the relationship between engagement at work and ... · pdf filethe relationship between...
TRANSCRIPT
The Relationship Between Engagement at Work and Organizational Outcomes2016 Q12® Meta-Analysis: Ninth Edition
APRIL 2016
JAMES K. HARTER, PH.D., GALLUP
FRANK L. SCHMIDT, PH.D., UNIVERSITY OF IOWA
SANGEETA AGRAWAL, M.S., GALLUP
STEPHANIE K. PLOWMAN, M.A., GALLUP
ANTHONY BLUE, M.A., GALLUP
Acknowledgments
The authors thank Jim Asplund, Nate Dvorak, Julie Griffiths, Kirti Kanitkar, Bogdan Lalu, Shane McFeely, Marco Nink, John Reimnitz, Maria Semykoz, Puneet Singh, Ben Wigert and Daniela Yu for contributing important new research studies to this ongoing meta-analysis.
Copyright Standards
This document contains proprietary research, copyrighted materials and literary property of Gallup, Inc. It is for the guidance of your company only and is not to be copied, quoted, published or divulged to others outside of your organization. Gallup®, Q12®, Selection Research, Inc.™ and SRI® are trademarks of Gallup, Inc. All other trademarks are the property of their respective owners.
This document is of great value to both your organization and Gallup, Inc. Accordingly, international and domestic laws and penalties guaranteeing patent, copyright, trademark and trade secret protection protect the ideas, concepts and recommendations related within this document.
No changes may be made to this document without the express written permission of Gallup, Inc.
1 Copyright © 2016 Gallup, Inc. All rights reserved.
2016 Q12® Meta-Analysis: Ninth Edition
The Relationship Between Engagement at Work and Organizational Outcomes 2016 Q12® Meta-Analysis: Ninth Edition
Table of Contents
Executive Summary ................................................................................................................................................................2
Objective .......................................................................................................................................................................................................................................2
Methods .........................................................................................................................................................................................................................................2
Results ............................................................................................................................................................................................................................................2
Conclusion ...................................................................................................................................................................................................................................3
Introduction ..................................................................................................................................................................................4
Foreword .......................................................................................................................................................................................................................................4
Development of the Q12 ....................................................................................................................................................................................................5
Introduction to the Study .................................................................................................................................................................................................7
Description of the Q12 .........................................................................................................................................................................................................9
Meta-Analysis, Hypothesis, Methods and Results ..............................................................................................13
Meta-Analysis ........................................................................................................................................................................................................................13
Hypothesis and Study Characteristics .............................................................................................................................................................13
Meta-Analytic Methods Used ...................................................................................................................................................................................19
Results ........................................................................................................................................................................................................................................ 23
Utility Analysis: Practicality of the Effects ...............................................................................................................27
Utility Analysis ...................................................................................................................................................................................................................... 27
Discussion .................................................................................................................................................................................30
References ................................................................................................................................................................................32
Appendix A: Reliabilities of Business/Work Unit Outcomes ........................................................................36
Appendix B: Test-Retest Reliabilities of Employee Engagement ...............................................................37
2Copyright © 2016 Gallup, Inc. All rights reserved.
2016 Q12® Meta-Analysis: Ninth Edition
Executive Summary
Objective
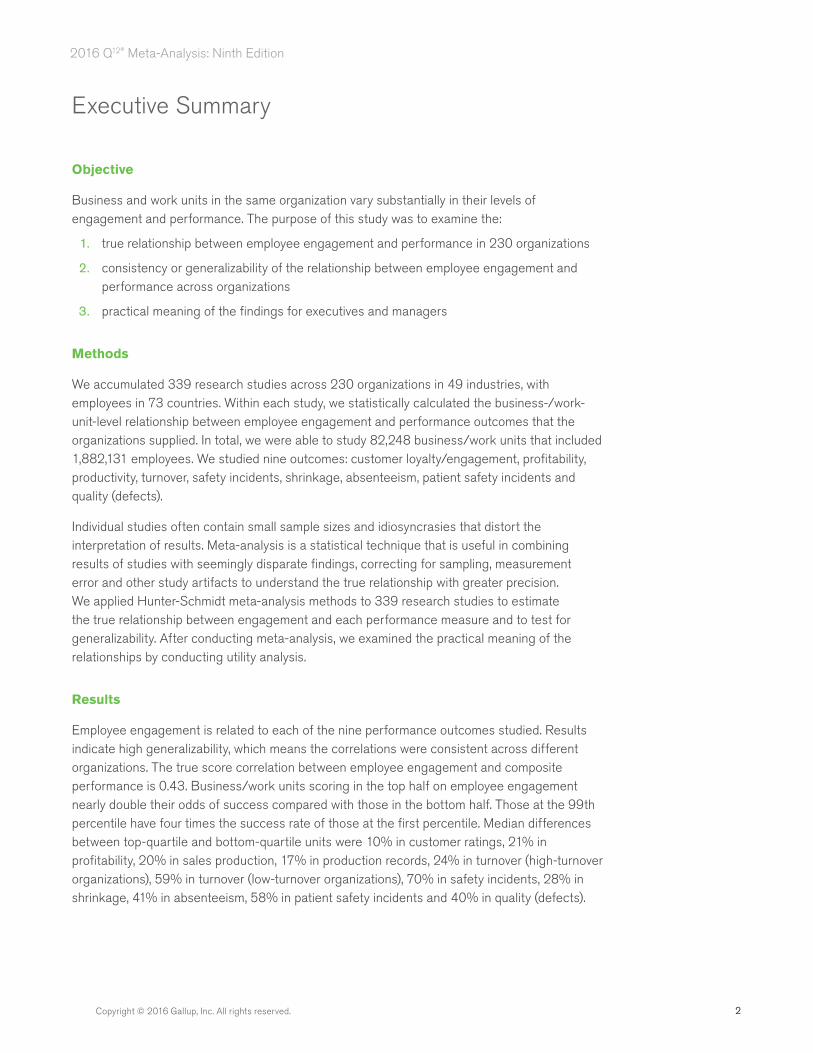
Business and work units in the same organization vary substantially in their levels of engagement and performance. The purpose of this study was to examine the:
1. true relationship between employee engagement and performance in 230 organizations
2. consistency or generalizability of the relationship between employee engagement and performance across organizations
3. practical meaning of the findings for executives and managers
Methods
We accumulated 339 research studies across 230 organizations in 49 industries, with employees in 73 countries. Within each study, we statistically calculated the business-/work-unit-level relationship between employee engagement and performance outcomes that the organizations supplied. In total, we were able to study 82,248 business/work units that included 1,882,131 employees. We studied nine outcomes: customer loyalty/engagement, profitability, productivity, turnover, safety incidents, shrinkage, absenteeism, patient safety incidents and quality (defects).
Individual studies often contain small sample sizes and idiosyncrasies that distort the interpretation of results. Meta-analysis is a statistical technique that is useful in combining results of studies with seemingly disparate findings, correcting for sampling, measurement error and other study artifacts to understand the true relationship with greater precision. We applied Hunter-Schmidt meta-analysis methods to 339 research studies to estimate the true relationship between engagement and each performance measure and to test for generalizability. After conducting meta-analysis, we examined the practical meaning of the relationships by conducting utility analysis.
Results
Employee engagement is related to each of the nine performance outcomes studied. Results indicate high generalizability, which means the correlations were consistent across different organizations. The true score correlation between employee engagement and composite performance is 0.43. Business/work units scoring in the top half on employee engagement nearly double their odds of success compared with those in the bottom half. Those at the 99th percentile have four times the success rate of those at the first percentile. Median differences between top-quartile and bottom-quartile units were 10% in customer ratings, 21% in profitability, 20% in sales production, 17% in production records, 24% in turnover (high-turnover organizations), 59% in turnover (low-turnover organizations), 70% in safety incidents, 28% in shrinkage, 41% in absenteeism, 58% in patient safety incidents and 40% in quality (defects).
3 Copyright © 2016 Gallup, Inc. All rights reserved.
2016 Q12® Meta-Analysis: Ninth Edition
Conclusion
The relationship between engagement and performance at the business/work unit level is substantial and highly generalizable across organizations. Employee engagement is related to each of nine different performance outcomes. This means that practitioners can apply the Q12 measure in a variety of situations with confidence that the measure captures important performance-related information.
4Copyright © 2016 Gallup, Inc. All rights reserved.
2016 Q12® Meta-Analysis: Ninth Edition
Introduction
Foreword
In the 1930s, George Gallup began a worldwide study of human needs and satisfactions. He pioneered the development of scientific sampling processes to measure popular opinion. In addition to his polling work, Dr. Gallup completed landmark research on well-being, studying the factors common among people who lived to be 95 and older (Gallup & Hill, 1959). Over the next several decades, Dr. Gallup and his colleagues conducted numerous polls throughout the world, covering many aspects of people’s lives. His early world polls dealt with topics such as family, religion, politics, personal happiness, economics, health, education, safety and attitudes toward work. In the 1970s, Dr. Gallup reported that less than half of those employed in North America were highly satisfied with their work (Gallup, 1976). Work satisfaction was even lower in Western Europe, Latin America, Africa and the Far East.
Satisfaction at work has become a widespread focus for researchers. In addition to Dr. Gallup’s early work, the topic of job satisfaction has been studied and written about in more than 10,000 articles and publications. Because most people spend a high percentage of their waking hours at work, studies of the workplace are of great interest for psychologists, sociologists, economists, anthropologists and physiologists. The process of managing and improving the workplace is crucial and presents great challenges to nearly every organization. So it is vital that the instruments used to create change do, in fact, measure workplace dynamics that predict key outcomes — outcomes that a variety of organizational leaders would consider important. After all, organizational leaders are in the best position to create interest in and momentum for job satisfaction research.
Parallel to Dr. Gallup’s early polling work, Donald O. Clifton, a psychologist and professor at the University of Nebraska, began studying the causes of success in education and business. Dr. Clifton founded Selection Research, Incorporated (SRI) in 1969. While most psychologists were busy studying dysfunction and the cause of disease, Dr. Clifton and his colleagues focused their careers on the science of strengths-based psychology, the study of what makes people flourish.
Their early discoveries led to hundreds of research studies focused on successful individuals and teams across a broad spectrum of industries and job types. In particular, research on successful learning and workplace environments led to numerous studies of successful teachers and managers. This work included extensive research on individual differences and the environments that best facilitate success. Early in their studies, the researchers discovered that simply measuring employees’ satisfaction was insufficient to create sustainable change. Satisfaction needed to be specified in terms of its most important elements, and it needed to be measured and reported in a way that could be used by the people who could take action and create change.
Further research revealed that change happens most efficiently at a local level — at the level of the front-line, manager-led team. For an executive, the front-line team is his or her direct reports, and for a plant manager, the front-line team is the people he or she manages each day. Studying great managers, Gallup scientists learned that optimal decision-making happens when information regarding decisions is collected at a local level, close to the everyday action.
5 Copyright © 2016 Gallup, Inc. All rights reserved.
2016 Q12® Meta-Analysis: Ninth Edition
Dr. Clifton’s work merged with Dr. Gallup’s work in 1988, when Gallup and SRI combined, enabling the blending of progressive management science with top survey and polling science. Dr. Gallup and Dr. Clifton spent much of their lives studying people’s opinions, attitudes, talents and behaviors. To do this, they wrote questions, recorded the responses and studied which questions elicited differential responses and related to meaningful outcomes. In the case of survey research, some questions are unbiased and elicit meaningful opinions, while others do not. In the case of management research, some questions elicit responses that predict future performance, while others do not.
Developing the right questions is an iterative process in which scientists write questions and conduct analysis. The research and questions are refined and rephrased. Additional analysis is conducted. The questions are refined and rephrased again. And the process is repeated. Gallup has followed the iterative process in devising the survey tool that is the subject of this report, Gallup’s Q12 instrument, which is designed to measure employee engagement conditions.
The next sections will provide an overview of the many decades of research that have gone into the development and validation of Gallup’s Q12 employee engagement instrument. Following this overview, we present a meta-analysis of 339 research studies exploring the relationship between employee engagement and performance across 230 organizations and 82,248 business/work units that include 1,882,131 employees.
Development of the Q12
Beginning in the 1950s, Dr. Clifton started studying work and learning environments to determine the factors that contribute positively to those environments and that enable people to capitalize on their unique talents. It was through this early work that Dr. Clifton began using science and the study of strengths to research individuals’ frames of reference and attitudes.
From the 1950s to the 1970s, Dr. Clifton continued his research of students, counselors, managers, teachers and employees. He used various rating scales and interview techniques to study individual differences, analyzing questions and factors that explain dissimilarities in people. The concepts he studied included “focusing on strengths versus weaknesses,” “relationships,” “personnel support,” “friendships” and “learning.” Various questions were written and tested, including many early versions of the Q12 items. Ongoing feedback techniques were first developed with the intent of asking questions, collecting data and encouraging ongoing discussion of the results to provide feedback and potential improvement — a measurement-based feedback process. To learn causes of employee turnover, exit interviews were conducted with employees who left organizations. A common reason for leaving an organization focused on the quality of the manager.
In the 1980s, Gallup scientists continued the iterative process by studying high-performing individuals and teams. Studies involved assessments of individual talents and workplace attitudes. As a starting point for questionnaire design, numerous qualitative analyses were conducted, including interviews and focus groups. Gallup researchers asked top-performing individuals or teams to describe their work environments and their thoughts, feelings and behaviors related to success.
The researchers used qualitative data to generate hypotheses and insights into the distinguishing factors leading to success. From these hypotheses, they wrote and tested
6Copyright © 2016 Gallup, Inc. All rights reserved.
2016 Q12® Meta-Analysis: Ninth Edition
questions. They also conducted numerous quantitative studies throughout the 1980s, including exit interviews, to continue to learn causes of employee turnover. Qualitative analyses such as focus groups and interviews formed the basis for lengthy and comprehensive employee surveys, called “Organizational Development Audits” or “Managing Attitudes for Excellence” surveys. Many of these surveys included 100 to 200 items. Quantitative analyses included factor analyses to assess the dimensionality of the survey data; regression analyses to identify uniqueness and redundancies in the data; and criterion-related validity analyses to identify questions that correlate with meaningful outcomes such as overall satisfaction, commitment and productivity. The scientists developed feedback protocols to facilitate the feedback of survey results to managers and employees. Such protocols and their use in practice helped researchers learn which items were most useful in creating dialogue and stimulating change.
One outgrowth of a management research practice that was focused on talent and environment was the theory of talent maximization in an organization:
Per-person productivity = Talent x (Relationship + Right Expectation + Recognition/Reward)
These concepts would later become embedded in the foundational elements of the Q12.
Over time, SRI and Gallup researchers conducted numerous studies of manager success patterns that focused on the talents of the manager and the environments that best facilitated success. By integrating knowledge of managerial talent with survey data on employee attitudes, scientists had a unique perspective on what it takes to build a successful workplace environment. Themes such as “individualized perception,” “performance orientation,” “mission,” “recognition,” “learning and growing,” “expectations” and “the right fit” continued to emerge. In addition to studies of management, researchers conducted numerous studies with successful teachers, students and learning environments.
In the 1990s, the iterative process continued. During this time, Gallup researchers developed the first version of the Q12 (“The Gallup Workplace Audit” or GWA) in an effort to efficiently capture the most important workplace attitudes. Qualitative and quantitative analyses continued. In that decade, more than 1,000 focus groups were conducted and hundreds of instruments were developed, many of them with several additional items. Scientists also continued to use exit interviews; these revealed the importance of the manager in retaining employees. Studies of the Q12 and other survey items were conducted in various countries throughout the world, including the United States, Canada, Mexico, Great Britain, Japan and Germany. Gallup researchers obtained international cross-cultural feedback on Gallup’s core items, which provided context on the applicability of the items across different cultures. Various scale types were also tested, including variations of 5-point and dichotomous response options.
Quantitative analyses of survey data included descriptive statistics, factor analyses, discriminant analyses, criterion-related validity analyses, reliability analyses, regression analyses and other correlational analyses. Gallup scientists continued to study the core concepts that differentiated successful from less successful work units and the expressions that best captured those concepts. In 1997, the criterion-related studies were combined into a meta-analysis to study the relationship of employee satisfaction and engagement (as measured by the Q12) to business/work unit profitability, productivity, employee retention and customer satisfaction/loyalty across 1,135 business/work units (Harter & Creglow, 1997). Meta-analysis also enabled researchers
7 Copyright © 2016 Gallup, Inc. All rights reserved.
2016 Q12® Meta-Analysis: Ninth Edition
to study the generalizability of the relationship between engagement and outcomes. Results of this confirmatory analysis revealed substantial criterion-related validity for each of the Q12 items.
As criterion-related validity studies are ongoing, the meta-analysis was updated in 1998 (Harter & Creglow, 1998) and included 2,528 business/work units; in 2000 (Harter & Schmidt, 2000), when it included 7,939 business/work units; in 2002 (Harter & Schmidt, 2002), when it included 10,885 business/work units; in 2003 (Harter, Schmidt, & Killham, 2003), when it included 13,751 business/work units; in 2006 (Harter, Schmidt, Killham, & Asplund, 2006), when it included 23,910 business/work units; in 2009 (Harter, Schmidt, Killham, & Agrawal, 2009), when it included 32,394 business/work units; and in 2013 (Harter, Schmidt, Agrawal, & Plowman, 2013), when it included 49,928 business/work units. This report provides the ninth published iteration of Gallup’s Q12 meta-analysis focusing on the relationship between employee engagement and performance.
As with the 2013 report, this report expands the number of business/work units and increases the total composition of different industries and countries studied.
Since its final wording and order were completed in 1998, the Q12 has been administered to more than 30 million employees in 198 different countries and 72 languages. Additionally, a series of studies has been conducted examining the cross-cultural properties of the instrument (Harter & Agrawal, 2011).
Introduction to the Study
The quality of an organization’s human resources is perhaps the leading indicator of its growth and sustainability. The attainment of a workplace with high-caliber employees starts with the selection of the right people for the right jobs. Numerous studies have documented the utility of valid selection instruments and systems in the selection of the right people (Schmidt, Hunter, McKenzie, & Muldrow, 1979; Hunter & Schmidt, 1983; Huselid, 1995; Schmidt & Rader, 1999; Harter, Hayes, & Schmidt, 2004).
After employees are hired, they make decisions and take actions every day that can affect the success of their organizations. Many of these decisions and actions are influenced by their own internal motivations and drives. One can also hypothesize that the way employees are treated and the way they treat one another can positively affect their actions — or can place their organizations at risk. For example, researchers have found positive relationships between general workplace attitudes and service intentions, customer perceptions (Schmit & Allscheid, 1995) and individual performance outcomes (Iaffaldano & Muchinsky, 1985). An updated meta-analysis has revealed a substantial relationship between individual job satisfaction and individual performance (Judge, Thoresen, Bono, & Patton, 2001). Before 2000, the vast majority of job satisfaction research and subsequent meta-analyses had collected and studied data at the individual employee level.
There is also evidence at the workgroup or business unit level that employee attitudes relate to various organizational outcomes. Organizational-level research has focused primarily on cross-sectional studies. Independent studies found relationships between employee attitudes and performance outcomes such as safety (Zohar, 1980, 2000), customer experiences (Schneider, Parkington, & Buxton, 1980; Ulrich, Halbrook, Meder, Stuchlik, & Thorpe, 1991;
8Copyright © 2016 Gallup, Inc. All rights reserved.
2016 Q12® Meta-Analysis: Ninth Edition
Schneider & Bowen, 1993; Schneider, Ashworth, Higgs, & Carr, 1996; Schmit & Allscheid, 1995; Reynierse & Harker, 1992; Johnson, 1996; Wiley, 1991), financials (Denison, 1990; Schneider, 1991) and employee turnover (Ostroff, 1992). A study by Batt (2002) used multivariate analysis to examine the relationship between human resource practices (including employee participation in decision-making) and sales growth. Gallup has conducted large-scale meta-analyses, most recently studying 49,928 business and work units regarding the concurrent and predictive relationship of employee attitudes (satisfaction and engagement) with safety, customer attitudes, financials, employee retention, absenteeism, quality metrics and merchandise shrinkage (Harter et al., 2013; Harter et al., 2009; Harter et al., 2006; Harter et al., 2003; Harter, Schmidt, & Hayes, 2002; Harter & Schmidt, 2002; Harter & Schmidt, 2000; Harter & Creglow, 1998; Harter & Creglow, 1997). This meta-analysis, repeated across time, has found consistently that there are positive concurrent and predictive relationships between employee attitudes and various important business outcomes. It has also found that these relationships generalize across a wide range of situations (industries, business/work unit types and countries). Additional independent studies have found similar results (Whitman, Van Rooy, & Viswesvaran, 2010; Edmans, 2012).
Even though it has been much more common to study employee opinion data at the individual level, studying data at the business unit or workgroup level is critical because that is where the data are typically reported (because of confidentiality concerns, employee surveys are reported at a broader business unit or workgroup level). In addition, business-unit-level research usually provides opportunities to establish links to outcomes that are directly relevant to most businesses — outcomes like customer loyalty, profitability, productivity, employee turnover, safety incidents, merchandise shrinkage and quality variables that are often aggregated and reported at the business unit level.
Another advantage to reporting and studying data at the business unit or workgroup level is that instrument item scores are of similar reliability to dimension scores for individual-level analysis. This is because at the business unit or workgroup level, each item score is an average of many individuals’ scores. This means that employee surveys reported at a business unit or workgroup level can be more efficient or parsimonious in length, i.e., because item-level measurement error is less of a concern. See Harter and Schmidt (2006) for a more complete discussion of job satisfaction research and the advantages of conducting unit-level analyses.
One potential problem with such business-unit-level studies is limited data as a result of a limited number of business units (the number of business units becomes the sample size) or limited access to outcome measures that one can compare across business units. For this reason, many of these studies are limited in statistical power, and as such, results from individual studies may appear to conflict with one another. Meta-analysis techniques provide the opportunity to pool such studies together to obtain more precise estimates of the strength of effects and their generalizability.
This paper’s purpose is to present the results of an updated meta-analysis of the relationship between employee workplace perceptions and business unit outcomes based on currently available data collected with Gallup clients. The focus of this study is on Gallup’s Q12 instrument. The Q12 items — which were selected because of their importance at the business unit or workgroup level — measure employee perceptions of the quality of people-related management practices in their business units.
9 Copyright © 2016 Gallup, Inc. All rights reserved.
2016 Q12® Meta-Analysis: Ninth Edition
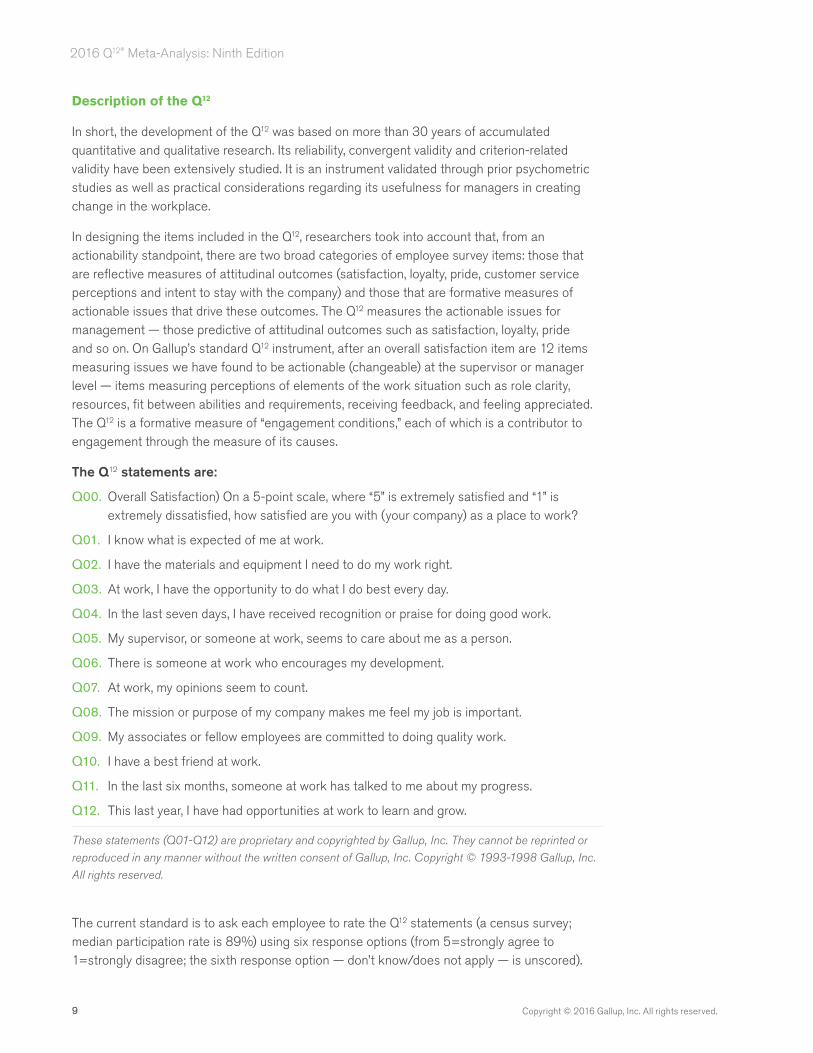
Description of the Q12
In short, the development of the Q12 was based on more than 30 years of accumulated quantitative and qualitative research. Its reliability, convergent validity and criterion-related validity have been extensively studied. It is an instrument validated through prior psychometric studies as well as practical considerations regarding its usefulness for managers in creating change in the workplace.
In designing the items included in the Q12, researchers took into account that, from an actionability standpoint, there are two broad categories of employee survey items: those that are reflective measures of attitudinal outcomes (satisfaction, loyalty, pride, customer service perceptions and intent to stay with the company) and those that are formative measures of actionable issues that drive these outcomes. The Q12 measures the actionable issues for management — those predictive of attitudinal outcomes such as satisfaction, loyalty, pride and so on. On Gallup’s standard Q12 instrument, after an overall satisfaction item are 12 items measuring issues we have found to be actionable (changeable) at the supervisor or manager level — items measuring perceptions of elements of the work situation such as role clarity, resources, fit between abilities and requirements, receiving feedback, and feeling appreciated. The Q12 is a formative measure of “engagement conditions,” each of which is a contributor to engagement through the measure of its causes.
The Q12 statements are:
Q00. Overall Satisfaction) On a 5-point scale, where “5” is extremely satisfied and “1” is extremely dissatisfied, how satisfied are you with (your company) as a place to work?
Q01. I know what is expected of me at work.
Q02. I have the materials and equipment I need to do my work right.
Q03. At work, I have the opportunity to do what I do best every day.
Q04. In the last seven days, I have received recognition or praise for doing good work.
Q05. My supervisor, or someone at work, seems to care about me as a person.
Q06. There is someone at work who encourages my development.
Q07. At work, my opinions seem to count.
Q08. The mission or purpose of my company makes me feel my job is important.
Q09. My associates or fellow employees are committed to doing quality work.
Q10. I have a best friend at work.
Q11. In the last six months, someone at work has talked to me about my progress.
Q12. This last year, I have had opportunities at work to learn and grow.
These statements (Q01-Q12) are proprietary and copyrighted by Gallup, Inc. They cannot be reprinted or
reproduced in any manner without the written consent of Gallup, Inc. Copyright © 1993-1998 Gallup, Inc.
All rights reserved.
The current standard is to ask each employee to rate the Q12 statements (a census survey; median participation rate is 89%) using six response options (from 5=strongly agree to 1=strongly disagree; the sixth response option — don’t know/does not apply — is unscored).
10Copyright © 1993-1998. 2016 Gallup, Inc. All rights reserved.
2016 Q12® Meta-Analysis: Ninth Edition
Because it is a satisfaction item, the first item (Q00) is scored on a satisfaction scale rather than on an agreement scale. Regression analyses (Harter et al., 2002) indicate that employee engagement accounts for nearly all of the performance-related variance (composite performance) accounted for by the overall satisfaction measure. Therefore, the focus of this report is on employee engagement (as measured by statements Q01-Q12).
While these items measure issues that the manager or supervisor can influence, only one item contains the word “supervisor.” This is because it is realistic to assume that numerous people in the workplace can influence whether someone’s expectations are clear, whether he or she feels cared about and so on. The manager’s or supervisor’s position, though, allows him or her to take the lead in establishing a culture that values behaviors that support these perceptions. The following is a brief discussion of the conceptual relevance of each of the 13 items:
Q00. Overall satisfaction. The first item on the survey measures affective satisfaction on a scale from “extremely dissatisfied” to “extremely satisfied.” It is an attitudinal outcome or direct reflective measure of how people feel about their organization. Given that it is a direct measure of affective satisfaction, on its own, it is difficult to act on the results of this item. Other issues, like those measured in the following 12 items, explain why people are satisfied and why they become engaged and produce outcomes.
Q01. Expectations. Defining and clarifying the outcomes that are to be achieved is perhaps the most basic of all employee needs and manager responsibilities. How these outcomes are defined and acted on will vary across business/work units, depending on the goals of the business/work unit.
Q02. Materials and equipment. Getting people what they need to do their work is important in maximizing efficiency, in demonstrating to employees that their work is valued and in showing that the company is supporting them in what they are asked to do. Great managers help employees see how their requests for materials and equipment connect to important organizational outcomes.
Q03. Opportunity to do what I do best. Helping people get into roles in which they can most fully use their inherent talents and strengths is the ongoing work of great managers. Learning about individual differences through experience and assessment can help the manager position people efficiently within and across roles and remove barriers to high performance.
Q04. Recognition for good work. Employees need constant feedback to know if what they are doing matters. An ongoing management challenge is to understand how each person prefers to be recognized, to make recognition objective and real by basing it on performance, and to do it frequently.
Q05. Someone at work cares about me. For each person, feeling cared about may mean something different. The best managers listen to individuals and respond to their unique needs. In addition, they find the connection between the needs of the individual and the needs of the organization.
Q06. Encourages my development. How employees are coached can influence how they perceive their future. If the manager is helping the employee improve as an individual by providing opportunities that are in sync with the employee’s talents, both the employee and the company will profit.
11 Copyright © 1993-1998. 2016 Gallup, Inc. All rights reserved.
2016 Q12® Meta-Analysis: Ninth Edition
Q07. Opinions count. Asking for the employee’s input and considering that input can often lead to better decision-making. This is because employees are often closer to many factors that affect the overall system than the manager is, whether that is the customer or the products they are producing every day. In addition, when employees feel they are involved in decisions, they take greater ownership for the outcomes.
Q08. Mission/Purpose. Great managers help people see not only the purpose of their work, but also how each person’s work influences and relates to the purpose of the organization and its outcomes. Reminding employees of the big-picture effect of what they do each day is important, whether it is how their work influences the customer, safety or the public.
Q09. Associates committed to quality. Managers can influence the extent to which employees respect one another by selecting conscientious employees, providing some common goals and metrics for quality, and increasing associates’ frequency of opportunity for interaction.
Q10. Best friend. Managers vary in the extent to which they create opportunities for people at work to get to know one another and in how much they value close, trusting relationships at work. The best managers do not subscribe to the idea that there should be no close friendships at work; instead, they free people to get to know one another, which is a basic human need. This, then, can influence communication, trust and other outcomes.
Q11. Progress. Providing a structured time to discuss each employee’s progress, achievements and goals is important for managers and employees. Great managers regularly meet with individuals, both to learn from them and to give them guidance. This give-and-take helps managers and employees make better decisions.
Q12. Learn and grow. In addition to having a need to be recognized for doing good work, most employees need to know that they are improving and have opportunities to build their knowledge and skills. Great managers choose training that will benefit the individual and the organization.
More detailed discussion of the practical application of each of the Q12 items is provided in Wagner and Harter (2006) and in various articles posted on Gallup.com.
As a total instrument (sum or mean of items Q01-Q12), the Q12 has a Cronbach’s alpha of 0.91 at the business unit level. The meta-analytic convergent validity of the equally weighted mean (or sum) of items Q01-Q12 (GrandMean) to the equally weighted mean (or sum) of additional items in longer surveys (measuring all known facets of job satisfaction and engagement) is 0.91. This provides evidence that the Q12, as a composite measure, captures the general factor in longer employee surveys. Individual items correlate to their broader dimension true-score values, on average, at approximately 0.70. While the Q12 is a measure of actionable engagement conditions, its composite has high convergent validity with affective satisfaction and other direct measures of work engagement (see Harter & Schmidt, 2008, for further discussion of convergent and discriminant validity issues and the construct of “engagement”).
As previously mentioned, this is the ninth published iteration of the Q12 business-unit-level meta-analysis. Compared with the previous meta-analysis, the current meta-analysis includes a larger number of studies, business units and countries. The current meta-analysis includes nearly three times more business units with patient safety data, 81% more business units with productivity data, 68% more with safety data, 48% more with profitability data, 42% more with
12Copyright © 2016 Gallup, Inc. All rights reserved.
2016 Q12® Meta-Analysis: Ninth Edition
turnover data, 34% more with quality or defects data, 39% more with absenteeism data, 27% more with customer data, and 16% more with shrinkage data. As such, this study provides a substantial update of new and recent data.
The coverage of research studies includes business units in 73 countries, including Asia (Bangladesh, Cambodia, China, Hong Kong, India, Indonesia, Japan, Korea, Malaysia, Nepal, Pakistan, the Philippines, Singapore, Sri Lanka, Taiwan, Thailand and Turkey), Australia, New Zealand, Europe (Austria, Belgium, France, Germany, Greece, Ireland, Italy, Netherlands, Spain, Sweden, Switzerland and the United Kingdom), former communist countries (Czech Republic, Hungary, Lithuania, Poland and Russia), Latin America (Argentina, Bolivia, Brazil, Chile, Colombia, Ecuador, El Salvador, Guatemala, Honduras, Mexico, Nicaragua and Peru), the Middle East (Bahrain, Brunei Darussalam, Egypt, Jordan, Oman and United Arab Emirates), North America (Canada and the United States), Africa (Botswana, Burkina Faso, Ethiopia, Gambia, Ghana, Kenya, Nigeria, Rwanda, Tanzania, Togo, Uganda, Zambia and Zimbabwe) and the Caribbean (Barbados, Bermuda, the Dominican Republic and Haiti). Thirty-eight companies included in the present meta-analysis operate exclusively in countries outside the U.S.
This meta-analysis includes all available Gallup studies (whether published or unpublished) and has no risk of publication bias.
13 Copyright © 2016 Gallup, Inc. All rights reserved.
2016 Q12® Meta-Analysis: Ninth Edition
Meta-Analysis, Hypothesis, Methods and Results
Meta-Analysis
A meta-analysis is a statistical integration of data accumulated across many different studies. As such, it provides uniquely powerful information because it controls for measurement and sampling errors and other idiosyncrasies that distort the results of individual studies. A meta-analysis eliminates biases and provides an estimate of true validity or true relationship between two or more variables. Statistics typically calculated during meta-analyses also allow the researcher to explore the presence, or lack, of moderators of relationships.
More than 1,000 meta-analyses have been conducted in the psychological, educational, behavioral, medical and personnel selection fields. The research literature in the behavioral and social sciences fields includes a multitude of individual studies with apparently conflicting conclusions. Meta-analysis, however, allows the researcher to estimate the mean relationship between variables and make corrections for artifactual sources of variation in findings across studies. It provides a method by which researchers can determine whether validities and relationships generalize across various situations (e.g., across firms or geographical locations).
This paper will not provide a full review of meta-analysis. Rather, the authors encourage readers to consult the following sources for background information and detailed descriptions of the more recent meta-analytic methods: Schmidt and Hunter (2015); Schmidt (1992); Hunter and Schmidt (1990, 2004); Lipsey and Wilson (1993); Bangert-Drowns (1986); and Schmidt, Hunter, Pearlman, and Rothstein-Hirsh (1985).
Hypothesis and Study Characteristics
The hypotheses examined for this meta-analysis were:
Hypothesis 1: Business-unit-level employee engagement will have positive average correlations with the business unit outcomes of customer loyalty, productivity and profitability and negative correlations with employee turnover, employee safety incidents (accidents), absenteeism, shrinkage (theft), patient safety incidents (mortality and falls) and quality (defects).
• Hypothesis 2: The correlations between engagement and business unit outcomes will generalize across organizations for all business unit outcomes. That is, these correlations will not vary substantially across organizations. And in particular, there will be few, if any, organizations with zero correlations or those in the opposite direction from Hypothesis 1.
Gallup’s inferential database includes 339 studies conducted as proprietary research for 230 independent organizations. In each Q12, one or more of the Q12 items was used (as a part of standard policy starting in 1997, all items were included in all studies), and data were aggregated at the business unit level and correlated with the following aggregate business unit performance measures:
• customer metrics (referred to as customer loyalty)
• profitability
• productivity
14Copyright © 2016 Gallup, Inc. All rights reserved.
2016 Q12® Meta-Analysis: Ninth Edition
• turnover
• safety incidents
• absenteeism
• shrinkage
• patient safety incidents
• quality (defects)
That is, in these analyses, the unit of analysis was the business or work unit, not the individual employee.
Correlations (r values) were calculated, estimating the relationship of business/work unit average measures of employee engagement (the mean of the Q12 items) to each of these nine general outcomes. Correlations were calculated across business/work units in each company, and these correlation coefficients were entered into a database. The researchers then calculated mean validities, standard deviations of validities and validity generalization statistics for each of the nine business/work unit outcome measures.
As with previous meta-analyses, some of the studies were concurrent validity studies, where engagement and performance were measured in roughly the same time period or with engagement measurement slightly trailing behind the performance measurement (because engagement is relatively stable and a summation of the recent past, such studies are considered “concurrent”). Predictive validity studies involve measuring engagement at time 1 and performance at time 2. “Predictive” validity estimates were obtained for 50% of the organizations included in this meta-analysis.
This paper does not directly address issues of causality, which are best addressed with meta-analytic longitudinal data, consideration of multiple variables and path analysis. Issues of causality are discussed and examined extensively in other sources (Harter, Schmidt, Asplund, Killham, & Agrawal, 2010). Findings of causal studies suggest that engagement and financial performance are reciprocally related, but that engagement is a stronger predictor of financial outcomes than the reverse. The relationship between engagement and financial performance appears to be mediated by its causal relationship with other outcomes such as customer perceptions and employee retention. That is, financial performance is a downstream outcome that is influenced by the effect of engagement on shorter-term outcomes such as customer perceptions and employee retention.
Studies for the current meta-analysis were selected so that each organization was represented once in each analysis. For several organizations, multiple studies were conducted. To include the best possible information for each organization represented in the study, some basic rules were used. If two concurrent studies were conducted for the same client (where Q12 and outcome data were collected concurrently, i.e., in the same year), then the weighted average effect sizes across the multiple studies were entered as the value for that organization. If an organization had a concurrent and a predictive study (where the Q12 was collected in year 1 and outcomes were tracked in year 2), then the effect sizes from the predictive study were entered. If an organization had multiple predictive studies, then the mean of the correlations in these studies was entered. If sample sizes varied substantially in repeated studies for an organization, the study with the largest of the sample sizes was used.
15 Copyright © 2016 Gallup, Inc. All rights reserved.
2016 Q12® Meta-Analysis: Ninth Edition
• For 94 organizations, there were studies that examined the relationship between business unit employee perceptions and customer perceptions. Customer perceptions included customer metrics, patient metrics and student ratings of teachers. These metrics included measures of loyalty, satisfaction, service excellence, customer evaluation of quality of claims, net promoter scores and engagement. The largest representation of studies included loyalty metrics (e.g., likelihood to recommend/net promoter or repeat business), so we refer to customer metrics as customer loyalty in this study. Instruments varied from study to study. The general index of customer loyalty was an average score of the items included in each measure. A growing number of studies include “customer engagement” as the metric of choice, which measures the emotional connection between the customers and the organization that serves them. For more information on the interaction of employee and customer engagement, see Fleming, Coffman, and Harter (2005) and Harter, Asplund, and Fleming (2004).
• Profitability studies were available for 85 organizations. The definition of profitability typically was a percentage profit of revenue (sales). In several companies, the researchers used — as the best measure of profit — a difference score from the prior year or a difference from a budgeted amount because it represented a more accurate measure of each unit’s relative performance. As such, a control for opportunity (location) was used when profitability figures were deemed less comparable from one unit to the next. For example, a difference variable involved dividing profit by revenue for a business unit and then subtracting a budgeted percentage from this percentage. Or, more explicitly, in some cases a partial correlation (r value) was calculated, controlling for location variables when they were deemed to be relevant to accurate comparison of business units. In every case, profitability variables were measures of margin, and productivity variables (which follow) were measures of amount produced.
• Productivity studies were available for 140 organizations. Measures of business unit productivity consisted of one of the following: financials (e.g., revenue/sales dollars per person or patient), quantity produced (production volume), enrollments in programs, hours/labor costs to budget, cross-sells, performance ratings or student achievement scores (for three education organizations). In a few cases, this was a dichotomous variable (top-performing business units = 2; less successful units = 1). The majority of variables included as “productivity” were financial measures of sales or revenue or growth in sales or revenue. As with profitability, in many cases, it was necessary for the researchers to compare financial results with a performance goal or prior-year figure to control for the differential business opportunity because of the location of business units, or to explicitly calculate a partial correlation (r value).
• Turnover data were available for 106 organizations. The turnover measure was the annualized percentage of employee turnover for each business unit. In most cases, voluntary turnover was reported and used in the analyses.
• Safety data were available for 53 organizations. Safety measures included lost workday/time incident rate, percentage of workdays lost as a result of incidents or workers’ compensation claims (incidents and costs), number of incidents, or incident rates.
• Absenteeism data were included for 30 organizations. Absenteeism measures included the average number of days missed per person for each work unit divided by the total days available for work. This included either a measure of sick days or a measure of hours or total absenteeism.
16Copyright © 2016 Gallup, Inc. All rights reserved.
2016 Q12® Meta-Analysis: Ninth Edition
• Eleven organizations provided measures of shrinkage. Shrinkage is defined as the dollar amount of unaccounted-for lost merchandise, which could be the result of employee theft, customer theft or lost merchandise. Given the varying size of locations, shrinkage was calculated as a percentage of total revenue or a difference from an expected target.
• Nine healthcare organizations provided measures of patient safety. Patient safety incident measures varied from patient fall counts (percentages of total patients), medical error and infection rates and risk-adjusted mortality rates.
• Sixteen organizations provided measures of quality. For most organizations, quality was measured through records of defects such as unsaleable/returned items/quality shutdowns/scrap/operational efficiency/rejections per inspection rate (in manufacturing), forced outages (in utilities), disciplinary actions, deposit accuracy (financial) and other quality scores. Because the majority of quality metrics were measures of defects (where higher figures meant worse performance), measures of efficiency and quality scores were reverse coded so that all variables carried the same inferential interpretation.
• The overall study involved 1,882,131 independent employee responses to surveys and 82,248 independent business/work units in 230 organizations, with an average of 23 employees per business unit and 358 business/work units per organization. We conducted 339 research studies across the 230 organizations.
• Table 1 provides a summary of organizations sorted by industry. It is evident that there is considerable variation in the industry types represented, as organizations from 49 industries provided studies. Each of the general government industry classifications (via SIC codes) is represented, with the largest number of organizations represented in services, retail, manufacturing and financial industries. The largest numbers of business units are in the financial and retail industries. Of the specific industry classifications, these are the most frequently represented (based on number of business units): Finance — Depository, Services — Health, Retail — Pharmaceutical, Retail — Food, Transportation/Public Utilities — Communications, Finance — Insurance, Manufacturing — Pharmaceutical and Retail — Miscellaneous.
17 Copyright © 2016 Gallup, Inc. All rights reserved.
2016 Q12® Meta-Analysis: Ninth Edition
Table 1: Summary of Studies by Industry
Industry Type Number of Organizations
Number of Business/ Work Units
Number of Respondents
Finance — Commercial Banking 2 996 7,419
Finance — Credit 2 59 581
Finance — Depository 21 16,320 176,430
Finance — Insurance 6 4,219 53,581
Finance — Mortgage 1 27 985
Finance — Nondepository 1 94 2,038
Finance — Security 4 797 25,833
Finance — Transactions 1 73 1,530
Manufacturing — Aircraft 1 3,411 37,616
Manufacturing — Building Materials 1 8 1,335
Manufacturing — Chemicals 1 928 8,203
Manufacturing — Computers and Electronics 3 239 27,002
Manufacturing — Consumer Goods 4 235 7,077
Manufacturing — Food 5 300 21,317
Manufacturing — Glass 1 5 1,349
Manufacturing — Industrial Equipment 1 89 639
Manufacturing — Instrument 7 105 2,112
Manufacturing — Miscellaneous 3 396 12,478
Manufacturing — Paper 1 60 17,243
Manufacturing — Pharmaceutical 5 4,103 39,575
Manufacturing — Plastics 1 133 938
Manufacturing — Printing 2 35 716
Manufacturing — Ship Building 3 882 134,297
Materials and Construction 4 1,270 29,932
Personal Services — Beauty Salons 1 424 3,226
Real Estate 3 199 5,964
Retail — Automotive 4 261 13,614
Retail — Building Materials 3 1,158 65,001
Retail — Clothes 4 1,055 28,937
Retail — Department Stores 2 816 6,594
Retail — Eating 6 736 37,191
Retail — Electronics 6 1,483 104,273
Retail — Entertainment 1 106 1,051
Retail — Food 5 6,204 97,049
Retail — Industrial Equipment 1 11 484
Retail — Miscellaneous 10 4,076 157,602
Retail — Pharmaceutical 2 7,321 138,428
Services — Business 3 645 10,309
Services — Education 7 459 10,746
18Copyright © 2016 Gallup, Inc. All rights reserved.
2016 Q12® Meta-Analysis: Ninth Edition
Table 1: Summary of Studies by Industry (Continued)
Industry Type Number of Organizations
Number of Business/ Work Units
Number of Respondents
Services — Government 4 240 8,336
Services — Health 61 12,619 281,995
Services — Hospitality 8 958 156,678
Services — Nursing Home 1 353 26,582
Services — Recreation 1 14 288
Services — Social Services 2 1,525 16,920
Transportation/Public Utilities — Communications 7 4,234 45,506
Transportation/Public Utilities — Electric, Gas and Sanitary Services
5 1,740 20,318
Transportation/Public Utilities — Nonhazardous Waste Disposal
1 727 28,600
Transportation/Public Utilities — Trucking 1 100 6,213
Total Financial 38 22,585 268,397
Total Manufacturing 39 10,929 311,897
Total Materials and Construction 4 1,270 29,932
Total Personal Services 1 424 3,226
Total Real Estate 3 199 5,964
Total Retail 44 23,227 650,224
Total Services 87 16,813 511,854
Total Transportation/Public Utilities 14 6,801 100,637
Total 230 82,248 1,882,131
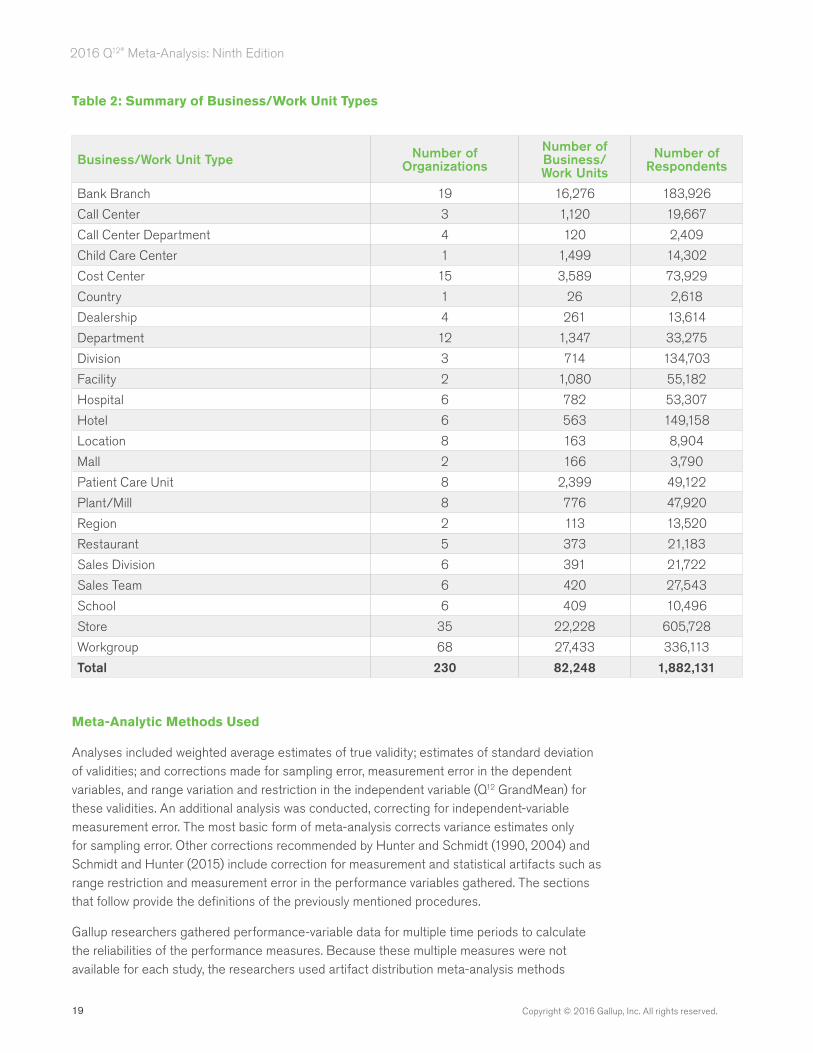
Table 2 provides a summary of organizations sorted by business/work unit type. There is also considerable variation in the types of business/work units, ranging from stores to plants/mills to departments to schools. Overall, 23 different types of business/work units are represented; the largest number of organizations had studies of workgroups, stores or bank branches. Likewise, workgroups, stores and bank branches have the highest proportional representation of business/work units.
19 Copyright © 2016 Gallup, Inc. All rights reserved.
2016 Q12® Meta-Analysis: Ninth Edition
Table 2: Summary of Business/Work Unit Types
Business/Work Unit Type Number of Organizations
Number of Business/ Work Units
Number of Respondents
Bank Branch 19 16,276 183,926
Call Center 3 1,120 19,667
Call Center Department 4 120 2,409
Child Care Center 1 1,499 14,302
Cost Center 15 3,589 73,929
Country 1 26 2,618
Dealership 4 261 13,614
Department 12 1,347 33,275
Division 3 714 134,703
Facility 2 1,080 55,182
Hospital 6 782 53,307
Hotel 6 563 149,158
Location 8 163 8,904
Mall 2 166 3,790
Patient Care Unit 8 2,399 49,122
Plant/Mill 8 776 47,920
Region 2 113 13,520
Restaurant 5 373 21,183
Sales Division 6 391 21,722
Sales Team 6 420 27,543
School 6 409 10,496
Store 35 22,228 605,728
Workgroup 68 27,433 336,113
Total 230 82,248 1,882,131
Meta-Analytic Methods Used
Analyses included weighted average estimates of true validity; estimates of standard deviation of validities; and corrections made for sampling error, measurement error in the dependent variables, and range variation and restriction in the independent variable (Q12 GrandMean) for these validities. An additional analysis was conducted, correcting for independent-variable measurement error. The most basic form of meta-analysis corrects variance estimates only for sampling error. Other corrections recommended by Hunter and Schmidt (1990, 2004) and Schmidt and Hunter (2015) include correction for measurement and statistical artifacts such as range restriction and measurement error in the performance variables gathered. The sections that follow provide the definitions of the previously mentioned procedures.
Gallup researchers gathered performance-variable data for multiple time periods to calculate the reliabilities of the performance measures. Because these multiple measures were not available for each study, the researchers used artifact distribution meta-analysis methods
20Copyright © 2016 Gallup, Inc. All rights reserved.
2016 Q12® Meta-Analysis: Ninth Edition
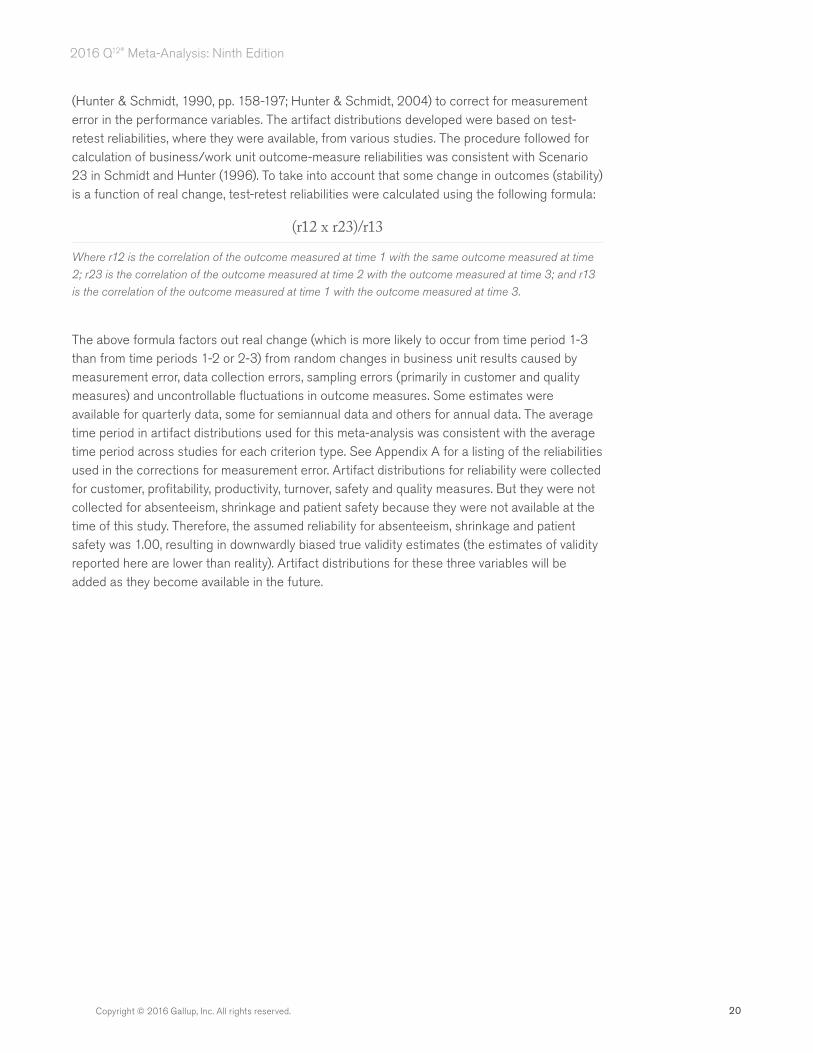
(Hunter & Schmidt, 1990, pp. 158-197; Hunter & Schmidt, 2004) to correct for measurement error in the performance variables. The artifact distributions developed were based on test-retest reliabilities, where they were available, from various studies. The procedure followed for calculation of business/work unit outcome-measure reliabilities was consistent with Scenario 23 in Schmidt and Hunter (1996). To take into account that some change in outcomes (stability) is a function of real change, test-retest reliabilities were calculated using the following formula:
(r12 x r23)/r13
Where r12 is the correlation of the outcome measured at time 1 with the same outcome measured at time
2; r23 is the correlation of the outcome measured at time 2 with the outcome measured at time 3; and r13
is the correlation of the outcome measured at time 1 with the outcome measured at time 3.
The above formula factors out real change (which is more likely to occur from time period 1-3 than from time periods 1-2 or 2-3) from random changes in business unit results caused by measurement error, data collection errors, sampling errors (primarily in customer and quality measures) and uncontrollable fluctuations in outcome measures. Some estimates were available for quarterly data, some for semiannual data and others for annual data. The average time period in artifact distributions used for this meta-analysis was consistent with the average time period across studies for each criterion type. See Appendix A for a listing of the reliabilities used in the corrections for measurement error. Artifact distributions for reliability were collected for customer, profitability, productivity, turnover, safety and quality measures. But they were not collected for absenteeism, shrinkage and patient safety because they were not available at the time of this study. Therefore, the assumed reliability for absenteeism, shrinkage and patient safety was 1.00, resulting in downwardly biased true validity estimates (the estimates of validity reported here are lower than reality). Artifact distributions for these three variables will be added as they become available in the future.
21 Copyright © 2016 Gallup, Inc. All rights reserved.
2016 Q12® Meta-Analysis: Ninth Edition
It could be argued that, because the independent variable (employee engagement as measured by the Q12) is used in practice to predict outcomes, the practitioner must live with the reliability of the instrument he or she is using. However, correcting for measurement error in the independent variable answers the theoretical question of how the actual constructs (true scores) relate to each other. Therefore, we present analyses both before and after correcting for independent variable reliability. Appendix B presents the distributions of reliabilities for the GrandMean of Q12, which have been updated with 22 entries added to the artifact distribution used for the 2013 analysis. These values were computed in the same manner as were those for the performance outcomes.
In correcting for range variation and range restriction, there are fundamental theoretical questions that need to be considered relating to whether such correction is necessary. In personnel selection, validities are routinely corrected for range restriction because in selecting applicants for jobs, those scoring highest on the predictor are typically selected. This results in explicit range restriction that biases observed correlations downward (i.e., attenuation). But in the employee satisfaction and engagement arena, one could argue that there is no explicit range restriction because we are studying results as they exist in the workplace. Work units are not selected based on scores on the predictor (Q12 scores).
However, we have observed that there is variation across companies in standard deviations of engagement. One hypothesis for why this variation occurs is that companies vary in how they encourage employee satisfaction and engagement initiatives and in how they have or have not developed a common set of values and a common culture. Therefore, the standard deviation of the population of business units across organizations studied will be greater than the standard deviation within the typical company. This variation in standard deviations across companies can be thought of as indirect range restriction (as opposed to direct range restriction). Improved indirect range restriction corrections have been incorporated into this meta-analysis (Hunter, Schmidt, & Le, 2006).
Since the development of the Q12, Gallup has collected descriptive data on more than 30 million respondents, 3.4 million business units or workgroups, and 1,165 organizations. This accumulation of data indicates that the standard deviation within a given company is approximately 8/10 the standard deviation in the population of all business/work units. In addition, the ratio of standard deviation for a given organization relative to the population value varies from organization to organization. Therefore, if one goal is to estimate the effect size in the population of all business units (arguably a theoretically important issue), then correction should be made based on such available data. In the observed data, correlations are attenuated for organizations with less variability across business/work units than the population average and vice versa. As such, variability in standard deviations across organizations will create variability in observed correlations and is therefore an artifact that can be corrected for in interpreting the generalizability of validities. Appendixes in Harter and Schmidt (2000) provide artifact distributions for range-restriction/variation corrections used for meta-analysis. These artifact distributions were updated substantially in 2009, and this meta-analysis includes these updates. We have included a randomly selected 100 organizations in our current artifact distributions. Because of the increased size of these tables, they are not included in this report. They resemble those reported in the earlier study, but with a larger number of entries. The following excerpt provides an overview of meta-analysis conducted using artifact distributions:
22Copyright © 2016 Gallup, Inc. All rights reserved.
2016 Q12® Meta-Analysis: Ninth Edition
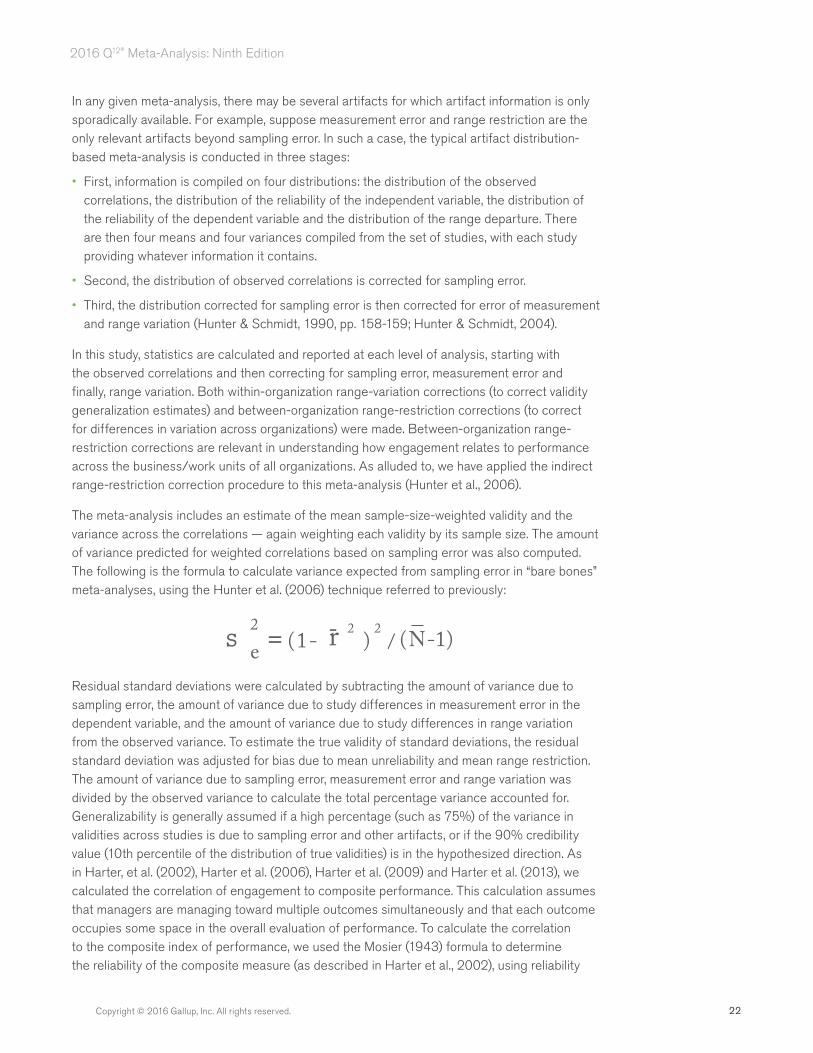
In any given meta-analysis, there may be several artifacts for which artifact information is only sporadically available. For example, suppose measurement error and range restriction are the only relevant artifacts beyond sampling error. In such a case, the typical artifact distribution-based meta-analysis is conducted in three stages:
• First, information is compiled on four distributions: the distribution of the observed correlations, the distribution of the reliability of the independent variable, the distribution of the reliability of the dependent variable and the distribution of the range departure. There are then four means and four variances compiled from the set of studies, with each study providing whatever information it contains.
• Second, the distribution of observed correlations is corrected for sampling error.
• Third, the distribution corrected for sampling error is then corrected for error of measurement and range variation (Hunter & Schmidt, 1990, pp. 158-159; Hunter & Schmidt, 2004).
In this study, statistics are calculated and reported at each level of analysis, starting with the observed correlations and then correcting for sampling error, measurement error and finally, range variation. Both within-organization range-variation corrections (to correct validity generalization estimates) and between-organization range-restriction corrections (to correct for differences in variation across organizations) were made. Between-organization range-restriction corrections are relevant in understanding how engagement relates to performance across the business/work units of all organizations. As alluded to, we have applied the indirect range-restriction correction procedure to this meta-analysis (Hunter et al., 2006).
The meta-analysis includes an estimate of the mean sample-size-weighted validity and the variance across the correlations — again weighting each validity by its sample size. The amount of variance predicted for weighted correlations based on sampling error was also computed. The following is the formula to calculate variance expected from sampling error in “bare bones” meta-analyses, using the Hunter et al. (2006) technique referred to previously:
S2 = (1- - 2
)2
/ (N-1)e rResidual standard deviations were calculated by subtracting the amount of variance due to sampling error, the amount of variance due to study differences in measurement error in the dependent variable, and the amount of variance due to study differences in range variation from the observed variance. To estimate the true validity of standard deviations, the residual standard deviation was adjusted for bias due to mean unreliability and mean range restriction. The amount of variance due to sampling error, measurement error and range variation was divided by the observed variance to calculate the total percentage variance accounted for. Generalizability is generally assumed if a high percentage (such as 75%) of the variance in validities across studies is due to sampling error and other artifacts, or if the 90% credibility value (10th percentile of the distribution of true validities) is in the hypothesized direction. As in Harter, et al. (2002), Harter et al. (2006), Harter et al. (2009) and Harter et al. (2013), we calculated the correlation of engagement to composite performance. This calculation assumes that managers are managing toward multiple outcomes simultaneously and that each outcome occupies some space in the overall evaluation of performance. To calculate the correlation to the composite index of performance, we used the Mosier (1943) formula to determine the reliability of the composite measure (as described in Harter et al., 2002), using reliability
23 Copyright © 2016 Gallup, Inc. All rights reserved.
2016 Q12® Meta-Analysis: Ninth Edition
distributions and intercorrelations of the outcome measures. Patient safety was combined with the more general “safety” category because patient safety is an industry-specific variable. The reliability of the composite metric is 0.91. Composite performance was measured as the equally weighted sum of customer loyalty, turnover (reverse scored as retention), safety (accidents and patient safety incidents reverse scored), absenteeism (reverse scored), shrinkage (reverse scored), financials (with profitability and productivity equally weighted) and quality (defects reverse scored). We also calculated composite performance as the equally weighted sum of the most direct outcomes of engagement — customer loyalty, turnover (reverse scored as retention), safety (accidents/patient safety incidents reverse scored), absenteeism (reverse scored), shrinkage (reverse scored) and quality (defects reverse scored). The reliability of this composite variable is 0.89.
In our research, we used the Schmidt and Le (2004) meta-analysis package (the artifact distribution meta-analysis program with correction for indirect range restriction). The program package is described in Hunter and Schmidt (2004).
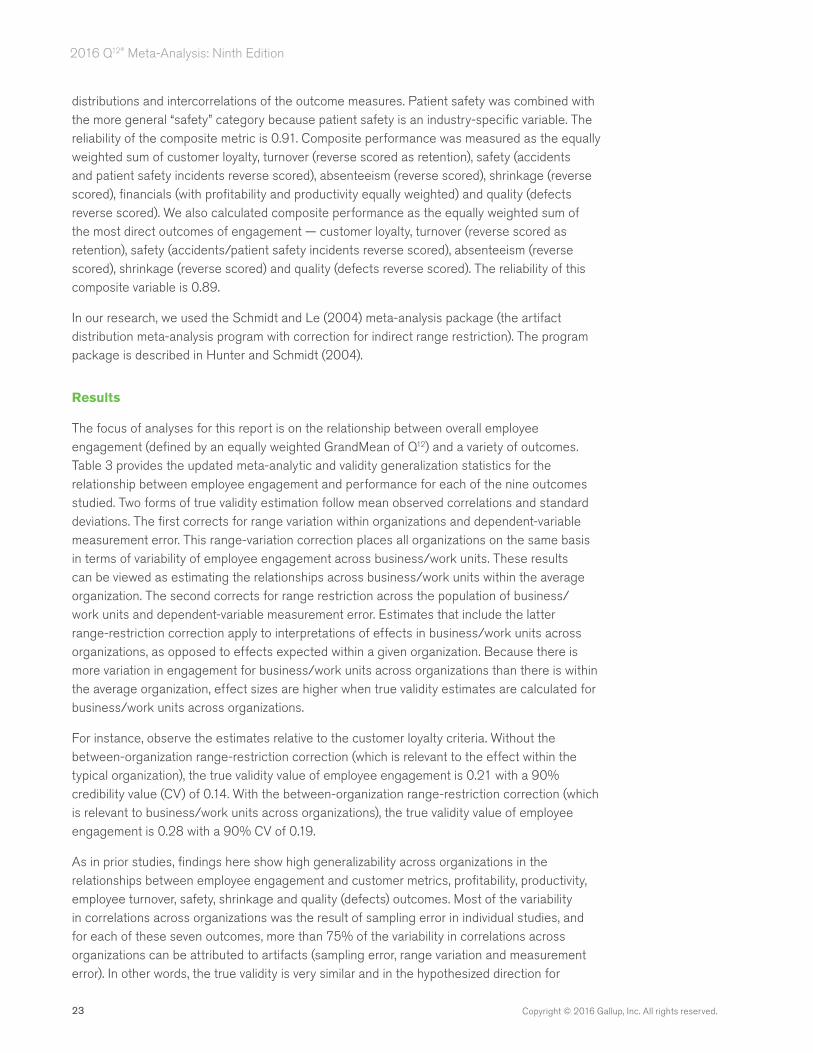
Results
The focus of analyses for this report is on the relationship between overall employee engagement (defined by an equally weighted GrandMean of Q12) and a variety of outcomes. Table 3 provides the updated meta-analytic and validity generalization statistics for the relationship between employee engagement and performance for each of the nine outcomes studied. Two forms of true validity estimation follow mean observed correlations and standard deviations. The first corrects for range variation within organizations and dependent-variable measurement error. This range-variation correction places all organizations on the same basis in terms of variability of employee engagement across business/work units. These results can be viewed as estimating the relationships across business/work units within the average organization. The second corrects for range restriction across the population of business/work units and dependent-variable measurement error. Estimates that include the latter range-restriction correction apply to interpretations of effects in business/work units across organizations, as opposed to effects expected within a given organization. Because there is more variation in engagement for business/work units across organizations than there is within the average organization, effect sizes are higher when true validity estimates are calculated for business/work units across organizations.
For instance, observe the estimates relative to the customer loyalty criteria. Without the between-organization range-restriction correction (which is relevant to the effect within the typical organization), the true validity value of employee engagement is 0.21 with a 90% credibility value (CV) of 0.14. With the between-organization range-restriction correction (which is relevant to business/work units across organizations), the true validity value of employee engagement is 0.28 with a 90% CV of 0.19.
As in prior studies, findings here show high generalizability across organizations in the relationships between employee engagement and customer metrics, profitability, productivity, employee turnover, safety, shrinkage and quality (defects) outcomes. Most of the variability in correlations across organizations was the result of sampling error in individual studies, and for each of these seven outcomes, more than 75% of the variability in correlations across organizations can be attributed to artifacts (sampling error, range variation and measurement error). In other words, the true validity is very similar and in the hypothesized direction for
24Copyright © 2016 Gallup, Inc. All rights reserved.
2016 Q12® Meta-Analysis: Ninth Edition
each organization studied. For the remaining two outcomes (absenteeism and patient safety), results indicate high generalizability across the organizations studied, as indicated by the 90% credibility value in the hypothesized direction. However, the validities vary somewhat more than with other outcomes, although the distribution of validities is in the hypothesized direction. The direction of the effect is predictable, but the size of effect across companies varies somewhat. Artifacts do not explain all of the variance in correlations of employee engagement and these latter two outcomes. It is possible that this is because of a lack of reliability estimates for these outcomes. Unfortunately, we have yet to acquire reliability estimates for these two outcomes. Once reliability estimates become available and as more studies are added to the meta-analysis, future research may shed light on this. Regardless, the 90% credibility values indicate substantial evidence of generalizability for all nine outcomes studied (Schmidt & Hunter, 1977). What this means is that the Q12 measure of employee engagement effectively predicts these outcomes in the expected direction across organizations, including those in different industries and in different countries.
Table 3: Meta-Analysis of Relationship Between Employee Engagement and Business Unit Performance
Customer Loyalty
Profitability Productivity TurnoverSafety
IncidentsAbsenteeism Shrinkage
Patient Safety Incidents
Quality (defects)
Number of Business Units
20,679 31,472 45,328 43,987 9,746 11,460 4,514 1,378 2,320
Number of r’s 94 85 140 106 53 30 11 9 16
Mean Observed r
0.16 0.10 0.14 -0.10 -0.12 -0.16 -0.09 -0.42 -0.16
Observed SD 0.09 0.07 0.08 0.06 0.08 0.09 0.06 0.14 0.10
True Validity1 0.21 0.10 0.16 -0.15 -0.14 -0.16 -0.09 -0.42 -0.16
True Validity SD1
0.05 0.04 0.04 0.01 0.03 0.05 0.03 0.08 0.04
True Validity2 0.28 0.14 0.21 -0.20 -0.19 -0.22 -0.12 -0.53 -0.22
True Validity SD2
0.07 0.05 0.05 0.01 0.04 0.07 0.04 0.08 0.05
% Variance Accounted for — Sampling Error
51 59 48 62 75 34 60 23 69
% Variance Accounted for1
80 76 78 98 92 60 75 71 88
% Variance Accounted for2
80 77 78 98 92 60 75 71 88
90% CV1 0.14 0.06 0.10 -0.13 -0.11 -0.09 -0.05 -0.32 -0.12
90% CV2 0.19 0.08 0.14 -0.18 -0.14 -0.12 -0.06 -0.42 -0.16
25 Copyright © 2016 Gallup, Inc. All rights reserved.
2016 Q12® Meta-Analysis: Ninth Edition
In summary, for the composite measure of engagement shown in Table 3, the strongest effects were found for customer loyalty metrics, productivity, employee turnover, safety, absenteeism, patient safety and quality. Correlations were positive and generalizable relative to profitability and shrinkage criteria, but of slightly lower magnitude. In the case of profitability, it is likely influenced indirectly by employee engagement and more directly by variables such as customer loyalty, productivity, employee turnover, safety, absenteeism, shrinkage, patient safety and quality. Remember, the productivity variable includes various measures of business/work unit productivity, the majority of which are sales data. Of the two financial variables included in the meta-analysis (sales and profit), engagement is most highly correlated with sales. This is probably because day-to-day employee engagement has an impact on customer perceptions, turnover, quality and other variables that are in close proximity with sales. In fact, this is what we have found empirically in our causal analyses (Harter et al., 2010). In the case of shrinkage, correlations may be somewhat lower because many factors influence merchandise shrinkage, including theft, attentiveness to inventory and damaged merchandise. The next section will explore the practical utility of the observed relationships.
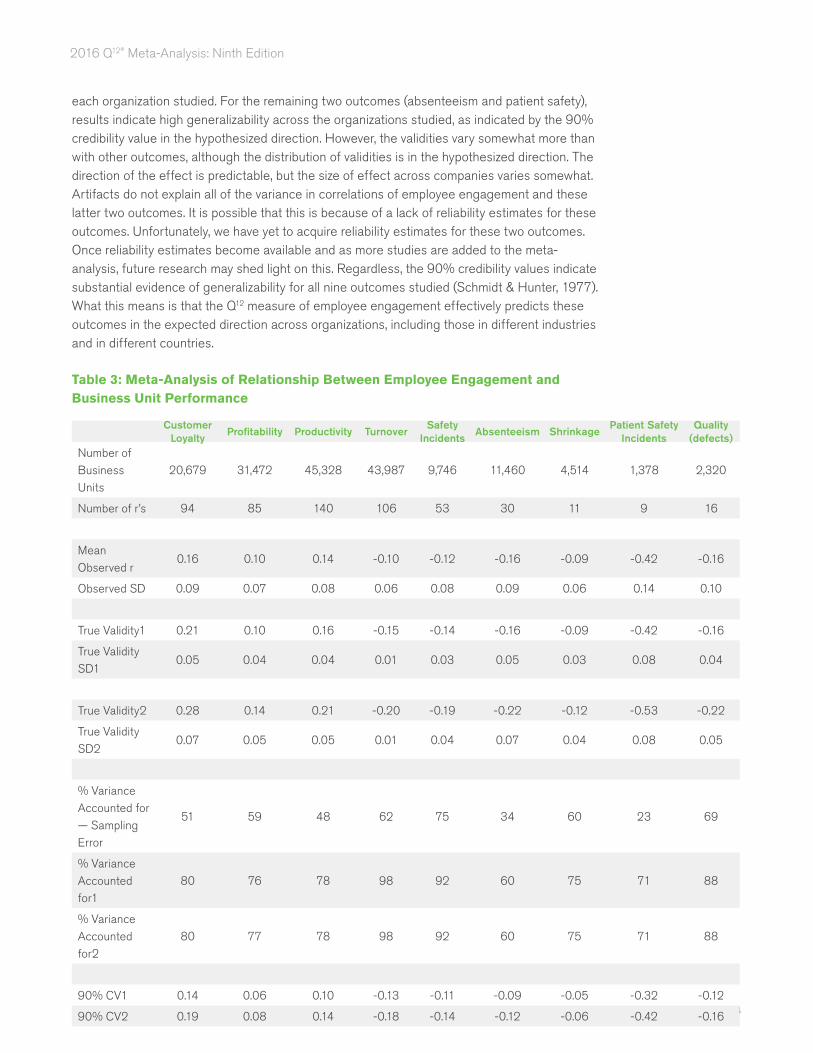
As in Harter et al. (2002), we calculated the correlation of employee engagement to composite performance. As defined earlier, Table 4 provides the correlations and d-values for four analyses: the observed correlations; correction for dependent-variable measurement error; correction for dependent-variable measurement error and range restriction across companies; and correction for dependent-variable measurement error, range restriction and independent-variable measurement error (true score correlation).
As with previous meta-analyses, the effect sizes presented in Table 4 indicate substantial relationships between engagement and composite performance.
Consistent with the 2013 meta-analysis, business units in the top half on engagement within companies have 0.46 standard deviation units’ higher composite performance compared with those in the bottom half on engagement.
Across companies, business units in the top half on engagement have 0.60 standard deviation units’ higher composite performance compared with those in the bottom half on engagement.
After correcting for all available study artifacts (examining the true score relationship), business units in the top half on employee engagement have 0.73 standard deviation units’ higher composite performance compared with those in the bottom half on engagement. This is the true score effect expected over time, across all business units.
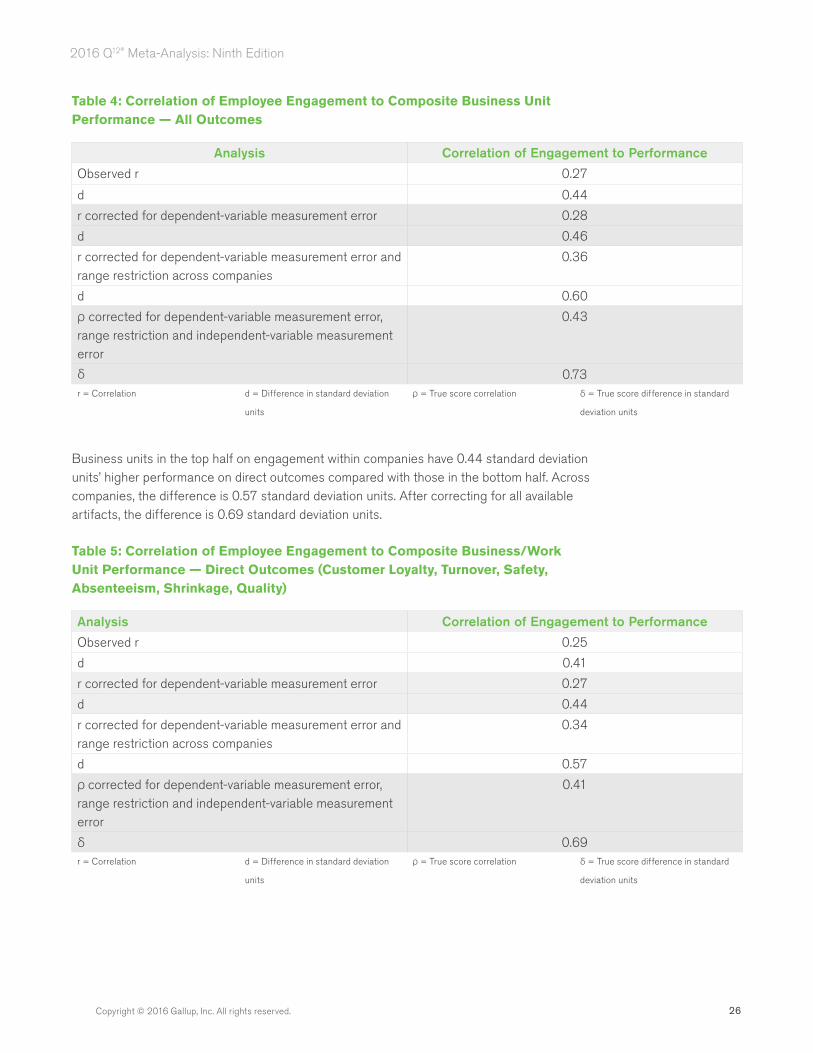
As alluded to, some outcomes are the direct consequence of employee engagement (employee turnover, customer loyalty, safety, absenteeism, shrinkage and quality), and other outcomes are more of a downstream result of intermediary outcomes (sales and profit). For this reason, we have also calculated the composite correlation to short-term outcomes. Table 5 again indicates a substantial relationship between engagement and composite performance. Observed correlations and d-values are of approximately the same magnitude as those reported in Table 4 but slightly lower (most likely because the direct outcomes do not occupy all of the performance criterion space).
26Copyright © 2016 Gallup, Inc. All rights reserved.
2016 Q12® Meta-Analysis: Ninth Edition
Table 4: Correlation of Employee Engagement to Composite Business Unit Performance — All Outcomes
Analysis Correlation of Engagement to Performance
Observed r 0.27
d 0.44
r corrected for dependent-variable measurement error 0.28
d 0.46
r corrected for dependent-variable measurement error and range restriction across companies
0.36
d 0.60
ρ corrected for dependent-variable measurement error, range restriction and independent-variable measurement error
0.43
δ 0.73r = Correlation d = Difference in standard deviation
units
ρ = True score correlation δ = True score difference in standard
deviation units
Business units in the top half on engagement within companies have 0.44 standard deviation units’ higher performance on direct outcomes compared with those in the bottom half. Across companies, the difference is 0.57 standard deviation units. After correcting for all available artifacts, the difference is 0.69 standard deviation units.
Table 5: Correlation of Employee Engagement to Composite Business/Work Unit Performance — Direct Outcomes (Customer Loyalty, Turnover, Safety, Absenteeism, Shrinkage, Quality)
Analysis Correlation of Engagement to Performance
Observed r 0.25
d 0.41
r corrected for dependent-variable measurement error 0.27
d 0.44
r corrected for dependent-variable measurement error and range restriction across companies
0.34
d 0.57
ρ corrected for dependent-variable measurement error, range restriction and independent-variable measurement error
0.41
δ 0.69r = Correlation d = Difference in standard deviation
units
ρ = True score correlation δ = True score difference in standard
deviation units
27 Copyright © 2016 Gallup, Inc. All rights reserved.
2016 Q12® Meta-Analysis: Ninth Edition
Utility Analysis: Practicality of the Effects
Utility Analysis
In the past, studies of job satisfaction’s relationship to performance have had limited analysis of the utility of the reported relationships. Correlations have often been discounted as trivial without an effort to understand the potential utility, in practice, of the relationships. The Q12 includes items that Gallup researchers have found to be changeable by the local manager and others within the business/work unit. As such, understanding the practical utility of potential changes is crucial.
The research literature includes a great deal of evidence that numerically small or moderate effects often translate into large practical effects (Abelson, 1985; Carver, 1975; Lipsey, 1990; Rosenthal & Rubin, 1982; Sechrest & Yeaton, 1982). As shown in Table 6, this is, in fact, the case here. Effect sizes referenced in this study are consistent with or above other practical effect sizes referenced in other reviews (Lipsey & Wilson, 1993).
A more intuitive method of displaying the practical value of an effect is that of binomial effect size displays, or BESDs (Rosenthal & Rubin, 1982; Grissom, 1994). BESDs typically depict the success rate of a treatment versus a control group as a percentage above the median on the outcome variable of interest.
BESDs can be applied to the results of this study. Table 6 shows the percentage of business units above the median on composite performance for high- and low-scoring business/work units on the employee engagement (Q12) composite measure. True validity estimates (correcting for measurement error only in the dependent variable) were used for analysis of business/work units both within and across organizations.
One can see from Table 6 that there are meaningful differences between the top and bottom halves. The top half is defined as the average of business/work units scoring in the highest 50% on the Q12, and business/work units scoring in the lowest 50% constitute the bottom half. It is clear from Table 6 that management would learn a great deal more about success if it studied what was going on in top-half business units rather than bottom-half units.
With regard to composite business/work unit performance, business/work units in the top half on employee engagement have a 78% higher success rate in their own organization and a 113% higher success rate across business units in all companies studied. In other words, business/work units with high employee engagement nearly double their odds of above-average composite performance in their own organizations and increase their odds for above-average success across business/work units in all organizations by 2.1 times.
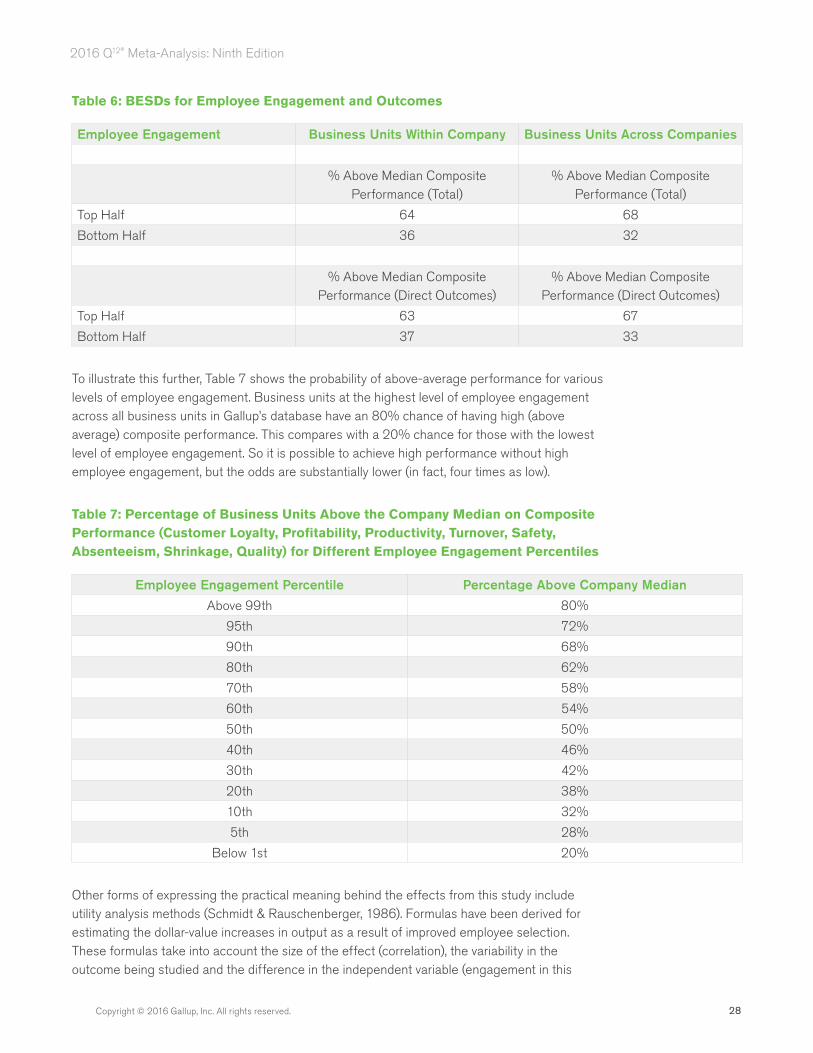
28Copyright © 2016 Gallup, Inc. All rights reserved.
2016 Q12® Meta-Analysis: Ninth Edition
Table 6: BESDs for Employee Engagement and Outcomes
Employee Engagement Business Units Within Company Business Units Across Companies
% Above Median Composite Performance (Total)
% Above Median Composite Performance (Total)
Top Half 64 68
Bottom Half 36 32
% Above Median Composite Performance (Direct Outcomes)
% Above Median Composite Performance (Direct Outcomes)
Top Half 63 67
Bottom Half 37 33
To illustrate this further, Table 7 shows the probability of above-average performance for various levels of employee engagement. Business units at the highest level of employee engagement across all business units in Gallup’s database have an 80% chance of having high (above average) composite performance. This compares with a 20% chance for those with the lowest level of employee engagement. So it is possible to achieve high performance without high employee engagement, but the odds are substantially lower (in fact, four times as low).
Table 7: Percentage of Business Units Above the Company Median on Composite Performance (Customer Loyalty, Profitability, Productivity, Turnover, Safety, Absenteeism, Shrinkage, Quality) for Different Employee Engagement Percentiles
Employee Engagement Percentile Percentage Above Company Median
Above 99th 80%
95th 72%
90th 68%
80th 62%
70th 58%
60th 54%
50th 50%
40th 46%
30th 42%
20th 38%
10th 32%
5th 28%
Below 1st 20%
Other forms of expressing the practical meaning behind the effects from this study include utility analysis methods (Schmidt & Rauschenberger, 1986). Formulas have been derived for estimating the dollar-value increases in output as a result of improved employee selection. These formulas take into account the size of the effect (correlation), the variability in the outcome being studied and the difference in the independent variable (engagement in this
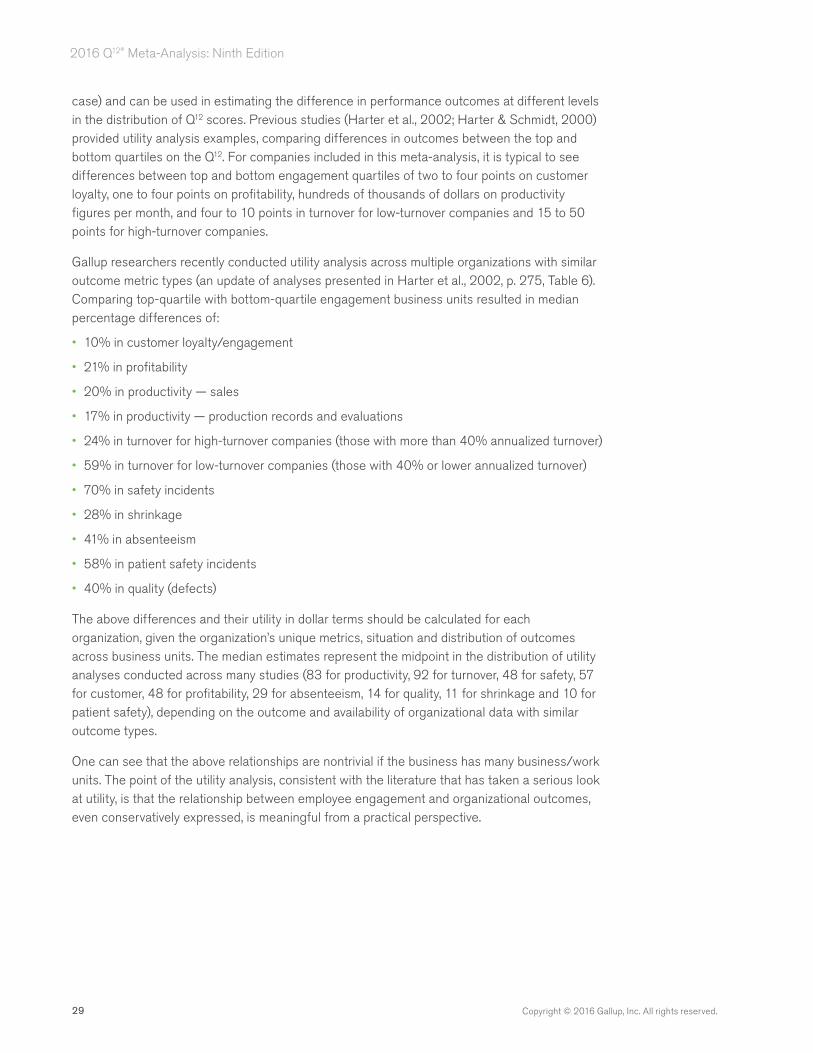
29 Copyright © 2016 Gallup, Inc. All rights reserved.
2016 Q12® Meta-Analysis: Ninth Edition
case) and can be used in estimating the difference in performance outcomes at different levels in the distribution of Q12 scores. Previous studies (Harter et al., 2002; Harter & Schmidt, 2000) provided utility analysis examples, comparing differences in outcomes between the top and bottom quartiles on the Q12. For companies included in this meta-analysis, it is typical to see differences between top and bottom engagement quartiles of two to four points on customer loyalty, one to four points on profitability, hundreds of thousands of dollars on productivity figures per month, and four to 10 points in turnover for low-turnover companies and 15 to 50 points for high-turnover companies.
Gallup researchers recently conducted utility analysis across multiple organizations with similar outcome metric types (an update of analyses presented in Harter et al., 2002, p. 275, Table 6). Comparing top-quartile with bottom-quartile engagement business units resulted in median percentage differences of:
• 10% in customer loyalty/engagement
• 21% in profitability
• 20% in productivity — sales
• 17% in productivity — production records and evaluations
• 24% in turnover for high-turnover companies (those with more than 40% annualized turnover)
• 59% in turnover for low-turnover companies (those with 40% or lower annualized turnover)
• 70% in safety incidents
• 28% in shrinkage
• 41% in absenteeism
• 58% in patient safety incidents
• 40% in quality (defects)
The above differences and their utility in dollar terms should be calculated for each organization, given the organization’s unique metrics, situation and distribution of outcomes across business units. The median estimates represent the midpoint in the distribution of utility analyses conducted across many studies (83 for productivity, 92 for turnover, 48 for safety, 57 for customer, 48 for profitability, 29 for absenteeism, 14 for quality, 11 for shrinkage and 10 for patient safety), depending on the outcome and availability of organizational data with similar outcome types.
One can see that the above relationships are nontrivial if the business has many business/work units. The point of the utility analysis, consistent with the literature that has taken a serious look at utility, is that the relationship between employee engagement and organizational outcomes, even conservatively expressed, is meaningful from a practical perspective.
30Copyright © 2016 Gallup, Inc. All rights reserved.
2016 Q12® Meta-Analysis: Ninth Edition
Discussion
Findings reported in this updated meta-analysis continue to provide large-scale cross-validation to prior meta-analyses conducted on the Q12 instrument. The present study expands the size of the meta-analytic database by 32,320 business/work units (an increase of 65%), as well as the number of countries and work unit types studied. The relationship between engagement and performance at the business unit level continues to be substantial and highly generalizable across companies. Differences in correlations across companies can be attributed mostly to study artifacts. For outcomes with sample sizes of 10,000 or more business units in 2013 (customer, profitability, productivity and turnover), the results of this updated meta-analysis are almost completely replicated. For these outcomes, differences in effect sizes from 2013 to 2015 ranged from 0.01-0.02 and evidence of generalizability remained substantial. The size of this database gives us confidence in the direction of the true relationship between employee engagement and business outcomes but also confidence in the size of the relationship, which can be helpful in calculating potential return on investment from performance management initiatives. The consistent findings across many iterations of meta-analysis also speak to the importance and relevance of workplace perceptions for businesses across different economic times and even amid massive changes in technology since 1997 when this study series began.
These findings are important because they mean generalizable tools can be developed and used across different organizations with a high level of confidence that they elicit important performance-related information. The data from the present study provide further substantiation to the theory that doing what is best for employees does not have to contradict what is best for the business or organization.
It is also worth noting that, as Gallup consultants have educated managers and partnered with companies on change initiatives, organizations have experienced (between the first and second year), on average, one-half standard deviation growth on employee engagement and often a full standard deviation growth and more after three or more years. An important element in the utility of any applied instrument and improvement process is the extent to which the variable under study can be changed. Our current evidence is that employee engagement is changeable and varies widely by business unit or workgroup.
As we demonstrated in the utility analyses presented here and in other iterations of this analysis, the size of the effects observed has important practical implications, particularly given that engagement, as measured here, is quite changeable.
Current and future Gallup research is focusing on expanding the base of outcomes to include health and well-being variables. For instance, one study found substantial linkages between employee engagement in 2008 and sick days in 2009, after controlling for demographics and prior health conditions, including body mass index. In worldwide samples, we have found consistent associations between engagement at work and life satisfaction, daily experiences and health (Gallup, 2010). Another longitudinal study found that changes in engagement predicted changes in cholesterol and triglycerides (via blood samples) after controlling for demographics, health history and medication use (Harter, Canedy, & Stone, 2008). And even more recently, we have observed differences in momentary affect and cortisol when comparing engaged and disengaged employees (Harter & Stone, 2011). Yet another study found engagement at work predicts likelihood of involvement in organization-sponsored

31 Copyright © 2016 Gallup, Inc. All rights reserved.
2016 Q12® Meta-Analysis: Ninth Edition
health programs (Agrawal & Harter, 2009). Others have found engagement to be integral to perceptions of inclusiveness across diverse groups (Jones & Harter, 2004; Badal & Harter, 2014). All together, these studies suggest that the boundaries for the effect of an engaging workplace are quite wide.
32Copyright © 2016 Gallup, Inc. All rights reserved.
2016 Q12® Meta-Analysis: Ninth Edition
References
Abelson, R. P. (1985). A variance explanation paradox: When a little is a lot. Psychological Bulletin, 97(1), 129-133.
Agrawal, S., & Harter, J. K. (2009, October). Employee engagement influences involvement in wellness programs. Omaha, NE: Gallup.
Badal, S., & Harter, J. K. (2014). Gender diversity, business-unit engagement, & performance. Journal of Leadership & Organizational Studies, 2(4), 354-365.
Bangert-Drowns, R. L. (1986). Review of developments in meta-analytic method. Psychological Bulletin, 99(3), 388-399.
Batt, R. (2002). Managing customer services: Human resource practices, quit rates, and sales growth. Academy of Management Journal, 45(3), 587-597.
Carver, R. P. (1975). The Coleman Report: Using inappropriately designed achievement tests. American Educational Research Journal, 12(1), 77-86.
Denison, D. R. (1990). Corporate culture and organizational effectiveness. New York: John Wiley.
Edmans, A. (2012, November 1). The link between job satisfaction and firm value, with implications for corporate social responsibility. Academy of Management Perspectives, 26(4), 1-19.
Fleming, J. H., Coffman, C., & Harter, J. K. (2005, July-August). Manage your Human Sigma. Harvard Business Review, 83(7), 106-114.
Gallup (2010). The state of the global workplace: A worldwide study of employee engagement and wellbeing. Omaha, NE: Gallup.
Gallup, G. H. (1976, Winter). Human needs and satisfactions: A global survey. Public Opinion Quarterly, 40(4), 459-467.
Gallup, G. H., & Hill, E. (1959). The secrets of long life. New York: Bernard Geis.
The Gallup Organization (1992-1999). Gallup Workplace Audit (Copyright Registration Certificate TX-5 080 066). Washington, D.C.: U.S. Copyright Office.
Grissom, R. J. (1994). Probability of the superior outcome of one treatment over another. Journal of Applied Psychology, 79(2), 314-316.
Harter, J. K., & Agrawal, S. (2011). Cross-cultural analysis of Gallup’s Q12 employee engagement instrument. Omaha, NE: Gallup.
Harter, J. K., Asplund, J. W., & Fleming, J. H. (2004, August). HumanSigma: A meta-analysis of the relationship between employee engagement, customer engagement and financial performance. Omaha, NE: The Gallup Organization.
Harter, J. K., Canedy, J., & Stone, A. (2008). A longitudinal study of engagement at work and physiologic indicators of health. Presented at Work, Stress, & Health Conference. Washington, D.C.
33 Copyright © 2016 Gallup, Inc. All rights reserved.
2016 Q12® Meta-Analysis: Ninth Edition
Harter, J. K., & Creglow, A. (1997). A meta-analysis and utility analysis of the relationship between core GWA employee perceptions and business outcomes. Lincoln, NE: The Gallup Organization.
Harter, J. K., & Creglow, A. (1998, July). A meta-analysis and utility analysis of the relationship between core GWA employee perceptions and business outcomes. Lincoln, NE: The Gallup Organization.
Harter, J. K., Hayes, T. L., & Schmidt, F. L. (2004, January). Meta-analytic predictive validity of Gallup Selection Research Instruments (SRI). Omaha, NE: The Gallup Organization.
Harter, J. K., & Schmidt, F. L. (2000, March). Validation of a performance-related and actionable management tool: A meta-analysis and utility analysis. Princeton, NJ: The Gallup Organization.
Harter, J. K., & Schmidt, F. L. (2002, March). Employee engagement, satisfaction, and business-unit-level outcomes: A meta-analysis. Lincoln, NE: The Gallup Organization.
Harter, J. K., & Schmidt, F. L. (2006). Connecting employee satisfaction to business unit performance. In A. I. Kraut (Ed.), Getting action from organizational surveys: New concepts, technologies, and applications (pp. 33-52). San Francisco: Jossey-Bass.
Harter, J. K., & Schmidt, F. L. (2008). Conceptual versus empirical distinctions among constructs: Implications for discriminant validity. Industrial and Organizational Psychology, 1, 37-40.
Harter, J. K., Schmidt, F. L., Agrawal, S., & Plowman, S. K. (2013, February). The Relationship Between Engagement at Work and Organizational Outcomes: 2012 Q12 Meta-Analysis. Omaha, NE: Gallup.
Harter, J. K., Schmidt, F. L., Asplund, J. W., Killham, E. A., & Agrawal, S. (2010). Causal impact of employee work perceptions on the bottom line of organizations. Perspectives on Psychological Science, 5(4), 378-389.
Harter, J. K., Schmidt, F. L., & Hayes, T. L. (2002). Business-unit-level relationship between employee satisfaction, employee engagement, and business outcomes: A meta-analysis. Journal of Applied Psychology, 87(2), 268-279.
Harter, J. K., Schmidt, F. L., & Killham, E. A. (2003, July). Employee engagement, satisfaction, and business-unit-level outcomes: A meta-analysis. Omaha, NE: The Gallup Organization.
Harter, J. K., Schmidt, F. L., Killham, E. A., & Agrawal, S. (2009). Q12 Meta-Analysis. Gallup. Omaha, NE.
Harter, J. K., Schmidt, F. L., Killham, E. A., & Asplund, J. W. (2006). Q12 Meta-Analysis. Gallup. Omaha, NE.
Harter, J. K., & Stone, A. A. (2011). Engaging and disengaging work conditions, momentary experiences, and cortisol response. Motivation and Emotion, 36(2), 104-113.
Hunter, J. E., & Schmidt, F. L. (1983). Quantifying the effects of psychological interventions on employee job performance and work-force productivity. American Psychologist, 38(4), 473-478.
34Copyright © 2016 Gallup, Inc. All rights reserved.
2016 Q12® Meta-Analysis: Ninth Edition
Hunter, J. E., & Schmidt, F. L. (1990). Methods of meta-analysis: Correcting error and bias in research findings. Newbury Park, CA: Sage.
Hunter, J. E., & Schmidt, F. L. (2004). Methods of meta-analysis: Correcting error and bias in research findings (2nd ed.). Newbury Park, CA: Sage.
Hunter, J. E., Schmidt, F. L., & Le, H. A. (2006). Implications of direct and indirect range restriction for meta-analysis methods and findings. Journal of Applied Psychology, 91, 594-612.
Huselid, M. A. (1995). The impact of human resource management practices on turnover, productivity, and corporate financial performance. Academy of Management Journal, 38(3), 635-672.
Iaffaldano, M. T., & Muchinsky, P. M. (1985). Job satisfaction and job performance: A meta-analysis. Psychological Bulletin, 97(2), 251-273.
Johnson, J. W. (1996). Linking employee perceptions of service climate to customer satisfaction. Personnel Psychology, 49, 831-851.
Jones, J. R., & Harter, J. K. (2004). Race effects on the employee engagement-turnover intention relationship. Journal of Leadership & Organizational Studies, 11(2), 78-87.
Judge, T. A., Thoresen, C. J., Bono, J. E., & Patton, G. K. (2001). The job satisfaction-job performance relationship: A qualitative and quantitative review. Psychological Bulletin, 127(3), 376-407.
Lipsey, M. W. (1990). Design sensitivity: Statistical power for experimental research. Newbury Park, CA: Sage.
Lipsey, M. W., & Wilson, D. B. (1993). The efficacy of psychological, educational, and behavioral treatment: Confirmation from meta-analysis. American Psychologist, 48(12), 1181-1209.
Mosier, C. I. (1943). On the reliability of a weighted composite. Psychometrika, 8, 161-168.
National Technical Information Services. (1987). Standard Industrial Classification manual. Washington, D.C.: Executive Office of the President, Office of Management and Budget.
Ostroff, C. (1992). The relationship between satisfaction, attitudes, and performance: An organizational level analysis. Journal of Applied Psychology, 77(6), 963-974.
Reynierse, J. H., & Harker, J. B. (1992). Employee and customer perceptions of service in banks: Teller and customer service representative ratings. Human Resource Planning, 15(4), 31-46.
Rosenthal, R., & Rubin, D. B. (1982). A simple, general purpose display of magnitude of experimental effect. Journal of Educational Psychology, 74, 166-169.
Schmidt, F. L. (1992). What do data really mean? Research findings, meta-analysis, and cumulative knowledge in psychology. American Psychologist, 47(10), 1173-1181.
Schmidt, F. L., & Hunter, J. E. (1977). Development of a general solution to the problem of validity generalization. Journal of Applied Psychology, 62, 529-540.
Schmidt, F. L., & Hunter, J. E. (1996). Measurement error in psychological research: Lessons from 26 research scenarios. Psychological Methods, 1(2), 199-223.
35 Copyright © 2016 Gallup, Inc. All rights reserved.
2016 Q12® Meta-Analysis: Ninth Edition
Schmidt, F. L., & Hunter, J. E. (2015). Methods of meta-analysis: Correcting error and bias in research findings. (3rd ed.). Thousand Oaks, CA: Sage.
Schmidt, F. L., Hunter, J. E., McKenzie, R. C., & Muldrow, T. W. (1979). Impact of valid selection procedures on work-force productivity. Journal of Applied Psychology, 64(6), 609-626.
Schmidt, F. L., Hunter, J. E., Pearlman, K., & Rothstein-Hirsh, H. (1985). Forty questions about validity generalization and meta-analysis. Personnel Psychology, 38, 697-798.
Schmidt, F. L., & Le, H. A. (2004). Software for the Hunter-Schmidt meta-analysis methods. Iowa City, IA: Tippie College of Business, University of Iowa.
Schmidt, F. L., & Rader, M. (1999). Exploring the boundary conditions for interview validity: Meta-analytic validity findings for a new interview type. Personnel Psychology, 52, 445-464.
Schmidt, F. L., & Rauschenberger, J. (1986, April). Utility analysis for practitioners. Paper presented at the First Annual Conference of The Society for Industrial and Organizational Psychology, Chicago, IL.
Schmit, M. J., & Allscheid, S. P. (1995). Employee attitudes and customer satisfaction: Making theoretical and empirical connections. Personnel Psychology, 48, 521-536.
Schneider, B. (1991). Service quality and profits: Can you have your cake and eat it too? Human Resource Planning, 14(2), 151-157.
Schneider, B., Ashworth, S. D., Higgs, A. C., & Carr, L. (1996). Design, validity, and use of strategically focused employee attitude surveys. Personnel Psychology, 49(3), 695-705.
Schneider, B., & Bowen, D. E. (1993). The service organization: Human resources management is crucial. Organizational Dynamics, 21, 39-52.
Schneider, B., Parkington, J. J., & Buxton, V. M. (1980). Employee and customer perceptions of service in banks. Administrative Science Quarterly, 25, 252-267.
Sechrest, L., & Yeaton, W. H. (1982). Magnitudes of experimental effects in social science research. Evaluation Review, 6(5), 579-600.
Ulrich, D., Halbrook, R., Meder, D., Stuchlik, M., & Thorpe, S. (1991). Employee and customer attachment: Synergies for competitive advantage. Human Resource Planning, 14(2), 89-103.
Wagner, R., & Harter, J. K. (2006). 12: The elements of great managing. New York: Gallup Press.
Whitman, D. S., Van Rooy, D. L., & Viswesvaran, C. (2010). Satisfaction, citizenship behaviors, and performance in work units: A meta-analysis of collective construct relations. Personnel Psychology, 63(1), 41-81.
Wiley, J. W. (1991). Customer satisfaction: A supportive work environment and its financial cost. Human Resource Planning, 14(2), 117-127.
Zohar, D. (1980). Safety climate in industrial organizations: Theoretical and applied implications. Journal of Applied Psychology, 65(1), 96-102.
Zohar, D. (2000). A group-level model of safety climate: Testing the effect of group climate on microaccidents in manufacturing jobs. Journal of Applied Psychology, 85(4), 587-596.
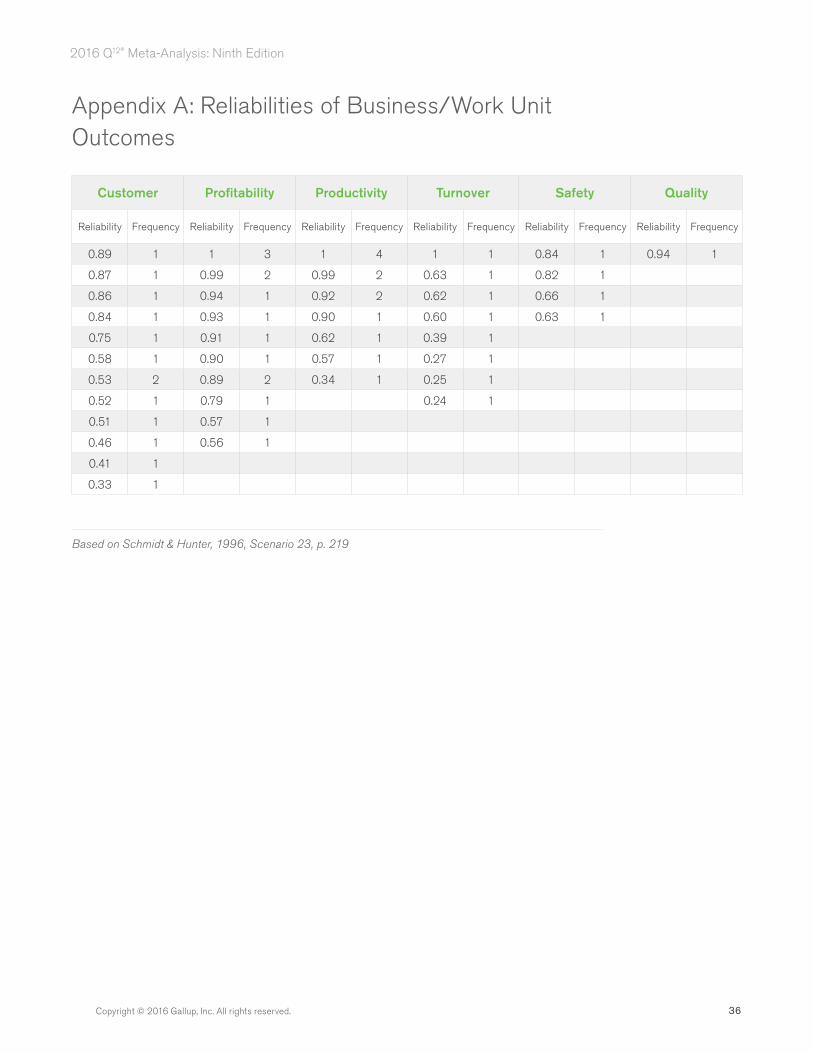
36Copyright © 2016 Gallup, Inc. All rights reserved.
2016 Q12® Meta-Analysis: Ninth Edition
Appendix A: Reliabilities of Business/Work Unit Outcomes
Customer Profitability Productivity Turnover Safety Quality
Reliability Frequency Reliability Frequency Reliability Frequency Reliability Frequency Reliability Frequency Reliability Frequency
0.89 1 1 3 1 4 1 1 0.84 1 0.94 1
0.87 1 0.99 2 0.99 2 0.63 1 0.82 1
0.86 1 0.94 1 0.92 2 0.62 1 0.66 1
0.84 1 0.93 1 0.90 1 0.60 1 0.63 1
0.75 1 0.91 1 0.62 1 0.39 1
0.58 1 0.90 1 0.57 1 0.27 1
0.53 2 0.89 2 0.34 1 0.25 1
0.52 1 0.79 1 0.24 1
0.51 1 0.57 1
0.46 1 0.56 1
0.41 1
0.33 1
Based on Schmidt & Hunter, 1996, Scenario 23, p. 219
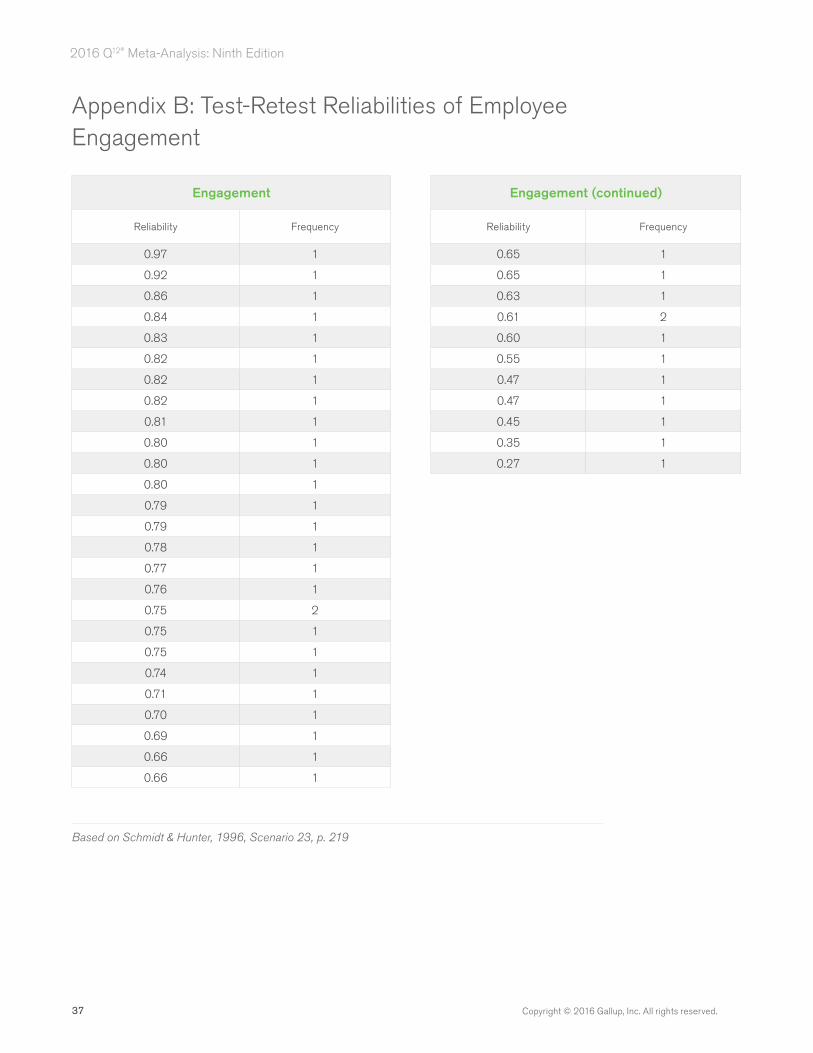
37 Copyright © 2016 Gallup, Inc. All rights reserved.
2016 Q12® Meta-Analysis: Ninth Edition
Appendix B: Test-Retest Reliabilities of Employee Engagement
Engagement Engagement (continued)
Reliability Frequency Reliability Frequency
0.97 1 0.65 1
0.92 1 0.65 1
0.86 1 0.63 1
0.84 1 0.61 2
0.83 1 0.60 1
0.82 1 0.55 1
0.82 1 0.47 1
0.82 1 0.47 1
0.81 1 0.45 1
0.80 1 0.35 1
0.80 1 0.27 1
0.80 1
0.79 1
0.79 1
0.78 1
0.77 1
0.76 1
0.75 2
0.75 1
0.75 1
0.74 1
0.71 1
0.70 1
0.69 1
0.66 1
0.66 1
Based on Schmidt & Hunter, 1996, Scenario 23, p. 219