the relationship between student engagement and recent
TRANSCRIPT

University of Central Florida University of Central Florida
STARS STARS
Electronic Theses and Dissertations, 2004-2019
2013
The Relationship Between Student Engagement And Recent The Relationship Between Student Engagement And Recent
Alumni Donors At Carnegie Baccalaureate Colleges Located In Alumni Donors At Carnegie Baccalaureate Colleges Located In
The Southeastern United States The Southeastern United States
Joshua Truitt University of Central Florida
Part of the Higher Education Commons
Find similar works at: https://stars.library.ucf.edu/etd
University of Central Florida Libraries http://library.ucf.edu
This Doctoral Dissertation (Open Access) is brought to you for free and open access by STARS. It has been accepted
for inclusion in Electronic Theses and Dissertations, 2004-2019 by an authorized administrator of STARS. For more
information, please contact [email protected].
STARS Citation STARS Citation Truitt, Joshua, "The Relationship Between Student Engagement And Recent Alumni Donors At Carnegie Baccalaureate Colleges Located In The Southeastern United States" (2013). Electronic Theses and Dissertations, 2004-2019. 2791. https://stars.library.ucf.edu/etd/2791
THE RELATIONSHIP BETWEEN STUDENT ENGAGEMENT AND RECENT
ALUMNI DONORS AT CARNEGIE BACCALAUREATE COLLEGES LOCATED IN THE
SOUTHEASTERN UNITED STATES
by
JOSHUA HYLTON TRUITT
B.S. University of Central Florida, 2007
M.B.A. Rollins College, 2010
A dissertation submitted in partial fulfillment of the requirements
for the degree of Doctor of Philosophy
in the Department of Child, Family, and Community Sciences
in the College of Education and Human Performance
at the University of Central Florida
Orlando, FL
Fall Term
2013
Major Professor: Sandra Robinson

ii
© 2013 Joshua Hylton Truitt

iii
ABSTRACT
In 2011, over 30 billion dollars were given to colleges and universities across the United States;
donors included individuals, corporations, foundations, and religious organizations. Of the 30
billion dollars, 43% of this financial support came directly from individual and alumni donors
(Council for Aid to Education, 2011). Leslie and Ramey (1988) stated that “voluntary support is
becoming the only source of real discretionary money [that a college or university has]” (p. 115).
The primary purpose of this study was to investigate the ability of responses from senior class
students on the 2006 National Survey of Student Engagement to be used as predictors of alumni
donor participation in liberal arts colleges. The sample of this study was 10 Carnegie
Baccalaureate Colleges from the southeastern United States. The institutions that participated
provided alumni donor participation data for members of the undergraduate class of 2006 for a
five-year post-graduation period. Logistical regression models were developed to represent the
multivariate impacts of NSSE benchmark scores and student demographics independent
variables on the bivariate alumni donor participation rate dependent variable.
The results indicated that two NSSE benchmarks, measured by the 2006 NSSE, (Level of
Academic Challenge and Student-Faculty Interaction) and three demographic variables (parental
level of education, Greek Life membership, and receipt of an institutional scholarship) had a
positive relationship with increased alumni donor participation.

iv
I dedicate this dissertation to my wife, parents, brothers, and mentors. Your love, support, and
gentle prodding made this dissertation a reality.

v
ACKNOWLEDGMENTS
I wish to thank my committee members who were generous and selfless with their
time, expertise, and encouragement. To my committee chair, Dr. Sandra Robinson, thank
you for pushing me to the next level, and supporting me through challenges; you may
never know the confidence it gave me to have you riding shotgun. Dr. Glenn Lambie, you
are an accomplished methodologist and have a gift for sharing your expertise with
patience and genuine kindness, thank you for your inspiration and dedication. Dr. Nancy
Marshall, thank you for listening and offering advice, your honesty and encouragement
helped me stay the path and grow as a scholar. Dr. Rosa Cintron, thank you for your
insight and guidance; throughout this journey you have helped me understand that the
“desire to learn counts more than any other qualification, and seriousness more than
brilliance.” Dr. Thomas Cox, your feedback and advice helped develop and guide my
research.
A special debt of gratitude is due to Terrie Sypolt, UCF’s premier research and
information services librarian, better known as “the education database guru.” You have
provided endless hours of help, and my dissertation is better because of you.
I also have endless thanks to my friends at the UCF Office of Research and
Commercialization, especially, Drs. M.J. Soileau, Thomas O’Neal, and Svetlana Shtrom.
Thank you for your support and encouragement.
My accomplishments are a result of the wisdom, advice, and support that my
family, mentors, colleagues, and friends have imparted to me. Thank you for sharing this
journey with me!
vi
TABLE OF CONTENTS
LIST OF FIGURES ............................................................................................................ x
LIST OF TABLES ............................................................................................................. xi
CHAPTER ONE: INTRODUCTION ................................................................................. 1
Background of the Problem ........................................................................................3
Student Affairs .................................................................................................... 3
Student Engagement ............................................................................................ 4
Statement of the Problem ...........................................................................................5
Purpose of the Study ..................................................................................................7
Research Questions ....................................................................................................7
Significance of the Study ...........................................................................................8
Definition of Terms ....................................................................................................9
Conceptual Framework ............................................................................................10
Limitations of the Study ...........................................................................................16
Delimitations of the Study ........................................................................................17
Organization of the Study ........................................................................................17
CHAPTER TWO: LITERATURE REVIEW ................................................................... 19
Introduction ..............................................................................................................19
Baccalaureate Colleges ............................................................................................21
The Carnegie Classification’s Definition of Liberal Arts Colleges .................. 21
What is a Liberal Arts College? ........................................................................ 23
History of Liberal Arts Colleges .................................................................. 23
Present Day Liberal Arts Campuses and Students ............................................ 25
Present-Day Financial Challenges .................................................................... 26
Philanthropic Alumni Donor Participation ..............................................................33
History ............................................................................................................... 33
Organized Alumni Donor Participation ............................................................ 34
National Rankings ............................................................................................. 35

vii
Size Does Not Matter ........................................................................................ 35
Present Day ....................................................................................................... 36
Research on Alumni Participation at Baccalaureate Colleges .......................... 38
Variables Related to Alumni Donor Participation ...................................................41
Student Experience ............................................................................................ 41
Demographic Variables ..................................................................................... 44
Student Engagement .................................................................................................48
Student-Faculty Contact .................................................................................... 50
Reciprocity and Cooperation among Students .................................................. 51
Prompt Feedback and Time on Task ................................................................. 53
High Expectations from Faculty and Respect for Diverse Talents ................... 53
Adaptations of the Seven Principles .........................................................................54
Developments in Student Engagement ............................................................. 55
Streamlining Student Engagement .................................................................... 56
National Survey of Student Engagement .................................................................56
Descriptions of the Five Benchmarks ............................................................... 58
Critiques of NSSE ............................................................................................. 60
Student Engagement and Alumni Giving Summary ......................................... 64
Summary ..................................................................................................................65
CHAPTER THREE: METHODOLOGY ......................................................................... 67
Introduction ..............................................................................................................67
Research Methods ....................................................................................................67
Research Design ................................................................................................ 68
Data Sources ...................................................................................................... 70
National Survey of Student Engagement .......................................................... 72
Instrument Consistency and Validity ........................................................... 73
Population .......................................................................................................... 76
Sample ............................................................................................................... 77
Procedure ..................................................................................................................79

viii
Data Collection .................................................................................................. 79
NSSE Data .................................................................................................... 79
Alumni Donor Participation Data ................................................................. 80
Data Preparation ........................................................................................... 80
Independent Variables ....................................................................................... 81
NSSE Variables ............................................................................................ 81
Demographic Variables ................................................................................ 82
Dependent Variable ...................................................................................... 83
Data Analysis ...........................................................................................................83
Summary ..................................................................................................................84
CHAPTER FOUR: RESULTS ......................................................................................... 86
Introduction ..............................................................................................................86
Sampling and Data Collection Procedures ...............................................................87
Target Population .............................................................................................. 87
Data Collection Procedures ............................................................................... 88
Response Rate ................................................................................................... 89
Sample Demographics and Descriptive Statistics ............................................. 91
Data Preparation ................................................................................................ 93
Multicollinearity of NSSE benchmarks ........................................................ 93
Statistical Procedures ...............................................................................................96
Preliminary Analysis for Research Question 1 ................................................. 97
Research Question One ................................................................................ 99
Preliminary Analysis for Research Question 2 ............................................... 101
Research Question Two .............................................................................. 103
Summary ................................................................................................................109
CHAPTER FIVE: DISCUSSION ................................................................................... 111
Introduction ............................................................................................................111
Overview of the Study ............................................................................................111
Internal Consistency of NSSE ......................................................................... 113

ix
Reliability of Data ........................................................................................... 114
Discussion of Findings ...........................................................................................118
Research Question One ................................................................................... 118
Statistical Significance ............................................................................... 118
Substantive Significance ............................................................................ 120
Research Question Two .................................................................................. 122
Statistical Significance ............................................................................... 123
Substantive Significance ............................................................................ 125
Limitations of the Study .........................................................................................126
Research Design .............................................................................................. 126
Sampling .......................................................................................................... 127
Instrumentation ................................................................................................ 128
Implications ............................................................................................................128
Recommendations for Future Research .................................................................130
Conclusions ............................................................................................................132
APPENDIX A: 2006 NSSE ............................................................................................ 134
APPENDIX B: UCF IRB LETTER ................................................................................ 139
APPENDIX C: NSSE DATA SHARING AGREEMENT ............................................. 141
APPENDIX D: EMAIL REQUESTING DATA ............................................................ 146
REFERENCES ............................................................................................................... 148

x
LIST OF FIGURES
Figure 1. Multivariate Causal Model of Alumni Giving. ................................................. 13
Figure 2. Student-Centered Model of Alumni Donor Participation. ................................ 15
Figure 3. Philanthropic Financial Support of Higher Education Totals $30.3 Billion. .... 19
Figure 4. Enrollment at Baccalaureate Colleges. .............................................................. 29
Figure 5. Undergraduate Tuition and Fees at Baccalaureate Colleges. ............................ 29
Figure 6. Alumni Donor Participation at Baccalaureate Colleges. ................................... 37
Figure 7. Student-Centered Model of Alumni Donor Participation. ................................ 58

xi
LIST OF TABLES
Table 1 Chickering and Gamson’s Seven Principles and NSSE Benchmarks ................. 60
Table 2 Questions on the 2006 NSSE that Moderate the Five Benchmarks Scores ......... 71
Table 3 Internal Consistency of the 2006 NSSE Benchmarks ......................................... 74
Table 4 Regional Distribution of Private Not-for-Profit Liberal Arts Colleges ............... 77
Table 5 Internal Consistency for a Random Sample of 2006 NSSE Benchmark Data and
the 2006 NSSE Benchmark Data Used in the Present Study .............................. 95
Table 6 Institution Level NSSE Benchmark Data Used in the Present Study .................. 96
Table 7 Summary of Logistic Regression Analysis for Engagement Factors Predicting
Institutional Giving Rates (N = 1,073) ............................................................... 101
Table 8 Block Model for Research Question 2 ............................................................... 104
Table 9 Summary of Logistic Regression Analysis for Demographic Factors Predicting
Institutional Giving Rates (N = 1,060) ................................................................ 108
Table 10 2006 NSSE Benchmark Data Used in the Present Study ................................ 116
Table 11 Institution Level NSSE Benchmark Data Used in the Present Study .............. 117

1
CHAPTER ONE: INTRODUCTION
As state and federal support for higher education decreases and the costs to operate
continue to rise, institutions across the United States have come to rely on private funds
(Drezner, 2011; Giving USA, 2011). Over the last 30 years, state and national appropriations for
higher education have not maintained pace with the rising costs of higher education (Thelin,
2004), and the burden has been relieved in part by private philanthropic donations. Philanthropic
donations from corporations, foundations, religious organizations, and individuals are just a few
of the primary sources of the much-needed funding.
Fortunately, private support of education has steadily increased over the last half-century.
In 1965, private support for education was $2.01 billion (in constant dollars); by 2010, support
increased to $41.67 billion, representing an increase of 2,073 percent over a 45-year period
(Giving USA, 2011). Higher education received the largest portion of support, and alumni
accounted for the largest body giving at colleges and universities (Giving USA, 2011).
Furthermore, private individual support of higher education is an indelible trademark of
American higher education (Cutlip, 1965). This much-needed private philanthropic support helps
colleges to keep the doors open and young minds engaged (Friedmann, 2003).
Sun, Hoffman, and Grady (2007) reported that the study and exploration of strategies to
solicit private funds for education is a growing field, and because institutions have an
opportunity to influence alumni, considerable research has contributed to a better understanding
of alumni and their reasons for giving to their alma mater (Tsao & Coll, 2005; Gaier, 2005).
Research investigating giving as a function of individual alumni characteristics, aspects of
campus culture, educational environments, demographic data, and other facets of the college

2
experience has been published (e.g., Gaier, 2005; Giving USA, 2011; Sun et al., 2007; Taylor &
Martin, 1995; Thomas & Smart, 1995; Todd, 1993; Tsao & Coll, 2005). Specific individual
aspects of alumni giving that have been studied include (a) participating in post-graduation
campus events; (b) reading alumni magazines; (c) joining the alumni association; (d) updating
contact information regularly; and (e) maintaining contact with faculty and staff; as well as (f)
demographics such as gender, religion, age, family income, program of study, political
affiliation, proximity to alma mater, highest degree attained, and birth order (Taylor & Martin,
1995). Furthermore, researchers have considered experience and attitudinal variables that may
impact alumni donor participation.
Attitudinal variables such as satisfaction with educational experience and emotional
attachment to the institution have been shown to influence alumni donor participation (Martin
Jr., 1993; Pearson, 1999; Shadoian, 1989; Tsao & Coll, 2005). Gaier (2005) found that alumni
who reported being satisfied with their college experiences remained connected to the institution
post-graduation and made financial contributions. Researchers have suggested that enhancing the
college students’ experience and better understanding the role of student engagement in alumni
donor behavior are two factors that may increase future donor involvement (Drezner, 2011;
Field, 2011; Outcalt & Skewes-Cox, 2002; Thomas & Smart, 1995; Todd, 1993) and positively
impact the financial position of colleges and universities.
Although there is a broad base of research on alumni giving and opportunities to
influence alumni donor involvement, many of the research findings suggest that an alumnus’s
decision to be a donor is impacted by college experience and engagement after college (Kuh,
2001b; O’Neill, 2005). However, it is still unclear how student engagement during college
3
impacts future donor behavior, especially within Carnegie Baccalaureate Colleges. Indeed,
understanding how an institution can influence alumni donor behavior by focusing on students
before they become alumni will drive the next generation of philanthropy research (Hurvitz,
2010). This investigation provides information on the relationship between student engagement
while students are in college and alumni donor participation after graduation.
Background of the Problem
Academic fundraisers within alumni affairs and institutional development offices
continue to grow and cultivate relationships with alumni. The relationships between academic
fundraisers and alumni are important in keeping the institution apprised of changes in the lives of
its alumni, as well as providing alumni updates about their alma mater. Often, the relationships
between academic fundraisers and alumni evolve into an opportunity for an alumnus to become a
financial partner and supporter of the institution. Stimuli that influence philanthropic
involvement among alumni are of great interest to academic fundraisers. Field (2011) suggested,
“Marketing research reveals information about what triggers consumers to buy certain products
or brands, [and] academic fundraisers will begin to seek out answers to what prompts
philanthropic activity among alumni” (p. 1). Satisfaction with college experience, a phenomenon
impacted by student affairs, is a key determinant of alumni donor involvement (e.g., Pumerantz,
2004).
Student Affairs
Student affairs departments have many partners and stakeholders, including parents,
faculty, and the campus community, but students are the clients of student affairs offices (Evans,

4
Forney, & Guido-DiBrito, 1998). The innovative programs and services provided by student
affairs offices are implemented to increase satisfaction and engagement on college campuses,
and have been instrumental in guiding and serving students for over half a century (Komives,
Dudley, & Woodard, 1996). While continuing to improve resources for students and
stakeholders, student affairs departments have examined student engagement, especially at
Carnegie Baccalaureate Colleges.
Student Engagement
Chickering and Gamson (1987), Perry (1968), King (1994), and others have sought to
understand student engagement and the drivers that promote engagement and success of college
students. These student engagement stimuli are characterized by: (a) student-faculty contact; (b)
cooperation among students; (c) active learning; (d) prompt feedback; (e) time on task; (f) high
expectations; and (g) respect for diverse talents and ways of learning (Carini, Kuh, & Klein,
2006; Chickering & Gamson, 1987, 1991; Kuh, 2001a, 2004; Pascarella & Terenzini, 2005). The
characterizations of student engagement help to inform student experience.
Zhao and Kuh (2004) suggested that student engagement is of utmost importance, and
found that institutions that promote student engagement have higher levels of student
achievement and satisfaction. In addition, Field (2011) found that student engagement and
satisfaction with college experience were key predictors of alumni donor involvement.
Therefore, student engagement moderates both student achievement and alumni philanthropy.
Additionally, Gaier (2005) and Tsao and Coll (2005) found that high levels of student
satisfaction with college experience and high levels of alumni donor participation were positively

5
correlated. However, there exists an undefined connection between student engagement and
alumni donor participation at Carnegie Baccalaureate Colleges, and elucidating this connection
will give student affairs and alumni affairs offices the tools to impact student success and
promote alumni donor participation (Field, 2011; Pearson, 1999).
Statement of the Problem
Researchers of alumni giving have examined a broad array of alumni characteristics and
post-graduation attributes that may predict alumni donor participation, but the research has
focused on a single institution, Ivy League colleges, or large research universities, and limited
attention has been placed on Carnegie Baccalaureate Colleges. Additionally, the literature of
student engagement theory has traditionally maintained a narrow focus on opportunities to
enhance student achievement and outcomes, including graduation rates, graduate school
admission tests scores, and self-reported student learning (e.g., Field, 2011; Kuh, Schuh, Whitt,
& Associates, 1991; Pascarella & Terenzini, 1991, 2005; Zhao & Kuh, 2004). Therefore, little is
known about the overlap of student engagement and recent alumni participation, especially as it
relates to Carnegie Baccalaureate Colleges.
The attempt to define the relationship between student engagement and alumni donor
participation was introduced by Field (2011). Field (2011) reported that Carnegie Baccalaureate
Colleges with high scores of student engagement reported higher percent of alumni donor
participation. However, as Field’s study did not include an examination of the unique regional
Carnegie Baccalaureate College campus environments, demographics, student experiences, and

6
individual class cohorts, the findings were not helpful to practitioners seeking to increase
donations in Carnegie Baccalaureate College environments.
Moreover, there is a lack of research investigation of the relationships between the
variables of (a) student engagement during school, (b) student experiences, and (c) alumni donor
participation rates. Information on the extent of the relationship between recent alumni donor
participation rates and student engagement of individual class year cohorts is requisite as schools
continue to experience losses in external funding and come increasingly to rely on private
philanthropic support (Friedmann, 2003). As the operational costs of higher education continue
to rise and there is a lack of external funding, it is essential that alumni donor participation
practices continue. Moreover, empirically supported strategies to encourage alumni donor
participation are needed to maintain the level of alumni donor participation that colleges depend
upon. Especially given the slow recovery of the United States from the Great Recession,
acknowledged to be the most devastating global economic crisis since the Great Depression of
the 1930s, which started on December 2007 and lasted over 20 months. Although research has
examined selected variables that may influence alumni donor participation in certain settings,
there is a lack of information on the relationship between alumni donor participation and student
engagement, especially in a Carnegie Baccalaureate Colleges setting. Investigating the possible
relationship between student engagement and alumni donor participation is timely and may be
helpful both to practitioners who work to enhance student experiences that contribute to student
engagement and to alumni affairs staff seeking to maximize financial giving.

7
Purpose of the Study
The purpose of this quantitative study was to ascertain the relationship between level of
student engagement of senior class cohorts at Carnegie Baccalaureate Colleges and alumni donor
participation rates during a five-year post-graduation period. A correlational research design was
employed to examine student engagement benchmark and alumni donor participation rates (as
measured by the 2006 National Survey of Student Engagement [NSSE]). A correlational design
was appropriate for this research, as the primary purposes of the investigation were to determine
the predictive power of student demographics and their NSSE benchmark scores on alumni
donor participation. The NSSE Student Engagement benchmarks include: (a) Level of Academic
Challenge; (b) Active and Collaborative Learning; (c) Student-Faculty Interaction; (d)
Supportive Campus Environment; and (e) Enriching Educational Experience (NSSE, 2000).
Recent alumni participation rates at Carnegie Baccalaureate Colleges were collected via the
participation of institutions located in the southeastern region of the United States over the
pursuant five-year period.
Research Questions
This study is guided by the following research questions:
1. What is the relationship between student engagement rates at Carnegie Baccalaureate
Colleges (as measured by the five NSSE 2006 benchmarks of engagement: [a] level of academic
challenge; [b] active and collaborative learning; [c] student-faculty interaction; [d] supportive
campus environment; and [e] enriching educational experience) and alumni donor participation
rates over a five year post-graduation period (2007, 2008, 2009, 2010, 2011)?

8
2. What is the relationship between alumni donor participation rates and the NSSE
demographic variables of: (a) parents’ education levels, (b) nationality, (c) academic major, (d)
recipient of scholarship, (e) gender, and (f) participation in Greek Life?
Significance of the Study
Alumni are key supporters of colleges, and significant resources are expended each year
to attract and engage alumni (Council for Aid to Education, 2011; Leslie & Ramey, 1988). An
institution’s opportunity to impact future alumni donations begins the first time a student steps
foot on campus (Oglesby, 1991; Shadoian, 1989), and scholars maintain that this impact can be
made through engagement (Pike & Kuh, 2005). Thus, student engagement can be more
specifically defined and informed by an alumnus’s undergraduate experience of student
engagement.
Understanding the impact of student engagement and student experiences during the
college years is important as institutions seek to remain competitive and current (Pike & Kuh,
2005). Leslie and Ramey (1988) stated that “voluntary [alumni] support is becoming the only
source of real discretionary money” (p. 115); this comes at a time when institutions are facing
reduced budgets and increased pressures to do more with less. The benefits of understanding the
possible relationship between student engagement and alumni donor participation are two-fold:
(a) institutional leaders can better forecast alumni donor participation rates by assessing
engagement, providing more interaction between student affairs and academic affairs; and (b)
institutions can employ data-driven decision-making in allocating resources to support activities

9
that engage students and enhance student experiences, to strengthen the students’ success and
increase alumni donor participation (Field, 2011).
Definition of Terms
The following terms are presented to define the terminology used in this dissertation:
Alma mater. The institution from which a person received her or his undergraduate
degree.
Alumni. Often, institutions define alumni as any persons who ever took a course at the
institution. For the purposes for this study, alumni are defined as individuals who met all the
requirements and obtained undergraduate degrees (Gaier, 2005). Note: While the construction
“alumnae or alumni” is technically correct and most inclusive, for reasons of space and ease of
reading, the masculine plural form ‘alumni’ will be used to refer to persons of both genders.
Alumni donor. An alumnus/a who made a financial contribution to the college during
the year(s) of interest.
Alumni donor participation rate. The number of alumni who made a financial
contribution to the college or university, during the year of interest, divided by the total number
of alumni for the year of interest (Turner, Meserve, & Bowen, 2001).
Carnegie Baccalaureate Colleges (CBCs). CBCs have two primary characteristics: (1)
bachelor’s degrees accounted for at least 10% of all undergraduate degrees awarded; and (2)
fewer than 50 fifty master’s-granting programs (Carnegie, 2009)
Development. The term development is often referred to as “educational fundraising,”
and the function of development is also to develop relationships. Development functions include
10
“all the programs and activities by which the college or university seeks gifts and grants from
private sources to support its programs and build long-term strength through improvements to
facilities and additions to its endowment” (Worth, 1993, p. 5).
Enrollment management. Strategies used by college administrators to meet specific
goals of enrollment, revenue, and costs (Garcia Montano, 2010). Emphasis is placed on student
tuition.
Liberal arts colleges. For over forty years, Carnegie Classification has been the leading
framework for describing and classifying colleges and universities across the U.S. (Pike & Kuh,
2005). For the purposes of this study, liberal arts colleges will be defined as institutions that have
high undergraduate enrollment, high or very high levels of students living on campus, and
classifications of Carnegie Baccalaureate College—Arts and Sciences and Diverse Fields.
Motivation to give. Emotional reasons influencing and motivating alumni to be donors.
Non-donors. Alumni who did not make a financial contribution to the college during the
year(s) of interest.
Recent alumni donors. Alumni who graduated five years or fewer after their
participation in NSSE and who financially support their alma mater.
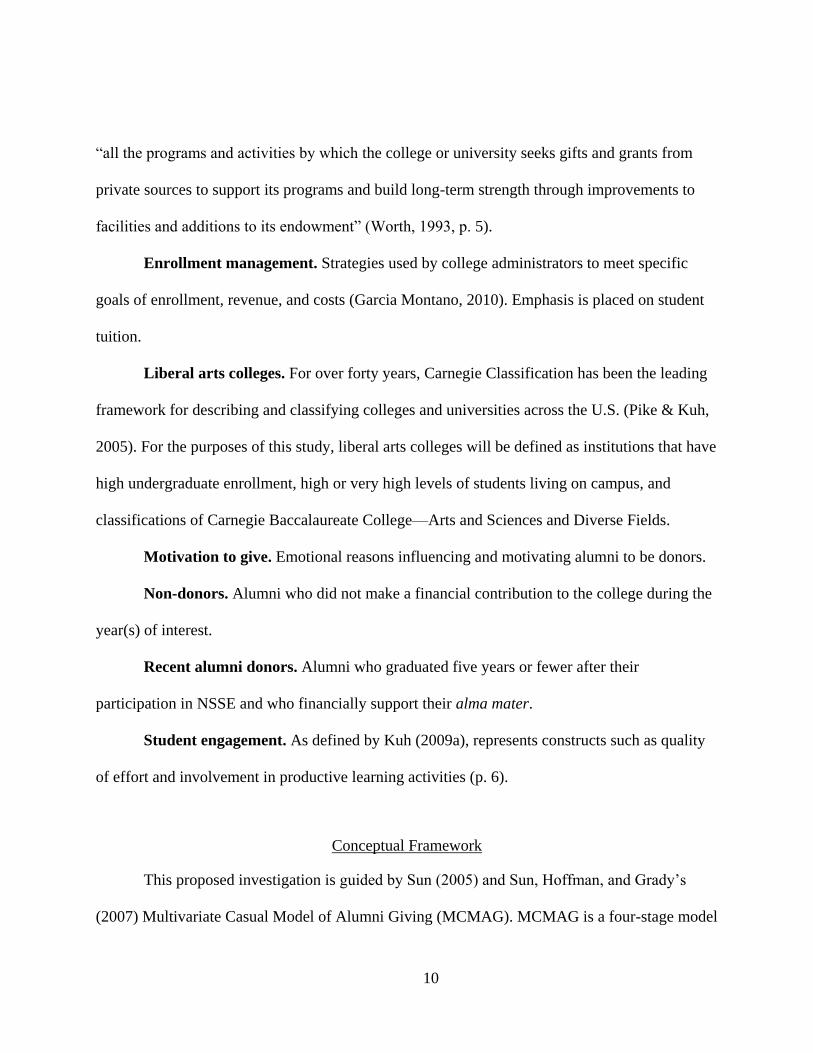
Student engagement. As defined by Kuh (2009a), represents constructs such as quality
of effort and involvement in productive learning activities (p. 6).
Conceptual Framework
This proposed investigation is guided by Sun (2005) and Sun, Hoffman, and Grady’s
(2007) Multivariate Casual Model of Alumni Giving (MCMAG). MCMAG is a four-stage model

11
for predicting alumni giving and provides a basis for understanding alumni and their donations
(Sun, 2005; Sun et al., 2007). Limited research has examined the broad context of alumni giving,
and the majority of research on alumni donor participation has focused on single-institution
studies and examined alumni donor participation factors that were specific to a single institution.
The four-stage model developed by Sun (2005) and Sun, Hoffman, and Grady (2007) includes
student experience, demographic variables, alumni experience, and alumni motivation as
distinguishing factors that separate donors from non-donors. In Sun et al.’s (2007) study, three of
the four stages were shown to be significant predictors of alumni donor participation, including
student experience, alumni experience, and alumni motivation. The factor of demographic
variables did not impact alumni donor participation. However, there is a profusion of research
identifying demographic variables that influence alumni donor participation (Ashcraft, 1995;
Diehl, 2007; Dugan, Mullin, & Siegfried, 2000; House, 1987; Hunter, 1997; Robinson, 1994).
The abundance of research to support the use of demographic variables will be further explored
in Chapter Two; thus, for this study, demographic factors were included.
In the present investigation, alumni motivation and alumni experience, two factors of the
MCMAG, were not considered; only student experience and demographic variables were
selected for inclusion. Sun (2005) used a post-graduation survey of alumni at one institution to
acquire alumni motivation and alumni experience data; however, this study included an
examination of student data at multiple institutions and extracted how demographics and specific
student engagement activities, as reported on the NSSE, impact alumni donor participation rates,
thus allowing for more generalizability and a broader conceptual framework. The exclusion of
alumni experience and alumni motivation was necessary for a broad study of how demographic

12
variables and student experience in college affect alumni donor participation. Furthermore, data
for both alumni experience and alumni motivation could not be obtained because of limitations
on data collection and access to information about specific alumni.
The two factors under examination, student experience and demographic variables,
provided lenses for this study and are theoretically grounded in several decades of scholarly
work. The variables of student experience and student demographics could also be termed
student participation activities, as these variables provided the ability to examine activities that
students participated in while enrolled, which affected their alumni donor participation, without
delving into post-graduation experiences or motivations. Figure 1 presents Sun et al.’s (2007)
MCMAG, and each box on the left of the figure represents a variable that, according to that
study, affects alumni giving.

13
Multivariate Causal Model of Alumni Giving
Figure 1. Multivariate Causal Model of Alumni Giving.
From “A Multivariate Causal Model of Alumni Giving: Implications for Alumni
Fundraisers,” by X. Sun, S.C. Hoffman, and M.L. Grady, 2007, Reprinted by permission
from Macmillan Publishers Ltd: International Journal of Education Advancement, 7(4), p.
308. Copyright (2007) published by Palgrave Macmillan.
Because the purpose of the research was to expound upon the relationships of alumni
giving and demographics as observed at several institutions (Diehl, 2007; Dugan, Mullin, &
Siegfried, 2000; Haddad, 1986; House, 1987; Hunter, 1997, Shadoian, 1989), this study utilized
only two factors of the MCMAG. By clarifying the trends using Sun’s (2005) framework, this
investigation expanded the work of Sun (2005) and Sun et al. (2007) in a new population and
provides relevant and tangible results that can be used by practitioners in both academic and

14
student affairs. The researcher narrowed MCMAG to focus only on student experiences and
demographics. These two factors were chosen because of the need to address specific variables
of each factor that the literature suggests impacts alumni donor participation.
For the student experience construct, five variables or aspects of student experience that
are based upon the work of Chickering and Gamson (1987, 1991) and Kuh (2001b, 2004) and
focus on student engagement were chosen; furthermore, these variables are positively correlated
with alumni donor participation (Field, 2011; Lofton, 2005; Ward, 2004). The student experience
variables that inform the proposed conceptual model for this study include participation in
Greek-life (fraternity/sorority), student athletics, study abroad, or student leadership roles, as
well as living on campus (Burt, 1989; Dugan, Mullin, & Siegfried, 2000; Hunter, 1997; Lofton,
2005; Martin, 1993; O’Neill, 2005; Robinson, 1994; Shim, 2001). Demographic variables
identified as characteristics that can impact alumni donor participation, and inform this
conceptual model, include education level of parents, recipient of scholarship, nationality,
gender, and major (Belfield & Beney, 2000; Diehl, 2007; Dugan, Mullin, & Siegfried, 2000;
Ficano, 2002; Grill, 1998; Haddad, 1986; Hoyt, 2004; Meer & Rosen, 2012; Robinson, 1994;
Schmidt, 2001; Shim, 2001). The model and specific aspects of student experience and
demographic variables that impact alumni donor participation are further explored in Chapter
Two. The relationships among the study variables are conceptualized using the National Survey
of Student Engagement, and presented in Figure 2 as the Student-Centered Model of Alumni
Donor Participation.

15
Student-Centered Model of Alumni Donor Participation
Figure 2. Student-Centered Model of Alumni Donor Participation.
Copyright 2012, Joshua H. Truitt.
The Student-Centered Model of Alumni Donor Participation builds upon the work of Sun
(2005) and Sun et al. (2007), and focuses on only two factors of the MCMAG. This model
illustrates the co-relationships between each construct. The lines between each construct allow
for the creation of a triangle to illustrate how each piece, while independent, can be joined with
other pieces to craft a prediction model of alumni donor participation. This conformation
illustrates that each construct plays an independent role as a circle, but collectively the

16
connections between each circle inform the larger picture, a triangle. The peak of the triangle
represents the student engagement benchmarks of the National Survey of Student Engagement
(NSSE). The NSSE benchmarks are informed through the student responses on specific items
contained within the NSSE instrument. The NSSE benchmarks include level of academic
challenge, active and collaborative learning, student-faculty interaction, supportive campus
environment, and enriching educational experience. Next, the student experiences variables that
are often suggested to impact alumni donor participation are represented in the bottom left of the
triangle. The student experiences and demographic variables, represented respectively at the
bottom left and right of the triangle, each comprise the five sub-variables drawn from the
research literature. The constructs and variables of the Student-Centered Model of Alumni Donor
Participation will be further explored in Chapter Two.
Limitations of the Study
Both alumni donor participation and institutional student data for this study were
collected through self-report instruments. Inherent validity threats of self-report instruments
existed, as participants might have exaggerated or minimized to portray themselves in a
favorable light. Furthermore, participants might have failed to recall specific instances when
recording their responses, and some might have perceived the questions to be leading. The NSSE
is self-reported by students, and thus accuracy cannot be ensured. Furthermore, the data that
were used for this study had an inherent lag time. The NSSE makes data available to researchers
“no sooner than three years after institutional reports are mailed to participating institutions”
(NSSE, 2006). Additionally, not all institutions participate in the NSSE, and those that do often

17
lack continuity of involvement. Threats to internal and external validity were also present.
Threats of internal validity included selection bias, inaccurate statistical reporting from
institutions, and limited sample size of NSSE participants at institutions. Threats of external
validity included small sample size of participating institutions. Furthermore, student
engagement, student experiences, and student demographics are only three components of
alumni donor participation, and extraneous variables may have influenced findings. Lastly, the
MCMAG was not used in its entirety, and modifications were adopted and accepted by the
researcher.
Delimitations of the Study
The two delimitations of this study included the use of archival contribution data and the
sampling techniques that were employed to acquire the data. Archival data were chosen for their
efficiency; however, the data were dependent upon consistent data entry by each institution. The
collection of data was not augmented by surveys, as a survey was beyond the scope of the
research questions and was considered too expensive. Additionally, this study was delimited by
the type of institution that was chosen for participation. This study only included an examination
of a select group of Carnegie Baccalaureate Colleges, according to The 2010 Carnegie
Classification of Institutions of Higher Education, located in the southeastern region of the
United States; therefore, national generalizability may be limited.
Organization of the Study
Chapter One provided an introduction to the background of higher education and its
increasing reliance on private funding. A brief overview of how alumni support has shaped

18
higher education in America and an introduction to student engagement were also included.
Information on the problem, purpose of the study, research questions, and conceptual framework
was provided as well. Chapter Two provides further discussion of the conceptual framework,
Kuh’s (2009a) theory of engagement, and the National Survey on Student Engagement (NSSE).
In addition, Chapter Two presents a review of relevant literature pertaining to student satisfaction
and alumni donor involvement. The research methodology, data collection, and data analysis are
contained in Chapter Three. The results of the research study are found in Chapter Four. Finally,
the conclusions from the data analyses, implications for research and practice, and
recommendations for future research are discussed in Chapter Five.

19
CHAPTER TWO: LITERATURE REVIEW
Introduction
The purpose of this quantitative study was to ascertain the relationship between level of
student engagement of senior class cohorts at Carnegie Baccalaureate Colleges and alumni donor
participation rates during a five-year post-graduation period. Colleges and universities in the
United States will continue to need funds to supplement the costs associated with educating the
next generation (Zusman, 1999). Over the last thirty years, state and national appropriations for
higher education have not maintained pace with the rising costs of higher education (Thelin,
2004), and alumni are more important than ever to the survival of institutions. Of all charitable
giving, higher education received the largest portion of support, and Giving USA (2011) reports
that individuals account for the majority of giving at colleges and universities. Figure 3 provides
a visual representation of each supporter of higher education for 2011.
Figure 3. Philanthropic Financial Support of Higher Education Totals $30.3 Billion.
Adapted from Giving USA (2011).
Individuals
$13.45 (44.3%)
Foundations
$8.68 (28.6%)
Religious
Organizations
$0.31 (1%)
Other
Organizations
$2.85 (9.4%)
Corporations
$5.02 (16.6%)
Figures in parrentheses are percentages of total, and do not add to 100 due to rounding.
Philanthropic Financial Support of Higher Education Totals $30.3 Billion

20
As individual giving has evolved to become a vital support base of higher education, the
study of how to solicit private funds for education has become a rapidly growing field.
Unfortunately, the implications and broad applicability of preliminary findings are limited
because of the absence of philanthropy research grounded in theoretical and conceptual
frameworks (Drezner, 2011; Hurvitz, 2010). Carbone (1986) and Kelly (1991) suggest that while
there is an overwhelming amount of instructive and experience-based fundraising advice to
share, there is a limited amount of research-based knowledge.
Furthermore, the research-based knowledge of alumni donor involvement and
philanthropic giving has traditionally focused on three major areas. These include: (1) the
activities of development offices; (2) economic and tax benefits (Holmes, 2009); and (3) social
psychology theories, including social learning theories and motivational theories of prosocial
behavior. Researchers considering activities within development offices have examined trends of
marketing materials, correlations between the number of staff members and giving, and
strategies for successful event management. In regard to economic impacts, researchers have
found that a positive relationship may exist between economic benefits, such as tax deductions,
and alumni donor involvement (Gruber, 2004; Harrison, 1995). Researchers of social psychology
theories have sought to understand the learned and prosocial behaviors of alumni as a means to
explain their motivations for philanthropic giving. Despite this work, little is known about the
years of an alumnus’s life that are often considered the most transformational—the college years.
In the present study, it is assumed that alumni donor participation is best understood by
focusing on student engagement, and specifically the aspects of student demographics and
student experience that inform a measurement of student engagement. This study goes beyond

21
the traditional factors of development office practices, social psychology theories, and
economic/tax benefits to provide cross-sectional information of student engagement and alumni
donor participation rates of an individual class year at select institutions.
To begin, this literature review provides information on student engagement and its
growth to include measureable variables. Careful consideration is given to the origins of student
engagement within Chickering and Gamson’s (1987, 1991) seven principles for good practice in
undergraduate education. Specific consideration is given to each principle and a discussion of
how the principles of student engagement shaped Kuh’s (2001a, 2004, 2009a) theory of student
engagement and the National Survey on Student Engagement (NSSE) is provided. The second
section of this literature review presents background information on liberal arts colleges,
including institutional characteristics, and the impact of these characteristics on students and
alumni. Finally, this literature review synthesizes the grounded research of student engagement
variable that affect the NSSE scores, institutional characteristics of liberal arts colleges, and
factors that impact alumni donor involvement.
Baccalaureate Colleges
The Carnegie Classification’s Definition of Liberal Arts Colleges
The Carnegie Classification is a taxonomy that has been used for over four decades. First
developed in the 1970s by the Carnegie Commission on Higher Education to serve its policy
needs, the Carnegie Classification was designed to provide information on colleges and
universities across the United States in one central location (Carnegie, 1987). Although the

22
criteria or each classification are widely debated and have changed over the last forty years, the
Carnegie Classification is still widely regarded as a resource for practitioners and researchers.
Liberal arts colleges were originally classified by the Carnegie Classification as
“Baccalaureate Colleges: Liberal Arts I and II.” The distinction between “I” and “II” was based
largely on selectivity of the college and the percentage of students pursuing degrees in a liberal
arts field (Carnegie, 2001). This archaic method has been replaced by a new method that
considers categories that better reflect campus environment, including percentage of students
living on campus, enrollment, study body diversity, campus focus, commitment to graduate
education, and fields of study for degrees awarded (Carnegie, 2009).
The most recent iteration of Carnegie Classification was released in 2010. Institutions
classified as Carnegie Baccalaureate Colleges (CBCs) have two primary characteristics: (1)
bachelor’s degrees accounted for at least 10% of all undergraduate degrees awarded; and (2)
fewer than 50 fifty master’s-granting programs (Carnegie, 2009). Furthermore, CBCs are divided
based upon the percentage of bachelor’s degrees awarded. CBCs that award over 50% of all
degrees as bachelor’s degrees are divided by areas of study. The areas of study are categorized as
“Arts & Sciences” and “Diverse Fields.” The Arts and Sciences classification represents the
institutions that award over half of all bachelor’s degrees in arts and sciences. Institutions with
less than 50% of all bachelor’s degrees in arts and sciences, or institutions that offer bachelor’s
degrees in other areas, are included in the Diverse Fields category.
23
What is a Liberal Arts College?
Francis Oakley is President Emeritus of Williams College and of the American Council
of Learned Societies in New York. Oakley (2005) proposed that liberal arts colleges be defined
as “small college universities devoted exclusively (or almost exclusively) to the teaching of
undergraduates” (2005, p. 3). Furthermore, because the literature has traditionally referred to
many baccalaureate institutions as liberal arts colleges, and these institutions have provided a
liberal arts education and awarded degrees in many fields of study including the arts and science
fields (Gilbert, 1995;Harward, 2007; Paulsen, 1990), the term “liberal arts colleges” will be used
in this literature review when referring to non-profit, private institutions, as described within The
2010 Carnegie Baccalaureate Colleges—Arts and Sciences and Diverse Fields Classifications.
The Carnegie Classification is often used for defining a group of colleges or universities,
such as liberal arts colleges, and its use is well supported in the literature. The 2010 Carnegie
Baccalaureate Colleges—Arts and Sciences and Diverse Fields Classification used in this study
has considered several of the characteristics found in liberal arts colleges, including size,
selectivity, location, percent of students living on campus, and degrees awarded. Historical
lenses are needed to fully illustrate the evolution of liberal arts colleges, and are further
considered in this literature review.
History of Liberal Arts Colleges
Liberal arts colleges are described as “one of American society’s great success stories”
(Breneman, 1994, p. 1). America’s early colonists understood that only by education could
individuals be equipped to secure governance and preserve religious freedoms (Brubacher &

24
Rudy, 1997). The first higher-education institutions in America were founded to disseminate
Christianity, prepare leaders, and train clergy (Brubacher & Rudy, 1997). Unlike present-day
liberal arts colleges, which receive most of their funding from tuition and philanthropic alumni
donor participation, financial support for the early liberal arts colleges came from their affiliation
with religious organizations. In fact, of the nine colleges established prior to the American
Revolutionary War, only the College of Philadelphia, later known as University of Pennsylvania,
had no religious affiliation (Brubacher & Rudy, 1997).
Regardless of religious affiliation, the liberal arts colleges in the United States sought to
prepare leaders for America, and believed that training in the arts, Classical Greek, and Latin
were necessary (Brubacher & Rudy, 1997) to “develop personal character and intellect” (Lang,
1999, p. 134) of the citizens. Additionally, early liberal arts colleges believed that the training
and installation of values would be most effective when the students lived in campus dormitories
and shared common living space with peers. Furthermore, the “unabashed orientation of these
institutions [liberal arts colleges] to student needs, to student satisfaction, and to educational
outcomes” (Oakley, 2005, p.6) contributed to a successful alumni population. The results of the
early liberal arts colleges are evident across the United States, and include many of the United
States’ founding fathers, decorated military leaders, and presidents.
The rich tradition of excellence set forth by the early liberal arts colleges and their desire
to impact the governance of society continues today, as many institutions seek to produce
citizens who will be productive and curious (Voelker & Campbell, 2003). Liberal arts colleges
attempt to provide a small, residential, and personal environment in which students can work

25
closely with dedicated and qualified faculty, an environment that “remains almost a unique
embodiment of a certain ideal of educational excellence” (McPherson & Schapiro, 2000, p. 73).
Present Day Liberal Arts Campuses and Students
Present-day liberal arts colleges seek to build personal character and intellect and to
“cultivate the ability for independent thought” (McPherson & Shapiro, 2000, p. 69), and have
often retained several institutional characteristics of their origins (Harward, 2007). These
institutional characteristics include small, independent, residential campuses that emphasize
teaching and place less emphasis on research (McPherson & Schapiro, 2000; Oakley, 2005), and
enroll mostly baccalaureate-seeking students who typically range in age between 17 and 21
(Astin, 1993). One area that has changed at liberal arts colleges over the last half-century is the
demographics represented on campus, including admissions of scholars from the African
Americans and Hispanic communities (Garcia Montano, 2010). Liberal arts colleges provide
environments for students to mature intellectually and socially, and live and study alongside
others of different races, gender associations, religious affiliations, and socio-economic
backgrounds.
Kuh (2003) and others reported that those who earn their undergraduate education at a
liberal arts college are best prepared for advanced graduate study and civic leadership. Durden
(2001) proposed that a liberal arts education is the foundation for success in an ever-changing
world, and that present-day students are best prepared to handle human and intellectual
disagreements by utilizing the skills provided uniquely at liberal arts colleges. Pascarella (2005)
and others found that this high frequency of post-graduation success was distinct to liberal arts

26
colleges and educational experiences. Furthermore, Hersh (1999) reinforced the impact of
modern-day liberal arts colleges, saying:
Residential liberal arts colleges—by virtue of their primary focus on teaching, their small
size, residential nature, quest for genuine community, engagement of students in active
learning, concern for a general and coherent education, and emphasis on the development
of the whole person—provide the most important kind of undergraduate education for the
21st century. (Hersh, 1999, p. 192)
Providing the best undergraduate education for the 21st century is not easy, and as
Pascarella and Terenzini noted (2005), college and its impact on the student is mostly determined
by the level of student involvement inside and outside of the classroom. True to their historical
roots, present-day liberal arts colleges provide an opportunity for students to be intimately
involved with faculty who are committed to engaging students (Kuh, Kinzie, Schuh, Whitt, &
Associates, 2010). However, not all traditional roots, including religious affiliations, have
survived, and the movement of liberal arts colleges away from religious affiliation has had a
profound impact on their sources of funding.
Present-Day Financial Challenges
Unlike the early liberal arts colleges, which had strong financial support from their
religious affiliations, the majority of liberal arts colleges of the present day are dependent on
three primary modes of funding: student tuition dollars; alumni donor participation; and
investment returns from institutional endowment, long-term investments funded by contributions
from donors.

27
As administrators at liberal arts colleges work to increase revenue, reduce expenses,
increase the public’s perception of institutional quality, and enroll the most academically
prepared students, several enrollment and financial aid mechanisms have taken form (Buss,
Parker, Rivenburg, 2004; Ehrenberg & Smith, 2003; Parker & Summers, 1993), particularly in
regard to enrollment management (Hearn, 1988, 1991). Enrollment management refers to the
roadmaps and strategies used to produce targeted outcomes, such as to increase public
perception, increase enrollment, meet revenue goals, and increase student satisfaction with
college experience (Hearn, 1988; Russo, 1999; Wilkinson, Taylor, Peterson, & Machado-Taylor,
2007). Furthermore, enrollment management describes the strategies to increase financial aid
awards and matriculation by focusing centrally on student tuition (Hearn, 1988; Russo &
Coomes, 2000).
Student tuition. It is commonly believed that liberal arts colleges primarily survive on
student tuition dollars (Fong, 2005), but Lapovsky (2005) reported that this is not entirely true;
list price does not equal cost. Thus, student tuition revenue is not simply the product of the
number of students multiplied by the listed cost of tuition (Hearn, 1988). Substantial tuition
discounts are offered to competitive students, and institutions know that these discounts appeal to
both parents and students (Fong, 2005; Lapovsky, 2005; Winston, 1999). The National
Association of Independent Colleges and Universities (NAICU) reported that tuition and fees at
liberal arts colleges increased by 3.9% for the 2012-2013 academic year. This marginal increase
represents the smallest percentage increase of tuition at liberal arts colleges in over forty years
(NAICU, 2012); the average increase between 1999 and 2009 was 5.7% per academic year.
Meanwhile, the institutional financial aid provided to students at the liberal arts colleges

28
increased by 6.2% (NAICU, 2012). The president of NAICU, David L. Warren, reported,
“Students and families are increasingly price- and value-conscious” (NAICU, 2012. para. 6). The
attention that students and families are placing on tuition creates an environment for competition
between institutions in areas such as offering attractive tuition discounting and financial aid
packages (Hearn, 1988).
At liberal arts colleges, aid is offered to entice students to attend the institution, as
competitive enrollment numbers are needed to compete with other institutions (Hearn, 1988;
Hossler, 2004; Lapovsky, 2005). Despite the rising costs of student tuition and increases in
student enrollment (see Figures 4 and 5) at liberal arts colleges, Fong (2005) and Lapovsky
(2005) reported that many liberal arts colleges in America are marginally operating, and are
unlikely to survive this century.
While an increase in student enrollment does provide some additional tuition funding, if
liberal arts colleges are to remain true to their historical foundation of small classes that
transform young minds, the number of qualified faculty must also increase—adding additional
costs to an already strained budget. Therefore, an increase of student enrollment alone will not
solve the struggles to maintain institutional quality. Figure 4 illustrates the steady increase of
student enrollment at Baccalaureate Colleges over the last ten years.

29
Figure 4. Enrollment at Baccalaureate Colleges.
Adapted from Voluntary Support of Education, FY 2001-2011.
Figure 5. Undergraduate Tuition and Fees at Baccalaureate Colleges.
Twenty year snapshot of tuition, fees, and room and board at Baccalaureate Colleges
located in the southeastern region of the United States. Adapted from The College Board,
Annual Survey of Colleges, 2011.
1,550
1,600
1,650
1,700
1,750
1,800
1,850
1,900
2001 2002 2003 2004 2005 2006 2007 2008 2009 2010 2011
Enrollment at Baccalaureate Colleges
$5,000
$10,000
$15,000
$20,000
$25,000
$30,000
19
91
19
92
19
93
19
94
19
95
19
96
19
97
19
98
19
99
20
00
20
01
20
02
20
03
20
04
20
05
20
06
20
07
20
08
20
09
20
10
20
11
20
12
Undergraduate Tuition and Fees at Baccalaureate Colleges
Enro
llm
ent
(stu
den
ts)
Fiscal Year
Annual
ized
Cost
Fiscal Year
30
Therefore, many liberal arts colleges may subscribe—if not literally, then at least
parenthetically—to the fear that students equate price to quality, and thus that an institution with
lower tuition will be perceived by prospective students as lower quality. This relationship is
known as the Chivas Regal Effect. Therefore, liberal arts colleges can offer selective discounting
(Lapovsky, 2005, p. 60) and increase the perceived quality as “a necessary strategy to fill up all
of the seats in the class” (p.58), and receive a two-fold benefit.
Liberal arts colleges use the strategic options provided through the financial aid office to
attract highly academically qualified students, and improve public perceptions of the institution
(Hossler, 2004). The majority of internal financial aid is not provided by a large endowment, but
covered by those students who pay the full cost of tuition—but a rise in tuition creates a rise in
student need (Astin & Oseguera, 2004). The use of financial aid as a road map to determining the
amount of aid that will induce a prospective student to enroll, instead of as a way to ensure
affordability, is at the forefront of debate in higher education.
NAICU reported that liberal arts colleges across the United States are employing
strategies to increase their attractiveness to prospective students and alleviate the likelihood of
students graduating with high debt loads. The strategies discussed by NAICU include tuition
cuts, tuition freezes, student loan caps, and four-year graduation guarantees. Tuition cuts,
including those offered by Concordia University, allow for a reduction of up to 33% for new and
transfer students. Tuition freezes are being employed at liberal arts colleges through the United
States, and offer students a set price for all four years of their undergraduate careers. The student
loan capping program is being rolled out by Franklin and Marshall College for a two-year study,
and will provide student aid packages to cover tuition costs of students from low and middle

31
income families, so that a graduating student does not have loans that exceed $10,000. Similar
programs have been used at Davidson College, a liberal arts college in North Carolina. These
strategies allow for students to complete their undergraduate studies at liberal arts colleges and
graduate without overwhelming student loans, a practice that Allan (1999) found directly
impacted alumni donor participation.
In consideration of tuition costs at liberal arts colleges, as well as the financial aid
packages that institutions offer, a concern that is often at the forefront of discussions is diversity
and access. One aspect of the debate is the suggestion that financial aid and tuition discounting
are used as a means of increasing enrollment of students who are able to afford the cost of
attendance, and decreasing the population of lower-income students (Dowd, Cheslock, &
Melguizo, 2008). However, this may not be cause and effect. Instead, it may be an effort by
liberal arts colleges to accept the most academically qualified students and thereby increase the
colleges’ rankings, which continue to influence perception of collegiate quality, while obtaining
the maximum amount of tuition revenue from the students (Buss et al., 2004; Fong, 2005).
In instances of accepting highly academically qualified students, Hu and St. John (2001)
found that financial aid and tuition discounting directly affected persistence among African
American and Hispanic students (McGhee, 2011). Furthermore, St. John, Paulsen, and Carter
(2005) found that for African American families, the student aid package played a significant
role in a student’s decision to enroll and positively impacted persistence (McGhee, 2011). This
heightened enrollment and persistence among African Americans and Hispanics could point
toward opportunities for liberal arts colleges to further distinguish their campuses (Garcia
Montano, 2010).

32
However, those who are unable to pay the listed cost of attendance or obtain generous
tuition discounts, and yet enroll in liberal arts colleges, are obtaining student loans to finance
their education. Many government programs have been developed to help recent alumni handle
their debt loads, but the reality is that students who are laden with six-figure student loan debts
have a reduced capacity to give, and are unlikely to become alumni donors in the foreseeable
future (Meer & Rosen, 2012).
Allan (1999) observed that liberal arts colleges that seek to manage competing goals of
enrolling academically competitive students by offering tuition discounting find themselves in a
perpetual cycle of increasing the list price of tuition and offering additional tuition discounts to
attract students. If Allan’s (1999) observation is true and students graduate with heavy debt
loads, a dual detriment exists. First, this cycle could result in an erosion of quality and prestige
and instead produce alumni who graduate feeling that they have overpaid for their education.
Leaving indelible scars on a potential alumni donor’s experience, and hence, be eternally
damaging to the long-term alumni donor support opportunities that liberal arts colleges need to
survive. Secondly, the burdens of student loan debt on recent college graduates will reduce their
disposable incomes, thus making it difficult for even alumni with positive collegiate experiences
and high perceptions of collegiate quality and prestige to become donors (Meer, 2011).
Hansen (1998) suggested that perceptions of quality and prestige begin to form with the
receipt of an admissions letter, and Mael and Ashforth (1992) surveyed 297 alumni at an all-male
religious college and found that that alumni who, as students, perceived that their institution was
high-quality and prestigious, showed higher alumni donor participation rates.

33
Thus, although enrollments continue to increase, and liberal arts colleges are often
required to discount the published tuition rates to attract competitive students (Lapovsky, 2005),
the higher price could impact how students perceive their education, and directly influence
alumni donor participation (Hoyt, 2004).
Philanthropic Alumni Donor Participation
History
Philanthropic alumni donor participation is a practice that is over 500 years old, with
origins tracing back to Oxford University (Markoff, 1978). Harvard College was established in
1636, and modeled after Oxford. Of the many practices that were adopted for higher education in
early America, one that has been critical to the survival of education is philanthropic support
from alumni. Alumni giving in America began at Harvard College with a donation of land in
1648 by four Harvard alumni (Markoff, 1978). The gift was followed by gifts from other alumni
for the remainder of the seventeenth century, and contributed to the establishment and
steadfastness of Harvard and other higher education institutions in America.
Curti and Nash (1965) found that America’s earliest institutions understood the
importance of alumni donor participation to establishing and advancing higher education in
America. However, institutions relied mostly on garnering limited numbers of substantial
donations, and it took almost two centuries for institutions to develop strategic initiatives to
increase alumni donor involvement (Curti & Nash, 1965; Stewart, 1955).

34
Organized Alumni Donor Participation
In 1890, the first alumni donor participation program in the United States was instituted
by Yale University. The Yale System, an organized alumni giving initiative for all alumni of
Yale University, sought to increase smaller donations from many instead of relying on only large
donations from the few. Within two decades, The Yale System forever changed the trajectory of
Yale University by balancing years of fiscal struggles (Geiger, 1985). The success of Yale set the
framework for alumni donor participation, and successes such as Yale’s have occurred in many
institutions since the late 19th century.
The benefits of alumni donor participation are numerous. Charles Eliot, president of
Harvard from 1869-1909, is regarded as the sole force that transformed Harvard from a
provincial college into a preeminent research university. During his forty-year tenure as
president, Elliot also set the foundation for organized alumni support at Harvard. Elliot was a
fierce advocate for alumni participation, and recognized that alumni support as critical leverage
when seeking funds from other sources. During Eliot’s tenure at Harvard, he proclaimed, “An
institution that cannot rally to its financial assistance the men who have taken its degrees and
whose diploma is their passport into the world is in poor position to ask for support from others”
(n.d.). Eliot’s statement caused a surge of giving among the Harvard alumni and significantly
increased alumni donor participation, resulting in ripple effects that increased corporate
contributions and institutional prominence (Stewart, 1957).

35
National Rankings
Institutional rankings are very influential in higher education (Moore, 2008). Ranking
reports such as US News and World Reports (2012) have contended that alumni donor
participation rates are a reflection of student satisfaction. James Madison University (2012)
spelled out the cause and effect connection to the students: “the number of alumni who make a
gift every year is a key factor in determining national rankings of colleges and universities, such
as U.S. News & World Report's annual top-20 list. Having a nationally ranked university, in turn,
makes our graduates more competitive in the job market” (para. 5). Interestingly, the amount
given by alumni does not matter; participation counts most in the U.S. News & World Report
rankings.
Size Does Not Matter
The Yale System and Elliot’s battle cry forever changed the landscape of alumni donor
participation, emphasizing the act of participation and not solely the size of the gift. This change
encouraged philanthropic alumni donor participation, regardless of the size of each gift. Not only
did this allow alumni who were only able to make small gifts to their alma mater to become
stakeholders, but often these smaller gifts were not designated towards a specific project such as
a building or capital campaign, and could be used to enhance the daily operations of the
institution. Non-designated, discretionary funds are vital to the operation of an institution; Leslie
and Ramey (1988) stated, “voluntary support is becoming the only source of real discretionary
money [that an institution has]” (p. 115). There are numerous institutions that have benefitted
from the support of alumni, and as Stewart (1957) pointed out, “all universities and colleges—

36
and the private institutions in particular—must look to philanthropy as a primary source for that
additional support” (p. 191).
Present Day
The importance of alumni donor participation continues today, and liberal arts colleges
rely heavily on their alumni for support. Alumni donor participation accounts for approximately
25% of the budget at liberal arts colleges in America (Grandgenett, 2007). To support the next
generation of institutions, researchers from a multitude of disciplines have sought to better
understand alumni giving (e.g., Field, 2011; Grandgenett, 2007).
Voluntary Support of Education, a national database of alumni donor and institutional
data, reported that liberal arts colleges are experiencing a steady decline in alumni donor
participation (see Figure 5); this affects individual institutions. Ultimately, if the current trend is
not remedied, then the rich history of a liberal arts education and the role that liberal arts colleges
have played in the fabric of American higher education will become a relic (Curti & Nash, 1965;
McPherson & Schapiro, 2000).

37
Figure 6. Alumni Donor Participation at Baccalaureate Colleges.
Adapted from Voluntary Support of Education, FY 2001-2011.
However, liberal arts colleges vary widely in their institutional wealth, diversity,
selectivity, religious affiliation, educational offerings (Astin, 1993; Oakley, 2005), geographical
location (IPEDS, 2012), and alumni donor participation (Harrison, Mitchell, & Peterson, 1995).
Because liberal arts education began in the Northeast, studies that examine alumni donor
participation at liberal arts colleges have tended only to focus on the elite Ivy League institutions
that have strong financial resources and abundance of alumni donor participation (Hurvitz, 2010;
Tsao & Coll, 2005). Unfortunately, colleges outside of the Northeast often have the greatest
financial need and are susceptible to irreparable damage from low alumni donor participation
(McPherson & Shapiro, 2000; Oakley, 2005). Furthermore, studies have provided a wealth of
information to both researchers and practitioners at elite institutions; however, strategies that are
successful at elite liberal arts colleges may not be efficacious at colleges in the other parts of the
20.0%
21.0%
22.0%
23.0%
24.0%
25.0%
26.0%
27.0%
28.0%
Alumni Donor Participation Baccalaureate Colleges
Fiscal Year
Par
tici
pat
ion

38
United States (Hunter, 2012). Grandgenett (2007) examined alumni giving rates and fundraising
strategies that liberal arts colleges located throughout the Midwest, and found that of the 161
participating institutions, two-thirds had experienced steady deterioration of alumni donor
participation, and the remaining one-third operated at or below a financially viable level. In
2012, the Integrated Postsecondary Reporting System (IPEDS) reported that the greatest
percentages of liberal arts colleges are located in the southeastern region of the United States.
Yet there are very few studies that have examined alumni donor participation in the southeastern
region. Therefore, this study focused on schools located in the southeastern region of the United
States.
Research on Alumni Participation at Baccalaureate Colleges
Liberal arts colleges are more dependent than ever on support for the alumni base to
maintain high levels of performance (Clotfelter, 2003; Drezner, 2009; Gunsalus, 2004). A
foundational piece of research for informing academicians and practitioners on development was
the result of a cooperative study between the Council for the Advancement and Support of
Education (CASE) and ERIC Clearinghouse on Higher Education (Brittingham & Pezzullo,
1990; Weerts & Ronca, 2008). This report is widely cited, and draws from many areas across
campus to examine the development process. Much of the research surrounding alumni donor
participation is based upon survey and interviews with alumni. Often, this research is dissertation
research and has focused on only single institutions (Brittingham & Pezzullo, 1990).
Furthermore, the results of these studies indicate that an alumnus’s decision to give is not a result
of post-college connection with the college, but instead is based largely on demographics and

39
student experiences, engagement, and overall college satisfaction of the alumnus. This sets the
framework for further using a nationally recognized instrument of student engagement and
student experience, the NSSE, to correlate these variables with alumni donor participation rates.
In the long term, this method could be used to predict an alumnus’s response to a future request.
Therefore, this review of the literature presents information on the elements that are relevant to
alumni giving, to contribute to a better understanding of the factors of student experience and
demographic variables.
Clotfelter (2001) extensively studied two distinct generations of alumni from 14 liberal
arts colleges and found that participation in extracurricular activities (especially holding
leadership roles), faculty/student contact and mentorship, and satisfaction with college
experience were significant variables that affected alumni donor participation.
Gunsalus (2004) examined several factors that influence alumni donor participation at
liberal arts colleges, and much of his work focused on institutional characteristics of the liberal
arts college that support a cohesive student experience. Gunsalus examined 195 private colleges
and universities with “master’s” designations by US News and World Report. The results of his
study showed that at a 0.05 significance level, first-year retention rate, graduation rate, percent of
students living on campus, tuition price, and student-to-faculty ratio were significant predictors
of high alumni donor participation rates. While each variable that Gunsalus identified to be a
predictor of alumni giving is an institutional characteristic, it is well supported in the literature
that these characteristics are central to the liberal arts college environment and contribute to a
cohesive student experience. Therefore, extracting from these findings allows for a better
discussion of the intersection between academic and student affairs and a better understanding of

40
their influence on alumni donor participation (Van Horn, 2002). Furthermore, Gunsalus (2004)
reasoned that these characteristics should be considered in developing a study to examine alumni
donor participation, and when it is necessary to benchmark against peer institutions. Therefore,
as the selection of institutions is considered in Chapter Three, a more in-depth discussion will
follow.
In a study at Wellesley College, one of the most prestigious women’s colleges in the
United States, Grant and Lindauer (1986) found that age was a significant factor of alumni donor
participation. Their study focused on examining the participation rates of class year cohorts and
demonstrated that, as the age of the graduated class increased, the alumni donor participation rate
also increased. Additionally, Okunade, Wunnava, and Walsh (1994) found that age and alumni
donor participation was positively correlated. This is good news for liberal arts colleges, and as
early giving by recent college graduates remains a primary predictor of future giving (Wunnava
& Lauze, 2001), this information reinforces the need to better understand the student experiences
and demographics that most closely correlate with future giving.
Belfield and Beney (2000) examined two British universities and also found that there
was a positive relationship between alumni age and donor participation. Furthermore, their study
suggested there was a significant impact of gender on alumni donor participation. Belfield and
Beney suggested that women are more likely to become alumni donors than their male
counterparts; however, when comparing the size of the gift, men contribute substantially more
than women. This finding directly contradicted a finding by Okunade et al. (1994), who reported
that gender does not impact alumni donor participation rates.

41
Broadening the scope of institutions, Harrison, Mitchell, and Peterson (1995) studied 18
universities and colleges over a three-year period, and found that colleges with Greek
organizations experience increased giving from members of fraternity or sorority organizations.
Furthermore, the researchers found that colleges with a high population of part-time students had
lower alumni donor participation rates. In this study, findings were consistent regardless of
whether the college was private or public, or a small institution or a research institution.
Okunade et al. (1994) found similar results and suggested that professionals in alumni
development offices should reach out to alumni who participated in Greek Life while enrolled.
Bruggnik and Siddiqui (1995) modeled alumni donor participation rates at liberal arts
colleges and found positive correlations with key student experiences and demographic
variables. Building upon the work of Bruggnik and Siddiqui, others have also found factors of
the college student experience to be significant predictors of giving. Significant experience
variables included living on campus, studying abroad, being affiliated with Greek Life, and
holding leadership roles while enrolled in college. Demographic variables that were found to
contribute to future alumni donor participation included undergraduate major, gender, recipient
of institutional scholarship or student debt at graduation, and nationality (Conner, 2005).
Variables Related to Alumni Donor Participation
Student Experience
For this study, the five variables (factors) that inform the concept of student experience
are participating in Greek Life, holding student leadership roles in college, studying abroad,
being a student athlete, and living on campus.

42
Greek Life. Colleges and universities with sororities and fraternities are defined as
having a Greek Life presence. In fact, there are more than 100 social Greek-letter establishments
at over 900 institutions within the United States (O’Neill, 2005). Greek Life involvement has a
rich tradition at many colleges and universities across the United States, and many institutions
credit the Greek traditions with shaping the lives of students on campus. Research on the impact
of Greek Life on the undergraduate experience is controversial (Steeper, 2009; Tripp, 1997), but
the impact that fraternities and sororities have on university life cannot be ignored (Kuh,
Pascarella, & Weschsler, 1996). Additionally, researchers have found that Greek Life
involvement has a direct link to alumni donor participation (Belfield & Beney, 2000; Dugan,
Mullin & Siegfried, 2000; Haddad, 1986; Harrison, Mitchell & Peterson, 1995; Hunter, 1997;
O’Neill, 2005; Martin, 1993).
Belfield and Beney (2000), who examined alumni giving in the United Kingdom, found
similar results, including the significance of Greek organization affiliations and demographic
characteristics such as gender and nationality to alumni donor participation. Haddad (1986) used
a survey questionnaire to investigate the differences between alumni donors and non-donors at
Butler University. Data were collected from alumni and included 400 donors and 400 non-
donors. Haddad found that students who were involved with fraternities and sororities were more
likely to give than alumni who did not have a Greek Life affiliation. Additionally, Haddad
(1986) found that a significant predictor of alumni donor participation was undergraduate major.
Robinson (1994) surveyed alumni donor participation at three public institutions,
including a Historically Black College and University (HBCU). Of the five categories
(demographic data, student experiences, academic experiences, alumni support, and alumni
43
attitude), the demographic variables of undergraduate major and gender and the student
experience variables of participating in student athletics, living on campus, and holding
leadership roles were each associated with increased alumni donor participation. Therefore,
Robinson’s study confirmed that undergraduate major and gender were significant demographic
characteristics; both are further explored in the alumni donor participation section of this study.
Furthermore, student experiences such as participating in intercollegiate college athletics, living
on campus, and holding leadership roles within the college were all found to be predictors of
alumni donor participation (Burt, 1989).
Shim (2001), in a study of 500 alumni from an all-female college, found that living on
campus was significantly related to alumni donor participation. However, unlike other
investigations, Shim’s found that extracurricular activities, student experiences, and receiving
financial aid were not significantly related to alumni donor participation. O’Neill (2005)
examined the personal giving history of all 36,340 undergraduate alumni at the College of
William and Mary who were affiliated with a graduating class between 1964 and 1994.
Examining a span of thirty years allowed the researcher to observe significant trends among
alumni donors. O’Neill found that alumni who were affiliated with a Greek organization while
enrolled were more frequent and more generous in their support of the College of William and
Mary than their non-Greek peers. Furthermore, Dugan, Mullin, and Siegfried (2000), in a multi-
year study of Vanderbilt University class cohorts, found that membership in a fraternity or
sorority while in college increased alumni donor participation. Other findings of Dugan et al.
(2000) demonstrated that being a student athlete also increased post-graduation alumni donor
participation.

44
In a study of Livingstone College, a HBCU located in North Carolina, Hunter (1997)
found that alumni who were involved in Greek Life while enrolled as students showed
significantly higher alumni donor participation rates than alumni without Greek Life affiliation.
Lofton (2005) found that for members of the University of Southern Mississippi Alumni
Association, leadership positions held while students were enrolled and associations in campus
life were significant determinants of future alumni donor participation. However, Young and
Fischer (1996) looked at the alumni donor participation rates of Pepperdine University, and
found that undergraduate experiences were not predictors of future alumni giving. The results of
Young and Fischer (1996) indicated that alumni donor status was better predicted by examining
only the involvement of alumni post-graduation than the impressions that an institution left on
graduates—their experiences. Turner, Meserve, and Bowen (2001) examined the relationship
between winning football teams and alumni donor involvement at Division IA, II, and III liberal
arts colleges. Although few conclusive determinations could be made for the impact of winning
and alumni donor involvement, the study did reveal that former student athletes gave at a higher
percentage than non-athletes. Furthermore, their study showed that gender did not play a
significant role in alumni donor participation rates among former student athletes.
Demographic Variables
The five demographic variables (factors) that are examined in this study and that others
have found to impact alumni donor involvement include gender, recipient of institutional
scholarship, undergraduate major, nationality, and educational level attained by the students’

45
parents. These five factors will inform and compose the demographic variables presented in the
conceptual model.
Gender and recipient of an institutional scholarship. Belfield and Beney (2000) found
that by percentage, women were more generous than male alumni, but that gifts from males
tended to be larger; and Schmidt (2001) who examined alumni donor records at Winona State
University found that gender was a significant predictor of alumni donor participation. Dugan,
Mullin, and Siegfried (2000), in their study of Vanderbilt University alumni class cohorts, also
found that gender was a significant factor in alumni donor participation.
Diehl (2007) who studied constructs associated with alumni donor participation at
Pennsylvania State University found that gender and receipt of a scholarship or school supported
financial aid played a significant role in alumni donor participation. Cunningham and Cochi-
Ficano (2002) also found that students who received need-based scholarships were more apt to
give generously as alumni. Hoyt (2004), who worked to develop a model for predicting alumni
donor participation, found that receiving institutional financial aid was a significant factor in
future alumni donor participation. Hurst (2008) alluded to the possibility of a relationship
between receiving institutional financial aid and alumni donor participation; however, he was
unable to conclusively establish this relationship empirically and recommended further study of
the phenomenon. Hunter (1997) also found that gender was a significant predictor of alumni
donor participation, but did not find relationships between receiving institutional scholarships or
financial aid and alumni donor participation rates. Additionally, Baade and Sundberg (1993,
1996) found that receiving an institutional scholarship did not impact alumni donor involvement.
However, Marr, Mullin, and Siegfried (2005), who provided an arguably stronger methodology

46
(Meer & Rosen, 2012) by looking at the amounts given to individuals and corresponding alumni
donor participation for eight years after graduation, found that need-based and meritocratically-
based scholarships were positively correlated with increased alumni donor participation, while
student loans negatively affected alumni giving.
Furthermore, some have found that gender does not play a significant role in alumni
donor participation. Lawley (2008), who examined alumni donor rates and the factors that affect
alumni loyalty at a public university, and Baker (1998), who examined alumni donors at four
post-baccalaureate programs, both found that gender was not a significant factor in alumni donor
participation. The present research study included gender as a factor because many studies that
have sought to refute the impact of gender on alumni donor participation have focused on
specific instances and only considered small populations in each study. To this end, Grill (1988),
who studied attitudinal variables of alumni giving at Pennsylvania State University’s College of
Education, found that gender was a distinguishing characteristic between large and small donors;
however, gender was found to not be a factor in participation rates between donor and non-
donors. Hall (2004) provided a possible explanation for Grill’s finding: “Men tend to give to
enhance their own standing or maintain the status quo, it is believed, while women give to
promote social change or help others less fortunate” (Hall, 2004, p. 71) .Therefore, Grill showed
that while gender is significant to the amount given, it is not significant when examining alumni
donor participation.
Undergraduate major. Haddad’s (1998) work at Butler University to investigate the
differences between alumni donor and non-donors also demonstrated that undergraduate major is
a significant predictor of alumni donor participation. Haddad found that the highest percentage of

47
donors came from alumni with majors in business administration and education. Furthermore,
Grill’s (1998) study of alumni donor participation at Pennsylvania State University revealed that
undergraduate major was a significant factor in alumni donor participation, but he did not
explore the discriminate analysis of individual majors. Diehl (2007), who also examined alumni
giving at Pennsylvania State University, found undergraduate major to be a significant predictor
of alumni donor participation. Diehl found that alumni with majors in natural sciences and
business were more likely to give than their counterparts. Other findings by Robinson (1994)
included the significance of undergraduate major for alumni donor participation. Dugan et al
(2000) and others, including Shadoian (1989), who conducted a survey of over 1,000 alumni
who graduated over a 10-year period, examined the demographic and attitudinal variables
associated with alumni donor participation at a college and found that undergraduate major was a
significant factor in alumni donor participation.
Nationality and education level of parents. In regard to nationality and education level
of parents or guardians, there is a scant amount of literature. Alumni giving research on the
impact of nationality places the emphasis on race and ethnicity, and does not emphasize country
of origin (Diehl, 2007). While some researchers reported significant differences between the
giving rates of different races and ethnicities (Drezner, 2011; Gonzalez, 2003; Smith, 2008),
there is still much debate on the relationship between race, ethnicity, and alumni donor
participation (Lackie, 2010). Furthermore, the impact of education level of parents has not been
explored, but rather only the effect of a family member also being an alumnus/a of the institution
(Oglesby, 1991; Mosser, 1993). Therefore, the present study was opportunely positioned to

48
explore two demographic variables that could impact alumni donor participation, and
significantly contribute to the literature of alumni giving.
Student Engagement
Student engagement, and its impact on student learning, success, and experience (Astin,
1993; Boyer, 1987; Feldman & Newcomb, 1969; Pascarella & Terenzini, 1991), has been an
evolving and ever-changing construct and research area for nearly fifty years (Astin, 1993; Kuh,
2009a; Pace, 1980; Pascarella & Terenzini, 2005). The study of student engagement began with
Ralph Tyler’s time on task theory, which showed a positive correlation between time on task and
learning gains (Merwin, 1969). This gave momentum to Astin’s theory of involvement (1984),
which demonstrated that student involvement and student engagement are impacted by the effort
and energy the student expends in meaningful educational experiences. Astin’s work was
complimented by the concept of “quality of effort,” proposed by Pace (1980) and Pascarella
(1985), the concept of “student outcomes” (Pascarella, 1985), and Vincent Tinto’s
conceptualization that social and academic integration affect retention (Tinto, 1987). The work
of Pace (1979, 1980), Pascarella (1985), and Tinto (1987) gave theoretical and empirical footings
to the study of student engagement by clearly indicating “that what matters most in student
learning and personal development is what the students do in college” (Hu & Wolniak, 2013, p.
212). Furthermore, these foundational pieces of student engagement theory laid stepping stones
for the next phase of student engagement theory, Arthur Chickering and Zelda Gamson’s Seven
Principles of Good Practice in Higher Education.

49
Following the challenges faced in the 1960s and 70s to increase access and participation
of under-represented populations, the leaders of higher education were vilified in the 1980s for
neglecting a uniform standard of educational quality (Jacoby, 1994). In 1986, the Johnson
Foundation and the Lilly Endowment sponsored Chickering and Gamson to compose principles
for educating undergraduates that would “be accessible, understandable, practical, and widely
applicable” (Chickering & Gamson, 1999, p. 76). Chickering and Gamson recruited a task force
of higher education scholars who intimately grasped student development theory and understood
the organizational, political, and economic pressures of undergraduate higher education. The
efforts of this task force gave birth to the Seven Principles of Good Practice in Higher Education.
By involving a broad range of higher education scholars to address specific facets of the college
campus and their impact on undergraduate student experiences, Chickering and Gamson broke
through the individual silos approach to the study of student engagement, and developed seven
principles that have remained preeminent among theories of student engagement. Chickering and
Gamson (1987) united college campuses under seven principles of widely applicable best
practices for undergraduate education, condensing decades of research on undergraduate student
engagement into one easy-to-read pamphlet (Fruzzetti, 2011).
Chickering and Gamson (1987) built their seven principles on “six powerful” (p. 3)
educational forces: “activity, cooperation, diversity, expectations, interaction, and responsibility”
(p. 3). The seven principles were (a) student-faculty contact, (b) cooperation among students, (c)
active learning, (d) prompt feedback, (e) time on task, (f) high expectations, and (g) respect for
diverse talents and ways of learning.

50
These seven principles provide faculty and academic leaders seeking to increase student
engagement with the tools to enhance the undergraduate experience and create “gains in critical
thinking, problem solving and effective communication, and responsible citizenship” (Kuh,
2004), and are being widely adapted across college campuses.
Student-Faculty Contact
The first principle, student-faculty contact, is “the most important factor in student
motivation and involvement” (Chickering & Gamson, 1987, 1991), and is critically important to
success, persistence, and belonging (Tinto, 1987). Interactions between students and faculty also
enhance the students’ intellectual seriousness by helping them think about their future plans and
values. The first principle is often accomplished though opportunities such as undergraduate
research experiences, which can promote interest in research and provide opportunities for
publication (Pacifici & Thomson, 2011), mentorship between the student and faculty, and
involvement in community outreach. Jacob (1957) found that this is often only accomplished by
normal, frequent, and uninhibited interactions outside of class. Thistlewaite (1960) suggested
that students’ contact with faculty members are primarily responsible for the impact college has
on students, and that student-faculty contact is regulated by the faculty. Furthermore, Pascarella,
Terenzini, and Hibel (1978) suggested that student-faculty contact in an informal setting could be
more impactful to students and their undergraduate experiences than contact within the
classroom. Researchers have inferred that student-faculty contact positively affects student
achievement, as faculty place importance on learning and students are socialized to the faculty’s
expectations. Milem and Berger (1997) alleged that student-faculty interaction was a strong

51
contributor to persistence and directly influenced the students’ interaction with peers; a finding
that is supported by Tinto (1987), who suggested that student-faculty interaction enhances social
integration and commitment to the college. Lastly, although overall satisfaction with college
experience is often considered to be sourced within peer groups, Alberti (1972) and Gaff & Gaff
(1981) suggested that student-faculty non-academic contact is more impactful on a student’s
engagement and positive experience. Although several empirical studies have tried to determine
the correlation between student-faculty contact and student experiences (Astin, 1977; Kirk and
Dorfman, 1983; Pascarella and Terenzini, 1976; Pascarella & Terenzini, 1977; Spady, 1971;
Terenzini, Theophilides, & Lorang, 1984) a correlational study does not expose causation and
only inferences can be made.
Reciprocity and Cooperation among Students
The second principle is reciprocity and cooperation among students (Chickering &
Gamson, p. 3). Student learning is enhanced when individual effort supports the team’s effort.
The enhanced learning can often be accomplished through tutors, group projects, and learning
communities (Chickering & Gamson, 1987). Simultaneously, reciprocity and cooperation
prevent a student from becoming a passive participant or observer, and change the learning
environment from competitive and isolated to welcoming and collaborative (Chickering &
Gamson, 1987). This simultaneity leads to the third principle, active learning. Active learning
occurs when students critique each other’s work, and rephrase, discuss, write, and apply the
material presented in lecture. However, active learning is not limited to the classroom
environment, and often occurs through internships, independent study, cooperative job
52
placement programs, and student teaching (Chickering & Gamson, 1987). Even with the
theoretical constructs, the empirical evidence to support active learning is lacking (Prince, 2004),
especially with regard to defining what active learning is and is not. Sorcinelli (1991) worked to
present a foundation for Chickering and Gamson’s principles, but was unable to establish
empirical data that firmly supported active learning. The second and third principles are often
considered to prepare the student for real-world interactions, and are included as one measure in
the NSSE benchmarks (Kuh, 2009b). Similar to the first principle, student-faculty contact, these
are also limited in their broad applicability, and are often criticized for attempting to closely
examine isolated events to describe causation from correlational studies (Kirk and Dorfman,
1983; Pascarella and Terenzini, 1976; Spady, 1971; Terenzini, Theophilides, & Lorang, 1984).
Springer, Stanne, and Donovan (1999) examined effect sizes for students engaged in
collaboration while studying in the science, technology, engineering and mathematics fields, and
found that collaboration promotes a broad range of positive student learning outcomes and that
much of the observed effect size was owed to faculty promoting student collaborations (Prince,
2004). Lastly, Prince (2004) found that in addition to increasing student success, cooperative
learning “promotes interpersonal relationships, improves social support, and fosters self-esteem”
(p. 228). Additionally, Panitz (1999) and others also empirically observed the positive learning
outcomes of cooperation among students (Terenzini, Cabrera, Colbeck, Bjorklund, & Parente,
2001).

53
Prompt Feedback and Time on Task
The fourth principle, prompt feedback, helps students refine their current understanding
and promotes accuracy as they seek new knowledge. Students need consistent, authoritative, and
accurate feedback to improve and reflect on what they have learned. The fifth principle, time
spent on task, follows the simple equation “time plus energy equals learning” (p. 4). Merwin
(1969) proposed that students need to be engaged in opportunities to apply the skills acquired
inside the classroom to situations outside the classroom; this is often accomplished when
students have study abroad experiences and hold leadership roles on campus (Astin, 1993; Pike
& Kuh, 2005). These principles affect students’ learning and professional growth, and students
need help learning time management skills (Chickering & Gamson, 1991). Mastery of this
principle requires effective learning for students and continued improvement of faculty teaching
protocol (Chickering & Gamson, 1987).
High Expectations from Faculty and Respect for Diverse Talents
The sixth principle, high expectations, rests on a simple understanding that all students
will achieve more when they are required to achieve more. High expectations are necessary for
students at all levels, including “for the poorly prepared, for those unwilling to exert themselves,
and for the bright and well-motivated” (Chickering & Gamson, 1987, p. 4). It is prudent to note
that the academic achievement benchmark of the NSSE was crafted by combining the time on
task and high expectations principles.
The last principle, respect for diverse talents and ways of learning, concluded Chickering
& Gamson’s (1987) seven principles of good undergraduate education. Faculty need to

54
understand that students “bring different talents and styles of learning to college” (p. 5), and
provide opportunities for students to showcase their knowledge and learning in a variety of
venues. This can often be accomplished through individualized degree programs and
personalized teaching and evaluation methods (Chickering & Gamson, 1987). Milem and Berger
(1997) and Tinto (1987) credit high expectations of faculty for increased student persistence and
integration into the college campus.
Adaptations of the Seven Principles
The seven principles of Chickering and Gamson (1987) have served as a template to
organizations seeking to develop a set of guiding principles, instruments that are theoretically
grounded in the literature of higher education, and advanced student engagement theories. The
seven principles have been adapted by the American College Personnel Association and the
National Association of Student Personnel Administrators to have a more “student-oriented
emphasis” (p.77), under a charter titled the Seven Principles of Good Practice in Student Affairs
(Chickering & Gamson, 1999). Scholars have used the seven principles at the Ohio State
University to develop a survey-guided tool for faculty and students to manage communication
and feedback during the learning process more effectively (Chickering & Gamson, 1999). In
short, these seven principles, when applied to the student’s college experience, enhance and build
an “ideal” experience (Pike & Kuh, 2005), leading to a fundamental tenet of Astin’s theories.
Astin’s (1993) IEO framework has been used for assessing student development, e.g.,
Cooperative Institutional Research Program’s Entering Student Survey and its counterpart, The
College Senior Survey (Astin, 1993; Kuh, 2009a).

55
Of all the evolutionary milestones between the 1960s and 1990s, two are most widely
known by scholars and practitioners. The College Student Experiences Questionnaire, used by
scholars to measure several of the principles (Kuh & Vesper, 1997; Kuh, Pace, & Vesper, 1997),
and the National Survey of Student Engagement (NSSE) are deeply ingrained in Chickering and
Gamson’s (1987, 1991) good practices in undergraduate education. Kuh (2004) described the
work of Chickering and Gamson (1987) as “perhaps the best known set of engagement
indicators” (p. 1).
Developments in Student Engagement
Following Chickering and Gamson’s (1987) seven principles to enhance the
undergraduate experience, Astin sought to better understand how involvement impacted college
students. Astin’s (1999) student involvement theory posited that when students are involved in
both the academic and social aspects of the collegiate experience, they grow and develop;
however, this does not happen without the alignment of resources. Astin’s theory is described as
a dual-participant activity, in which “[the students] play a central role…[in] determining the
extent and nature of growth according to the quality of effort or involvement with the resources
provided by the institution” (Pascarella & Terenzini, 1991, p. 51).
Furthermore, Astin (1993), Kuh (2001a), Pike, Schroeder, and Berry (1997) and others
used the early works of Chickering and Gamson (1987) to begin developing a framework for
assessing the impact of student experiences, such as living on campus, on student engagement
and collegiate quality (Reason, Terenzini, & Domingo, 2006). Liberal arts colleges were at the

56
forefront of this discussion, and were actively seeking transportable practices to assess and track
efforts that add value to a college student’s experience (Kuh, 2003; Kuh, Hu, & Vesper, 2000).
Streamlining Student Engagement
Liberal arts colleges have roots in the beginnings of higher education in America, and in
loco parentis are at the forefront of their history, as students live in proximity to peers without a
parent and are responsible for making their own choices (Brubacher & Rudy, 1997). Thus, it was
no surprise to liberal arts colleges that “living on campus is perhaps the single most consistent
within-college determinant of impact” (Astin, 1999, p. 611), and dual-participant activities such
as student athletics and student organizations increase student engagement (Chickering &
Reisser, 1993; Chickering, 1969; Kuh et al., 1991; Pascarella & Terenzini, 1991, 2005). The
ability to support these findings in consistent, measurable, and transferable ways set the stage for
assessment of student engagement using a nationally standardized instrument: the National
Survey of Student Engagement (NSSE).
National Survey of Student Engagement
The activities that shape and impact college and university environments have been
studied extensively (Astin, 1993; Astin & Sax, 1998; Carini, Kuh, & Klein, 2006; Kuh, Pace, &
Vesper, 1997; Pascarella & Terenzini, 1991, 2005; Schroeder & Kuh, 2003; Umbach and Kuh,
2003, 2006). The 1990s were met with increased interest in student engagement and a need for
reliable and valid instruments to assess student engagement and collegiate quality (Ewell &
Jones, 1996). Through funds provided by the Pew Charitable Trusts, and under the direction of

57
the National Center for Higher Education Management Systems, the National Survey of Student
Engagement (NSSE) was created.
The National Survey of Student Engagement (NSSE), a nationally recognized instrument,
obtains data that identifies aspects of the undergraduate experience, inside and outside of the
classroom, that contribute to learning and success during college (Kuh, Hayek, Carini, Ouimet,
Gonyea, & Kennedy, 2001). The instrument is structured to provide information in five
categories. The NSSE targets the heart of student engagement through two critical measures of
the college experience and collects data in five categories (Kuh, 2001b).
The two overall measures of college experience are: (1) the amount of time and effort
students invest in their coursework and on educational on-campus activities, and (2) the
institution’s utilization of its resources to create learning opportunities and organize curriculum
in a manner that is highly correlated to student learning. Because of the relationship of student
engagement and overall student experience, the conceptual model for this study integrated
engagement, as described by Kuh et al. (2000), as one circle that impacts alumni donor
involvement. As shown in Figure 7, the five benchmarks to assess campus environments in
relation to student engagement are: (a) Level of Academic Challenge (LAC), (b) Active and
Collaborative Learning (ACL), (c) Student-Faculty Interaction (SFI), (d) Supportive Campus
Environment (SCE), and (e) Enriching Educational Experience (EEE) (NSSE, 2000). These
benchmarks are central to the framework of the NSSE, and provide a basis for comparison
between institutions (Kuh, 2001b).

58
Student-Centered Model of Alumni Donor Participation
Figure 7. Student-Centered Model of Alumni Donor Participation.
The Student Engagement circle of the Student-Centered Model of Alumni Donor
Participation is presented to showcase NSSE’s five benchmarks of student engagement.
Descriptions of the Five Benchmarks
Active and Collaborative Learning is assessed by asking questions relating to class
preparation, tutoring, involvement in community outreach initiatives, and time spent working on
group projects that require inquiry-based learning and collaboration both inside and outside of
the classroom environment. Level of Academic Challenge assesses the amount of time spent
preparing for class, amount of reading and writing, intellectual inquiry, and level of vigor.

59
Institutions with lax attendance policies and mild curricula have significantly lower scores on
this benchmark. Student-Faculty Interaction is assessed through questions related to promptness
of feedback on academic performance, the frequency with which students talk with faculty
members outside of the classroom, and items related to the opportunities for student participation
on faculty research projects. Enriching Educational Experiences assesses items related to the
students’ experience with diverse racial, ethnic, and religious backgrounds, as well as political
views, uses of technology, and participation in community service, internships, job shadowing,
study abroad, co-curricular activities, and/or cumulative senior-year experience. Lastly,
Supportive Campus Environments is assessed by the students’ perceptions of the extent to which
the campus enhances their social and academic success, assists when coping with non-academic
pressures, and supports positive interactions between students and peers, faculty members, and
administrative personnel.
The five NSSE benchmarks have been described as an opportunity to observe the
undergraduate experience (Kinzie & Matveev, 2008). The empirically-driven data have been
reported to accurately assess student outcomes (Pascarella, Seifert, & Blaich, 2010) and have
been used by many institutions to direct college strategy and identify areas of strength and
weakness within their programs. Researchers also use NSSE data to compare peer institutions on
a vast array of measures, including collegiate quality, student experience, and alumni donation
rates; this research provides a basis for connecting student engagement and alumni donor
participation. Because Chickering and Gamson’s seven principles were summative of the college
experience, and accounted for multiple aspects of the college environment, they serve as the
foundation for the NSSE, and at least one of Chickering and Gamson’s seven principles is

60
associated with each of the five NSSE benchmarks. Supportive Campus Environments is not
directly associated with any specific principle of Chickering and Gamson, and is best described
as being moderated by the seven principles in their entirety. Table 1 presents the seven principles
and their close association with the benchmarks of the NSSE instrument.
Table 1 Chickering and Gamson’s Seven Principles and NSSE Benchmarks
Seven Principles NSSE Benchmarks
Faculty Contact
Student-Faculty Interaction
Cooperation Among Students
Active and Collaborative Learning
Encourages Active Learning
Active and Collaborative Learning
Gives Prompt Feedback
Student-Faculty Interaction
Emphasizes Time on Task
Level of Academic Challenge
High Expectations
Level of Academic Challenge
Respects Diverse Talents and Ways of
Learning
Enriching Educational Experiences and
Supportive Campus Environments
Critiques of NSSE
The NSSE instrument is unique among assessments because it is “squarely focused on
the extent to which first-year students and seniors engage in empirically-derived good
educational practice and what they gain from their college experience” (Kuh, 2005, p.124).
Because of the broad and unique characteristics of the NSSE, researchers are using NSSE data to
better understand more about practices in seemingly unrelated areas that impact students (Field,
2011). According to Kuh (2009a), the NSSE should be “used to represent [report on] constructs

61
such as quality of effort and involvement in productive learning activities” (p. 6). However, not
all stakeholders in academia are quick to buy in to the NSSE, and as Olivas (2011) noted, “No
good deed goes un-assessed these days” (p. 1).
Dowd, Sawatzky, and Korn (2011) proposed that incomplete or inaccurate pictures of
college campuses often exist when NSSE scores from two or more institutions are compared
side-by-side, because when measuring student effort, the NSSE does not account for differences
in student demographics and institutional characteristics. Goodwin and Leech (2003) propose
that the student effort construct is intimately tied to intercultural effort, which is based on
cultural and critical theories. Without accounting for the intercultural influences of a campus
environment, they suggest, measuring student effort is challenging if not impossible (Dowd et
al., 2011). Therefore, the NSSE is often criticized for its inability to properly address the student
effort construct, as student effort is not theoretically defined and understood within “intercultural
and economic constraints” (Dowd et al., 2011, p. 38). The other critiques of the NSSE’s ability
to measure student engagement center on the instrument’s validity and reliability.
Porter (2011) disputed the validity of the NSSE survey in four primary areas:
background, content, response process, and internal structure. A major assumption within the
background of the NSSE proposes that students can accurately report their own behavior. Porter
(2011) canvassed the models of human cognition and survey response, and reported that the
literature “clearly suggests they [students] cannot” (p.45) accurately report their own experiences
or behavior. Furthermore, Porter (2011) reported inconsistencies between the survey’s content
with NSSE benchmarks and external data, purporting that the NSSE collects data on broad ideals
of student experiences that lack a theoretical justification for inclusion. However, according to

62
Kuh et al. (2001c), the NSSE items were determined considering principles similar to those used
by Chickering and Gamson (1987, 1991); these included: “(1) Is the item arguably related to
student outcomes as shown by research? (2) Is the item useful to prospective students in
choosing a college? (3) Is the item straightforward enough for its results to be readily interpreted
by a lay audience with a minimum of analysis?” (p. 3). These criteria are based upon actual
student behaviors and perceptions, and provide a useful piece of information to colleges
interested in student engagement at their institutions (Kuh et al., 2001c).
Third, Porter (2011) questioned the response process of students responding to NSSE
items. Porter (2011) suggested that students did not understand the questions being asked, and
the results are inconsistent between survey respondents. Some rationale for why this may exist is
due to the terms used on the survey; for example, students ranked their experiences on the 2006
NSSE using the Likert scale terms: Very Much, Quite A Bit, Some, and Very Little. Porter
(2011) suggested that even if a student had a precise estimation of frequency, which in his
opinion is highly unlikely, each of these Likert scale terms could be interpreted differently by
students and students could be compelled to report a higher than accurate self-rating due “to
social desirability bias” (2011, p.58). Pike & Kuh (2005) contended that survey respondents
receive no incentive for completing the NSSE, and anonymity is provided so that students will
feel comfortable being truthful in their responses. However, Porter (2011) demonstrated that
occasionally, students intentionally misrepresent themselves to look better. Furthermore, Porter
(2011) criticized the response process by focusing on the use of specific terms such as “serious
conversation” and “instructor” on the NSSE, as they can be ambiguous. What is a serious
conversation to one student may be a casual chat to another, and the term “instructor” could

63
mean a host of people, including a graduate assistant, instructional assistant, or faculty member
(Porter, 2011), yet each assumes a unique role.
Lastly, Porter (2011) and Campbell and Cabrera (2011) questioned the internal structure
and validity of the NSSE as an instrument. The two critiques of the NSSE’s internal structure
are: (a) the inter-correlation among the five benchmarks limits the likelihood for the benchmarks
to be used at an institutional level, and (b) the ability of NSSE benchmarks to predict student
outcomes. The NSSE is supported by factor analysis and surface level validity, which does raise
concerns about the ability of the NSSE to retain internal structure across multiple institutions
(Kuh et al., 2001; Porter, 2011). The concerns surrounding the NSSE are paramount, because if
the survey is not measuring what researchers believe it is measuring, “the knowledge of college
students is flawed” (Porter, 2011, p. 45).
These critiques push the NSSE survey to new frontiers and provide opportunities for all
researchers to review their current beliefs to improve dimensions. Olivas (2011), Porter (2011),
and Campbell and Cabrera (2011) each purport to acquire a more wide-ranging picture of the
undergraduate experience; there is a need for additional validity research on the NSSE
instrument. These critiques suggest that the NSSE benchmarks lack theoretical justification, and
because of the quantitative nature of the items addressing student experiences, the NSSE
measures are deficient in regard to validity of survey content (Olivas, 2011). Kuh (2003) has
acknowledged that only addressing the quantity of an activity, and not its quality, is a flaw of the
NSSE. However, the critiques of validity must be taken with consideration of the NSSE’s charter
challenge, to address the national benchmarks of effective educational practice of the
undergraduate experience (Kuh, 2001a), and having evidence of student engagement would

64
encourage people “to focus less on an institution’s resources and reputation, and more on how
institutions were using their resources to create experiences that are related to student learning”
(Indiana University, Bloomington, 2001, p. 2).
Student Engagement and Alumni Giving Summary
Taylor and Martin (1995) used a 32-item self-reporting survey instrument at a Research 1
institution to assess the demographic, attitudinal, involvement, and philanthropic variables that
distinguish alumni donors from non-donors. Taylor and Martin found that the degree of alumni
donor involvement was characterized and directly impacted by the alumnus’s participation in
reading alumni publications, attendance at sporting events, familial attendance at the institution,
subsequent enrollment for graduate studies, and impression of perceived need. This work laid the
foundation for determining an alumnus’s potential for becoming a donor by evaluating that
alumnus’s post-graduation involvement. Similarly, Bruggnik and Siddiqui (1995) constructed a
model for determining the characteristics of donors and non-donors at a private liberal arts
college, but they only surveyed characteristics of alumni and found that marital status, income,
employment status, Greek status, distance from alma mater, and involvement in alumni activities
were statistically significant.
Conner (2005) found that alumni who made donations to their alma mater were more
likely than non-donors to express sincere feelings of allegiance to their institution. The alumni
donors in Conner’s study also reported that they felt they received value from their education
experience. The early studies of alumni giving that revealed that student experiences and student

65
demographics were significant were studied in depth to better elucidate the relationships between
demographics and educational experiences.
For purposes of the current study, educational experiences are directly related to the
seven factors of Chickering and Gamson (1987), which contributed to the development of an
instrument for assessing experience and engagement. Additionally, Merchant (2008) found that
feelings of nostalgia were positively associated with alumni donor involvement and student
experience while in college. Furthermore, Field (2011) found that there was a positive
correlation between NSSE scores from 2005 and 2006 of Carnegie Baccalaureate Colleges and
overall alumni donor participation rates; however, this trend did not continue when considering
master’s or doctoral research universities. Additionally, Field’s (2011) study did not account for
differences in student engagement between alumni, based on year of graduation. The purposes of
the current study were to explore the relationship between NSSE scores and alumni donor
participation in liberal arts colleges, as observed by Field (2011), and further expound upon the
relationships between NSSE scores and alumni participation rates.
Summary
The literature discussed in the forgoing chapter has attempted to draw together the lines
of intersection and overlap among the variables of student experience, demographic variables,
and alumni donor participation. Each study of alumni giving and alumni donor participation has
attempted to address the overwhelming question of how to increase alumni donor participation.
As shown in the literature review and the conceptual framework, supported by Sun (2005) and

66
Sun et al. (2007), student experiences and demographics are key factors in addressing the unmet
need for better understanding alumni donor participation.
The review of information on liberal arts colleges and student experience from the origins
to present day, and within Chickering & Gamson’s (1987, 1991) seven principles for good
practice in undergraduate education, has set the stage for broad applicability. Furthermore, the
in-depth analysis of student engagement and its evolution allows for a better understanding of the
impact that specific student experiences have on future alumni donor participation. Lastly, an
emphasis has been placed on each principle that impacts student experience and followed by a
discussion of how the principles of student engagement, and its critiques, helped shape Kuh’s
(2001a, 2004, 2009a) National Survey of Student Engagement (NSSE).
67
CHAPTER THREE: METHODOLOGY
Introduction
The purpose of this quantitative study was to examine the relationship between level of
student engagement of senior class cohorts at Carnegie Baccalaureate Colleges and alumni donor
participation rates during a five-year post-graduation period. A correlational research design was
employed to investigate the relationship between student demographics, student engagement
benchmark scores (data collected through the 2006 National Survey of Student Engagement
[NSSE]), and alumni donor participation rates for the 2006 class year cohorts at liberal arts
colleges located in the southeastern region of the United States. Institutional level alumni donor
participation data were collected during the pursuant five-year period. Chapter Three presents the
data sources and process used to examine the relationships between student engagement, student
demographics, and alumni participation at Carnegie Baccalaureate Colleges. Building upon the
conceptual model presented in Chapter One, the researcher employed statistical analyses to
examine possible conditions under which student engagement scores and demographic variables
can be used to predict alumni donor participation.
Research Methods
This study was directed by a quantitative research approach. A quantitative study allows
for the comparison of groups and/or constructs using statistical analysis and aims to answer
specific research questions with unbiased, quantifiable data (Creswell, 2008). The quantitative
study tested one theoretical construct, and explored the impact of demographic variables. The
first research question was whether student engagement would predict alumni donor

68
participation, and the second research question explored whether demographic variables would
predict alumni donor participation.
The use of student engagement as a construct and demographic variables as predictors of
alumni giving was guided by a review of the literature that identified gaps that warrant
investigation (Creswell, 2008). College student engagement and philanthropic alumni donors
were investigated as separate entities; however, research is warranted to examine the relationship
between student engagement and alumni donor participation. The limited research examining the
relationship between student engagement and alumni donor participation identified gaps in the
literature of philanthropic alumni donor participation.
Sound quantitative research methods necessitate quality data collection measures with
acceptable validity and reliability (Tabachnick & Fidell, 2001). For this investigation, college
student engagement data were collected via the 2006 NSSE survey, which was administered in
its totality to each participant. Philanthropic alumni donor participation for the 2006 class cohort
was ascertained by contacting the participating institutions to request the data.
Research Design
A correlational research design was employed to investigate the relationship between
student engagement and alumni donor participation. Correlational research is used to identify
relationships between variables as they occur in their unmodified state (without manipulation),
while establishing the degree and direction of the relationship (Fraenkel & Wallen, 2006). A
correlational research design was appropriate for this study, as the purpose of the investigation
was to determine if there were relationships between student engagement scores, demographic

69
characteristics, and alumni donor participation rates. Furthermore, as the data for this study were
preexisting and obtained through purposive sampling techniques, it is important to note that
correlational designs do not infer casual relationships. For the purpose of this study, alumni
donor participation was defined as the dependent variable, and the independent variables were
student engagement scores and demographic variables (e.g., gender, parents’ educational level,
recipient of institutional scholarship, major, and nationality).
The statistical analysis used to answer the research questions included logistic regression,
as the dependent variable (alumni donor participation rate) was provided by NSSE as a binary
variable instead of a continuous variable. The use of a logistical regression model is needed to
analyze research data when the dependent variable is dichotomous (e.g., donated or did not
donate) and the predictor variables are either categorical or continuous. Specifically, logistic
regression “is the appropriate statistical technique when the dependent variable is a categorical
(nominal or nonmetric) variable and the independent variables are metric or nonmetric variables”
(Hair et al., 2010, p. 319). Unlike linear regression, logistic regression maps to a logistic curve, is
designed for binary dependent variables, and is interpreted in terms of likelihood (e.g., condition
1 is X times more likely to occur than condition 2) (Hair et al., 2010). Logistic regression uses
models to calculate log odd ratios and record the log odd ratios as regression coefficients (Bs).
Thus, the relationships between independent variables and a dichotomous dependent variable are
nonlinear. In each step of the analysis, the log odds were increased by one unit of its scale, and
the regression coefficients (Bs) mirror this change in the dependent variable. Correlations
between the independent variables and the dependent variable induce the log odds to increase or
decrease in accordance with the probability that the event would occur (in the present case, an
70
increase or decrease in alumni donor participation). To create the model, each of the five NSSE
engagement benchmarks (all continuous) was entered at once. No transformations of these data
were necessary.
Data Sources
The study of college student engagement during the late 1990s prompted the
development of the National Survey of Student Engagement (NSSE). The NSSE has five
benchmarks of student engagement, which are moderated by responses to survey questions
inquiring about specific student behaviors or experiences. Responses to the NSSE survey
questions relate to the five benchmarks and each behavior is measured using a scored scale.
The five NSSE benchmarks of educational practice, which are composed of student
responses to questions on the NSSE survey, are listed.
Active and Collaborative Learning. The active and collaborative learning benchmark
measures the level of participation and time spent working on group projects that require inquiry-
based learning and collaboration both inside and outside of the classroom environment.
Enriching Educational Experiences. The enriching educational experiences benchmark
assesses items related to the students’ experience with diverse racial, ethnic, and religious
backgrounds, uses of technology, and participation in community service, internships, job
shadowing, study abroad, co-curricular activities, and/or cumulative senior-year experience.
Level of Academic Challenge. The level of academic challenge benchmark assesses the
amount of time spent preparing for class, amount of reading and writing, intellectual inquiry, and
level of vigor.

71
Supportive Campus Environments. The supportive campus environments benchmark
reflects the students’ perceptions of the extent to which the campus enhances their social and
academic success, and assists them in coping with non-academic pressures.
Student-Faculty Interaction. The student-faculty interaction benchmark assesses the
frequency and quality of communication that students report having with faculty members
outside of the classroom.
The NSSE instrument assesses impact of engagement on positive student outcomes at
institutions across the United States, and liberal arts colleges were one of the first groups to
adopt the use of the NSSE. Table 2 presents the individual questions (NSSE items) on the 2006
NSSE that contribute to each of the five benchmark scores (NSSE, 2000).
For ease of reading, three letter codes for each benchmark are used: Active and
Collaborative Learning (ACL); Enriching Educational Experience (EEE); Level of Academic
Challenge (LAC); Supportive Campus Environment (SCE); Student-Faculty Interaction (SFI)
(NSSE, 2000). The complete 2006 NSSE survey is contained in Appendix A.
Table 2 Questions on the 2006 NSSE that Moderate the Five Benchmarks Scores
NSSE item number Benchmark of Engagement
1a,b,g,h,j,k,t ACL
1l,u,v; 7a-c,e-h; 9d; 10c EEE
1r; 2b-e; 3a,c-e; 9a; 10a LAC
8a-c; 10b,d,e SCE
1n-q,s; 7d SFI
72
National Survey of Student Engagement
The NSSE is an instrument used at institutions of higher education to measure
undergraduate student engagement levels and is used to “provide data to colleges and
universities to use for improving undergraduate education, inform state accountability and
accreditation efforts, and facilitate national and sector benchmarking efforts, among others”
(NSSE, 2005, p. 5). The measure addresses the magnitude of institutional engagement by
measuring student participation in activities (NSSE, 2005). NSSE data is collected from
participating institutions by randomly selecting undergraduate students during the spring
semesters of their first and senior years. Survey participants are enrolled during the previous
semester so that they have a substantial view of the campus environment and can make informed
judgments (Kuh, et al., 2001b).
The NSSE survey is a self-report questionnaire composed of 85 questions designed to
collect information on student demographics and experiences. The NSSE comprises five
benchmarks that can be used to assess student engagement within the institution, and scaled
scores of individual items are categorically tied to benchmark scores. Furthermore, the NSSE is
regarded as the premier measure of undergraduate student engagement in the United States; the
data may be used by institutions to compare results with peer institutions, to identify
opportunities for development, and track progress toward meaningful improvements. Lastly, the
NSSE may be used by prospective students and parents/guardians to assess a college’s student
centeredness (Kuh, et al., 2001a, 2001b).

73
Instrument Consistency and Validity
The internal consistency reliability of the NSSE (2006) was questionable to moderate
with Cronbach’s alphas ranging from .65 to .76 (Pascarella, Seifert, & Blaich, 2008). Table 3
presents the internal consistency reliability for the five subscales of the NSSE. Benchmarks are
properly used when comparing student responses with those at similar institutions. One way to
estimate internal consistency of the NSSE results is by calculating Cronbach’s alphas and inter-
correlations for each benchmark. When used for a set of items, the internal consistency is a
measurement of how well the individual items are measuring the same variable or construct.
Cronbach’s alphas range from zero to one. Alphas near one indicate a greater internal
consistency than those near zero. Groups with Cronbach’s alphas greater than 0.70 are
acceptable, but Cronbach’s alpha of 0.60 are questionable (McMillan & Schumacher, 2000;
Kline, 2011), and further tests for inter-item analysis and item-to-scale correlations should be
completed (Clark & Watson, 1995). Table 3 reports the Cronbach’s alphas for each benchmark.
Correlations were significant at p < .01, and no distinctions were identified between freshman
and senior, or institution type (Pascarella et al., 2008).

74
Table 3 Internal Consistency of the 2006 NSSE Benchmarks
NSSE Benchmarks Cronbach’s α
Level of Academic Challenge .72
Active and Collaborative Learning .67
Enriching Educational Experiences .65
Student-Faculty Interaction .75
Supportive Campus Environment .76
Note. All correlations are significant at the p <.01 level.
The Cronbach’s alphas for active and collaborative learning (α = .67) and enriching
educational experiences (α = .65) suggest that these two benchmarks should be used cautiously
and considered less reliable, as there may be weak items within the two subscales. Two
benchmarks with high indicators of reliability are Supportive Campus Environment (α = .76) and
Student-Faculty Interaction (α = .75); the Level of Academic Challenge (α = .72) benchmark had
moderate reliability. Given the range in internal consistency for the NSSE, prior to the analysis
of the data, all the data underwent a rigorous screening and review. Kline (2011) stated that
“somewhat lower levels of score reliability can be tolerated if sample size is sufficiently large”
(p. 70). For the present study, the results of such screening and review allowed the researcher to
assess internal consistency and reliability of all the factors/benchmarks prior to any statistical
analysis.
Should the individual benchmarks of data obtained for the present study had high
multicollinearity, the individual benchmark scores would have been used to compute an
engaging environment score by adding the five benchmark scores. An additive approach was
used by Hu and Kuh (2003) for data from survey respondents from a NSSE precursor, the

75
College Student Experiences Questionnaire, and Field (2011) for data from the NSSE
instrument. In both studies, the summed benchmark scores were used as an independent variable
(Field, 2011).
Engaging environment = level of academic challenge score + active and collaborative
learning score + enriching educational experiences score + student faculty interactions
score + supportive campus environments score
Validity, as defined by the Standards for Educational and Psychological Assessment
(AERA, APA, & NCME, 1999), is “the degree to which evidence and theory support the
interpretations of test scores entailed by the proposed uses of tests” (p. 9). Therefore, validity is
not a property of the instrument, but of the inference (Messick, 1989). Furthermore, Gonyea and
Miller (2010) reported that validity results of the NSSE indicate that the NSSE benchmarks are
able to distinguish between groups in a predictable way, commonly termed Known Groups
Validity, and that the institutional uses of the NSSE coincide with the envisioned purposes of the
NSSE survey, also known as Consequential Validity. The NSSE survey has good content,
construct, predictive, and consequential validity (e.g. Campbell & Cabrera, 2011; Gonyea &
Miller, 2010). Nevertheless, the present study assessed construct validity of the NSSE using the
present data set.
Self-report data, such as the five NSSE benchmarks, are used, and the validity, reliability,
and credibility of these data were studied (Baird, 1976; Berdie, 1971; Griffith, 2011; Pace, 1985;
Pike, 1995; Pohlmann & Beggs, 1974). Data collected by self-report questionnaires are
considered valid under the following five conditions:
1. The information that is being requested by the instrument is known to the respondent;

76
2. Questions are clearly and unambiguously phrased;
3. Respondents believe that the questions deserve careful, serious, and thoughtful
responses;
4. Questions are specifically geared towards recent activities;
5. Answering the question does not cause a respondent to feel compelled to respond in
socially desirable ways or to feel embarrassed, humiliated, threatened, or feel that their
privacy has been violated (Kuh, 2001a, p. 4).
Population
Since 2000, over 850 private colleges and universities across the U.S. have administered
the NSSE survey (NSSE, 2012). In 2006, over 1,225,000 first-year and senior students
participated in the survey, representing 557 institutions. The overall response rate for the
institutions that participated in the 2006 NSSE administration was 39%.
The population for this study was composed of college seniors at private institutions who
completed the 2006 NSSE during the spring semester of their senior years. NSSE data were used
to study the five benchmarks described in Chapter Two: (a) level of academic challenge, (b)
active and collaborative learning, (c) student-faculty interactions, (d) enriching educational
experiences, and (e) supportive campus environments.
The Integrated Postsecondary Reporting System (IPEDS) reported that most liberal arts
colleges were located in the southeastern region of the United States (IPEDS, 2012). Table 4
presents a regional overview of liberal arts colleges across the United States, and highlights the
number of institutions in each region that participated in the 2006 NSSE.

77
Table 4 Regional Distribution of Private Not-for-Profit Liberal Arts Colleges
Geographic Region Total # of Colleges Participated in 2006
NSSE Far West 34 23 Great Lakes 95 60 Mid East 76 76 New England 52 38 Plains 66 30 Rocky Mountains 7 7 Southeast 154 78 Southwest 25 15 Total 509 327
Sources: IPEDS, 2010; NSSE, 2012.
Sample
Campbell and Stanley (1963) described six fundamental principles of quality quantitative
research. Two of the six principles apply to sample selection: using a random sample and
controlling for extraneous factors. Sampling is described as the cornerstone of quality
quantitative research; however, given the practical considerations of conducting a random
sample or controlling for extraneous factors, the NSSE has collected data using a convenience
sample. Convenience sampling does limit the generalizability of the results, but is acceptable
when other options are limited (Creswell, 2008), such as in the case of the NSSE’s
administration. Therefore, the NSSE utilized convenience sampling to gather the data, and the
sample chosen by the researcher of institutions who participated in the NSSE were purposefully
obtained by pulling a subsample from the overall NSSE data.
Of the population defined above, a purposive sample of data for college seniors was
collected from institutions. The three criteria of this purposive sample were: (a) institutions
located in the Southeastern region of the United States, as defined by IPEDS (2012); (b)

78
Carnegie Baccalaureate College—Arts and Sciences and Diverse fields Classification, as defined
by the 2010 Carnegie Classification of Institutions of Higher Education; and (c) the institutions’
willingness to share class year alumni donor participation data. After a comprehensive list of
liberal arts colleges that participated in the NSSE during 2006 was compiled, and University of
Central Florida Institutional Review Board approval obtained, the researcher contacted the
liberal arts colleges’ alumni staff to acquire data concerning yearly alumni donor participation
for the senior class year cohort who, as seniors, participated in the 2006 NSSE.
Based on a 39% overall response rate of students to the 2006 NSSE administration, and
the desire to make inferences based upon the data collected, a minimum number of seniors who
participated in the 2006 NSSE was needed. An appropriate sample size for this study was
determined by considering the power of the study, the level of significance and the effect size of
the study. Statistical power of a study is the long-term probability of rejecting the null
hypothesis; calculating the statistical power for a sample prior to beginning a study can decrease
the likelihood of making a Type II error (Cohen, 1992; Moore & McCabe, 2006), failure to reject
the null hypothesis. Kuehl (2000) suggests a minimum power of .80 to reject a false null
hypothesis, or to report that there is no relationship. Next, the level of significance is determined
by the risk of falsely rejecting the null hypothesis. Following convention, the level of
significance for this study was set at the .05 level (Cohen, 1992). Lastly, the effect size is a
measurement of the strength or magnitude of the relationship between the independent and
dependent variables in the analysis (Cohen, 1992). Power is related to data analysis procedures
and number of variables. For the present study, effect sizes were defined as small, medium, or
large effect, where small is .02, moderate is .15, and large is .35; therefore, based upon an

79
analysis using logistical regression for five independent variables, the investigation necessitated
a minimum sample size of 645 based upon a power of 80%, a level of significance of α = 5% to
identify a small effect size.
Procedure
Data Collection
All data were collected and acquired in accordance with the University of Central Florida
Institutional Review Board (UCFIRB) policies and procedures. A more detailed description for
each data set is provided below.
NSSE Data
Following approval from the UCFIRB, the researcher gained access to the NSSE dataset.
The data were provided by the Center for Postsecondary Research, and the institutions’ names
and aggregate scores for the five respective benchmarks, based upon the 2006 senior class
participant responses, were provided to the researcher. The name of each institution and its
scores were confidentially maintained and only used for the purposes described herein. The
NSSE does not provide data on individual institutions to researchers who have not obtained a
waiver from the respective institutions. Because of these data sharing requirements, the
dependent variable, alumni donor participation rate, was reported as a binary variable instead of
a continuous variable. Therefore, the researcher grouped the institutions who responded to the
request for alumni donor participation data on the 2006 class year by alumni donor participation
rates.

80
Alumni Donor Participation Data
Following UCFIRB approval, alumni donor participation data was acquired. The
following steps were taken to ensure a comprehensive list of schools: (a) Develop a list of liberal
arts colleges in the southeastern region of the United States that participated in the 2006 NSSE;
(b) Acquire the contact information for an institutional official with the title of Young Alumni
Affairs or Young Alumni Giving; (c) Contact each institution individually using the form letter
provided in Appendix B, which explains the purpose and use of the data and ensures anonymity;
and (d) Provide any benefits for the institution’s assistance, and include a thank you card.
Institutions were separated based upon their alumni donor participation rates, and data for
student engagement were provided to the researcher in two tranches (based upon the alumni
donor participation rates provided by the researcher). The binary representation of the dependent
variable follows the national trends of alumni donor participation in higher education, and
provides valuable information that can be used across multiple institutions to enhance
understanding of the factors that contribute to alumni donor participation. For the study, alumni
donor participation was “high” when greater than 16% and “low” when less than 12%. Unlike
linear regression, logistic regression maps to a logistic curve, is designed for binary dependent
variables, and is interpreted in terms of likelihood (e.g., condition 1 is X times more likely to
occur than condition 2) (Hair et al., 2010).
Data Preparation
When conducting statistical analysis to answer a specific research goal, using a data set,
conclusions can only be reliable when assumptions guiding the analysis are sound (Tabachnick

81
& Fidell, 2001). Tabachnick and Fidell suggests that cleaning, to remove cases with missing or
incomplete data, and preparing data can help ensure the best statistical outcome, and the
accuracy of the data “involves examination of descriptive statistics and graphic representations
of the variables”(p. 57). All data entered by the researcher were cross-checked to ensure that no
data entry errors occurred.
Validity and reliability tests were examined by testing four statistical assumptions. These
four assumptions were normally distributed data, homogeneity of variance, interval data, and
independence (Tabachnick & Fidell, 2001). Normally distributed data refers to checking the data
through plotting to a normal probability curve. Homogeneity of variance refers to the variances
in correlational designs, and assumes that they are the same for each level of each variable.
Interval data refers to data where the distance between any two points is the same and is
assumed in this study for Likert data. Independence of the data assumes that the response of each
respondent has no effect on any other respondent’s scores. Cleaning the data and performing pre-
analysis assumption testing ensures that the results accurately represent the data set.
Data from the independent and dependent variables were categorized and coded in
aggregate.
Independent Variables
NSSE Variables
The independent variables in this study were the individual benchmark scores for each
NSSE benchmark, and the computed score for the engaging environment, as described above,
which is reflective of the extent to which institutional environments are engaging students.

82
Demographic Variables
Gender (GEND). There are two categories: male and female. Males were coded “1” and
females were coded “2” (Question 16, Appendix A).
International student or foreign national (INTER). There are two categories: yes and no.
Yes was coded “2” and no was coded “1” (Question 17, Appendix A).
Parent’s education level (PARED). There are two categories: father and mother, and
seven classifications for each. Each category was scored separately (father and mother), and each
category’s classification coded with a dummy value. Responses of Did not finish high school
were coded “1,” Graduated from high school were coded “2,” Attended College but did not
complete degree were coded “3,” Completed an associate’s degree were coded “4,” Completed a
bachelor’s degree were coded “5,” Completed a master’s degree were coded “6,” Completed a
doctoral degree were coded “7” (Question 27, Appendix A).
Major of degree (MAJ). The major of degree was a free response item, and categories for
each major were grouped into a college-specific category and the corresponding NSSE codebook
(e.g., accounting, marketing, and finance were grouped under Business; literature,
creative/technical writing, political science and history were grouped under Social Sciences, and
biological sciences, physical sciences, and mathematics were grouped under Laboratory
Sciences). The coding schematic was based upon the CIP 2000 major categorization (Question
28, Appendix A).
Recipient of an institutional scholarship (SCHSP). Data for the recipient of an
institutional scholarship variable were reported by the participating institution when donor
participation information is collected, and was the number of students in the class of 2006 who

83
received an institutional scholarship. In addition, the SCHSP variable was reported as a
percentage.
Dependent Variable
The dependent variable used in this study was recent alumni donor participation rates for
each institution under investigation. The dependent variable was reported as a percentage of
students in the class of 2006 who made a financial contribution. The percentage was determined
by obtaining the total number of alumni donors from the class of 2006 and dividing it by the total
number of 2006 graduates (Field, 2011).
Alumni donor participation rate = # of alumni donors from the undergraduate class of
2006 / # of undergraduates who graduated in 2006. The alumni donor participation rate for the
class of 2006 was measured over time by keeping the denominator constant, and obtaining the
total number of alumni donors from the class of 2006 who gave in 2007, 2008, 2009, 2010, and
2011. Calculating a donor participation rate for each year allowed for analysis of alumni donor
participation rates over a five-year period, and may present trends of alumni donor participation
for the first five years after graduation.
Data Analysis
All data were obtained and recorded using the procedures described above and in
accordance with the University of Central Florida Institutional Review Board. The data were
entered into the standardized statistical software package, Statistical Package for Social Sciences
(SPSS), and analyzed using descriptive statistics and logistical regression. Coded variables were
analyzed using SPSS, for independent and interactive effects.

84
The research questions guiding the investigation are as follows:
Research question one. What is the relationship between student engagement rates at
liberal arts colleges (as measured by the five NSSE 2006 benchmarks of engagement: [a] level of
academic challenge, [b] active and collaborative learning, [c] student-faculty interaction, [d]
supportive campus environment, and [e] enriching educational experience) and alumni donor
participation rates over a five year post-graduation period (2007, 2008, 2009, 2010, 2011)?
a. Dependent / Outcome Variable – Alumni donor participation rates
b. Independent / Predictor Variables – (a) level of academic challenge, (b) active and
collaborative learning, (c) student-faculty interaction, (d) supportive campus environment, and
(e) enriching educational experience.
Research question two. What is the relationship between alumni donor participation
rates and the alumni demographic variables of: (a) parents’ education levels, (b) nationality, (c)
academic major, (d) recipient of scholarship, (e) gender, and (f) participation in Greek Life?
a. Dependent / Outcome Variable – Alumni donor participation rates
b. Independent / Predictor Variables – (a) parents’ education levels, (b) nationality, (c)
academic major, (d) recipient of scholarship, (e) gender, and (f) participation in Greek Life.
Summary
The purpose of this study was to examine the relationship between student demographic
variables and student engagement scores on the 2006 NSSE, and recent alumni donor
participation at liberal arts colleges. A quantitative approach was used to answer the research
questions, and to determine the student demographics and the NSSE benchmarks of student

85
engagement that are predictive of alumni donor participation. Using alumni donor participation
rates as a dependent variable was advantageous, as the rate served as an indication of alumni
satisfaction and did not rely on the magnitude of the gift. Furthermore, the alumni donor
participation rates did not have broad fluctuations between years, and allowed for control over
the categorical separation of the dependent variable. The results of these analyses are discussed
in Chapter Four.

86
CHAPTER FOUR: RESULTS
Introduction
This study investigated the relationship between student engagement scores, alumni
donor participation rates, and student demographics to offer insight on strategies to increase
alumni giving. Unlike previous research on alumni giving, which examined a single institution or
national databases, this study focused on the class of 2006, from a multi-state selection of
Carnegie Baccalaureate Colleges located in the southeastern region of the United States.
Furthermore, this study used the 2006 senior class NSSE responses of students at these
institutions, as the NSSE is recognized as the standard for understanding and comparing
institutions on student engagement (Kuh, 2001b). By controlling for institution type and
graduating class year, the analyses were able to add value to institutions that participate in the
annual administrations of the NSSE and were similarly related to the population and sample.
Results from this study offer implications to higher education professionals interested in
understanding the impact of student engagement during the college years on their alumni giving.
In addition, an increased understanding of the relationship between student engagement, student
demographics, and alumni donor participation aids institutional leaders in better forecasting
alumni donor participation rates by assessing engagement. An increased understanding of the
relationship between student engagement, student demographics and alumni donor participation
may provide more interaction between student affairs and academic affairs departments;
enabling institutions to employ data-driven decision-making when allocating resources to
support activities that engage and enhance students’ experiences, strengthen students’ success,
and increase alumni donor participation (Field, 2011). The findings are presented in the chapter

87
in the following format: (a) Sampling Procedures, (b) Data Preparation, (c) Statistical
Procedures, (d) Evaluation of the Findings, and (e) Summary of Key Results.
Sampling and Data Collection Procedures
Target Population
The targeted population in this study was students who graduated in 2006 from a
Carnegie Baccalaureate College located in the southeastern region of the United States, and
whose institutions participated in the 2006 NSSE administration. Because of confidentiality
regulations, individual students could not be contacted, and the responses of individual students
could not be matched with their individual giving records. In all, 40 schools met the population
requirements of this study: (a) located in the Southeastern region of the United States, as defined
by IPEDS (2012); (b) defined by the 2010 Carnegie Classification of Institutions of Higher
Education as Carnegie Baccalaureate College—Arts and Sciences and Diverse fields; and (c) had
administered the 2006 NSSE to the 2006 undergraduate senior class cohort.
The researcher obtained approval from the University of Central Florida’s Institutional
Review Board (UCFIRB) prior to data collection. An administrator at each liberal arts college
that met the participation requirements for this study was sent an email inviting the institution to
participate in this study. Each email requested that the administrator provide factual data
concerning the full-time undergraduate class of 2006, who participated in the 2006 NSSE
administration. The survey consisted of the following requests for data: (1) What was the total
number of undergraduate graduates in the spring semester of 2006? (2) Tracking only
undergraduate graduates of the 2006 spring semester (as reported in question 1 above) over a

88
five year post-graduation period, how many students made a monetary (of any amount)
contribution to COLLEGE NAME during each of the following years: 2007, 2008, 2009, 2010,
2011? (3) On average, what percentage of students at COLLEGE NAME receives institution-
based financial aid?
Data Collection Procedures
The data collection ran from March 11, 2013 to April 9, 2013. To increase the response
rate, a modified method of email prompting, based upon Dillman’s (2007) Tailored Design
Method, was used. The modified method of email prompting included (a) multiple contacts, (b)
incentives, and (c) Social Exchange Theory (Homans, 1958). For this study, multiple contacts
were as follows: approximately one week after the initial email was sent to each of the potential
participants, a follow-up email was sent. The follow-up email contained the original request, and
a reminder; therefore, the follow-up email served as a “thank you” note to those who had already
responded and as a reminder to those who had not yet responded to the request for data. Three
potential participants requested a copy of the researcher’s IRB approval form; after a copy of the
approval form was provided, the potential respondents chose to participate in the study. Each
potential participant was provided the incentive of receiving an aggregate analysis of the data
upon completion of the dissertation. As this study was focused on peer institutions of the
potential participant, the opportunity to participate and be provided analyses that allowed peer to
peer comparison was seen as a valuable incentive.
Social Exchange Theory (Homans, 1958) is a derivation of economic exchange theory
and posits that individuals in relationships undergo an exchange of non-material goods, such as

89
advice, affection, power, or in this case, knowledge. To employ the Social Exchange Theory
(Homans, 1958), three postulates were addressed. The first postulate examined how the potential
participant’s perceived awards can be increased, the second examined how perceived costs for
responding can be reduced, and the last sought to establish trust so that people believe the
rewards will outweigh the costs of responding. The present study employed the postulates to
increase the potential participants’ perception of reward by providing information about the
study, and describing how the researcher intends to use the results, informing the participants
that their institution was among an elite group of institutions contacted, showing positive regard
for the potential participants, and thanking the participants. Furthermore, costs of participation
were reduced by asking questions that were short and easy to complete, avoiding subordinating
language, and writing the request in the text of the email so that the participant could respond
easily. Lastly, the Social Exchange Theory (Homans, 1958) was employed by obtaining
sponsorship from a legitimate authority, providing appreciation for a timely response in advance,
and ensuring the confidentiality and security of information.
Response Rate
Of the 40 potential participant institutions identified for this study, two emails were
returned as undeliverable, three respondents indicated a desire to participate, but cited time
constraints for obtaining the requested data and ultimately declined to participate, two indicated
that they were no longer employed by the institution, and one indicated that they were unwilling
to provide any data concerning their alumni donor participation. The researcher identified
different individuals at the two institutions for which the undeliverable emails were returned, and

90
for the two institutions where the original contact was no longer employed; however, there was
no response from the subsequent follow-up. In all, 10 institutions provided the requested
information. Of those 10, there were no incomplete responses, yielding a usable response rate of
25%.
Following the collection of alumni donor participation data, which allowed for the
determination of participating institutions, the NSSE was contacted for student NSSE responses
for seniors who participated in the 2006 administration at each institution. Due to the
confidentiality requirements of the Indiana University Center for Postsecondary Research Data
Sharing Agreement, the researcher was unable to obtain NSSE data for individual institutions;
therefore, was unable to match the alumni donor participation data obtained from each of the 10
participating institutions with their respective NSSE responses. The NSSE would only provide
engagement data from individual institutions upon receipt of a waiver of confidentiality from
each participating institution. The researcher was not able to obtain a waiver of confidentiality
letter; however, the NSSE did agree to provide the engagement data in two tranches, five
institutions in each. The NSSE did group the student data by institution and assigned an arbitrary
code to separate each institution. The 10 participating institutions were divided into two
categories, based upon average alumni donor participation rates for the 2006 class cohort. The
alumni donor participation rate was determined by the following formula: Alumni donor
participation rate = # of alumni donors from the undergraduate class of 2006 / # of
undergraduates who graduated in 2006. The alumni donor participation rate for the class of
2006 was measured over time by keeping the denominator constant, and obtaining the total
number of alumni donors from the class of 2006 who gave in 2007, 2008, 2009, 2010, and 2011.

91
The first tranche provided by the NSSE consisted of institutions with low alumni donor
participation rates of 12% or less (represented by 0), and the second tranche consisted of
institutions with high alumni donor participation rates in excess of 16% (represented by 1).
While on the surface, a binary dependent variable does limit variance, the minimal variance may
have been inevitable given the wide gap between the alumni donor participation rates at the two
groups. Therefore, the limitation of NSSE confidentiality regulations allowed for a binary
dependent variable, instead of a continuous variable. Logistic regression maps to a logistic curve,
designed for binary dependent variables, and is interpreted in terms of likelihood (e.g., condition
1 is X times more likely to occur than condition 2) (Hair et al., 2010). Following the removal of
missing or incomplete cases, the sample size for NSSE student responses was acceptable for the
data analysis (N = 1,073). When using logistical regression, Long (1997) suggests that sample
sizes of fewer than 100 should be avoided and that 500 observations should be adequate for
almost any situation. Prior to the data analyses, the data set was examined to assess the fit
between the distribution of the variables and the assumptions of the statistical analysis, such as
multicollinearity, outliers, and confirming the presence of independence between the errors, and
linearity of predictors with log odds of dependent variable; no assumption violations were
identified. In addition, a sample size of 1,073 was acceptable for identifying a small effect size
(power = .80) at the .05 level (Cohen, 1992).
Sample Demographics and Descriptive Statistics
Descriptive analyses of the data collected by the NSSE revealed that the number of
students at institutions with less than 12% alumni donor participation rate was 424 (39.9%), with

92
638 (60.1%) from institutions with greater than 12% alumni donor participation. Gender of the
students was reported as 274 (25.8%) male and 788 female (74.2%), and the sample included 41
(3.9%) international students and 1019 (96.1%) non-international students.
Additional analysis of the descriptive data revealed parent education level to be 155
(14.6%) neither parent attempted college, 190 (17.9%) at least one parent attempted college, 151
(14.2%) at least one parent completed a baccalaureate, 146 (13.7%) both parents completed
baccalaureate, 261 (24.6%) at least one parent completed graduate degree, and 157 (14.1%) both
parents completed graduate degree. Further analysis revealed the academic majors of the sample
as 155 (14.6%) laboratory sciences (e.g. biological sciences, physical sciences, and
mathematics), 627 (59.0%) social sciences (e.g. arts, humanities, education, and political
science), and 279 (26.3%) business (accounting, finance, management, economics). Lastly, 298
(28.1%) students identified as a member of a Greek Life organization, while 764 (71.9%) did not
identify as a member of a Greek Life organization.
A higher number of students completed the NSSE survey questions that were
academically oriented than completed the NSSE survey demographic questions; in total, 70
(6.1%) did not answer demographic questions. The cases of missing data were removed prior to
analysis to answer research question 2, which examined demographic data. Hence, the removal
of missing cases explain the observed differences in N = 1,073 for research question 1 and N=
1,060 for research question 2. Furthermore, when the NSSE responses were evaluated for
reliability, “the degree to which scores yielded by an instrument, at a specific point in time and
under certain conditions, are replicable” (Leech, Onwuegbuzie, & O’Conner, 2011, p. 115), the
N = 1,038.

93
Data Preparation
Multicollinearity of NSSE benchmarks
Cronbach’s alpha is a coefficient of internal consistency. Cronbach’s alpha increases as
the intercorrelations among test items increase and is referred to as an internal consistency
measure of reliability of test scores. Leech and colleagues (2011) reported that scores obtained
by an instrument must be consistent to be replicable and must represent the behaviors or
constructs across variations in instrument items and differing occasions of measurement.
Cronbach’s alpha is used in social sciences to indirectly indicate the degree to which a set of
items, such as individual question on the NSSE instrument, measures a single unidimensional
latent construct. In the case of the NSSE instrument, individual items on the NSSE instrument
contribute to the benchmark score that is reported, and Cronbach’s alpha is an appropriate
measurement to ensure that the items are measuring the intended construct. Benchmarks are
properly used when comparing student responses with those at similar institutions. One way to
estimate the internal consistency of the NSSE results is by calculating Cronbach’s alphas and
inter-correlations for each benchmark. When used for a set of items, the internal consistency is a
measurement of how well the individual items are measuring the same variable or construct.
Cronbach’s alphas range from zero to one (Cronbach & Shavelson, 2004). Alphas near one
indicate a greater internal consistency than those near zero. There is broad support in social
science research for the use of constructs with a minimum Cronbach’s alpha of .80 (e.g.,
Nunnally, 1978; Osborne, 2013).
Table 3 of Chapter Three, presented Cronbach’s alpha of internal consistency for each
NSSE benchmark, using a base random sample of data collected during the 2006 NSSE survey

94
administration (Pascarella, Seifert, & Blaich, 2008). The Cronbach’s alpha from Pascarella et al.
(2008) is also presented in Table 5 to provide a comparison between the NSSE’s reported
Cronbach’s alpha using a base random sample and the Cronbach’s alpha for the 2006 data set
used in the present study. Nunnally (1978) preferred that Cronbach’s alpha be above .80, but
recommended a threshold of at least .70 so that a relationship between the reliability of the
instrument and the validity of the research findings can be established. However, others have
advocated that alpha is a function of the number of items on the survey (Osborne, 2013;
Rosenthal & Rosnow, 1984), and it is acceptable to use internal reliability estimates of .60
(Bernardi, 1994; Bernardi, Baca, Landers, & Witek, 2008; Chang, Chan, Gudmundsson, &
Sawang, 2011; Mechanic, 1979). Thus, the two constructs that do show Cronbach’s alphas
smaller than 0.70 are acceptable, but should be used cautiously (Esquivel, 2001; McMillan &
Schumacher, 2000). Table 5 reports the Cronbach’s alphas for each benchmark, using data from
the present study. Correlations were significant at p < .01.
The Cronbach’s alphas for these data ranged from 0.62 to 0.76, and the number of items
for each benchmark ranged from 6 to 12. Active and collaborative learning (α = .63) and
enriching educational experiences (α = .62) were scored based upon 7 and 12 items, respectively,
and their alphas fell below the recommended thresholds of reliability. Further tests for inter-item
analysis and recalculations of Cronbach’s alphas based upon an item being removed were
completed for each benchmark; however, there was no improvement for the Cronbach’s alpha of
either benchmark, and thus no items were removed from the benchmark scores. Both the
Supportive Campus Environment (α = .76) and Student-Faculty Interaction (α = .75) had high
indicators of reliability, and the Level of Academic Challenge (α = .75) benchmark had moderate

95
reliability; these benchmarks were scored based upon their respective 6, 5, and 11 items. Despite
two of the dimensions dropping below the recommended .70 threshold (Nunnally, 1978), the
results were not dismissed, as a low alpha may have indicated that the sample possessed little
variance, a driver of reliability measurements (Thompson, 1994), and was homogenous
(Bernardi, 1994). Therefore, further tests were used to determine if the results could be logically
justified.
Table 5 Internal Consistency for a Random Sample of 2006 NSSE Benchmark Data and the 2006
NSSE Benchmark Data Used in the Present Study
NSSE Benchmarks Number of
Items
Cronbach’s α* Cronbach’s α of
present study
Level of Academic Challenge 11 .72 .75
Active and Collaborative Learning 7 .67 .63
Enriching Educational Experiences 12 .65 .62
Student-Faculty Interaction 5 .75 .75
Supportive Campus Environment 6 .76 .76
Note. All correlations are significant at the p <.01 level.
* Data reported from analyses using a base random sample of 2006 NSSE data by Pascarella, Seifert, & Blaich (2008).
To ensure that the Cronbach’s alphas reported in Table 5, which are representative of the
internal consistency of the entire sample, were not hindered by only one institution, further
analyses were completed (Bernardi, 1994). The Cronbach’s alphas of each benchmark at each
participating institution were computed and compared to examine the data for score reliability
across sub-samples (Onwuegbuzie & Daniel, 2004). Onwuegbuzie and Daniel (2004) determined
through empirical and theoretical methods that reliability coefficients of the entire sample can
conceal a low or high reliability of one or more subsamples, and this could impact the statistical
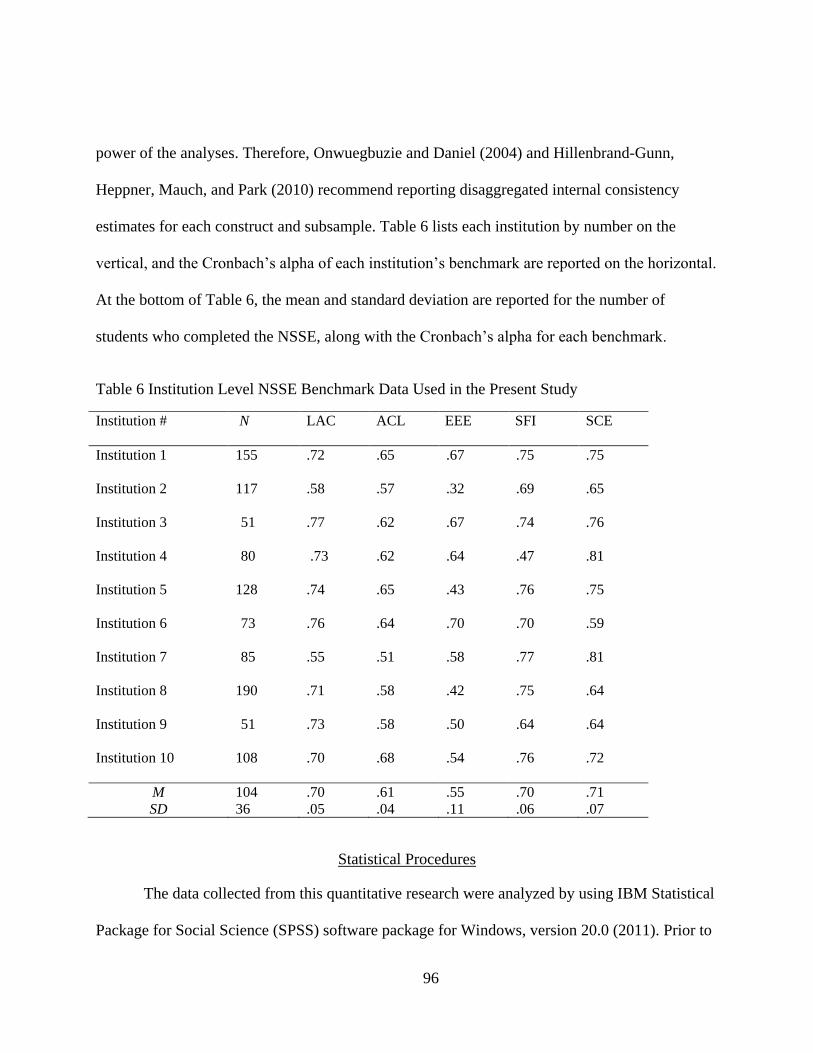
96
power of the analyses. Therefore, Onwuegbuzie and Daniel (2004) and Hillenbrand-Gunn,
Heppner, Mauch, and Park (2010) recommend reporting disaggregated internal consistency
estimates for each construct and subsample. Table 6 lists each institution by number on the
vertical, and the Cronbach’s alpha of each institution’s benchmark are reported on the horizontal.
At the bottom of Table 6, the mean and standard deviation are reported for the number of
students who completed the NSSE, along with the Cronbach’s alpha for each benchmark.
Table 6 Institution Level NSSE Benchmark Data Used in the Present Study
Institution # N LAC ACL EEE SFI SCE
Institution 1 155 .72 .65 .67 .75 .75
Institution 2 117 .58 .57 .32 .69 .65
Institution 3 51 .77 .62 .67 .74 .76
Institution 4 80 .73 .62 .64 .47 .81
Institution 5 128 .74 .65 .43 .76 .75
Institution 6 73 .76 .64 .70 .70 .59
Institution 7 85 .55 .51 .58 .77 .81
Institution 8 190 .71 .58 .42 .75 .64
Institution 9 51 .73 .58 .50 .64 .64
Institution 10 108 .70 .68 .54 .76 .72
M 104 .70 .61 .55 .70 .71
SD 36 .05 .04 .11 .06 .07
Statistical Procedures
The data collected from this quantitative research were analyzed by using IBM Statistical
Package for Social Science (SPSS) software package for Windows, version 20.0 (2011). Prior to

97
any data analysis procedures, preliminary analyses were conducted to confirm that the
assumptions of logistical regression were met. These analyses included confirming the absence
of multicollinearity and outliers, and confirming the presence of independence between the
errors and linearity of predictors with log odds of dependent variable.
Preliminary Analysis for Research Question 1
Logistical regression was a convenient method to describe the relationship between
several independent variables (e.g., the five NSSE benchmarks of student engagement) and a
response variable. Logistic regression is more flexible than other techniques, such as multiple
regression and discriminate function analysis (Tabachnick & Fidell, 2001). Logistical regression
was used to determine the odds ratio (effect size) of the independent variables (level of academic
challenge, active and collaborative learning, student-faculty interaction, supportive campus
environment, and enriching educational experience) on the dependent variable (alumni donor
participation). Logistical regression can be used to rank the importance of each predictor
variables and assess interaction effects of the independent variables.
Multicollinearity was examined prior to the analyses. Multicollinearity exists when
independent variables are correlated, and is reported as the extent to which a variable can be
explained by other variables in the analysis. Multicollinearity was tested using variable inflation
factor (VIF) and the tolerance value, as well as examination of condition indices. According to
Doane and Seward (2013), VIF should be below 10 and tolerance should be above 0.10. For the
present data set, all VIF factors were 1.91 or below, and minimum tolerance value was 0.53, so
multicollinearity was not considered to be an issue for any of the independent variables.

98
Maximum condition index was 16.52, which is slightly above 15, but well below 30. Thus, the
absence of multicollinearity was confirmed. Outliers and Influential Points were analyzed, as
outliers can massively change the shape of a distribution and cause regression to be improperly
reported as significant or not significant. Outliers were checked through Cook’s distance, df beta
(standardized Cook’s), leverage values, and standardized residuals. Cook’s distance and df beta
values should be less than one (1), leverage values should be less than 0.2, and standardized
residuals should be between -3.3 and 3.3. For the present data analysis, Cook’s distance was
0.04, maximum leverage was 0.03, standardized residuals were between -2.20 and 1.63, and df
beta values were all approximately .001 or less.
Independence between the errors ensures that the observations are not dependent upon
one another. Independence was ensured by plotting the standardized residuals for each dependent
variable against its case number (an arbitrary placement of the observation in the dataset); no
patterns were observed as case numbers increased (Long, 1997).
Linearity of predictors with log odds of dependent variable was completed by testing the
linearity of predictors with the dependent variable. The use of continuous independent predictors
makes linearity with the natural log odds of the dependent variable desirable. The assumption
was tested by multiplying each continuous independent variable by its natural log (ln) and testing
for significance in the model (Long, 1997). Only the interaction term with Enriching Educational
Experiences was significant (p < .001), and while the variable was not excluded from the model,
it was interpreted with some caution.
Upon determining that all assumptions were met and confirmed valid, further analyses
commenced, to answer the research questions.

99
Research Question One
What is the relationship between student engagement rates at Carnegie Baccalaureate
Colleges (as measured by the five NSSE 2006 benchmarks of engagement: [a] level of academic
challenge, [b] active and collaborative learning, [c] student-faculty interaction, [d] supportive
campus environment, and [e] enriching educational experience) and alumni donor participation
rates over a five year post-graduation period (2007, 2008, 2009, 2010, 2011)?
a. Dependent / Outcome Variable – Alumni donor participation rates
b. Independent / Predictor Variables – (a) level of academic challenge, (b) active and
collaborative learning, (c) student-faculty interaction, (d) supportive campus environment, and
(e) enriching educational experience.
Logistical regression analysis was conducted to investigate the ability for the predictor
variables to predict or affect alumni donor participation rates. Non-significant results of the
Hosmer and Lemeshow test, which indicates the model’s ability to accurately predict high
alumni donor participation and low alumni donor participation, χ2 (8) = 2.49, p = .96, indicated
that the model fit well. Effect sizes were defined as small, medium, or large effect, where small
is .02, moderate is .15, and large is .35 (Cohen, 1988). Cohen’s (1988) interpretation of effect
size indicates small effect size indices (Cox & Snell R2 = .05, Nagelkerke R
2 = .07). The
predictors, as a set, are statistically effective predictors of high alumni donor participation: χ2 (5)
= 53.89, p < .001. The model is best understood in terms of likelihood of the dependent variable
happening; in the present case, a value of 1 for the dependent variable corresponds to a high

100
(alumni donor participation rate greater than 16%) alumni donor participation rate school.
Exp(B) represents the odds ratios for the predictors and is the exponentiation of the coefficients.
Thus, Exp(B) column of Table 7 illustrates how each one-unit increase (because the
independents are continuous) affects changes to the likelihood of the dependent variable having a
value of 1.
Each of the five benchmarks of the NSSE is explained in terms of the impact of each one-
unit increase. Therefore, as Level of Academic Challenge (Wald = 3.87, df = 1, p < .05)
increased by one unit, the likelihood of high alumni donor participation increased by 1.1%.
Similarly, each one-unit increase in Student-Faculty Interaction (Wald = 22.66, df = 1, p < .001)
increased the likelihood of high alumni donor participation by 2.1%. However, each one-unit
increase in Active and Collaborative Learning (Wald = 28.74, df = 1, p < .001) decreased the
likelihood of high alumni donor participation by 2.7%. Similarly, each one-unit increase in
Supportive Campus Environment (Wald = 6.30, df = 1, p = .01) decreased the likelihood of high
alumni donor participation by 1.0%. Lastly, Enriching Education Environment was not
identified to be a statistically significant predictor; which may have been attributed the subscale
data was marginal passing the linearity assumption.
Furthermore, the logistic regression model accurately predicted 62.3% of the students in
the sample (25.1% for those at low giving rate schools and 86.7% for those at higher giving rate
schools). This result represents a slight increase from the 60.3% classification rate indicated by
the constant-only model that did not contain any of the predictor variables. A higher
classification rate was been preferred (e.g., 75%), so this model was not particularly strong in
predictive value.

101
The Kappa coefficient of 0.13, a measure of classification accuracy or precision (Fleiss,
1973), indicated that the model was weak at classifying the observations at a level of accuracy
moderately greater than chance. Overall, the logical regression model used in this study was
weak in indicating that student engagement rates could predict an institution’s average donor
participation rate.
Table 7 Summary of Logistic Regression Analysis for Engagement Factors Predicting
Institutional Giving Rates (N = 1,073)
Variable B SE B eB
Constant .49 .35
Level of Academic Challenge .01* .01 1.01
Active and Collaborative Learning -.03** .01 0.97
Student-Faculty Interaction .02** .01 1.02
Supportive Campus Environment -.01* .01 0.99
Enriching Educational Experiences .01 .01 1.01
χ2
53.89**
df 5
Note. eB = exponentiated B.
*p < .05. **p < .01.
Preliminary Analysis for Research Question 2
Logistical regression was a convenient method to describe the relationship between
several independent variables (e.g., personal demographics and student experience
demographics) and a response variable. Logistical regression is more flexible than other
techniques, such as multiple regression and discriminate function analysis (Tabachnick & Fidell,

102
2001). Logistical regression was used to determine the effect size of the independent variables of
Block (1) one (e.g. highest level of parental education, student nationality, and student gender)
and Block (2) two (e.g. academic major, percentage of students receiving institutional financial
support, and Greek Life affiliation) on the dependent variable (alumni donor participation rate).
Logistical regression can be used to rank the importance of predictor variables and assess
interaction effects of the independent variables (Hair et al., 2010).
Multicollinearity was tested using VIF and the tolerance value, as well as examination of
condition indices. The VIF should be below 10 and tolerance should be above 0.10 (Doane &
Seward, 2013). For the present data set, all VIF factors were 2.16 or below, and minimum
tolerance value was 0.46, so multicollinearity was not considered to be an issue for any of the
independent variables. Maximum condition index was 10.52, which is below 15. Thus, the
absence of multicollinearity was confirmed. Outliers and Influential Points were analyzed, as
outliers can massively change the shape of a distribution and cause regression to be improperly
reported as significant or not significant. Outliers were checked through Cook’s distance, df beta
(standardized Cook’s), leverage values, and standardized residuals. Cook’s distance and df beta
values should be less than one (1), leverage values should be less than 0.2, and standardized
residuals should be between -3.3 and 3.3. For the present data analysis model, Cook’s distance
was 0.20, maximum leverage was 0.002, standardized residuals were between -3.52 and 3.40,
and df beta values were all approximately .001 or less. A few of the df beta values were slightly
large, but not large enough to warrant concern (Johnson & Tsui, 1998).
Independence between the errors ensures that the observations are not dependent upon
one another (Johnson & Tsui, 1998). Independence was ensured by plotting the standardized

103
residuals for each dependent variable against its case number (an arbitrary placement of the
observation in the dataset); no patterns were observed as case numbers increased.
Linearity of predictors was not needed, as no independent variable in this model was
continuous. Upon determining that all assumptions were met and confirmed valid, further
analyses commenced, to answer the research question.
Research Question Two
What is the relationship between alumni donor participation rates and the alumni
demographic variables of: (a) parents’ education levels, (b) nationality, (c) academic major, (d)
recipient of scholarship, (e) gender, and (f) participation in Greek Life?
a. Dependent / Outcome Variable – Alumni donor participation rates
b. Independent / Predictor Variables – (a) parents’ education levels, (b) nationality, (c)
academic major, (d) recipient of scholarship, (e) gender, and (f) participation in Greek Life.
To create the analysis models, the categorical independent variables were coded and
separated into two blocks (Block 1 and Block 2). Table 8 illustrates the two-block design and
provides the binomial code used for dichotomous variables. Block (1) One contained personal
demographics (e.g. highest level of parental education, student nationality, and student gender)
and Block (2) Two contained college students’ experience (e.g. academic major, percentage of
students receiving institutional financial support, and Greek Life affiliation). Model A tested the
effect of the independent variables of Block 1 on the dependent variable, and Model B tested the
effect of the independent variables of both Blocks 1 and 2 on the dependent variable.

104
Table 8 Block Model for Research Question 2
Block 1 Block 2
Highest level of parental education
o Neither parent attempted college (the
reference category to which all other levels
of this variable were compared)
o At least one parent attempted college
o At least one parent attempted baccalaureate
o Both parents completed baccalaureate
o At least one parent attempted graduate
degree
o Both parents completed graduate degree
Academic major
o Laboratory sciences (biological
sciences, physical sciences;
reference category)
o Social sciences (arts, humanities,
education, political science)
o Business and other majors
Student nationality: non-international student
(0) and international student (1)
School level of percentage of students
receiving financial aid: 85% or less (0)
and over 85% (1)
Student gender: male (0) and female (1) Student participation in Greek
organization: non-participant (0) and
participant (1)
Model A: Personal Demographics Only
Logistical regression analysis was conducted to investigate the ability for the predictor
variables (highest level of parental education, student nationality, and student gender) to
influence the dichotomous dependent variable (high or low alumni donor participation rate).
Non-significant results of Hosmer and Lemeshow test χ2 (7) = 4.39, p = .74, indicate that the
model (parental education, nationality, and gender predicting institutional giving category) fit
well. Cohen’s (1988) interpretation of effect size indicates moderate effect size indices (Cox &
Snell, R2 = .15; Nagelkerke, R
2 = .20). The predictors, as a set, are statistically effective for
determining the likelihood of high alumni donor participation: χ2 (7)= 167.17, p < .001.
Logistic regression was used to predict the likelihood of high alumni donor participation
increasing based on each of the predictors. Data were reported as the odds ratio of alumni donor
participation rate increasing over decreasing, so that an odd ratio of 9.46 was interpreted to mean

105
that the odds of the likelihood of high alumni donor participation, greater than 16%, was 8.46
times greater if both parents completed a graduate degree. The relationship between parental
education level and the likelihood of high alumni donor participation was significant (p < 0.05),
and each increasing level of parental education beyond not having ever attempted college
significantly increased the likelihood of high alumni donor participation by the following
percentages (as compared to having parents who never attempted college). In cases in which at
least one parent attempted college, the likelihood increased by 101.7% (Wald = 9.00, df = 1, p =
.003), and in cases in which at least one parent attempted baccalaureate study the likelihood
increased by 369.7% (Wald = 38.20, df = 1, p < .001). Completion of a baccalaureate by both
parents showed statistically significant increases (p < 0.001); in such cases, the likelihood
increased by 575.1% (Wald = 53.05, df = 1, p < .001). Furthermore, in cases in which at least
one parent attempted graduate study, the likelihood increased by 726.8% (Wald = 80.92, df = 1,
p < .001), and in cases in which both parents completed graduate study the likelihood increased
by 846.1% (Wald = 70.13, df = 1, p < .001). In contrast, being an international student decreased
the likelihood of high alumni donor participation by 82% (Wald = 21.65, df = 1, p < .001).
Gender was not identified as a significant predictor of alumni donor participation rates.
Regression results are shown in Table 8 (Model A).
The logistic regression model predicted 70.3% of the students in the sample (57.6% for
those at low alumni donor participation rate institutions and 78.6% for those at high alumni
donor participation rate institutions). This result represents an increase from the 60.5%
classification rate indicated by the constant-only model that did not contain any of the predictor

106
variables. Ideally, a classification rate of 75% is preferred (Miller, Hui, & Tierney, 1991), so the
tested model with these data met the desired strength in predictive value.
Model B: Personal Demographics of Block 1 and College Student Experiences of Block 2
Logistical regression analysis was conducted to investigate the ability for the predictor
variables (of Blocks 1 and 2) to influence alumni donor participation rates. Significant results of
the Hosmer and Lemeshow test, χ2 (8) = 25.86, p < .001 indicate that the model (academic
major, institutional financial aid status, and Greek affiliation added to the existing model of
parental education, nationality, and gender predicting institutional giving category) did not
necessarily fit well, but this test alone does not dictate model fit.
Cohen’s (1988) interpretation of effect size indicates moderate to large effect size indices
(Cox & Snell, R2 = .29; Nagelkerke, R
2 = .39). The predictors, as a set, serve as a statistically
significant addition, serving as predictors of high alumni donor participation: χ2 (4) = 189.13, p <
.001. Overall, the model tested with these predictors was statistically significant: χ2 (11) =
356.30, p < .001.
Logistical regression was used to predict the likelihood of high alumni donor
participation increasing based on each of the predictors. Like Model A, data were reported as the
odds ratio of alumni donor participation rate increasing over decreasing. The relationship
between parent education level and high alumni donor participation is significant (p < 0.05), and
each increasing level of parental education beyond not having ever attempted college
significantly increased the likelihood of high alumni donor participation by the following
percentages. In cases in which at least one parent attempted college, the likelihood increased by
72.9% (Wald = 4.29, df = 1, p = .04), and in cases in which at least one parent attempted

107
baccalaureate study the likelihood increased by 365.5% (Wald = 30.77, df = 1, p < .001).
Completion of a baccalaureate by both parents showed significant increases (p < 0.001); in such
cases, the likelihood increased by 491.0% (Wald = 37.05, df = 1, p < .001). Furthermore, in cases
in which at least one parent attempted graduate study, the likelihood increased by 622.9% (Wald
= 55.74, df = 1, p < .001), and in cases in which both parents completed graduate study, the
likelihood increased by 802.2% (Wald = 53.11, df = 1, p < .001). Majoring in business, as
compared to the laboratory sciences, was associated with a 44.3% decrease in the likelihood of
high alumni donor participation by 44.3% (Wald = 5.45, df = 1, p = .02). However, majoring in
the social sciences was not found to be a significant predictor. Receiving institutional financial
aid also increased the likelihood of high alumni donor participation by 187.6% (Wald = 43.70, df
= 1, p < .001). Being a member of a Greek organization increased the likelihood of high alumni
donor participation by 726.2% (Wald = 89.95, df = 1, p < .001). Gender was not identified to be
a predictor for high alumni donor participation.
The regression results are presented in Table 9 (Model B).
Furthermore, the logistic regression model predicted 74.2% of the students in the sample
(59.5% for those at low giving rate schools and 83.8% for those at higher giving rate schools).
This result represents an increase from the 60.5% classification rate indicated by the constant-
only model that did not contain any of the predictor variables, but only a slight increase from the
model that only contained personal demographics.
Ideally, a classification rate of 0.75 is sought (Miller et al., 1991); therefore, the tested
model with these data was close to meeting the desired strength in predictive value. The Kappa
coefficient of 0.45 further indicated that the model was moderately strong for classifying the

108
observations at a level of accuracy or precision (Fleiss, 1973). Overall, results indicated that
student demographic qualities predicted the likelihood of high alumni donor participation.
Table 9 Summary of Logistic Regression Analysis for Demographic Factors Predicting
Institutional Giving Rates (N = 1,060)
Model A
Model B
Variable B SE B eB B SE B e
B
Constant -0.80
-1.40
Parental Education
One start bacc 0.70** .23 2.02
0.55* .27 1.73
One finish bacc 1.55** .25 4.70
1.54** .28 4.66
Both finish bacc 1.91** .26 6.75
1.78** .29 5.91
One finish grad 2.11** .24 8.27
1.98** .27 7.23
Both finish grad 2.25** .27 9.46
2.20** .30 9.02
International student -1.72** .37 0.18
-1.52** .39 0.22
Gender -0.17 .16 0.84
-0.30 .18 0.74
Major
Social sciences
0.12 .23 1.13
Business/other
-0.59* .25 0.56
School financial aid
1.06** .16 2.88
Greek affiliation
2.11** .22 8.26
χ2
167.17**
356.30**
df 7 11 Note. eB = exponentiated B. Neither parent attempting college is reference category for parental education. Laboratory-sciences is the
reference category for major. Gender is coded as 1 for female and 0 for male. School financial aid is coded as 1 for over 85% receiving
aid and 0 for 85% and under. All other variables are coded as 1 for yes and 0 for no. *p < .05. **p < .01.
109
Summary
This quantitative correlational study was conducted to examine the relationship between
the NSSE benchmarks of student engagement and student demographic factors and alumni donor
participation rates at Carnegie Baccalaureate Colleges. In all, 10 Carnegie Baccalaureate
Colleges located in the southeastern region of the United States provided alumni donor
participation data and participated in this study. The NSSE student engagement benchmark
variables of level of academic challenge, active and collaborative learning, student-faculty
interaction, supportive campus environment, and enriching educational experience, as well as the
student demographic variables of highest level of parental education, student nationality, student
gender, academic major, percentage of students receiving institutional financial support, and
Greek Life affiliation were investigated to determine if they could be used, either independently
or in combination, to predict alumni donor participation rates.
Descriptive statistics and logistical regression models were used to analyze the effect size
of the predictor variables on the binomial dependent variable. The NSSE benchmarks of Level of
Academic Challenge and Student-Faculty Interaction increased the likelihood of alumni donor
participation, while active and collaborative learning and student campus environment were
found to decrease the likelihood of alumni donor participation. Furthermore, affiliation with
Greek Life during college, the education level of parents, and receiving institutional financial aid
were shown to increase the likelihood of high alumni donor participation, while being an
international student decreased this likelihood. Majoring in business, when compared to the
laboratory sciences, decreased the likelihood of high alumni donor participation, and gender was

110
not found to be a significant predictor. The implications of this study’s findings and
recommendations for future research are presented in Chapter Five.
111
CHAPTER FIVE: DISCUSSION
Introduction
The primary purpose of this study was to examine the relationship between student
engagement, demographic variables, and alumni donor participation rates of senior class cohorts
who graduated from liberal arts colleges located in the southeastern region of the United States
in 2006. The relationship between the level of student engagement, demographic variables, and
alumni donor participation rates were examined over a five-year post-graduation period. Chapter
Five presents a discussion of the results of this study. The chapter begins with a brief overview
of the study; continues with a review of the data presented in Chapter Four and a comparison to
the research findings presented in Chapter Two, with discussion of congruency and
inconsistency of the findings; and concludes with a discussion of the study’s limitations,
implications, and recommendations for future research.
Overview of the Study
This study employed logistical regression analysis to investigate the relationship and
determine the predictive power of the National Survey of Student Engagement (NSSE)
benchmark scores and student demographic variables on alumni donor participation. The sample
was composed of a multi-state selection of Carnegie Baccalaureate Colleges located in the
southeastern region of the United States. Data obtained from the NSSE and the participating
colleges were analyzed using the Statistical Package for Social Sciences (SPSS) 20.0. Logistical
regression was performed on each variable presented in the research questions to determine
whether a statistically significant relationship at the 0.05 alpha level existed. Internal

112
consistencies for the NSSE benchmarks were examined and represented by Cronbach’s alpha
coefficient analysis. By controlling for Carnegie Classification of institutions and graduating
class year, the analyses may provide value to institutions that participate in the annual
administrations of the NSSE and similar populations and samples. Published research has
examined the effects of student experience and demographic characteristics on alumni donor
participation rate (Field, 2011); however, a gap in the literature was identified regarding the
relationship between student engagement, student demographics, and alumni donor participation
rates.
Understanding of the relationship between student engagement, student demographics,
and alumni donor participation aids higher education leaders seeking to impact alumni donor
participation rates, by assessing engagement. The increased understanding of student
engagement factors correlating with alumni donor participation rates may be supported through
providing more interaction between student affairs and academic affairs; enabling institutions to
employ data-driven decision-making when allocating resources to support activities that engage
and enhance students’ experiences, strengthen students’ success, and increase alumni donor
participation (Field, 2011).
The selection criteria for the study identified 40 potential participant institutions, and a
senior administrator (e.g., director or vice president of alumni affairs) at each institution was
contacted. Of the 40 institutions contacted, 10 senior administrators provided the requested
information, yielding a usable response rate of 25%. The alumni donor participation rate was
determined for each institution using the following formula: Alumni donor participation rate = #
of alumni donors from the undergraduate class of 2006 / # of undergraduates who graduated in
113
2006. The alumni donor participation rate for the class of 2006 was measured over time by
keeping the denominator constant, and obtaining the total number of alumni donors from the
class of 2006 who gave in 2007, 2008, 2009, 2010, and 2011. However, due to the
confidentiality of student level NSSE responses, the alumni donor participation rates provided by
each institution were not able to be matched to their respective 2006 senior class cohort NSSE
responses. Therefore, the 10 institutions were dichotomized by the NSSE and categorically
separated into two groups of five: (a) five institutions with alumni donor participation rates of
less than 12% and (b) five institutions with alumni donor participation rates greater than 16%.
The categorical dichotomization was based upon the institutions’ alumni donor participation rate
of the 2006 senior class cohort. The sample of student data provided by the NSSE was based
upon a selection of 75% of the total responses collected by the NSSE during the 2006
administration at each institution. In all, the findings highlight relationships between student
engagement, student demographics, and alumni donor participation rates, but the findings should
be used with caution.
Internal Consistency of NSSE
Validity refers to the concept that an instrument measures what it was designed to
measure, and is often regarded as the most important determinant of the assessment tool
(Osborne, 2013). Kuh (2001a) and others underscore the importance of validity and describe the
arduous process of ensuring that the NSSE survey items were clearly worded, well-defined,
unambiguous, and possessed high content validity, especially with regard to the scoring of
benchmark constructs. The NSSE contains over 100 items that are dichotomously scored or have

114
a limited number of responses; these items are categorized and inform the score for each of the
five benchmarks, also referred to as constructs (Kuh, 2001). The five NSSE benchmarks are used
as a basis for comparison of institutions; however, Bryan, Eagle, Wright, and Icenogle (2012)
found, based on data collected from the 2005 and 2006 NSSE administration at individual
private liberal arts colleges, that the NSSE does not possess benchmarks that permit a high
degree of construct validity determination and does not support the five factor model provided by
Kuh (2001a). Furthermore, critiques of scholars have indicated that unambiguous, well-defined
wording and the ability of items to be codified to a benchmark do not exclusively indicate
reliability and consistency (Porter, 2011), and information about score reliability is critical to
assess internal validity. Therefore, prior to any data analysis, a thorough review and examination
of the data was completed.
Reliability of Data
Reliability is properly presented only when it is discussed in relation to the data
(Osborne, 2013); furthermore, measures of internal consistency are critical for reporting the
instrument used to collect data, and are a property of data, not an instrument (Leech et al., 2011).
When used to analyze responses to items on an instrument such as the NSSE, Cronbach’s alpha
“is an indication of how well the different items complement each other in their measurement of
different aspects of the same variable or quality [construct/benchmark]” (Litwin, 2003, p. 22).
Cronbach’s alphas are reported in a range between zero and one. Alphas closer to one indicate a
higher internal consistency, and alphas closer to zero indicate a lower internal consistency.
Groups and constructs with Cronbach’s alphas greater than 0.70 are acceptable, but Cronbach’s

115
alpha of 0.60 are questionable and should be used with caution (McMillan & Schumacher, 2000;
Kline 2011), and further tests for inter-item analysis and item-to-scale correlations should be
completed (Clark & Watson, 1995).
Leech and colleagues (2011) state, “Cronbach’s coefficient alpha are by far the most
commonly used indices to determine internal consistency reliability estimates for scores from
instruments that are dichotomously scored and that have a specific number of fixed response
options” (p. 117). Therefore, Cronbach’s alphas for the present study do not indicate the
reliability of NSSE, but instead indicate the reliability of the data collected by the NSSE and
used in this study. Although appropriate ranges of Cronbach’s alphas can vary by individual
instrument and data collection procedures (Onwuegbuzie & Daniel, 2002), alpha is an estimate
of error in a measure, and reduced reliability can negatively impact estimates of effect sizes
when the internal consistency is questionable, and when alpha is .70 or below, the researcher can
underestimate the effects by more than 50% (Osborne, 2013).
Osborne (2013) suggests a process of data cleaning procedures prior to any analysis, so
upon completion, the data for this study were analyzed as one aggregated data set. The
Cronbach’s alphas of the aggregated NSSE data were calculated, and are reported in Table 10.
The Cronbach’s alpha indicated that at least two benchmarks (e.g., Active and Collaborative
Learning and Enriching Educational Experiences) were below the minimum needed for
reliability (Osborne, 2013).
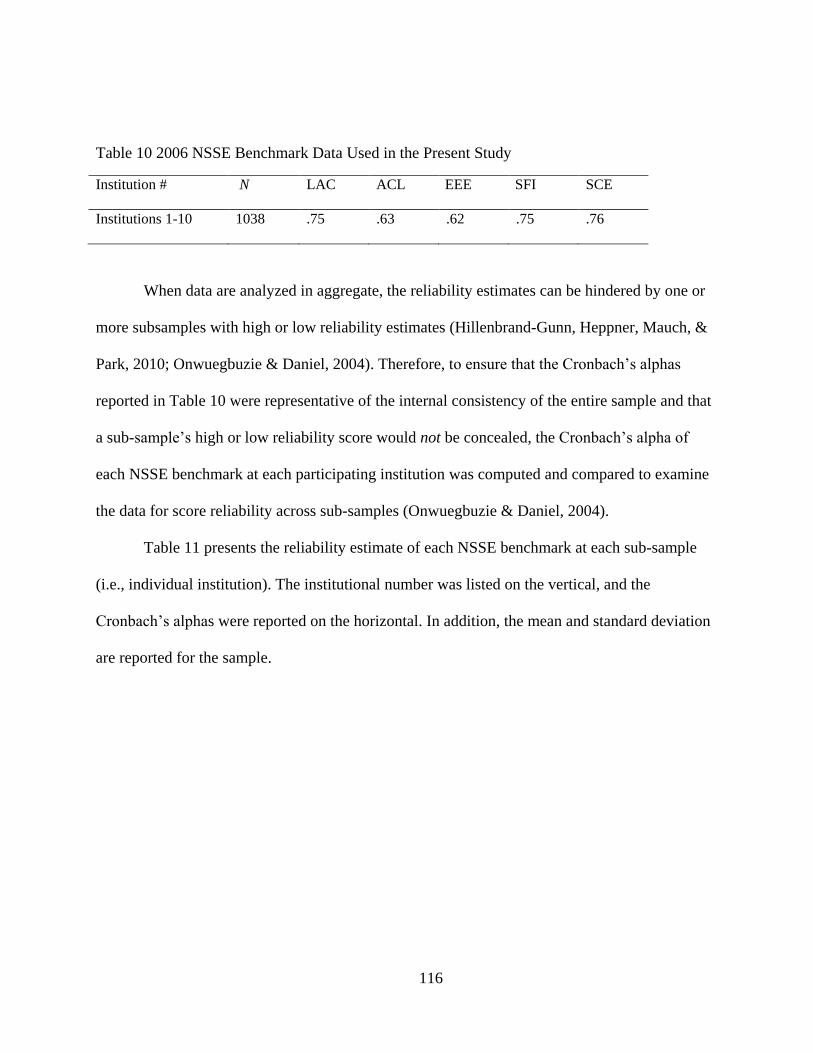
116
Table 10 2006 NSSE Benchmark Data Used in the Present Study
Institution # N LAC ACL EEE SFI SCE
Institutions 1-10 1038 .75 .63 .62 .75 .76
When data are analyzed in aggregate, the reliability estimates can be hindered by one or
more subsamples with high or low reliability estimates (Hillenbrand-Gunn, Heppner, Mauch, &
Park, 2010; Onwuegbuzie & Daniel, 2004). Therefore, to ensure that the Cronbach’s alphas
reported in Table 10 were representative of the internal consistency of the entire sample and that
a sub-sample’s high or low reliability score would not be concealed, the Cronbach’s alpha of
each NSSE benchmark at each participating institution was computed and compared to examine
the data for score reliability across sub-samples (Onwuegbuzie & Daniel, 2004).
Table 11 presents the reliability estimate of each NSSE benchmark at each sub-sample
(i.e., individual institution). The institutional number was listed on the vertical, and the
Cronbach’s alphas were reported on the horizontal. In addition, the mean and standard deviation
are reported for the sample.

117
Table 11 Institution Level NSSE Benchmark Data Used in the Present Study
Institution # N LAC ACL EEE SFI SCE
Institution 1 155 .72 .65 .67 .75 .75
Institution 2 117 .58 .57 .32 .69 .65
Institution 3 51 .77 .62 .67 .74 .76
Institution 4 80 .73 .62 .64 .47 .81
Institution 5 128 .74 .65 .43 .76 .75
Institution 6 73 .76 .64 .70 .70 .59
Institution 7 85 .55 .51 .58 .77 .81
Institution 8 190 .71 .58 .42 .75 .64
Institution 9 51 .73 .58 .50 .64 .64
Institution 10 108 .70 .68 .54 .76 .72
M 104 .70 .61 .55 .70 .71
SD 36 .05 .04 .11 .06 .07
The possible range for each benchmark measurement was 0 – 1.00, where higher score
indicated higher internal consistency. The obtained range among sub-samples for Level of
Academic Challenge was 0.55 – 0.77 with a mean score of 0.70 (SD = .05), Active and
Collaborative Learning scores ranged from 0.51 – 0.68 with a mean of 0.61 (SD = .04), Student-
Faculty Interaction scores ranged from 0.47 – 0.77 with a mean of 0.70 (SD = .06), Enriching
Educational Experiences scores ranged from 0.32 – 0.70 with a mean of 0.55 (SD = .11), and
Supportive Campus Environment scores ranged from 0.59 – 0.81 with a mean of 0.71 (SD = .07).
Nevertheless, further analyses of the NSSE data by subsample did not yield results to alleviate
the questionable data concerns reported in Table 10. The concerns regarding the questionability

118
of NSSE data was reported by other scholars (e.g., Campbell & Cabrera, 2011; Olivas, 2011;
Porter, 2011). Therefore, the findings were questionable and should be used with caution.
Discussion of Findings
The research questions guiding this study sought to examine the relationship between
student engagement theory (Chickering & Gamson, 1987, 1991; Kuh, 2001) and alumni donor
participation theory. As confidentiality of the data restricted the matching of individual students’
engagement and demographics data with their respective alumni donor participation data, all data
were used in aggregate and the findings are presented in relation to characteristics of the
institution. Therefore, the findings of this study describe the effect of the independent variables
on the likelihood (odds ratio) of high alumni donor participation.
Research Question One
Research question one explored the relationship between senior class student engagement
rates at Carnegie Baccalaureate Colleges (as measured by the five NSSE 2006 benchmarks of
engagement: [a] level of academic challenge; [b] active and collaborative learning; [c] student-
faculty interaction; [d] supportive campus environment; and [e] enriching educational
experience), and alumni donor participation rates over a five year post-graduation period (2007,
2008, 2009, 2010, 2011).
Statistical Significance
As the dependent variable was dichotomous (group one or group two), logistical
regression was used to predict the likelihood of high alumni donor participation increasing based

119
on each of the predictors. Non-significant results of Hosmer and Lemeshow test, χ2 (8) = 2.49, p
= .96, indicated that the five NSSE benchmarks for predicting institutional giving fit well for the
model. Effect sizes were defined as small, medium, or large effect, where small is .02, moderate
is .15, and large is .35 (Cohen, 1988). Cohen’s (1988) interpretation of effect size indicates small
effect size indices (Cox & Snell R2 = .05, Nagelkerke R
2 = .07). The predictors, as a set, are
statistically effective predictors of high alumni donor participation: χ2 (5) = 53.89, p < .001.
The findings of the logistical regression model identified that Level of Academic
Challenge and Student Faculty Interaction increased the likelihood of high alumni donor
participation; however, each had a small effect size (Cohen, 1988). Level of Academic Challenge
(Wald = 3.87, df = 1, p < .05)—a NSSE factor/subscale scoring the amount of time a student
spends preparing for class, reading and writing to complete assignments and perceives the
institution’s expectations for high academic performance—increased the likelihood of high
alumni donor participation by 1.1%. Level of Academic Challenge influences student
satisfaction (Martin, 2012; Pauley, 2011), and satisfaction with college experience is regarded as
a strong predictor of future alumni donor participation (Burt, 1989; Drew-Branch, 2011; Gaier,
2005; Van Horn, 2002; Zhao & Kuh, 2004). Student-Faculty Interaction (Wald = 22.66, df = 1, p
< .001) was found to increase the likelihood of high alumni donor participation by 2.1%.
Two NSSE benchmarks were found to decrease the likelihood of high alumni donor
participation; however, each had a small effect size (Cohen, 1988). Active and Collaborative
Learning (Wald = 28.74, df = 1, p < .001)—a NSSE factor/subscale that measures a student’s
class participation through class presentations, group work outside of class and work on
community service projects—decreased the likelihood of high alumni donor participation by

120
2.7%. Supportive Campus Environment (Wald = 6.30, df = 1, p = .01)—a NSSE factor/subscale
that scores a student’s perception of campus climate, how the campus environment supports their
growth academically and socially through relations with peers and understanding of self,
character development, and cope with non-academic responsibilities—decreased the likelihood
of high alumni donor participation by 1.0%. Therefore, four student engagement factors (NSSE)
correlated with alumni donor participation; however, the effect sizes for the four correlates were
small (Cohen, 1988), mitigating the practical significant of these findings.
Substantive Significance
Substantive significance provides the relevance and real-world meaningfulness of
statistical findings in the context of the research question (Miller, 2008). Two benchmarks, Level
of Academic Challenge and Student-Faculty Interaction increased the likelihood of high alumni
donor participation within these data. The impact of each benchmark was assessed for causality,
direction, and magnitude; however, assessing the importance of coefficients on categorical and
continuous variables can be challenging and convolutes the statistical significance; thus,
illustrating a need to discuss substantive significance (Miller, 2008).
Pearson (1999) found that
the relationship alumni have with the university begins with their experience as students
[e.g., Level of Academic Challenge], and, not surprisingly, satisfaction with the student
experience is the single most essential pre-condition for giving. Few Stanford alumni
who are not satisfied with their student experience are donors. (p. 3)

121
Therefore, the findings identified a positive correlation between student engagement and alumni
donor participation and were congruent with Pearson’s results; satisfaction with college
experience is influenced by quality relationships with faculty members (Astin, 2001). The
identified relationship between student-faculty interaction and alumni donor participation was
anticipated as student-faculty interactions are credited with increasing persistence, especially
among students from minority and underrepresented populations (Pascarella & Terenzini, 2001),
and the relationship between students and faculty members shows “substantial positive
correlations with all other areas of student satisfaction” (Astin, 2001, p. 383). Despite the
limitations noted in the current investigation (e.g., aggregated data, poor internal consistency
reliability with the NSSE), the findings identifying a relationship between student engagement
and alumni donor participation were congruent with the findings of others.
Although the NSSE factors of Level of Academic Challenge and Student-Faculty
Interaction correlated with alumni donor participation at the .05 alpha level, the odds ratio (effect
size) of the independent variables (level of academic challenge and student-faculty interaction)
on the dependent variable (alumni donor participation) alumni donor participation was small
(Cohen, 1988), 1.0% and 2.1%, respectively.
The negative correlation between alumni donor participation and the two NSSE factors
Active and Collaborative Learning and Supportive Campus Environment was unexpected, as the
NSSE items that score the factors are associated with student satisfaction. However, the
identified negative correlation may indicate the presence of suppressor effects, which “occur
when a predictor has a significant effect but one when another variable is held constant” (Field,
2009, p. 213). Further research on the NSSE Active and Collaborative Learning factor and

122
alumni donor participation is warranted to further examine this finding. The weakness of the
alumni donor participation model, indicated by the Kappa coefficient, and the limitations of
NSSE instrument affect the substantive statistical interpretation and warrant caution when
considering the foregoing statistical inferences.
Research Question Two
Research question two examined the relationship between alumni donor participation
rates and the alumni demographic variables of: (a) parents’ education levels, (b) nationality, (c)
academic major, (d) recipient of scholarship, (e) gender, and (f) participation in Greek Life.
Logistic regression was used to predict the odds of high alumni donor participation increase
based on each of the predictors.
To create the analysis models, the categorical independent variables were coded and
separated into two blocks (Block 1 and Block 2). Table 8 illustrates the two-block design and
provides the binomial code used for dichotomous variables. Block (1) One contained personal
demographics (e.g. highest level of parental education, student nationality, and student gender)
and Block (2) Two contained college students’ experience (e.g. academic major, percentage of
students receiving institutional financial support, and Greek Life affiliation). Model A tested the
effect of the independent variables of Block 1 on the dependent variable, and Model B tested the
effect of the independent variables of both Blocks 1 and 2 on the dependent variable.
Logistical regression analysis was conducted to investigate the ability for the predictor
variables (highest level of parental education, student nationality, and student gender) to
influence the dichotomous dependent variable (alumni donor participation rate); results were

123
presented in Table 9 (Model A). The Kappa coefficient of 0.45 further indicated that the models
were moderately strong for classifying the observations (Fleiss, 1973). Overall, the findings
indicated statistical significance for several student demographics that increase the likelihood of
high alumni donor participation.
Statistical Significance
Model A
Model A comprised only personal demographics, Block 1. The relationship between
parent education level and the likelihood of high alumni donor participation was statistically
significant (p < 0.05). In cases that at least one parent attempted college, the likelihood of high
alumni donor participation increased by 101.7% (Wald = 9.00, df = 1, p = .003), and in cases in
which at least one parent attempted baccalaureate study, the likelihood increased by 369.7%
(Wald = 38.20, df = 1, p < .001). Completion of a baccalaureate by both parents showed
statistically significant increases (p < 0.001); in such cases, the likelihood increased by 575.1%
(Wald = 53.05, df = 1, p < .001). Furthermore, in cases in which at least one parent attempted
graduate study, the likelihood increased by 726.8% (Wald = 80.92, df = 1, p < .001), and in cases
in which both parents completed graduate study, the likelihood increased by 846.1% (Wald =
70.13, df = 1, p < .001). The results of the present study identified that parent education level had
a strong impact (large effect sizes) on the likelihood of higher alumni donor participation.
Students who identified as an international student decreased the likelihood of high
alumni donor participation by 82% (Wald = 21.65, df = 1, p < .001). Gender was not found to be
a significant predictor of alumni donor participation.

124
Model B
The relationship between parent education level and the likelihood of high alumni donor
participation was significant (p < 0.05), and each increasing level of parental education beyond
not having ever attempted college significantly increased the likelihood of high alumni donor
participation. In cases in which at least one parent attempted college, the likelihood increased by
72.9% (Wald = 4.29, df = 1, p = .04), and in cases in which at least one parent attempted
baccalaureate study, the likelihood increased by 365.5% (Wald = 30.77, df = 1, p < .001).
Completion of a baccalaureate by both parents showed statistically significant increases (p <
0.001); in such cases, the likelihood increased by 491.0% (Wald = 37.05, df = 1, p < .001).
Furthermore, in cases in which at least one parent attempted graduate study, the likelihood
increased by 622.9% (Wald = 55.74, df = 1, p < .001), and in cases in which both parents
completed graduate study, the likelihood increased by 802.2% (Wald = 53.11, df = 1, p < .001).
Majoring in business, as compared to the laboratory sciences, decreased the likelihood by 44.3%
(Wald = 5.45, df = 1, p = .02), and majoring in the social sciences was not found to be a
statistically significant predictor. Receiving financial aid also increased the likelihood of high
alumni donor participation by 187.6% (Wald = 43.70, df = 1, p < .001). Greek Life Affiliation
increased the likelihood of high alumni donor participation by 726.2% (Wald = 89.95, df = 1, p <
.001). In Model B, like in Model A, Gender was not found to be a predictor of alumni donor
participation.

125
Substantive Significance
Institutional giving models are used based upon the readily available data, and few
provided insight for predicting gifts or their likelihood (Okunade & Berl, 1997). Consequently,
the research questions proposed sought to use data that was readily via NSSE, and examined the
predictability of the NSSE factors/benchmarks despite the limitations of a dichotomous
dependent variable. The effect of level of parent education on alumni donor participation was
strong (large effect sizes); however, the association between parent education level and alumni
donor participation was not examined in the literature; therefore, substantive significance is
interpreted within the context of “study design, measurement of variables, or model
specification” (Miller, 2008, p.7). Therefore, additional research is warranted to examine the
relationship between parent education and alumni donor participation in other sample of college
students.
The study design may account for the parents’ level of education finding as institutions
have recognized the increasing importance of first-generation college alumni. Andrade,
Rodriguez-Ingle, and Diaz-Rios (2001) report that a there is a proportion of first-generation
students who “sometimes have ambivalent attitudes about their college experiences and…there is
not a great deal known about how first-generation and/or minority students feel about alumni
affairs” (p.3). Variables that positively impact alumni donor participation were consistent with
previously published research including Greek Life participation (Harrison et al., 1995; O’Neil,
2005), academic major (Dugan et al., 2000; Shadoian, 1989; Haddad, 1986) institutional
scholarship recipient (Hoyt, 2004; Marr, Mullin, & Siegfried, 2005).

126
Gender was not found to correlate with alumni donor participation; however, Miller
(2008) suggests that a finding contrary to traditional reasoning or hypothesis may be “highly
substantive significant” (p. 7). When considering variables that others have found statistically
significant, Miller (2008) recommends to consider that the present
analysis might have been based on data from a study design that is better suited for
assessing causality than were previous studies… [or] the analysis might involve a sample
in which there is no association between the variables, even if a statistically significant
association has been observed in a different time, place, or subgroup. (p. 8)
Therefore, the inconsistent findings regarding the relationship between gender and alumni donor
participation necessitate further inquiry. In light of NSSE’s limitations, the reliability of self-
report instruments, and the confidentiality restrictions that prevented causality investigations, the
foregoing results are provided with the understanding that the student demographics warrant
further investigation.
Limitations of the Study
Research Design
This study investigated the relationship between mean score of student engagement
benchmarks and average of alumni giving. However, a model with student-level data, rather than
institutional-level, would be more revealing and might aid in the identification of student
engagement behaviors or activities, as assessed by the NSSE, that contribute to alumni donor
participation. Furthermore, the confidentiality restrictions of student level data limited the
interpretation of the results. Obtaining the unmodified NSSE responses for each student and

127
matching individual students’ responses with their respective alumni donor participation records
may have provided better descriptions of the relationship between a student’s engagement and
demographics and alumni donor participation.
An additional limitation may be sample size. Of the 154 liberal arts colleges in the
Southeastern United States (IPEDS, 2012), this study’s selectivity criteria narrowed the target
population to 40 institutions. Of the target population, a population of 10 institutions chose to
participate in the study, and a sample of student NSSE responses at the 10 institutions was
obtained (N = 1,130). Institutions that did not participate may have different qualities from those
that did; therefore, the 10 institutions that did participate may not be representative of liberal arts
colleges in the Southeastern United States and these limitations should be considered when
attempting to generalize the results of this study. Furthermore, with flexibility in research design,
definitions and classifications of variables, outcomes and analytical procedures may allow bias
(Ioannidis, 2005); however, this could be curtailed in future studies “through enhanced research
standards” (Ioannidis, 2005, p. 701).
Sampling
The sample for this study consisted of seniors graduating in the spring semester of 2006.
Seniors are often regarded as having multiple responsibilities to balance (e.g., graduate school,
finding employment, marriage, etc.), so the time spent responding to the NSSE could have
distracted senior class respondents from other obligations and might have impacted the amount
of time they spent thinking about their responses. Furthermore, self-response surveys are
inherently crippled with limitations. In the present study both alumni donor participation and

128
institutional student data were collected through self-report instruments. Inherent validity threats
of self-report instruments existed, as participants might have exaggerated or minimized to
portray themselves in a favorable light. Furthermore, participants may have failed to recall
specific instances when responding to NSSE items and some may have perceived the NSSE
items to be leading (LaNasa, Cabrera, & Transgrud, 2009; Pascarella et al., 2010).
Instrumentation
Kuh (2001b) and others have described the NSSE as the basis for comparison of student
engagement and institutional quality. The limitation experienced in the present study relates to
the reliability of the data that is being collected using the NSSE instrument, specifically with
regard to Cronbach’s alpha. Reliability measurements in the present study indicated that there
were large variations in the responses obtained by the NSSE. Reliability measurements such as
these could be due to the respondents; however, there could also be an underlying issue of
reliability with the NSSE instrument and how the items of the NSSE are informing the
instrument’s constructs.
Cronbach’s alpha for the present study were consistent with others that used 2006 NSSE
data, such as Pascarella et al. (2008), and little variation was found. The Cronbach’s alpha
obtained of the data used in the present study further limits the generalizability and warrants
ongoing investigation of the NSSE instrument and its ability to measure student engagement.
Implications
This study’s findings contribute to the higher education literature. Specifically, the
findings may support academicians and assist development professionals at Baccalaureate

129
institutions in the efficient canvassing of donor databases, utilizing alumni-specific data to
predict propensity towards alumni donor participation (Okunade & Berl, 1997). Academic
institutions are composed of offices and departments that are simultaneously autonomous and
interdependent. Alumni affairs traditionally focuses on efforts to connect and involve alumni
with reunions and giving campaigns that support scholarships, fellowships, and endowments, yet
miss the institution’s programmatic needs to engage students in sustainable activities. Academic
affairs professionals maintain student records, transcripts, promote learning, and administer
policy that affects student-faculty interactions. The interactions that students have with academic
affairs professionals and faculty impact their perception of the institution and its priorities. Level
of parents’ education was found to be a significant predictor of alumni donor participation, and
may be useful when combing demographical data for prospective donors. Furthermore, as
colleges have developed programmatic initiatives to inform and support transition for first
generation students, the finding could be used to share alumni donor participation expectations
with first generation college students.
Student affairs professionals are an ideal group to help alumni affairs develop
programmatic initiatives that can assist the development office in its long-term strategy. Student
affairs offices are also one of the first offices on campus to interact with students and share on
campus activities and opportunities for involvement, such as Greek Life which was shown to
positively affect alumni donor participation. Furthermore, student affairs offices tend to make
lasting connections with students who were actively involved with on-campus activities and
could provide feedback to the alumni affairs offices regarding strategies to engage and involve
alumni. A relationship between student engagement and alumni donor participation was

130
identified; however, the effect size was small. Level of academic challenge and student-faculty
interaction play in alumni donor participation, professionals in alumni affairs, student affairs, and
academic affairs should consider partnering with their programming and activities to engage
students in activities that impact alumni donor participation. Leveraging relationships to
judiciously allocate resources and optimize messaging may increase positive connections and
impact how students feel about their college experiences, thereby increasing alumni donor
participation rates. The findings of the current study may help inform future alumni giving
research and provide for broader uses of NSSE; however, due to the reliability concerns
previously stated and the effect sizes, the implications and recommendations discussed should be
interpreted and used with caution.
Recommendations for Future Research
Much of the alumni giving literature in higher education is written by practitioners and
focuses on practical strategies for alumni donor cultivation and retention. However, the current
study contributes to the literature through the development of a conceptual model, The Student-
Centered Model of Alumni Donor Participation, by focusing on students and how their
experiences, demographics, and levels of engagement contribute to their alumni donor
participation. There is a need to test the model at other institutions and to further refine the
constructs of the model through data analysis. An institution should construct NSSE items that
are appropriate for the institution’s need to fully benefit from these recommendations (Pike,
2006). Future studies could contribute to the understanding student-focused philanthropy by
testing the constructs and variables of the model or selecting constructs unique to an institution

131
of interest. In addition, further examination of NSSE’s construct and factorial validity is
warranted. In the present study, testing of constructs was impaired due to confidentiality
restrictions placed upon student-level data. Researchers who are able to obtain student-level
NSSE responses and student-level alumni donor participation data could test the model and
larger sample sizes could contribute to the understanding of how NSSE responses can be used to
predict alumni donor participation. Other scholars who have investigated the construct validity of
the NSSE found that the NSSE has failed to provide a reliable measurement of college student
engagement (Campbell & Cabrera, 2011; LaNasa et al., 2009; Porter, 2011).
Furthermore, this study sought only responses from senior class students, so it was
preselecting for those who had integrated into the college environment through institutional
interventions of academic and social systems, as suggested in Tinto’s (1993; 1998) model of
student departure. Therefore, it may be of benefit to understand the changes that occur over the
four years spent in college. This could be made possible through comparing the NSSE responses
of an entering and leaving class cohort with regards to how their responses to the items on the
NSSE changed, especially those items that have indicated relevance to alumni donor
participation. However, to compare freshman and senior year responses would require access to
student-level data so that individuals could be matched. This comparison would shed light on
how students move through a process of institutional and social boundaries and conform to a
mean, a process often referred to as “being institutionalized.” On average, a student will spend
more time as an alumnus than as a student, so the process of students integrating into an
institution’s culture, being institutionalized, is of great interest those engaging and student
philanthropy education. Student philanthropy education programing seeks to engage students in

132
the process of giving philanthropically while enrolled, so that students will graduate with an
understanding of how philanthropy has shaped higher education. Engaging students in the
philanthropic process is often referred to as “alumni in training,” and at many institutions is in its
infancy stage; however, it has grown in popularity, and institutional leaders who chose to
embrace this initiative are viewing the process as a long-term cultivation strategy, especially at
institutions that depend on dwindling state and federal support (Miller, 2004).
Conclusions
This study investigated the relationship of student engagement and demographics on
alumni donor participation. The statistical analyses were limited in their generalizability, but the
findings do highlight two areas of student engagement measurements that can increase the
likelihood of alumni donor participation, namely of level academic challenge and the interaction
of faculty with students. Furthermore, the findings provided empirical evidence of the
importance of parental level of education on alumni donor participation. Additionally, the
finding supported the importance of campus involvement and the relationships that a student
develops with an institution, as both Greek Life membership and receiving of an institutional
scholarship were found to positively impact alumni donor participation.
Opportunities to affect student experience will begin and end with a walk across campus,
and students spend more time as alumni than students. Therefore, additional research at the
individual and institutional level into the collection and use of student experience, demographics,
and engagement data is warranted. Institutions that choose to actively explore data and determine

133
specific engagement activities that affect alumni donor participation will enhance the
performance of their alumni affairs and student development offices.

134
APPENDIX A: 2006 NSSE

135

136

137

138

139
APPENDIX B: UCF IRB LETTER

140

141
APPENDIX C: NSSE DATA SHARING AGREEMENT

142

143

144

145

146
APPENDIX D: EMAIL REQUESTING DATA

147
Hi SCHOOL REPRESENTATIVE,
My name is Joshua Truitt. I am a Ph.D. candidate in the Higher Education and Policy
Studies department at the University of Central Florida. My dissertation research seeks to
understand if undergraduate student engagement scores predict alumni donor participation. To do
this, I plan to correlate student engagement scores from the full-time undergraduate class of
2006, with their five year post-graduation alumni giving record. I have identified SCHOOL
NAME, and hope that you will choose to participate. Your participation is completely voluntary.
However, the answers you provide will help me study an important element of higher education.
Please answer the three questions below. Your responses will be kept confidential, and
results will not be released or reported in any way that might allow for identification of an
individual institution.
For all responses, use only data from the full-time undergraduate degree program, and
please report whole numbers.
1. Total number of graduates in the spring semester of 2006:__________________
2. Tracking only graduates of the 2006 spring semester (as reported in question 1
above) over a five year post-graduation period, how many made a monetary (of any
amount) contribution to SCHOOL NAME during each of the following years?
2007:___________________
2008:___________________
2009:___________________
2010:___________________
2011:___________________
3. On average, what percentage of students at SCHOOL NAME receives institution
based financial aid?
All participants will receive a copy of the final results.
Thank you for your help!
If you have any questions, please contact me at PHONE NUMBER.
Cordially yours,
Josh

148
REFERENCES
American Educational Research Association, American Psychological Association, & National
Council on Measurement in Education. (1999). Standards for educational and
psychological testing. Washington, DC: AERA.
Alberti, R. (1972). Influence of the faculty on college student character. Journal of College
Student Personnel, 13, 18-23.
Allan, R. G. (1999). Tuition discounts, institutional student aid and scholarship allowances.
Washington, DC: Sallie Mae Education Institute.
Andrade, S. J., Rodriguez Ingle, Y., & Diaz-Rios, R. L. (2001). “First-generation alumni”—
Improving survey research at a commuter university. Paper presented at Center for
Institutional Evaluation, Research and Planning, The University of Texas at El Paso.
Retrieved from
http://irp.utep.edu/Portals/1108/Previous%20Projects%20and%20Presentations/2001%20
First%20Generation%20Alumni%20Improving%20Survey%20Research%20.pdf
Ashcraft, R. (1995). An analysis of alumni donation and nondonation related to selected
personal, involvement and outcome factors. (Unpublished doctoral dissertation). Arizona
State University, Tempe, AZ.
Astin, A. (1977). Four critical years: Effects of college on beliefs, attitudes, and knowledge. San
Francisco: Jossey-Bass.
Astin, A. (1993). What matters in college? Four critical years revisited. San Francisco: Jossey-
Bass.

149
Astin, A. W. (1999). Student involvement: A developmental theory for higher education. Journal
of College Student Development, 40, 518-529.
Astin, A. W. (2001). What matters in college? Four critical years revisited. San Francisco, CA:
Jossey-Bass.
Astin, A. W., & Oseguera, L. (2004). The declining “equity” of American higher education. The
Review of Higher Education, 27(3), 321. http://dx.doi.org/10.1353%2Frhe.2004.0001
Astin, A. W., & Sax, L. J. (1998). How undergraduates are affected by service participation.
Journal of College Student Development, 39(3), 251–263.
Baade, R., & Sundberg, J. (1993). Identifying the factors that stimulate alumni giving. The
Chronicle of Higher Education, 40, Bl-B2.
Baade, R., & Sundberg, J. (1996). What determines alumni generosity?. Economics of Education
Review, (15)1, 75-81. http://dx.doi.org/10.1016/0272-7757(95)00026-7
Baird, L. L. (1976). Using self-reports to predict student performance. New York: The College
Board.
Berdie, R. (1971). Self-claimed and tested knowledge. Educational and Psychological
Measurement, 31, 629–636. http://dx.doi.org/10.1177/001316447103100304
Baker, P. C. (1998). The relationship of selected characteristics and attitudes of professional
school alumni to financial support within a public research university. (Doctoral
dissertation). Retrieved from the ProQuest Dissertations and Theses database. (9833579)
Belfield, C. R., & Beney, A. P. (2000 April). What determines alumni generosity? Evidence for
the UK. Education Economics, 8, 1-13. http://dx.doi.org/10.1080/096452900110300

150
Bernardi, R. (1994). Validating research results when Cronbach’s-alpha is below .70 - A
methodological procedure. Educational and Psychological Measurement, 54(3), 766-775.
http://dx.doi.org/10.1177/0013164494054003023
Bernardi, R. A., Baca, A. V., Landers, K. S., & Witek, M. B. (2008). Methods of cheating and
deterrents to classroom cheating: An international study. Ethics & Behavior, 18(4), 373-
391. http://dx.doi.org/10.1080/10508420701713030
Boyer, E. L., & Carnegie Foundation for the Advancement of Teaching. (1987). College: The
undergraduate experience in America. New York, NY: Harper & Row.
Breneman, D. W. (1994). Liberal arts colleges: Thriving, surviving, or endangered?
Washington, DC: Brookings Institute.
Brittingham, B. E., & Pezzullo, T. R. (1990). The campus green: Fund raising in higher
education. ASHE-ERIC Higher Education Report no.1. Washington, DC: George
Washington University Press.
Brubacher, J. S., & Rudy, W. (1997). Higher education in transition: A history of American
colleges and universities. New Brunswick, N.J.: Transaction Publishers.
Bruggnik, T. H., & Siddiqui, K. (1995). An econometric model of alumni giving: A case study
for liberal arts colleges. The American Economist (39), 53-61.
Bryan, N. B., Eagle, B. W., Wright, B. M., & Icenogle, M. L. (2012). Looking ahead to NSSE
2.0 by knowing what to keep from NSSE 1.1: Construct validity and invariance
properties of NSSE benchmarks across institutional types. Retrieved from
http://www.presby.edu/ir/wp-content/uploads/sites/50/2013/03/2012-AIR-NSSE-
Research.pdf

151
Burt, W. W., Jr. (1989). Alumni donors and nondonors of Southeast Missouri State University
according to institutional involvement, educational satisfaction and demographic
characteristics. (Doctoral dissertation). Retrieved from the ProQuest Dissertations and
Theses database. (8925272)
Buss, C., Parker, J., & Rivenburg, J. (2004). Cost, quality and enrollment demand at liberal arts
colleges. Economics of Education Review, 23(1), 57-65. http://dx.doi.org/10.1016/S0272-
7757(03)00047-5
Campbell, C., & Cabrera, A. (2011). How sound is NSSE? Investigating the psychometric
properties NSSE of NSSE at public, research-extensive institutions. The Review of
Higher Education, 35(1), 77-103.
Campbell, D. T., & Stanley, J. C. (1963). Experimental and quasi-experimental designs for
research. Chicago, IL: Rand McNally.
Carbone, R. (1986). An agenda for research on fund raising. College Park, MD: Clearinghouse
for Research on Fund Raising.
Carini, R. M., Kuh, G. D., & Klein, S. P. (2006). Student engagement and student learning:
Testing the linkages. Research in Higher Education, 47(1), 1-32.
http://dx.doi.org/10.1007/s11162-005-8150-9
Carnegie Foundation for the Advancement of Teaching. (1987). A classification of institutions of
higher education. 1987 Edition.
Carnegie Foundation for the Advancement of Teaching (2001). The Carnegie classification of
institutions of higher education (2000 ed.). Princeton, NJ: Author. Retrieved from
http://classifications.carnegiefoundation.org/downloads/2000_edition_data_printable.pdf

152
Carnegie Foundation for the Advancement of Teaching. (2009). Classification description.
Retrieved from http://classifications.carnegiefoundation.org/descriptions/basic.php
Chang, A., Chan, F., Gudmundsson, A., & Sawang, S. (2011). Motivating blue-collar employees:
A case study of the Chinese workforce. Journal of Asia-Pacific Business, 12(1), 69-85.
http://dx.doi.org/10.1080/10599231.2011.537504
Chickering, A. W. (1969). Education and Identity (1st ed.). San Franscisco, CA: Jossey-Bass.
Chickering, A.W., & Gamson, Z.F. (1987). Seven principles for good practice in undergraduate
education. AAHE Bulletin, 39(7), 3-7.
Chickering, A.W., & Gamson, Z.F. (1991). Applying the seven principles for good
undergraduate education. New Directions for Teaching and Learning, 47, San Francisco,
CA: Jossey-Bass. http://dx.doi.org/10.1002/tl.37219914708
Chickering, A. W., & Reisser, L. (1993). Education and Identity (2nd ed.). San Francisco:
Jossey-Bass.
Clark, L. A. & Watson, D. (1995). Constructing validity: Basic issues in objective scale
development. Psychological Assessment, 7, 309-319.
Clotfelter, C. T. (2001). Who are the alumni donors? Giving by two generations of alumni from
selective colleges. Nonprofit Management & Leadership, 12, 119-138.
http://dx.doi.org/10.1002/nml.12201
Clotfelter, C.T. (2003). Alumni giving to elite private colleges and universities. Economics of
Education Review, 22(2), 109-120. http://dx.doi.org/10.1016/S0272-7757(02)00028-6
Cohen, J. (1988). Statistical power analysis for the behavioral sciences. Hillsdale, NJ: Erlbaum.

153
Cohen, J. (1992). Power primer. Psychological Bulletin, 112, 155–159.
http://dx.doi.org/10.1037//0033-2909.112.1.155
Conner, D. K. (2005). Factors that affect alumni giving at a southeastern comprehensive
university. (Doctoral dissertation). Retrieved from the ProQuest Dissertations and Theses
database. (3198484)
Council for Aid to Education. (2011). Voluntary support of education. New York: Author.
Creswell, J. W. (2008). Educational research: Planning, conducting, and evaluating quantitative
and qualitative research. Upper Saddle River, NJ: Pearson Education, Inc.
Cronbach, L. J., & Shavelson, R. J. (2004). My current thoughts on coefficient alpha and
successor procedures. Educational & Psychological Measurement, 64(3), 391–418.
Cunningham, B. M., & Cochi-Ficano, C. K. (2002). The determinants of donative revenue flows
from alumni of higher education: An empirical inquiry. Journal of Human Resources,
37(3), 540-569.
Curti, M., & Nash, R. (1965). Philanthropy in the shaping of American higher education. New
Brunswick, NJ: Rutgers University Press.
Cutlip, S. (1965). Fund raising in the United States, its role in America’s philanthropy. New
Brunswick, NJ: Rutgers University Press.
Diehl, A. G. (2007). The relationship between alumni giving and receipt of institutional
scholarships among undergraduate students at a public, land-grant institution. (Doctoral
dissertation). Retrieved from ProQuest Dissertations and Theses database. (3298988)
Dillman, D. A. (2007). Mail and internet surveys: The tailored design method (2nd ed.).
Hoboken, NJ US: John Wiley & Sons Inc.

154
Doane, D., & Seward, L. (2013). Applied statistics in business and economics (4th ed.). New
York, NY: McGraw-Hill.
Dowd, A. C., Cheslock, J. J., & Melguizo, T. (2008). Transfer access from community colleges
and the distribution of elite higher education. The Journal of Higher Education, 79(4),
442-472.
Dowd, A.C., Sawatzky, M., & Korn R. (2011). Theoretical foundations and a research agenda to
validate measures of intercultural effort. The Review of Higher Education, 35(1), 17-44.
http://dx.doi.org/10.1353/rhe.2011.0033
Drew-Branch, V. (2011). Student engagement, alumni satisfaction, and alumni donations at a
public four year institution: An analysis of how the undergraduate experience influences
alumni donations. (Doctoral dissertation). Retrieved from the ProQuest Dissertations and
Theses database. (3476544)
Drezner, N. D. (2011). Special issue: Philanthropy and fundraising in American higher
education. ASHE Higher Education Report, 37(2), 1-155.
Dugan, K., Mullin, C. H., & Siegfried, J. J. (2000). Undergraduate financial aid and subsequent
giving behavior. Discussion paper produced by the Williams Project on the Economics of
Higher Education, 26. Williams College, Williamstown, MA
Durden, E. (2001, October 19). Liberal arts education for all, not just the rich. The Chronicle of
Higher Education. Retrieved from http://chronicle.com
Ehrenberg, R.G., & Smith, C.L. (2003). The sources and uses of annual giving at selective
private research universities and liberal arts colleges. Economics of Education Review,
22(3), 223-235. http://dx.doi.org/10.1016/S0272-7757(02)00073-0
155
Esquivel, S. L. (2011). The Factorial Validity of the National Survey of Student Engagement.
(Doctoral dissertation). Retrieved from http://trace.tennessee.edu/utk_graddiss/965
Evans, N. J., Forney, D. S., & Guido-DiBrito, F. (1998). Student development in college: Theory,
research, and practice. San Francisco: Jossey-Bass.
Ewell, P. T., & Jones, D. P. (1996). Indicators of “good practice” in undergraduate education:
A handbook for development and implementation. Boulder, CO: National Center.
Feldman, K. A., & Newcomb, T. M. (1969). The impact of college on students. San Francisco:
Jossey-Bass.
Field, A. P. (2009). Discovering Statistics Using SPSS (3rd
ed.). Los Angeles, CA: Sage
Publications.
Field, K. M. (2011). Engaging institutional environments and alumni donor participation rates:
Is there a linkage? (Doctoral dissertation). Retrieved from the ProQuest Dissertations and
Theses database. (3477197)
Fleiss, J. L. (1973). Statistical Methods for Rates and Proportions. John Wiley & Sons, Inc.,
New York, New York, USA.
Fong, B. (2005). The economics of higher education. Liberal Education, 91(1), 42-47.
Fraenkel, J. R., & Wallen, N. E. (2006). How to design and evaluate research in education.
Boston: McGraw-Hill.
Friedmann, A. S. (2003). Building communities of participation through student advancement
programs: A first step toward relationship fund raising. (Doctoral dissertation). Retrieved
from the ProQuest Dissertations and Theses database. (3081201)
156
Fruzzetti, A. R. (2011). Promoting student engagement with a virtual learning community at an
urban, private university in the northeast. Johnson & Wales University. (Doctoral
dissertation). Retrieved from the ProQuest Dissertations and Theses database. (3449268)
Gaff, J., & Gaff, S. S. (1981). Student-faculty relationships. In A. W. Ckickering (Ed.), The
modern American college (pp. 641-656). San Francisco: Jossey-Bass.
Gaier, S. (2005). Alumni satisfaction with their undergraduate academic experience and the
impact on alumni giving and participation. International Journal of Education and
Advancement, 2, 279-288. http://dx.doi.org/10.1057/palgrave.ijea.2140220
Garcia Montano, G. (2010). Enrollment and financial aid decisions of first-year students at a
private institution. Retrieved from the ProQuest Dissertations and Theses database.
(750487084)
Geiger, R. (1985). After the emergence: Voluntary support and the building of American
research universities. History of Education Quarterly, 25(3), 369-381.
http://dx.doi.org/10.2307/368274
Gilbert, J. (1995). The liberal arts college--Is it really an endangered species?. Change, 27(5),
36-43. http://dx.doi.org/10.1080/00091383.1995.9936446
Giving USA. (2011). The annual report on philanthropy for the year 2010. New York, NY:
Giving USA.
Gonyea, B., & Miller, A. (2010). NSSE’s psychometric portfolio: Evidence for reliability,
validity, and other quality indicators. Bloomington, IN: Indiana University Center for
Postsecondary Research.

157
Goodwin, L. D., & Leech, N. L. (2003). The meaning of validity in the new standards for
educational and psychological testing: Implications for measurement courses.
Measurement and Evaluation in Counseling and Development, 36(3), 181–192.
Gottfried, M. A. (2008). College Crowd-In: How Private Donations Positively Affect Alumni
Giving. International Journal of Educational Advancement, 8(2), 51-70.
http://dx.doi.org/10.1057/ijea.2008.8
Grandgenett, L. D. (2007). A quantitative analysis of strategic and financial changes in small
private higher education institutions. (Doctoral dissertation). Retrieved from the
ProQuest Dissertations and Theses database. (304731832)
Grant, J. H., & Lindauer, D. L. (1986). The economics of charity life-cycle patterns of alumnae
contributions. Eastern Economic Journal, 12(2), 129-141.
Griffith, S. D. (2011). Using the national survey of student engagement as a tool to determine
influences of overall student satisfaction with the college experience and help define
student-centeredness. (Doctoral dissertation). Retrieved from the ProQuest Dissertations
and Theses database. (926418133)
Grill, A. J. (1988). An analysis of the relationships of selected variables to financial support
provided by alumni of a public university. (Unpublished doctoral dissertation). The
Pennsylvania State University, University Park, PA.
Gruber, J. (2004). Pay or pray? The impact of charitable subsidies on religious attendance.
Journal of Public Economics, 88, 2635-2655.
http://dx.doi.org/10.1016/j.jpubeco.2004.03.006

158
Gunsalus, R. (2004). The relationship of institutional characteristics and giving participation
rates of alumni. International Journal of Educational Advancement, 5(2), 162-170.
http://dx.doi.org/10.1057/palgrave.ijea.2140214
Haddad, F. D., Jr. (1986). An analysis of the characteristics of alumni donors and nondonors at
Butler University. (Unpublished doctoral dissertation). West Virginia University,
Morgantown, WV.
Hair, Jr., J. F., Black, W. C., Babin, B. J., & Anderson, R. E. (2010). Multivariate data analysis
(7th ed.). Uppersaddle River, New Jersey: Prentice Hall.
Hall, H. (2004). Gender differences in giving: Going, going, gone?: Fundraising as a profession:
Advancements and challenges in the field [Special issue]. New Directions for
Philanthropic Fundraising, 43, 71-81.
Hansen, E.J. (1998). Essential demographics of today’s college students. AAHE Bulletin, 51(3),
3-5.
Harrison, W.B. (1995). College relations and fundraising expenditures: Influencing the
probability of alumni giving to higher education. Economics of Education Review, 14(1),
73-84. http://dx.doi.org/10.1016/0272-7757(94)00035-5
Harrison, W., Mitchell, S. & Peterson, S. (1995). Alumni donations and colleges’ development
expenditures: Does spending matter? American Journal of Economics and Sociology,
54(4), 397-413. http://dx.doi.org/10.1111/j.1536-7150.1995.tb03243.x
Harward, D. W. (2007). Engaged learning and the core purposes of liberal education: Bringing
theory to practice. Liberal Education, 93(1), 6-15.

159
Hearn, J. C. (1988). Attendance at higher-cost colleges: Ascribed, socioeconomic, and academic
influences on student enrollment patterns. Economics of Education Review, 7, 65-76.
http://dx.doi.org/10.1016/0272-7757(88)90072-6
Hearn, J. C. (1991). Academic and nonacademic influences on the college destinations of 1980
high school graduates. Sociology of Education, 64, 158-171.
http://dx.doi.org/10.2307/2112849
Hersh, R. H. (1999). Generating ideals and transforming lives: A contemporary case for the
residential liberal arts college. Daedalus, 128(1), 173-94.
Hillenbrand-Gunn, T. L., Heppner, M. J., Mauch, P. A., & Park, H. (2010). Men as allies: The
efficacy of a high school rape prevention intervention. Journal of Counseling &
Development, 88, 43-51. http://dx.doi.org/10.1002/j.1556-6678.2010.tb00149.x
Holmes, J. (2009). Prestige, charitable deductions and other determinants of alumni giving:
Evidence from a highly selective liberal arts college. Economics of Education Review,
28(1), 18-28. http://dx.doi.org/10.1016/j.econedurev.2007.10.008
Homans, G. C. (1958). Social behavior as exchange. American Journal of Sociology, 63, 597-
606. http://dx.doi.org/10.1086/222355
Hossler, D. R. (2004). How enrollment management has transformed –or ruined—higher
education. The Chronicle of Higher Education, 50(34), 77-90.
House, M. L. (1987). Annual fund raising in public higher education: The development and
validation of a prediction equation. University of Florida. ProQuest Dissertations and
Theses. Retrieved from
160
http://ezproxy.lib.ucf.edu/login?url=http://search.proquest.com/docview/303568881?acco
untid=10003. (303568881).
Hoyt, J. E. (2004, May/June). Understanding alumni giving: Theory and predictors of donor
status. Paper presented at the Annual Forum of the Association for Institutional Research,
Boston, MA.
Hu, S., & Kuh, G. D. (2003). Maximizing what students get out of college: Testing a learning
productivity model. Journal of College Student Development 44(2), 185-203.
http://dx.doi.org/10.1353/csd.2003.0016
Hu, S., & St. John, E. P. (2001). Student persistence in a public higher education system:
Understanding racial and ethnic differences. The Journal of Higher Education, 72(3),
265-286. http://dx.doi.org/10.2307/2649332
Hu, S., & Wolniak, G. C. (Winter 2013). College student engagement and early career earnings:
Differences by gender, race/ethnicity, and academic preparation. The Review of Higher
Education, 36(2), 211-233. http://dx.doi.org/10.1353/rhe.2013.0002
Hunter, C. S. (1997). A study of the relationships between alumni giving and selected
characteristics of alumni donors of livingstone college. (Doctoral dissertation). Retrieved
from the ProQuest Dissertations and Theses database. (304405426)
Hunter, J. M. (2012). An integrated framework for understanding the financial health of small,
private colleges. (Doctoral dissertation). Retrieved from the ProQuest Dissertations and
Theses database. (1112250988)

161
Hurst, F. M. (2008). Philanthropic giving preference differences: Nontraditional and traditional
alumni at Northern Arizona University. (Doctoral dissertation). Retrieved from the
ProQuest Dissertations and Theses database. (3321618)
Hurvitz, L. A. (2010). Building a culture of student philanthropy: A study of the ivy-plus
institutions' philanthropy education initiatives. (Doctoral dissertation). Retrieved from
the ProQuest Dissertations and Theses database. (499902509)
Indiana University, Bloomington. (2001). Improving the college experience: National
benchmarks of effective educational practice. NSSE 2001 Report. National Survey of
Student Engagement: The College Student Report.
Ioannidis, J. P. A. (2005). Why most published research findings are false. PLOS Med 2(8):
e124. doi:10.1371/journal.pmed.0020124
Jacoby, R. (1994). Dogmatic wisdom: How the culture wars divert education and distract
America. New York, NY: Doubleday.
James Madison University. (2012). Madison fund. Retrieved from
http://www.jmu.edu/madisonfund/about.shtml
Johnson, R. A., and Tsui, K.-W. (1998), Statistical Reasoning and Methods, New York: John
Wiley and Sons, Inc.
Kelly, K. (1991). Fund raising and public relations: A critical analysis. Hillsdale, NJ: L.
Erlbaum.
Kirk, C. F., & Dorfman, L. T. (1983). Satisfaction and role strain among middle-age and older
reentry women students. Educational Gerontology, 9, 15-29.
http://dx.doi.org/10.1080/0380127830090102

162
King, P. M. (1994). Theories of college student development: Sequences and consequences.
Journal of College Student Development, 35, 413-421.
Kinzie, J. & Matveev, A. (2008, June). Enhancing student success: Using the NSSE & BCSSE to
shape student engagement. Paper presented at the NASPA IARC Conference, Arizona.
Kline, R. B. (2011). Principles and practice of structural equation modeling (3rd ed.). New
York, NY: Guilford Press.
Komives, S. R., Dudley, B., Woodard, Jr., (1996). Student services: A handbook for the
profession (3rd ed.). San Francisco, CA: Jossey-Bass.
Kuehl, R. O. (2000). Design of experiments: Statistical principles of research design and
analysis. Pacific Grove, CA: Duxbury.
Kuh, G. D. (2001a). The National Survey of Student Engagement: Conceptual framework and
overview of psychometric properties. Bloomington, IN: Indiana University Center for
Postsecondary Research.
Kuh, G. D. (2001b). Assessing what really matters to student learning: Inside the National
Survey of Student Engagement. Change, 33(3), 10-17.
Kuh, G.D. (2003). What we are learning about student engagement from NSSE. Change, 35(2),
24-32. http://dx.doi.org/10.1080/00091380309604090
Kuh, G. D. (2004). The National Survey of Student Engagement: Conceptual framework
and overview of psychometric properties. Bloomington, IN: Indiana University Center for
Postsecondary Research and Planning. Retrieved from
http://nsse.iub.edu/2004_annual_report/pdf/2004_Conceptual_Framework.pdf

163
Kuh, G.D. (2005). Built to engage: Liberal arts colleges and effective educational practice. In F.
Oakely (Ed.), Liberal arts colleges in American higher education: Challenges and
opportunities, ACLS Occasional Paper, No. 59 (pp. 122-150). New York, NY: American
Council of Learned Societies.
Kuh, G.D. (2009a). The National Survey of Student Engagement: Conceptual and empirical
findings. New Directions for Institutional Research, 41, 5-20.
http://dx.doi.org/10.1002/ir.283
Kuh, G.D. (2009b). What student affairs professionals need to know about student engagement.
Journal of College Student Development, 50(6), 633-706.
http://dx.doi.org/10.1353/csd.0.0099
Kuh, G. D., & Vesper, N. (1997). A comparison of student experiences with good practices in
undergraduate education between 1990 and 1994. Review of Higher Education, 21(1),
43–61. http://dx.doi.org/10.1353/rhe.1997.0014
Kuh, G. D., Hu, S., & Vesper, N. (2000). "They shall be known by what they do": An activities-
based typology of college students. Journal of College Student Development, 41(2), 228-
44.
Kuh, G. D., Hayek, J. C., Carini, R. M., Ouimet, J. A., Gonyea, R. M., & Kennedy, J. (2001).
NSSE technical and norms report. Bloomington, IN: Indiana University Center for
Postsecondary Research and Planning.
Kuh, G.D., Kinzie, J., Schuh, J.H., Whitt, E.J., & Associates. (2010). Student success in college:
Creating conditions that matter. San Francisco, CA: Jossey-Bass.

164
Kuh, G. D., Pace, C. R., & Vesper, N. (1997). The development of process indicators to estimate
student gains associated with good practices in undergraduate education. Research in
Higher Education, 38, 435-454. http://dx.doi.org/10.1023/A:1024962526492
Kuh, G. D., Pascarella, E. T., & Weschsler, H. (1996). The questionable value of fraternities. The
Chronicle Of Higher Education, 42, A68.
Kuh, G. D., Schuh, J. H., Whitt, E. J., & Associates. (1991). Involving colleges: Successful
approaches to fostering student learning and personal development outside the
classroom (1st ed.). San Francisco, CA: Jossey-Bass.
Lackie, M. B. (2010). Alumni giving at Arkansas Tech University: College experiences and
motivations to give as predictors of giving behavior. (Doctoral dissertation). Retrieved
from the ProQuest Dissertations and Theses database. (3438055)
LaNasa, S. M., Cabrera, A. F., & Transgrud, H. (2009). The construct validity of student
engagement: A confirmatory analysis approach. Research in Higher Education, 2009(50),
315–332. http://dx.doi.org/10.1007/s11162-009-9123-1
Lang, E. M. (1999). Distinctively American: The residential liberal arts colleges. Daedalus,
128(1), 133-150.
Lapovsky, L. (2005). The economic challenges of liberal arts college. In Liberal arts college in
American higher education: Challenges and opportunities (pp. 50-69). New York, NY:
American Council of Learned Societies.
Lawley, C. D. (2008). Factors that affect alumni loyalty at a public university. (Doctoral
dissertation). Retrieved from the ProQuest Dissertations and Theses database.
(304500738)

165
Leech, N. L., Onwuegbuzie, A. J., & O’Conner, R. L. (2011). Assessing internal consistency in
counseling research. Counseling Outcomes Research and Evaluation, 2, 115-125.
http://dx.doi.org/10.1177/2150137811414873
Leslie, L. L., & Ramey, G. (1988). Donor behavior and voluntary support for higher education
institutions. The Journal of Higher Education, 59(2), 115-132.
http://dx.doi.org/10.2307/1981689
Litwin, M. S. (2003). How to assess and interpret survey psychometrics, 2nd
edition. Thousand
Oaks, CA: Sage Publications.
Lofton, W. J. (2005). Commonalities among experiences of supportive alumni of the university of
southern mississippi. (Doctoral dissertation). Retrieved from the ProQuest Dissertations
and Theses database. (305432289)
Long, J.S. (1997). Regression Models for Categorical and Limited Dependent Variables.
Thousand Oaks, CA: Sage Publications.
Mael, F., & Ashforth, B. E. (1992). Alumni and their alma-mater—A partial test of the
reformulated model of organizational identification. Journal of Organizational Behavior,
13(2), 103–123. http://dx.doi.org/10.1002/job.4030130202
Marr, K. A., Mullin, C. H., & Siegfried, J.J. (2005). Undergraduate financial aid and subsequent
alumni giving behavior. The Quarterly Review of Economics and Finance, 45, 123-143.
http://dx.doi.org/10.1016/j.qref.2003.08.005
Markoff, R. M. (1978). An analysis of the relationship of alumni giving and level of participation
in voluntary organizations: A case study. Toledo, OH: University of Toledo.

166
Martin, J. C., Jr. (1993). Characteristics of alumni donors and non-donors at a research I, public
university. (Doctoral dissertation). Retrieved from the ProQuest Dissertations and Theses
database. (304093123)
Martin, N. D. (2012). The privilege of ease: Social class and campus life at highly selective,
private universities. Research in Higher Education, 53(4), 426-452. Retrieved from
http://www.jstor.org/stable/41475401
McGhee, S. C. (2011). Financial aid, persistence, and the status of the under-represented in
higher education: Exploring the relationships between financial aid, persistence, and
degree attainment among african-american, hispanic, and low-income students.
(Doctoral dissertation). Retrieved from the ProQuest Dissertations and Theses database.
(887981412)
McMillan, J. H., & Schumacher, S. (2000). Research in education: A conceptual introduction.
New York, NY: Longman.
McPherson, M. S., & Shapiro, M. O. (2000). The future economic challenges for the liberal arts
colleges. In S. Koblik, & S. R. Graubard (Eds.), Distinctively American; The residential
liberal arts college (pp. 47-75). New Brunswick, NJ: Transaction.
Mechanic, D. (1979). The stability of health and illness behavior: Results from a 16-year follow-
up. American Journal of Public Health, 69(11), 1142–1145.
http://dx.doi.org/10.2105/AJPH.69.11.1142
Meer, J. (2011). Brother can you spare a dime? Peer pressure in charitable solicitation. Journal
of Public Economics, 95, 926-941. http://dx.doi.org/10.1016/j.jpubeco.2010.11.026

167
Meer, J., & Rosen, H.S. (2012). Does generosity beget generosity? Alumni giving and
undergraduate financial aid. National Bureau of Economic Research, Working Paper
17861, 1-48.
Merchant, A. (2008). How personal nostalgia influences giving to charity. Old Dominion
University. (Doctoral dissertation). Retrieved from the ProQuest Dissertations and Theses
database. (304413416)
Merwin, J. C. (1969). Historical review of changing concepts of evaluation. In R. L. Tyler (Ed.),
Educational evaluation: New roles, new methods: The sixty-eighth yearbook of the
National Society for the Study of Education, Part II.Chicago, IL: University of Chicago
Press.
Messick, S. (1989). Validity. In R. L. Linn (Ed.), Educational Measurement (3rd ed., pp. 13-
103). New York, NY: American Council on Education/Macmillan.
Milem, J.F., & Berger, J.B. (1997). A modified model of college student persistence: Exploring
the relationship between Astin’s theory of involvement and Tinto’s theory of student
departure. Journal of College Student Development, 38(4), 387-399.
Miller, J. E. (2008). Interpreting the substantive significance of multivariable regression
coefficients. Proceedings of the American Statistical Association, Statistical Education
Section. Retrieved from
http://policy.rutgers.edu/faculty/miller/2008regression_coefficients.pdf.
Miller, R. E. (2004). Our future donors. College English, 66(4), 365-379. Retrieved from
http://www.jstor.org/stable/4140707

168
Miller, M. E., Hui, S. L., & Tierney, W. M. (1991). Validation techniques for logistic regression
models. Statistics in Medicine, 10(8), 1213-1226. doi:10.1002/sim.4780100805
Moore, D. S., & McCabe, G. P. (2006). Introduction to the practice of statistics (5th ed.). New
York, NY: W.H. Freeman and Company.
Mosser, J. W. (1993). Predicting alumni/ae gift giving behavior: A structural equation model
approach. Unpublished dissertation, University of Michigan, Ann Arbor.
National Association of Independent Colleges and Universities. (2012, October 4). Private
college tuition increases slow to lowest rate in at least four decades. NAICU News
Release. Retrieved from http://www.naicu.edu/news_room/detail/private-college-tuition-
increases-slow-to-lowest-rate-in-at-least-four-decades
National Center for Education Statistics. (2012). Integrated Postsecondary Education Data
System (IPEDS). Retrieved from
http://nces.ed.gov/ipeds/datacenter/InstitutionByGroup.aspx
National Survey of Student Engagement. (2000). National benchmarks of effective educational
practice. Bloomington, IN: Indiana University, Center for Postsecondary Research.
National Survey of Student Engagement. (2005). National survey of student engagement
VIEWPOINT. Bloomington, IN: Indiana University, Center for Postsecondary Research.
Retrieved from
http://nsse.iub.edu/NSSE_2005_Annual_Report/pdf/NSSE2005_Viewpoint.pdf
National Survey of Student Engagement (2006). Psychometric properties of NSSE. Retrieved
from

169
http://www.iun.edu/~nwadmin/oier/nsse/faq/2006/FAQ_NSSE_2006_Psychometric_Pro
perties.pdf
National Survey on Student Engagement. (2012). Participating institutions. Retrieved from
http://nsse.iub.edu/html/participants.cfm?include_surveys=NSSE&min_year=2000&max
_year=2012&name_keyword=&governance=Private&orderby=State&aButton=Collect+
Results&action=Collect+Results
Nunnally, J. C. (1978). Psychometric theory. New York, NY: McGraw-Hill.
Oakley, F. (2005). Liberal arts colleges in American higher education: challenges and
opportunities. New York, NY: American Council of Learned Societies.
Oglesby, R. A. (1991). Age, student involvement, and other characteristics of alumni donors and
alumni non-donors. (Unpublished doctoral dissertation). University of Missouri-
Columbia, Columbia, MO.
Olivas, M.A. (2011). If you build it, they will assess it (or an open letter to George Kuh, with
love and respect). The Review of Higher Education, 35(1), 1-15.
http://dx.doi.org/10.1353/rhe.2011.0032
Onwuegbuzie, A. J., & Daniel, L. G. (2002). Framework for reporting and interpreting internal
consistency reliability estimates. Measurement and Evaluation in Counseling and
Development, 35, 89-103.
Onwuegbuzie, A. J., & Daniel, L. G. (2004). Reliability generalization: The importance of
considering sample specificity, confidence intervals, and subgroup differences. Research
in the Schools, 11, 60-71.

170
Okunade, A. A., & Berl, R. L. (1997). Determinants of charitable giving of business school
alumni. Research in Higher Education, 38(2), 201-214. Retrieved from
http://www.jstor.org/stable/40196242
Okunade, A. A., Wunnava, P. V., & Walsh, R. Jr. (1994). Charitable giving of alumni: Micro-
data evidence from a large public university. American Journal of Economics and
Sociology, 53(1), 73-84. http://dx.doi.org/10.1111/j.1536-7150.1994.tb02674.x
O'Neill, P. P. (2005). The impact of undergraduate greek membership on alumni giving at the
college of William and Mary. (Doctoral dissertation). Retrieved from the ProQuest
Dissertations and Theses database. (305394226)
Osborne, J. W. (2013). Best practices in data cleaning. Thousand Oaks, CA: Sage Publications.
Outcalt, C. L., & Skewes-Cox, T. E. (2002). Involvement, interaction, and satisfaction: The
human environment at HBCUs. The Review of Higher Education, 25(3), 331-347.
http://dx.doi.org/10.1353/rhe.2002.0015
Pace, C. R. (1979). Measuring outcomes of college. San Francisco, CA: Jossey-Bass.
Pace, C. R. (1980). Measuring the quality of student effort. Improving Teaching and Institutional
Quality, 1, 10-16.
Pace, C. R. (1985). The credibility of student self-reports. Los Angeles, CA: Center for the Study
of Evaluation, University of California Los Angeles.
Pacifici, L., & Thomson, N. (2011). What do they expect? A comparison of student expectations
and outcomes of undergraduate research experiences. Journal of College Science
Teaching, 41(1), 54-60.

171
Panitz, T. (1999). The Case for Student Centered Instruction via Collaborative Learning
Paradigms. Retrieved from
http://home.capecod.net/~tpanitz/tedsarticles/coopbenefits.htm
Parker, J., & Summers, J. (1993). Tuition and enrollment yield at selective liberal arts colleges.
Economics of Education Review, 12(4), 311-324. http://dx.doi.org/10.1016/0272-
7757(93)90065-O
Pascarella, E. T. (1985). College environmental influences on learning and cognitive
development: A critical review and synthesis. In J. C. Smart (Ed.), Higher education:
Handbook of theory and research. New York, NY: Agathon.
Pascarella, E. T., Seifert, T. A., & Blaich, C. (2008). Validation of the NSSE benchmarks and
deep approaches to learning against liberal arts outcomes. Paper presented at the Annual
Meeting of the Association for the Study of Higher Education, Jacksonville, FL.
Retrieved from
http://www.liberalarts.wabash.edu/storage/ValidationofNSSEBenchmarks_PascarellaEtA
l_ASHE08Linked.pdf
Pascarella, E. T., & Terenzini, P. T. (1976, May). Outcomes of the academic and nonacademic
experience of college related to frequency of students' informal interaction with faculty.
Paper presented at the Annual Forum of the Association for Institutional Research, Los
Angeles, CA.
Pascarella, E. T., & Terenzini, P. T. (1977). Patterns of student-faculty informal interaction
beyond the classroom and voluntary freshman attrition. Journal of Higher Education, 48,
540-552. http://dx.doi.org/10.2307/1981596

172
Pascarella, E. T., & Terenzini, P.T. (1991). How college affects students. San Francisco: Jossey-
Bass.
Pascarella, E. T., & Terenzini, P. (2001). Student-faculty informal contact and college
persistence: A further investigation. The Journal of Educational Research, 214-218.
Pascarella, E.T. & Terenzini, P.T. (2005). How college affects students. San Francisco: Jossey-
Bass.
Pascarella, E. T., Terenzini, P. T., & Hibel, J. (1978). Student-faculty interactional settings and
their relationship to predicted academic performance. Journal of Higher Education, 49,
450-463. http://dx.doi.org/10.2307/1980509
Pascarella, E. T., Seifert, T. A., & Blaich, C. (2010). How effective are the NSSE benchmarks in
predicting important educational outcomes? Change: The Magazine of Higher Learning,
42(1), 16-22. http://dx.doi.org/10.1080/00091380903449060
Pauley, B. A. (2011). A case study of first-year persistence of Marshall University freshmen.
(Doctoral dissertation). Retrieved from the ProQuest Dissertations and Theses database.
(887711898)
Paulsen, M. (1990). Curriculum change at liberal arts colleges: The influence of financial
conditions. Liberal Education, 76(2), 2-5.
Pearson, J. (1999). Comprehensive research on alumni relationships: Four years of market
research at Stanford University. New Directions for Institutional Research, 101, 5-21.
http://dx.doi.org/10.1002/ir.10101
Perry, W. G., Jr. (1968). Forms of intellectual and ethical development in the college years: A
scheme. New York, NY: Holt, Rinehart & Winston.
173
Pike, G. R. (1995). The relationship between self-reports of college experiences and achievement
test scores. Research in Higher Education, 36, 1–21.
http://dx.doi.org/10.1007/BF02207764
Pike, G. R. (2006). The convergent and discriminate validity of NSSE scalelet scores. Journal of
College Student Development, 47(5), 550–563. http://dx.doi.org/10.1353/csd.2006.0061
Pike, G. R., & Kuh, G. D. (2005). A typology of student engagement for American colleges and
universities. Research in Higher Education, 46(2), 185-209.
http://dx.doi.org/10.1007/s11162-004-1599-0
Pike, G. R., Schroeder, C. C., & Berry, T. R. (1997). Enhancing the educational impact of
residence halls: The relationship between residential learning communities and first-year
college experiences and persistence. Journal of College Student Development, 38(6),
609-621.
Pohlmann, J., & Beggs, D. (1974). A study of the validity of self-reported measures of academic
growth. Journal of Educational Measurement, 11, 115–119.
http://dx.doi.org/10.1111/j.1745-3984.1974.tb00980.x
Porter, S. (2011). Do college student surveys have any validity? The Review of Higher
Education, 35(1), 45-76. http://dx.doi.org/10.1353/rhe.2011.0034
Prince, M. (2004). Does active learning work? A review of the research. Journal of Engineering
Education, 93(3), 223–231. DOI: 10.1002/j.2168-9830.2004.tb00809.x
Pumerantz, R. K. (2004). Alumni-in-training: Institutional factors associated with greater
alumni giving at public comprehensive colleges and universities. (Doctoral dissertation).
Retrieved from the ProQuest Dissertations and Theses database. (305201556)

174
Reason, R. D., Terenzini, P. T., & Domingo, R. J. (2006). First things first: Developing
academic competence in the first year of college. Research in Higher Education, 29(1),
23-52. http://dx.doi.org/10.1007/s11162-005-8884-4
Robinson, D. M. (1994). A study of selected characteristics of alumni financial support to their
alma mater. (Doctoral dissertation). Retrieved from the ProQuest Dissertations and
Theses database. (304164545)
Rosenthal, R., & Rosnow, R. L. (1984). Essentials of behavioral research: Methods and data
analysis, New York, NY: McGraw-Hill.
Russo, J. A. (1999). Policies, practices and philosophy. Journal of College Admission, 162, 4-11.
Russo, J. A., & Coomes, M. D. (2000). Enrollment management, institutional resources, and the
private college. New Directions for Student Services, 89, 33-46.
http://dx.doi.org/10.1002/ss.8903
Schmidt, J. C. (2001). Mining philanthropic data: Models for predicting alumni/us giving at a
medium-sized public master's university. (Doctoral dissertation). Retrieved from the
ProQuest Dissertations and Theses database. (304705037)
Schroeder, C. C., & Kuh, G. D. (2003). How are we doing at engaging students? Charles
Schroeder talks to George Kuh. About Campus, 8(2), 9-16.
Shadoian, H. L. (1989). A study of predictors of alumni philanthropy in public colleges.
(Doctoral dissertation). Retrieved from the ProQuest Dissertations and Theses database.
(303749027)

175
Shim, J. (2001). Relationship of selected alumnae characteristics to alumnae financial support at
a women's college. (Doctoral dissertation). Retrieved from the ProQuest Dissertations
and Theses database. (304692099)
Smith, M. M. (2008). The profile of giving and non-giving young alumni to the Scotsman club at
Presbyterian college. (Doctoral dissertation). Retrieved from the ProQuest Dissertations
and Theses database. (304529038)
Sorcinelli, M. D. (1991). Research findings on the seven principles. New Directions for Teaching
and Learning, 1991(47), 13–25. http://dx.doi.org/10.1002/tl.37219914704
Spady, W. (1971). Dropouts from higher education. Toward an empirical model. Interchange, 2,
38-62. http://dx.doi.org/10.1007/BF02282469
Springer, L., Stanne, M., Donovan, S. (1999). Effects of small-group learning on undergraduates
in science, mathematics, engineering, and technology: A meta-analysis. Review of
Educational Research, 69(1), 21-51.
Statistical Package for the Social Sciences, Windows, Version 20.0. (2011). Armonk, NY: IBM
Corp.
Steeper, D. W. (2009). The effects of selected undergraduate student involvement and alumni
characteristics on alumni gift-giving behavior at the University of Virginia. (Doctoral
dissertation). Retrieved from the ProQuest Dissertations and Theses database.
(305011140)
Stewart, E. T. (1955). Higher education under stress. Annals of the American Academy of
Political Science, 301, 123-139. Retrieved from http://www.jstor.org/stable/1032537

176
Stewart, E. T. (1957). Individual giving to higher education. Phi Delta Kappa International,
38(5), 191-194. Retrieved from http://www.jstor.org/stable/20341898
St. John, E. P., Paulsen, M. B., & Carter, D. F. (2005). Diversity, college costs, and post-
secondary opportunity: An examination of the financial nexus between college choice
and persistence for African Americans and Whites. The Journal of Higher Education.
76(5). September/October. 545-569.
Sun, X. (2005). A multivariate causal model of alumni giving at a midwest, public university.
(Doctoral dissertation). Retrieved from the ProQuest Dissertations and Theses database.
(305457139)
Sun, X., Hoffman, S.C., & Grady, M. L. (2007). A multivariate causal model of alumni giving:
Implications for alumni fundraisers. International Journal of Educational Advancement,
7(4), 307-332. http://dx.doi.org/10.1057/palgrave.ijea.2150073
Tabachnick, B. G, & Fidell, L. S. (2001). Using multivariate statistics. Boston, MA: Allyn and
Bacon.
Taylor, A. L., & Martin, J. C., Jr. (1995). Characteristics of alumni donors and non-donors at a
research I, public university. Research in Higher Education, 36(3), 283-302.
Terenzini, P. T., Cabrera, A. F., Colbeck, C. L., Bjorklund, S. A., & Parente, J. M. (2001). Racial
and ethnic diversity in the classroom: Does it promote student learning? Journal of
Higher Education, 72, 509-531. http://dx.doi.org/10.2307/2672879
Terenzini, P. T., Theophilides, C., & Lorang, W. G. (1984). Influences on students' perceptions
of their academic skill development during college. Journal of Higher Education, 55,
621-636. http://dx.doi.org/10.2307/1981826

177
Thelin, J. R. (2004). A history of American higher education. Baltimore, MD: John Hopkins
Press.
Thistlewaite, D. (1960). College press and changes in study plans of talented students. Journal of
Educational Psychology, 51, 222-234. http://dx.doi.org/10.1037/h0039850
Thomas, J. A., & Smart, J. (1995, May/June). The relationship between personal and social
growth and involvement in college and subsequent alumni giving. Paper presented at an
annual forum of the Association for Institutional Research, San Diego, CA.
Thompson, B. (1994). Guidelines for authors. Educational and Psychological Measurement, 54,
837-847.
Tinto, V. (1987). The Principles of Effective Retention. Retrieved from
http://eric.ed.gov/ERICWebPortal/detail?accno=ED301267
Tinto, V. (1993). Leaving college: Rethinking the causes and cures of student attrition. Chicago,
IL: The University of Chicago Press.
Tinto, V. (1998). Stages of departure: Reflections on the longitudinal character of student leaving.
Journal of Higher Education, 59 (4), 438-455. http://dx.doi.org/10.2307/1981920
Todd, B. T., (Ed.). (1993). Student advancement programs: Shaping tomorrow's alumni
leaders today. Washington, DC: CASE Books.
Tripp, R. (1997). Greek organizations and student development: A review of the research.
College Student Affairs Journal, 16(2), 31-39.
Tsao, J. C., & Coll, G. (2005). To give or not to give: factors determining alumni intent to make
donations as a PR outcome. Journalism & Mass Communication Educator, 59(4), 381-
392. http://dx.doi.org/10.1177/107769580405900407

178
Turner, S. E., Meserve, L. A., & Bowen, W. G. (2001). Winning and giving: football results and
alumni giving at selective private colleges and universities. Social Science Quarterly,
82(4), 812-826. http://dx.doi.org/10.1111/0038-4941.00061
Umbach, P. D., & Kuh, G. D. (2003, May). Student experiences with diversity at liberal arts
colleges: Another claim for distinctiveness. Paper presented at the annual meeting of the
Association for Institutional Research, Tampa, FL.
Umbach, P. D., & Kuh, G. D. (2006). Student experiences with diversity at liberal arts colleges:
Another claim for distinctiveness. Journal of Higher Education, 77(1), 169-192.
http://dx.doi.org/10.1353/jhe.2006.0008
U.S. News & World Report. (2012). National Liberal Arts College Rankings. Retrieved from
http://www.usnews.com/education/best-colleges/articles/2011/09/12/how-us-news-
calculates-the-college-rankings-2012?page=4
Van Horn, D. L. (2002). Satisfaction with the undergraduate experience as motivation for
smaller dollar alumni donations. (Doctoral dissertation). Retrieved from the ProQuest
Dissertations and Theses database. (305518360)
Voelker, J., & Campbell, J. (2003). Imagining the future citizen. Liberal Education, 89(4), 46-
53.
Ward, H. (2004). The impact of collegiate involvement on african-american alumni giving.
Bowling Green State University. (Doctoral dissertation). Retrieved from the ProQuest
Dissertations and Theses database. (305218079)

179
Weerts, D. J., & Ronca, J. M. (2008). Characteristics of alumni donors who volunteer at their
alma mater. Research in Higher Education, 49(3), 274-292. Retrieved from
http://www.jstor.org/stable/25704562
Wilkinson, R. B., Taylor, J. S., Peterson, A., & Machado-Taylor, M. d. L. (2007). A practical
guide to strategic enrollment management planning. Retrieved from
http://www.educationalpolicy.org/pdf/SEM%20Guide.pdf
Winston, G. C. (1999). Subsidies, hierarchy and peers: The awkward economics of higher
education. Journal of Economic Perspectives, 13(1), 13-36.
http://dx.doi.org/10.1257/jep.13.1.13
Worth, M. (1993). Defining institutional advancement, development, and fundraising. In M. J.
Worth (Ed.), Educational fund raising: Principles and practice. Phoenix, AZ: Oryx
Press.
Wunnava, P.V., Lauze, M.A. (2001). Alumni giving at a small liberal arts college: Evidence
from consistent and occasional donors. Economics of Education Review, 20(6), 533-543.
http://dx.doi.org/10.1016/S0272-7757(00)00023-6
Young, P. S., & Fischer, N. M. (1996). Identifying undergraduate and post-college
characteristics that may affect alumni giving. Paper presented at the annual forum of the
Association for Institutional Research, Albuquerque, NM. (ERIC Document
Reproduction Service No. ED397748).
Zhao, C & Kuh, G. D. (2004). Adding value: Learning communities and student engagement.
Research in Higher Education, 45(2), 115-138.
http://dx.doi.org/10.1023/B:RIHE.0000015692.88534.de

180
Zusman, A. (1999). Challenges facing higher education in the twenty-first century. In P. Altbach,
et al. (Eds.), American higher education in the twenty-first century: Social, political and
economic challenges. Baltimore, MD: Johns Hopkins University Press. Retrieved from
http://www.educationanddemocracy.org/Resources/Zusman.pdf