the relationship between employee engagement and survey
TRANSCRIPT

San Jose State University San Jose State University
SJSU ScholarWorks SJSU ScholarWorks
Master's Theses Master's Theses and Graduate Research
Summer 2015
The relationship between employee engagement and survey The relationship between employee engagement and survey
response rate with union membership as a moderator response rate with union membership as a moderator
Alexandra Mariah de la Rocha San Jose State University
Follow this and additional works at: https://scholarworks.sjsu.edu/etd_theses
Recommended Citation Recommended Citation de la Rocha, Alexandra Mariah, "The relationship between employee engagement and survey response rate with union membership as a moderator" (2015). Master's Theses. 4582. DOI: https://doi.org/10.31979/etd.z4c6-uv9d https://scholarworks.sjsu.edu/etd_theses/4582
This Thesis is brought to you for free and open access by the Master's Theses and Graduate Research at SJSU ScholarWorks. It has been accepted for inclusion in Master's Theses by an authorized administrator of SJSU ScholarWorks. For more information, please contact [email protected].

THE RELATIONSHIP BETWEEN EMPLOYEE ENGAGEMENT AND SURVEY RESPONSE RATE WITH UNION MEMBERSHIP AS A MODERATOR
A Thesis
Presented to
The Faculty of the Department of Psychology
San José State University
In Partial Fulfillment
of the Requirements for the Degree
Master of Science
by
Alexandra M. de la Rocha
August 2015

© 2015
Alexandra M. de la Rocha
ALL RIGHTS RESERVED

The Designated Thesis Committee Approves the Thesis Titled
THE RELATIONSHIP BETWEEN EMPLOYEE ENGAGEMENT AND SURVEY RESPONSE RATE WITH UNION MEMBERSHIP AS A MODERATOR
by
Alexandra M. de la Rocha
APPROVED FOR THE DEPARTMENT OF PSYCHOLOGY
SAN JOSÉ STATE UNIVERSITY
August 2015
Dr. Howard Tokunaga Department of Psychology
Dr. Megumi Hosoda Department of Psychology
Dr. Chris Lawson Pacific Gas and Electric Company

ABSTRACT
THE RELATIONSHIP BETWEEN EMPLOYEE ENGAGEMENT AND SURVEY
RESPOSNE RATE WITH UNION MEMBERSHIP AS A MODERATOR
by Alexandra M. de la Rocha
Research has examined the benefits of having an engaged workforce. One way of
measuring employee engagement is through organizational surveys. Survey response
rate represents voluntary participation behavior and may be an outcome of employee
engagement. However, research has not examined survey participation behavior as an
outcome of employee engagement or factors that might influence this relationship. Thus,
the purpose of the present study was to examine the relationship between dimensions of
employee engagement (vigor, dedication, and absorption) and survey response rate at the
aggregate level and to examine how this relationship varied as a function of percentage of
union membership. Analyses were conducted for small and large groups because they
had different work environments. The researcher found that there was a significant
positive relationship between aggregate employee engagement levels and survey
response rate. Moreover, this relationship was stronger for large groups than small
groups, suggesting that group size influences the relationship between aggregate
employee engagement and survey response rate. Regarding the moderating effect, union
membership influenced the relationship between dedication and survey response rate only
in small groups. These findings suggest that in small groups, the percentage of union
membership in a group influenced the relationship between a strong sense of pride and
personal accomplishment and survey response rate.
v
ACKNOWLEDGEMENTS
I would like to thank my thesis committee for their support and countless hours of
assistance. Howard, thank you for being my thesis chair and providing me with guidance
through the entire process of writing my thesis. I appreciate the many discussions we had
on-campus and late night phone calls to ensure that progress was made. You were
influential in helping me process the uniqueness of my data and I appreciate your insights
and feedback. Megumi, thank you for working with the fast paced deadline I was aiming
for. I value your detailed feedback, thoughtful questions, and grammatical corrections.
Chris, thank you for your guidance and support. I can clearly remember the day that you
came to me and asked what topic I was thinking about for my thesis. Without that
probing that question, my curiosity about employee engagement would not have
blossomed into this thesis.
To my family and friends, thank you for your love, support, and understanding of
my inability to be social these last few months. Mom and Dad, thank you for always
supporting me in all of my endeavors. At a very young age, you instilled in me a strong
love for learning that propelled me to strive for my Master’s Degree. I am very grateful
for all of the sacrifices you have made for me and want to say that none of this would
have been possible without you both.
Nathan, thank you for all of your love and support. Without you, I am not sure
how I would have kept my sanity during the process of writing my thesis. Thank you for
“tearing apart” my introduction, listening to my endless rants, and for reminding me to
relax and have fun.
vi
TABLE OF CONTENTS
LIST OF TABLES ........................................................................................................... ix
LIST OF FIGURES ......................................................................................................... xi
INTRODUCTION ........................................................................................................... 1
Employee Engagement ........................................................................................ 2
Outcomes of Employee Engagement ................................................................... 4
Customer loyalty and satisfaction ............................................................ 4
Productivity .............................................................................................. 4
Organizational citizenship behaviors (OCBs) ......................................... 5
Positive employee attitudes...................................................................... 6
Retention, absenteeism, and shrinkage .................................................... 6
Summary .............................................................................................................. 7
Survey Response Rate.......................................................................................... 7
Organizational surveys............................................................................. 7
Definition of survey participation and response rate ............................... 9
Predictors of Participation and Survey Response Rate ........................................ 10
Survey methodology ................................................................................ 10
Demographic predictors ........................................................................... 12
Psychological predictors .......................................................................... 12
Summary .............................................................................................................. 13
Union Membership .............................................................................................. 15
Research With Union Variables as Predictors ..................................................... 15

vii
Research With Union Variables as Moderators ................................................... 17
Summary .............................................................................................................. 20
METHOD ........................................................................................................................ 22
Participants ........................................................................................................... 22
Measures .............................................................................................................. 24
Employee engagement ............................................................................. 24
Survey response rate ................................................................................ 26
Union membership ................................................................................... 27
Procedures ............................................................................................................ 27
RESULTS ........................................................................................................................ 29
Descriptive Statistics ............................................................................................ 29
Small groups descriptive statistics ........................................................... 29
Large groups descriptive statistics ........................................................... 30
Group comparisons .................................................................................. 30
Pearson Correlations ............................................................................................ 31
Small groups correlations ........................................................................ 31
Large groups correlations ........................................................................ 33
Group comparisons .................................................................................. 34
Standard Multiple Regression Analyses .............................................................. 35
Small groups analysis .............................................................................. 35
Large groups analysis .............................................................................. 36
Group comparisons .................................................................................. 37

viii
Hierarchical Multiple Regression Analyses......................................................... 38
Small groups analyses .............................................................................. 38
Large groups analyses .............................................................................. 44
Group comparisons .................................................................................. 47
DISCUSSION .................................................................................................................. 49
Summary of Results ............................................................................................. 49
Relationships between variables .............................................................. 50
The relationship between employee engagement and survey
response rate............................................................................................. 51
The moderating effect of union membership on the relationship
between employee engagement and survey response rate ....................... 52
Implications.......................................................................................................... 53
Theoretical implications........................................................................... 53
Practical implications ............................................................................... 54
Contributions of the Current Study ...................................................................... 55
Limitations and Future Research ......................................................................... 55
Conclusion ........................................................................................................... 57
REFERENCES ................................................................................................................ 59
APPENDIX ...................................................................................................................... 63

ix
LIST OF TABLES
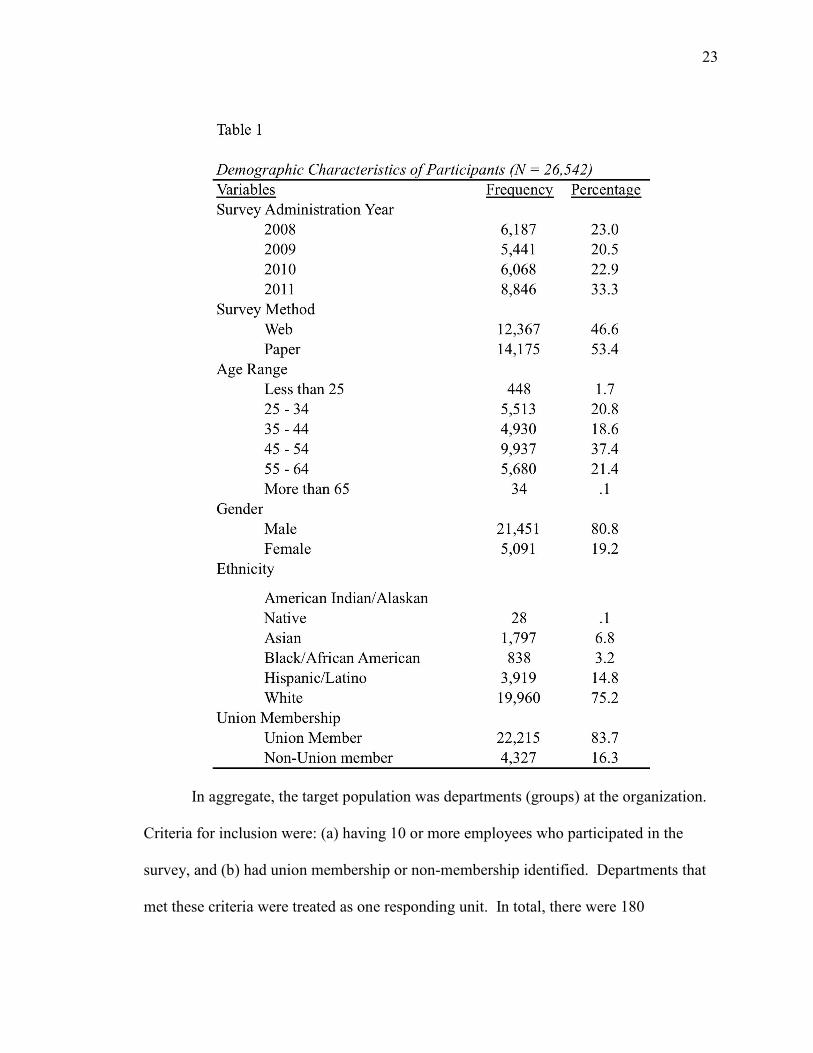
Table 1. Demographic Characteristics of Participants ..................................................... 23
Table 2. Number of Survey Items in Each Dimension .................................................... 25
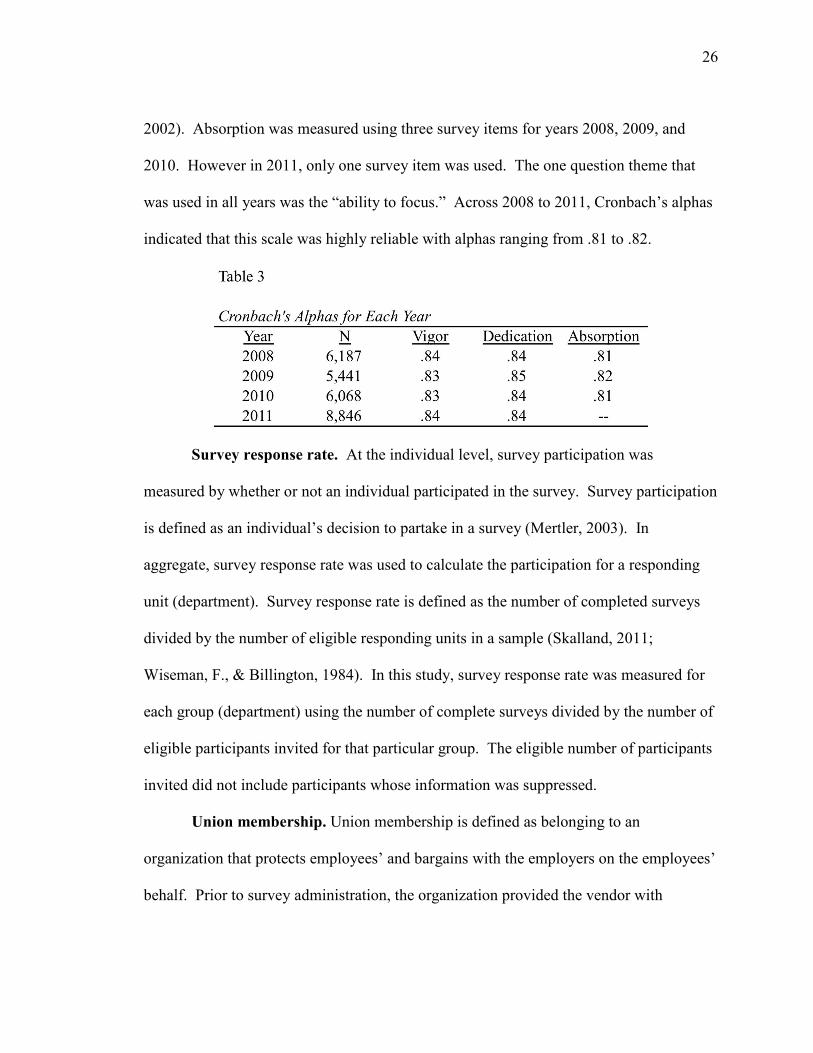
Table 3. Cronbach's Alphas for Each Year ...................................................................... 26
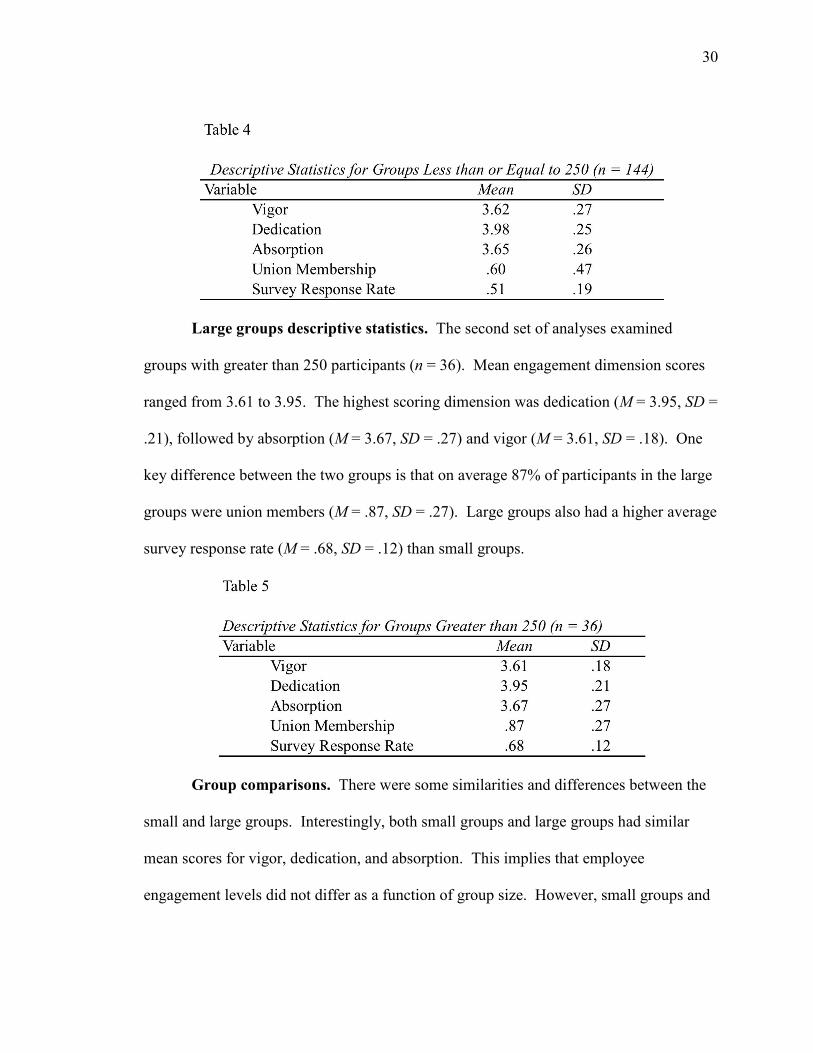
Table 4. Descriptive Statistics for Groups Less than or Equal to 250 ............................. 30
Table 5. Descriptive Statistics for Groups Greater than 250 ........................................... 30
Table 6. Intercorrelations Matrix for Groups Less than or Equal to 250 ......................... 33
Table 7. Intercorrelations Matrix for Groups Greater than 250 ....................................... 34
Table 8. Standard Multiple Regression Analysis: Prediction of Survey Response Rate by Vigor, Dedication, and Absorption for Groups Less than or Equal to 250 ...................................................................................................... 36 Table 9. Standard Multiple Regression Analysis: Prediction of Survey Response Rate by Vigor, Dedication, and Absorption for Groups Greater than 250 ....... 37 Table 10. Hierarchical Multiple Regression Analysis: Prediction of Survey Response Rate by Vigor and Union Membership for Groups Less than or Equal to 250 .................................................................................................. 39 Table 11. Hierarchical Multiple Regression Analysis: Prediction of Survey Response Rate by Dedication and Union Membership for Groups Less than or Equal to 250 .......................................................................................... 40 Table 12. Hierarchical Multiple Regression Analysis: Prediction of Survey Response Rate by Absorption and Union Membership for Groups Less than or Equal to 250 .......................................................................................... 43 Table 13. Hierarchical Multiple Regression Analysis: Prediction of Survey Response Rate by Vigor and Union Membership for Groups Greater than 250 ............................................................................................................. 45 Table 14. Hierarchical Multiple Regression Analysis: Prediction of Survey Response Rate by Dedication and Union Membership for Groups Greater than 250 ............................................................................................................. 46 Table 15. Hierarchical Multiple Regression Analysis: Prediction of Survey

x
Response Rate by Absorption and Union Membership for Groups Greater than 250 ............................................................................................................. 47

xi
LIST OF FIGURES
Figure 1. Interaction effects of dedication on survey response rate for groups less than or equal to 250....................................................................................... 42
1
Introduction
In recent research and organizational surveys, employee engagement has emerged
as an important construct of interest. According to Modern Survey (2013),
approximately 13% of today’s workforce is fully engaged, whereas 27% of employees
are disengaged at work. The remaining 60% of employees are under and moderately
engaged. This means that the majority of today’s workforce is not engaged. Employee
engagement has been found to be predictive of organizational outcomes, such as
productivity, safety, retention, and customer satisfaction (i.e., Cowart, Crowell, & Kaye,
2013; Gallup, 2012). According to Gallup (2002), actively disengaged employees pose a
threat to companies because these employees act consistently against everything at work.
Most importantly, actively disengaged employees engage in behaviors that erode the
beneficial actions and attitudes of engaged employees (Maslach, Schaufeli, & Leiter,
2001). Engaged employees exhibit more energy, experience a state of deep concentration
with their work, and engage in extra-role behaviors. Thus, one possible outcome of
employee engagement is survey response rate because it represents an aggregate of
voluntary employee behaviors. Survey response rate is defined as the number of
completed surveys divided by the number of eligible responding units in a sample
(Skalland, 2011; Wiseman, & Billington, 1984). Survey response rate is important
because it ensures the representativeness of a sample in a population and the validity of
survey results (i.e., Gobo, 2004; Hinkin & Holtom, 2009; Tomaskovic-Devey et al.,
1994). However, the relationship between employee engagement and survey response
rate has not been examined. Furthermore, factors that may influence the relationship

2
between employee engagement and survey response rate have not been examined. The
relationship between psychological predictors and behavioral outcomes may be
moderated by union variables (Bulger, 2001). In industries with unionized workers,
engagement levels, survey response rates, and the influence of union membership are
topics of particular interest. Therefore, the main goal of the present study was to examine
the relationship between employee engagement and survey response rate and to examine
how that relationship varies as a function of union membership.
Employee Engagement
Kahn was one of the first researchers to examine the construct of engagement.
According to Kahn (1990), personal engagement is defined as “the harnessing of
organizational members’ selves to their work roles” (p. 694). Kahn’s engagement is
comprised of the simultaneous investment of an individual’s physical, cognitive, and
emotional energy in active job performance. Within Kahn’s theory, engaged employees
display behaviors that portray some combination of their self and obligatory roles. The
self-role refers to an individual’s personal life (self-expression, creativity, and ideas),
whereas the obligatory role refers to the role that an individual must fulfill at work.
Engaged employees are physically involved in tasks, cognitively attentive, and
emotionally aware of their thoughts, feelings, values, and beliefs.
Although Kahn presented a theoretical model, the term engagement was never
distinctly operationalized in that exact dimensions of engagement were not identified or
defined. However, the construct of employee engagement has been operationalized in
other studies. In particular, Schaufeli, Salanova, González-Romá, and Bakker (2002)

3
sought to operationalize the dimensions of employee engagement. Schaufeli et al. (2002)
defined, employee engagement as “a positive, fulfilling, work-related state of mind that is
characterized by vigor, dedication, and absorption” (p. 74).
The first dimension of employee engagement, vigor, is defined as having high
levels of energy, willingness to exert effort, and having mental resilience and persistence
in one’s work (Schaufeli et al., 2002). A distinct characteristic of vigor is that engaged
employees are willing to go above and beyond when completing their work. Moreover,
engaged employees feel energized by their work, have better mental resilience when
performing tasks, and view work difficulties as a challenge.
The second dimension of employee engagement, dedication, is defined as having
strong involvement, enthusiasm, pride, and a sense of significance (Schaufeli et al.,
2002). Dedicated employees experience a strong sense of involvement both cognitively
and affectively. Moreover, their behaviors reflect strong involvement in work-related
and other company-related activities, such as volunteering, company events, and guest-
speaker seminars. Engaged employees may also affectively and cognitively feel a sense
of pride in the work they do and in the company they work for. Additionally, engaged
employees feel that the work that they do is important and significant.
Lastly, the dimension of absorption is defined as a state of deep concentration and
a state of being deeply engrossed in one’s work (Schaufeli et al., 2002). An engaged
employee experiencing absorption has a persistent state of deep concentration in which
time seems to pass quickly. During this state of absorption, it can become difficult to
remove oneself from work. While completing work, an engaged employee experiences a
4
clear state of mind with effortless concentration and a sense of complete control.
Furthermore, an engaged employee feels enjoyment when completing work-related tasks.
This study adopts the definition of employee engagement proposed by Schaufeli et al.
(2002).
Outcomes of Employee Engagement
Research has examined the relationship between employee engagement and
organizational outcomes. Employee engagement has been found to be positively related
to organizational outcomes, including customer loyalty/satisfaction, productivity, safety,
and retention (Harter, Schmidt, Killham, & Asplund, 2012).
Customer loyalty and satisfaction. Researchers have found that customers had
higher customer engagement levels when they were serviced in departments with
employees with high levels of engagement (Bates, 2004). Talent Management examined
employee engagement and had similar findings: when engagement levels rose
approximately 30%, client satisfaction rates rose approximately 16% for the enterprise
(Cowart, Crowell, & Kaye, 2013). Other researchers have also examined whether
employee engagement could predict customer satisfaction. Gallup (2012) found that top
quartile companies with engaged employees had 10% higher customer satisfaction scores
than bottom-quartile companies.
Productivity. In looking at the effect of employee engagement on productivity at
the organizational level, researchers found that top-quartile companies with highly
engaged employees had 21% higher productivity than bottom-quartile companies
(Gallup, 2012). The Gallup organization studied 89 companies and compared top

5
quartile and bottom quartile engagement levels and found that companies in the top
quartile had 2.6 times higher earnings per share than those in the bottom quartile (Ott,
2007). Additionally, companies with highly engaged employees have experienced higher
returns for shareholders (Irvine, 2009).
In a case study, Gallup examined whether employee engagement could predict
productivity (i.e., net sales and return on investment). Employee engagement
significantly predicted productivity such that productivity increased as employee
engagement increased. For the company in the study, net sales increased by 300%, and
the company had a 600% return on investment (Robison, 2006).
In addition to profitability at the organizational level, researchers have examined
the effects of employee engagement on productivity at the individual level. Rich, LePine,
and Crawford (2010) examined the relationship between job engagement and job
performance. They also examined antecedents (i.e., value congruence, perceived
organizational support, and self core-evaluations) of job engagement. The researchers
found that job engagement significantly mediated the relationships between antecedents
and task performance; employees who had higher value congruence perceived more
organizational support and higher core self-evaluation had higher engagement scores,
which, in turn, led to better performance.
Organizational citizenship behaviors (OCBs). Research discussed in the
previous section examined productivity at the organizational level (e.g., earnings per
share and net sales) and at the individual level (i.e., job performance). Continuing with
predictors at the individual level, researchers have examined the relationship between

6
employee engagement and OCBs. Rich et al. (2010) found that job engagement mediated
the relationship between three antecedents (value congruence, perceived organizational
support, and core self-evaluations) and organizational citizenship behaviors. Employees
who reported high value congruence, perceived greater organizational support, and had
high core self-evaluations had significantly higher engagement scores, which led them to
perform more OCBs.
Positive employee attitudes. Employee engagement has also been found to be
predictive of positive attitudes, such as pride and confidence in the future. In particular,
Modern Survey (2013) conducted a survey on employee engagement, organizational
capabilities, and organizational direction. Participants (N = 1,000) included a sample of
U.S. employees who worked full-time, were 18 years or older, and worked for
organizations with over 100 employees. Industries included in the study were financial
services, heavy manufacturing, health care, government, light manufacturing, retail trade,
education, and business services. The researchers found that engaged employees had a
greater willingness to refer the company to others, had a higher sense of pride, and had a
higher sense of future and were more inspired by their company than disengaged
employees.
Retention, absenteeism, and shrinkage. Researchers have also examined the
effect of engagement on employee retention, absenteeism, and shrinkage (Cowart,
Crowell, & Kaye, 2013; Gallup, 2012; Modern Survey, 2013). In its study, Talent
Management found that as employee engagement rose approximately 30% and turnover
rates dropped approximately 15% for the enterprise (Cowart et al., 2013). More
7
specifically, researchers have examined differences between engaged and disengaged
employees (Gallup 2012; Modern Survey, 2013). For example, Modern Survey (2012)
found that engaged employees had greater intent to stay with the company than
disengaged employees, with 47% of disengaged and 18% of under-engaged employees
actively looking to leave the company. Gallup (2012) also found that engaged employees
exhibited 37% less absenteeism, 25-65% less turnover, and 28% less shrinkage.
Summary
Research has shown employee engagement to be a predictor of many
organizational outcomes. In particular, employee engagement has been found to be
positively related to customer satisfaction, positive attitudes about an organization (e.g.,
pride and optimism about the future), productivity, OCBs, safety, and retention.
Employee engagement has also been found to be negatively related to absenteeism and
shrinkage. Thus, it is important for organizations to assess employees’ level of
engagement in the workplace. One way of measuring or assessing employee engagement
is through regularly scheduled organization-wide surveys. In the next section, I will
discuss organizational surveys and the importance of survey response rate. I will also
discuss predictors of survey response rate (i.e., administration method, demographic
variables and psychological variables).
Survey Response Rate
Organizational surveys. Organizational surveys have become common practice
in many organizations. Organizational surveys are important because surveys provide
mutual benefits for both organizations and employees. By administering a survey, an

8
organization receives feedback critical to identifying issues with the organization’s
functioning. By participating, employees are given the opportunity to influence change
in the organization by providing honest feedback about the organization and their work
environment (Saari & Scherbaum, 2011). According to Sugheir, Coco, and Kaupins
(2011), administration of organizational surveys is a common practice, typically done at
least every two years. In their meta-analysis, they found that the majority (58.1%) of
organizational surveys were administered at least once a year.
Organizations conduct surveys to quantitatively measure specific aspects of an
organization as it relates to employee experience and the workplace (Church &
Waclawski, 2007). Examples of organizational employee surveys include attitude,
opinion, satisfaction, and engagement surveys (Church & Waclawski, 2007; Wyse,
2012). Other organizational surveys also measure behaviors, performance, and processes
(Church & Waclawski, 2007).
Many changes have been made to organizational surveys, especially through the
use of technology. Examples include the administration of organizational surveys online
and the linkage of employee surveys to organizational data. In particular, Saari and
Scherbaum (2011) identified three types of surveys used by organizations: identified
surveys, temporarily-identified surveys, and non-identified surveys. Identified surveys
collect and retain unique identifying information of individual employees and link this
information to their survey results. Employees’ unique identifiers to survey results
remain intact for future use. Temporarily-identified surveys identify employees by their
unique identifying information only at the time of administration or for a short period of
9
time following survey administration. The key difference between these two types of
surveys is that employee responses can be identified using identified surveys, whereas
employee responses using the temporarily-identified surveys are anonymous. The
historically common method of collecting surveys is through non-identified surveys in
which no identifiers are linked to employee responses and demographic information is
collected within the survey itself.
Definition of survey participation and response rate. Past research has
examined the concepts of employee voice and participation in the organization (e.g.,
Budd, Gollan, & Wilkinson, 2010). Employee voice refers to expression of
dissatisfaction at the individual, organizational, management, and employee-employer
relationship levels. Employee participation occurs through many channels, including
direct interactions between managers, peers, employees, membership of formal
institutions, and organizational surveys (Budd et al., 2010). In particular, research has
examined employee voice and participation with regard to union-represented employees.
Through the emergence of labor unions in United States in the late 19th century,
employees have been given a channel to voice their opinions and the potential to shape
company polices regarding compensation, benefits, and productivity (Budd et al., 2010).
Although organizational surveys are useful tools for measuring feedback from
employees, the quality of the information gathered in organizational surveys depends on
survey participation. Survey participation refers to an individual’s decision to partake in
a survey (Mertler, 2003). In aggregate, individual survey participation results in a survey
response rate, which is defined as the number of completed surveys divided by the

10
number of eligible responding units in a sample (Skalland, 2011; Wiseman, & Billington,
1984).
In an organizational setting, researchers have found survey response rates to be as
low as 53% (Tomaskovic-Devey, Leiter, & Thompson, 1994). Some major concerns
related to low survey response rate are the representativeness of the sample used in the
survey and non-response bias (Gobo, 2004; Hinkin & Holtom, 2009; Tomaskovic-Devey
et al., 1994). Sample representativeness refers to having a sample that mirrors, and has
survey results generalizable to, the population of interest (Gobo, 2004). Non-response
bias refers to systematic (i.e., non-random) error that occurs when survey participants
purposely do not take a survey. Non-response bias is a concern because it leads to a non-
representative sample, which poses a threat to the validity of a survey (Tomaskovic-
Devey et al., 1994).
Predictors of Participation and Survey Response Rate
Survey methodology. There are many factors that can influence survey
participation and response rate. In particular, one factor that affects survey response rate
is the survey administration method. In an organizational setting, surveys are commonly
administered via mail, internal mail, in-person, email, phone, and web. Research has
demonstrated survey response rates to be as high or higher when survey administered
electronically compared to traditional mail surveys (Baruch, & Holtom, 2008).
Manfreda, Berzelak, Vehovar, Bosnjak, and Haas (2008) conducted a meta-
analysis to determine whether survey administration method (web-based survey or
alternative survey modes) affected survey response rate. Alternative survey
11
administration methods examined were mail, telephone, fax, email, and other.
Researchers found that web-based surveys had 11% lower survey response rates than
other modes of survey administration. These findings are contradictory to what Baruch
and Holtom (2008) found. However, it is important to note that studies included in the
meta-analysis by Manfreda et al. included empirical studies with surveys administered to
the general population, organizations, education, and army, whereas Baruch and Holtom
examined empirical studies with surveys only administered in organizations.
Methodological factors that affect survey response rate include survey length,
repeated mailings, and delivery method of further contact. Heberlein and Baumgartner
(1978) found that initial survey response rate, survey length, salience of a topic, special
third contact, and number of follow-up contacts explained 90% of variance in final
survey response rate. In particular, survey length, special third contact, and number of
follow-up contacts significantly predicted survey response rate such that people were
more likely to participate in surveys when the length of the survey was shorter, were
contacted in a way that was special (e.g., special delivery, telephone call, personal
contact), or received multiple follow-up contact.
At the individual level, research has examined how organizational administration
of surveys affects employee perceptions and response behaviors. Saari and Scherbaum
(2011) examined existing literature on the relationship between the practice of linking
employee opinion surveys to HR data and employee perceptions of privacy/anonymity
and survey response rate. A key aspect of linkage analysis is that opinion surveys
retained identifying information about each survey respondent over time. A review of the

12
existing literature suggested that linked surveys were related to higher concerns for
privacy/anonymity and lower survey response rate (Mertler, 2003; Saari & Scherbaum,
2011; Thompson & Surface, 2007).
Demographic predictors. Other factors that can affect survey response rate
occur at the individual participant level. According to Heberlein and Baumgartner (1978)
population type is related to survey response rate. They found that students, army
personnel, and employees were more likely to respond to surveys than the general
population. Edmondson, Barnes, and Gupte (2008) also studied the relationship between
individual characteristics and survey response rate. Researchers examined existing
research to develop a theoretical model about the influence of race or ethnicity of survey
participants on response behaviors (i.e., non-response or acquiescent behavior). In
general, employees of color had lower survey participation than Caucasian employees.
Researchers proposed that the influence of race or ethnicity depended upon whether or
not employees of color shared a positive or negative perception of the organization with
others of the same ethnicity. When employees did not share a positive organizational
perception with others of the same race/ethnicity, they were more likely not to respond
for fear of identification or retaliation. When employees did not share a negative
organizational perception with others of the same race/ethnicity, they were more likely
not to respond or to conform their responses based on group member responses. That is,
when employees of color did not share the same organizational perception as others of
the same ethnicity, they were less likely to respond to surveys.
13
Psychological predictors. Psychological predictors are variables of a
psychological nature that predict outcomes. Saliency of a survey topic is an example of a
psychological predictor that can influence survey response or non-response. Saliency
refers to an individual’s interest in and knowledge of a topic (Heberlein & Baumgartner,
1978). Heberlein and Baumgartner found that saliency explained 50.5% of the variance
in final response rate. Participants were more likely to participate in surveys when they
were interested and knowledgeable about the survey topic.
Summary
In summary, previous research examined the relationships between survey
methodology and individual predictors with survey response rate. However, research has
not examined the relationship between organizational surveys and survey response rate.
Previous research also examined the relationship between employee engagement and a
variety of organizational outcomes (Gallup, 2012; Modern Survey, 2013; Rich et al.,
2010). However, research has not examined the relationship between employee
engagement and survey response rate. Employee engagement involves employees going
above and beyond their normal duties and displaying behaviors and attitudes that exhibit
vigor, dedication, and absorption with their work. One way of measuring employee
engagement is through organizational surveys. Therefore, by voluntarily participating in
organizational surveys, employees provide feedback and voice concerns to the
organization. However, this requires that employees feel and think that their opinions
and feedback matter to the organization. Survey response rate should be considered a
positive index because it symbolizes something good about the organization, such as

14
organizational concern for employees and organizational responsiveness based on
employee feedback. Survey response rate could be an indicator of whether or not
employees feel their voice is heard (Budd, Gollan, & Wilkinson, 2010) and can possibly
be a consequence of engagement. Therefore, the purpose of the current study was to
examine the relationship between employee engagement and survey response rate.
Higher employee engagement levels indicate that employees are more connected at work,
more willing to perform extra tasks, and therefore, individuals may be more willing to
voluntarily participate in surveys (Schaufeli et al., 2002). Engagement levels cannot be
known for individuals who do not participate in the survey; therefore, aggregate
engagement scores and group survey response rates can be used as a metric of voluntary
survey response behavior at the aggregate level. Because employee engagement is a
positive predictor and survey response rate is considered a positive index, it is
hypothesized that there will be a positive relationship between the two variables.
Hypothesis 1: There will be a positive relationship between aggregate
employee engagement levels and survey response rates such that the more
engaged groups are, the more likely they are to have higher survey
response rates.
In this study, employee engagement is a psychological predictor and survey
response rate is a behavioral outcome. Previous research suggests that the relationship
between a psychological predictor and a behavioral outcome may be moderated by a
union variable (Bulger, 2001). In the next section, union membership will be discussed
15
as a possible moderator of the relationship between employee engagement and survey
response rate.
Union Membership
By definition, unions are organized associations formed to represent and protect
employee interests, including work conditions, wage insecurity, and benefits (Hogler,
Hunt, & Weiler, 2015). Traditional industries with high union membership include
manufacturing, construction, transportation, utilities, and communications, with the
majority of unionization occurring in the Northeast and Midwest (Western & Rosenfeld,
2011).
In the U. S., labor unions first emerged in the late 19th century (Brochu, & Morin,
2012; Budd, Gollan, & Wilkinson, 2010). Since the 1970s, union membership has
declined drastically due to economics, globalization, and job growth in non-traditional
union industries (Budd et al., 2010; Western & Rosenfeld, 2011). In the private sector,
union membership has declined from 34% to 8% for men and 16% to 6% for women
since 1973. One perceived consequence of this decline in union membership is an
increase in wage inequality between unionized and non-unionized workers. According to
Western and Rosenfeld, wage inequality has increased by over 40% in the private sector.
Research With Union Variables as Predictors
The majority of studies conducted regarding unions have used union variables as
predictors for job satisfaction (Gordon, & Denisi, 1995; Odewahn & Petty, 1980). In
particular, research has examined the relationship between union membership and job
satisfaction. Much research has found that union employees had significantly lower

16
levels of job satisfaction than non-union employees (Bryson, Cappellari & Lucifora,
2004; Hammer & Avgar, 2005; Heywood, Siebert, & Wei, 2002; Odewahn & Petty,
1980; Renaud, 2002; Schwochau, 1987). Bryson, Cappellari, and Lucifora (2010) argue
that these differences occur as a result of non-random group differences. That is,
individuals who are less satisfied self-select or sort into the union membership group
(Heywood et al., 2002). However, other research has found that union membership did
not affect job satisfaction (Gordon, & Denisi, 1995). One likely reason for the
discrepancy of these findings is that findings depended on how researchers controlled for
working conditions across different samples (Gordon, & Denisi, 1995; Renaud, 2002).
According to Renaud (2002), union employees typically have worse working conditions
than non-union employees, which could explain why unionized workers have lower job
satisfaction than non-union workers. Once working conditions have been controlled for,
research has found no differences on job satisfaction between union and non-union
employees (Renaud, 2002).
Research has also studied the relationship between union variables and other
attitudinal outcomes (Hammer & Avgar, 2005; Odewahn & Petty, 1980). For example,
Odewahn and Petty (1980) examined the relationship between union membership and
attitudinal outcomes (job satisfaction, stress, and personal competence) and found that
union employees had significantly higher anxiety levels and lower levels of personal
competence than non-union employees. Brochu and Morin (2012) studied the
relationship between union membership and perceived job insecurity, finding that union

17
employees were significantly more likely than non-union employees to feel insecure
about current and future jobs.
Modern Survey (2013) examined the relationship between union membership and
employee engagement. Modern Survey conducted a national longitudinal study of
employee engagement from 2007 to 2011. This study consisted of a representative
sample of U. S. working adults ages 18 years or older from different regions in the U.S.
Participants were selected to match demographics from U.S. census data. Of that sample,
141 participants were union members and 559 were non-union employees. Participants
were sorted into four categories of engagement levels: fully engaged, moderately
engaged, under engaged, and disengaged. Researchers found union members (33%) were
more likely than non-union members (28%) to be disengaged. Also, non-union members
were more likely than union employees to describe themselves as moderately engaged.
Both union members (37%, 11%) and non-union members (36%, 12%) were almost
equally likely to describe themselves as under-engaged or fully engaged, respectively.
Research With Union Variables as Moderators
A plethora of research has examined union variables as predictors for attitudinal
outcomes. However, relatively little research has examined the extent of union variables
as moderators. Research has examined the moderating effects of psychological union
variables (perceived union tolerance and perceived union support) on the relationship
between sexual harassment and psychological and behavioral outcomes. Mellor and
Golay (2014) examined the moderating effect of two union-related variables (perceived
union tolerance for sexual harassment and perceived union support) on the relationship

18
between sexual harassment and mental health, with the goal of identifying conditions
under which the toxicity of harassment is reduced. Perceived union tolerance for sexual
harassment refers to a union member’s belief regarding union tolerance for harassment
based on union policy and policy-practice on sexual harassment. Perceived union
support refers to a union member’s beliefs about union responsiveness to that member.
Participants included in this study were women who had union membership and lived in
Connecticut, Massachusetts, and New York.
Mellor and Golay (2014) found two significant interaction effects for the
relationship between sexual harassment and mental health. First, perceived union
tolerance and perceived union support influenced the relationship between sexual
harassment and mental health. Under conditions of high perceived union tolerance for
sexual harassment and low perceived union support, women who experienced greater
sexual harassment had higher negative mental health. Under conditions of low perceived
union tolerance for sexual harassment and high perceived union support, there was no
significant relationship between sexual harassment and negative mental health.
Consequently, union involvement affected relationships such that union involvement
produced a buffering effect on relationships. In other words, when employees did not
feel supported by their unions (the union tolerated sexual harassment and did not support
members), sexual harassment adversely affected their mental health. However, when
employees felt supported by their unions (the union did not tolerate sexual harassment
and supported members), the negative effect of harassment on mental health was
nullified.
19
Bulger (2001) examined two relationships: (a) the relationship between reported
sexual harassment and psychological consequences (perceived distress), and (b) the
relationship between organizational tolerance for sexual harassment and the reporting of
harassment. The moderating effects of union resources and union tolerance for sexual
harassment were also examined. Union resources refer to “the number of resources that a
union has in place for dealing with sexual harassment” (p. 728). Union tolerance for
sexual harassment refers to the degree to which a union is perceived as tolerant of sexual
harassment. Participants included in this study were women who were union members
and lived in the Northeast and Midwest United States.
Bulger (2001) first examined the relationship between reported sexual harassment
and psychological outcomes. The researcher found that union tolerance moderated the
relationship between reported sexual harassment and negative psychological outcomes;
however, results did not support their hypothesis of a buffering effect. Instead, union
tolerance influenced the relationship between organizational tolerance for sexual
harassment and negative psychological outcomes, such that women in organizations with
perceived low union tolerance for sexual harassment experienced more negative
psychological outcomes when they reported high sexual harassment. When women in
unions perceived high union tolerance for sexual harassment, there was no significant
relationship between reporting of sexual harassment and negative psychological
outcomes. These results suggest that unions with low tolerance for sexual harassment
exacerbated the effect of sexual harassment on negative psychological outcomes. The
second relationship that Bulger examined was the relationship between organizational

20
tolerance for sexual harassment and reported sexual harassment. The researcher found
that union resources moderated the relationship between organizational tolerance for
sexual harassment and reported sexual harassment. When women were in unions with
fewer resources, the relationship between organizational tolerance for sexual harassment
and reported sexual harassment was strong, such that women were more likely to report
experiencing sexual harassment when organizational tolerance for harassment was high.
However, the relationship was weaker when women were in unions with more resources
for dealing with sexual harassment such that women were less likely to report
experiencing sexual harassment even when organizational tolerance for harassment was
high. These findings suggest that unions that have the resources needed to support
members can neutralize the negative effects of organizations on employees.
Summary
Research in the previous sections examined union variables as moderators of the
relationship between a psychological predictor and psychological and behavioral
outcomes (Bulger, 2001; Mellor & Golay, 2014). Research supports a union variable as a
moderator between a psychological predictor and a behavioral outcome (Bulger, 2001).
In relation to the current study, the findings of Bulger, and Mellor and Golay suggest that
union involvement moderates relationships such that the relationship between a
psychological predictor and a behavioral outcome is weakened when union involvement
is high. This implies that greater union involvement weakens the relationship between
negative events and negative outcomes. Furthermore, it suggests that unions are
protecting employees (buffering the effect of a negative work environment). From this, it

21
can also be inferred that union involvement should strengthen the relationship between
positive predictors and positive outcomes. Conversely, the lack of union involvement
should weaken the relationship between positive predictors and positive outcomes.
Therefore, the second purpose of the current study is to examine if union membership
moderates the relationship between a psychological predictor (employee engagement)
and behavioral outcome (survey response rate).
Hypothesis 2: Union membership will moderate the relationship between
aggregate employee engagement levels and survey response rate, such that union
membership will produce a stronger positive relationship between employee
engagement and survey response rate than non-union membership. In other
words, when union members are highly engaged, they will be more likely than
non-union members to participate in the survey. When union members are not
engaged, they will be less likely than non-union members to participate in the
survey.

22
Method
Participants
At the individual level, the target population was employees at a utility company,
18 years or older. Data were collected at the organization using company-wide employee
engagement surveys administered in 2008, 2009, 2010, and 2011. All employees who
worked part-time or full-time and had been with the company for a minimum of six
months were invited to take the engagement survey. Contracted workers were not invited
to participate in the survey because they were employed by an outside temporary staffing
agency and not by the company.
To protect the confidentiality of participants, demographic data were suppressed
for participants in departments with fewer than 10 participants. Data were also
suppressed for individuals when fewer than 10 participants in a department shared the
same demographic information. Because union membership was considered to be a
demographic variable, union membership information was suppressed within
departments that met the criteria stated above. Consequently, 32,186 (54.81%) of the
58,728 participants were excluded, resulting in a sample size of 26,542.
Participants consisted of 80.8% males and 19.2% females. Approximately 38%
of the respondents were in the age range of 45 to 54; the least frequent age ranges were
less than 25 (1.7%) and more than 65 (.1%). The majority of participants were White
(75.2%), followed by Hispanic/Latino (14.8%), Asian (6.8%), African American (3.2%),
and American Indian/Alaskan Native (.1%). Also, 83.7% of participants were union
members, and 16.7% were non-union members.
23
In aggregate, the target population was departments (groups) at the organization.
Criteria for inclusion were: (a) having 10 or more employees who participated in the
survey, and (b) had union membership or non-membership identified. Departments that
met these criteria were treated as one responding unit. In total, there were 180

24
responding units with number of participating employees ranging from 31 to 2,683 (M =
261.39, SD = 298.55). Because the survey was administered multiple years, some
departments were represented in the sample more than once. In total, there were 78
unique departments, with 33 departments being represented twice and 12 departments
represented three times. In the present study, statistical analyses were conducted at the
aggregate level with 180 departments (groups).
Measures
Employee engagement. At the individual level, employee engagement was
captured using the Employee Engagement Index, which consisted of 14 survey questions
(see Appendix). Survey questions were benchmarked against top performing companies
in the U.S. (Fortune 200) and were validated at the organization via pilot studies during
survey development in 2008. The Employee Engagement Index was used at the
organization from 2008 to 2011. The response format for the survey questions consisted
of a 5-point Likert scale measuring how strongly individuals agreed or disagreed with
statements (1 – Strongly Agree to 5 – Strongly Disagree). For analysis, scores were
reverse coded so that a high score indicated greater engagement. In aggregate, mean
engagement scores were calculated for each group (department) to determine the average
engagement score for that responding unit. It is important to note that the number of
items varied each year (see Table 2). To determine the internal consistency reliability of
the dimensions, a reliability test was conducted on each dimension for each year (see
Table 3).

25
This study adopted the definition of employee engagement proposed by Schaufeli,
Salanova, González-Romá, and Bakker (2002). Employee engagement is defined as “a
positive, fulfilling, work-related state of mind that is characterized by vigor, dedication,
and absorption” (Schaufeli et al., 2002, p. 74).
The first dimension of employee engagement, vigor, is defined as having high
levels of energy, willingness to exert effort, and having mental resilience and persistence
in one’s work. Vigor was measured using five survey items. An example question theme
in this dimension was “invigorate.” Across all four years, Cronbach’s alphas indicated
that this scale was highly reliable with alphas ranging from .83 to .84.
The second dimension of employee engagement, dedication, is defined as having
strong involvement, enthusiasm, pride, and a sense of significance. Dedication was
measured using six survey items for years 2008, 2009, and 2010, and three items in 2011.
An example question theme in this dimension was “belonging.” Across all four years,
Cronbach’s alphas indicated that this scale was highly reliable with alphas ranging from
.84 to .85.
The third dimension of employee engagement, absorption, is defined as a state of
deep concentration and a state of being deeply engrossed in one’s work (Schaufeli et al.,
26
2002). Absorption was measured using three survey items for years 2008, 2009, and
2010. However in 2011, only one survey item was used. The one question theme that
was used in all years was the “ability to focus.” Across 2008 to 2011, Cronbach’s alphas
indicated that this scale was highly reliable with alphas ranging from .81 to .82.
Survey response rate. At the individual level, survey participation was
measured by whether or not an individual participated in the survey. Survey participation
is defined as an individual’s decision to partake in a survey (Mertler, 2003). In
aggregate, survey response rate was used to calculate the participation for a responding
unit (department). Survey response rate is defined as the number of completed surveys
divided by the number of eligible responding units in a sample (Skalland, 2011;
Wiseman, F., & Billington, 1984). In this study, survey response rate was measured for
each group (department) using the number of complete surveys divided by the number of
eligible participants invited for that particular group. The eligible number of participants
invited did not include participants whose information was suppressed.
Union membership. Union membership is defined as belonging to an
organization that protects employees’ and bargains with the employers on the employees’
behalf. Prior to survey administration, the organization provided the vendor with
27
information about every eligible employee, including whether the employee was a union
member. This was used to determine union membership at the participant level. At the
aggregate level, percent of union membership was calculated using group (department)
sum of union members divided by the total number of completed surveys. The total
number of completed surveys did not include participants whose information was
suppressed.
Procedures
On behalf of the organization, a third-party vendor conducted the employee
engagement surveys. Prior to survey administration, the organization provided the
vendor with information about every employee, including whether the employee was a
union member and the group (department) in which the person was employed. Next,
each employee was assigned a unique identifying pin to ensure that survey responses
were linked to a particular employee and employees only took the survey once. The
survey administration period lasted two weeks with surveys being completed at the
location and timing of the participant’s choosing. All participants were invited to take
the survey via email with a link to take the survey online. Online survey submissions
were automatically collected upon either the participant pressing the “submit” button or
completion of at least one survey question by the end of administration period.
In addition to the online survey administration, a subgroup of participants also
received a paper copy of the survey with a unique identifying pin and barcode to link
survey responses to a particular employee. This subgroup was identified as employees
with limited access to Internet connection, consisting mainly of a subset of unionized

28
workers. Paper survey participants were given time at work to complete the survey from
management. The vendor provided paper survey participants with preprinted envelopes
for survey submission. Paper surveys were collected during and after the two-week
administration period, and were counted as valid submissions if they were post marked
by three weeks after the beginning of survey administration. If participants in the paper
submission group also submitted their responses online, only one survey submission was
counted (the most complete). Paper surveys that came back missing the unique
identifying information could not have employee information linked to the survey
responses and were assigned to an “unidentified” group. Once paper surveys were
received, the third party vendor cleaned and coded the data.
After the returned surveys were compiled, the vendor created a database that
mapped survey responses with union membership and group (department) assignment.
Prior to the researcher receiving the data set, the third party vendor removed any
identifying information, such that no specific individual could be linked to his or her
survey response or union membership. With permission of the organization, the third
party vendor provided the data set to the researcher.
29
Results
Descriptive Statistics
The unit of analysis was at the group level (N = 180), rather than the individual
level. Analyses were conducted for two different groups. The first group consisted of
groups with 250 or fewer employees (n = 144) and the second group consisted of groups
with greater than 250 employees (n = 36). These groups represented small groups in the
organization that performed work different from the large groups. On one hand, small
groups performed work that was more centralized in nature and work was typically in the
same geographic location. On the other hand, large groups performed work that was
decentralized and work was performed in many different geographic locations. Another
major difference between the two groups was that small groups mostly performed work
in a corporate setting, whereas large groups mostly performed work in a field setting. For
these reasons, separate analyses were conducted for small and large groups.
Small groups descriptive statistics. The first set of analyses examined groups
with 250 or fewer participants (n = 144). Mean engagement dimension scores ranged
from 3.62 to 3.98. The highest scoring dimension was dedication (M = 3.98, SD = .25),
followed by absorption (M = 3.65, SD = .26) and vigor (M = 3.62, SD = .27). On
average, 60% of individuals in groups were union members (M = .60, SD = .47). The
average group survey response rate was neither high nor low (M = .51, SD = .19).
30
Large groups descriptive statistics. The second set of analyses examined
groups with greater than 250 participants (n = 36). Mean engagement dimension scores
ranged from 3.61 to 3.95. The highest scoring dimension was dedication (M = 3.95, SD =
.21), followed by absorption (M = 3.67, SD = .27) and vigor (M = 3.61, SD = .18). One
key difference between the two groups is that on average 87% of participants in the large
groups were union members (M = .87, SD = .27). Large groups also had a higher average
survey response rate (M = .68, SD = .12) than small groups.
Group comparisons. There were some similarities and differences between the
small and large groups. Interestingly, both small groups and large groups had similar
mean scores for vigor, dedication, and absorption. This implies that employee
engagement levels did not differ as a function of group size. However, small groups and
31
large groups differed in mean union membership rates and survey response rates. On
average, large groups had higher union membership rates and had higher survey
participation rates than small groups. This means that large groups had more union
members and, in general, had more employees voluntarily participate in the survey
compared to small groups.
Pearson Correlations
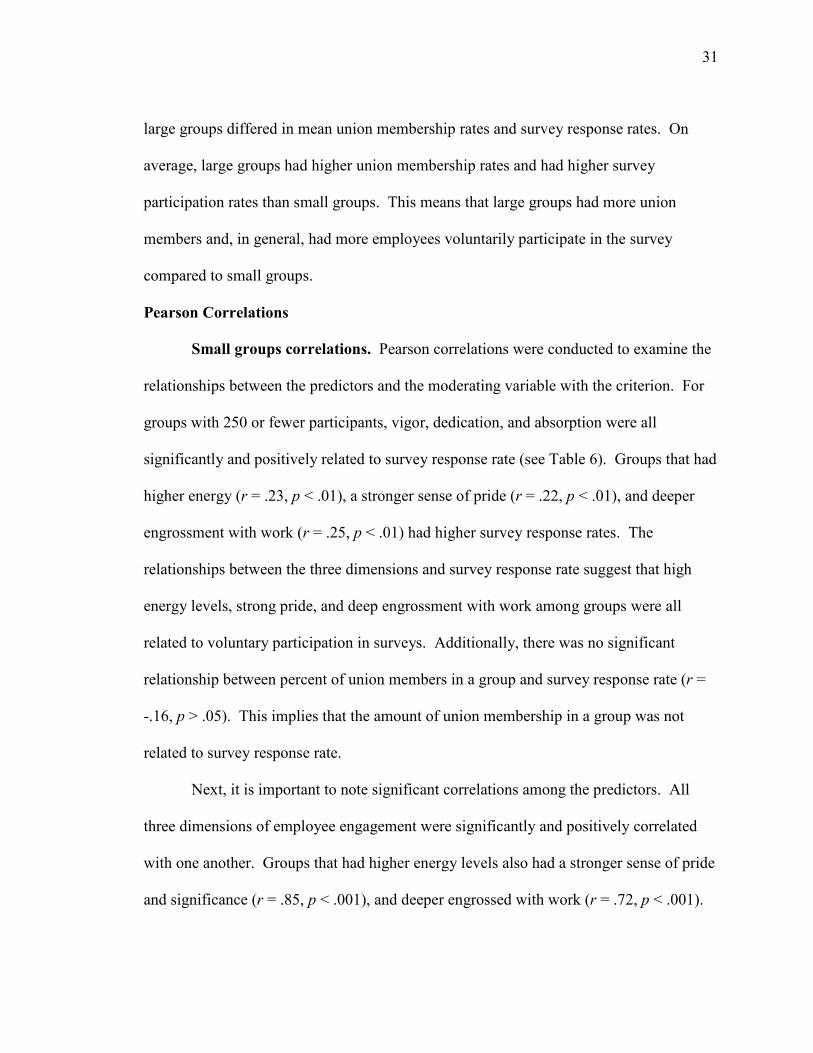
Small groups correlations. Pearson correlations were conducted to examine the
relationships between the predictors and the moderating variable with the criterion. For
groups with 250 or fewer participants, vigor, dedication, and absorption were all
significantly and positively related to survey response rate (see Table 6). Groups that had
higher energy (r = .23, p < .01), a stronger sense of pride (r = .22, p < .01), and deeper
engrossment with work (r = .25, p < .01) had higher survey response rates. The
relationships between the three dimensions and survey response rate suggest that high
energy levels, strong pride, and deep engrossment with work among groups were all
related to voluntary participation in surveys. Additionally, there was no significant
relationship between percent of union members in a group and survey response rate (r =
-.16, p > .05). This implies that the amount of union membership in a group was not
related to survey response rate.
Next, it is important to note significant correlations among the predictors. All
three dimensions of employee engagement were significantly and positively correlated
with one another. Groups that had higher energy levels also had a stronger sense of pride
and significance (r = .85, p < .001), and deeper engrossed with work (r = .72, p < .001).
32
A stronger sense of pride and significance were also related to higher enjoyment at work
(r = .84, p < .001). The strong correlations between predictors indicate that the three
dimensions of employee engagement measured the same construct (i.e., employee
engagement). The strength of these relationships also suggests that these dimensions
were redundant with one another.
It is also important to note significant correlations between the moderating
variable (union membership) and predictors. Union membership was significantly
related to predictors for groups with 250 or fewer participants. Vigor (r = -.67, p < .001)
and dedication (r = -.56, p < .001) were strongly and negatively related to union
membership, whereas absorption was moderately negatively related to union membership
(r = -.37 p < .001). Groups with a higher percentage of union membership were less
likely to experience engagement at work than groups with a lower percentage of union
membership. The relationship between vigor and union membership suggests that groups
with a higher percentage of union membership were more likely than groups with a lower
percentage of union membership to have a less enthusiasm or energy at work. The
relationship between dedication and union membership implies that groups with a higher
percentage of union membership were less likely than groups with a lower percentage of
union membership to have a strong sense of pride about the organization, or to be
involved in extra organizational activities. Lastly, the relationship between absorption
and union membership implies that groups with a higher percentage of union membership
had greater difficultly focusing and did not enjoy completing tasks while at work than
groups with a lower percentage of union membership.

33
Large groups correlations. Pearson correlations were also conducted for groups
with greater than 250 participants. Examining relationships with the criterion, vigor,
dedication, and absorption were all found to be significantly and positively related to
survey response rate (see Table 7). Survey response rates were higher when groups had
higher energy levels (r = .65, p < .001), a stronger sense of personal accomplishment or
pride (r = .56, p < .001), and experienced deeper engrossment with work (r = .57, p <
.001). This suggests that engaged groups were likely to voluntarily participate in surveys.
Examining the relationship between the moderator (union membership) and survey
response rate, there was no significant relationship (r = -.06, p > .05). This implies that
the percent of union membership in a group was not related to survey response rate.
Furthermore, all three dimensions of engagement were also significantly and
positively correlated with one another. Groups that had higher energy levels also had a
stronger sense of pride and significance (r = .74, p < .001). Moreover, groups with

34
higher energy levels were also deeply engrossed with work (r = .67, p < .001). Groups
that had a stronger sense of pride and significance also had a deeper state of engrossment
with work (r = .93, p < .001). It is important to note that this relationship was strong,
indicating that these two dimensions were redundant with one another. Lastly, it is
important to note correlations between union membership and predictors. Unlike small
groups, there were no significant correlations between predictors and union membership
for large groups, suggesting that group engagement levels and the percentage of union
membership were not related.
Group comparisons. Comparing small and large groups, the relationships
between the dimensions of engagement and survey response rate were stronger for groups
with greater than 250 participants. This suggests that there were stronger relationships
between energy levels, pride, and work engrossment with survey response rate for large
groups compared to small groups. For both groups, there was no significant relationship
between union membership and survey response rate. Additionally, high energy levels, a

35
strong sense of pride, and deep engrossment with work were all related to one another for
both small and large groups. In particular, pride and engrossment with work were
strongly related to one another for large groups. Lastly, one major difference between
small and large groups was that the relationship between union membership and survey
response rate was only significant for small groups. This implies that the relationship
between the percentage of union membership for a group and survey response rate only
existed for groups with 250 or fewer participants.
Standard Multiple Regression Analyses
Hypothesis 1 stated that employee engagement would be positively related to
survey response rate. To test this hypothesis, a standard multiple regression analysis was
conducted to examine the predictive value of the three dimensions of employee
engagement (vigor, dedication, and absorption).
Small groups analysis. For groups with 250 or fewer participants, the three
dimensions of employee engagement were entered as a set and were significantly related
to survey response rate (see Table 8). The three dimensions accounted for 7% of
variance in survey response rate (R = .26, R2 = .07, R2adj = .05, F(3,140) = 3.43, p < .05).
Examining the three dimensions of engagement more closely, none of the dimensions of
employee engagement had a significant unique relationship with survey response rate.
Given that the overall relationship was significant, the predictors had non-significant
betas likely due to multicollinearity. In other words, the predictors were highly
correlated, and therefore redundant, with one another. Furthermore, there was a negative
beta for dedication, suggesting that groups with a stronger sense of pride and significance

36
had lower survey response rates. Comparing the negative beta of dedication with its
positive correlation with survey response rate (r = .22) suggests that dedication was a
suppressor variable due to its strong correlation with absorption (r = .84). Thus, the
negative beta of dedication should be considered a statistical artifact rather than an
interpretable and meaningful effect. Thus Hypothesis 1 was supported for small groups,
such that groups with higher energy levels, a stronger sense of pride, and deeper
engrossment were related to higher survey response rates.
Large groups analysis. For groups with more than 250 participants, the three
dimensions of employee engagement were also entered as a set and were significantly
related to survey response rate (see Table 9). Vigor, dedication, and absorption
accounted for 46% of variance in survey response rate (R = .68, R2 = .46, R2adj = .41,
F(3,32) = 9.17, p < .001). This is a much stronger effect than the effect found for small
groups. Only vigor had a significant unique relationship with survey response rate (β =
.54, t = 2.78, p < .01), indicating that groups with higher energy levels and higher
numbers of voluntary behaviors had higher survey response rates. Like small groups, the
beta for dedication was negative, whereas the correlation between dedication and

37
absorption were positive, indicating that dedication was a suppression variable. Once
again, Hypothesis 1 was supported for large groups, such that groups with higher
employee engagement level also had higher survey response rates.
Group comparisons. In summary, for both groups, groups with more engaged
employees had higher survey participate rates. The difference in the explained variance
between the two groups (small and large) suggests that group size might moderate the
relationship between employee engagement and survey response rate, such that the
relationship was stronger for large groups. Furthermore, there were no significant
individual predictors for small groups; however, there was a significant relationship
between vigor and survey response rate for large groups. This implies that the
relationships between predictors and survey response rate were stronger for large groups.
Moreover, for both small and large groups, the negative betas for dedication and positive
correlations between dedication and absorption suggest that dedication was a suppressor
variable. In conclusion, for both small and large groups, results supported Hypothesis 1,

38
such that groups with higher energy levels, a stronger sense of pride, and deeper
engrossment with work had higher survey response rates.
Hierarchical Multiple Regression Analyses
Hypothesis 2 stated that union membership would moderate the relationship
between employee engagement and survey response rate, such that the relationship
between engagement and survey response rate would be stronger when union
membership was high than when it was low. To test this hypothesis, three separate
hierarchical multiple regression analyses were conducted to examine the predictive value
of union membership, above and beyond the three engagement dimensions.
Small groups analyses. The first set of analyses examined the moderating effect
of union membership for groups with 250 or fewer participants. The first hierarchical
multiple regression analysis was conducted to examine the moderating effect of union
membership on the relationship between vigor and survey response rate. Vigor was
entered in Step 1, union membership was entered in Step 2, and the cross product of vigor
and union membership was entered in Step 3 (see Table 10). In Step 1, vigor accounted
for 6% of the variance in survey response rate (R2 = .06, R2adj = .05, F(1,142) = 8.22, p <
.01). Groups that had higher energy levels and resilience had higher survey participation
rates than groups with lower energy levels and resilience. In Step 2, union membership
and vigor accounted for 6% of the variance in survey response rate (R2 = .06, R2adj = .04,
F(2,141) = 4.08, p < .05). However, there was no significant incremental value of union
membership (ΔR2 = .00, ΔF(1,141) = .00, p > .05). Although the overall relationship was
significant, union membership did not add any predictive value to the relationship

39
between energy levels and survey response rate. In Step 3, the cross product of union
membership and vigor, union membership, and vigor accounted for 6% of the variance in
survey response rate (R2 = .06, R2adj = .04, F(3,140) = 3.02, p < .05). However there
was no significant incremental value of the cross product of union membership and vigor
on survey response rate (ΔR2 = .00, ΔF(1,140) = .90, p > .05) above and beyond that of
union membership and vigor. This suggests that union membership did not moderate the
relationship between vigor and survey response rate.
A second hierarchical multiple regression analysis was conducted to examine the
moderating effect of union membership on the relationship between dedication and
survey response rate. In this analysis, dedication was entered in Step 1, union
membership was entered in Step 2, and the cross product of dedication and union
membership was entered in Step 3 (see Table 11). In Step 1, dedication accounted for
5% of variance in survey response rate (R2 = .05, R2adj = .04, F(1,142) = 7.02, p < .01).
Groups with a stronger sense of pride and personal significance at work had higher

40
survey response rates than groups with a lower sense of pride or significance. In Step 2,
dedication and union membership accounted for 5% of variance in survey response rate
(R2 = .05, R2adj = .04, F(2,141) = 3.66, p < .05). Although the overall relationship was
significant, the percentage of union membership in a group did not add any predictive
value to the relationship between pride and personal accomplishment with survey
participation behavior. Union membership did not have a significant incremental effect,
above and beyond dedication (ΔR2 = .00, ΔF(1,141) = .34, p > .05). In Step 3, the cross
product of union membership and dedication, union membership, and dedication
accounted for 8% of variance in survey response rate (R2 = .08, R2adj = .06, F(3,140) =
3.86, p < .05). The cross product of union membership and dedication also had a
significant incremental effect, above and beyond union membership and dedication (ΔR2
= .03, ΔF(1,140) = 4.09, p < .05). This indicates that union membership moderated the
relationship between dedication and survey response rate.

41
Two standard regression analyses were conducted to examine the relationship
between dedication and survey response rate for groups with “low” and “high” union
membership (see Figure 1). Low and high union membership were determined by
calculating the median value for percentage of union membership. Groups that were less
than the median were put in the low union membership group, and groups that were equal
to or above the median were put in the high union membership group. The relationship
between dedication and survey response rate was significantly and positively stronger
when union membership was low (R2 = .10, R2adj = .09, F(1,69) = 7.86, p < .01) than
when union membership was high (R2 = .00, R2adj = -.01, F(1,71) = .01, p > .05). This
partially supports Hypothesis 2, however, high union membership did not increase the
strength of the relationship between dedication and survey response rate as predicted.
Rather, union membership moderated the relationship between dedication and survey
response rate such that it nullified the relationship. When union membership was low,
there was a strong positive relationship between dedication and survey response rate. In
other words, when the percent of union membership was low, highly dedicated groups
had higher survey response rates. However, when percent of union membership was
high, there was no relationship between dedication and survey response rate. That is, a
high percentage of union membership did not influence the relationship between having a
sense of pride or personal accomplishment and survey response rate.

42
Figure 1. Interaction effects of dedication on survey response rate for groups less than or equal to 250 (n = 144).
Lastly, a third hierarchical multiple regression analysis was conducted to examine
the moderating effect of union membership on the relationship between absorption and
survey response rate. Absorption was entered in Step 1, union membership was entered
in Step 2, and the cross product of union membership and absorption was entered in Step
3 (see Table 12). In Step 1, absorption accounted for 6% of variance in survey response
rate (R2 = .06, R2adj = .05, F(1,142) = 9.08, p < .01). Groups that had deeper
engrossment with work were more likely to have higher survey response rates than
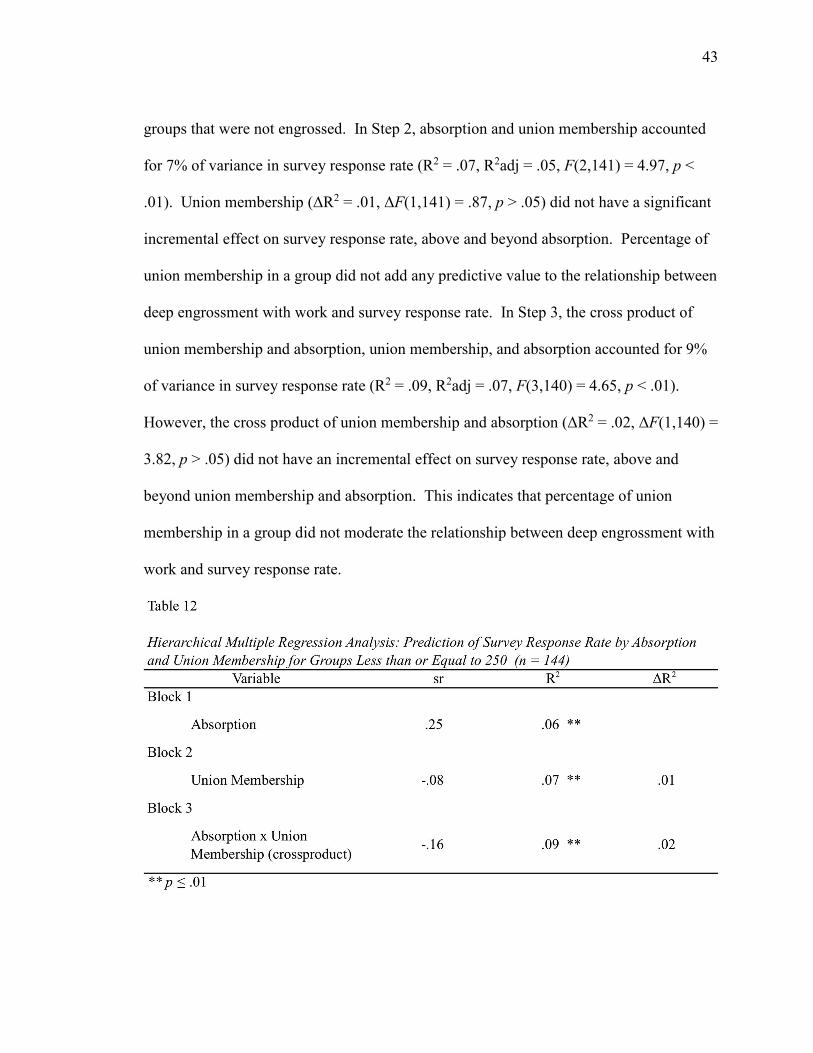
43
groups that were not engrossed. In Step 2, absorption and union membership accounted
for 7% of variance in survey response rate (R2 = .07, R2adj = .05, F(2,141) = 4.97, p <
.01). Union membership (ΔR2 = .01, ΔF(1,141) = .87, p > .05) did not have a significant
incremental effect on survey response rate, above and beyond absorption. Percentage of
union membership in a group did not add any predictive value to the relationship between
deep engrossment with work and survey response rate. In Step 3, the cross product of
union membership and absorption, union membership, and absorption accounted for 9%
of variance in survey response rate (R2 = .09, R2adj = .07, F(3,140) = 4.65, p < .01).
However, the cross product of union membership and absorption (ΔR2 = .02, ΔF(1,140) =
3.82, p > .05) did not have an incremental effect on survey response rate, above and
beyond union membership and absorption. This indicates that percentage of union
membership in a group did not moderate the relationship between deep engrossment with
work and survey response rate.
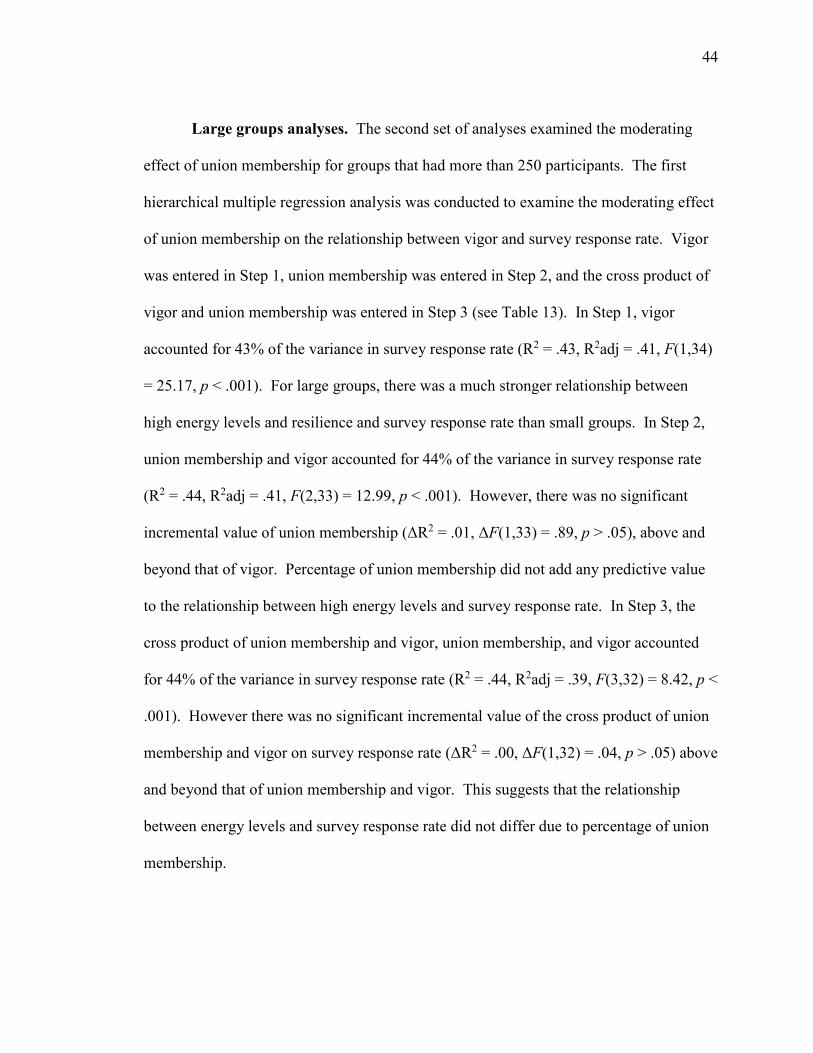
44
Large groups analyses. The second set of analyses examined the moderating
effect of union membership for groups that had more than 250 participants. The first
hierarchical multiple regression analysis was conducted to examine the moderating effect
of union membership on the relationship between vigor and survey response rate. Vigor
was entered in Step 1, union membership was entered in Step 2, and the cross product of
vigor and union membership was entered in Step 3 (see Table 13). In Step 1, vigor
accounted for 43% of the variance in survey response rate (R2 = .43, R2adj = .41, F(1,34)
= 25.17, p < .001). For large groups, there was a much stronger relationship between
high energy levels and resilience and survey response rate than small groups. In Step 2,
union membership and vigor accounted for 44% of the variance in survey response rate
(R2 = .44, R2adj = .41, F(2,33) = 12.99, p < .001). However, there was no significant
incremental value of union membership (ΔR2 = .01, ΔF(1,33) = .89, p > .05), above and
beyond that of vigor. Percentage of union membership did not add any predictive value
to the relationship between high energy levels and survey response rate. In Step 3, the
cross product of union membership and vigor, union membership, and vigor accounted
for 44% of the variance in survey response rate (R2 = .44, R2adj = .39, F(3,32) = 8.42, p <
.001). However there was no significant incremental value of the cross product of union
membership and vigor on survey response rate (ΔR2 = .00, ΔF(1,32) = .04, p > .05) above
and beyond that of union membership and vigor. This suggests that the relationship
between energy levels and survey response rate did not differ due to percentage of union
membership.
45
Next, a second hierarchical multiple regression analysis was conducted to
examine the moderating effect of union membership on the relationship between
dedication and survey response rate. Dedication was entered in Step 1, union
membership was entered in Step 2, and the cross product of union membership and
dedication was entered in Step 3 (see Table 14). In Step 1, dedication accounted for 32%
of variance in survey response rate (R2 = .32, R2adj = .30, F(1,34) = 15.85, p < .001).
Groups with a stronger sense of pride and personal significance at work had higher
survey response rates than groups with a weaker sense of pride and significance. In Step
2, dedication and union membership accounted for 36% of variance in survey response
rate (R2 = .36, R2adj = .32, F(2,33) = 9.13, p = .001). Union membership did not have a
significant incremental effect, above and beyond dedication (ΔR2 = .04, ΔF(1,33) = 1.96,
p > .05). Percentage of union membership in a group did not add any predictive value to
the relationship between a strong sense of pride and personal significance and survey
response rate. In Step 3, the cross product of union membership and dedication, union

46
membership, and dedication accounted for 37% of variance in survey response rate (R2 =
.37, R2adj = .32, F(3,32) = 6.36, p < .01). The cross product of union membership and
dedication did not have a significant incremental effect, above and beyond union
membership and dedication (ΔR2 = .01, ΔF(1,32) = .89, p < .05). In summary,
dedication, union membership, and the cross product of union membership and
dedication explained approximately two-fifths of variance in survey response rate.
However, there was no significant moderating effect of the percentage of union
membership in a group.
Lastly, a third hierarchical multiple regression analysis was conducted to examine
the moderating effect of union membership on the relationship between absorption and
survey response rate. Absorption was entered in Step 1, union membership was entered
in Step 2, and the cross product of union membership and absorption was entered in Step
3 (see Table 15). In Step 1, absorption accounted for 32% of variance in survey response
rate (R2 = .32, R2adj = .30, F(1,34) = 16.20, p < .001). In Step 2, absorption and union

47
membership accounted for 39% of variance in survey response rate (R2 = .39, R2adj =
.35, F(2,33) = 10.50, p < .001). Union membership (ΔR2 = .07, ΔF(1,33) = 3.58, p > .05)
did not have a significant incremental effect on survey response rate, above and beyond
absorption. In Step 3, the cross product of union membership and absorption, union
membership, and absorption accounted for 41% of variance in survey response rate (R2 =
.41, R2adj = .36, F(3,32) = 7.54, p = .001). However, the cross product of union
membership and absorption (ΔR2 = .02, ΔF(1,32) = 1.37, p > .05) did not have an
incremental effect on survey response rate, above and beyond union membership and
absorption. This indicates that the relationship between absorption and survey response
rate did not differ as a function of the percentage of union membership in a group.
Group comparisons. For both small and large groups, there were significant
relationships between the three engagement dimensions and survey response rate.
Additionally, union membership had no incremental effect on the relationship between
employee engagement and survey response rate. This could be due to multicollinearity of
48
variables. Lastly, with one exception, percentage of union membership did not moderate
the relationship between engagement and survey response rate for both groups. Only
small groups had a significant interaction effect between dedication and union
membership. Groups that had a lower percentage of union membership had a stronger
sense of pride and significance and higher survey response rates than groups with a high
percentage of union membership. The more dedicated groups were, the more likely they
were to participate in survey when the percentage of union members was low.

49
Discussion
Employee engagement is a topic of particular interest to organizations and
researchers. Research has demonstrated employee engagement to be related to many
organizational outcomes, such as productivity, low turnover, and organizational
citizenship behaviors (Gallup, 2012; Cowart et al., 2013; Rich et al., 2010). Furthermore,
organizations are interested in having high employee participation in organizational
surveys. With regard to employee engagement, survey participation represents a
behavior that employees can voluntarily choose to engage in. However, the relationship
between employee engagement and survey participation behavior has not been examined,
nor have factors that influence the strength of this relationship. In unionized industries,
there is also much interest in how union membership affects the relationship between
employee engagement and survey participation behavior. Hence, the purpose of the
present study was to examine the relationship between employee engagement and survey
response rate, and how that relationship varied as a function of union membership.
Summary of Results
Analyses were conducted at the aggregate level, looking at two different group
sizes to examine group differences. The first grouping, small groups, consisted of groups
with 250 or fewer employees. The second grouping, large groups, consisted of groups
with greater than 250 employees. Smaller groups represented groups in the organization
that performed centralized work, whereas large groups represented groups in the
organization that performed decentralized work. Another major distinction between
groups was that smaller groups tended to perform work in a corporate setting, and larger

50
groups tended to perform work in a field setting. In general, both small and large groups
had high mean levels for each dimension of engagement; energy levels, a sense of pride
and significance, and for engrossment with work. However, larger groups had a greater
number of employees participate in the survey and a greater number of unionized
employees than smaller groups.
Relationships between variables. For both small and large groups, the
relationship between energy levels, pride, and engrossment with work were all positively
related to survey response rate. However, the relationships were stronger for larger
groups than smaller groups. Also, union membership was not related to survey response
rate for either group, implying that the percentage of union membership in a group was
not associated with survey response rate. For both small and large groups, the
dimensions of engagement were highly correlated with one another, suggesting that the
all three dimensions measured the same construct and were possibly redundant with each
other. For small groups, the strongest relationships were between high energy levels and
a strong sense of pride or significance, and a strong sense of pride or significance and
engrossment with work. For large groups, the strongest relationship was between a
strong sense of pride or significance and deep engrossment with work. One major
difference between groups was that the relationship between union membership and
predictors was only significant for small groups. This suggests that in groups with 250 or
fewer participants, vigor, dedication, and absorption were related to survey response rate.
The relationship between employee engagement and survey response rate.
Two regression analyses were conducted to examine the relationship between employee

51
engagement and survey response rate at group level. For both small and large groups,
employee engagement predicted survey response rates. Groups that had higher energy
levels and more resilient, had a stronger sense of pride and personal accomplishment, and
deeper engrossment with work were more likely to have higher survey response rates
than less engaged groups. However, this relationship was much stronger for larger
groups than smaller groups. Engaged groups were more likely to have higher response
rates for organizational surveys in large groups compared to small groups possibly due to
the survey administration method. All employees were invited to participate in the
survey online via email. However, a subgroup of individuals who were union members
was also invited to take the survey via paper. Larger groups had a larger percentage of
unionized employees who had two chances to take the survey, compared to non-union
employees who were only invited to take the survey online.
It is important to note that, among the engagement dimensions, only vigor was
uniquely related to survey response rate for large groups. Given that all of the
engagement dimensions were individually related to survey response rate, the lack of
significant unique relationships for dedication and absorption was probably due to
multicollinearity between these predictors. This means that energy at work, pride, and
engrossment with work were all highly related, and therefore redundant, with one
another. This overlap between engagement dimensions explains why the unique
relationship between dedication and survey response rate, albeit not significant, was
found to be negative for both small and large groups even though its individual
relationship was positive.

52
The moderating effect of union membership on the relationship between
employee engagement and survey response rate. For large groups, the percentage of
union membership in a group did not influence the relationship between energy at work,
pride, and engrossment with work and survey response rate. This suggests that the
relationship between employee engagement and survey response rate did not depend on
union membership. Regardless of the percentage of union membership, engaged groups
were more likely to participate in the survey than less engaged employees. Given that the
size of the sample for large groups was small, it is not a surprise that no significant
moderating effect was found.
For small groups, union membership only influenced the relationship between
dedication (having a sense of pride and personal accomplishment at work) and survey
response rate. The relationship between dedication and survey response rate was
influenced by percentage of union membership, such that a high percentage of union
membership nullified the relationship between the variables. When percentage of union
membership was low, groups with a stronger sense of pride were more likely to
participate in the survey than less engaged groups. When percentage of union
membership was high, engaged groups with a sense of pride and disengaged groups
without a sense of pride were equally likely to participate in the survey. However, no
moderating effect was found for the relationship between energy and survey response
rate, or for the relationship between engrossment with work and survey response rate.
Implications
53
Theoretical implications. The results of the present study confirm previous
research regarding the relationship between engagement and voluntary behaviors in the
workplace (Rich et al., 2010). The present study shows such a relationship at group
level. Like previous research, engaged groups were more likely than disengaged groups
to engage in the voluntary behavior being measured (survey response rate). In addition,
the results of this study partially align with previous research on the influence of a union
variable on the relationship between psychological predictors and behavioral outcomes
(Bulger, 2001; Mellor & Golay, 2014). Previous research found that union variables
weakened the relationship between a negative psychological predictor and negative
behavioral outcome. In examining the relationship between a positive predictor
(engagement) and a positive outcome (survey response rate), one significant moderating
effect was found on the relationship between dedication and survey participation for
small groups. Moreover, results conflict with the hypothesis that union variable would
strengthen the relationship between a positive predictor and a positive outcome
(Hypothesis 2), suggesting that percentage of union membership in a group can weaken
the positive relationship between employee engagement and survey participation for
organizations.
One critical theoretical implication of this study is that group size influenced the
relationship between employee engagement and survey response rate, such that the
relationship was stronger for larger groups. This finding is contrary to previous research,
which suggested that group size did not influence survey response rate (Baruch &
Holtom, 2008). This suggests that the size of a work group may play a critical role in the

54
relationship between engagement and positive work outcomes, and to a lesser degree the
moderating effect of union membership.
Practical implications. One important question that organizations should be
asking is what the engagement levels of employees who do not participate in employee
engagement surveys are. The results of this study indicate that there is a positive
relationship between group engagement and survey response rate, suggesting that one
reason for a lack of survey participation might be disengagement from work. Groups that
are energized by their work, are more willing to engage in more extra-role behaviors, feel
a sense of pride, and enjoy their work are more likely to have higher survey response
rates than disengaged groups. However, the strength of this relationship is weaker for
smaller groups than larger groups, suggesting that smaller groups should possibly put
interventions (action plans) into place to increase engagement levels for group members.
From a group perspective, survey participation indicated the engagement level of
employees for that particular group. Lower group survey participation was linked to
lower energy levels, a lower sense of pride or personal accomplishment at work, and a
lower sense of engrossment with work. Research has demonstrated that employees who
are disengaged are more likely to engage in unwanted behaviors, such as theft,
absenteeism, and attrition (Cowart, Crowell, & Kaye, 2013; Gallup, 2012; Modern
Survey, 2013). Additionally, having disengaged employees can erode the beneficial
actions and attitudes of engaged employees (Maslach, Schaufeli, & Leiter, 2001). From a
group and organizational perspective, lower survey participation may be indicative of
lower engagement levels. In other words, it might be another diagnostic tool (along with
55
employee engagement scores) for identifying groups where cultural and organizational
changes need to occur.
Contributions of the Current Study
The present study was the first study to examine the relationship between
employee engagement and survey response rate at the group level. This study introduces
voluntary employee survey participation (survey response rate) as a possible index of
group employee engagement levels. This is particularly interesting given that
engagement levels cannot be known for survey non-participants. In a way, survey non-
participation could indicate intentional sabotage behaviors that employees engage in
when they are disengaged, or employees who are in a state of disengagement.
Moreover, the present study was the first study to examine factors that may
influence the relationship between employee engagement and survey response rate. In
unionized industries, the influence of union membership on employee engagement and
survey participation is a particular topic of interest for organizations. In the present
study, percentage of union membership for a group only influenced the relationship
between having a strong sense of pride and personal accomplishment and survey
response rate in small groups.
Limitations and Future Research
One major limitation of the present study was that predictors were highly
correlated with one another. This is a concern because it likely limited the unique
contributions of predictors in the relationship between employee engagement and survey
response rate. Moreover, the strong relationships between dimensions of engagement

56
indicate redundancy. Given the high correlations between variables, further research is
needed to examine how union membership influences the relationship between the
dimensions of engagement and survey participation behavior.
A second limitation of the current study was that the study was conducted at a
single organization in the utility industry. This may limit the generalizability of the
results to other organizations or other industries. In particular the moderating variable
(union membership) is only generalizable to other unionized industries, such as
construction, manufacturing and transportation. Additionally, the generalizability of
group findings will depend on whether or not the nature of the work is centralized or
decentralized geographically speaking, and whether or not the nature of the work
performed is similar to the described groups. Therefore, future research is needed to
replicate the findings of (a) the relationship between employee engagement and survey
response rate in other organizations and industries and (b) the moderating effect of union
membership at different organizations in unionized industries.
A third limitation is the sample size used for large groups. The small size may
have limited the strength and significance of relationships found. Large groups also had
a higher amount of unionized employees than small groups. Further research is needed to
examine how this influenced the moderation effect of union membership on the
relationship between employee engagement and survey response rate with a larger
sample size for large groups. Given that some of the groups were measured more than
once, the assumption of the independent of observation was violated. Thus, the results
should be interpreted with caution.
57
Lastly, one particularly interesting finding was the non-significant negative
unique relationship between dedication and survey response rate. Unlike the other
dimensions of engagement, the negative relationship indicates that groups that had a
sense of pride and accomplishment were less likely to participate in the survey.
However, dedication was also highly correlated with absorption, indicating that it was a
suppressor variable. Future research is needed to examine the nature of this relationship
and why it occurred.
Conclusion
Given the many benefits of having an engaged workforce, employee engagement
is an important topic of interest for organizations. Engaged employees have been found
to relate to a variety of organizational outcomes, including a willingness to perform extra-
role tasks. One way of measuring employee engagement is through organizational
surveys. To ensure the validity of results, organizational surveys need a representative
sample of the organization participate. Thus, research has examined the relationship
between survey methodology and survey response rate. Survey response rate represents
the aggregate of voluntary employee participation in surveys and may be an outcome of
employee engagement. However, previous research has not examined the relationship
between employee engagement and voluntary survey participation behavior. Moreover,
research has not examined how this relationship may vary as a function of union
membership. Therefore, the purpose of the present study was to address this gap in the
literature and provide insight at the group level. Results revealed that there was a
positive relationship between the variables, with larger groups having stronger

58
relationships. This suggests that survey response rate is an indicator of group
engagement levels. Survey response rate can be used as a diagnostic tool to examine
engagement levels, and to a certain extent reveal disengagement at the group level.
Furthermore,, the relationship between pride and survey response rate was influenced by
percentage of union membership in a group. However, this only occurred for small
groups with 250 or fewer participants. Additional research is needed to validate the
findings of the current study and further understand the moderating effect of union
membership.

59
References
Baruch, Y., & Holtom, B. C. (2008). Survey response rate levels and trends in organizational research. Human Relations, 61, 1139-1160.
Bates, S. (2004, February). Getting engaged. HR Magazine, 49(2). Retrieved from:
http://www.shrm.org/publications/hrmagazine/editorialcontent/pages/0204covstory.aspx
Budd, J. W., Gollan, P. J., & Wilkinson, A. (2010). New approaches to employee voice
and participation in organizations. Human Relations 63, 303-310. doi:10.1177/0018726709348938
Brochu, P., & Morin, L. P. (2012). Union membership and perceived job insecurity:
Thirty years of evidence from the American General Social Survey. Industrial &
Labor Relations Review, 65, 263-285. Bryson, A., Cappellari, L., & Lucifora, C. (2004). Does union membership really reduce
job satisfaction? British Journal of Industrial Relations, 42, 439-459. Bryson, A., Cappellari, L., & Lucifora, C. (2010). Why So Unhappy? The Effects of
Unionization on Job Satisfaction. Oxford Bulletin of Economics and Statistics, 72, 357-380.
Bulger, C. A. (2001). Union resources and union tolerance as moderators of relationships
with sexual harassment. Sex Roles, 45, 723-741. doi:10.1023/A:1015684202115 Church, A. H., & Waclawski, J. (2007). Designing and using organizational surveys: A
seven-step process. John Wiley & Sons. Cowart, L., Crowell, B., & Kaye, B. (2013, July). Engagement leads to growth at
Morrison. Retrieved from: http://www.talentmgt.com/articles/engagement-leads-to-growth-at-morrison
Dernovsek, D. (2008). Engaged employees. Credit Union Magazine, 74, 42-46. Edmondson, V. C., Barnes, J., & Gupte, G. (2008). Weakness in numbers: Towards an
understanding of employees of color’s responses to organizational research efforts. Journal of Behavioral and Applied Management, 10, 89-109.
Gallup. (2002, April). The high cost of disengaged employees. Business Journal.
Retrieved from: http://www.gallup.com/businessjournal/247/the-high-cost-of-disengaged-employees.aspx

60
Gallup. (2012). Engagement at work: Its effect on performance continues in tough economic times. Retrieved from: http://www.gallup.com/services/176657/engagement-work-effect-performance-continues-tough-economic-%20times.aspx?utm_source=engagement%20work%20effect%20performance&utm_medium=search&utm_campaign=tiles
Gobo, G. (2004). Sampling, representativeness and generalizability. Qualitative Research
Practice, 435 – 456. Retrieved from: http://ggobors.ariel.ctu.unimi.it/repository/ggobors/sage2004.pdf
Gordon, M. E., & Denisi, A. S. (1995). A re-examination of the relationship between
union membership and job satisfaction. Industrial & Labor Relations Review, 48, 222-236.
Hammer, T. H., & Avgar, A. (2005). The impact of unions on job satisfaction,
organizational commitment, and turnover. Journal of Labor Research, 26, 241-266.
Harter, J. K., Schmidt, F. L., Killham, E. A., Asplund, J. W. (2012). Q12 meta-analysis.
Gallup. Retrieved from: http://strengths.gallup.com/private/Resources/Q12Meta-Analysis_Flyer_GEN_08%2008_BP.pdf
Heberlein, T. A., & Baumgartner, R. (1978). Factors affecting response rates to mailed
questionnaires: A quantitative analysis of the published literature. American
Sociological Review, 43, 447-462. doi:10.2307/2094771 Heywood, J. S., Siebert, W. S., & Wei, X. (2002). Worker sorting and job satisfaction:
The case of union and government jobs. Industrial & Labor Relations Review, 55, 595-609.
Hinkin, T., & Holtom, B. (2009). Response rates and sample representativeness:
Identifying contextual response drivers. In D. Buchanan & A. Bryman (Ed.), Handbook of Organizational Research Methods (pp. 451-464). Los Angeles, CA: Sage Publications.
Hogler, R., Hunt, H., & Weiler, S. (2015). Killing unions with culture: Institutions,
inequality, and the effects of labor's decline in the United States. Employee
Responsibilities & Rights Journal, 27, 63-79. doi:10.1007/s10672-014-9257-y Irvine, D. (2009). Employee engagement: What it is and why you need it. Business Week
Online, 12.
61
Kahn, W. A. (1990). Psychological conditions of personal engagement and disengagement at work. Academy of Management Journal, 33, 692-724. doi:10.2307/256287
Manfreda, K. L., Berzelak, J., Vehovar, V., Bosnjak, M., & Haas, I. (2008). Web surveys
versus other survey modes: A meta-analysis comparing response rates. International Journal of Market Research, 50, 79-104.
Maslach, C., Schaufeli, W. B., & Leiter, M. P. (2001). Job burnout. Annual Review of
Psychology, 52, 397-422. Mellor, S., & Golay, L. M. (2014). Gender harassment and negative mental health: What
labor unions can do to help union women. Employee Responsibilities and Rights
Journal, 26, 21-34. doi:10.1007/s10672-012-9203-9 Mertler, C. A. (2003). Patterns of response and nonresponse from teachers to traditional
and web surveys. Practical Assessment, Research & Evaluation, 8(22). Retrieved from http://www.pareonline.net/ getvn.asp?v=8&n=22.
Modern Survey. (2013). State of engagement: Unveiling the latest employee engagement
research. Retrieved from: http://www.modernsurvey.com/wp-content/uploads/2013/12/The-State-of-Engagement-Report-Fall-2013.pdf
Odewahn, C. A., & Petty, M. M. (1980). A comparison of levels of job satisfaction, role
stress, and personal competence between union members and nonmembers. Academy of Management Journal, 23, 150-155.
Ott, B. (2007). Investors, take note: Engagement boosts earnings. Gallup Management
Journal Online, 1. Renaud, S. (2002). Rethinking the union membership/job satisfaction relationship: some
empirical evidence in Canada. International Journal of Manpower, 23, 137-150. Rich, B., LePine, J. A., & Crawford, E. R. (2010). Job engagement: Antecedents and
effects on job performance. Academy of Management Journal, 53, 617-635. doi:10.5465/AMJ.2010.51468988
Robison, J. (2006). A caterpillar dealer unearths employee engagement. Gallup
Management Journal Online, 1. Saari, L. M., & Scherbaum, C. A. (2011). Identified employee surveys: Potential
promise, perils, and professional practice guidelines. Industrial and
Organizational Psychology: Perspectives on Science and Practice, 4, 435-448. doi:10.1111/j.1754-9434.2011.01369.x
62
Schaufeli, W. B., Salanova, M., González-Romá, V., & Bakker, A. B. (2002). The
measurement of engagement and burnout: A two sample confirmatory factor analytic approach. Journal of Happiness Studies, 3, 71-92. doi:10.1023/A:1015630930326
Schwochau, S. (1987). Union effects on job attitudes. Industrial & Labor Relations
Review, 40, 209-224. Skalland, B. (2011). An alternative to the response rate for measuring a survey’s
realization of the target population. Public Opinion Quarterly, 75, 89-98. doi:10.1093/poq/nfq072
Sugheir, J., Coco, M., & Kaupins, G. (2011). Perceptions of organizational surveys
within employee engagement efforts. International Journal of Business & Public
Administration, 8, 48-61. Thompson, L. F., & Surface, E. A. (2007). Employee surveys administered online
attitudes toward the medium, nonresponse, and data representativeness. Organizational Research Methods, 10, 241-261.
Tomaskovic-Devey, D., Leiter, J., & Thompson, S. (1994). Organizational Survey
Nonresponse. Administrative Science Quarterly, 39, 439-457. Western, B., & Rosenfeld, J. (2011). Unions, norms, and the rise in US wage
inequality. American Sociological Review, 76, 513-537. Wiseman, F., & Billington, M. (1984). Comment on a standard definition of response
rates. Journal of Marketing Research, 21, 336-338. doi:10.2307/3151610 Wyse, S. (2012, August 24). 11 Types of Employee Surveys. [Web log comment].
Retrieved from: http://www.snapsurveys.com/blog/11-types-employee-surveys/

63
Appendix
Survey Question Themes
Vigor
1. Invigorate
2. Timeliness in completing tasks
3. Adapting to new methods of working
4. Adapting to new roles and responsibilities
5. Self-Development
Dedication
6. Contribution to company success
7. Belonging
8. Personal Achievement
9. Dedication *
10. Pride *
11. Volunteering *
Absorption
12. Ability to focus
13. Satisfaction with job *
14. Satisfaction with company *
* Indicates that survey questions were not included in 2011 administration year