the regional economics applications laboratory (real) is a
TRANSCRIPT

The Regional Economics Applications Laboratory (REAL) is a cooperative venture between the University of Illinois and the Federal Reserve Bank of Chicago focusing on the development and use of analytical models for urban and regional economic development. The purpose of the Discussion Papers is to circulate intermediate and final results of this research among readers within and outside REAL. The opinions and conclusions expressed in the papers are those of the authors and do not necessarily represent those of the Federal Reserve Bank of Chicago, Federal Reserve Board of Governors or the University of Illinois. All requests and comments should be directed to Geoffrey J. D. Hewings, Director, Regional Economics Applications Laboratory, 607 South Matthews, Urbana, IL, 61801-3671, phone (217) 333-4740, FAX (217) 244-9339. Web page: www.uiuc.edu/unit/real
COMPARATIVE ANALYSIS OF CHINA’S ECONOMIC
STRUCTURES BETWEEN 1987 AND 1997: AN INPUT-OUTPUT PROSPECTIVE
Dong Guo and Geoffrey J.D. Hewings
REAL 01-T-04 May, 2001
Comparative analysis of China’s economic structures between 1987 and 1997: an input-output prospective1 Dong Guo 2 Geoffrey J.D. Hewings 3 Abstract China experienced a rapid economic growth since 1979 when it opened up. The fast transformation affected the country in many ways including economic structure. This paper tries to identify the changes of economic structure influenced by economic growth from input-output prospective. The methodology is rooted in key sector analysis and complemented by presentation of the multiplier product matrix (MPM), which presents an interpretation of structure based on the products of the row and column of Leontief inverse, and provides a macro-economic visualization (economic landscape) of economic structure to make a better understanding of economic structure change of one economy in different times. The analyses results show that heavy industries sectors maintain dominant roles in the Chinese economy from 1987 to 1997, but with different emphases. Labor- intensive industries like textiles are giving way to high-technology industry due to an active policy that intends to develop high-technology. Some non-manufacturing sectors changed their roles in the national economy and started to influence the economy in a positive way, but the services sector has not been a key sector in national economy. Therefore China's developing character as a developing country has not changed.
1 Special thanks go to Ms. Haiyan Wang (Department of National Accounts, National Bureau of Statistics of P.R. China), for providing suggestions and access to dataset used in the paper. We also would like to acknowledge Jiemin Guo (Bureau of Economic Analysis, Commerce Department of USA), Xiaofan Liu (Beijing office, World Bank), Suahasil Nazara (Regional Economics Applications Laboratory, University of Illinois, USA), Michael Sonis ( Bar Ilan University, Israel) for suggestions and comments. The standard disclaimer applies. 2 Department of National Accounts, National Bureau of Statistics, P.R. China 3 Regional Economics Applications Laboratory, University of Illinois, USA

R E A L Comparative analysis of China’s economic structures between 1987 and 1997: an input-output prospective 2
1. Introduction China experienced rapid economic growth after the country was opened up in 1979. How has
this transformation affected the economic structure of the country? This paper describes some
comparative analyses of the economic structure of China focusing on interrelationships between
sectors over the period 1987-1997. The analysis draws on published input-output tables and a
several methods are used to explore changes in structure.
The methodology is rooted in key sector analysis, which was directed to the identification of
sectors whose backward and forward linkages create more than average impacts on the other
sectors of the whole economy. However, this is complemented by presentation of the multiplier
product matrix or MPM (Sonis et al., 1997a), which presents an interpretation of structure based
on the products of the row and column multipliers of the Leontief inverse. It has some related
properties with backward and forward linkage, and what is more, it can provide a macro-
economic visualization (economic landscape) of economic structure, making it possible to
compare one economy in different time periods and to provide a better understanding of the
effects of economic structure changes on economic growth and the way economic growth has
affected structure.
2. Methodology
2.1 Key sectors analysis to establish rank-size hierarchies of backward and forward
linkages
Let A= ][ ija be a matrix of direct inputs in the usual input-output system, ][)( 1ijbAIB =−= − be
the associated Leontief inverse matrix and let jB⋅ and ⋅iB be the column and row multipliers of
this Leontief inverse. These are defined as:
∑=
⋅ =n
iijj bB
1
, ∑=
⋅ =n
jiji bB
1
(1)
Let V be the global intensity of the Leontief inverse matrix:
R E A L Comparative analysis of China’s economic structures between 1987 and 1997: an input-output prospective 3
∑∑= =
=n
i
n
jijbV
1 1
(2)
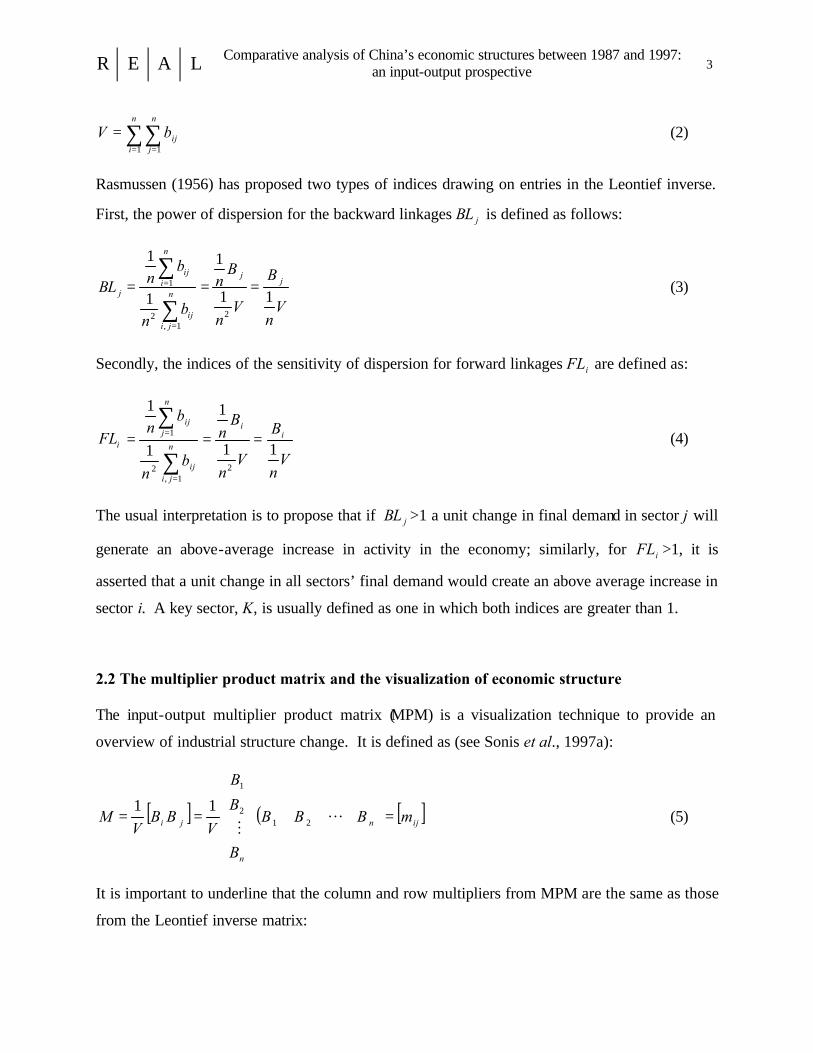
Rasmussen (1956) has proposed two types of indices drawing on entries in the Leontief inverse.
First, the power of dispersion for the backward linkages jBL is defined as follows:
Vn
B
Vn
Bn
bn
bnBL j
j
n
jiij
n
iij
j 11
1
1
1
21,
2
1 ⋅⋅
=
= ===∑
∑ (3)
Secondly, the indices of the sensitivity of dispersion for forward linkages iFL are defined as:
Vn
B
Vn
Bn
bn
bn
FL ii
n
jiij
n
jij
i 11
1
1
1
21,
2
1 ⋅⋅
=
= ===∑
∑ (4)
The usual interpretation is to propose that if jBL >1 a unit change in final demand in sector j will
generate an above-average increase in activity in the economy; similarly, for iFL >1, it is
asserted that a unit change in all sectors’ final demand would create an above average increase in
sector i. A key sector, K, is usually defined as one in which both indices are greater than 1.
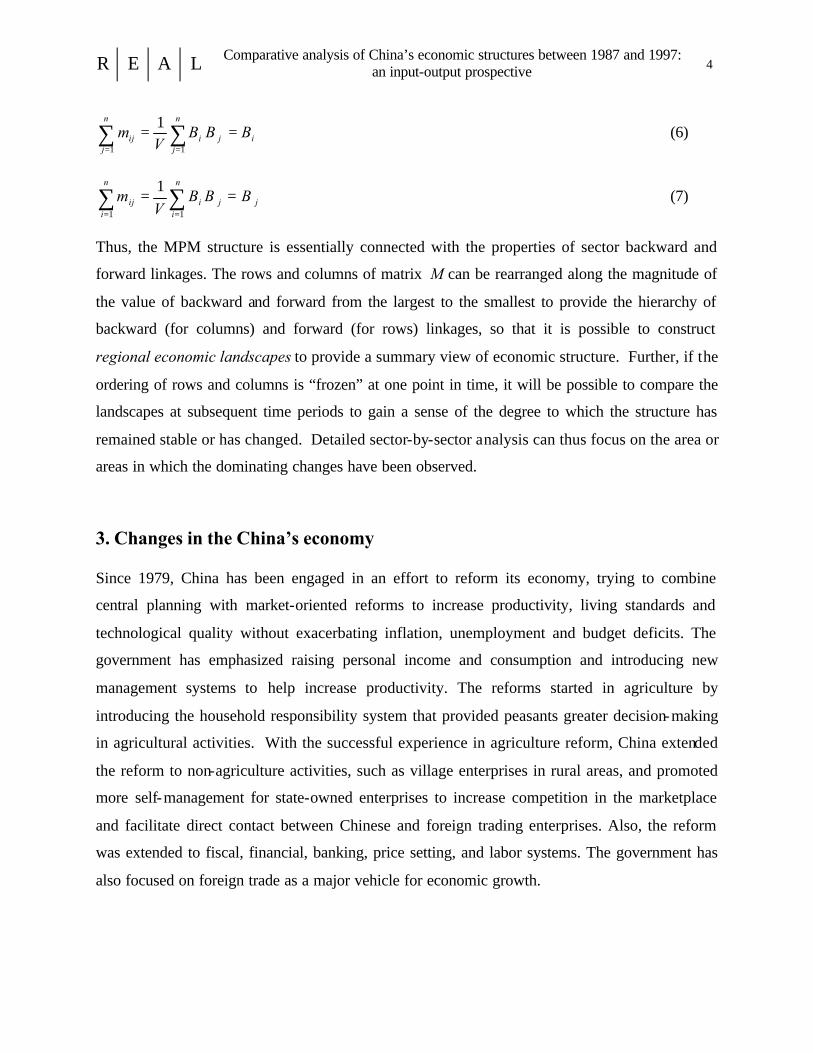
2.2 The multiplier product matrix and the visualization of economic structure
The input-output multiplier product matrix (MPM) is a visualization technique to provide an
overview of industrial structure change. It is defined as (see Sonis et al., 1997a):
[ ] ( ) [ ]ijn
n
ji mBBB
B
B
B
VBB
VM =
== ⋅⋅⋅
⋅
⋅
⋅
⋅⋅ LM 212
1
11 (5)
It is important to underline that the column and row multipliers from MPM are the same as those
from the Leontief inverse matrix:
R E A L Comparative analysis of China’s economic structures between 1987 and 1997: an input-output prospective 4
⋅⋅=
⋅=
== ∑∑ ij
n
ji
n
jij BBB
Vm
11
1 (6)
jj
n
ii
n
iij BBB
Vm ⋅⋅
=⋅
=
== ∑∑11
1 (7)
Thus, the MPM structure is essentially connected with the properties of sector backward and
forward linkages. The rows and columns of matrix M can be rearranged along the magnitude of
the value of backward and forward from the largest to the smallest to provide the hierarchy of
backward (for columns) and forward (for rows) linkages, so that it is possible to construct
regional economic landscapes to provide a summary view of economic structure. Further, if the
ordering of rows and columns is “frozen” at one point in time, it will be possible to compare the
landscapes at subsequent time periods to gain a sense of the degree to which the structure has
remained stable or has changed. Detailed sector-by-sector analysis can thus focus on the area or
areas in which the dominating changes have been observed.
3. Changes in the China’s economy
Since 1979, China has been engaged in an effort to reform its economy, trying to combine
central planning with market-oriented reforms to increase productivity, living standards and
technological quality without exacerbating inflation, unemployment and budget deficits. The
government has emphasized raising personal income and consumption and introducing new
management systems to help increase productivity. The reforms started in agriculture by
introducing the household responsibility system that provided peasants greater decision-making
in agricultural activities. With the successful experience in agriculture reform, China extended
the reform to non-agriculture activities, such as village enterprises in rural areas, and promoted
more self-management for state-owned enterprises to increase competition in the marketplace
and facilitate direct contact between Chinese and foreign trading enterprises. Also, the reform
was extended to fiscal, financial, banking, price setting, and labor systems. The government has
also focused on foreign trade as a major vehicle for economic growth.

R E A L Comparative analysis of China’s economic structures between 1987 and 1997: an input-output prospective 5
Figure 1 GDP and industries growth rate in China from 1978 to 1997
-5
0
5
10
15
20
25
1978 1979 1980 1981 1982 1983 1984 1985 1986 1987 1988 1989 1990 1991 1992 1993 1994 1995 1996 1997
Year
%
GDP Agriculture Secondary Industry Tertriary
The reforms to date have yielded impressive dividends, with the result that China is the fastest
growing country in the world. The average annual growth rate from 1978 to 1997 was 9.7%,
while the world average annual growth rate was no more than 3.2 % (during the1980 to 1990
period and 2.5% during the1990 to 1998 period). Figure 1 shows the GDP and industries’
growth rate from 1979 to 1997. From figure 1, we can see that since 1985, secondary industry
(manufactur ing and constructions) is the main driving strength of China’s national economy,
since the growth rate for this component of the economy is much faster than that for GDP as a
whole. On the other hand, tertiary industry (services), which used to grow faster than GDP in the
first five years of 1980’s, has slowed in the 1990’s. Primary industry (agriculture) has kept a
relatively more stable growth rate since 1985 compared to rates observed before 1985.
Productivity has been increased together with personal income. Hence, GDP per capita is
increasing rapidly. Table 1 shows the GDP per capita from 1979 to 1997 in China.
Table 1 GDP per capita comparisons in China from 1979 to 1997
Year GDP per capita 1979 417 1987 1104 1992 2287 1997 6053

R E A L Comparative analysis of China’s economic structures between 1987 and 1997: an input-output prospective 6
Foreign trade is the major vehicle for economic growth. If we compare the exports growth and
economic growth rate at same period, it is easy to learn that 5-year-average-growth rate of
exports is much higher than that of economic growth since 1986, even though GDP growth rate
is higher at the beginning period of open up from 1981 to 1985. Figure 2 shows the average
exports growth rate and GDP growth rate from 1980 to 2000 with five years interval. Note that
exports growth rate is higher than economic growth rate after 1985.
Figure 2 GDP and exports growth rates
0
5
10
15
20
25
1981-1985 1986-1990 1991-1995 1996-2000Year
%
GDP Exports
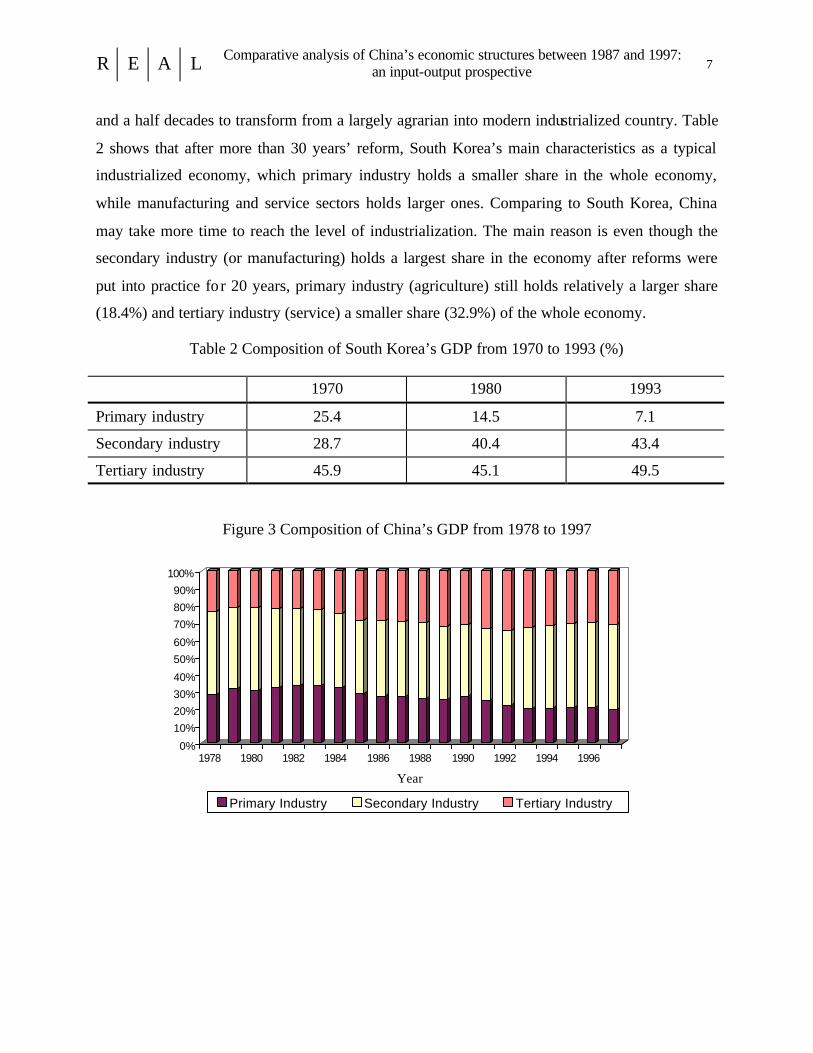
Has the rapid economic growth rate been reflected in changes to China’s economic structure?
From the changes of composition of GDP, we can compare the share of different industries from
1978 to 1997 in the economy. Figure 3 shows the composition of GDP in China from 1978 to
1997. It is not difficult to find that the share of primary industry (agriculture) is decreasing, but
that of secondary industry (manufacturing and construction) is increasing. Tertiary industry
experienced an increase in the first ten years since reform and a decrease since then (in relative
terms). For example, the share of primary industry declined from 26.8% in 1987 to 21.8% in
1992, and to 19.1% in 1997. In contrast, the secondary industry's composition increased, from
43.9% (1987) to 50.0% (1997) (Figure 3). This process is not unusual in a developing economy;
what is unusual is the speed of this adjustment. The significant case is South Korea’s
development model. Being a typical developing, largely agrarian, country before 1960’s, South
Korea started with the export-oriented industrialization since then. It only took the country three
R E A L Comparative analysis of China’s economic structures between 1987 and 1997: an input-output prospective 7
and a half decades to transform from a largely agrarian into modern industrialized country. Table
2 shows that after more than 30 years’ reform, South Korea’s main characteristics as a typical
industrialized economy, which primary industry holds a smaller share in the whole economy,
while manufacturing and service sectors holds larger ones. Comparing to South Korea, China
may take more time to reach the level of industrialization. The main reason is even though the
secondary industry (or manufacturing) holds a largest share in the economy after reforms were
put into practice fo r 20 years, primary industry (agriculture) still holds relatively a larger share
(18.4%) and tertiary industry (service) a smaller share (32.9%) of the whole economy.
Table 2 Composition of South Korea’s GDP from 1970 to 1993 (%)
1970 1980 1993
Primary industry 25.4 14.5 7.1
Secondary industry 28.7 40.4 43.4
Tertiary industry 45.9 45.1 49.5
Figure 3 Composition of China’s GDP from 1978 to 1997
0%
10%20%30%40%
50%60%
70%80%90%
100%
1978 1980 1982 1984 1986 1988 1990 1992 1994 1996
Year
Primary Industry Secondary Industry Tertiary Industry
R E A L Comparative analysis of China’s economic structures between 1987 and 1997: an input-output prospective 8
4. 1987 to 1997 China’s economy: MPM applications
4.1 Data Source
Comparison of economic structure was undertaken using data derived from input-output tables
for China for 1987,1992 and 1997. From 1987, China began to assemble national input-output
tables every five years on survey data according to the SNA framework. By now, three national
input-output tables have been completed4 . There are 18 sectors classified for the structural
analysis as shown in table 3.
Table 3 Industrial Classification and Codes of Chinese Input-Output Table
Manufacturing Sector Non-Manufacturing Sector Code Description Code Description
1. Food 11. Agriculture 2. Textiles 12. Mining 3. Furniture 13. Construction 4. Paper, printing and related products 14. Transportation and communication 5. Energy 15. Commerce and restaurants 6. Chemical industries 16. Public utilities and household services 7. Building Materials 17. Finance and insurance 8. Metal manufacturing 18. Public services 9. Machinery, equipment and electronics 10. Industries not elsewhere classified
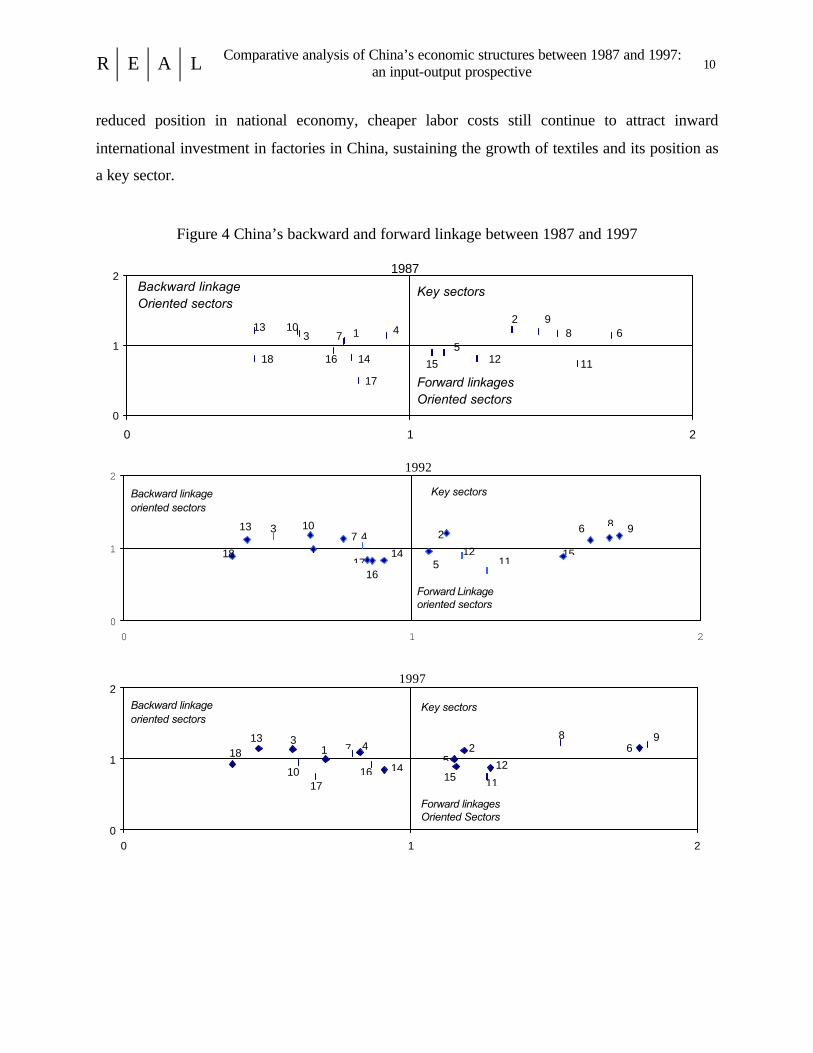
4.2 Key sectors analysis
As noted earlier, key sectors are the sectors whose both backward and forward linkages
multiplier are greater than 1. That means that changes in key sectors should have a greater than
average influence on the whole economy. Key sectors in the period of 1987 to 1997 in China are
identified in table 3 and figure 4. It is easy to note that during this period, even though the
forward and backward linkages changed, the key sectors remain sector 2 (textiles), 6 (chemical),
8 (metal manufacturing) and 9 (machinery, equipment and electronics). For the last ten years, all
the key sectors interact with these four sectors, which can be said that the most important sectors
4 For more information on these tables and their constructions, refer to National Accounts Department, National Bureau of Statistics of China.

R E A L Comparative analysis of China’s economic structures between 1987 and 1997: an input-output prospective 9
(or the core) of China’s national economy. This stability in structure reflects China’s long-run
policy to keep the manufacturing industries as a driving strength in national economy.
Table 4 Sector Classifications for the 1987,1992 and 1997 in China
Year Code Sectors 1987 1992 1997
1 Food B O B 2 Textiles K K K 3 Furniture B B B 4 Paper, printing and related products B B B 5 Energy F F F 6 Chemical industries K K K 7 Building Materials B B B 8 Metal manufacturing K K K 9 Machinery, equipment and electronics K K K 10 Industries not elsewhere classified B B O 11 Agriculture F F F 12 Mining F F F 13 Construction B B B 14 Transportation and communication O O O 15 Commerce and restaurants F F F 16 Public utilities and services to household O O O 17 Finance and insurance O O O 18 Public services O O O
Note: K—Key sectors B—Backward linkage oriented sectors
F—Forward linkages oriented sectors O—other sectors
In terms of the value of both forward and backward linkage, we can see that those for sector 9
(machinery, equipment and electronics) are increasing through the whole period, and this sector
has the highest forward and backward linkage since 1992. As a result, the position of sector 9 as
a basic industry seems to be increasing. Sector 6’s (chemicals) forward and backward linkages
decreased from 1987 to 1992, while, at the same time, those for sector 8 (metal manufacturing)
increased. However, from 1992, sector 6 surpassed sector 8 in both aspects to indicate its role in
the economy. In contrast to the heavy industry’s role as a key sector from 1987 to 1997, sector 2
(textiles) is the only light industry that remains in this position. The main reason is that China has
implemented an exports-oriented development policy focusing attention on labor- intensive
industries such as textiles. Even though its declining forward and backward linkage reflect its
R E A L Comparative analysis of China’s economic structures between 1987 and 1997: an input-output prospective 10
reduced position in national economy, cheaper labor costs still continue to attract inward
international investment in factories in China, sustaining the growth of textiles and its position as
a key sector.
Figure 4 China’s backward and forward linkage between 1987 and 1997
1987
0
1
2
0 1 2
Backward linkageOriented sectors
Key sectors
Forward linkagesOriented sectors
6
11
892
125
15
4
17
14
17
16
310
18
13
0
1
2
0 1 2
1992
Backward linkage oriented sectors
Key sectors
Forward Linkage oriented sectors
714
2
151211
5
16
41
17
10313
18
6 8 9
5
0
1
2
0 1 2
1997
1814
15 1110 16
71
17
12
313
52
8 964
Key Sectors
Forward linkages Oriented Sectors
Backward linkage oriented sectors
Key sectors
R E A L Comparative analysis of China’s economic structures between 1987 and 1997: an input-output prospective 11
While a non-key sector in terms of the definition (both backward and forward linkage multiplier
are less than 1), sector 5 (energy) deserves our attention because of its importance in national
economy. In fact, its forward and backward linkages are increasing through the period indication
that its importance in economy is growing. The forward linkage is always greater than 1
reflecting that it is very involved with other sectors of the economy. By 1997, its backward
linkage multiplier approached 1 (0.998), and we can say that has really become one of the most
important sectors in China’s economy. In many ways, this sector’s evolution may be traced to a
very pro-active development strategy.
Figure 5 China backward linkage hierarchies
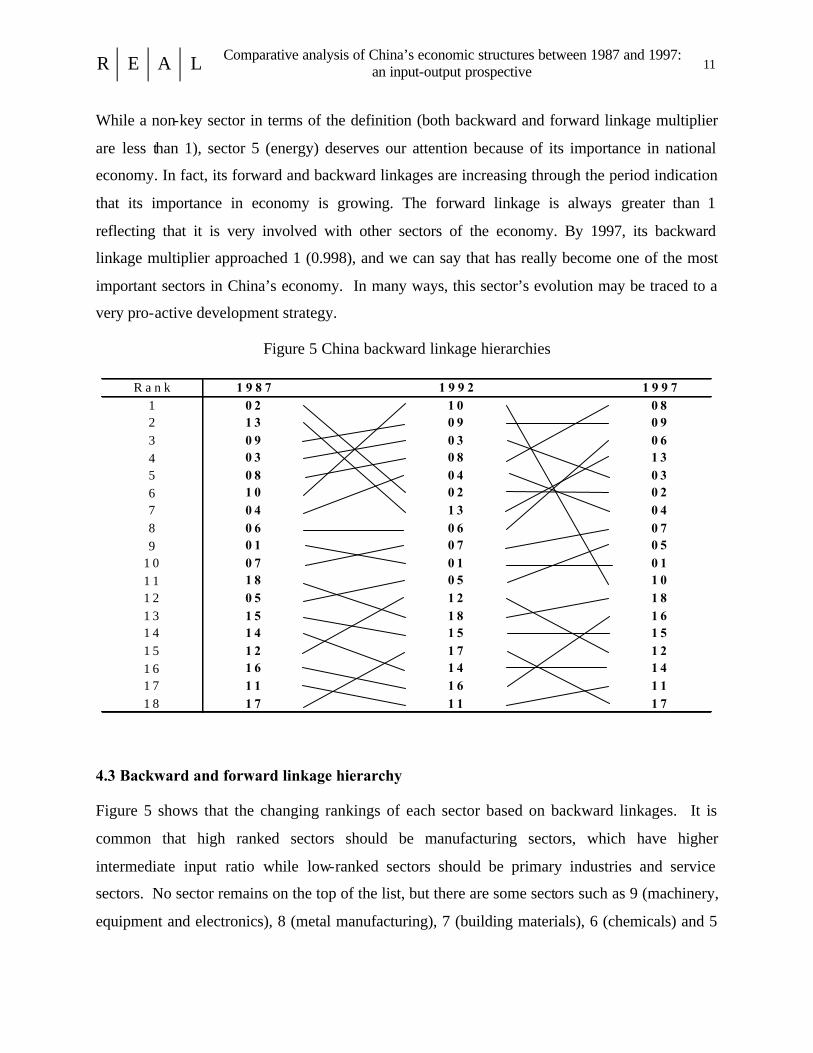
4.3 Backward and forward linkage hierarchy
Figure 5 shows that the changing rankings of each sector based on backward linkages. It is
common that high ranked sectors should be manufacturing sectors, which have higher
intermediate input ratio while low-ranked sectors should be primary industries and service
sectors. No sector remains on the top of the list, but there are some sectors such as 9 (machinery,
equipment and electronics), 8 (metal manufacturing), 7 (building materials), 6 (chemicals) and 5
R a n k 1 9 8 7 1 9 9 2 1 9 9 71 0 2 1 0 0 82 1 3 0 9 0 93 0 9 0 3 0 64 0 3 0 8 1 35 0 8 0 4 0 36 1 0 0 2 0 27 0 4 1 3 0 48 0 6 0 6 0 79 0 1 0 7 0 5
1 0 0 7 0 1 0 11 1 1 8 0 5 1 01 2 0 5 1 2 1 81 3 1 5 1 8 1 61 4 1 4 1 5 1 51 5 1 2 1 7 1 21 6 1 6 1 4 1 41 7 1 1 1 6 1 11 8 1 7 1 1 1 7
R E A L Comparative analysis of China’s economic structures between 1987 and 1997: an input-output prospective 12
(energy) have moved upward consistently during the period. It can be explained that heavy
industries have always been the driving strength of the economy; domestic replacement from
previously imported inputs have contributed to its ascendancy in the backward input linkage
ranks. The fast growth of construction and real estate is the main reason for sector 7 (building
materials) moving up consistently through the whole period and sector 13(constructions) moving
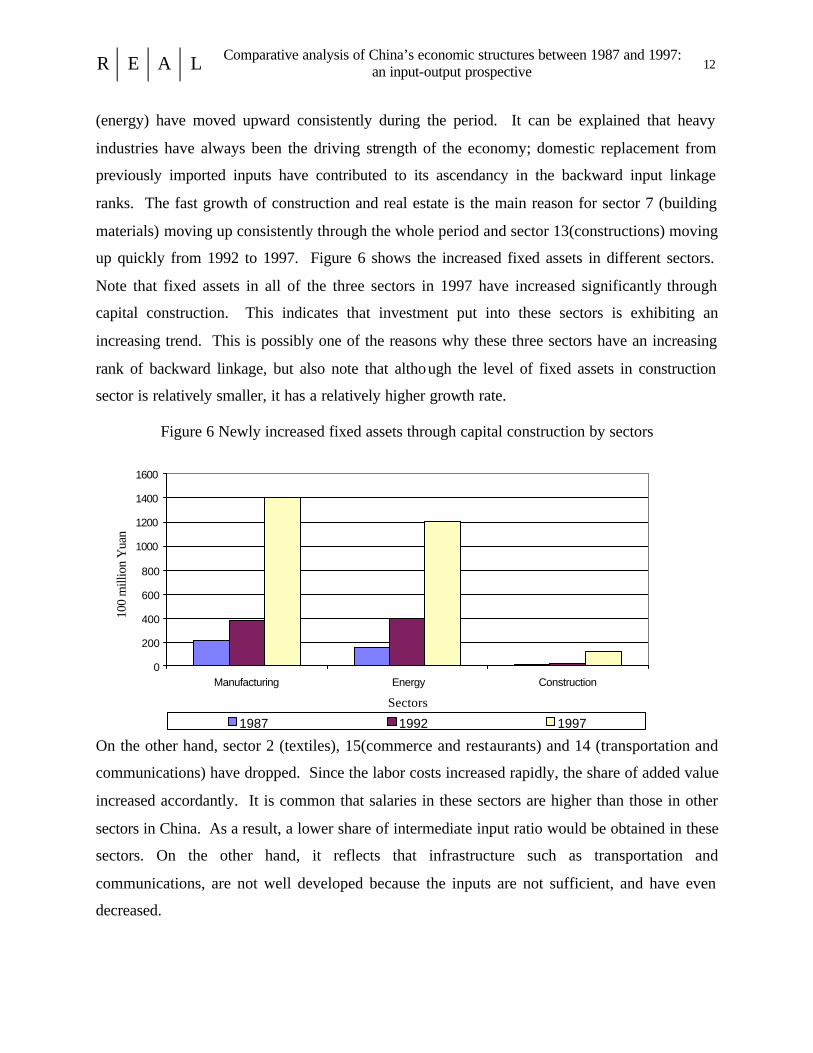
up quickly from 1992 to 1997. Figure 6 shows the increased fixed assets in different sectors.
Note that fixed assets in all of the three sectors in 1997 have increased significantly through
capital construction. This indicates that investment put into these sectors is exhibiting an
increasing trend. This is possibly one of the reasons why these three sectors have an increasing
rank of backward linkage, but also note that although the level of fixed assets in construction
sector is relatively smaller, it has a relatively higher growth rate.
Figure 6 Newly increased fixed assets through capital construction by sectors
On the other hand, sector 2 (textiles), 15(commerce and restaurants) and 14 (transportation and
communications) have dropped. Since the labor costs increased rapidly, the share of added value
increased accordantly. It is common that salaries in these sectors are higher than those in other
sectors in China. As a result, a lower share of intermediate input ratio would be obtained in these
sectors. On the other hand, it reflects that infrastructure such as transportation and
communications, are not well developed because the inputs are not sufficient, and have even
decreased.
0
200
400
600
800
1000
1200
1400
1600
Manufacturing Energy Construction
Sectors
100
mill
ion
Yua
n
1987 1992 1997
R E A L Comparative analysis of China’s economic structures between 1987 and 1997: an input-output prospective 13
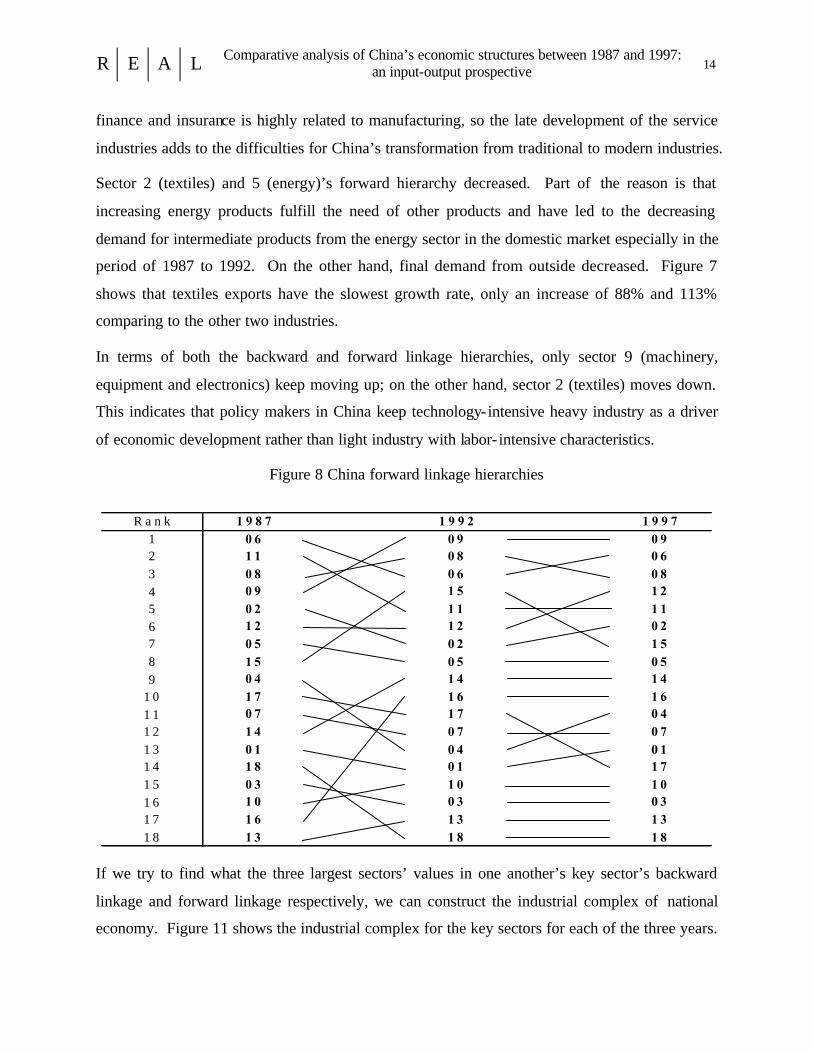
Figure 8 shows that the changing rankings of each sector based on forward linkages. And
provides a different picture from that of the backward linkages. Generally, manufacturing sectors
producing intermediate or semi-finished products have shown higher ranks in the forward
linkages. Sector 6, 8 and 9 are atop the list through the period with sector 9 (machinery,
equipment and electronics) maintaining the first rank since 1992. This is related to the rapid
growth of heavy industry from the 1990s. The intermediate products of heavy industries such as
chemical, electronics and metal manufacturing have been distributed into intermediate demand
sectors at an increasing rate. On the other hand, the fast export growth of sector 9 has also
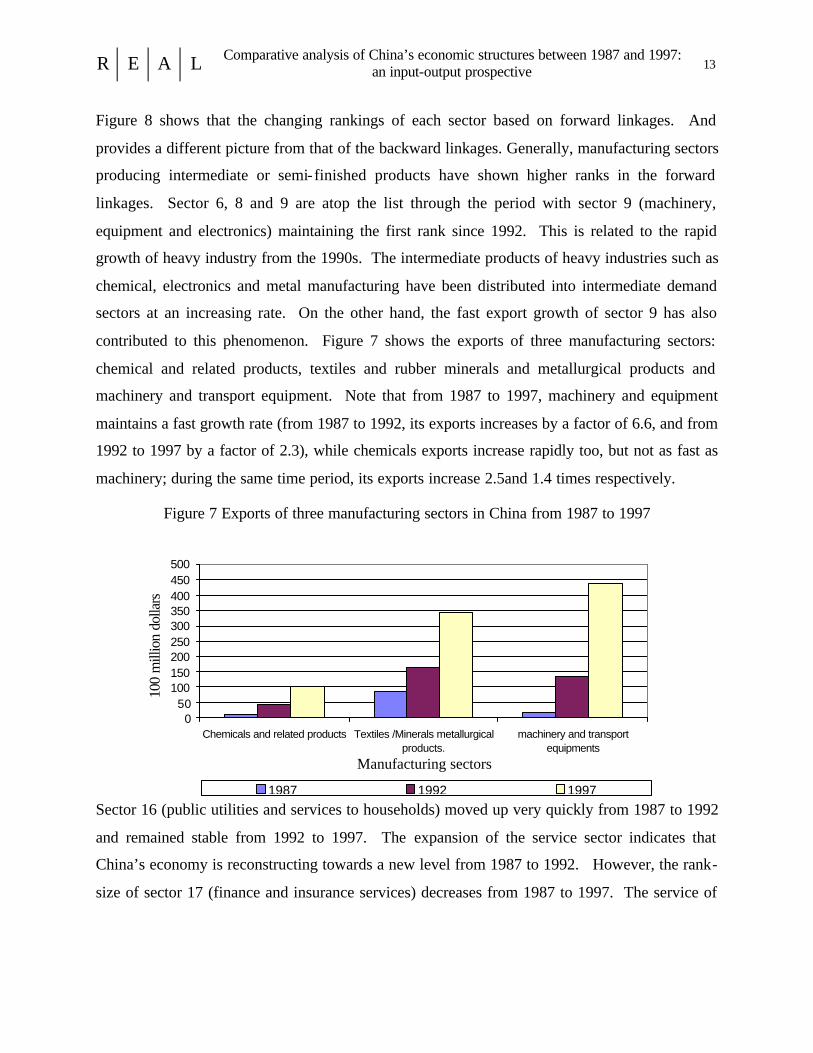
contributed to this phenomenon. Figure 7 shows the exports of three manufacturing sectors:
chemical and related products, textiles and rubber minerals and metallurgical products and
machinery and transport equipment. Note that from 1987 to 1997, machinery and equipment
maintains a fast growth rate (from 1987 to 1992, its exports increases by a factor of 6.6, and from
1992 to 1997 by a factor of 2.3), while chemicals exports increase rapidly too, but not as fast as
machinery; during the same time period, its exports increase 2.5and 1.4 times respectively.
Figure 7 Exports of three manufacturing sectors in China from 1987 to 1997
Sector 16 (public utilities and services to households) moved up very quickly from 1987 to 1992
and remained stable from 1992 to 1997. The expansion of the service sector indicates that
China’s economy is reconstructing towards a new level from 1987 to 1992. However, the rank-
size of sector 17 (finance and insurance services) decreases from 1987 to 1997. The service of
050
100150200250300350400450500
Chemicals and related products Textiles /Minerals metallurgicalproducts.
machinery and transportequipments
Manufacturing sectors
100
mill
ion
dolla
rs
1987 1992 1997
R E A L Comparative analysis of China’s economic structures between 1987 and 1997: an input-output prospective 14
finance and insurance is highly related to manufacturing, so the late development of the service
industries adds to the difficulties for China’s transformation from traditional to modern industries.
Sector 2 (textiles) and 5 (energy)’s forward hierarchy decreased. Part of the reason is that
increasing energy products fulfill the need of other products and have led to the decreasing
demand for intermediate products from the energy sector in the domestic market especially in the
period of 1987 to 1992. On the other hand, final demand from outside decreased. Figure 7
shows that textiles exports have the slowest growth rate, only an increase of 88% and 113%
comparing to the other two industries.
In terms of both the backward and forward linkage hierarchies, only sector 9 (machinery,
equipment and electronics) keep moving up; on the other hand, sector 2 (textiles) moves down.
This indicates that policy makers in China keep technology- intensive heavy industry as a driver
of economic development rather than light industry with labor- intensive characteristics.
Figure 8 China forward linkage hierarchies
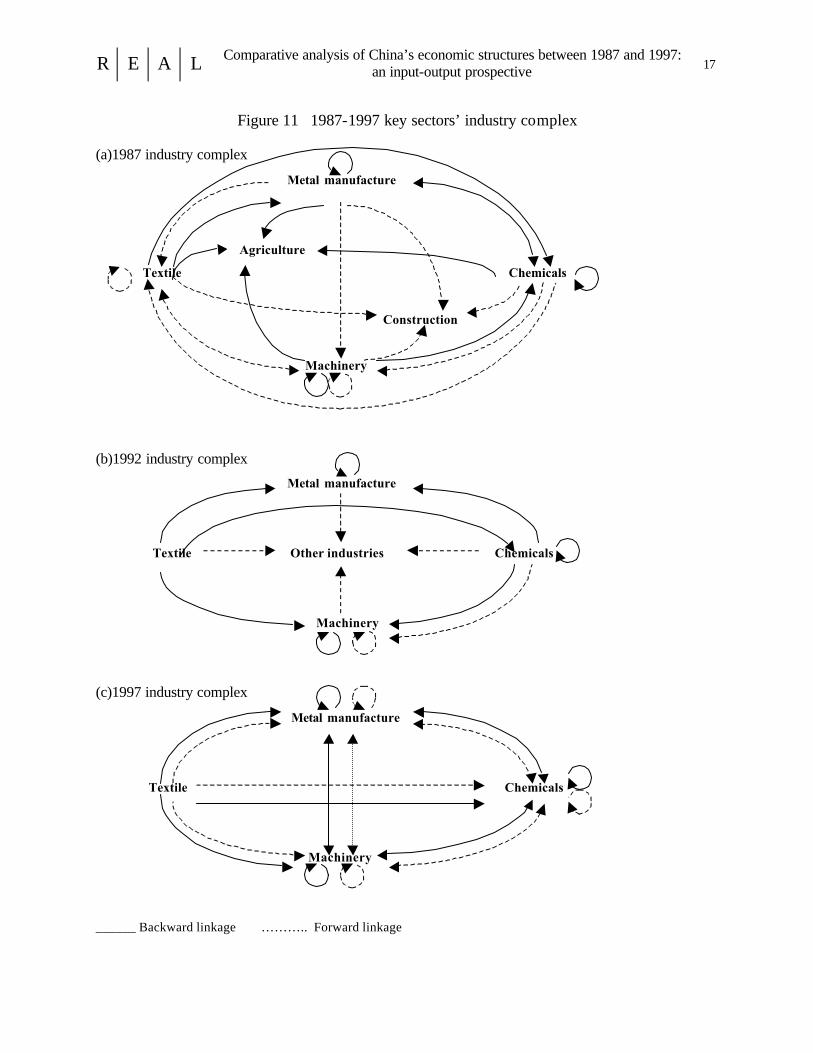
If we try to find what the three largest sectors’ values in one another’s key sector’s backward
linkage and forward linkage respectively, we can construct the industrial complex of national
economy. Figure 11 shows the industrial complex for the key sectors for each of the three years.
R a n k 1 9 8 7 1 9 9 2 1 9 9 71 0 6 0 9 0 92 1 1 0 8 0 63 0 8 0 6 0 84 0 9 1 5 1 25 0 2 1 1 1 16 1 2 1 2 0 27 0 5 0 2 1 58 1 5 0 5 0 59 0 4 1 4 1 4
1 0 1 7 1 6 1 61 1 0 7 1 7 0 41 2 1 4 0 7 0 71 3 0 1 0 4 0 11 4 1 8 0 1 1 71 5 0 3 1 0 1 01 6 1 0 0 3 0 31 7 1 6 1 3 1 31 8 1 3 1 8 1 8
R E A L Comparative analysis of China’s economic structures between 1987 and 1997: an input-output prospective 15
Note that the industrial complex in 1987 is the most complicated and the one in 1997 is the most
simplified if we view the whole figure directly. Agriculture and construction are the two non-
key-sectors in 1987 industrial complex; in 1992 only industry not else classified is in it, but in
1997 no non-key sectors appear. In 1987, agriculture input to all key sectors and construction
obtain inputs from all key sectors. The backward linkage rank size of agriculture and
construction reveals the same story: agriculture ranks 2 and construction ranks the last. The
reason is that in the early development phase after China opened up, the industrial economy was
not fully developed and the agricultural economy remained dominant; on the other hand,
infrastructure needed to be improved quickly to meet the goals set for rapid economic
development.
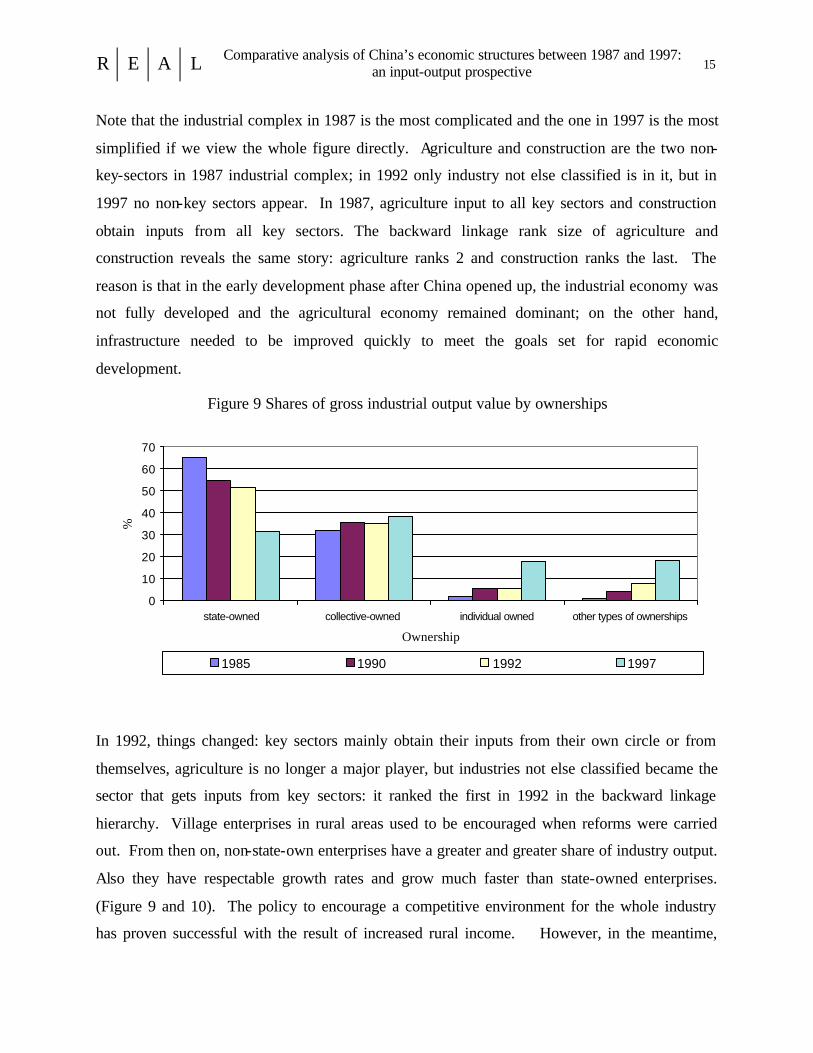
Figure 9 Shares of gross industrial output value by ownerships
0
10
20
30
40
50
60
70
state-owned collective-owned individual owned other types of ownerships
Ownership
%
1985 1990 1992 1997
In 1992, things changed: key sectors mainly obtain their inputs from their own circle or from
themselves, agriculture is no longer a major player, but industries not else classified became the
sector that gets inputs from key sectors: it ranked the first in 1992 in the backward linkage
hierarchy. Village enterprises in rural areas used to be encouraged when reforms were carried
out. From then on, non-state-own enterprises have a greater and greater share of industry output.
Also they have respectable growth rates and grow much faster than state-owned enterprises.
(Figure 9 and 10). The policy to encourage a competitive environment for the whole industry
has proven successful with the result of increased rural income. However, in the meantime,

R E A L Comparative analysis of China’s economic structures between 1987 and 1997: an input-output prospective 16
there some problems have arisen. Most of the enterprises have limited technology and poor
efficiency. Further, they are competing with raw materials needed by modern industry and thus
may influence the role played by key industries. In fact, China set as one of its policies the
targeting of electronics, as a symbol of national industrial development. So China made its mind
to clear, stop and merge village enterprises to provide a way of developing modern industries no
matter the ownership. It has worked; even though state-owned industry output growth rate keeps
on decreasing, non-state-owned industries have assumed an important role in every aspect,
including the key sectors. We can see that sector 10 (industries not else classified) rank size of
backward linkage decreased in 1997. From the industrial complex in 1997, note that all the key
sectors obtain input from and provide input to each other or themselves. Note that all the key
sectors are manufacturing sectors, so that by 1997, manufacturing sectors have been developed
enough to form an integrated system to provide input and outputs to each other.
Figure 10 Industry output growth rate (last year=100)
100
120
140
160
180
200
220
240
1981 1982 1983 1984 1985 1986 1987 1988 1989 1990 1991 1992 1993 1994 1995 1996 1997
Year
%
IndustryState-owned or Controlling Share Hold Industry Collective-owned IndustryIndividual Owned IndustryIndustry of Other Types of Ownership
R E A L Comparative analysis of China’s economic structures between 1987 and 1997: an input-output prospective 17
Figure 11 1987-1997 key sectors’ industry complex
(a)1987 industry complex
Metal manufacture
Agriculture
Textile Chemicals
Construction
Machinery
(b)1992 industry complex
Metal manufacture
Textile Other industries Chemicals
Machinery
(c)1997 industry complex
Metal manufacture
Textile Chemicals
Machinery
______ Backward linkage ……….. Forward linkage
R E A L Comparative analysis of China’s economic structures between 1987 and 1997: an input-output prospective 18
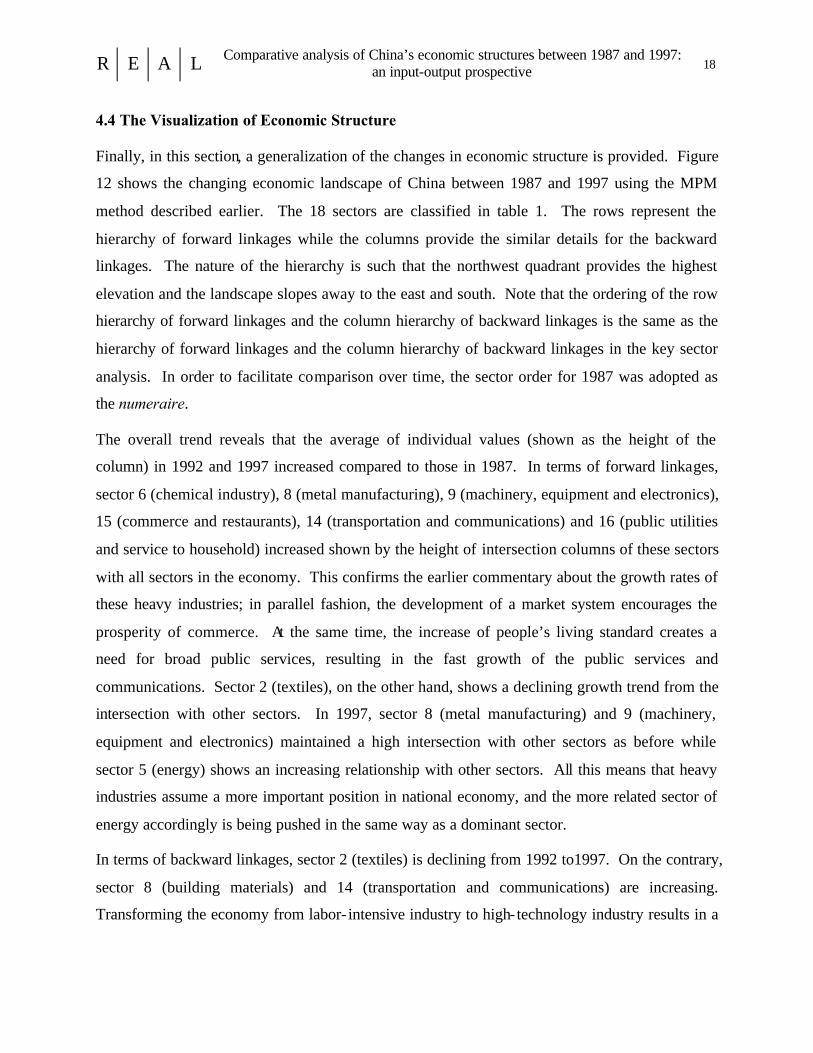
4.4 The Visualization of Economic Structure
Finally, in this section, a generalization of the changes in economic structure is provided. Figure
12 shows the changing economic landscape of China between 1987 and 1997 using the MPM
method described earlier. The 18 sectors are classified in table 1. The rows represent the
hierarchy of forward linkages while the columns provide the similar details for the backward
linkages. The nature of the hierarchy is such that the northwest quadrant provides the highest
elevation and the landscape slopes away to the east and south. Note that the ordering of the row
hierarchy of forward linkages and the column hierarchy of backward linkages is the same as the
hierarchy of forward linkages and the column hierarchy of backward linkages in the key sector
analysis. In order to facilitate comparison over time, the sector order for 1987 was adopted as
the numeraire.
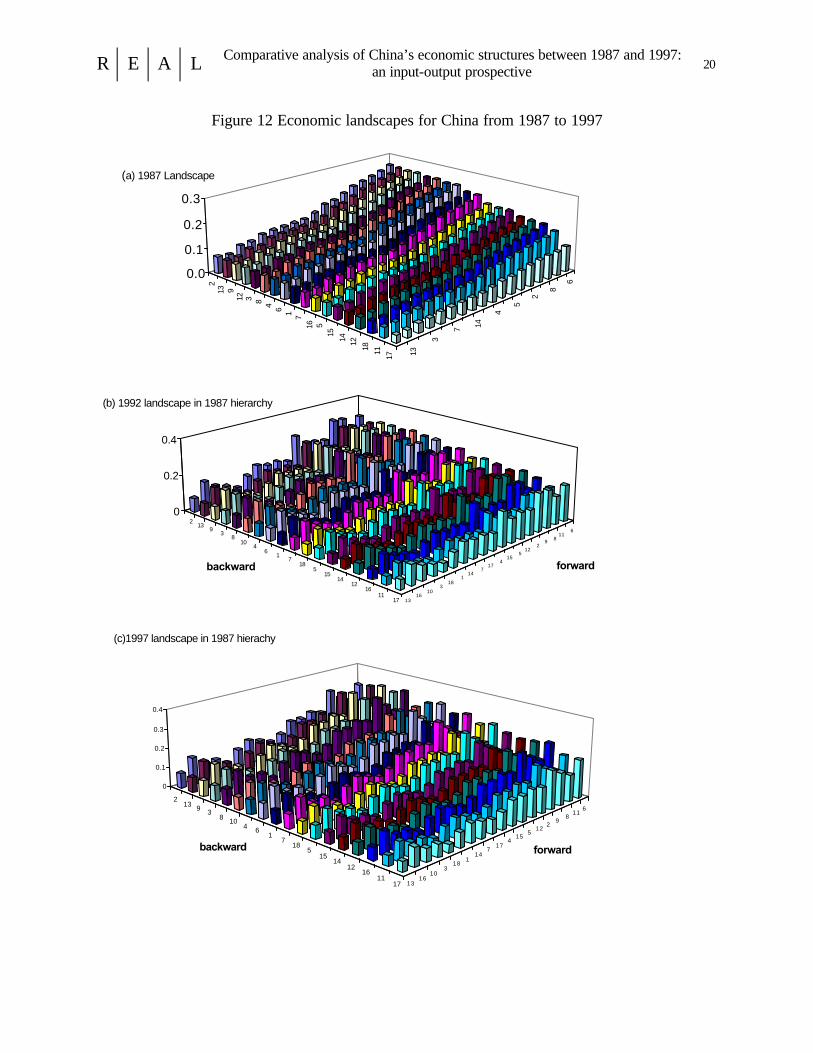
The overall trend reveals that the average of individual values (shown as the height of the
column) in 1992 and 1997 increased compared to those in 1987. In terms of forward linkages,
sector 6 (chemical industry), 8 (metal manufacturing), 9 (machinery, equipment and electronics),
15 (commerce and restaurants), 14 (transportation and communications) and 16 (public utilities
and service to household) increased shown by the height of intersection columns of these sectors
with all sectors in the economy. This confirms the earlier commentary about the growth rates of
these heavy industries; in parallel fashion, the development of a market system encourages the
prosperity of commerce. At the same time, the increase of people’s living standard creates a
need for broad public services, resulting in the fast growth of the public services and
communications. Sector 2 (textiles), on the other hand, shows a declining growth trend from the
intersection with other sectors. In 1997, sector 8 (metal manufacturing) and 9 (machinery,
equipment and electronics) maintained a high intersection with other sectors as before while
sector 5 (energy) shows an increasing relationship with other sectors. All this means that heavy
industries assume a more important position in national economy, and the more related sector of
energy accordingly is being pushed in the same way as a dominant sector.
In terms of backward linkages, sector 2 (textiles) is declining from 1992 to1997. On the contrary,
sector 8 (building materials) and 14 (transportation and communications) are increasing.
Transforming the economy from labor- intensive industry to high- technology industry results in a
R E A L Comparative analysis of China’s economic structures between 1987 and 1997: an input-output prospective 19
decrease in the input of textiles. On the other hand, the rapid growth of real estate promotes more
input to building materials. The inadequate conditions of infrastructure and the associated need
of communications generate growth in these sectors, which result in an increase of input.
Finally, the apex of the hierarchy has shifted from the intersection of sector 6 (chemical
industries) and sector 2 (textiles) in 1987 to that of sector of 9 and 8 in 1997. It reflects that the
economic structure in China has changed from a relatively lower level of light industry to an
economy in which heavy industries play a more active role.
5. Conclusion
In the last twenty years, China’s position as one of the fastest economic growing countries in the
world has generated forces that have changed its economic structure. With the rank-size analysis
and the method to visualize economic structure, we have provided a brief overview of these
changes. Heavy industries sectors maintain dominant roles in the Chinese economy from 1987
to 1997, but with different emphases----the first ten years on chemicals, and the second ten years
transferring to machinery and electronics. Labor- intensive industries like textiles are declining
due to an active policy that intends to develop high-technology industry. Some non-
manufacturing sectors changed their roles in the national economy and started to influence the
economy in a positive way, but the services sector has not been a key sector in national economy,
so China's developing character as a developing country has no t changed.
R E A L Comparative analysis of China’s economic structures between 1987 and 1997: an input-output prospective 20
Figure 12 Economic landscapes for China from 1987 to 1997
6
8
2
5
4
147
3
13
213 9
12 3 8 4 6 1 716 5
15 14 12 18 11 17
0.0
0.1
0.2
0.3
(a) 1987 Landscape
6 11
8 9 2
12 5
15 4
17 7
14 1
18 3
10 16
13
2 13
9 3
8 10
4 6
1 7
18 5
15 14
12 16
11 17
0
0.2
0.4
forwardbackward
(b) 1992 landscape in 1987 hierarchy
611
89
212
515
417
714
118
310
1613
213 9 3
8 104 6
17
185
1514
1216
1117
0
0.1
0.2
0.3
0.4
forward backward
(c)1997 landscape in 1987 hierachy
R E A L Comparative analysis of China’s economic structures between 1987 and 1997: an input-output prospective 21
References
Brown, M.E. (2000) The Rise of China, Cambridge, Mass. MIT Press, 2000.
Bulmer-Thomas, V. (1982) Input-Output Analysis in Developing Countries: Sources, Methods
and Applications, John Wiley & Sons Ltd.
Cho, B-D., J. Sohn and G.J.D. Hewings(2000) “Industrial structural Change in the Korean
Economy between 1975 and 1995: Input-output analysis.” Economic Papers (Bank of
Korea),3, 109-136.
Hewings, G.J.D. (1985) Regional Input-Output Analysis. Beverly Hills, Sage.
Miller, Ronald E., Blair, Peter D. (1985) Input-Output Analysis: Foundations and Extensions,
Prentice-Hall, Inc. Englewood Cliffs, New Jersey.
Polenske, K.R. and Chen, Xikang (1991) Chinese Economic Planning and Input-output Analysis.
Oxford, Oxford University Press.
Rasmussen, P. (1956). Studies in Inter-Sectoral Relations Copenhagen, Einar Harks.
Sonis, M., G.J.D. Hewings (1999) “Economic landscapes: multiplier product matrix analysis for
multiregional input-output systems.” Hitotsubashi Journal of Economics, 40, 59-74.
Sonis, M., G.J.D. Hewings, and J. Guo, 1997a. “Comparative analysis of China's metropolitan
economies: an input-output perspective.” In: M.Chatterji and Y. Kaizhong, eds. Regional
Science in Developing Countries. Basingstoke, Macmillan Press., pp. 147-162.
Sonis,M., G.J.D. Hewings, and J.Guo, J. 1997a. “A new image of classical key sector analysis:
Minimum information decomposition of the Leontief Inverse.” Economic Systems Research,
12.