the project schedule management processes are · the project management planning processes are...
TRANSCRIPT
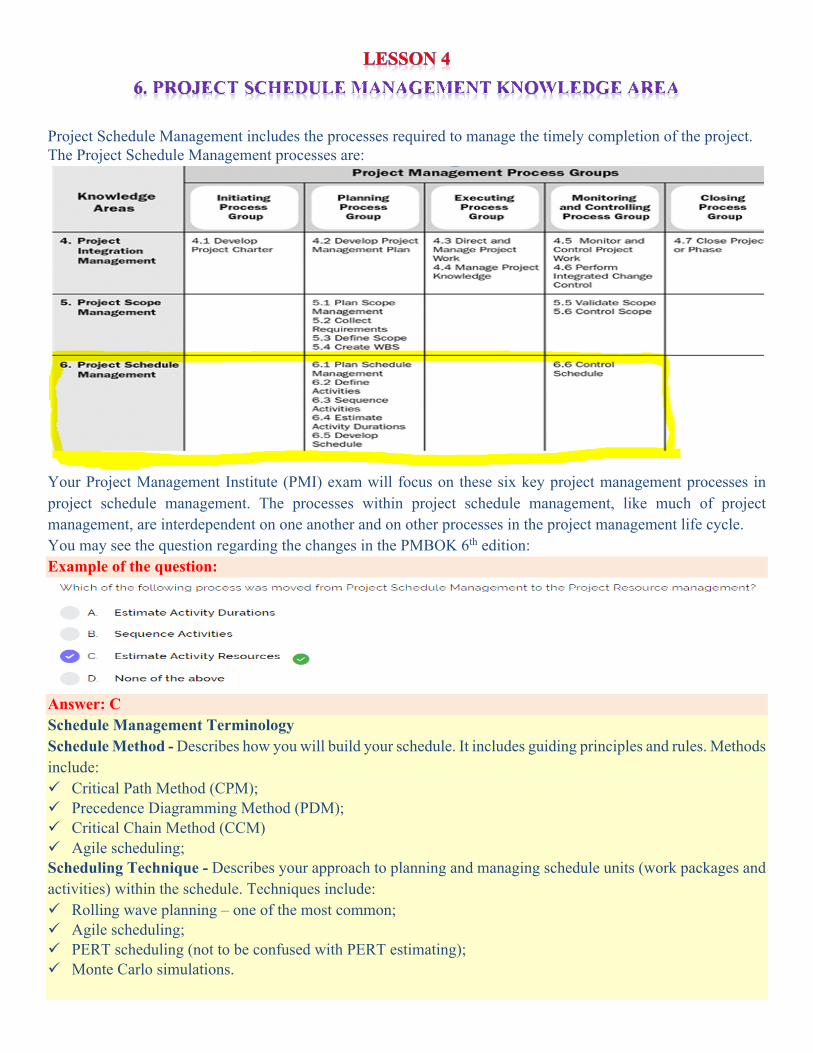
Project Schedule Management includes the processes required to manage the timely completion of the project. The Project Schedule Management processes are:
Your Project Management Institute (PMI) exam will focus on these six key project management processes in project schedule management. The processes within project schedule management, like much of project management, are interdependent on one another and on other processes in the project management life cycle. You may see the question regarding the changes in the PMBOK 6th edition: Example of the question:
Answer: C Schedule Management Terminology Schedule Method - Describes how you will build your schedule. It includes guiding principles and rules. Methods include: ü Critical Path Method (CPM); ü Precedence Diagramming Method (PDM); ü Critical Chain Method (CCM) ü Agile scheduling; Scheduling Technique - Describes your approach to planning and managing schedule units (work packages and activities) within the schedule. Techniques include: ü Rolling wave planning – one of the most common; ü Agile scheduling; ü PERT scheduling (not to be confused with PERT estimating); ü Monte Carlo simulations.
Scheduling tool - Typically, an automated or software application. There are more than 300 different project scheduling software tools available. You can select the one best for your industry or company. Once you have decided on a method and technique, you are ready to select the scheduling tool. Not all scheduling tools are designed for every method or technique, so this is important to know. Notice that none of these terms has anything to do with a specific project. These are only the structural or design considerations. Schedule Model - Contains project-specific information such as: activities, milestones, and resources. You construct a schedule in the scheduling tool utilizing the chosen method and technique. Your schedule model may be displayed in different ways, such as a: ü Gantt chart; ü Milestone schedule; ü Network diagram. KEY CONCEPTS FOR PROJECT SCHDULE MANAGEMENT: ü Project scheduling provides a detailed plan that represents how and when the project will deliver the
products, services, and results defined in the project scope and serves as a tool for communication, managing stakeholders’ expectations, and as a basis for performance reporting.
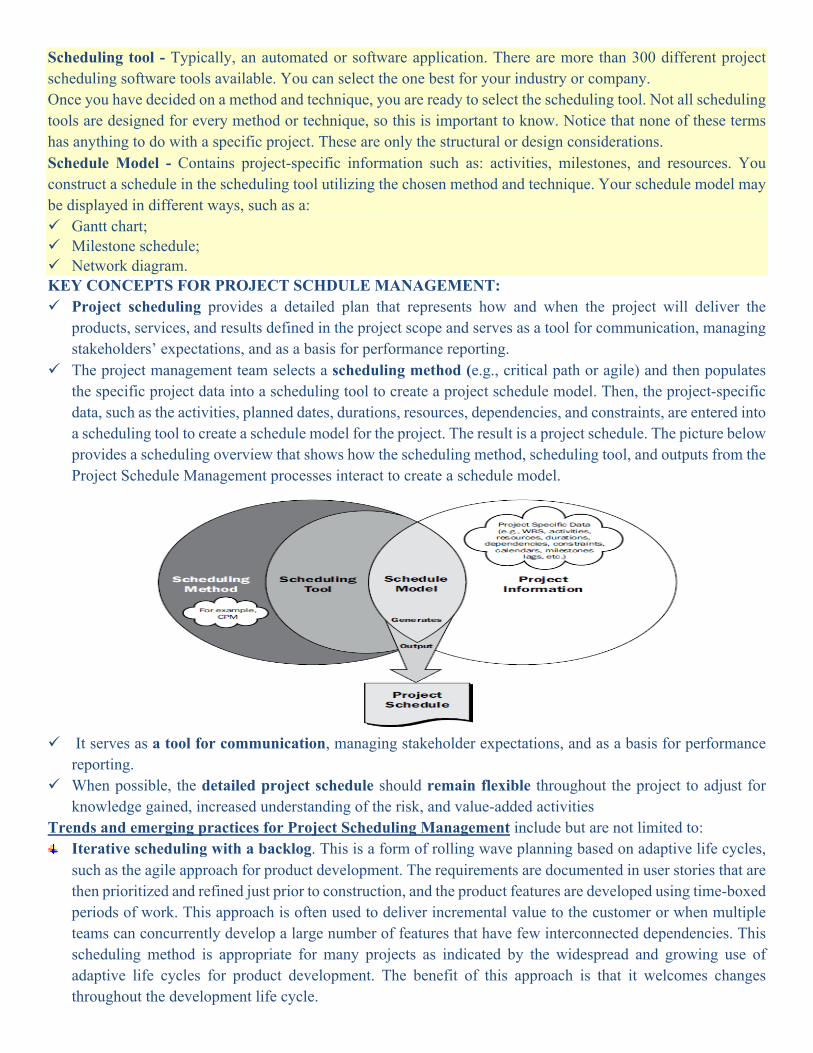
ü The project management team selects a scheduling method (e.g., critical path or agile) and then populates the specific project data into a scheduling tool to create a project schedule model. Then, the project-specific data, such as the activities, planned dates, durations, resources, dependencies, and constraints, are entered into a scheduling tool to create a schedule model for the project. The result is a project schedule. The picture below provides a scheduling overview that shows how the scheduling method, scheduling tool, and outputs from the Project Schedule Management processes interact to create a schedule model.
ü It serves as a tool for communication, managing stakeholder expectations, and as a basis for performance
reporting. ü When possible, the detailed project schedule should remain flexible throughout the project to adjust for
knowledge gained, increased understanding of the risk, and value-added activities Trends and emerging practices for Project Scheduling Management include but are not limited to:
Iterative scheduling with a backlog. This is a form of rolling wave planning based on adaptive life cycles, such as the agile approach for product development. The requirements are documented in user stories that are then prioritized and refined just prior to construction, and the product features are developed using time-boxed periods of work. This approach is often used to deliver incremental value to the customer or when multiple teams can concurrently develop a large number of features that have few interconnected dependencies. This scheduling method is appropriate for many projects as indicated by the widespread and growing use of adaptive life cycles for product development. The benefit of this approach is that it welcomes changes throughout the development life cycle.
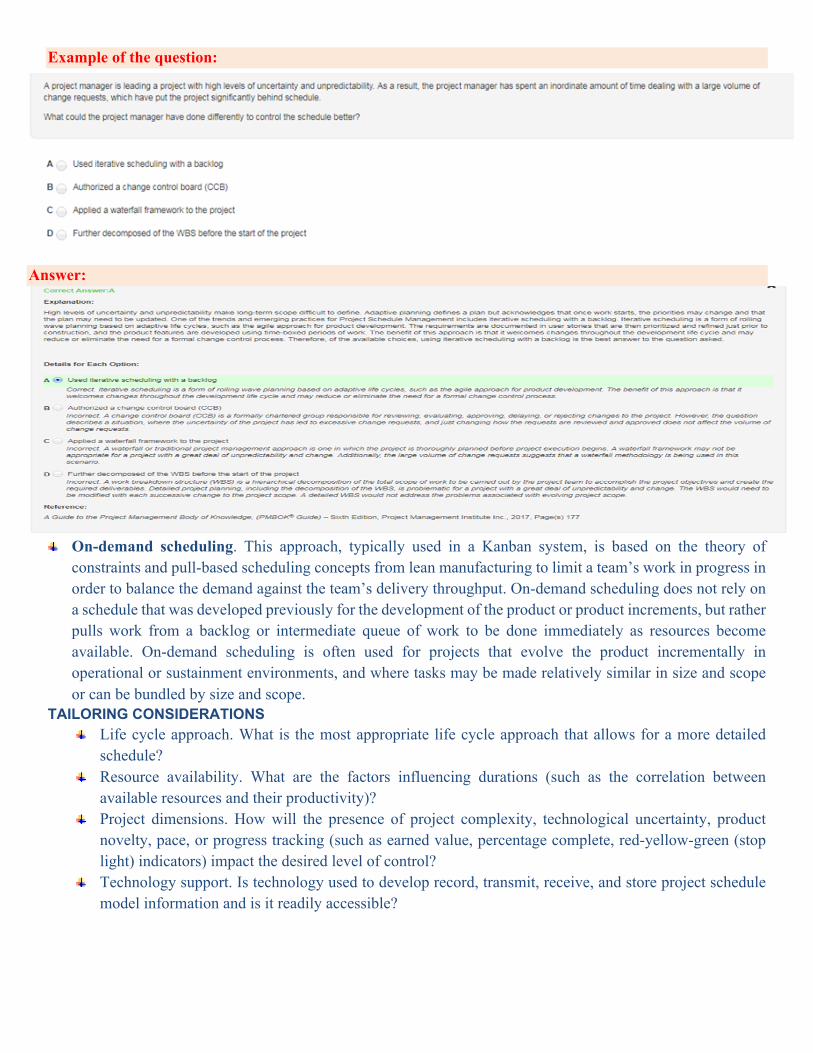
Example of the question:
Answer:
On-demand scheduling. This approach, typically used in a Kanban system, is based on the theory of
constraints and pull-based scheduling concepts from lean manufacturing to limit a team’s work in progress in order to balance the demand against the team’s delivery throughput. On-demand scheduling does not rely on a schedule that was developed previously for the development of the product or product increments, but rather pulls work from a backlog or intermediate queue of work to be done immediately as resources become available. On-demand scheduling is often used for projects that evolve the product incrementally in operational or sustainment environments, and where tasks may be made relatively similar in size and scope or can be bundled by size and scope.
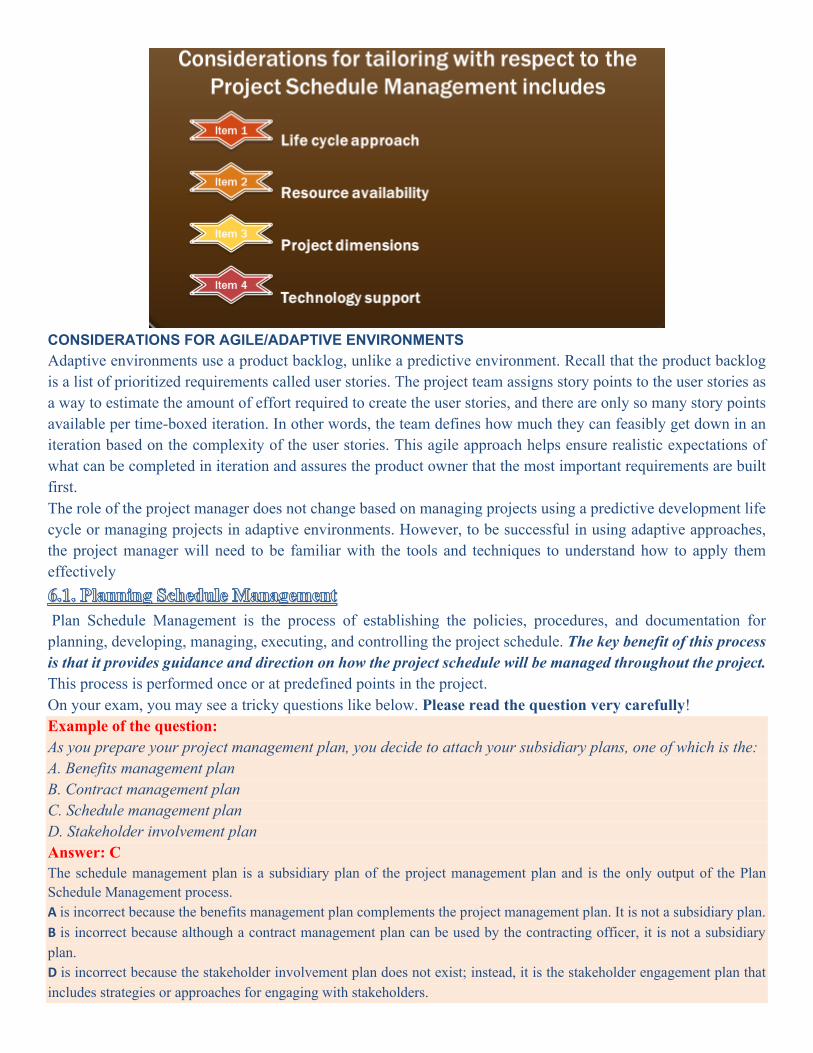
TAILORING CONSIDERATIONS Life cycle approach. What is the most appropriate life cycle approach that allows for a more detailed
schedule? Resource availability. What are the factors influencing durations (such as the correlation between
available resources and their productivity)? Project dimensions. How will the presence of project complexity, technological uncertainty, product
novelty, pace, or progress tracking (such as earned value, percentage complete, red-yellow-green (stop light) indicators) impact the desired level of control?
Technology support. Is technology used to develop record, transmit, receive, and store project schedule model information and is it readily accessible?
CONSIDERATIONS FOR AGILE/ADAPTIVE ENVIRONMENTS Adaptive environments use a product backlog, unlike a predictive environment. Recall that the product backlog is a list of prioritized requirements called user stories. The project team assigns story points to the user stories as a way to estimate the amount of effort required to create the user stories, and there are only so many story points available per time-boxed iteration. In other words, the team defines how much they can feasibly get down in an iteration based on the complexity of the user stories. This agile approach helps ensure realistic expectations of what can be completed in iteration and assures the product owner that the most important requirements are built first. The role of the project manager does not change based on managing projects using a predictive development life cycle or managing projects in adaptive environments. However, to be successful in using adaptive approaches, the project manager will need to be familiar with the tools and techniques to understand how to apply them effectively
Plan Schedule Management is the process of establishing the policies, procedures, and documentation for planning, developing, managing, executing, and controlling the project schedule. The key benefit of this process is that it provides guidance and direction on how the project schedule will be managed throughout the project. This process is performed once or at predefined points in the project. On your exam, you may see a tricky questions like below. Please read the question very carefully! Example of the question: As you prepare your project management plan, you decide to attach your subsidiary plans, one of which is the: A. Benefits management plan B. Contract management plan C. Schedule management plan D. Stakeholder involvement plan Answer: C The schedule management plan is a subsidiary plan of the project management plan and is the only output of the Plan Schedule Management process. A is incorrect because the benefits management plan complements the project management plan. It is not a subsidiary plan. B is incorrect because although a contract management plan can be used by the contracting officer, it is not a subsidiary plan. D is incorrect because the stakeholder involvement plan does not exist; instead, it is the stakeholder engagement plan that includes strategies or approaches for engaging with stakeholders.
The project management planning processes are iterative, as you know, and will happen over and over throughout the project. You and the project team—and even some key stakeholders—will work together to define the project’s schedule management plan. This will happen early in the project’s planning processes, but you’ll probably need to return to schedule management planning to adjust, replan, or focus on the schedule you’ve created for the project. Planning schedule management is not the creation of the actual project schedule. That’d be too easy. Instead, the schedule management plan defines how the project’s policies and procedures for managing the project schedule will take place. You’ll define the procedures for completing schedule management. To do this planning, you’ll gather your project team, key stakeholders, and subject matter experts such as people from management and consultants to help you plan what it is you’re about to schedule. Inputs for this process are: The project management plan (Scope management plan, Development approach); The Project Charter; Enterprise Environmental Factors; and Organizational Process Assets. Let us start at the beginning. A business case was approved and the project charter created. In the charter, there's a high-level milestone schedule used to set expectations. As the project planning progresses, the project management plan establishes the schedule framework based originally on the project charter and updated once the schedule is finalized. The schedule management plan specifies how the schedule will be created, managed, and reported. Before you open a scheduling tool, you need to answer some important questions and document them in the schedule management plan. These include:
How do you plan to develop your schedule model? The WBS orientation should be a consideration to help you determine the activity list format.
What method will you use? Critical Path Method is one of the most common, but there are others that may work better for your type of project.
Estimating: What is the level of estimating accuracy you need, and what is the unit of measurement the team should use? Generally, human resources are estimated in hours and paint in gallons.
Schedule maintenance: How frequently will updates be made? By whom? How? Performance measurements: How will percent complete be measured? Will it be using Earned Value
management? Physical percent complete? Reporting formats: How will you share project information with different stakeholders? Will a Gantt chart
be acceptable? Milestone schedule? Perhaps you need resource-specific views for your team assignments? Answering these questions now will make it easier to build a schedule that works for you. It will be easier to update later on if you think about how the schedule will be used to manage and control schedule performance. Think about outputs in the form of status reports. If there's a schedule component in the status report, what should it look like and how will you collect the information to generate that view? Ideally, the scheduling tool has reporting capabilities you can leverage. Project schedules must be mapped to a calendar.
The calendar specifies work and no-work periods. Does your company work five-day weeks or six-day weeks? What are the company holidays? You can't schedule work on days when staff aren't working. This can have a significant impact on the schedule. Let's say you have a project that's 50 weeks' duration before you map it to the calendar. Your company has five paid company holidays. If true, when the schedule is mapped to a calendar, you'll extend the schedule by one week (five work days) just because of the company holidays. In addition to
company holidays that impact all employees, your project team will likely be unavailable to the project at some point because of:
Other commitments to other projects or operations; Vacations; Training.
Resource calendars are also required and must be managed. Your schedule management plan should explain how calendars will be incorporated into the schedule. Remember that some non-human resources, such as access to certain facilities like training rooms or test labs, may also need resource calendars. According to the Practice Standard for Scheduling, calendars are required for every project. Tools and techniques for this process are: Expert judgment; Data analysis (Alternative analysis); Meetings. A data analysis technique that can be used for this process includes but is not limited to alternatives analysis. Alternatives analysis can include determining which schedule methodology to use, or how to combine various methods on the project. It can also include determining how detailed the schedule needs to be, the duration of waves for rolling wave planning, and how often it should be reviewed and updated. An appropriate balance between the levels of detail needed to manage the schedule and the amount of time it takes to keep it up to date needs to be reached for each project Output from this process is: SCHEDULE MANAGEMENT PLAN. The schedule management plan is a component of the project management plan that establishes the criteria and the activities for developing, monitoring, and controlling the schedule. The schedule management plan may be formal or informal, highly detailed, or broadly framed based on the needs of the project, and includes appropriate control thresholds. The schedule management plan could be adapted from a previous project, or, if you need to, you could design the plan from scratch. For your PMP examination, you should be familiar with the information documented in the plan:
Project schedule model development: This approved scheduling methodology and project management information system will help you develop the project schedule.
Project schedule model maintenance: You’ll use this component of the plan when you update the project progress.
Release and iteration length: If you’re working in an adaptive environment, you’ll define how long the time-boxed iterations will last (for example, two or four weeks per iteration).
Level of accuracy: You’ll need to establish confidence in the provided project duration estimates (such as +/–48 hours, or 10 percent), any rounding of hours (for example, you could say the smallest task assignment is one workday), and how confident you are to meet the project’s deadline, if one exists.
Units of measure: Your schedule management plan can define the schedule in hours, days, weeks, or even percentage of employee schedule.
Organizational procedure links: The schedule management plan is part of the overall project management plan and is a project deliverable that will become part of historical information. The work breakdown structure (WBS) is linked to the schedule management plan as the duration estimates are linked to the activities and the WBS work packages.
Control thresholds: Depending on the confidence in the activity duration estimates, a level of tolerance for the project schedule should be identified, such as +/−10 percent. This is considered the threshold or tolerance for error. Any value outside the 10 percent will be a cause for a corrective action in the project.
Rules of performance measurement: The schedule management plan should define how the project will be measured for performance. The most common approach is a suite of formulas called earned value management.
Reporting formats: Based on project performance, the project manager will need to report the schedule status to management, key stakeholders, and project customers.
Define Activities is the process of identifying and documenting the specific actions to be performed to produce the project deliverables. The key benefit of this process is that it decomposes work packages into schedule activities that provide a basis for estimating, scheduling, executing, monitoring, and controlling the project work. This process is performed throughout the project. Inputs in to this process are: Project management plan (Schedule management plan, Scope baseline); Enterprise environmental factors; Organizational process assets. The schedule management plan defines the schedule methodology, the duration of waves for rolling wave planning, and the level of detail necessary to manage the work. Scope baseline. The project WBS, deliverables, constraints, and assumptions documented in the scope baseline are considered explicitly while defining activities. These inputs and the order of precedence mentioned earlier will help the project team define the activities to create the components of the project scope. We’re still in the planning process group, so this process is iterative. Any changes to the project scope will likely cause the project manager to revisit these processes throughout the project. The work package, the smallest item in the WBS, is broken down into schedule activities, which include the labor to create the things defined in the WBS. The WBS, of course, reflects the project scope statement. The preceding list is the logical sequence of how the project management team will work together to create the activity list. What Is an Activity? An activity is a discrete unit of work to be performed. There are characteristics of an activity that make it easier to plan and manage. Building a good-quality schedule starts with good activity definition. Remember these four things when identifying activities:
Measurable, One resource, Specific, No interruptions.
Activity Types. We need more than one activity type to handle all the different situations we will run into. There are three basic types, and they are used differently:
Discrete activities have short durations and are very measurable. Your goal should be that the majority of activities fall into this type.
Level of Effort (LOE). These are used on an exception basis for longer-duration activities that are not easily measured. They are often administrative or support work efforts like project administration that starts on the first day of the project and ends on the last day, but there is not any specific activity related to a customer-accepted deliverable for them in the schedule. The project manager's work is the project.
Milestones are measurement points or possibly events. Milestones have zero duration, no work is performed, and no resources are assigned. A measurement milestone example is a phase completion milestone or an event like "contract approved."
Tools and techniques for this process are: Expert judgment; Decomposition; Rolling wave planning; Meetings Decomposition is a technique used for dividing and subdividing the project scope and project deliverables into smaller, more manageable parts. Activities represent the effort needed to complete a work package. The Define Activities process defines the final outputs as activities rather than deliverables, as done in the Create WBS process. The activity list, WBS, and WBS dictionary can be developed either sequentially or concurrently, with the WBS and WBS dictionary used as the basis for development of the final activity list. Each work package within the
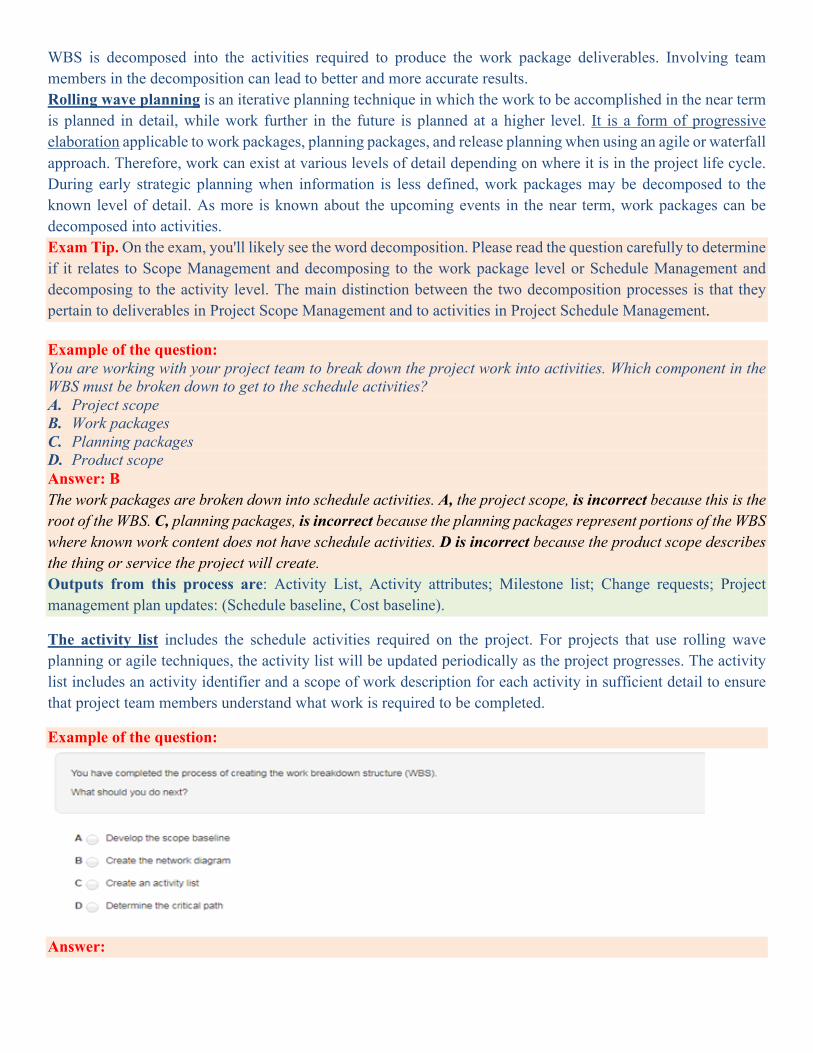
WBS is decomposed into the activities required to produce the work package deliverables. Involving team members in the decomposition can lead to better and more accurate results. Rolling wave planning is an iterative planning technique in which the work to be accomplished in the near term is planned in detail, while work further in the future is planned at a higher level. It is a form of progressive elaboration applicable to work packages, planning packages, and release planning when using an agile or waterfall approach. Therefore, work can exist at various levels of detail depending on where it is in the project life cycle. During early strategic planning when information is less defined, work packages may be decomposed to the known level of detail. As more is known about the upcoming events in the near term, work packages can be decomposed into activities. Exam Tip. On the exam, you'll likely see the word decomposition. Please read the question carefully to determine if it relates to Scope Management and decomposing to the work package level or Schedule Management and decomposing to the activity level. The main distinction between the two decomposition processes is that they pertain to deliverables in Project Scope Management and to activities in Project Schedule Management. Example of the question: You are working with your project team to break down the project work into activities. Which component in the WBS must be broken down to get to the schedule activities? A. Project scope B. Work packages C. Planning packages D. Product scope Answer: B The work packages are broken down into schedule activities. A, the project scope, is incorrect because this is the root of the WBS. C, planning packages, is incorrect because the planning packages represent portions of the WBS where known work content does not have schedule activities. D is incorrect because the product scope describes the thing or service the project will create. Outputs from this process are: Activity List, Activity attributes; Milestone list; Change requests; Project management plan updates: (Schedule baseline, Cost baseline).
The activity list includes the schedule activities required on the project. For projects that use rolling wave planning or agile techniques, the activity list will be updated periodically as the project progresses. The activity list includes an activity identifier and a scope of work description for each activity in sufficient detail to ensure that project team members understand what work is required to be completed.
Example of the question:
Answer:
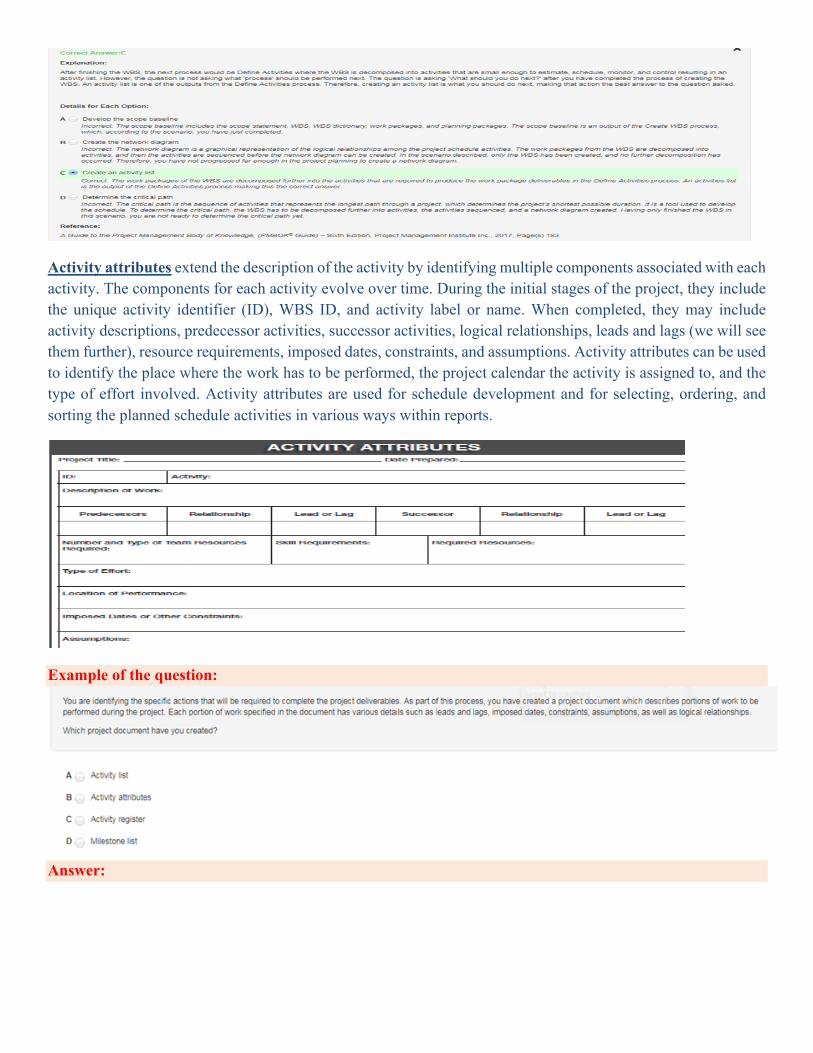
Activity attributes extend the description of the activity by identifying multiple components associated with each activity. The components for each activity evolve over time. During the initial stages of the project, they include the unique activity identifier (ID), WBS ID, and activity label or name. When completed, they may include activity descriptions, predecessor activities, successor activities, logical relationships, leads and lags (we will see them further), resource requirements, imposed dates, constraints, and assumptions. Activity attributes can be used to identify the place where the work has to be performed, the project calendar the activity is assigned to, and the type of effort involved. Activity attributes are used for schedule development and for selecting, ordering, and sorting the planned schedule activities in various ways within reports.
Example of the question:
Answer:
Milestones are important events that occur during the project life cycle. A milestone list identifies all project milestones and indicates whether the milestone is mandatory, such as those required by contract, or optional, such as those based on historical information. Milestones have zero duration because they represent a significant point or event.
Example of the question:
Answer:
Sequence Activities is the process of identifying and documenting relationships among the project activities. The key benefit of this process is that it defines the logical sequence of work to obtain the greatest efficiency given all project constraints. This process is performed throughout the project.
Now that the activity list has been created, the activities must be arranged in a logical sequence. This process calls on the project manager and the project team to identify the logical relationships between activities, as well as the preferred relationship between those activities. This can be accomplished in a few different ways:
Computer-driven: Many different scheduling and project management software packages are available. These programs can help the project manager and the project team determines which actions need to happen in what order and with what level of discretion.
Manual process: In smaller projects, and on larger projects in the early phases, manual sequencing may be preferred. An advantage of manual sequencing is that it’s easier to move around dependencies and activities than it is in some programs.
Blended approach: A combination of manual and computer-driven scheduling methods is fine. It’s important to determine the correctness of the activity sequence, however. Sometimes a blended approach can be more complex than relying on just one or the other.
Inputs to this process are: Project management plan (Schedule management plan, Scope baseline); Project documents: (Activity attributes, Activity list, Assumption log, Milestone list); Enterprise environmental factors; Organizational process assets.
The schedule management plan defines the method used and the level of accuracy along with other criteria required to sequence activities; Scope baseline - The project WBS, deliverables, constraints, and assumptions documented in the scope baseline are considered explicitly while sequencing activities.
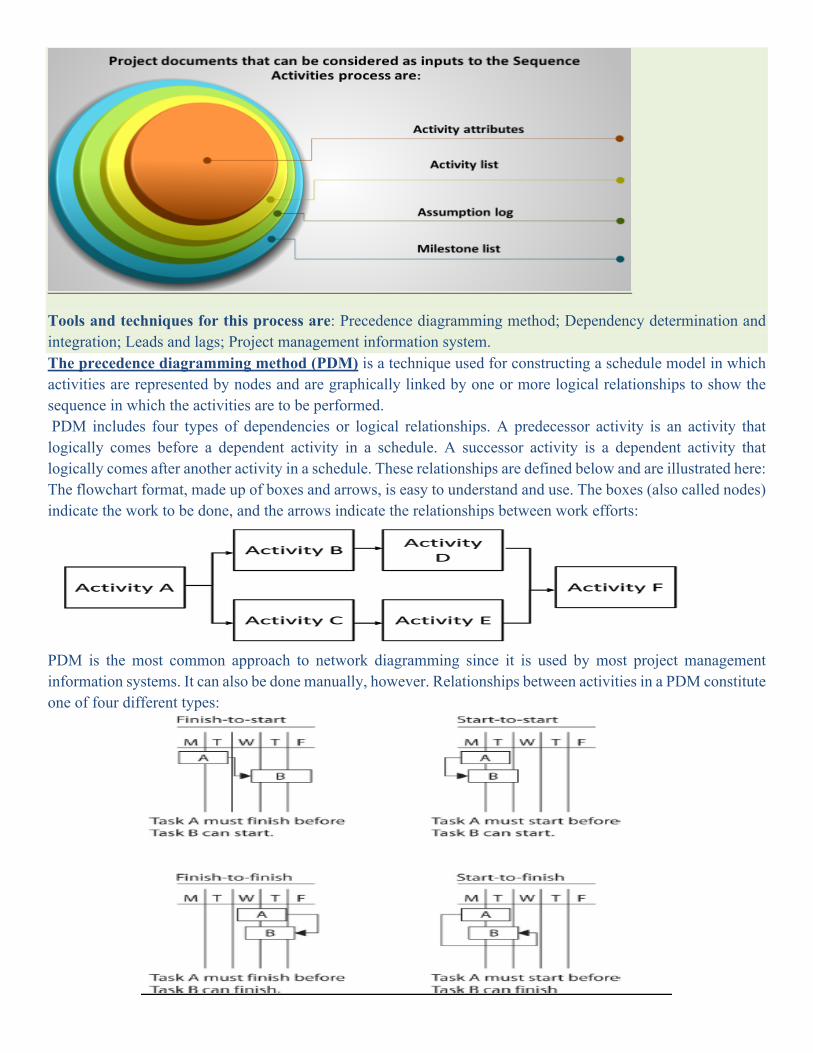
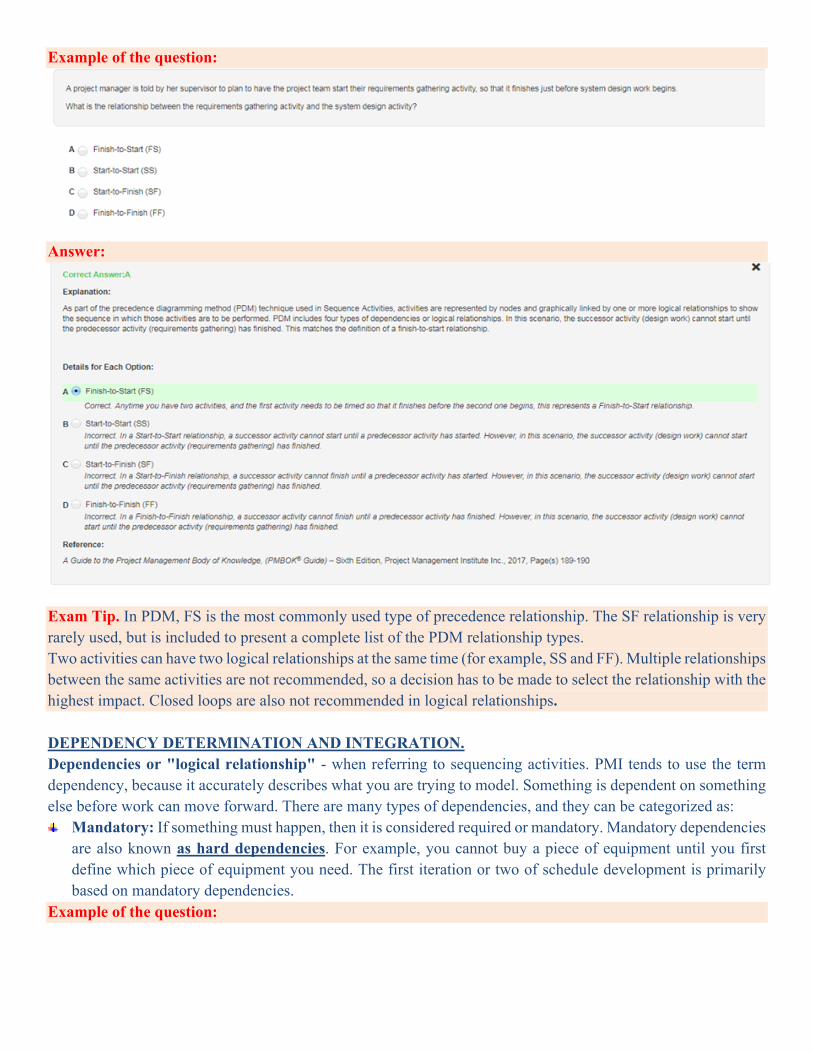
Tools and techniques for this process are: Precedence diagramming method; Dependency determination and integration; Leads and lags; Project management information system. The precedence diagramming method (PDM) is a technique used for constructing a schedule model in which activities are represented by nodes and are graphically linked by one or more logical relationships to show the sequence in which the activities are to be performed. PDM includes four types of dependencies or logical relationships. A predecessor activity is an activity that logically comes before a dependent activity in a schedule. A successor activity is a dependent activity that logically comes after another activity in a schedule. These relationships are defined below and are illustrated here: The flowchart format, made up of boxes and arrows, is easy to understand and use. The boxes (also called nodes) indicate the work to be done, and the arrows indicate the relationships between work efforts:
PDM is the most common approach to network diagramming since it is used by most project management information systems. It can also be done manually, however. Relationships between activities in a PDM constitute one of four different types:
Example of the question:
Answer:
Exam Tip. In PDM, FS is the most commonly used type of precedence relationship. The SF relationship is very rarely used, but is included to present a complete list of the PDM relationship types. Two activities can have two logical relationships at the same time (for example, SS and FF). Multiple relationships between the same activities are not recommended, so a decision has to be made to select the relationship with the highest impact. Closed loops are also not recommended in logical relationships. DEPENDENCY DETERMINATION AND INTEGRATION. Dependencies or "logical relationship" - when referring to sequencing activities. PMI tends to use the term dependency, because it accurately describes what you are trying to model. Something is dependent on something else before work can move forward. There are many types of dependencies, and they can be categorized as:
Mandatory: If something must happen, then it is considered required or mandatory. Mandatory dependencies are also known as hard dependencies. For example, you cannot buy a piece of equipment until you first define which piece of equipment you need. The first iteration or two of schedule development is primarily based on mandatory dependencies.
Example of the question:
Answer:
Discretionary: Is also known as soft dependencies. Unlike mandatory, discretionary dependencies are based
on choices or best practices. For example, a choice could be between two resources or approaches. A best practice may indicate a preferred method or technique. Your project team is in a good position to define these.
External dependencies are those that come from outside your project or company. These are inputs supplied by anyone who doesn't work for your organization. That means you have little or no influence or control over external dependencies. For example, obtaining a permit or inspection from a government entity would be external. It would also be mandatory.
Internal. These dependencies are typically between activities within your project, and you have control over these. You and your team will work together to determine these dependencies as you build the schedule.
Example of the question:
Answer:
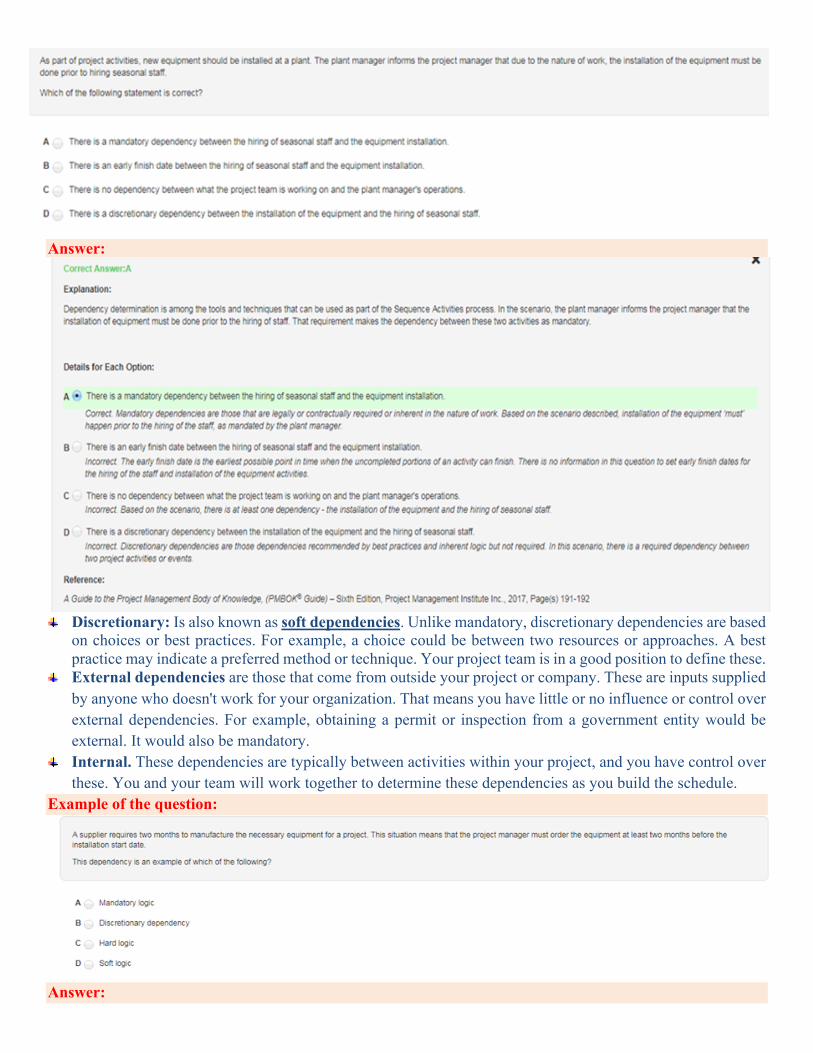
LEADS AND LAGS: (Activity Dependency Modifiers) Project managers have a significant amount of flexibility when scheduling activities utilizing discretionary dependencies. Not only do they want to define dependencies, but they want to fine-tune them by defining exactly when an activity will start. You can modify activity dependencies using leads and lags. ü A lead changes the amount of time the successor overlaps the predecessor activity. This moves work earlier
in the schedule and shifts work to the left. A lead is the amount of time a successor activity can be advanced with respect to a predecessor activity.
ü A lag is the amount of time a successor activity will be delayed with respect to a predecessor activity. This moves work later in the schedule and shifts work to the right.
Examples of Lead and Lag
Exam Tip. Best practices recommend using mandatory finish-to-start dependencies exclusively for the first iteration of your schedule. Add discretionary dependencies in later iterations. The finish-to-start is the most common and lowest-risk dependency type. The start-to-finish is the least common dependency type. Dependency types that create overlap between predecessor and successor (SS and FF) increase schedule risk. Activities may have more than one dependency, and in that case, one will be the higher priority. This may lead to eliminating the secondary dependencies, so you have a "clean" picture. Every activity (except for the first one) will have a defined predecessor. Every activity (except for the last one) will have a defined successor.
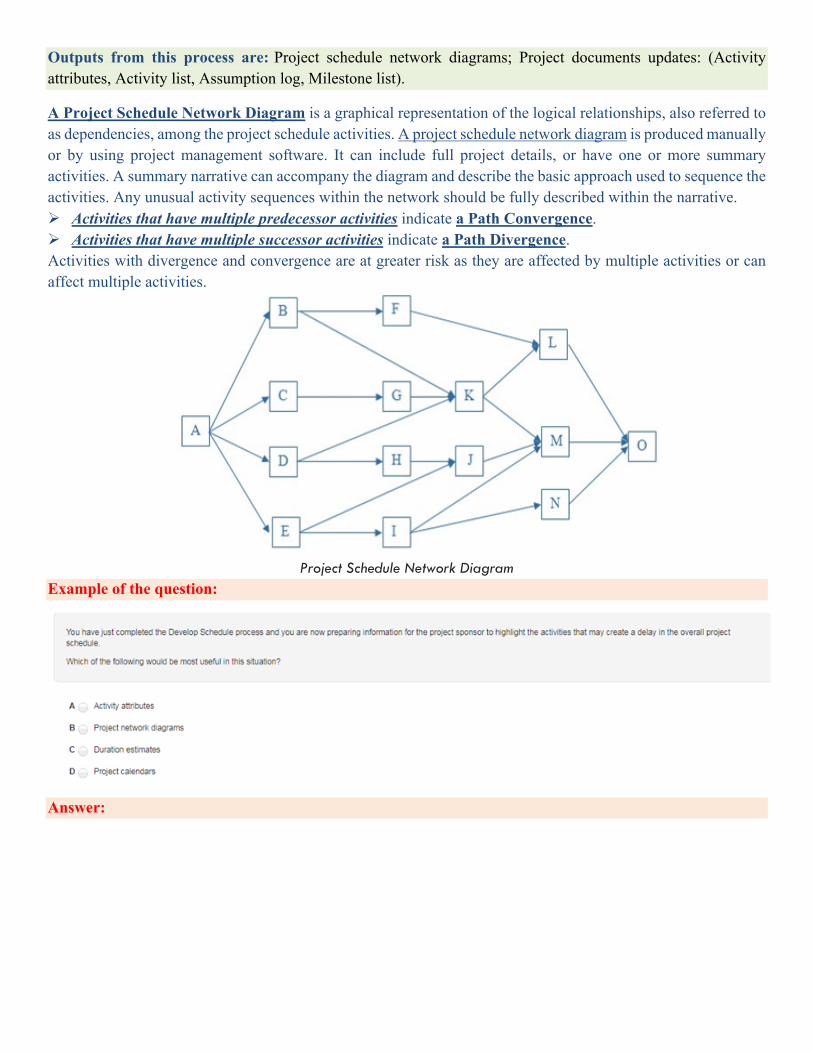
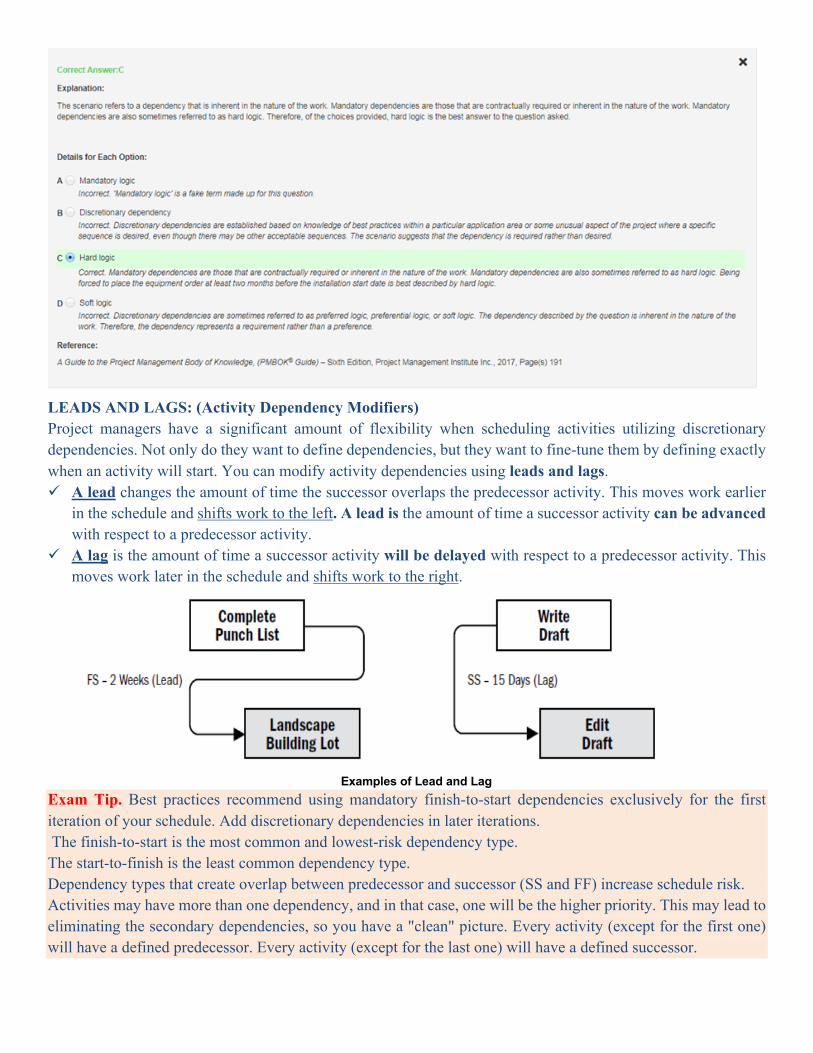
Outputs from this process are: Project schedule network diagrams; Project documents updates: (Activity attributes, Activity list, Assumption log, Milestone list).
A Project Schedule Network Diagram is a graphical representation of the logical relationships, also referred to as dependencies, among the project schedule activities. A project schedule network diagram is produced manually or by using project management software. It can include full project details, or have one or more summary activities. A summary narrative can accompany the diagram and describe the basic approach used to sequence the activities. Any unusual activity sequences within the network should be fully described within the narrative. Ø Activities that have multiple predecessor activities indicate a Path Convergence. Ø Activities that have multiple successor activities indicate a Path Divergence. Activities with divergence and convergence are at greater risk as they are affected by multiple activities or can affect multiple activities.
Project Schedule Network Diagram
Example of the question:
Answer:
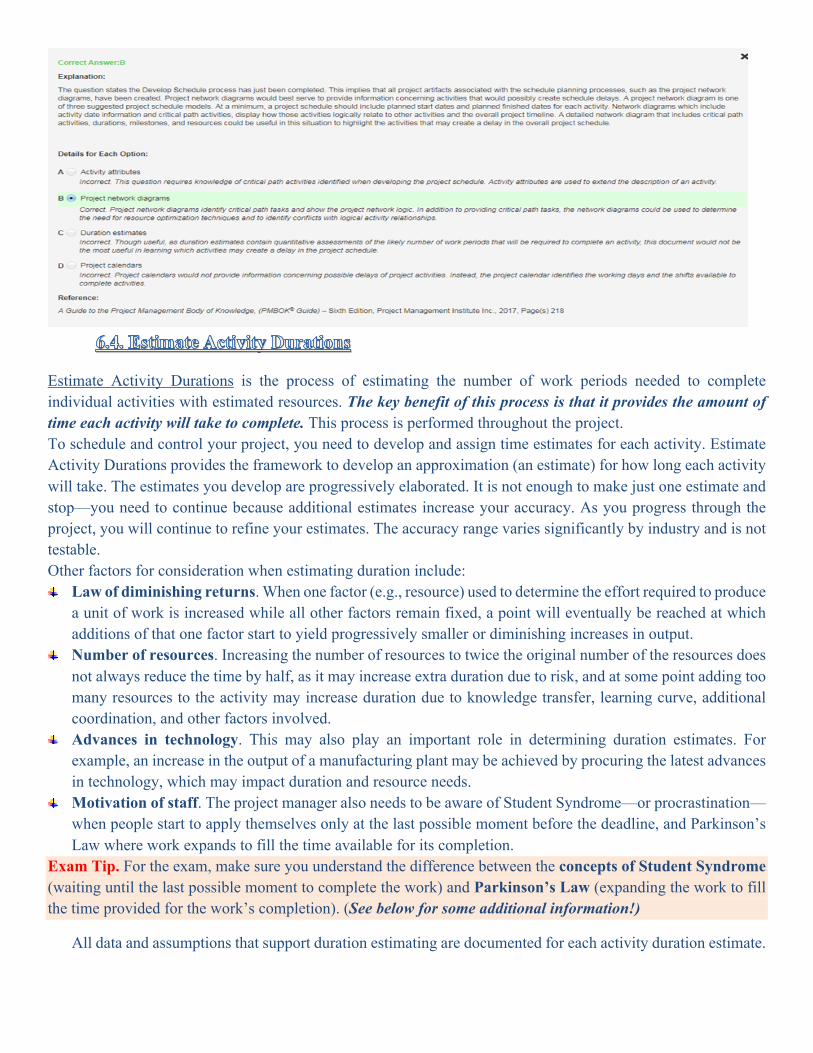
Estimate Activity Durations is the process of estimating the number of work periods needed to complete individual activities with estimated resources. The key benefit of this process is that it provides the amount of time each activity will take to complete. This process is performed throughout the project. To schedule and control your project, you need to develop and assign time estimates for each activity. Estimate Activity Durations provides the framework to develop an approximation (an estimate) for how long each activity will take. The estimates you develop are progressively elaborated. It is not enough to make just one estimate and stop—you need to continue because additional estimates increase your accuracy. As you progress through the project, you will continue to refine your estimates. The accuracy range varies significantly by industry and is not testable. Other factors for consideration when estimating duration include:
Law of diminishing returns. When one factor (e.g., resource) used to determine the effort required to produce a unit of work is increased while all other factors remain fixed, a point will eventually be reached at which additions of that one factor start to yield progressively smaller or diminishing increases in output.
Number of resources. Increasing the number of resources to twice the original number of the resources does not always reduce the time by half, as it may increase extra duration due to risk, and at some point adding too many resources to the activity may increase duration due to knowledge transfer, learning curve, additional coordination, and other factors involved.
Advances in technology. This may also play an important role in determining duration estimates. For example, an increase in the output of a manufacturing plant may be achieved by procuring the latest advances in technology, which may impact duration and resource needs.
Motivation of staff. The project manager also needs to be aware of Student Syndrome—or procrastination— when people start to apply themselves only at the last possible moment before the deadline, and Parkinson’s Law where work expands to fill the time available for its completion.
Exam Tip. For the exam, make sure you understand the difference between the concepts of Student Syndrome (waiting until the last possible moment to complete the work) and Parkinson’s Law (expanding the work to fill the time provided for the work’s completion). (See below for some additional information!)
All data and assumptions that support duration estimating are documented for each activity duration estimate.
Inputs for this process are: Project management plan: (Schedule management plan, Scope baseline); Project documents: (Activity attributes, Activity list, Assumption log, Lessons learned register, Milestone list, Project team assignments, Resource breakdown structure, Resource calendars, Resource requirements, Risk register); Enterprise environmental factors; Organizational process assets. Enterprise Environmental Factors (EEFs) – Examples include team member locations and productivity metrics. Organizational Process Assets (OPAs) – Examples include project calendars and historical activity duration information. Example of the question: You are the project manager of the HGF Project. You would like to use a portion of the activity list from the HGB Project, which is similar to your current project. The portion of the activity list from the HGB Project is best described as which one of the following? A. Rolling wave planning B. Analogous estimating C. A template D. Expert judgment Answer: C. this is an example of using the previous project as a template. A, rolling wave planning, is incorrect, because rolling wave planning describes the detailed planning of the imminent project work, and the high-level planning of work is further away in the project schedule. B is incorrect. Analogous estimating describes the method of using a similar project to create the current project’s time and/or cost estimate. D is incorrect because expert judgment is using an expert to provide needed information for the current project. So, what is a project manager to do? First off, the project manager should strive to incorporate historical information and expert judgment on which to predicate accurate estimates. Second, the project manager should stress a genuine need for accurate duration estimates. Finally, the project manager can incorporate a reserve time.
Tools and techniques for this process are: Expert judgment; Analogous estimating; Parametric estimating; Three-point estimating; Bottom-up estimating; Data analysis: (Alternatives analysis; Reserve analysis); Decision making (Voting); Meetings
Estimate Categories There are three broad categories of estimates: preliminary, budgetary, and definitive. Characteristics of Preliminary estimates are: Developed early, Created quickly, Not very accurate. Preliminary Methods are: Analogous, Parametric. If you are doing preliminary estimate - range of plus or minus 75%, Characteristics of Budgetary estimates are: Developed during planning and are used when setting your baseline. They take more time but are more accurate than preliminary estimates. Budgetary Methods: Three Point, Delphi. If you’re doing budgetary estimating -range could be plus or minus 25%, Characteristics of Definitive estimates are: Look-ahead estimating. If you are doing definitive estimating - range is plus or minus 10%.
Exam Tip: On the exam, look for the words preliminary and budgetary when referring to estimating. It will clue you into the timing and expected accuracy level of the estimates. Any of these estimating techniques may be used for duration or cost estimating. You will see them again when we discuss Project Cost Management in the next Lesson.
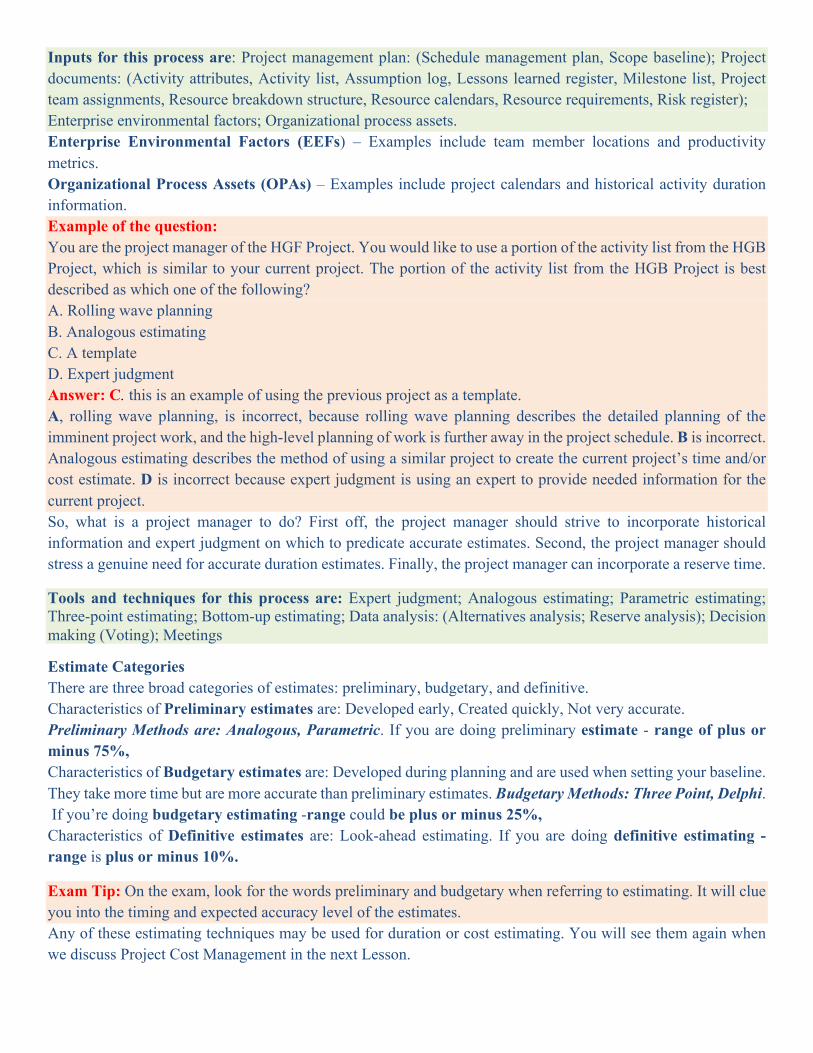
Analogous estimating relies on historical information to predict current activity durations. Analogous estimating is also known as top-down estimating and is a form of expert judgment. To use analogous estimating, activities from the historical project that are similar in nature are used to predict similar activities in the current project. A project manager must consider whether the work has been done before and, if so, what help the historical information provides. The project manager must consider the resources, project team members, and equipment that completed the activities in the previous project compared with the resources available for the current project. Ideally, the activities should be more than similar; they should be identical. The resources that completed the work in the past should be the same resources used in completing the current work. When the only source of activity duration estimates is the project team members, instead of expert judgment and historical information, your estimates will be uncertain and inherently risky. Example of the question:
Answer: D
Parametric estimating is an estimating technique in which an algorithm is used to calculate cost or duration
based on historical data and project parameters. Parametric estimating uses a statistical relationship between historical data and other variables (e.g., square footage in construction) to calculate an estimate for activity parameters, such as cost, budget, and duration.
Creating a Three-Point Estimate: How confident can a project manager be when it comes to estimating? If the project work has been done before in past projects, then the level of confidence in the duration estimate is probably high. But if the work has never been done before, there are lots of unknowns—and with them comes risk. To mitigate the risk, the project manager can use a three-point estimate. A three-point estimate requires that each activity have three estimates: Optimistic, Most likely and Pessimistic estimates. This is also known as simple averaging. Based on these three estimates, an average can be created to predict how long the activity should take. Three-point estimates use the formula to predict an activity’s duration:
(Optimistic + Most likely + Pessimistic)/3
Three-point estimates - is a Triangular distribution is the average of the 3 (three) factors. Program Evaluation and Review Technique (PERT). The formula for PERT is similar to the three-point
estimate. PERT is (Optimistic + (4 × Most Likely) + Pessimistic)/6.
The denominator is 6 in PERT because you’re using six factors. This is also known as weighted averaging. PERT estimates - is a Beta distribution, which is, uses a weight averaged for the most-likely time.
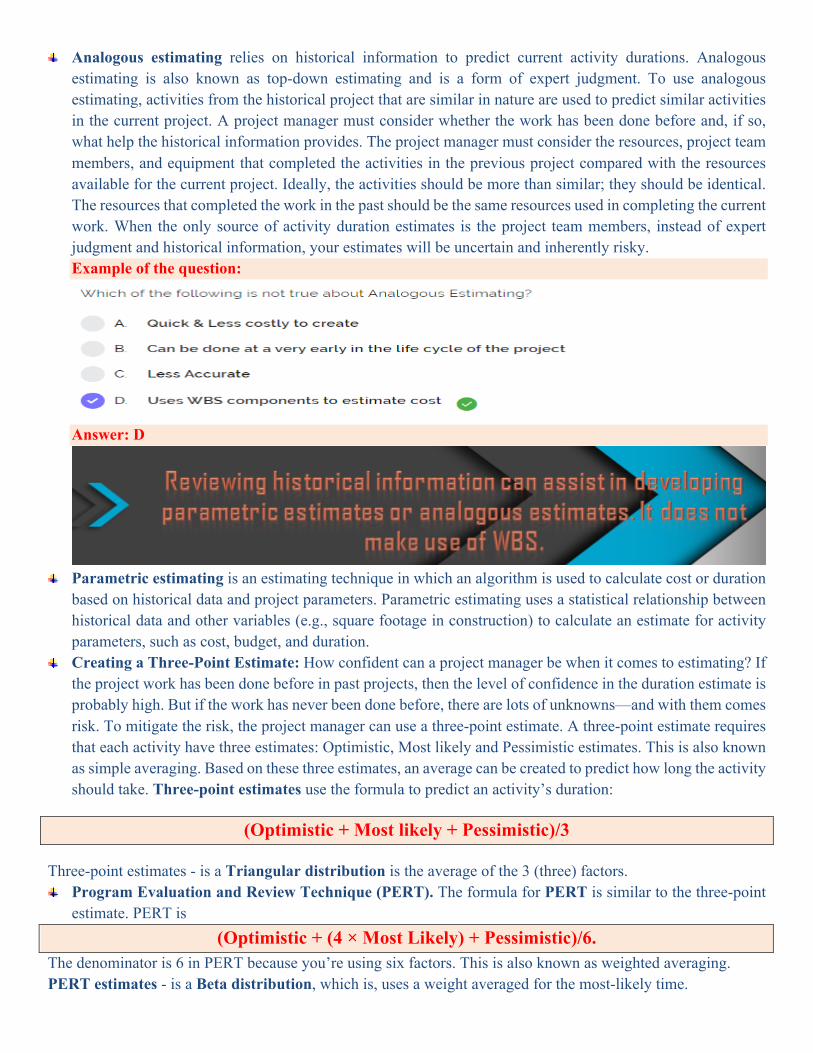
Delphi Estimating Technique. Like PERT, Delphi also requires multiple estimates. The difference is that with PERT you obtain three estimates (O, P and ML) from one person. With Delphi, you obtain one estimate (a "most likely") from multiple people. There are two main benefits of using Delphi. First, using multiple estimates will mitigate estimator bias. Second, the final estimate is consensus based.
Standard Deviation. Example of the question:
Answer:
Definitive estimates. It is also known as a Bottom-Up estimating technique. Bottom-up estimating is a
method of estimating project duration or cost by aggregating the estimates of the lower level components of the WBS. When an activity’s duration cannot be estimated with a reasonable degree of confidence, the work within the activity is decomposed into more detail. The detail durations are estimated. These estimates are then aggregated into a total quantity for each of the activity’s durations. Activities may or may not have dependencies between them that can affect the application and use of resources. If there are dependencies, this pattern of resource usage is reflected and documented in the estimated requirements of the activity.
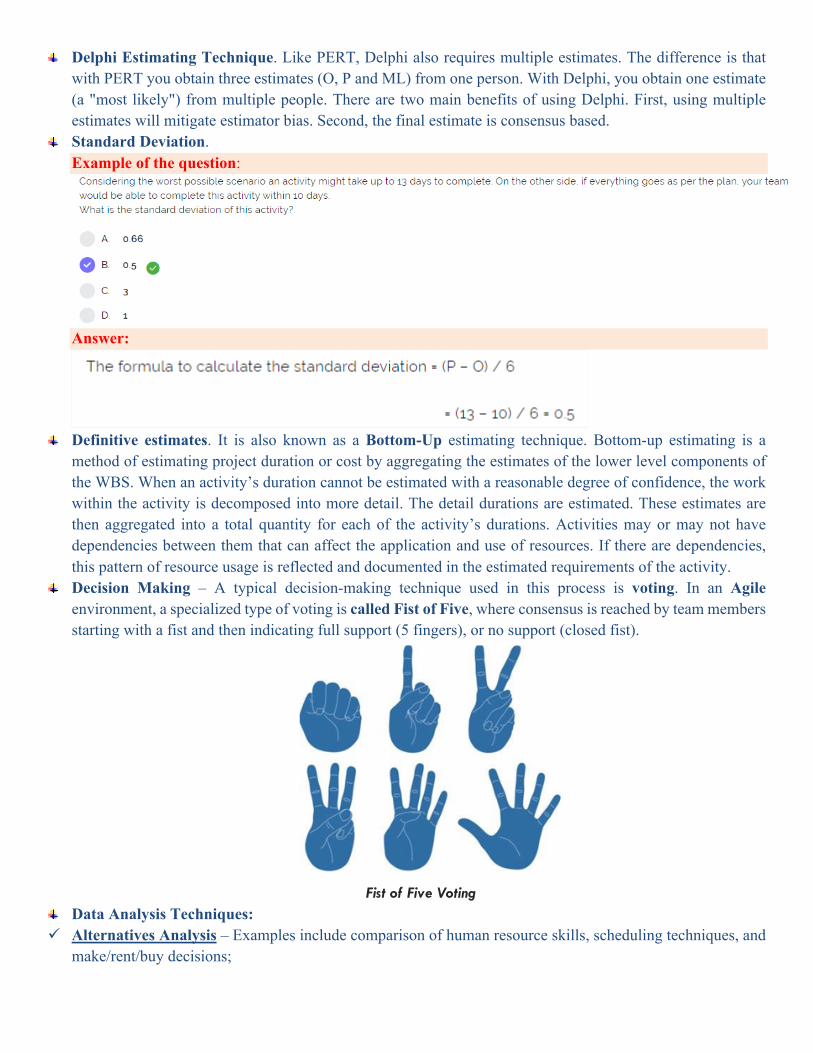
Decision Making – A typical decision-making technique used in this process is voting. In an Agile environment, a specialized type of voting is called Fist of Five, where consensus is reached by team members starting with a fist and then indicating full support (5 fingers), or no support (closed fist).
Fist of Five Voting
Data Analysis Techniques: ü Alternatives Analysis – Examples include comparison of human resource skills, scheduling techniques, and
make/rent/buy decisions;
ü Reserve Analysis – This is an analytical technique used to determine the specific reserves that may be necessary on the project in terms of schedule (time reserves) that are available if and when needed on the project.
Contingency Reserves – This refers to time allocated inside the schedule baseline for known risks with active risk response strategies. These could be in the form a percentage of estimated activity duration or a fixed number of work periods.
Management Reserves – This refers to time allocated outside the schedule baseline for work not originally identified on the project but within the scope of the project, and is used for management control purposes.
Exam Tip. Contingency Reserves are for known project risks (it is named as Known-Unknown), and are included in the schedule baseline. Management Reserves are for unknown project work not identified in the original scope ((it is named as Unknown-Unknown), and are not included in the schedule baseline.
A reserve time is a percentage of the project duration or a preset number of work periods, and it is usually added to the end of the project schedule or just in front of reaching project milestones. Reserve time may also be added to individual activity durations based on risk or uncertainty in the activity duration. When activities are completed late, the additional time for the activity is subtracted from the reserve time. As the project moves forward, the reserve time can be reduced or eliminated as the project manager sees fit. Reserve time decisions should be documented. Additional information:
Parkinson’s Law states “Work expands so as to fill the time available for its completion.” This little nugget of wisdom is oh-so-true. Consider a project team member who knows an activity should last 24 hours. The team member decides, in his own wisdom, to say that the activity will last 32 hours. These extra 8 hours, he figures, will allow plenty of time for the work to be completed should any unforeseen incidents pop up. The trouble is, however, that the task will magically expand to require the complete 32 hours.
Procrastination. Also known as a Student syndrome (planned procrastination). Most people put off starting a task until the last possible minute. The trouble with bloated, hidden time is that people may wait through the additional time they’ve secretly factored into the activity. Unfortunately, if something does go awry in completing the activity, the work result is later than predicted.
Hidden time. Hidden time, the time factored in by the project team member, is secret. No one, especially the project manager, knows why the extra time has been factored into the activity. The team member can then “enjoy” the extra time to complete the task at his leisure.
Demands. Project team members may be assigned to multiple projects with multiple demands. The requirement to move from project to project can shift focus, result in a loss of concentration, and require additional ramp-up time as workers shift from activity to activity. The demand for multitasking enables project team members to take advantage of hidden time.
On schedule. Activities are typically completed on schedule or later, but rarely early. Workers who have bloated the activity duration estimates may finish their task ahead of when they promised, but they tend to hold onto those results until the activity’s due date. This is because workers aren’t usually rewarded for completing work early. In addition, workers don’t want to reveal the inaccuracies in their time estimates. Workers may believe future estimates may be based on actual work durations rather than estimates, so they’ll “sandbag” the results to protect themselves—and finish “on schedule.”
Outputs from this process are: Duration estimates, Basis of estimates, Project documents updates: (Activity attributes, Assumption log, Lessons learned register).
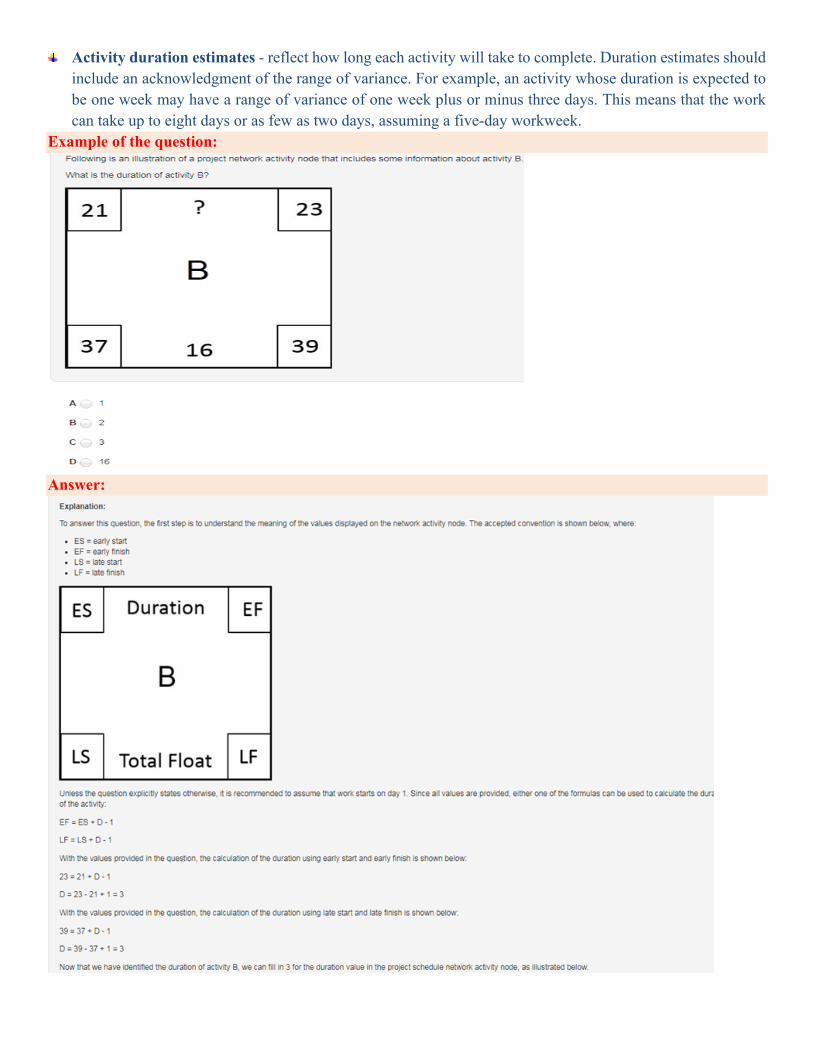
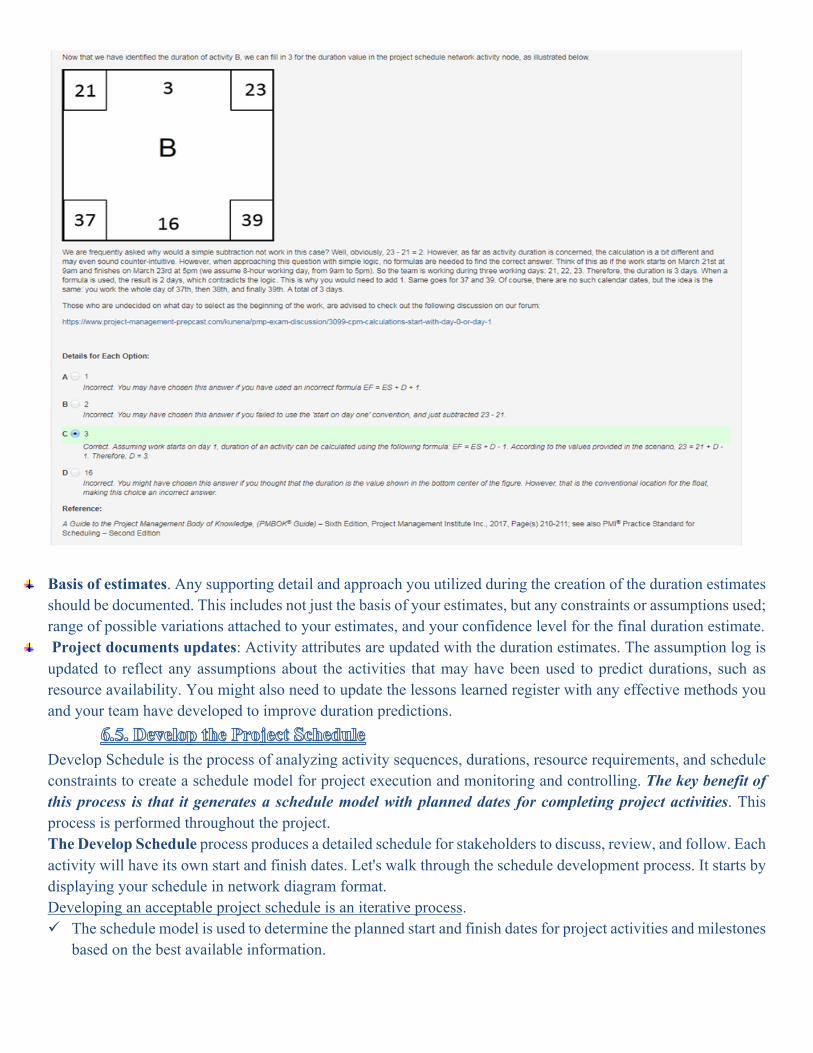
Activity duration estimates - reflect how long each activity will take to complete. Duration estimates should include an acknowledgment of the range of variance. For example, an activity whose duration is expected to be one week may have a range of variance of one week plus or minus three days. This means that the work can take up to eight days or as few as two days, assuming a five-day workweek.
Example of the question:
Answer:
Basis of estimates. Any supporting detail and approach you utilized during the creation of the duration estimates should be documented. This includes not just the basis of your estimates, but any constraints or assumptions used; range of possible variations attached to your estimates, and your confidence level for the final duration estimate.
Project documents updates: Activity attributes are updated with the duration estimates. The assumption log is updated to reflect any assumptions about the activities that may have been used to predict durations, such as resource availability. You might also need to update the lessons learned register with any effective methods you and your team have developed to improve duration predictions.
Develop Schedule is the process of analyzing activity sequences, durations, resource requirements, and schedule constraints to create a schedule model for project execution and monitoring and controlling. The key benefit of this process is that it generates a schedule model with planned dates for completing project activities. This process is performed throughout the project. The Develop Schedule process produces a detailed schedule for stakeholders to discuss, review, and follow. Each activity will have its own start and finish dates. Let's walk through the schedule development process. It starts by displaying your schedule in network diagram format. Developing an acceptable project schedule is an iterative process. ü The schedule model is used to determine the planned start and finish dates for project activities and milestones
based on the best available information.
ü Schedule development can require the review and revision of duration estimates, resource estimates, and schedule reserves to establish an approved project schedule that can serve as a baseline to track progress. Key steps include defining the project milestones, identifying and sequencing activities, and estimating durations.
ü Once the activity start and finish dates have been determined, it is common to have the project staff assigned to the activities review their assigned activities. The staff confirms that the start and finish dates present no conflict with resource calendars or assigned activities on other projects or tasks and thus are still valid.
ü The schedule is then analyzed to determine conflicts with logical relationships and if resource leveling is required before, the schedule is approved and baselined. Revising and maintaining the project schedule model to sustain a realistic schedule continues throughout the duration of the project.
Inputs into this process are: Project management plan: (Schedule management plan, Scope baseline); Project documents: (Activity attributes, Activity list, Assumption log, Basis of estimates, Duration estimates, Lessons learned register, Milestone list, Project schedule network diagrams, Project team assignments, Resource calendars, Resource requirements, Risk register); Agreements; Enterprise environmental factors; Organizational process assets. The schedule management plan identifies the scheduling method and tool used to create the schedule and how the schedule is to be calculated. Scope baseline. The scope statement, WBS, and WBS dictionary have details about the project deliverables that are considered when building the schedule model. Creating the project schedule is part of the planning process group. It is calendar based and relies on both the project network diagram and the accuracy of time estimates. When the project manager creates the project schedule, she will also reference the risk register. The identified risks and their associated responses can affect the sequence of the project work and when the project work can take place. In addition, if a risk comes to fruition, the risk event may affect the scheduling of the resources and the project completion date. Agreements. Vendors may have an input to the project schedule as they develop the details of how they will perform the project work to meet contractual commitments. Enterprise Environmental Factors (EEFs) –include government or industry standards, and communication channels. Organizational Process Assets (OPAs) –include project calendars and scheduling methodology. Tools and techniques for this process are: Schedule network analysis; Critical path method; Resource optimization; Data analysis: (What-if scenario analysis, Simulation); Leads and lags; Schedule compression; Project management information system; Agile release planning.
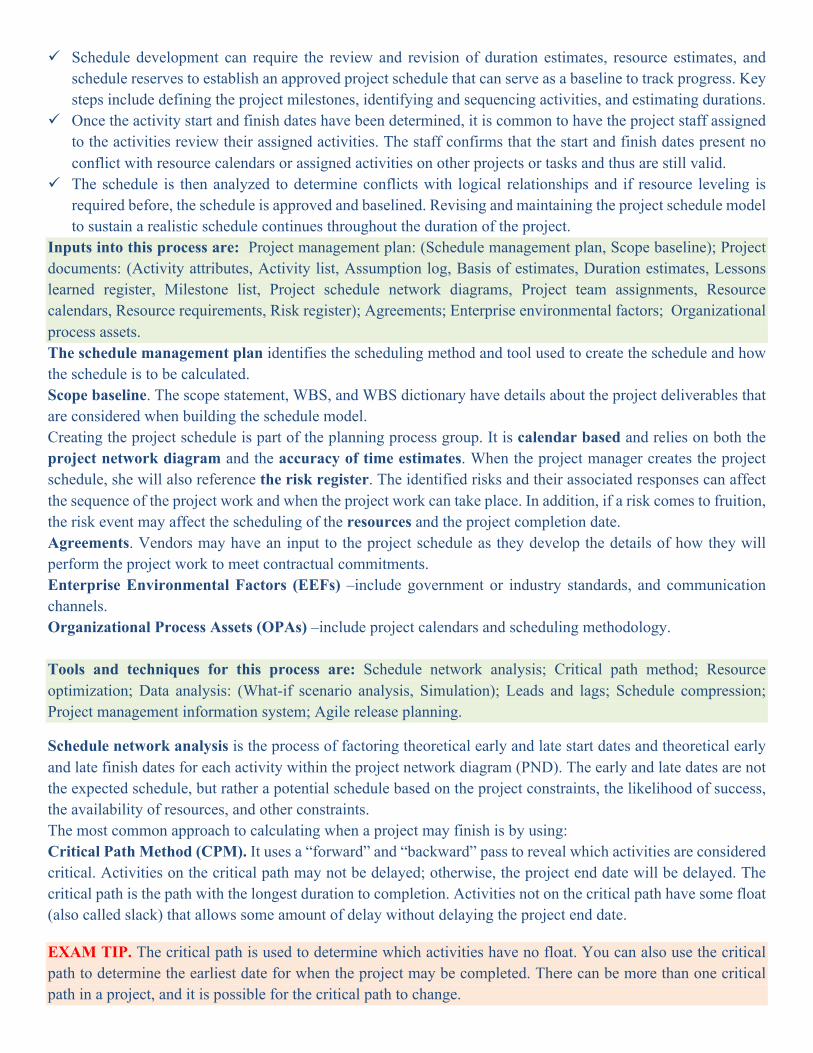
Schedule network analysis is the process of factoring theoretical early and late start dates and theoretical early and late finish dates for each activity within the project network diagram (PND). The early and late dates are not the expected schedule, but rather a potential schedule based on the project constraints, the likelihood of success, the availability of resources, and other constraints. The most common approach to calculating when a project may finish is by using: Critical Path Method (CPM). It uses a “forward” and “backward” pass to reveal which activities are considered critical. Activities on the critical path may not be delayed; otherwise, the project end date will be delayed. The critical path is the path with the longest duration to completion. Activities not on the critical path have some float (also called slack) that allows some amount of delay without delaying the project end date.
EXAM TIP. The critical path is used to determine which activities have no float. You can also use the critical path to determine the earliest date for when the project may be completed. There can be more than one critical path in a project, and it is possible for the critical path to change.
Example of the question:
Answer:
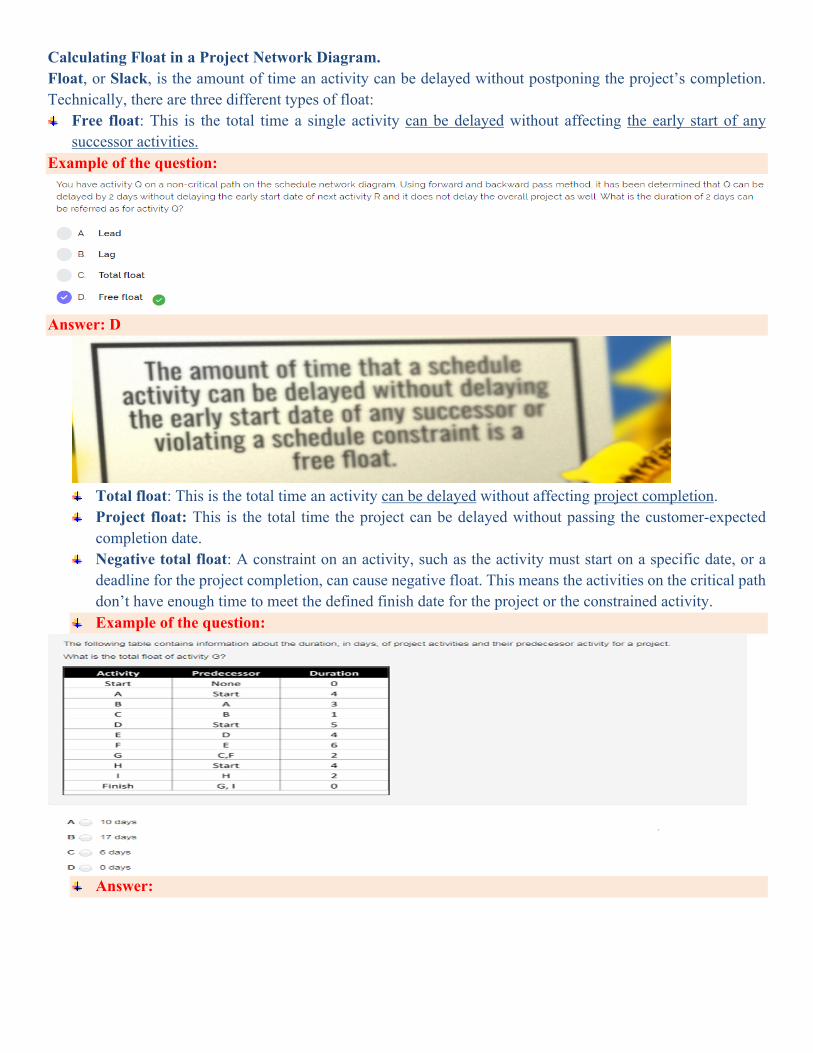
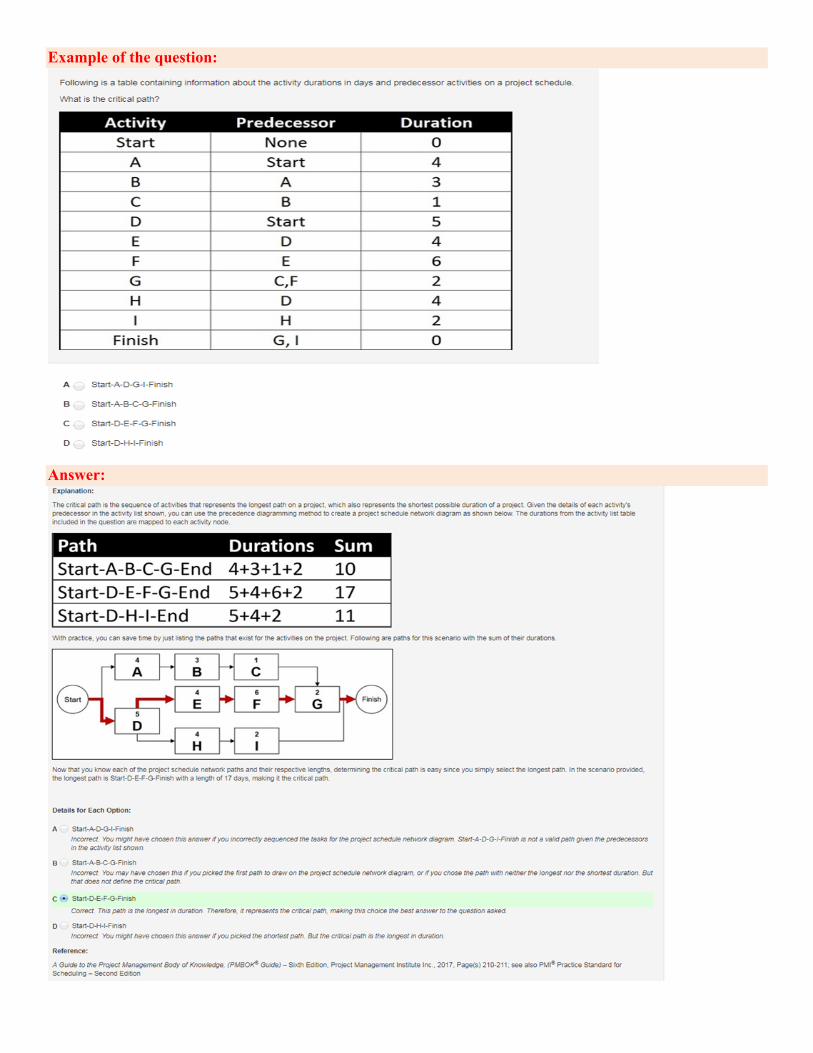
Calculating Float in a Project Network Diagram. Float, or Slack, is the amount of time an activity can be delayed without postponing the project’s completion. Technically, there are three different types of float:
Free float: This is the total time a single activity can be delayed without affecting the early start of any successor activities.
Example of the question:
Answer: D
Total float: This is the total time an activity can be delayed without affecting project completion. Project float: This is the total time the project can be delayed without passing the customer-expected
completion date. Negative total float: A constraint on an activity, such as the activity must start on a specific date, or a
deadline for the project completion, can cause negative float. This means the activities on the critical path don’t have enough time to meet the defined finish date for the project or the constrained activity.
Example of the question:
Answer:
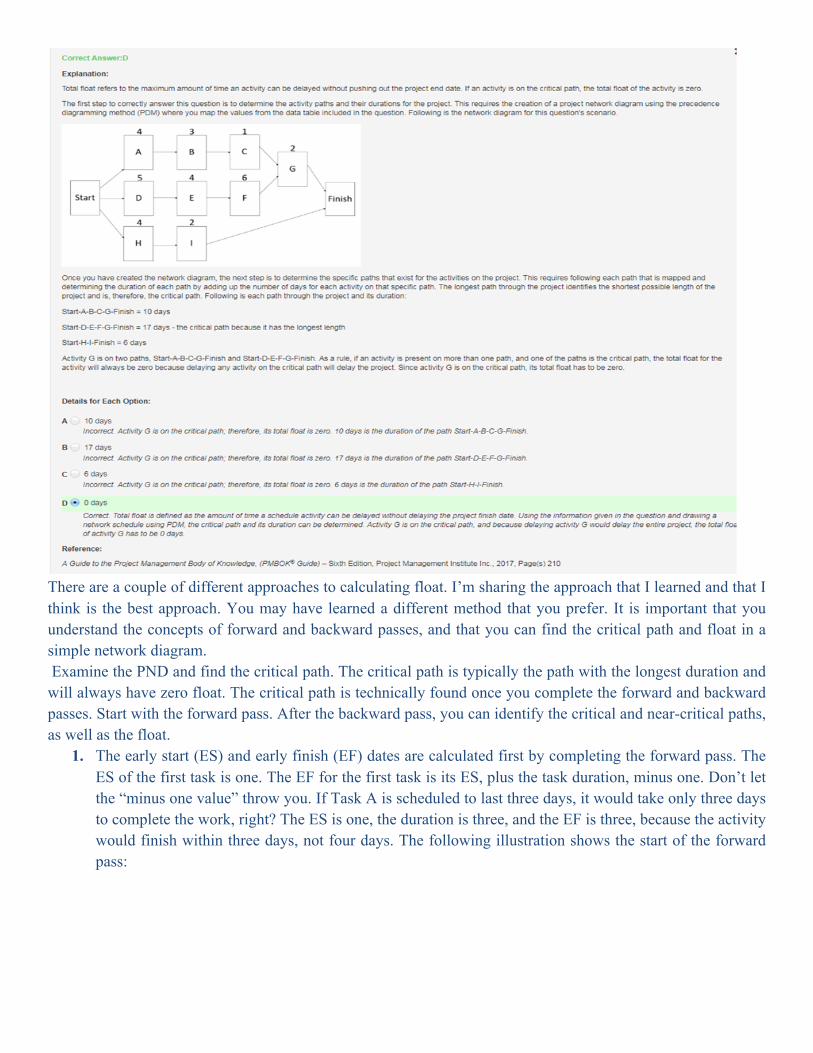
There are a couple of different approaches to calculating float. I’m sharing the approach that I learned and that I think is the best approach. You may have learned a different method that you prefer. It is important that you understand the concepts of forward and backward passes, and that you can find the critical path and float in a simple network diagram. Examine the PND and find the critical path. The critical path is typically the path with the longest duration and will always have zero float. The critical path is technically found once you complete the forward and backward passes. Start with the forward pass. After the backward pass, you can identify the critical and near-critical paths, as well as the float.
1. The early start (ES) and early finish (EF) dates are calculated first by completing the forward pass. The ES of the first task is one. The EF for the first task is its ES, plus the task duration, minus one. Don’t let the “minus one value” throw you. If Task A is scheduled to last three days, it would take only three days to complete the work, right? The ES is one, the duration is three, and the EF is three, because the activity would finish within three days, not four days. The following illustration shows the start of the forward pass:
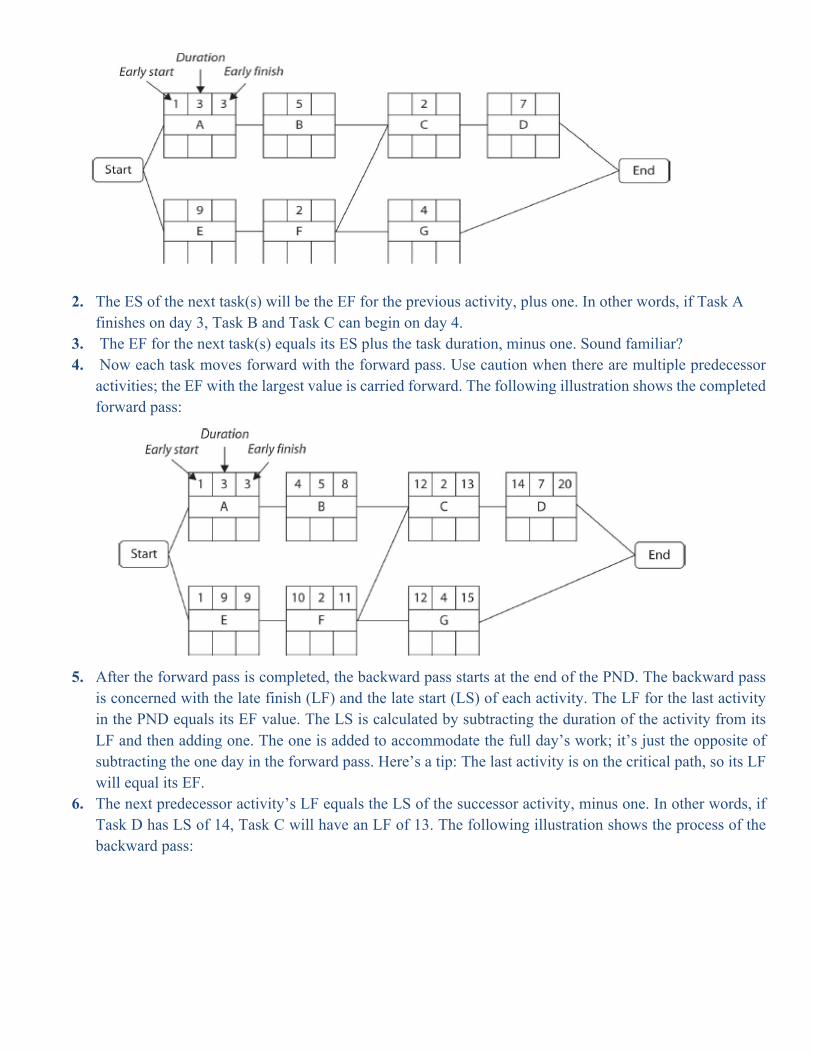
2. The ES of the next task(s) will be the EF for the previous activity, plus one. In other words, if Task A finishes on day 3, Task B and Task C can begin on day 4.
3. The EF for the next task(s) equals its ES plus the task duration, minus one. Sound familiar? 4. Now each task moves forward with the forward pass. Use caution when there are multiple predecessor
activities; the EF with the largest value is carried forward. The following illustration shows the completed forward pass:
5. After the forward pass is completed, the backward pass starts at the end of the PND. The backward pass
is concerned with the late finish (LF) and the late start (LS) of each activity. The LF for the last activity in the PND equals its EF value. The LS is calculated by subtracting the duration of the activity from its LF and then adding one. The one is added to accommodate the full day’s work; it’s just the opposite of subtracting the one day in the forward pass. Here’s a tip: The last activity is on the critical path, so its LF will equal its EF.
6. The next predecessor activity’s LF equals the LS of the successor activity, minus one. In other words, if Task D has LS of 14, Task C will have an LF of 13. The following illustration shows the process of the backward pass:
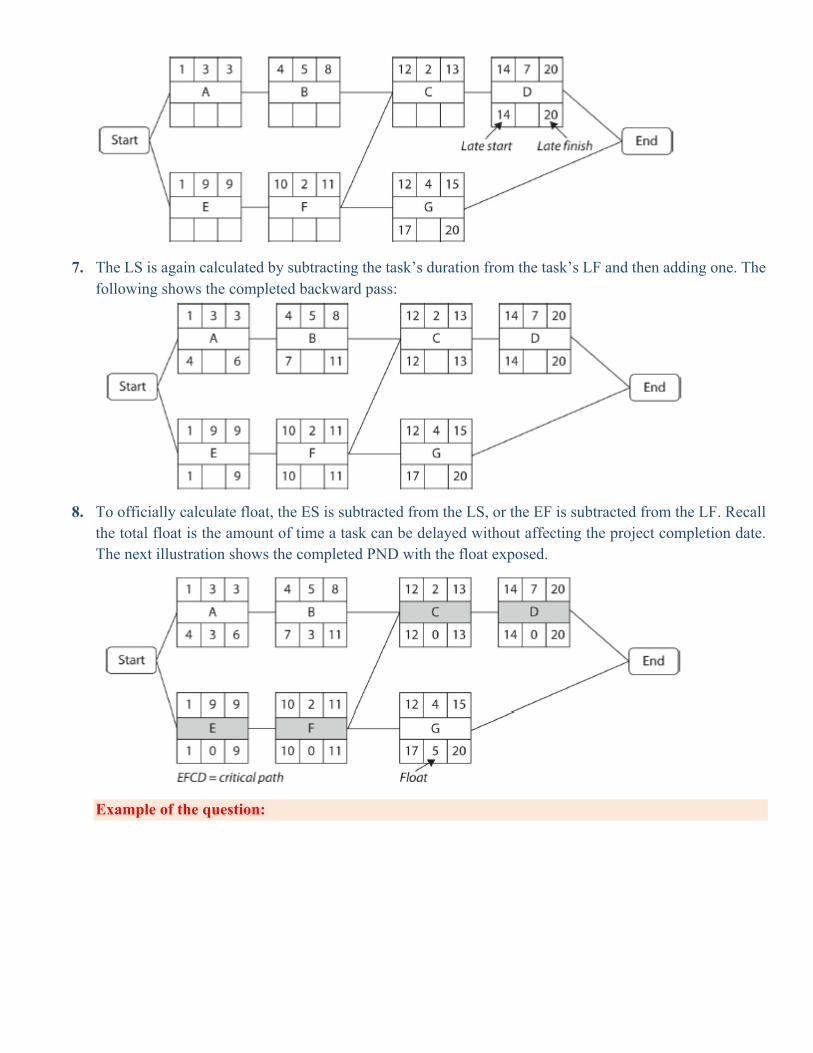
7. The LS is again calculated by subtracting the task’s duration from the task’s LF and then adding one. The
following shows the completed backward pass:
8. To officially calculate float, the ES is subtracted from the LS, or the EF is subtracted from the LF. Recall
the total float is the amount of time a task can be delayed without affecting the project completion date. The next illustration shows the completed PND with the float exposed.
Example of the question:
Answer:
Exam Tip. For Exam, you must to remember a few important rules:
Always draw out the network diagram presented on your scratch paper. It may be used in several questions. Know how to calculate float. You may encounter questions that ask on what day of the week a project will end if no weekends or holidays
are worked. No problem. Add up the critical path, divide by 5 (Monday through Friday), and then figure out on which day of the week the activity will end.
You may see something like
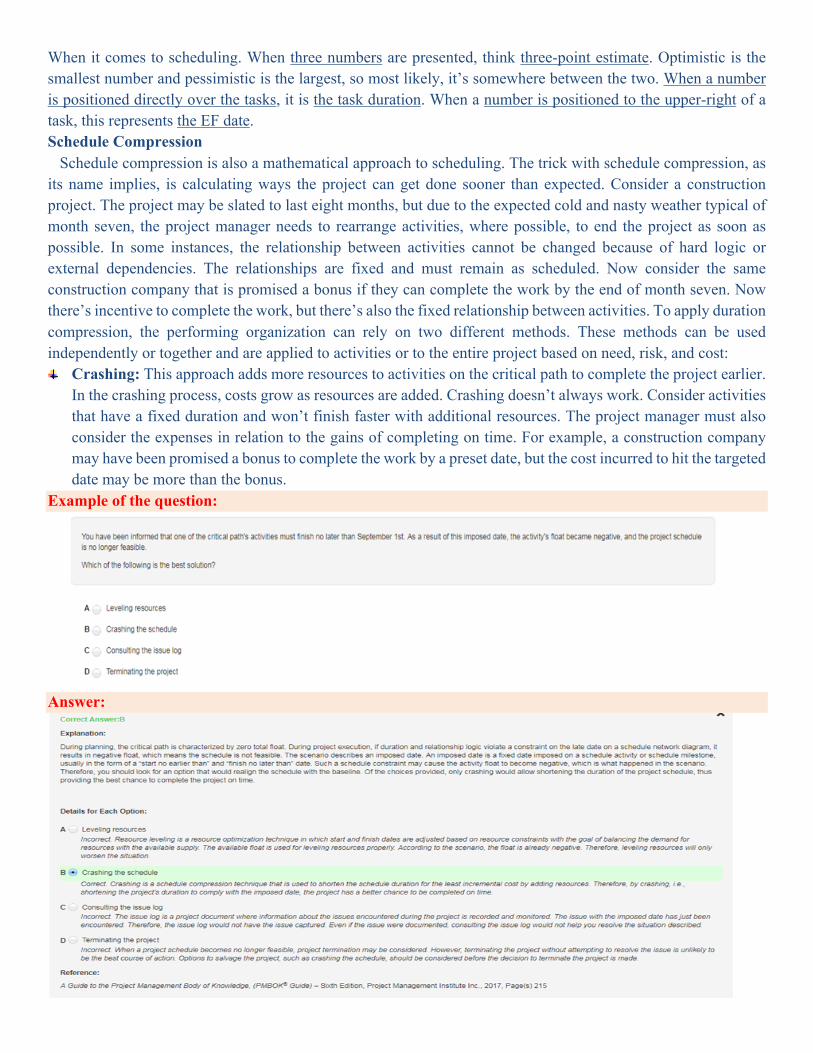
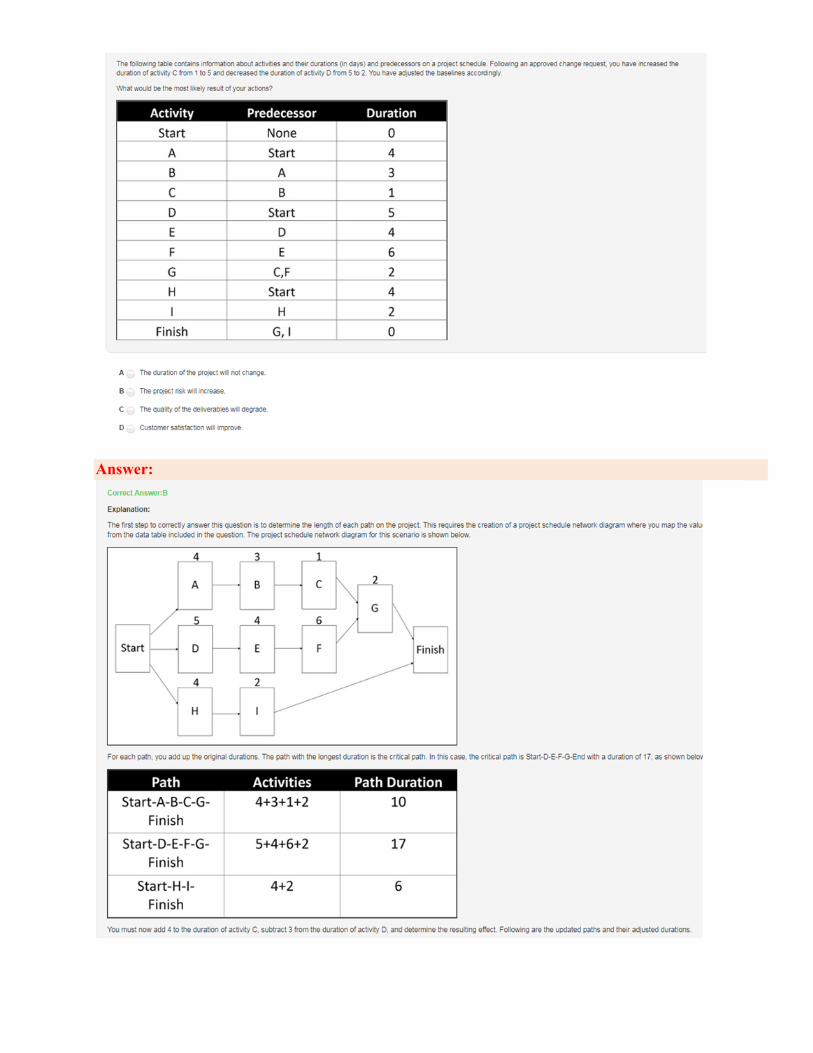
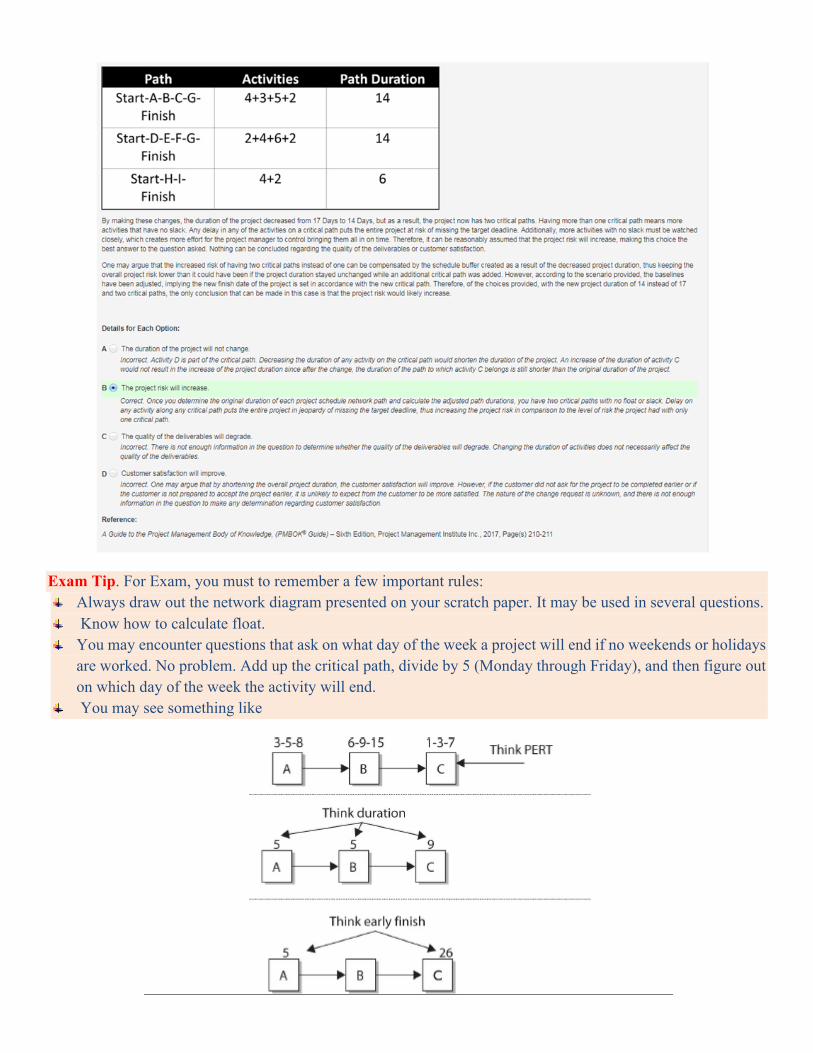
When it comes to scheduling. When three numbers are presented, think three-point estimate. Optimistic is the smallest number and pessimistic is the largest, so most likely, it’s somewhere between the two. When a number is positioned directly over the tasks, it is the task duration. When a number is positioned to the upper-right of a task, this represents the EF date. Schedule Compression Schedule compression is also a mathematical approach to scheduling. The trick with schedule compression, as its name implies, is calculating ways the project can get done sooner than expected. Consider a construction project. The project may be slated to last eight months, but due to the expected cold and nasty weather typical of month seven, the project manager needs to rearrange activities, where possible, to end the project as soon as possible. In some instances, the relationship between activities cannot be changed because of hard logic or external dependencies. The relationships are fixed and must remain as scheduled. Now consider the same construction company that is promised a bonus if they can complete the work by the end of month seven. Now there’s incentive to complete the work, but there’s also the fixed relationship between activities. To apply duration compression, the performing organization can rely on two different methods. These methods can be used independently or together and are applied to activities or to the entire project based on need, risk, and cost:
Crashing: This approach adds more resources to activities on the critical path to complete the project earlier. In the crashing process, costs grow as resources are added. Crashing doesn’t always work. Consider activities that have a fixed duration and won’t finish faster with additional resources. The project manager must also consider the expenses in relation to the gains of completing on time. For example, a construction company may have been promised a bonus to complete the work by a preset date, but the cost incurred to hit the targeted date may be more than the bonus.
Example of the question:
Answer:
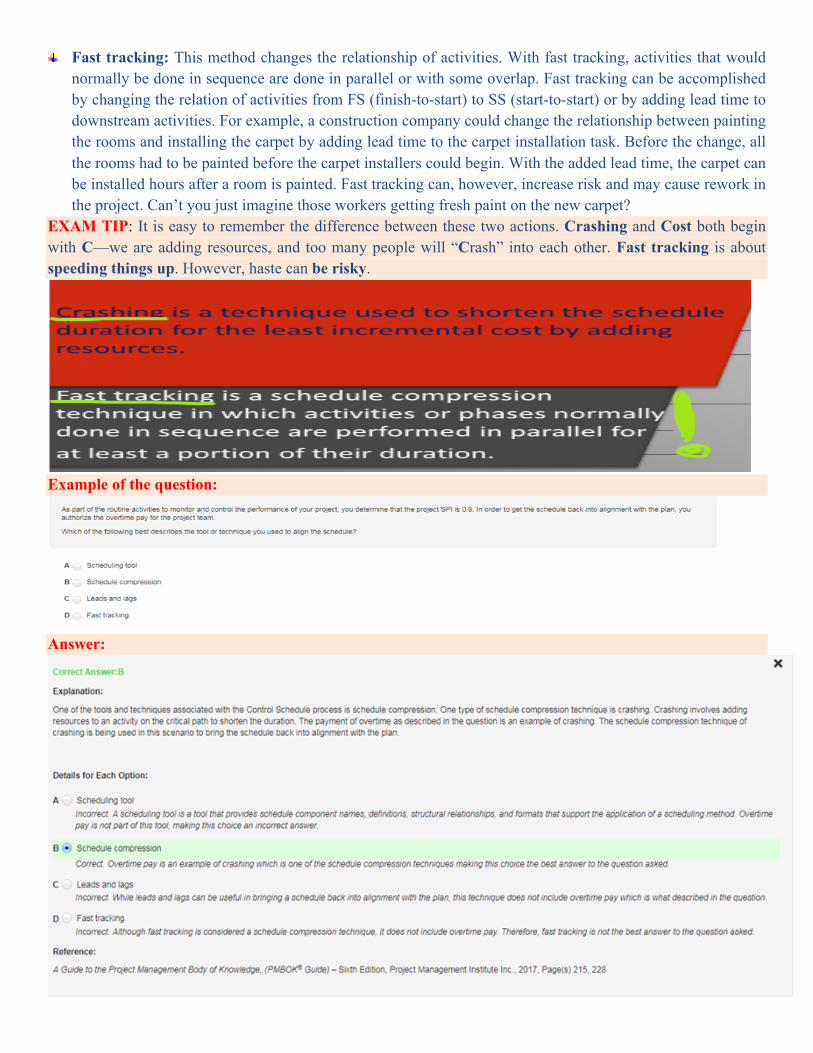
Fast tracking: This method changes the relationship of activities. With fast tracking, activities that would normally be done in sequence are done in parallel or with some overlap. Fast tracking can be accomplished by changing the relation of activities from FS (finish-to-start) to SS (start-to-start) or by adding lead time to downstream activities. For example, a construction company could change the relationship between painting the rooms and installing the carpet by adding lead time to the carpet installation task. Before the change, all the rooms had to be painted before the carpet installers could begin. With the added lead time, the carpet can be installed hours after a room is painted. Fast tracking can, however, increase risk and may cause rework in the project. Can’t you just imagine those workers getting fresh paint on the new carpet?
EXAM TIP: It is easy to remember the difference between these two actions. Crashing and Cost both begin with C—we are adding resources, and too many people will “Crash” into each other. Fast tracking is about speeding things up. However, haste can be risky.
Example of the question:
Answer:
Data Analysis Techniques There are two major data analysis techniques used in this process: Project simulations enable a project manager to examine the feasibility of the project schedule under different conditions, variables, and events. Simulations are often completed by use of the Monte Carlo analysis. It can predicts how scenarios may work out, given any number of variables. The process doesn’t actually churn out a specific answer, but a range of possible answers. When Monte Carlo is applied to a schedule, it can examine, for example, the optimistic completion date, the pessimistic completion date, and the most likely completion date for each activity in the project “What-If” scenarios with your project. is the process of evaluating scenarios in order to predict their effect, positive or negative, on project objectives. EXAM TIP. Monte Carlo analysis can be applied to more than just scheduling. It can also be applied to cost, project variables, and, most often, to risk analysis. Simulations also provide time to factor in “what-if” questions, worst-case scenarios, and potential disasters. The end result of simulations is to create responses to the feasible situations. Then, should the situations come into play, the project team is ready with a planned response. Resource optimization is used to adjust the start and finish dates of activities to adjust planned resource use to be equal to or less than resource availability. Examples of resource optimization techniques that can be used to adjust the schedule model due to demand and supply of resources include but are not limited to:
Resource leveling. A technique in which start and finish dates are adjusted based on resource constraints with the goal of balancing the demand for resources with the available supply. Resource leveling can be used when shared or critically required resources are available only at certain times or in limited quantities, or are over allocated, such as when a resource has been assigned to two or more activities during the same time period, or there is a need to keep resource usage at a constant level. Resource leveling can often cause the original critical path to change. Available float is used for leveling resources. Consequently, the critical path through the project schedule may change.
Resource smoothing. A technique that adjusts the activities of a schedule model such that the requirements for resources on the project do not exceed certain predefined resource limits. In resource smoothing, as opposed to resource leveling, the project’s critical path is not changed and the completion date may not be delayed. In other words, activities may only be delayed within their free and total float. Resource smoothing may not be able to optimize all resources. Agile Release Planning For those environments using agile methodologies, release planning provides a high-level summary timeline of the release schedule based on the product vision and the product roadmap. Agile release planning also determines the number of iterations for the releases, and allows the product owner and the project team to decide what needs to be developed and how long it will take to deliver a releasable product. Outputs from this process are: Schedule baseline; Project schedule; Schedule data; Project calendars; Change requests; Project management plan updates: (Schedule management plan, Cost baseline); Project documents updates: (Activity attributes, Assumption log, Duration estimates, Lessons learned register, Resource requirements, Risk register) Example of the Question:
Answer:
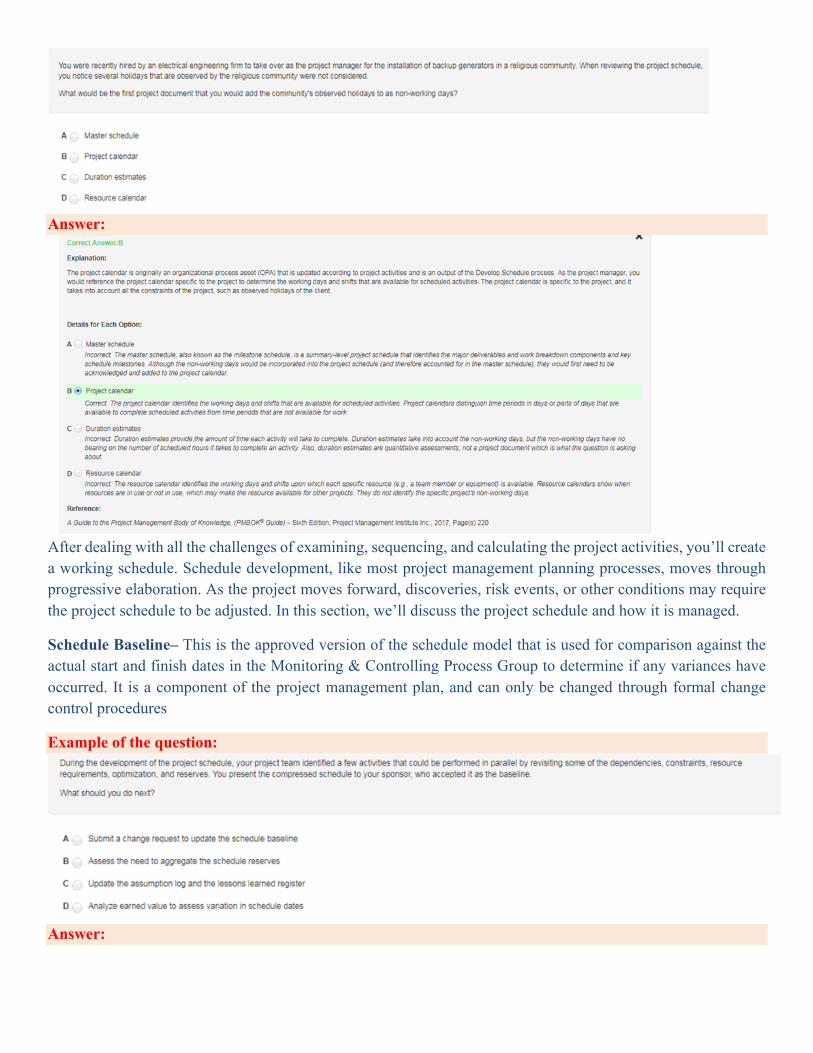
After dealing with all the challenges of examining, sequencing, and calculating the project activities, you’ll create a working schedule. Schedule development, like most project management planning processes, moves through progressive elaboration. As the project moves forward, discoveries, risk events, or other conditions may require the project schedule to be adjusted. In this section, we’ll discuss the project schedule and how it is managed.
Schedule Baseline– This is the approved version of the schedule model that is used for comparison against the actual start and finish dates in the Monitoring & Controlling Process Group to determine if any variances have occurred. It is a component of the project management plan, and can only be changed through formal change control procedures
Example of the question:
Answer:
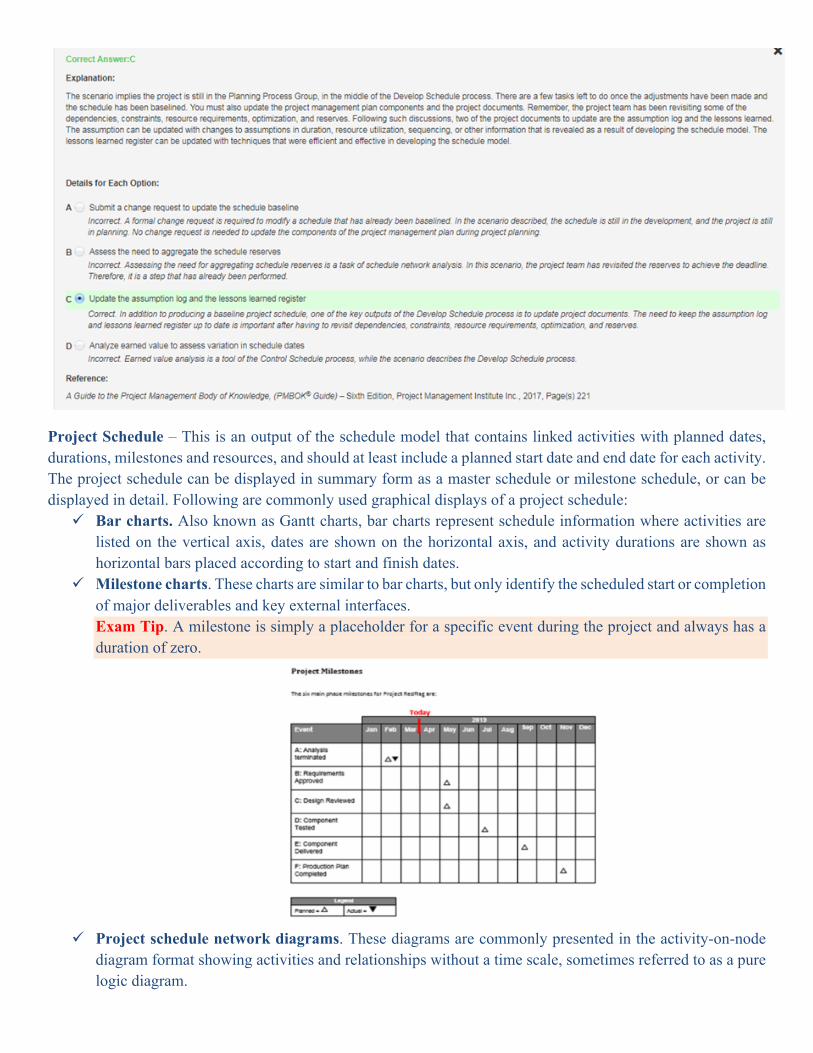
Project Schedule – This is an output of the schedule model that contains linked activities with planned dates, durations, milestones and resources, and should at least include a planned start date and end date for each activity. The project schedule can be displayed in summary form as a master schedule or milestone schedule, or can be displayed in detail. Following are commonly used graphical displays of a project schedule:
ü Bar charts. Also known as Gantt charts, bar charts represent schedule information where activities are listed on the vertical axis, dates are shown on the horizontal axis, and activity durations are shown as horizontal bars placed according to start and finish dates.
ü Milestone charts. These charts are similar to bar charts, but only identify the scheduled start or completion of major deliverables and key external interfaces. Exam Tip. A milestone is simply a placeholder for a specific event during the project and always has a duration of zero.
ü Project schedule network diagrams. These diagrams are commonly presented in the activity-on-node
diagram format showing activities and relationships without a time scale, sometimes referred to as a pure logic diagram.
Schedule Data – This is the collection of information that controls and describes the schedule and includes at least the schedule milestones, schedule activities, activity attributes, and identified assumptions and constraints. Project Calendars – These identify the working days and shifts associated with schedule activities. And Again - Examination Content Outline
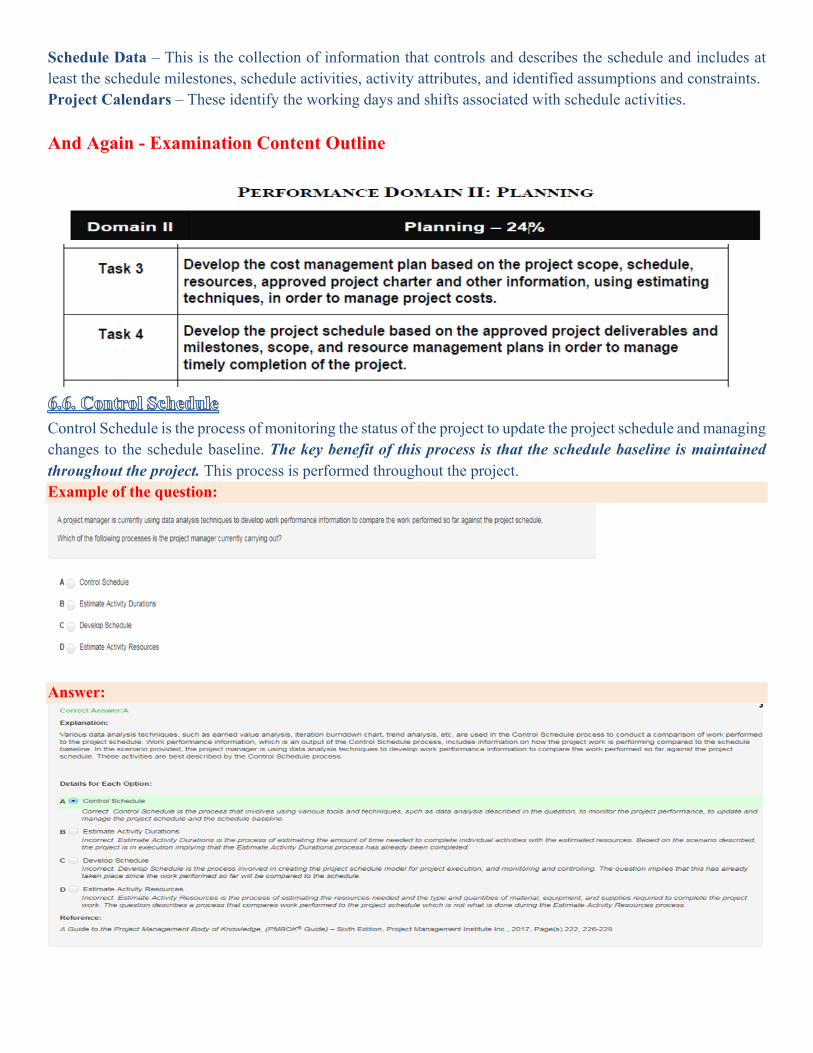
Control Schedule is the process of monitoring the status of the project to update the project schedule and managing changes to the schedule baseline. The key benefit of this process is that the schedule baseline is maintained throughout the project. This process is performed throughout the project. Example of the question:
Answer:
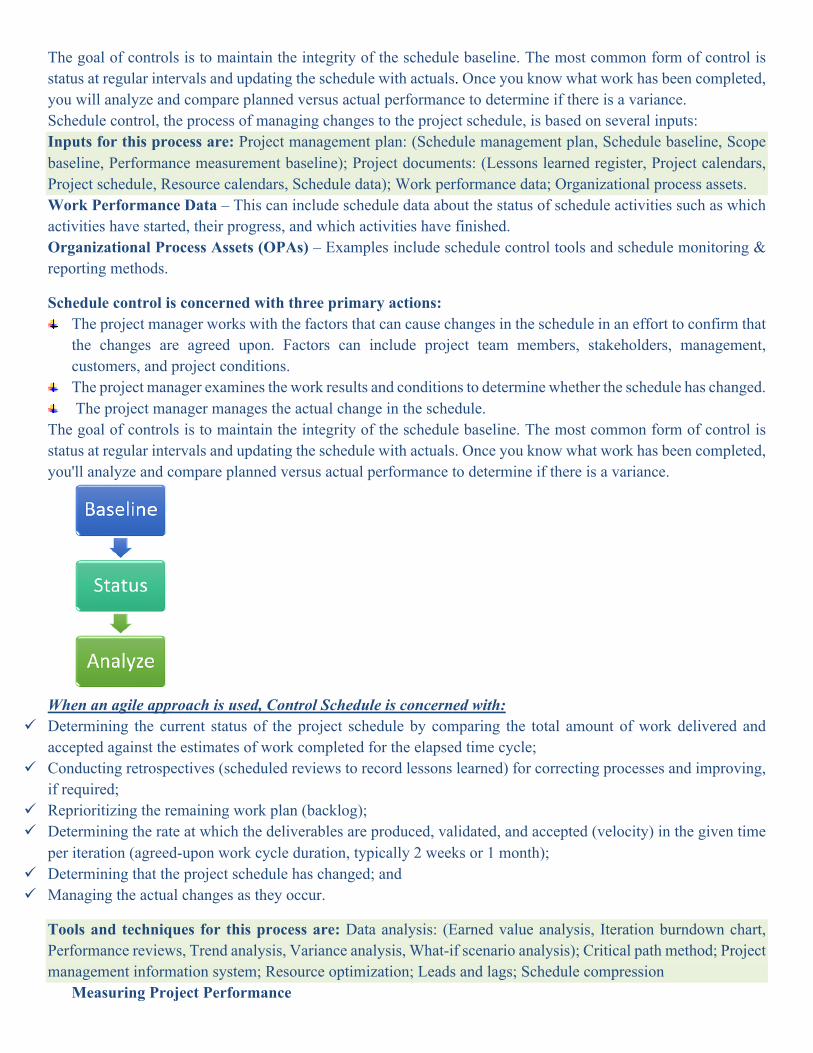
The goal of controls is to maintain the integrity of the schedule baseline. The most common form of control is status at regular intervals and updating the schedule with actuals. Once you know what work has been completed, you will analyze and compare planned versus actual performance to determine if there is a variance. Schedule control, the process of managing changes to the project schedule, is based on several inputs: Inputs for this process are: Project management plan: (Schedule management plan, Schedule baseline, Scope baseline, Performance measurement baseline); Project documents: (Lessons learned register, Project calendars, Project schedule, Resource calendars, Schedule data); Work performance data; Organizational process assets. Work Performance Data – This can include schedule data about the status of schedule activities such as which activities have started, their progress, and which activities have finished. Organizational Process Assets (OPAs) – Examples include schedule control tools and schedule monitoring & reporting methods.
Schedule control is concerned with three primary actions: The project manager works with the factors that can cause changes in the schedule in an effort to confirm that
the changes are agreed upon. Factors can include project team members, stakeholders, management, customers, and project conditions.
The project manager examines the work results and conditions to determine whether the schedule has changed. The project manager manages the actual change in the schedule.
The goal of controls is to maintain the integrity of the schedule baseline. The most common form of control is status at regular intervals and updating the schedule with actuals. Once you know what work has been completed, you'll analyze and compare planned versus actual performance to determine if there is a variance.
When an agile approach is used, Control Schedule is concerned with:
ü Determining the current status of the project schedule by comparing the total amount of work delivered and accepted against the estimates of work completed for the elapsed time cycle;
ü Conducting retrospectives (scheduled reviews to record lessons learned) for correcting processes and improving, if required;
ü Reprioritizing the remaining work plan (backlog); ü Determining the rate at which the deliverables are produced, validated, and accepted (velocity) in the given time
per iteration (agreed-upon work cycle duration, typically 2 weeks or 1 month); ü Determining that the project schedule has changed; and ü Managing the actual changes as they occur.
Tools and techniques for this process are: Data analysis: (Earned value analysis, Iteration burndown chart, Performance reviews, Trend analysis, Variance analysis, What-if scenario analysis); Critical path method; Project management information system; Resource optimization; Leads and lags; Schedule compression
Measuring Project Performance
Poor performance may result in schedule changes. Consider a project team that is completing its work on time, but all of the work results are unacceptable. The project team may be rushing through their assignments to meet their deadline. To compensate for this, the project may be changed to allow for additional quality inspections and more time for activity completion. Project performance is often based on earned value management. Earned Value Analysis – Schedule performance measurements such as schedule variance (SV) and schedule performance index (SPI) are used to determine the degree of variation from planned (schedule baseline) vs. actual in terms of the schedule.
Examining the Schedule Variance The project manager must actively monitor the variances between when activities are scheduled to end and when they actually end. An accumulation of differences between scheduled and actual dates may result in a schedule variance. The project manager must also pay attention to the completion of activities on paths with float, not just the critical path. Consider a project that has eight different paths to completion. The project manager should first identify the critical path, but should also identify the float on each path. The paths should be arranged and monitored in a hierarchy from the path with the smallest float to the path with the largest float. As activities are completed, the float of each path should be monitored to identify any paths that may be slipping from the scheduled end dates. Trend Analysis – This is used to examine schedule performance over time to determine if it is improving or worsening. What-If Scenario Analysis – This is used to compute and evaluate differing schedule scenarios as pertain to the Project Risk Management processes in order to bring the schedule model back into alignment with the approved schedule baseline.
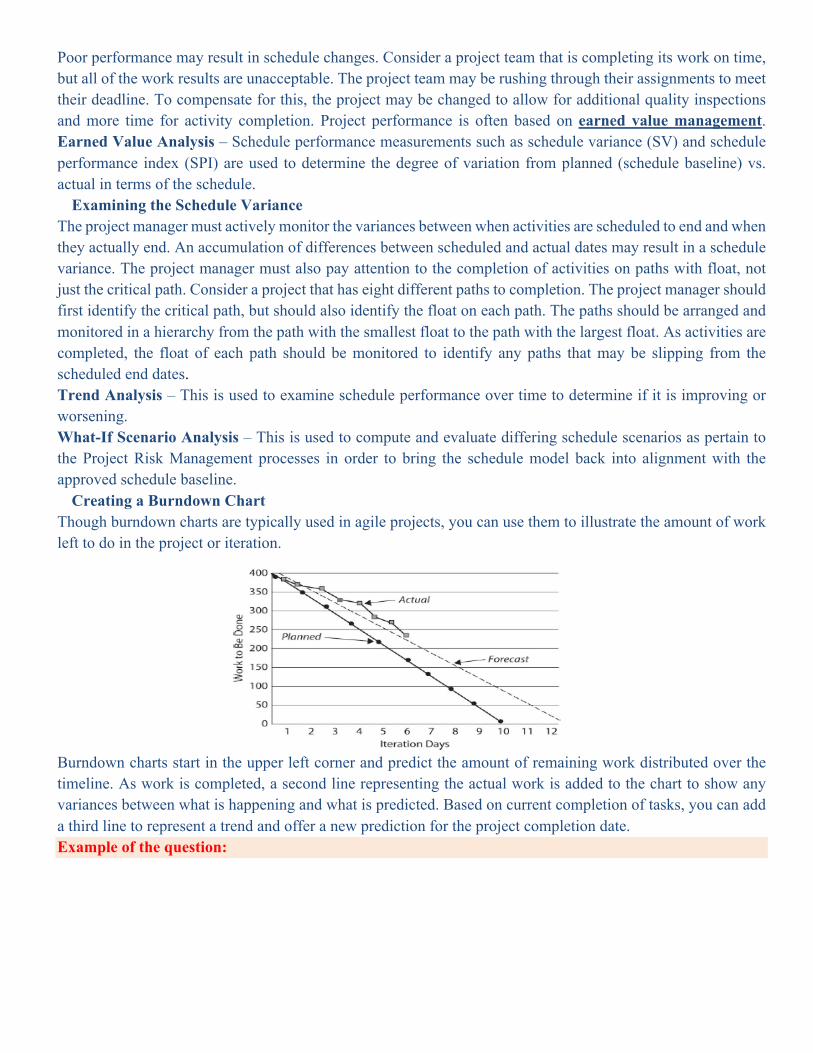
Creating a Burndown Chart Though burndown charts are typically used in agile projects, you can use them to illustrate the amount of work left to do in the project or iteration.
Burndown charts start in the upper left corner and predict the amount of remaining work distributed over the timeline. As work is completed, a second line representing the actual work is added to the chart to show any variances between what is happening and what is predicted. Based on current completion of tasks, you can add a third line to represent a trend and offer a new prediction for the project completion date. Example of the question:
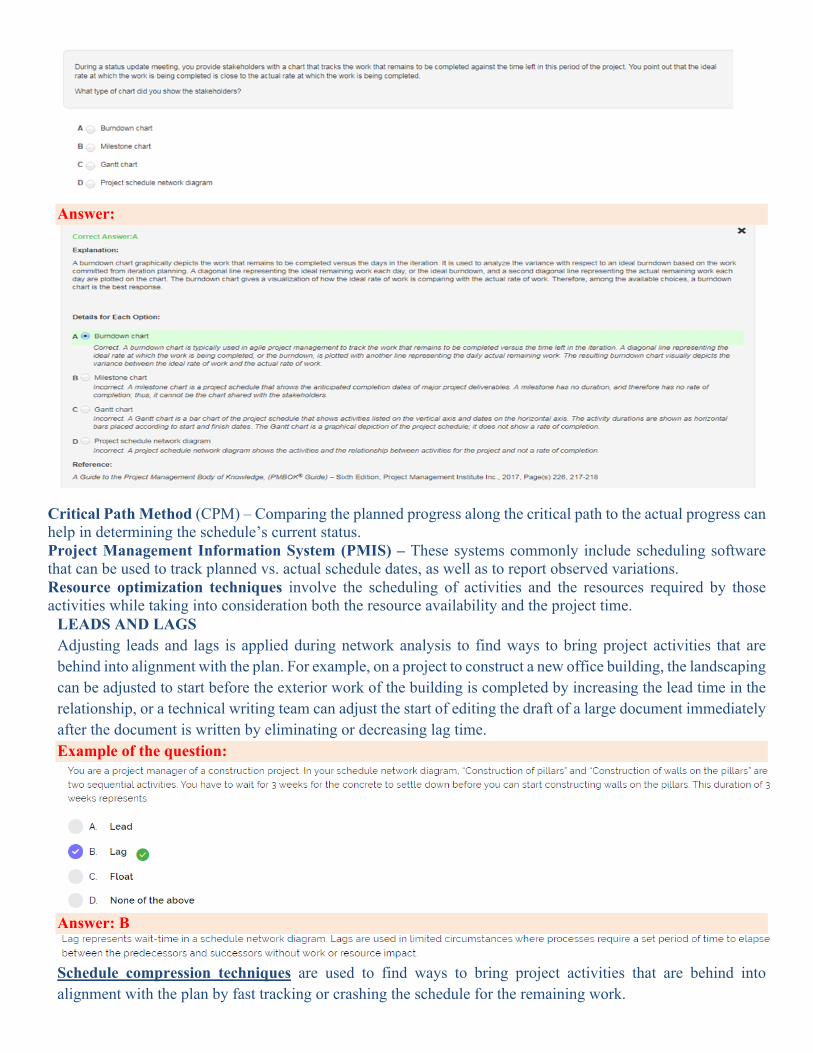
Answer:
Critical Path Method (CPM) – Comparing the planned progress along the critical path to the actual progress can help in determining the schedule’s current status. Project Management Information System (PMIS) – These systems commonly include scheduling software that can be used to track planned vs. actual schedule dates, as well as to report observed variations. Resource optimization techniques involve the scheduling of activities and the resources required by those activities while taking into consideration both the resource availability and the project time.
LEADS AND LAGS Adjusting leads and lags is applied during network analysis to find ways to bring project activities that are behind into alignment with the plan. For example, on a project to construct a new office building, the landscaping can be adjusted to start before the exterior work of the building is completed by increasing the lead time in the relationship, or a technical writing team can adjust the start of editing the draft of a large document immediately after the document is written by eliminating or decreasing lag time. Example of the question:
Answer: B
Schedule compression techniques are used to find ways to bring project activities that are behind into alignment with the plan by fast tracking or crashing the schedule for the remaining work.
Updating the Project Schedule So, what happens when a schedule change occurs? The project manager must ensure that the project schedule is updated to reflect the change, document the change, and follow the guidelines within the schedule management plan and integrated change control. Any formal processes, such as notifying stakeholders or management, should be followed. Revisions are a special type of project schedule change that cause the project start date and, more likely, the project end date to be changed. They typically stem from project scope changes. Because of the additional work the new scope requires, additional time is needed to complete the project. Schedule delays, for whatever reason, may be so drastic that the entire project has to be rebaselined —that is, all the historical information up to the point of the rebaseline is eliminated. Rebaselining is a worst-case scenario and should be used only when adjusting for drastic, long delays. Schedule revision is the preferred, and most common, approach to changing the project end date. EXAM TIP: You should rebaseline only in extreme, drastic scenarios; however, a change request can justify rebaselining the project if additional scope items require additional time for the project. Applying Corrective Action Corrective action is any method applied to bring the project schedule back into alignment with the original dates and goals for the project end date. Corrective actions are efforts to ensure that future performance meets the expected performance levels. It includes the following:
Ensuring that the work packages are complete as scheduled. Completing a work package early isn’t always a good thing.
Extraordinary measures to ensure that work packages complete with as little delay as possible. Root-cause analysis of schedule variances. Measures to recover from schedule delays.
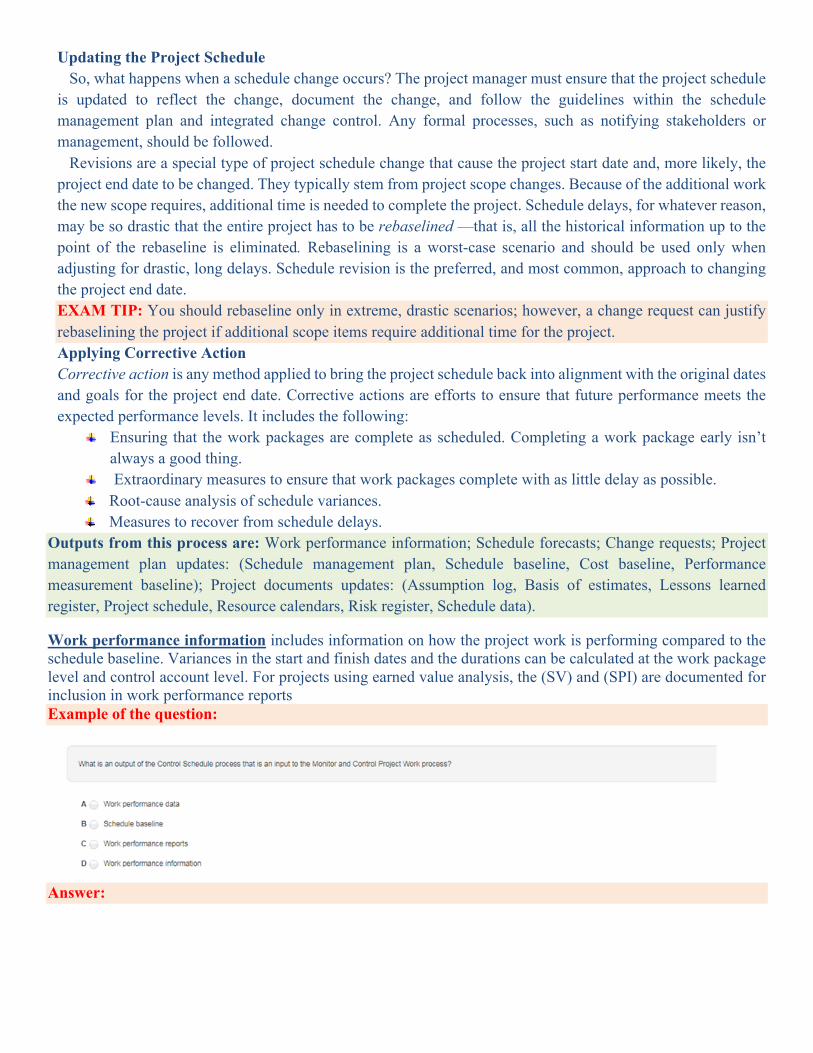
Outputs from this process are: Work performance information; Schedule forecasts; Change requests; Project management plan updates: (Schedule management plan, Schedule baseline, Cost baseline, Performance measurement baseline); Project documents updates: (Assumption log, Basis of estimates, Lessons learned register, Project schedule, Resource calendars, Risk register, Schedule data).
Work performance information includes information on how the project work is performing compared to the schedule baseline. Variances in the start and finish dates and the durations can be calculated at the work package level and control account level. For projects using earned value analysis, the (SV) and (SPI) are documented for inclusion in work performance reports Example of the question:
Answer:
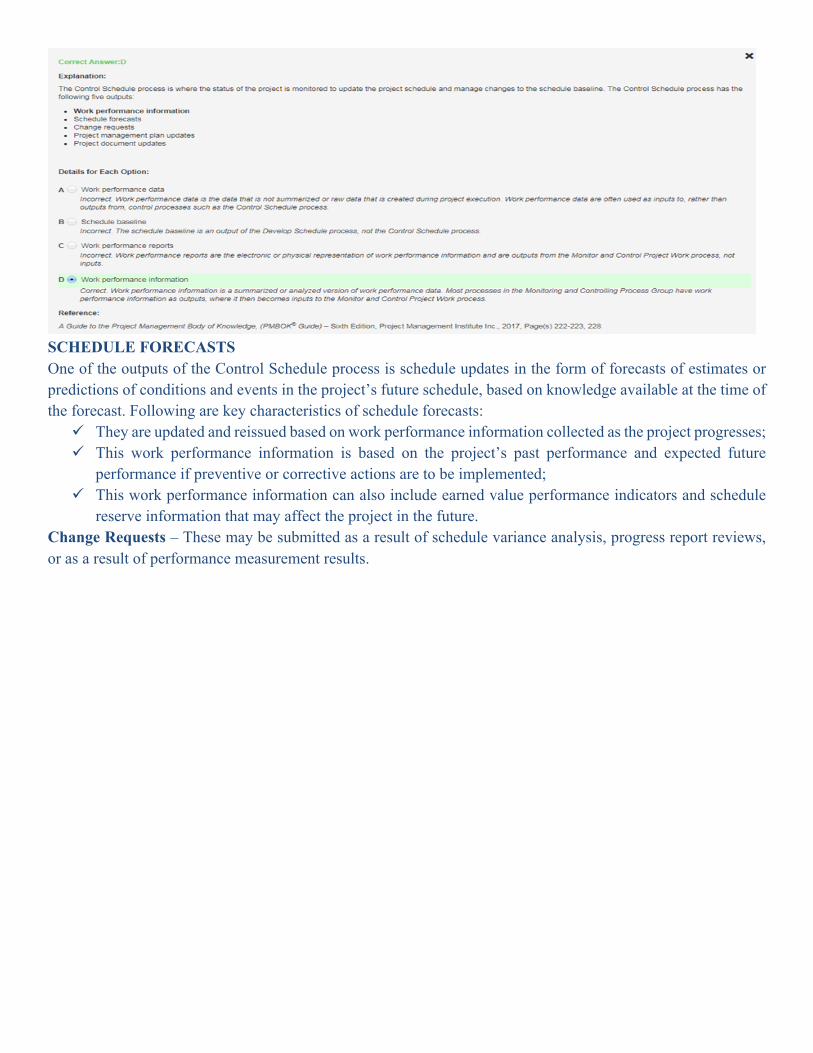
SCHEDULE FORECASTS One of the outputs of the Control Schedule process is schedule updates in the form of forecasts of estimates or predictions of conditions and events in the project’s future schedule, based on knowledge available at the time of the forecast. Following are key characteristics of schedule forecasts:
ü They are updated and reissued based on work performance information collected as the project progresses; ü This work performance information is based on the project’s past performance and expected future
performance if preventive or corrective actions are to be implemented; ü This work performance information can also include earned value performance indicators and schedule
reserve information that may affect the project in the future. Change Requests – These may be submitted as a result of schedule variance analysis, progress report reviews, or as a result of performance measurement results.