the potential of marine energy technologies in the uk ... · the energy system. in addition, we...
TRANSCRIPT

lable at ScienceDirect
Renewable Energy 115 (2018) 1281e1293
Contents lists avai
Renewable Energy
journal homepage: www.elsevier .com/locate/renene
The potential of marine energy technologies in the UK e Evaluationfrom a systems perspective
Marianne Zeyringer*, Birgit Fais, Ilkka Keppo, James PriceUCL Energy Institute, University College London, United Kingdom
a r t i c l e i n f o
Article history:Received 25 April 2017Received in revised form8 July 2017Accepted 23 July 2017Available online 11 September 2017
Keywords:Marine energyEnergy systems analysisEnergy innovationTechnology learningSensitivity analysis
* Corresponding author. 14 Upper Woburn Place,Kingdom.
E-mail address: [email protected] (M. Zeyring
https://doi.org/10.1016/j.renene.2017.07.0920960-1481/© 2017 The Author(s). Published by Elsevi
a b s t r a c t
Accelerated technological change plays a crucial role in enabling the low-carbon energy transition.Quantitative energy modelling exploring alternative long-term decarbonisation pathways can supportpolicy-makers in choosing the most important areas for technology promotion. This study analyses thepotential contribution of marine energy in the UK from an energy systems perspective considering thetrade-offs between local lead markets and global learning, the uncertainty in the learning potential,competition with alternative technologies and impacts on system balancing. The results indicate thatonly under very favourable conditions, i.e. with learning rates above 15% and high global deployment,marine energy will have a significant contribution to the UK decarbonisation pathway. Alternatively,marine energy could constitute a hedging strategy against multiple failure in other low-carbon options.The early strategic investments into marine energy lead, in most cases, to a slight rise in societal welfarecosts compared to the respective cases without attempts to induce marine learning and brings benefits tothe electricity system. Thus, on the whole, we conclude that marine energy has the potential tocontribute to the UK energy system, but there is a substantial risk that strategic investments in a nationallead market will not directly pay off in the long term.© 2017 The Author(s). Published by Elsevier Ltd. This is an open access article under the CC BY license
(http://creativecommons.org/licenses/by/4.0/).
1. Introduction
The recent Paris agreement [79] has put further emphasis on thesubstantial decarbonisation challenge that nations will face in thecoming decades. To enable such deep emission cuts, acceleratedtechnological change will be required, as most low-carbon tech-nologies still have the potential for considerable cost reductions[12]. Governments can play an important role in spurring techno-logical innovations by implementing measures of technology pro-motion that go beyond the standard instruments of climate policylike emission taxes or trading systems. Such additional support forsustainable technologies is justified by the simultaneous occur-rence of two market failures e environmental externalities as wellas knowledge and other externalities in the innovation system [35].The question then remains, however, what government interven-tion in innovation systems should look like ewhether only generalsupport to promote a strong national innovation system or explicitsupport for the development, demonstration and diffusion of
London, WC1H 0NN, United
er).
er Ltd. This is an open access artic
specific technologies should be provided [27,51]. A look at thecurrent climate and energy policy landscape in Europe reveals thatgovernments strongly intervene in innovation systems and useboth technology-push and demand-pull mechanisms to promotelow-carbon technologies [18,63]. When deciding on the right areasand measures for technology promotion, governments also have totake national vs. global trade-offs into account [54]. In most cases,learning in energy technologies takes place in global markets andnational energy systems can benefit from spill-overs [42]. At thesame time, the national framework conditions (the innovationsystem, natural conditions, regulations, etc.) play a crucial role inthe adoption and diffusion of new technologies. Moreover, thepossibility for national niche markets and potential economicbenefits from first-mover advantages have to be taken into account,as has been the case for the wind industry in Denmark, Germanyand the Netherlands. [46,86]. In addition, with the need for a rapidlow-carbon transition of the energy system becoming ever moreurgent, technologies need to reach commercial availability soon.Here, a statement from the UK's Carbon Plan [16], defining the long-term national decarbonisation strategy, is striking: “In the 2020s, wewill run a technology race, with the least-cost technologies winningthe largest market share. Before then, our aim is to help a range oftechnologies bring down their costs so they are ready to compete when
le under the CC BY license (http://creativecommons.org/licenses/by/4.0/).

M. Zeyringer et al. / Renewable Energy 115 (2018) 1281e12931282
the starting gun is fired.” [16]; p.1).Marine technologies could represent an important part of a low
carbon energy system [37]. The UK is currently in an advantageousposition to establish a national lead market for marine (wave andtidal) energy technologies having favourable natural conditions [9].Globally, the UK is leading in terms of planned ocean power pro-jects and number of major industry players as can be seen in Fig. 1.Additionally, the UK has several world class sea testing facilities andbenefits from a variety of public fundingmechanisms, including theOffshore Renewable Energy Catapult and a strike price between300 and 310£/MWh for wave energy and 295e300£/MWh for tidalenergy for 2021/22 and 2022/23 respectively, under the SecondContract for Difference (CdF) Allocation Round taking place in April2017 [20]. For further information on the development landscapefor marine energy in the UK, see Refs. [22,38,44]. At the same time,marine technologies are still at an early stage of development andlagging behind other more established renewable energy technol-ogies. Thus, further government support would be needed to arriveat a dominant technology design (especially for wave), implementfull scale testing, perform environmental assessments, develop andoptimise methods for installation, operation&maintenance as wellas grid connection and, above all, to drive down costs [22,44].
In the analysis at hand we develop an exogenous learningapproach for marine technologies in a national energy system,paying special attention to global vs. local trade-offs and uncertainty.We analyse the interplay between strategic investments into anational lead-market in the medium-term and spill-overs fromglobal technological change in the long-term and apply a sensitivityanalysis on key learning parameters. Furthermore, the contributionof marine technologies in the case of failure of other low-carbonelectricity options is explored. With this approach we address thequestion under which conditions marine energy could be expectedto have a significant contribution to the UK decarbonisationpathway and whether an early UK action could be justified as costeffective for the UK, if it then triggered further global deployment,and learning, later on.
Quantitative energy modelling has long played a key role at thescience-policy interface by mapping out possible decarbonisationstrategies and relaying these insights to policy-makers [78].Bottom-up, cost optimizing whole energy system models areapplied to determine cost-efficient and consistent long-termpathways for a low-carbon energy transition and to analyse in-teractions and the competition between technologies as well aslow-carbon energy vectors in the system. Given the complexity ofinnovation and learning processes, most energy system analysesmake exogenous assumptions on the rate of technological change[67]. Also, in system analyses for small open economies it is usually
Fig. 1. Key market figures for marine t
reasonable to assume at least part of the learning process asexogenous and taking place on the global scale. Endogenous ap-proaches usually focus on learning-by-doing potentials, where in-vestments costs (or other technology parameters) improve as afunction of the cumulative installed capacity according to a speci-fied learning rate, so-called one-factor learning curves [8]. A varietyof aspects of the learning process have been analysed with energysystems models including component learning [1,58,82], theimpact of technology clusters [19,43,75], regional spill-overs[6,31,54,72], the effect of R&D expenditures through two-factorlearning curves [7,47,55,56,83] as well as learning under uncer-tainty [28,73]. Concerning marine energy technologies a number ofstudies have reviewed the current technology designs [5,26,48],performed economic assessments [2,4,14,40], analysed the learningpotential and prospects of marine technologies [21,52], andassessed key investment barriers [45,50,57]. There are only twostudies which look at marine learning from an energy systemsperspective [37]. have performed a first assessment of marine en-ergy in the UK with a systems approach setting up scenarios withcombinations of learning for different technologies. Their analysisdoes not investigate the impacts of alternative learning rates ordifferentiate between local and global learning, nor does it analysethe impacts technology failures for other key technologies mighthave on the prospects of marine. Sgobbi et al. [87] assess the effectsof decreasing costs due to global technology learning and of effi-ciency improvements for marine technologies on their deploymentin the EU. This study does not analyse local learning or assess howmarine deployment may depend on the success or failure of othertechnologies.
The cost-effective deployment of marine technologies dependson the respective learning on the national and global level as well ason the developments in other technologies. Our literature reviewhighlights that no previous study has systematically explored howthe interplay between changing key marine learning parameters,both nationally and globally, and the failure and success ofcompeting technologies affects the modelled deployment of ma-rine energy. We close this gap by using a long term energy systemsmodel to assess 80 different scenarios with varying parameters onnational and global marine learning, technology availability of lowcarbon electricity options and also technology spill-overs betweenmarine and offshore wind. This allows us to determine the condi-tions under which marine energy can, in our model, become part ofthe energy system. In addition, we soft-link UKTM to a high spatialand temporal resolution electricity system model to assess oneother aspect of the potential system benefits offered by marinepower. In addition to providing information about the possiblerequired thresholds for marine technology breakthrough, this
echnologies in 2014 (Source [64]).

1 Tidal barrages are modelled separately in UKTM, but are not included in thelearning approach as they constitute a very different technology compared to waveand tidal stream [33].
M. Zeyringer et al. / Renewable Energy 115 (2018) 1281e1293 1283
article contributes to the literature on the role of technologylearning in long term decarbonisation strategies.
The rest of this paper is structured as follows. The next sectionfocuses on the methodology, providing a short overview on thewhole energy systems model and the approach for the learningsensitivity analysis. In the third section, the results of the analysisare presented, including the additional analysis on electricity sys-tem impacts. The implications on the benefits and costs of devel-oping a national lead market for marine technologies in the UK arefurther discussed in section 4. The paper concludes which a shortdiscussion of future research needs.
2. Methodological approach
2.1. Economic evaluation from a whole energy systems perspective
2.1.1. The national energy system model UKTMFor the system analysis of learning in marine technologies the
new national UK TIMES energy system model (UKTM) is employed[15,23,24]. UKTM has been developed at the UCL Energy Instituteover the last two years as a successor to the UK MARKAL model[88]. It is based on the model generator TIMES (The IntegratedMARKAL-EFOM System), which is developed and maintained bythe Energy Technology Systems Analysis Programme (ETSAP) of theInternational Energy Agency (IEA) [49].
UKTM is a technology-oriented, dynamic, linear programmingoptimisation model representing the entire UK energy system fromimports and domestic production of fuel resources, through fuelprocessing and supply, explicit representation of infrastructures,conversion to secondary energy carriers (including electricity, heatand hydrogen), end-use technologies and energy service demands.Generally, it minimizes the total welfare costs (under perfectforesight) to meet the exogenously given, but price elastic, sectoralenergy demands under a range of input assumptions and additionalconstraints, thereby delivering a cost optimal, system-wide solu-tion for the energy transition for the coming decades.
A key strength of UKTM is that it represents the whole UK en-ergy system under a given decarbonisation objective, which meansthat trade-offs between mitigation efforts in one sector versusanother can be explored. The model is divided into three supplyside sectors (resources & trade, processing & infrastructure andelectricity generation) and five demand sectors (residential, ser-vices, industry, transport and agriculture). All sectors are calibratedto the base year 2010, for which the existing stock of energytechnologies and their characteristics are known and taken intoaccount. A large variety of future supply and demand technologiesare represented by techno-economic parameters such as the ca-pacity factor, energy efficiency, lifetime, capital costs, O&M costsetc. Assumptions are also exogenously provided for attributes notdirectly connected to individual technologies, such as fuel importprices, resource availability and the potentials of renewable energysources. UKTM has a time resolution of 16 time-slices (four seasonsand four intra-day times-slices). In addition to all energy flows,UKTM tracks CO2, CH4, N2O and HFC emissions. For more infor-mation on UKTM see Ref. [25].
In addition to its academic use, UKTM is the central long-termenergy system pathway model used for policy analysis at theDepartment of Energy and Climate Change (DECC) and the Com-mittee on Climate Change (CCC).
2.1.2. Methodology for the sensitivity analysis around technologylearning
UKTM explicitly models, in a system context, the competitionbetween different technologies that provide the same fuel or en-ergy services. Here, this approach is used to explore the potentials
of marine technologies to contribute to the decarbonisation of theUK energy system and the potential benefits and costs from thestrategic development of a national market for wave and tidaltechnologies in the UK. Special attention is paid to potentiallearning-by-doing effects and the interplay between national andglobal technology development. The following framework for ma-rine technologies is set up: based on its current position in themarine market, it is assumed that the UK undertakes, with the helpof targeted government support, a strategic development of thenational marine energy market and establishes itself as the marketleader by 2030. In this time, learning effects depend solely on thenational cumulative capacity instalments, reflecting the nichemarket development taking place in the UK. After 2030, the globaldeployment of marine technologies is expected to pick up such thatfurther learning occurs fully on the global market. Further, marinetechnologies no longer receive any preferential treatment in theUK.
This storyline is then implemented in UKTM in the followingmanner (see Fig. 2). Given the current uncertainties around thetechnology design that will prevail in the long term, marine tech-nologies e representing both tidal stream and wave power e aremodelled by one process in UKTM.1 The initial capital costs of 6000£/kW are based on [22]. The resource potential is adopted fromCarbon Trust (2011), resulting in a maximum capacity for wave andtidal stream technologies of 24.5 GW in the UK. The strategic na-tional market development between 2020 and 2030 is reflected inthe model by forcing in a trajectory for installed capacity of thismarine technology, reaching 0.5 GW in 2020 and 4 GW in 2030(based on projections from Ref. [69]. Assessing learning-by-doingfor technologies that are not yet fully commercial is challenging(see e.g. Refs. [71,74] for fuel cells). So far, little investments inmarine have occurred in the UK and with lead times of 3e5 yearsthe expansion and early stage cost reductions that can be expectedto take place until 2020 are limited. We therefore parametrize thelearning-by-doing process to start in 2020, with an initial capacityof 0.5 GW and an initial investment cost of 6000 £/kW (based on[22,52]). All learning effects are calculated outside of the model -assuming that each doubling of cumulative capacity additions leadsto a reduction in the specific investment costs determined by thelearning rate - and the resulting cost trajectory is then fed into themodel. Hence, in the period from 2020 to 2030, the assumedlearning rate (see below) is applied to the national cumulative ca-pacity additions. After 2030, no further national investments areforced into the model, such that marine technologies are in directcompetitionwith the other low-carbon electricity options in UKTMand the model chooses the cost optimal investments for fulfillingthe energy demands. In addition, from 2030 onwards the learningeffects are based on the expected global cumulative deployment ofmarine technologies and assuming that the UK benefits from fullregional spill-overs (i.e. technology costs are determined also forthe UK based on the global cumulative deployment of thetechnology).
Starting from this basic approach, a sensitivity analysis is thenconducted on key developments that affect the competitiveness ofmarine technologies in the UK (Table 1). The learning rates formarine technologies, that are both applied to the national learningbetween 2020 and 2030 and to the global learning afterwards, arevaried between 5 and 20%, based on what has been observed forother electricity technologies in the past [41,60,77] and what isgenerally expected for marine technologies [4,9,36]. Apart from the

Fig. 2. Graphic representation of the basic modelling approach with the standard learning by doing equations with.
Table 1Overview on parameters varied in the sensitivity analysis.
Learning rate 5%, 10%, 15%, 20% (both national and global)
Global deployment after2030
- High: 178 GW in 2050 (based on 2� scenario in ETP (2015))- Low: 37 GW in 2050 (based on 6� scenario in ETP (2015))
Failure in othertechnologies
- NO CCS (CCS does not become available in the UK)- Low NUC (total nuclear capacity is restricted to 16 GW)- Low RE (installed capacity restricted to 16 GW for offshore wind and 10 GW for solar PV)- Combined (all of the failures combined)
Learning spill- overs(yes/no)
Partial spill- over from installed offshore wind capacity: Conservative learning rate of 7%, learning in 20% of total capital costs (installation andconnection) and 50% of O&M costs
M. Zeyringer et al. / Renewable Energy 115 (2018) 1281e12931284
learning rates, the push for marine technologies on the global levelwill strongly affect their competitiveness in the UK in the long-term, since national capacity investments alone are unlikely toinduce sufficient cost reductions. In the present sensitivity analysis,a high and a low trajectory are contrasted, both taken from the IEA'sEnergy Technology Perspectives 2015 [32] with a gradual increase ofglobal marine capacity to 37 GW (business-as-usual/6 �C Scenario)or 178 GW (2 �C Scenario) until 2050. Furthermore, the contribu-tion of marine technologies in the case of failure of other low-carbon electricity options is explored with four different cases inaddition to the scenarios with the standard UKTM assumptions ontechnology availability: (1) CCS technologies do not becomecommercially available in the UK before 2050 (case “No CCS”); (2)nuclear capacity is restricted to 16 GW, i.e. only a moderate increaseover the currently installed 11 GW, while the reference case as-sumes a nuclear potential of 33 GW in line with [16] (case “LowNUC”); (3) the extension of key renewable electricity options isrestrictedwith an installed capacity of 16 GW in the case of offshorewind (based on current projects with planning permission [70])and 10 GW for solar PV [59], while in the reference case consider-ably higher technical potentials are assumed (case “Low RE”); (4) acombination of the technology failures in cases 1e3 (case
“Combined”). Finally, the potential for learning spill-overs (SO)from the national offshore wind capacity are taken into account.Given the shared environment, marine and offshore wind facesimilar challenges, especially in terms of installation and gridconnection as well as operation and maintenance. Thus, the po-tential for partial spill-overs from the national cumulative offshorewind capacity is incorporated assuming that the part of the in-vestment cost of marine technologies that are associated toinstallation and grid connection (assumed to be 20% based on [44]can benefit from increasing national offshore wind capacity. Also,50% of the operation and maintenance costs can benefit from thesepartial learning spill-overs to reflect the shared environment. Thespill-over effects are added to themodel in an iterativemanner: in afirst run without SO, the cumulative national offshore wind ca-pacity is calculated. Afterwards, the cost trajectory for marinetechnologies is adjusted in accordance with these partial SO. Themodel is run again to assess whether this has influenced theoffshore wind capacity (and therefore the SO effects). The costtrajectory for marine technology is adjusted accordingly until theoffshore wind capacity does not change from one run to the next.
In the sensitivity analysis, all possible parameter combinationsare explored resulting in 80 scenarios in total (4 learning rate cases

Fig. 3. Development of electricity supply by fuel type in the UK in the reference case.
M. Zeyringer et al. / Renewable Energy 115 (2018) 1281e1293 1285
* 2 global deployment cases * 5 technology availability cases * 2spill-over cases).
Apart from the assumptions for the sensitivity analysisdescribed in Table 1 standard input parameters of UKTM are used inthe scenario analysis. The demand drivers are based on standardsocio-economic assumptions, most importantly an average GDPgrowth rate of 2.4% p.a [62]. and a rise in population of 0.5% p.a [65].over the period from 2010 to 2050. For all other electricity tech-nologies, exogenous learning rates are applied, assuming that theUK is a price taker for globally developing technologies. These costtrajectories are adopted from the Dynamic Dispatch Model (DDM)[17].2 All scenarios take the UK legislation on GHG emission limitsinto account, comprising the four five-yearly carbon budgets thathave been fixed so far until 2027 [10] and the long-term target ofa �80% reduction until 2050 compared to 1990 [29]. To give themodel flexibility with respect to the timing of emission reductionsafter the four carbon budgets, the long-term target is applied via acumulative budget constraint covering the period from 2028 to2050 which results in the same total quantity of emission reductionas would a linear reduction pathway to 80% until 2050.
3. Results
3.1. The impact of learning in marine technologies on the energysystem
This section provides an overview on the results of the learningsensitivity analysis in UKTM focusing on the possible contributionof marine technologies to the UKTM energy system and on the costimplications of the strategic development of a national nichemarket for marine technologies.
3.1.1. The reference caseWith the aim to establish a point of reference for the sensitivity
analysis on learning in marine technologies, we first briefly presentresults on a reference case which has the same basic UKTM as-sumptions as the sensitivity runs, but does not include any learningon marine electricity technologies. Thus, this case indicates howthe transition to a low-carbon electricity system in the UK couldlook like if no further development of the marine sector would takeplace (Fig. 3). As expected, the use of fossil fuels is strongly reduced,with a phase-out of coal until 2030 and a reduction of the contri-bution of natural gas to less than 20% (almost entirely with CCS).Based on the cost assumptions in the model, electricity generationin the UK would be heavily dominated by nuclear energy, theexpansion of which in the model follows the imposed growthconstraints. By 2050, the overall capacity limit of 33 GW is reachedresulting in a contribution of about 50% to total generation. From2030 onwards, the use of CCS is extended to biomass plants due tothe potential to generate negative emissions and thereby reducingthe pressure on the end-use sectors to contribute to emissionabatement. Accordingly, the electricity system becomes zero-carbon in 2030 and delivers up to 50 Mt CO2eq of negative emis-sions per year afterwards. Given the strong focus on large-scaletechnologies like nuclear and CCS, the expansion of renewableelectricity generation is less strong with a share of wind energy intotal electricity generation of 15% in 2050.
In terms of electricity demand, the initial reduction until 2030can be explained by a rising use of efficient appliances in thebuildings sector (most importantly for lighting) and an absolute
2 The actual cost figures of the DDM version underlying UKTM have not beenpublished. However, the resulting levelized costs of electricity are presented inFig. 4.
decline in the electricity use in the industry sector mostly in linewith the falling production levels in energy-intensive branches.Afterwards, an increased trend to electrification can be observedmostly due to a strong expansion of heat pumps in residentialheating and a rising contribution of electric cars to road transportdemand.
It has to be noted that these results are driven by the highlyuncertain cost trajectories assumed in UKTM. In particular, signif-icant uncertainties exist around the future of nuclear energy in theUK and the commercial availability of CCS technologies. As a lessoptimistic trajectory for either of the two would correspondinglyenhance the prospects of the other, competing technologies, wewill further explore different cases of technology failure in thesensitivity analysis (see also [24] for an extended analysis of tech-nology failures).
To highlight the current situation of marine energy in the UKsystem, Fig. 4 presents the levelized cost of electricity (LCOE) forkey generation technologies in the reference case. The rising carbonprice leads to increases in the LCOE of fossil fuel technologies, evenwith CCS. Accordingly, a huge drop in costs occurs for bio CCS plantsuntil 2035. Afterwards, the growing competition puts pressure onprices for bioenergy resources such that the LCOE for bioenergytechnologies rise again significantly. Both for onshore and offshorewind farms, relatively moderate learning effects are expected suchthat the LCOE reach 84 £/MWh and 101 £/MWh by 2050. Based onthe DDM cost assumptions, nuclear power plants exhibit with 65£/MWh the lowest generation costs in 2050.
This emphasizes the challenge that marine technologiescurrently face in the UK energy system. With capital costs of 6000£/kW, operating and maintenance cost at 3% of capital costs and acapacity factor of 31%, the marine technology modelled in UKTMstarts with LCOE of 326 £/MW. Thus, to reach competitiveness withother generation types, this cost would have to decrease to less
Fig. 4. Development of LCOE of key technologies in the reference case.

Table 2Marine capacity installed in 2050 across the scenario matrix (with GD¼ global deployment, LR¼ learning rate, TF¼ technology failure, SO¼ learning spill-overs from offshorewind).
Fig. 5. Comparison of electricity generation in 2050 in scenarios with high marinelearning (HL) and the respective reference scenarios (R, without marine learning) fordifferent cases of technology failure.
M. Zeyringer et al. / Renewable Energy 115 (2018) 1281e12931286
than 100 £/MWh before 2050, i.e. would have to fall to less than athird of today's cost. Under which conditions that could be the caseor which other factors might influence the role of marine tech-nologies in the UK electricity system is explored through a sensi-tivity analysis in the next section.
3.2. Sensitivity analysis e impacts on the electricity system
The sensitivity analysis explores the impact of four key param-eters on the diffusion of marine technologies in the UK energysystem: the learning rate (LR), global deployment (GD), failure inother key generation technologies (TF) and possible learning spill-overs from offshore wind capacity (SO). As a first step, the installedmarine capacity in 2050 across the 80 sensitivity runs is compared(Table 2). In 2030, 4 GWof themarine technology are installed in allscenarios as a result of the assumed strategic development of thenational market. Afterwards, however, the optimisation approachof UKTM decides whether further marine capacity is installed.
The results of the sensitivity analysis in Table 2 show that theassumed learning rate and the assumptions on technology failurehave the strongest impact on the long-term diffusion of marinetechnologies. Learning rates of 5 or 10% are generally too low toincentivise further investments such that the marine capacity,assumed to have a lifetime of 20 years in the model, is even phasedout by 2050. With learning rates of 15% or 20%, the deployment inthe UK depends strongly on the global capacity which defines thelearning effects. A full exploitation of the assumed available marinepotential of 25 GW by 2050 only occurs with a learning rate of 20%and the high global deployment trajectory (notwithstanding thecases with multiple technology failure). Also, at a 15% learning rateand without key technology failures, significant investments(>10 GW) are only realized in combination with high global ca-pacity, while with low global deployment a learning rate of 20% isneeded to induce similar investment figures. Looking at the caseswith failure in other key generation technologies shows thatrestricting the capacity of nuclear power or of other renewablegeneration technologies generally has no impact on the diffusion ofmarine technologies, as there are still cheaper options that couldreplace themissing capacity. In contrast, the contribution of marineenergy is higher under the assumption that CCS does not becomecommercially available with significant investments already at a
learning rate of 10% and high global deployment. This highlightsthe importance of bio-CCS as a safety valve for the energy system. Ifbio-CCS is not available, the electricity system is still fully decar-bonized, but as there is no longer the option to produce negativeemissions, a stronger electrification of the end-use sectors alsotakes place as their contribution to emission mitigation needs torise.
The case of a combined failure in nuclear, renewable and CCStechnologies puts extreme pressure on the decarbonisation of theelectricity system such that a strong contribution of marine tech-nologies is required even at a low learning rate of 5%. Comparingthe scenarios with and without learning spill-overs from the na-tional offshore wind capacity does not reveal any substantial dif-ferences indicating that the here assumed spill-over effects are notsignificant enough to influence the competitiveness of marinetechnologies.
Thus, the sensitivity analysis has shown that a significantcontribution of marine energy to the UK energy system only occursin an environment of significant learning (with rates of 15% or

M. Zeyringer et al. / Renewable Energy 115 (2018) 1281e1293 1287
above), high global deployment or multiple failures in other low-carbon generation options. Not all technology failures are equal,however: Failure of CCS technology alone is able to induce marineinvestments throughout to 2050, except if the learning rate is verylow. In light of the still uncertain future of CCS [89], marine couldpossibly provide a hedging strategy against CCS failure (although aswe'll soon show, also for CCS failure a learning rate of at least 15% isrequired before the early investments can be justified in terms ofcosts).
To further explore what an energy systemwith high penetrationof marine energy would look like and what technologies it wouldreplace, the electricity generationmix for 2050 is presented in Fig. 5comparing high marine scenarios (20% learning rate and highglobal deployment) with the respective reference scenarios (nolearning in marine technologies) for different cases of technologyfailure.
In general, marine technologies replace the next most expensivetechnology according to the merit-order curve. In the case with noassumed technology failure, this is the majority of offshore windgeneration and part of the natural gas CCS plants. Hence, therenewable share in electricity generation in 2050 increases to 36%in the high marine scenario compared to 26% in the respectivereference and the electricity sector contributes with an additional6Mt CO2eq to emissionmitigation. Accordingly, the pressure on theend-use sectors to reduce emissions is diminished, resulting in aslightly lower electrification of demand. Similar trends can beobserved in the scenarios with limited availability of nuclear poweror renewable generation options. By contrast, in the cases withoutCCS, marine energy replaces intermittent renewable generation,both from offshore wind and solar photovoltaics. Also, total elec-tricity demand is about 15% higher than in the cases withouttechnology failure, as here, without the option to generate negativeemissions through bio-CCS, the end-use sectors have to contributemore strongly to emission abatement through electrification. In thehighly constrained scenario with the combination of technologyfailures, electricity generation is reduced by roughly a quarter in2050 compared to the case without technology failure and marineenergy is even deployed in the absence of learning effects. Withhigh learning rates, the marine contribution is almost doubled andused mainly to increase electricity generation.
Hence, the analysis of the scenarios with the most favourableconditions for marine energy shows that in 2050 the contributionof marine technologies could reach the full potential assumed inthis scenario analysis for the UK of about 66 TWh covering between12 and 17% of total electricity generation in the UK.
Fig. 6. Development of LCOE for marine energy in the sensitivity analysis (colouredareas show difference in LCOE with the same learning rate but with low or high globaldeployment (HGD), values shown are without learning spill-overs from offshore wind(SO) except of the red line). (For interpretation of the references to colour in this figurelegend, the reader is referred to the web version of this article.)
3.3. Cost
The analysis with UKTM has shown that, with strategic devel-opment of a national lead market until 2030, marine energy couldachieve a significant share in the UK electricity system by 2050, ifhigh learning rates and strong global deployment prevails. In thissection we will analyse what this would mean in terms of costs forthe energy system. Fig. 6 summarises the LCOE trajectories acrossthe range of learning rates and levels of global deployment.
Starting from 326 £/MWh in 2020, considerable cost reductionsare already realized during the establishment of the nationalmarket where learning effects are assumed to depend on the na-tionally installed capacity alone. In 2030, the LCOE range between160 and 280 £/MWh. After that, the LCOE vary strongly according tothe imposed learning rate and global deployment trajectoryresulting in a considerable range from 50 to almost 240 £/MWh in2050. As suggested by the comparison of future generation costs ofkey technologies (see Fig. 4), significant deployment of marineenergy only takes place if the LCOE falls below 100 £/MWh. Thethreshold level is higher, if other low-carbon generation optionsfail, as for example, without CCS, LCOE of 170 £/MWh are sufficientto induce some marine investments by 2050. In terms of capitalcosts, LCOE of 50 £/MWh would correspond to around 900 £/kW,well below the current level for onshore wind farms. As alreadyindicated by the results of the sensitivity analysis in Table 2, thepossibility of positive spill-over effects in learning from nationaloffshore wind capacity has only a marginal effect on the LCOE ofmarine energy (shown in Fig. 6 by the difference between the redline (LCOE with learning spill-overs) and the lower end of the darkblue area (LCOEwith the same learning rate and global deploymentbut without learning spill-overs)). Also, and as could be seen inTable 2, it's clear that for LCOE the learning rate plays a much biggerrole than global deployment e having a higher learning rate, butlower global deployment (nearly) always leads to a lower LCOEvalue than a lower learning rate and higher global deploymentdoes.
In the next step, we assess whether the strategic investmentsinto a national lead market for marine energy technologies pays offin the long-term by reaping the benefits from global learning ef-fects. The assumption is that in absence of UK's early efforts, globallearning never takes off and we will follow the reference scenario.Conversely, any UK benefits that are gained from the post-2030 costreductions in the learning scenarios are assumed to be directconsequences of early UK action. Focusing on the energy system-wide cost implications, we compare the cumulated discountedwelfare costs for the entiremodel horizon between the sensitivitieswith learning and the respective reference cases without marinelearning but the same technology assumptions otherwise. Totalsocietal welfare costs are defined as the net total surplus of pro-ducers and consumers and comprise the entire costs of a specificenergy system, covering capital costs for energy conversion andtransport technologies, fixed operating and maintenance costs aswell as fuel and certificate costs. It has to be noted that thisassessment covers the entire energy system, but does not includewider macro-economic effects, like impacts on employment orGDP.
The numbers in Table 3 show that in most cases, the earlystrategic investments into marine energy lead to a rise in societalwelfare costs compared to the respective cases without a marinepush and the learning that follows. The cost increase is, however,small with a maximum of 0.32% or £35 billion cumulated over theentire model horizon. Yet, some exceptions need to be pointed outfor cases with considerable technology failure showing thatdeveloping a market for marine technologies could be seen as ahedging strategy against uncertainty in other low-carbon
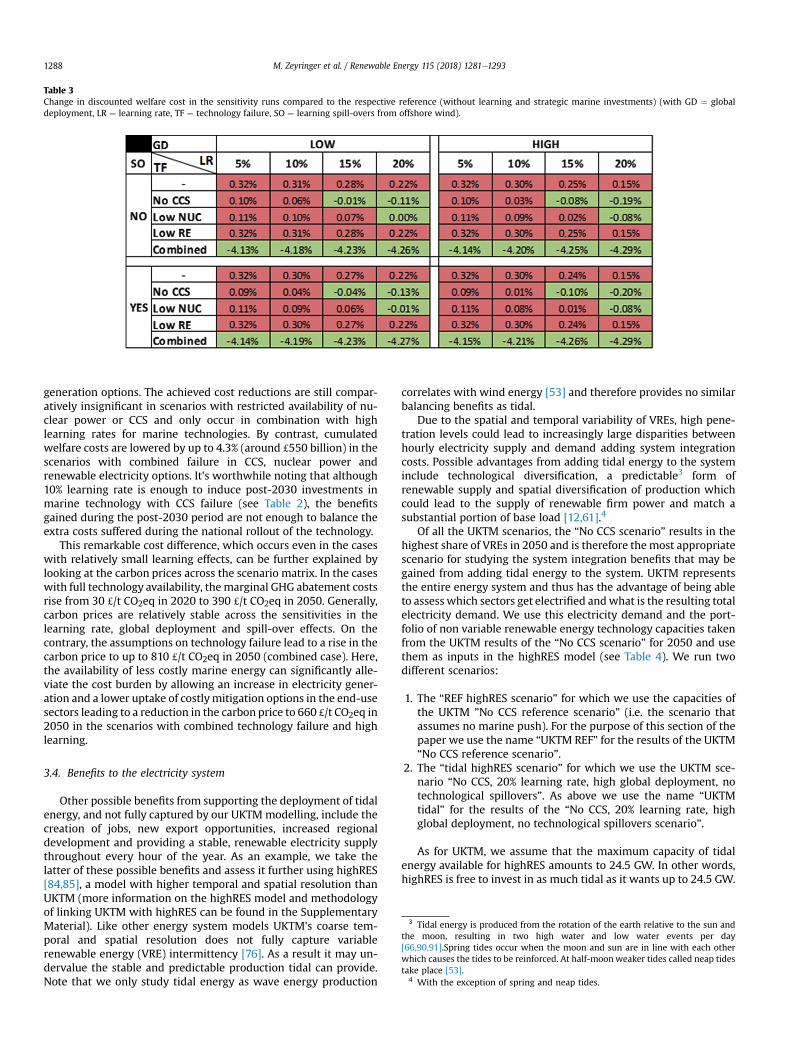
Table 3Change in discounted welfare cost in the sensitivity runs compared to the respective reference (without learning and strategic marine investments) (with GD ¼ globaldeployment, LR ¼ learning rate, TF ¼ technology failure, SO ¼ learning spill-overs from offshore wind).
M. Zeyringer et al. / Renewable Energy 115 (2018) 1281e12931288
generation options. The achieved cost reductions are still compar-atively insignificant in scenarios with restricted availability of nu-clear power or CCS and only occur in combination with highlearning rates for marine technologies. By contrast, cumulatedwelfare costs are lowered by up to 4.3% (around £550 billion) in thescenarios with combined failure in CCS, nuclear power andrenewable electricity options. It's worthwhile noting that although10% learning rate is enough to induce post-2030 investments inmarine technology with CCS failure (see Table 2), the benefitsgained during the post-2030 period are not enough to balance theextra costs suffered during the national rollout of the technology.
This remarkable cost difference, which occurs even in the caseswith relatively small learning effects, can be further explained bylooking at the carbon prices across the scenario matrix. In the caseswith full technology availability, themarginal GHG abatement costsrise from 30 £/t CO2eq in 2020 to 390 £/t CO2eq in 2050. Generally,carbon prices are relatively stable across the sensitivities in thelearning rate, global deployment and spill-over effects. On thecontrary, the assumptions on technology failure lead to a rise in thecarbon price to up to 810 £/t CO2eq in 2050 (combined case). Here,the availability of less costly marine energy can significantly alle-viate the cost burden by allowing an increase in electricity gener-ation and a lower uptake of costlymitigation options in the end-usesectors leading to a reduction in the carbon price to 660 £/t CO2eq in2050 in the scenarios with combined technology failure and highlearning.
3 Tidal energy is produced from the rotation of the earth relative to the sun andthe moon, resulting in two high water and low water events per day[66,90,91].Spring tides occur when the moon and sun are in line with each otherwhich causes the tides to be reinforced. At half-moonweaker tides called neap tidestake place [53].
4 With the exception of spring and neap tides.
3.4. Benefits to the electricity system
Other possible benefits from supporting the deployment of tidalenergy, and not fully captured by our UKTM modelling, include thecreation of jobs, new export opportunities, increased regionaldevelopment and providing a stable, renewable electricity supplythroughout every hour of the year. As an example, we take thelatter of these possible benefits and assess it further using highRES[84,85], a model with higher temporal and spatial resolution thanUKTM (more information on the highRES model and methodologyof linking UKTM with highRES can be found in the SupplementaryMaterial). Like other energy system models UKTM's coarse tem-poral and spatial resolution does not fully capture variablerenewable energy (VRE) intermittency [76]. As a result it may un-dervalue the stable and predictable production tidal can provide.Note that we only study tidal energy as wave energy production
correlates with wind energy [53] and therefore provides no similarbalancing benefits as tidal.
Due to the spatial and temporal variability of VREs, high pene-tration levels could lead to increasingly large disparities betweenhourly electricity supply and demand adding system integrationcosts. Possible advantages from adding tidal energy to the systeminclude technological diversification, a predictable3 form ofrenewable supply and spatial diversification of production whichcould lead to the supply of renewable firm power and match asubstantial portion of base load [12,61].4
Of all the UKTM scenarios, the “No CCS scenario” results in thehighest share of VREs in 2050 and is therefore the most appropriatescenario for studying the system integration benefits that may begained from adding tidal energy to the system. UKTM representsthe entire energy system and thus has the advantage of being ableto assess which sectors get electrified andwhat is the resulting totalelectricity demand. We use this electricity demand and the port-folio of non variable renewable energy technology capacities takenfrom the UKTM results of the “No CCS scenario” for 2050 and usethem as inputs in the highRES model (see Table 4). We run twodifferent scenarios:
1. The “REF highRES scenario” for which we use the capacities ofthe UKTM ”No CCS reference scenario” (i.e. the scenario thatassumes no marine push). For the purpose of this section of thepaper we use the name “UKTM REF” for the results of the UKTM“No CCS reference scenario”.
2. The “tidal highRES scenario” for which we use the UKTM sce-nario “No CCS, 20% learning rate, high global deployment, notechnological spillovers”. As above we use the name “UKTMtidal” for the results of the “No CCS, 20% learning rate, highglobal deployment, no technological spillovers scenario”.
As for UKTM, we assume that the maximum capacity of tidalenergy available for highRES amounts to 24.5 GW. In other words,highRES is free to invest in as much tidal as it wants up to 24.5 GW.
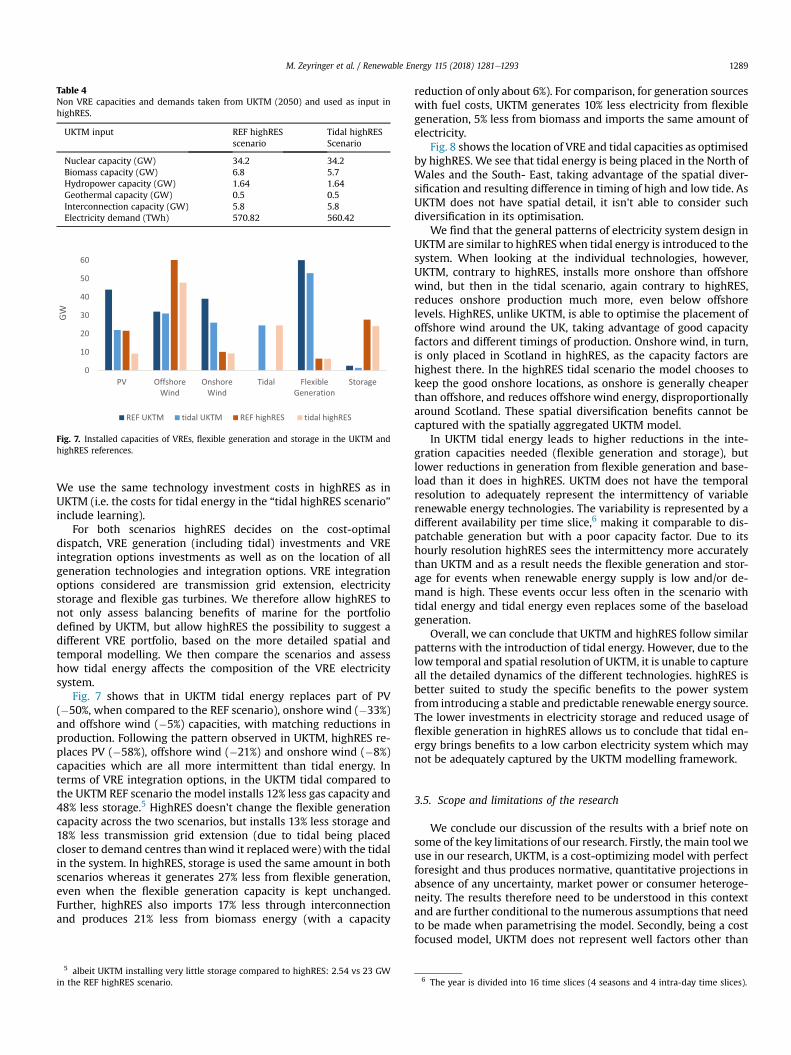
Table 4Non VRE capacities and demands taken from UKTM (2050) and used as input inhighRES.
UKTM input REF highRESscenario
Tidal highRESScenario
Nuclear capacity (GW) 34.2 34.2Biomass capacity (GW) 6.8 5.7Hydropower capacity (GW) 1.64 1.64Geothermal capacity (GW) 0.5 0.5Interconnection capacity (GW) 5.8 5.8Electricity demand (TWh) 570.82 560.42
Fig. 7. Installed capacities of VREs, flexible generation and storage in the UKTM andhighRES references.
M. Zeyringer et al. / Renewable Energy 115 (2018) 1281e1293 1289
We use the same technology investment costs in highRES as inUKTM (i.e. the costs for tidal energy in the “tidal highRES scenario”include learning).
For both scenarios highRES decides on the cost-optimaldispatch, VRE generation (including tidal) investments and VREintegration options investments as well as on the location of allgeneration technologies and integration options. VRE integrationoptions considered are transmission grid extension, electricitystorage and flexible gas turbines. We therefore allow highRES tonot only assess balancing benefits of marine for the portfoliodefined by UKTM, but allow highRES the possibility to suggest adifferent VRE portfolio, based on the more detailed spatial andtemporal modelling. We then compare the scenarios and assesshow tidal energy affects the composition of the VRE electricitysystem.
Fig. 7 shows that in UKTM tidal energy replaces part of PV(�50%, when compared to the REF scenario), onshore wind (�33%)and offshore wind (�5%) capacities, with matching reductions inproduction. Following the pattern observed in UKTM, highRES re-places PV (�58%), offshore wind (�21%) and onshore wind (�8%)capacities which are all more intermittent than tidal energy. Interms of VRE integration options, in the UKTM tidal compared tothe UKTM REF scenario the model installs 12% less gas capacity and48% less storage.5 HighRES doesn't change the flexible generationcapacity across the two scenarios, but installs 13% less storage and18% less transmission grid extension (due to tidal being placedcloser to demand centres thanwind it replaced were) with the tidalin the system. In highRES, storage is used the same amount in bothscenarios whereas it generates 27% less from flexible generation,even when the flexible generation capacity is kept unchanged.Further, highRES also imports 17% less through interconnectionand produces 21% less from biomass energy (with a capacity
5 albeit UKTM installing very little storage compared to highRES: 2.54 vs 23 GWin the REF highRES scenario.
reduction of only about 6%). For comparison, for generation sourceswith fuel costs, UKTM generates 10% less electricity from flexiblegeneration, 5% less from biomass and imports the same amount ofelectricity.
Fig. 8 shows the location of VRE and tidal capacities as optimisedby highRES. We see that tidal energy is being placed in the North ofWales and the South- East, taking advantage of the spatial diver-sification and resulting difference in timing of high and low tide. AsUKTM does not have spatial detail, it isn't able to consider suchdiversification in its optimisation.
We find that the general patterns of electricity system design inUKTM are similar to highRES when tidal energy is introduced to thesystem. When looking at the individual technologies, however,UKTM, contrary to highRES, installs more onshore than offshorewind, but then in the tidal scenario, again contrary to highRES,reduces onshore production much more, even below offshorelevels. HighRES, unlike UKTM, is able to optimise the placement ofoffshore wind around the UK, taking advantage of good capacityfactors and different timings of production. Onshore wind, in turn,is only placed in Scotland in highRES, as the capacity factors arehighest there. In the highRES tidal scenario the model chooses tokeep the good onshore locations, as onshore is generally cheaperthan offshore, and reduces offshore wind energy, disproportionallyaround Scotland. These spatial diversification benefits cannot becaptured with the spatially aggregated UKTM model.
In UKTM tidal energy leads to higher reductions in the inte-gration capacities needed (flexible generation and storage), butlower reductions in generation from flexible generation and base-load than it does in highRES. UKTM does not have the temporalresolution to adequately represent the intermittency of variablerenewable energy technologies. The variability is represented by adifferent availability per time slice,6 making it comparable to dis-patchable generation but with a poor capacity factor. Due to itshourly resolution highRES sees the intermittency more accuratelythan UKTM and as a result needs the flexible generation and stor-age for events when renewable energy supply is low and/or de-mand is high. These events occur less often in the scenario withtidal energy and tidal energy even replaces some of the baseloadgeneration.
Overall, we can conclude that UKTM and highRES follow similarpatterns with the introduction of tidal energy. However, due to thelow temporal and spatial resolution of UKTM, it is unable to captureall the detailed dynamics of the different technologies. highRES isbetter suited to study the specific benefits to the power systemfrom introducing a stable and predictable renewable energy source.The lower investments in electricity storage and reduced usage offlexible generation in highRES allows us to conclude that tidal en-ergy brings benefits to a low carbon electricity system which maynot be adequately captured by the UKTM modelling framework.
3.5. Scope and limitations of the research
We conclude our discussion of the results with a brief note onsome of the key limitations of our research. Firstly, themain tool weuse in our research, UKTM, is a cost-optimizing model with perfectforesight and thus produces normative, quantitative projections inabsence of any uncertainty, market power or consumer heteroge-neity. The results therefore need to be understood in this contextand are further conditional to the numerous assumptions that needto be made when parametrising the model. Secondly, being a costfocused model, UKTM does not represent well factors other than
6 The year is divided into 16 time slices (4 seasons and 4 intra-day time slices).

Fig. 8. Location of VRE and tidal capacities for the tidal highRES and REF highRES scenarios (exact capacities can be found in Table A1).
M. Zeyringer et al. / Renewable Energy 115 (2018) 1281e12931290
costs. Such factors, e.g. technology acceptance by the public,regional development concerns or other policy goals, can affect thedeployment of technologies. Thirdly, the overall marine resourcepotential is uncertain, can change with future technological de-velopments and, more generally, the study and most of its resultsand insights are specific to the UK. Fourthly, several simplificationsare included in the modelling, e.g. we model tidal and wave energyas one technology, we focus on technology learning in terms ofcosts reductions from learning by doing, but do not consider R&Dexplicitly or include performance improvements for the learning(e.g. efficiency or lifetime improvements), modelling of technologyspill-overs is limited to those from offshore wind to marine energyand UKTM, due to its lack of spatial detail, does not account forspatial cost differences related to e.g. grid connection (highREStakes into consideration transmission grid reinforcements, but noton an individual site basis).
4. Discussion and conclusions
The UK is currently in a favourable position to develop a nationallead market for marine energy technologies having attractive nat-ural conditions, experience in other maritime industries, substan-tial government support and high-quality research facilities.However, substantial learning effects would be necessary to bringmarine technologies tomaturity and even to a stagewhere they cancompete with other low-carbon technologies.
Against this background, the present analysis has explored, froma systems perspective, whether strategic national investments intomarine energy technologies in the medium-term and exploitingthe global learning effects that are assumed to be induced by theearly UK action in the long-term would benefit the UK energysystem by contributing to the decarbonisation of the electricitysystem. The sensitivity analysis conducted here has allowed us to
systematically assess the impact of key drivers of technologydeployment.
Our analysis highlights the magnitude of the challenges for themarine energy industry and raises several issues regarding thebenefits of establishing a lead market in the UK:
1) The results of the whole energy systems analysis indicate thatvery favourable conditions, i.e. high learning rates and globaldeployment, would be required to enable a substantial contri-bution of marine energy to the UK energy system in the long-term. Yet, it is highly uncertain that learning rates above 15%and a globally installed capacity of more than 150 GW by 2050will indeed materialise.
2) Alternatively, marine energy technologies could be conceived asa hedging strategy to avoid prohibitive decarbonisation costs inthe case of failure in other key low-carbon options. In light of theconsiderable uncertainties regarding the appropriate long-termdecarbonisation pathway, promoting a diverse technologyportfolio has often been highlighted as one of the key strategies[13,81]. Yet, given the fact that there are alternative technologyoptions which are closer to cost-competitiveness, it might bemore beneficial and less risky to concentrate policy support onthese options, especially since significant cost benefits can onlybe gained in case of multiple technology failures. Developingmarine technologies might also provide cost benefits in the caseof CCS not being commercially available, which, given the cur-rent technology development, does not seem unlikely. Thebenefits in terms of system costs calculated in this analysis are,however, rather low e especially when compared to the addi-tional costs that developing a marine market in the UK wouldinduce if no technology failure (or even with a “renewable fail-ure”) took place.

M. Zeyringer et al. / Renewable Energy 115 (2018) 1281e1293 1291
3) The issue of timing also plays against marine technology. Mostscenario analysis indicates that emissions from the UK elec-tricity system need to be reduced significantly by 2030 to stayon track with the 2050 target e to less than 100 g CO2/kWh[11,68]. Consequently, a massive roll-out of low-carbon gener-ation will be required during the 2020s. It is therefore doubtfulwhether a technology which is here assumed to reach com-mercial availability on a global scale only after 2030 will be ableto compete with the already established options.
4) The energy system-wide cost assessment indicates investing ina national marinemarket generally leads to a slight cost increasefor the energy system (up to £35 billion), with the exemption ofcases with multiple failure in other decarbonisation technolo-gies. Here, it needs to be stressed that our analysis does notprovide a comprehensive assessment of the economy-wide costimpacts in terms of GDP or job creation. These effects are verydifficult to estimate, especially those related to export oppor-tunities [3]. have found positive macroeconomic impacts forinvestments in marine capacity in Scotland based on CGE andinput-output modelling exercises, while [44] estimate thepossible contribution of a marine energy market to UK's GDP at£1.4e4.3 billion by 2050, based on a 15% share in the globalmarket. Yet, one must not forget that equal or even higherbenefits might be created through the promotion of other in-dustries. One aspect that has to be highlighted particularly forthe marine energy industry, is its potential to contribute toregional development of coastal areas that have long benefittedfrom the, now declining, offshore oil and gas industry [39].
5) Integrating low-carbon technologies into the existing genera-tion system will be a major challenge given their often decen-tralized and intermittent nature [80]. That is why we have alsoexamined whether a further justification for the deployment ofmarine technologies could be found in their (renewable)contribution to system balancing. Our analysis indicates thatincluding marine technologies has benefits in terms of reducedVRE integration measures needed to balance the system, espe-cially when the temporal and spatial detail of the assessment isincreased.
6) Given that it is still in the early stages of development, andmarine energy as such lags behind other low-carbon options,the UK government would have to be willing to provide sus-tained, ongoing support for the marine energy industry, at leastuntil 2030. Apart from the need to drive down costs throughcontinued research and demonstration projects, support isrequired for the development of national supply chains as wellas for upscaling efforts to prove the commercial potential. Suchlong timeframes are challenging and recent experience, like thecancellation of the CCS Commercialisation Competition,providing £1 billion capital funding [30], puts this prospect inserious doubt.
7) Lastly, the long-term value for the UK system depends stronglyonwhether marine technologies will take off on a global scale asnational learning effects are unlikely to be sufficient to establishcost-competitiveness. Both the International Energy Agency[32] and the International Renewable Energy Agency [34]highlight the significant potential of wave and tidal energy,but emphasize at the same time the substantial barriers that putthe development at risk. Hence, in terms of long-term exportopportunities and economic benefits, it might be less risky toconcentrate on an already more mature industry where the UKalso has the potential to become a market leader, like offshorewind energy or CCS.
Thus, on the whole, we conclude that marine energy has thepotential to contribute to the UK energy system, but there is a
substantial risk that the initial strategic investments in a nationallead market will not directly pay off in the long term. Accordingly,while it may not be time to “pick winners” for the decarbonisationstrategy out to 2050, it might be necessary to “accept losers” atsome point, keeping in mind the value of diversity in the technol-ogy portfolio on the one hand and the cost of keeping the optionsopen on the other hand. Furthermore, we would like to emphasizethe need for long-term stable policy support, if the UK is toestablish a central role in any low-carbon technology market. Asone example for an additional benefit from the deployment ofmarine technologies we investigate if tidal energy can provide astable, renewable electricity supply. Future research analysingadditional benefits such as job creation, new export opportunities,increased regional development would provide an even morecomprehensive view.
Acknowledgement
The authors would like to thank the two anonymous reviewersfor their comments. This research was supported under the WholeSystems Energy Modelling Consortium (WholeSEM) e Ref: EP/K039326/1.
Appendix A. Supplementary data
Supplementary data related to this article can be found athttps://doi.org/10.1016/j.renene.2017.07.092.
References
[1] G. Anandarajah, W. McDowall, P. Ekins, Decarbonising road transport withhydrogen and electricity: long term global technology learning scenarios, Int.J. Hydrogen Energy 38 (8) (2013) 3419e3432, http://dx.doi.org/10.1016/j.ijhydene.2012.12.110.
[2] G. Allan, M. Gilmartin, P. McGregor, K. Swales, Levelised costs of wave andtidal energy in the UK: cost competitiveness and the importance of “banded”renewables obligation certificates, Energy Policy 39 (1) (2011) 23e39, http://dx.doi.org/10.1016/j.enpol.2010.08.029.
[3] G. Allan, P. Lecca, P.G. McGregor, J.K. Swales, The economic impacts of marineenergy developments: a case study from Scotland, Mar. Policy 43 (2014)122e131, http://dx.doi.org/10.1016/j.marpol.2013.05.003.
[4] S. Astariz, G. Iglesias, The economics of wave energy: a review, Renew. Sus-tain. Energy Rev. 45 (2015) 397e408, http://dx.doi.org/10.1016/j.rser.2015.01.061.
[5] AbuBakr S. Bahaj, Generating electricity from the oceans, Renew. Sustain.Energy Rev. 15 (7) (2011) 3399e3416, http://dx.doi.org/10.1016/j.rser.2011.04.032.
[6] L. Barreto, G. Klaassen, Emission trading and the role of learning-by-doingspillovers in the “bottom-up” energy-system ERIS model, Int. J. EnergyTechnol. Policy 2 (1e2) (2004) 70e95, http://dx.doi.org/10.1504/IJETP.2004.004588.
[7] L. Barreto, S. Kypreos, Endogenizing R&D and market experience in the“bottom-up” energy-systems ERIS model, Technovation 24 (8) (2004)615e629, http://dx.doi.org/10.1016/S0166-4972(02)00124-4.
[8] Ch Berglund, P. S€oderholm, Modeling technical change in energy systemanalysis: analyzing the introduction of learning-by-doing in bottom-up en-ergy models, Energy Policy 34 (12) (2006) 1344e1356, http://dx.doi.org/10.1016/j.enpol.2004.09.002.
[9] Carbon Trust, Accelerating Marine Energy, the Potential for Cost Reduction e
Insights from the Carbon Trust Marine Energy Accelerator, London, UK, 2011.[10] CCC, Fourth Carbon Budget Review e Part 2, the Cost-effective Path to the
2050 Target, Committee on Climate Change, London, 2013.[11] CCC, The Fifth Carbon Budget - the Next Step towards a Low-carbon Economy,
Committee on Climate Change, London, 2015.[12] L. Clarke, K. Jiang, K. Akimoto, M. Babiker, G. Blanford, K. Fisher-Vanden, …,
D.P. van Vuuren, Assessing transformation pathways, in: O. Edenhofer,R. Pichs-Madruga, Y. Sokona, E. Farahani, S. Kadner, K. Seyboth, A. Adler, …,J.C. Minx (Eds.), Climate Change 2014: Mitigation of Climate Change. Contri-bution of Working Group III to the Fifth Assessment Report of the Intergov-ernmental Panel on Climate Change, Cambridge University Press, Cambridge,United Kingdom and New York, NY, USA, 2014, pp. 413e510.
[13] H. Cooke, I. Keppo, S. Wolf, Diversity in theory and practice: a review withapplication to the evolution of renewable energy generation in the UK, EnergyPolicy 61 (2013) 88e95, http://dx.doi.org/10.1016/j.enpol.2013.06.089.
[14] G. Dalton, G. Allan, N. Beaumont, A. Georgakaki, N. Hacking, T. Hooper, …,

M. Zeyringer et al. / Renewable Energy 115 (2018) 1281e12931292
T. Stallard, Economic and socio-economic assessment methods for oceanrenewable energy: public and private perspectives, Renew. Sustain. EnergyRev. 45 (2015) 850e878, http://dx.doi.org/10.1016/j.rser.2015.01.068.
[15] H.E. Daly, K. Scott, N. Strachan, J. Barrett, Indirect CO2 emission implications ofenergy system pathways: linking IO and times models for the UK, Environ. Sci.Technol. 49 (17) (2015) 10701e10709, http://dx.doi.org/10.1021/acs.est.5b01020.
[16] DECC, The Carbon Plan: Delivering Our Low Carbon Future, Department ofEnergy and Climate Change, London, 2011.
[17] DECC, DECC Dynamic Dispatch Model (DDM), Department of Energy andClimate Change, London, 2012.
[18] A. Dechezlepretre, R. Martin, S. Bassi, Climate change policy, innovation andgrowth, Policy Brief Grantham Res. Inst. Clim. Change Environ. Glob. GreenGrowth Inst. (2016).
[19] M.A.P.C. de Feber, G.J. Schaeffer, A.J. Seebregts, K.E.L. Smekens, Enhancementsof en-dogenous technology learning in the Western European MARKALmodel. Contributions to the EU SAPIENT project, ECN, Petten, 2003.
[20] Department for Business, Energy and Industrial Strategy, Budget Notice forthe Second CFD Allocation Round, 2017. https://www.gov.uk/government/uploads/system/uploads/attachment_data/file/598824/Budget_Notice.pdf.
[21] M. Esteban, D. Leary, Current developments and future prospects of offshorewind and ocean energy, Appl. Energy 90 (1) (2012) 128e136, http://dx.doi.org/10.1016/j.apenergy.2011.06.011.
[22] ETI & UKERC, Marine Energy Technology Roadmap 2014, Energy TechnologiesInstitute (ETI) and the UK Energy Research Center (UKERC), Loughborough,London, 2014.
[23] B. Fais, N. Sabio, N. Strachan, The critical role of the industrial sector inreaching long-term emission reduction, energy efficiency and renewabletargets, Appl. Energy 162 (2016a) 699e712, http://dx.doi.org/10.1016/j.apenergy.2015.10.112.
[24] B. Fais, I. Keppo, M. Zeyringer, W. Usher, H. Daly, Impact of technology un-certainty on future low-carbon pathways in the UK, Energy Strategy Rev.13e14 (2016b) 154e168, http://dx.doi.org/10.1016/j.esr.2016.09.005.
[25] H.E. Daly, B. Fais, UK TIMES Model Documentation, UCL Energy Institute,London, 2014. http://www.ucl.ac.uk/energy-models/models/uktm-ucl/uktm-documentation-overview.
[26] Ant�onio F. de O. Falc~ao, Wave energy utilization: a review of the technologies,Renew. Sustain. Energy Rev. 14 (3) (2010) 899e918, http://dx.doi.org/10.1016/j.rser.2009.11.003.
[27] L.H. Goulder, I. Parry, Instrument choice in environmental policy, Rev. Envi-ron. Econ. Policy 2 (2) (2008) 152e174, http://dx.doi.org/10.1093/reep/ren005.
[28] A. Gritsevskyi, N. Nakicenovic, Modelling uncertainty of induced technologicalchange, Energy Policy 28 (13) (2000) 907e921, http://dx.doi.org/10.1016/S0301-4215(00)00082-3.
[29] HM Government, Climate Change Act 2008, HM Government, London, 2008.[30] HM Government, HM Government Statement to Markets Regarding Carbon
Capture and Storage Competition, HM Government, London, 2015, November25.
[31] J.A. Hayward, P.W. Graham, A global and local endogenous experience curvemodel for projecting future uptake and cost of electricity generation tech-nologies, Energy Econ. 40 (2013) 537e548, http://dx.doi.org/10.1016/j.eneco.2013.08.010.
[32] IEA, Energy Technology Perspectives 2015-Mobilising Innovation to Accel-erate Climate Action, Organisation for Economic Co-operation and Develop-ment (OECD)/International Energy Agency (IEA), Paris, 2015.
[33] IRENA, Tidal Energy Technology Brief, International Renewable EnergyAgency, Abu Dhabi, 2014a.
[34] IRENA, Ocean Energy: Technologies, Patents, Deployment Status and Outlook,International Renewable Energy Agency, Abu Dhabi, 2014b.
[35] A. Jaffe, R. Newell, R. Stavins, A tale of two market failures: technology andenvironmental policy, Ecol. Econ. 54 (2e3) (2005) 164e174, http://dx.doi.org/10.1016/j.ecolecon.2004.12.027.
[36] H. Jeffrey, M. Winskel, M. Mueller, Learning rates and cost reduction in themarine energy sector, Proc. Annu. Br. Inst. Energy Econ. (2008). Sep. 2008.
[37] H. Jeffrey, B. Jay, M. Winskel, Accelerating the development of marine energy:exploring the prospects, benefits and challenges, Technol. Forecast. Soc.Change 80 (7) (2013) 1306e1316, http://dx.doi.org/10.1016/j.techfore.2012.03.004.
[38] H. Jeffrey, J. Sedgwick, G. Gerrard, Public funding for ocean energy: a com-parison of the UK and U.S. Technol. Forecast. Soc. Change 84 (2014) 155e170,http://dx.doi.org/10.1016/j.techfore.2013.08.006.
[39] K. Johnson, S. Kerr, J. Side, Marine renewables and coastal communi-tiesdexperiences from the offshore oil industry in the 1970s and their rele-vance to marine renewables in the 2010s, Mar. Policy 38 (2013) 491e499,http://dx.doi.org/10.1016/j.marpol.2012.08.004.
[40] C.M. Johnstone, D. Pratt, J.A. Clarke, A. Grant, A techno-economic analysis oftidal energy technology, Renew. Energy 49 (2013) 101e106, http://dx.doi.org/10.1016/j.renene.2012.01.054.
[41] S. Kahouli-Brahmi, Technological learning in energy-environment-economymodelling: a survey, Energy Policy 36 (2008) 138e162, http://dx.doi.org/10.1016/j.enpol.2007.09.001.
[42] Wolfgang Keller, International technology diffusion, J. Econ. Lit. 42 (3) (2004)752e782, http://dx.doi.org/10.1257/0022051042177685.
[43] D. Krzyzanowski, S. Kypreos, L. Grutzwiller, L. Barreto, Implications of
Technology Learning in Energy-Economy Models of the Transport Sector,Report to the Alliance for the Global Sustainability (AGS), Paul ScherrerInstitute, Switzerland, 2004.
[44] LCICG, Technology Innovation Needs Assessment (TINA), Marine EnergySummary Report, Low Carbon Innovation Coordination Group, London, 2012.
[45] S. Leete, J. Xu, D. Wheeler, Investment barriers and incentives for marinerenewable energy in the UK: an analysis of investor preferences, Energy Policy60 (2013) 866e875, http://dx.doi.org/10.1016/j.enpol.2013.05.011.
[46] J. Lewis, R. Wiser, Fostering a renewable energy technology industry: an in-ternational comparison of wind industry policy support mechanisms, EnergyPolicy 35 (3) (2007) 1844e1857, http://dx.doi.org/10.1016/j.enpol.2006.06.005.
[47] R. Lohwasser, R. Madlener, Relating R&D and investment policies to CCSmarket diffusion through two-factor learning, Energy Policy 52 (2013)439e452, http://dx.doi.org/10.1016/j.enpol.2012.09.061.
[48] I. L�opez, J. Andreu, S. Ceballos, I. Martínez de Alegría, I. Kortabarria, Review ofwave energy technologies and the necessary power-equipment, Renew.Sustain. Energy Rev. 27 (2013) 413e434, http://dx.doi.org/10.1016/j.rser.2013.07.009.
[49] R. Loulou, U. Remme, A. Lehtil€a, A. Kanudia, G. Goldstein, Documentation forthe TIMES Model. Retrieved from the Energy Technology Systems AnalysisProgram (ETSAP) Website, 2005. http://www.iea-etsap.org/web/Documentation.asp.
[50] N. Løvdal, F. Neumann, Internationalization as a strategy to overcome industrybarriersdan assessment of the marine energy industry, Energy Policy 39 (3)(2011) 1093e1100, http://dx.doi.org/10.1016/j.enpol.2010.11.028.
[51] B. Lundvall, S. Borr�as, Science, technology and innovation policy, in:J. Fagerberg, D.C. Mowery, R.R. Nelson (Eds.), Innovation Handbook, OxfordUniversity Press, Oxford, 2005, pp. 599e631.
[52] A. MacGillivray, H. Jeffrey, M. Winskel, I. Bryden, Innovation and cost reduc-tion for marine renewable energy: a learning investment sensitivity analysis,Technol. Forecast. Soc. Change 87 (2014) 108e124, http://dx.doi.org/10.1016/j.techfore.2013.11.005.
[53] D. MacKay, Sustainable Energy - without the Hot Air, Reprinted. ed.), UITCambridge, Cambridge, 2010.
[54] Thomas Martinsen, Technology learning in a small open economydthe sys-tems, modelling and exploiting the learning effect, Energy Policy. ISSN: 0301-4215 39 (5) (2011) 2361e2372, http://dx.doi.org/10.1016/j.enpol.2011.01.056.
[55] T. Mayer, D. Kreyenberg, J. Wind, F. Braun, Feasibility study of 2020 targetcosts for PEM fuel cells and lithium-ion batteries: a two-factor experiencecurve approach, Int. J. Hydrogen Energy 37 (19) (2012) 14463e14474, http://dx.doi.org/10.1016/j.ijhydene.2012.07.022.
[56] A. Miketa, L. Schrattenholzer, Experiments with a methodology to model therole of R&D expenditures in energy technology learning processes: first re-sults, Energy Policy 32 (15) (2004) 1679e1692, http://dx.doi.org/10.1016/S0301-4215(03)00159-9.
[57] M. Mueller, R. Wallace, Enabling science and technology for marine renewableenergy, Energy Policy 36 (12) (2008) 4376e4382, http://dx.doi.org/10.1016/j.enpol.2008.09.035.
[58] T. Nakata, T. Sato, H. Wang, T. Kusunoki, T. Furubayashi, Modeling techno-logical learning and its application for clean coal technologies in Japan, Appl.Energy 88 (1) (2011) 330e336, http://dx.doi.org/10.1016/j.apenergy.2010.05.022.
[59] National Grid, Solar PV (Electricity Systems) and the National Grid: a BriefingNote for DECC, Retrieved from, 2012, https://www.gov.uk/government/organisations/department-of-energy-climate-change.
[60] L. Neij, Cost development of future technologies for power generationdastudy based on experience curves and complementary bottom-up assess-ments, Energy Policy 36 (2008) 2200e2211, http://dx.doi.org/10.1016/j.enpol.2008.02.029.
[61] S.P. Neill, M.R. Hashemi, M.J. Lewis, Tidal energy leasing and tidal phasing,Renew. Energy 85 (2016) 580e587, http://dx.doi.org/10.1016/j.renene.2015.07.016.
[62] OBR, Fiscal Sustainability Report, July 2012, Office for Budget Responsibility,London, 2012.
[63] OECD, IEA, NEA, ITF, Aligning Policies for a Low-carbon Economy, OECDPublishing, Paris, 2015, http://dx.doi.org/10.1787/9789264233294-en.
[64] OES, Annual Report 2014, Ocean Energy Systems Energy Technology Initia-tive, Lisbon, 2014.
[65] ONS, National Population Projections, 2010-based, Office for National Statis-tics, Newport, 2011.
[66] F. O Rourke, F. Boyle, A. Reynolds, Tidal energy update 2009, Appl. Energy 87(2010) 398e409, http://dx.doi.org/10.1016/j.apenergy.2009.08.014.
[67] David Popp, Innovation in climate policy models: implementing lessons fromthe economics of R&D, Energy Econ. 28 (5) (2006) 596e609, http://dx.doi.org/10.1016/j.eneco.2006.05.007.
[68] S. Pye, G. Anandarajah, B. Fais, Ch McGlade, N. Strachan, Pathways to DeepDecarbonisation in the UK, UK Country Report under the Deep Decarbon-isation Pathways Project (DDPP), UCL Energy Institute, 2015.
[69] RenewableUK, Wave and Tidal Energy in the UK - Conquering Challenges,Generating Growth, RenewableUK, London, 2013.
[70] RenewableUK, Offshore Wind Project Timelines, Retrieved from, 2015, http://www.renewableuk.com/.
[71] R. Rivera-Tinoco, K. Schoots, B. van der Zwaan, Learning curves for solid oxide

M. Zeyringer et al. / Renewable Energy 115 (2018) 1281e1293 1293
fuel cells, Energy Convers. Manag. 57 (2012) 86e96, http://dx.doi.org/10.1016/j.enconman.2011.11.018.
[72] U. Rout, U. Fahl, U. Remme, M. Blesl, A. Voß, Endogenous implementation oftechnolo-gy gap in energy optimization modelsda systematic analysis withinTIMES G5 model, Energy Policy 37 (7) (2009a) 2814e2830, http://dx.doi.org/10.1016/j.enpol.2009.03.034.
[73] U. Rout, M. Blesl, U. Fahl, U. Remme, A. Voß, Uncertainty in the learning ratesof energy technologies: an experiment in a global multi-regional energysystem model, Energy Policy 37 (11) (2009b) 4927e4942, http://dx.doi.org/10.1016/j.enpol.2009.06.056.
[74] K. Schoots, G.J. Kramer, B.C.C. van der Zwaan, Technology learning for fuelcells: an assessment of past and potential cost reductions, Energy Policy 38 (6)(2010) 2887e2897, http://dx.doi.org/10.1016/j.enpol.2010.01.022.
[75] A. Seebregts, T. Kram, G.J. Schaeffer, A. Bos, Endogenous learning and tech-nology clustering: analysis with MARKAL model of the Western Europeanenergy system, Int. J. Glob. Energy Issues 14 (1e4) (2000) 289e319, http://dx.doi.org/10.1504/IJGEI.2000.004430.
[76] S. Simoes, M. Zeyringer, D. Mayr, T. Huld, W. Nijs, J. Schmidt, Impact ofdifferent levels of geographical disaggregation of wind and PV electricitygeneration in large energy system models: a case study for Austria. Renew,Energy 105 (2017) 183e198, http://dx.doi.org/10.1016/j.renene.2016.12.020.
[77] P. S€oderholm, T. Sundqvist, Empirical challenges in the use of learning curvesfor assessing the economic prospects of renewable energy technologies,Renew. energy 32 (15) (2007) 2559e2578, http://dx.doi.org/10.1016/j.renene.2006.12.007.
[78] N. Strachan, B. Fais, H. Daly, Reinventing the energy modelling-policy inter-face, Nat. Energy (2006) 16012, http://dx.doi.org/10.1038/nenergy.2016.12.
[79] United Nations Framework Convention on Climate Change, Paris agreement,2015.
[80] G. Strbac, M. Aunedi, D. Pudjianto, F. Teng, P. Djapic, R. Druce, A. Carmel,K. Borkowski, Value of Flexibility in a Decarbonised Grid and System Exter-nalities of Low-carbon Generation Technologies. Report for the Committee onClimate Change, Imperial College & NERA Economic Consulting, London, 2015.
[81] J. Watson, R. Gross, I. Ketsopoulou, M. Winskel, The impact of uncertainties onthe UK's medium-term climate change targets, Energy Policy 87 (2015)685e695, http://dx.doi.org/10.1016/j.enpol.2015.02.030.
[82] G. Totschnig, I. Keppo, Cascade-mints e Part 1: an Analysis with MESSAGE.Final Report to the Energy-economics-environment Modeling Laboratory(E3MLAB) at the Institute of Communication and Computer Systems of theNational Technical University of Athens, Greece, Athens, 2007.
[83] T. Wiesenthal, A. Mercier, B. Schade, H. Petric, P. Dowling, A model-basedassessment of the impact of revitalised R&D investments on the Europeanpower sector, Renew. Sustain. Energy Rev. 16 (1) (2012) 105e112, http://dx.doi.org/10.1016/j.rser.2011.07.139.
[84] M. Zeyringer, B. Fais, J. Price, New or old technologies to decarbonize UK'selectricity system?, in: Presented at the International Conference on the Eu-ropean Energy Market, EEM, 2016a http://dx.doi.org/10.1109/EEM.2016.7521318.
[85] M. Zeyringer, D. Konnadu, A. Moore, Z. Sobral Mour~ao, J. Price, Renewableenergy deployment in the UK: spatial analysis of opportunities and threats, in:Proceedings of the 2016 BIEE (British Institute of Energy Economics) Con-ference, Oxford, 2016b.
[86] A.J. Wieczorek, M.P. Hekkert, L. Coenen, R. Harmsen, Broadening the nationalfocus in technological innovation system analysis: The case of offshore wind,Environ. Innov. Soc. Trans. 14 (2015) 128e148, http://dx.doi.org/10.1016/j.eist.2014.09.001.
[87] A. Sgobbi, S.G. Sim~oes, D. Magagna, W. Nijs, Assessing the impacts of tech-nology improvements on the deployment of marine energy in Europe with anenergy system perspective, Renew. Energy. 89 (2016) 515e525, http://dx.doi.org/10.1016/j.renene.2015.11.076.
[88] R. Kannan, N. Strachan, S. Pye, G. Anandarajah, N. Balta-Ozkan, UK MARKALModel Documentation, Retrieved from the UCL Energy Institute Modelswebsite:, 2007 http://www.ucl.ac.uk/energy-models/models/uk-markal.
[89] J. Watson, et al., Carbon Capture and Storage: Realising the Potential?, UKEnergy Research Centre, 2012. Retrieved from: http://www.ukerc.ac.uk/publications/carbon-capture-and-storage-realising-the-potential-html.
[90] E. Denny, The economics of tidal energy, Energy Policy 37 (2009) 1914e1924,http://dx.doi.org/10.1016/j.enpol.2009.01.009.
[91] M.Z. Jacobson, M.A. Delucchi, Providing all global energy with wind, water,and solar power, Part I: Technologies, energy resources, quantities and areasof infrastructure, and materials, Energy Policy 39 (2011) 1154e1169, http://dx.doi.org/10.1016/j.enpol.2010.11.040.