the potential of community fish refuges (cfrs) in rice...
TRANSCRIPT

The potential of community fish refuges (CFRs) in rice field agro-ecosystems for improving food and nutrition security in the Tonle Sap region

2
THE POTENTIAL OF COMMUNITY FISH REFUGES (CFRS) IN RICE FIELD AGRO-ECOSYSTEMS FOR IMPROVING FOOD AND NUTRITION SECURITY IN THE TONLE SAP REGION
THE POTENTIAL OF COMMUNITY FISH REFUGES (CFRS) IN RICE FIELD AGRO-ECOSYSTEMS FOR IMPROVING FOOD AND NUTRITION SECURITY IN THE TONLE SAP REGION
AuthorsAlan Brooks and Celine Sieu
CitationThis publication should be cited as: Brooks A and Sieu C. 2016. The potential of community fish refuges (CFRs) in rice field agro-ecosystems for improving food and nutrition security in the Tonle Sap region. Penang, Malaysia: WorldFish. Program Report: 2016-10.
AcknowledgmentsThe authors are grateful to our nongovernmental organization (NGO) and government partners, namely Aphiwat Neary Khmer Organization (ANKO), Trailblazer Cambodia Organization (TCO), Cambodia Organization for Women Support (COWS), Village Support Group (VSG), the Fisheries Administration, and local authorities in Battambang, Siem Reap, Kampong Thom and Pursat provinces, who actively participated in implementing the monitoring and evaluation efforts on which this study is based. The Rice Field Fisheries Enhancement Project is funded by the United States Agency for International Development (USAID).
DisclaimerThis report is made possible by the generous support of the American people through USAID. The contents are the responsibility of WorldFish and do not necessarily reflect the views of USAID or the United States government.

3
CONTENTSCONTENTS Introduction 4
The Rice Field Fisheries Enhancement Project (RFFEP) 5
CFRs in rice field fisheries agro-ecosystems 6
Data collection methods 7
Productivity of rice field fisheries with CFRs 8
Contribution to food and nutrition security 11
Fish consumption among children aged under 5 years 14
Potential for integration with small-scale aquaculture 17
The case for scaling out of CFR enhancement in Tonle Sap Lake floodplain 19
Notes 24
References 25

4
INTRODUCTION
The fisheries sector in Cambodia contributes 8%–12% to national GDP and 25%–30% to agricultural GDP, with an estimated 4.5 million people involved in fishing and associated trades. Fish and other aquatic animals are important food sources, contributing an estimated national average of 60%–70% of total animal protein intake. Of the 2013 total fish production, 550,000 metric tons (t) were harvested from freshwater habitats, of which rice field fisheries and small-scale family fisheries contributed approximately 20%. A recent study evaluated the potential yield from the rice field habitat, including channels and streams, at 350,000 t (Un et al. 2014).
The productivity and value of rice field fisheries to households in rural Cambodia has been highlighted in previous studies. Gregory and Guttman (2002) estimated that the average amount of fish caught in rice field fisheries in southeastern Cambodia was over 380 kilogram (kg) per household per year, or an annual consumption of 37 kg per person.
Shams et al. (2001) conducted a rice field study in Svay Rieng and showed that the majority (89%) of the fish caught were Clarias, Channa and Anabas species, all of which command good market prices in rural, peri-urban and export markets in Cambodia. They showed that over a 9-month period, yields were 585 kg/household or 2 kg/household/day/year. This was close to the mean catch rate of 681 kg/household/10 months (Gregory et al. 1996).
Wild-caught fish, a primary source of nutrition and income to millions of people in Cambodia, is under threat, mainly due to overexploitation and degradation of aquatic biodiversity and habitat. Open-water commercial fisheries are experiencing declining fish abundance. The Fisheries Administration of the Ministry of Agriculture, Forestry and Fisheries plans to increase productivity from rice field fisheries and aquaculture at an annual rate of 15% to maintain supply for a growing population (FiA 2010). However, in the current phases of the Strategic Planning Framework 2015–2024, rice field fisheries yields will be maintained and aquaculture will increase at a higher annual rate of 20%.
This report draws mainly on the baseline and monitoring data from the Rice Field Fisheries Enhancement Project (RFFEP) during its implementation between 2012 and 2014. Reference is also made to the Fish on Farms1 project to highlight the relative contribution of fish from small-scale aquaculture compared to wild-caught fish.
INTRODUCTION

5
Phot
o Cr
edit:
Sea
n Vi
chet
/Wor
ldFi
sh
A rice field refuge pond, Entak Kumar CFR, Kampong Thom Province.
5
THE RICE FIELD FISHERIES ENHANCEMENT PROJECT (RFFEP)
RFFEP, funded by USAID (2012–2016), seeks to improve sustainable rice field fishery management practices, mainly for poor aquatic-resource-dependent households. The project works with communities to strengthen the governance of rice field fisheries near their villages, through improved understanding of the dynamics of wild fisheries in the rice field
THE RICE FIELD FISHERIES ENHANCEMENT PROJECT (RFFEP)
environment. It also promotes best practices in the establishment and management of community fish refuges (CFRs) to help achieve the Fisheries Administration’s target of 1200 CFRs around the country; a total of 779 had already been established by 2013 according to a Fisheries Administration internal document.2
6
Phot
o Cr
edit:
Sea
n Vi
chet
/Wor
ldFi
sh
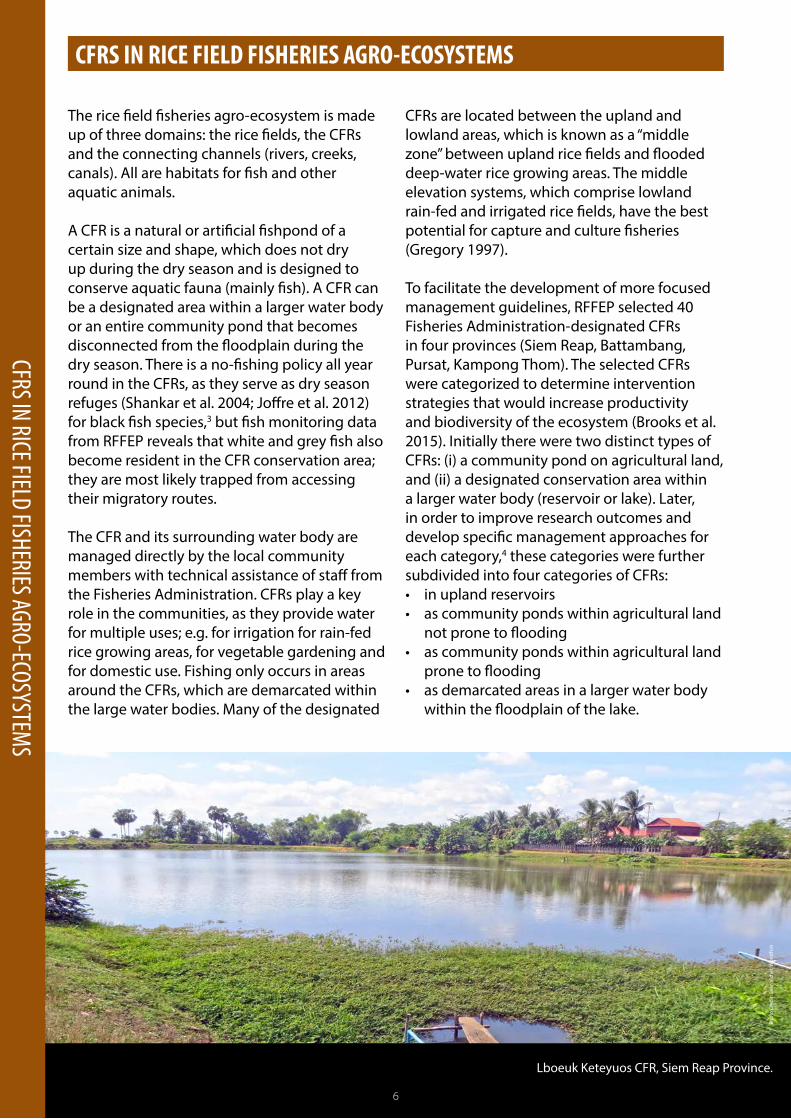
Lboeuk Keteyuos CFR, Siem Reap Province.
6
CFRS IN RICE FIELD FISHERIES AGRO-ECOSYSTEMS
CFRS IN RICE FIELD FISHERIES AGRO-ECOSYSTEMS
The rice field fisheries agro-ecosystem is made up of three domains: the rice fields, the CFRs and the connecting channels (rivers, creeks, canals). All are habitats for fish and other aquatic animals.
A CFR is a natural or artificial fishpond of a certain size and shape, which does not dry up during the dry season and is designed to conserve aquatic fauna (mainly fish). A CFR can be a designated area within a larger water body or an entire community pond that becomes disconnected from the floodplain during the dry season. There is a no-fishing policy all year round in the CFRs, as they serve as dry season refuges (Shankar et al. 2004; Joffre et al. 2012) for black fish species,3 but fish monitoring data from RFFEP reveals that white and grey fish also become resident in the CFR conservation area; they are most likely trapped from accessing their migratory routes.
The CFR and its surrounding water body are managed directly by the local community members with technical assistance of staff from the Fisheries Administration. CFRs play a key role in the communities, as they provide water for multiple uses; e.g. for irrigation for rain-fed rice growing areas, for vegetable gardening and for domestic use. Fishing only occurs in areas around the CFRs, which are demarcated within the large water bodies. Many of the designated
CFRs are located between the upland and lowland areas, which is known as a “middle zone” between upland rice fields and flooded deep-water rice growing areas. The middle elevation systems, which comprise lowland rain-fed and irrigated rice fields, have the best potential for capture and culture fisheries (Gregory 1997).
To facilitate the development of more focused management guidelines, RFFEP selected 40 Fisheries Administration-designated CFRs in four provinces (Siem Reap, Battambang, Pursat, Kampong Thom). The selected CFRs were categorized to determine intervention strategies that would increase productivity and biodiversity of the ecosystem (Brooks et al. 2015). Initially there were two distinct types of CFRs: (i) a community pond on agricultural land, and (ii) a designated conservation area within a larger water body (reservoir or lake). Later, in order to improve research outcomes and develop specific management approaches for each category,4 these categories were further subdivided into four categories of CFRs: • in upland reservoirs• as community ponds within agricultural land
not prone to flooding• as community ponds within agricultural land
prone to flooding• as demarcated areas in a larger water body
within the floodplain of the lake.

7
DATA COLLECTION METHODS
DATA COLLECTION METHODS
The productivity of rice field fisheries and household catch and consumption of fish is monitored by a combination of three surveying techniques supported by RFFEP. These techniques are described below and summarized in Table 1:
• Livelihoods baseline studies. In November 2012, RFFEP interviewed 640 households in four provinces with access to rice fields around the selected CFRs to assess the baseline status of the role of rice field fish in the livelihoods of target beneficiaries. The fish catch data was based on recall for the previous year.
• Biological monitoring. Biological monitoring aims to assess the impact of interventions on fish biomass and species diversity in the CFRs by setting eight multipanel gill nets in each CFR, four times per year (Hortle 2012). Rice field fisheries ecosystems are influenced by the hydrological dynamics of the floodplain; in order to be certain of causal effects from interventions, it is important to determine any variations within the CFR.
• Catch and consumption monitoring survey. Household surveys are periodically carried out to determine catch and fish utilization, including detailed information on consumption of fish and other aquatic animals by 400 households living near the project sites. Ten households within 1 kilometer (km) of the CFR were selected at each of 40 CFRs to provide a 7-day recall of
their fish catch, consumption and utilization of fish caught six times per year in order to include the effects of seasonality. The study aims to identify changes caused by project interventions, such as the improvement of habitat and management of the rice field fisheries system.
To enhance our understanding of how rice field fisheries contribute to households, we also consider the results of a small aquaculture research project in Prey Veng Province. Between 2012 and 2014, WorldFish, in partnership with Helen Keller International (HKI), supported 20 households (owning 24 homestead fishponds) in participatory action research to better understand the contribution of fish harvested from the ponds relative to the total quantity of fish sourced from natural habitats and assess the relative importance of fish from homestead aquaculture during the different seasons. A brief summary of the results that highlight an important link to productivity of rice field fisheries is provided below.
The results are presented in the following sections: first, productivity of the rice fields around CFRs; second, the contribution to food security; and finally, the summarized results of the aquaculture research activity and a discussion of potential integration of aquaculture to improve consistency of fish supply throughout the year.
Survey Sample DatesBaseline survey Total 640 households with children, 16
households/CFR site living within 1 km of the CFR November 2012
CFR biological monitoring
All 40 CFRs sampled four times a year at peak flood, receding flood, no flood and rising flood (November, February, May, September)
First sample November 2012, 10 survey events. Last survey data included in this report February 2015
Households catch and consumption monitoring
400 households, 10 households living near the CFR at each of 40 CFRs
Every 2 months from November 2012 to March 2015
Table 1. Summary of survey methods used in RFFEP.

8
(i) The key findings of the livelihoods baseline study (Joffre 2013) were as follows:• Fisheries contributed on average 15% to the
sampled households’ total annual income compared to other livelihood activities.
• Rice fields are the most common source of fish, with 83% of households reporting that they fished in rice fields.
• Rice fields are the most productive of all fishing grounds (fish and other aquatic animals), contributing almost 40% (77 kg) out of a total of 200 kg caught in 1 year from all sources (Figure 1). The figure shows four categories of CFR types based on proximity to Tonle Sap Lake, with Category 1 CFRs furthest from the lake at higher altitudes and Category 4 nearest to the lake. Unsurprisingly, the production of fish and other aquatic animals is higher in CFRs closer to the lake. Fish catch in rice fields is seasonal; more than half of the total catch
PRODUCTIVITY OF RICE FIELD FISHERIES WITH CFRS
PRODUCTIVITY OF RICE FIELD FISHERIES WITH CFRS
from this habitat occurred during a 4-month period during peak flood and water receding seasons.
• Households directly connected to CFRs by channels catch a little more on average in a 1-year period (87 kg) but variability is very high. Households owning refuge ponds in rice fields catch substantially more fish than those without; average productivity was estimated to be about 67 kg per 100 cubic meters (m²), but the variability of catch is high, ranging from less than 10 kg per 100 m² to more than 600 kg per 100 m².
The results were consistent with other studies (Ali 1990; Gregory 1997; Guttman 1999; Shams et al. 2001; Gregory and Guttman 2002; Halwart 2003; Hortle et al. 2008; Thuok 2009) highlighting the importance of rice field fisheries for seasonal contribution of fish and other aquatic animals to rural households.
Figure 1. Recall of fish and other aquatic animals catch in 2012 (kg per household) per fishing ground and CFR type (n=633).
Source: RFFEP baseline survey. OAA = other aquatic animals.
Annual fish and other aquatic animals catch per fishing ground and CFR type
Catc
h (k
g/ho
useh
old/
year
)
300
250
200
150
100
50
0All-Fish All-OAA CFR1-Fish CFR2-Fish CFR3-Fish CFR4-FishCFR1-OAA CFR2-OAA CFR3-OAA CFR4-OAA
Reservoir Flooded forest Tonle Sap Canals and rivers Rice field

9
(ii) Biological monitoring Fish productivity in rice fields is difficult to assess and quantify. It is assumed, however, that abundance and species diversity of fish in CFRs are good indicators of fish productivity in surrounding rice fields. RFFEP made several physical modifications to enhance natural productivity of CFRs. Most of the same months sampled in the second year after intervention showed increased fish biomass in the gill nets, with an overall annual increase of 64% compared to the first year (Figure 2). Although the water level was lower in 2014 than in 2013, the fish biomass increased in 2014 compared to 2013.
(iii) Catch and consumption monitoringThe average catch per household ranged from 3 kg per week in May 2013 to over 14 kg per week in March 2014, after project intervention (Figure 3). There was an increase of the average fish catch/household/week for January and March 2014, up from the previous year by 56% and 74%, respectively. However, annual variations result largely from the extent of flooding, which means monitoring over many annual cycles is needed to assess the long-term impact of improved habitat interventions.
PRODUCTIVITY OF RICE FIELD FISHERIES WITH CFRS
Figure 2. Average fish biomass sampled (grams [g]) per net per set in CFR, 2012–2014 (n=40).
Source: RFFEP CFR biological monitoring data.
900
800
700
600
500
400
300
200
100
Nov120
Feb13 May13 Aug13 Nov13 Feb14 May14 Aug14 Nov14 Feb15 Y-1 Y-2
Average fish sampled in CFR (in weight and using gill net)
Ave
rage
sam
ple
(g/n
et/s
et)
Other aquatic animals Fish
353.5
65.8 66.2
330 259
34.2
51.1
56
152.8
427.2
783.341.7
397.318.5
62.2
40.9
553.554.3
273.8
47.1
455.4409.7
213.9
72
Figure 3. Average fish catch (kg) per household in the last 7 days, 2012–2015 (n=400).
Source: RFFEP household catch monitoring survey.
16
14
12
10
8
6
4
2
0
Kg/h
ouse
hold
Fish catch (average)
Nov12 Jan13 Mar13 May13 Jul13 Sept13 Nov13 Jan14 Mar14 May14 Jul14 Sept14 Nov14 Jan15 Mar15
13.6
7.28.1
3.0
4.6
6.2
12.511.2
14.0
6.5
3.1 3.6
8.5
15.2
7.2

10
We extrapolated the weekly recall data to six periods per year by multiplying each 7-day recall value by 8.67 (52 weeks divided by six 1-week total fish caught). The total catches in kg per household per year were consistent with the baseline survey and other research reports. Catches from rice fields in 2013 were 28%, which is lower than the baseline study that reported 40% of total catch from wild sources. However, the quantity ratios for each habitat were similar between the two studies and total catches were 200–300 kg per household. Rice fields and surrounding canals and streams make an important contribution, with just over 200 kg of fish and approximately 75 kg of other aquatic animals.
Despite a low rainfall year in 2014 with shorter than average times that fields were connected to the CFR, average total catch increased between 2013 and 2014 by 13%, from 266 kg to 301 kg. This is not a significant increase for the rice field system. Average catch from trap or refuge ponds grew from 14 kg per household per year in 2013 to 48 kg per household per year in 2014.
Catch and consumption monitoring shows that the majority of women (59%–83%) go fishing for 1–3 days a week. Men go fishing more frequently in a week than women do, with 30%–70% of men going fishing for 4–7 days a week, compared to 17%–41% of women who do so.
PRODUCTIVITY OF RICE FIELD FISHERIES WITH CFRS
Year RFF system RFF system plus
Fish2013 207 2212014 210 258
Other aquatic animals2013 78 802014 75 77
Notes:“RFF system” is a combination of rice fields, canals and lakes.“RFF system plus” includes trap or refuge ponds.
Source for both tables: RFFEP household consumption monitoring data.
Table 1b. Approximate catch (kg per annum per household) from different habitat sources based on sample of 400 households collated as totals.
Rice fields in zone of influence
Rice fields not in zone of influence
Canals Reservoirs and lakes
Rice field refuge ponds in zone of influence
Rice field refuge ponds not in zone of influence
Community ponds
Flooded forest
Tonle Sap Lake
Other Total catch
Fish 2013 75 15 89 42 14 3 1 12 14 5 269
2014 55 4 94 56 48 5 6 8 15 10 301
Other aquatic animals
2013 58 10 14 6 2 0 1 1 0 0 92
2014 56 2 15 4 2 0 0 0 2 0 82
Note: Tonle Sap Lake and “Other” are not rice field fisheries sources.
Table 1a. Approximate catch (kg per annum per household) from different habitat sources based on sample of 400 households.
11
Phot
o Cr
edit:
Tit
Din
e/A
NKO
Awareness-raising event in the village about nutrients in fish, Kampeng CFR.
11
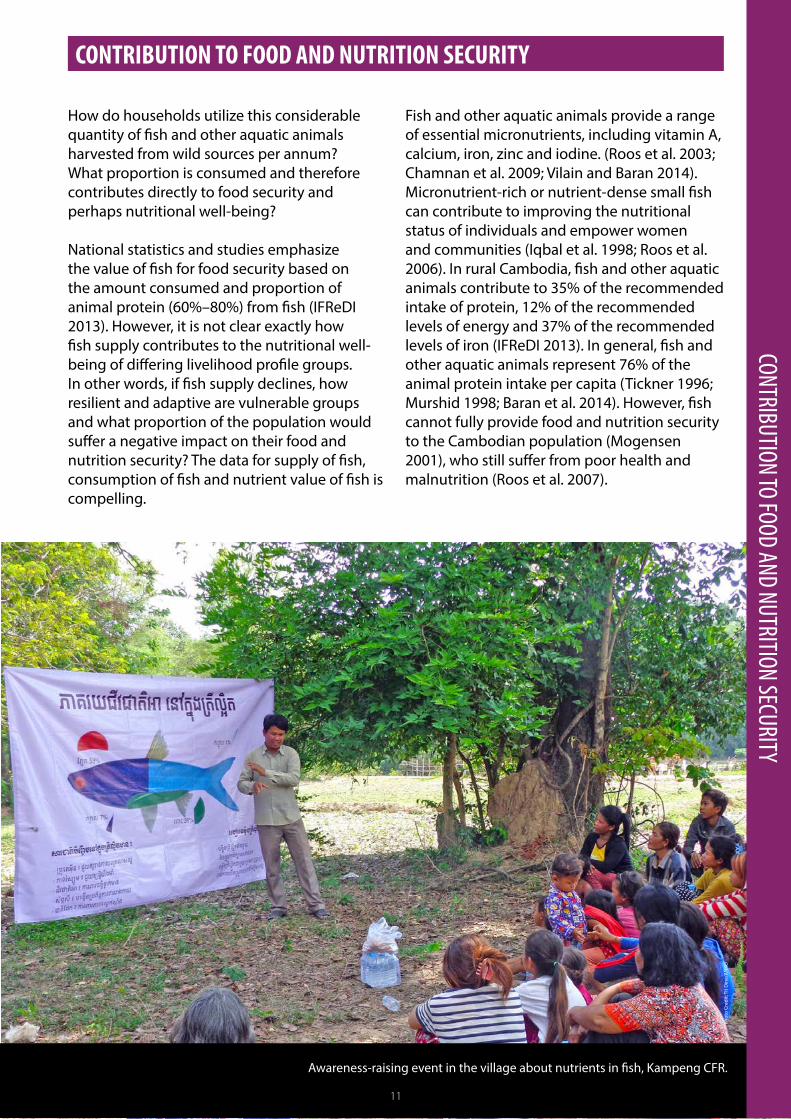
CONTRIBUTION TO FOOD AND NUTRITION SECURITY
How do households utilize this considerable quantity of fish and other aquatic animals harvested from wild sources per annum? What proportion is consumed and therefore contributes directly to food security and perhaps nutritional well-being?
National statistics and studies emphasize the value of fish for food security based on the amount consumed and proportion of animal protein (60%–80%) from fish (IFReDI 2013). However, it is not clear exactly how fish supply contributes to the nutritional well-being of differing livelihood profile groups. In other words, if fish supply declines, how resilient and adaptive are vulnerable groups and what proportion of the population would suffer a negative impact on their food and nutrition security? The data for supply of fish, consumption of fish and nutrient value of fish is compelling.
CONTRIBUTION TO FOOD AND NUTRITION SECURITY
Fish and other aquatic animals provide a range of essential micronutrients, including vitamin A, calcium, iron, zinc and iodine. (Roos et al. 2003; Chamnan et al. 2009; Vilain and Baran 2014). Micronutrient-rich or nutrient-dense small fish can contribute to improving the nutritional status of individuals and empower women and communities (Iqbal et al. 1998; Roos et al. 2006). In rural Cambodia, fish and other aquatic animals contribute to 35% of the recommended intake of protein, 12% of the recommended levels of energy and 37% of the recommended levels of iron (IFReDI 2013). In general, fish and other aquatic animals represent 76% of the animal protein intake per capita (Tickner 1996; Murshid 1998; Baran et al. 2014). However, fish cannot fully provide food and nutrition security to the Cambodian population (Mogensen 2001), who still suffer from poor health and malnutrition (Roos et al. 2007).

12
Flooded rice fields during the wet season provide around 40 kg of fish annually for consumption per capita (Gregory and Guttman 2002). A consumption of 30–40 kg per capita per year would provide two-thirds to three-quarters of the protein requirement. Based on this, to meet nutrition security requirements, Guttman (1999) estimates that a family of five to six people would require an intake of 170–240 kg of fish per year.
Households interviewed in the RFFEP baseline livelihoods survey ranked fisheries second to rice in contributing to food security. The survey shows that each household consumed 91 kg (45%) on average of the 201 kg of fish caught per year from five types of habitat (Table 1a). Fish are consumed by 98% of the women in our sample throughout the year, and 51% of them consumed other aquatic animals during the peak flood season.
The CFR and rice fields are, in most locations, connected to other habitats and may influence the yields of those habitats. Rice fields contribute the biggest proportion of the five habitat types, with an average of 38% or 77 kg caught per household per year (Figure 4). The utilization of the rice field catch illustrated in Figure 5 shows that the majority is consumed in the household. The variation in data is quite high but more than half of the households surveyed consumed more than 44 kg of fish per year from rice fields.
This study revealed that households consumed a higher proportion of other aquatic animals compared to fish, with 89% of the catch consumed directly or as a processed product. The quantity of other aquatic animals consumed was on average 5 kg per year from rice fields alone.
In contrast to the livelihoods baseline survey, the catch and consumption monitoring study is a longitudinal study. It provides more accurate data on household consumption of fish from rice fields fisheries habitats from 400 families six times per year over 2 years.
From this catch and consumption monitoring study over a 2-year period from 2013 to 2014, the average quantity of wild-catch fish eaten per week in the dry season was 1.7–3.9 kg per household, gradually increasing to 1.9–5.1 kg per household per week in the wet season for those households who went fishing. However, not all of the 400 families monitored went fishing in any given week. Even though selected households’ primary occupation was rice farming and part-time fishing, counting the households who did not go fishing in any given week was considered more representative of the sampled population living in rice field fisheries areas. As a result, the average amount of wild-catch fish consumed for the whole population sampled declines to 0.9–2.8 kg per household in the dry season and 1.4–4.4 kg per household in the wet season.
The proportion of fish consumed from total fish caught ranged from 23% to 61% in the dry season and from 38% to 65% in the wet season for the households sampled. The extrapolated total amount consumed in weight for 2013 and 2014 for the whole sample, including those who did not go fishing, was 117–124 kg and 30–43 kg from wild-caught sources for fish and other aquatic animals respectively, which was proportionately 39%–46% and 37%–47% of total fish and other aquatic animals caught, respectively. The total for only those households who went fishing increased to 161–170 kg and 43–60 kg fish and other aquatic animals, respectively, consumed per household per year (Table 2).
CONTRIBUTION TO FOOD AND NUTRITION SECURITY
Average quantity of fish consumed/household/year (from all habitats)
Proportion of fish consumed from total catch/household
Average quantity of other aquatic animals consumed/household/year (from all habitats)
Proportion of other aquatic animals consumed from total catch/household
N = 400 households (whole sample)
2013 124 kg 38% 43 kg 47%
2014 117 kg 39% 30 kg 37%
N = 278 households (who went fishing)
2013 170 kg 46% 60 kg 48%
2014 161 kg 35% 43 kg 37%
Source: RFFEP catch and consumption monitoring surveys.
Table 2. Quantity of fish and other aquatic animals consumed by households.

13
CONTRIBUTION TO FOOD AND NUTRITION SECURITY
Figure 5. Utilization of fish catch from rice field fisheries from sampled households.
Source: RFFEP livelihoods survey.
Figure 4. Source of fish by fishing ground and by CFR type for household consumption (n=630).
Source: RFFEP livelihoods survey.
100%
80%
60%
40%
20%
0%
Source of fish by fishing ground for food consumption
Tota
l fish
con
sum
ptio
n
CFR4CFR3CFR2CFR1All
Trap pondsFlooded forest Tonle Sap Canals and rivers Rice fields
3%
55%28%
14%
Distribution of rice field fisheries catch
Processed and soldConsumed fresh Sold fresh Processed and consumed
14
Phot
o Cr
edit:
Sea
n Vi
chet
/Wor
ldFi
sh
A family with small children sharing a meal with fish, Aren village, Pursat Province.
14
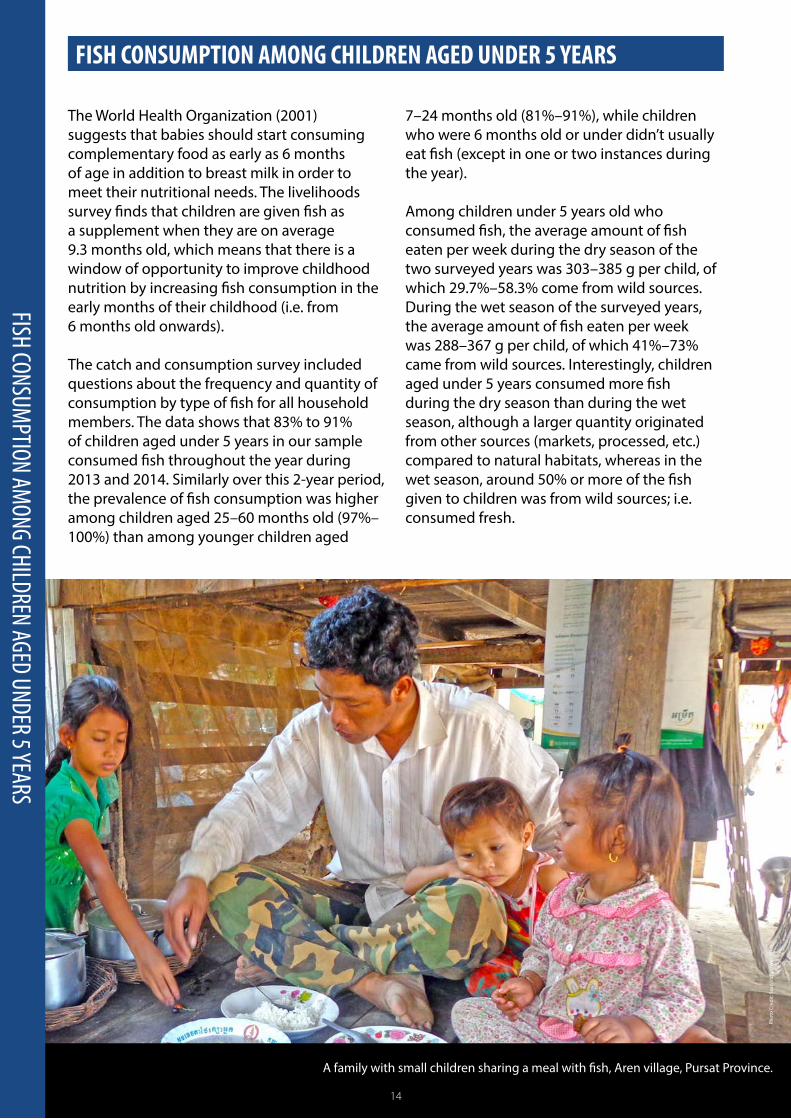
The World Health Organization (2001) suggests that babies should start consuming complementary food as early as 6 months of age in addition to breast milk in order to meet their nutritional needs. The livelihoods survey finds that children are given fish as a supplement when they are on average 9.3 months old, which means that there is a window of opportunity to improve childhood nutrition by increasing fish consumption in the early months of their childhood (i.e. from 6 months old onwards).
The catch and consumption survey included questions about the frequency and quantity of consumption by type of fish for all household members. The data shows that 83% to 91% of children aged under 5 years in our sample consumed fish throughout the year during 2013 and 2014. Similarly over this 2-year period, the prevalence of fish consumption was higher among children aged 25–60 months old (97%–100%) than among younger children aged
7–24 months old (81%–91%), while children who were 6 months old or under didn’t usually eat fish (except in one or two instances during the year).
Among children under 5 years old who consumed fish, the average amount of fish eaten per week during the dry season of the two surveyed years was 303–385 g per child, of which 29.7%–58.3% come from wild sources. During the wet season of the surveyed years, the average amount of fish eaten per week was 288–367 g per child, of which 41%–73% came from wild sources. Interestingly, children aged under 5 years consumed more fish during the dry season than during the wet season, although a larger quantity originated from other sources (markets, processed, etc.) compared to natural habitats, whereas in the wet season, around 50% or more of the fish given to children was from wild sources; i.e. consumed fresh.
FISH CONSUMPTION AM
ONG CHILDREN AGED UNDER 5 YEARS
FISH CONSUMPTION AMONG CHILDREN AGED UNDER 5 YEARS

15
FISH CONSUMPTION AM
ONG CHILDREN AGED UNDER 5 YEARSIn order for analysis to be more homogeneous, all the children aged under 5 years from our sample were included, including those who didn’t consume fish in any 7-day period, unless otherwise specified. Using this method of analysis, the average amount of fish eaten per week in the dry season of 2013 was 296 g per child per week, rising to 316 g per child per week in the dry season of 2014, before decreasing to 280 g per child in 2015. For the wet season, the consumption was 295 g per child per week in 2013, 274 g per child per week in 2014 and 294 g per child per week in 2015 (Figure 6). The total quantity of fish consumed by children aged under 5 years was relatively consistent throughout the year, while the proportion of fish consumed from wild sources was still higher in the wet season (49%–67%) than in the dry season (46%–52%).
Based on the catch and consumption survey, between 30% and 50% of the families who had children aged under 5 years fed their children with nutrient-dense5 fish throughout the year. There is no evidence that the number of households who fed their children with nutrient-dense species over the years had increased, although year 2 and year 3 showed a
more stable proportion of households feeding their children nutrient-dense fish regardless of season compared to year 1, where there was a 20% difference between the dry and the wet season (Figure 7).
The average weight of nutrient-dense fish consumed per child under 5 in our whole sample was 22.8–38.4 g per week during all years, with 46%–67% coming from wild sources (Figure 8). The average includes those who did not eat nutrient-dense fish. The amount of nutrient-dense fish consumed coming from wild catch among all sources was highest in the wet season of 2013, representing 67% of all sources.
The extrapolated total amount of nutrient-dense fish consumed coming from wild catches is 638–805 g per child per year, representing 50%–58% of the total nutrient-dense fish consumed from all sources. Wild-sourced fish and nutrient-dense species are an important contribution to the diet of children under 5; families should be encouraged to feed their children these fish.
Figure 6. Sources of fish eaten by all children under 5 years old in the sample (x̄=274).
350
300
250
200
150
100
50
0
Sources of fish consumed by children under 5
Wild sourcesOther sources
Gra
ms
Wet season Wet season Wet seasonDry season
2013 2014 2015
Dry season Dry season

16
FISH CONSUMPTION AM
ONG CHILDREN AGED UNDER 5 YEARS
Figure 7. Percentage of households with children aged under 5 who fed nutrient-dense fish to their children in the past 7 days (x̄=220).
YesNo
Households with children under 5 who fed micronutrient-rich fish to their children
% o
f hou
seho
lds
Wet season Wet season Wet season2013 2014 2015
Dry season Dry season Dry season
100%
90%
80%
70%
60%
50%
40%
30%
20%
10%
0%
Figure 8. Sources of nutrient-dense fish eaten by all children under 5 years old in the sample in the past 7 days (x̄=274).
Gra
ms
45
40
35
30
25
20
15
10
5
0
Other sources Wild sources
Wet season Wet season Wet season
2013 2014 2015
Dry season Dry season Dry season
Sources of micronutrient-rich fish consumed by children under 5

17
Small-scale aquaculture is often noted for its important contribution to household income, especially in Cambodia where small-scale cage farming makes use of the seasonal abundance of small fish as feed for larger high-priced predatory fish such as snakehead and catfish. Furthermore, for households dependent on fish and other aquatic animals for food and nutrition security, aquaculture may play an important role in supplementing fish supply to the household, especially during periods of reduced wild catch during the dry season.
Based on the 2011 national census data, Joffre (2013) calculated that 2.1% of Cambodian rural households own fishponds. From the RFFEP livelihoods survey data, the average pond productivity was estimated to be 55 kg per household per year,6 of which 58% was consumed (32 kg). Similarly, an IFReDI-led study showed that of the total quantity of fish
Phot
o Cr
edit:
Pro
um K
imho
r Wor
ldFi
sh
Farmer feeding her fish in Svay Antor District, Prey Veng Province.
17
POTENTIAL FOR INTEGRATION WITH SMALL-SCALE AQUACULTUREPOTENTIAL FOR INTEGRATION W
ITH SMALL-SCALE AQUACULTURE
consumed, 63 kg per capita per annum, only 2.1% originated from aquaculture (IFReDI 2013).
Over two annual cycles (2013–2014) of the small aquaculture research activity conducted in Prey Veng Province, the results revealed that 24 small (150–200 m2) fishponds contributed on average 23%–25% of total fish supply to the household; wild-caught sources contributed 66%–70%, and the balance of 8%–9% was purchased from the market. In a treatment of four replicates where carp was stocked but the pond was not protected from entry by wild fish,7 the total weight of wild fish harvested was 36% of total production. Therefore, wild-sourced fish remained important for food security, even when households owned a small fishpond. Perhaps the timing of the supply from fishponds during the year would be a more valued contribution to food and nutritional security.

18
In order to enable families to benefit from the abundance of wild-sourced fish in combination with aquaculture and test the timing of supply theory, the research study developed a two-pond system: one closed to entry by outside fish (using nylon netting fence) and stocked with carp and small nutrient-dense species in a polyculture and another adjacent pond near the rice field open (no fence) to wild fish entry. The closed pond served to provide fish at any time of the year, carp for income and small fish for regular consumption of nutrient-rich fish species, whereas the open pond became populated with small fish preyed upon by predators, which by April had grown large and could generate a good selling price during new year celebrations, providing the household with an excellent income source.
Flooded rice fields are a temporary aquatic ecosystem, so the production is seasonal, highly variable and unpredictable (Vromant et al. 2001a, 2001b). Therefore, managed aquaculture could fill the supply gap when wild-sourced fish are scarce. Taking this further, stocking and managing small fish species (e.g. species in genus Darkina, Esomus, Rasbora) rich in micronutrients opens up opportunities to better manage the supply of fish-sourced
micronutrients, thus potentially improving nutrient intake throughout the year.
Figure 9 shows household consumption of fish from the Prey Veng participating farms. The graph shows the quantity of fish harvested from wild sources and the household fishpond over a 1-year period using data collected from farmers every 2 weeks. The dotted line shows the total consumed from aquaculture and rice fields, revealing how effective the supply from aquaculture is in not only filling a gap and shortfall of wild-sourced supply but also ensuring better continuity of supply throughout the year as shown by a flatter line in Figure 9. This is important for maintaining regular consumption of protein and micronutrients throughout the year rather than the feast and famine cycle brought by the monsoon flooding and dry season drought. Therefore, the key message will be that as long as wild-sourced fish and other aquatic animals are consistently harvested from natural habitats and trap ponds, an important role of small-scale aquaculture for the resource-poor with nutritional deficiencies will be the quality of fish and the timing of multiple harvests for consumption during the annual cycle.
POTENTIAL FOR INTEGRATION WITH SMALL-SCALE AQUACULTURE
Figure 9. Monthly fish consumption from rice fields and aquaculture ponds per household over 1 year.
Source: WorldFish-HKI project on pond catch monitoring.
Kg
25
20
15
10
5
0
September
October
November
December
January
February
March AprilMay
June
July
August
Ponds Rice fields Total

19
Phot
o Cr
edit:
Sea
n Vi
chet
/Wor
ldFi
sh
Aren CFR after intervention, Pursat Province.
19
THE CASE FOR SCALING OUT OF CFR ENHANCEMENT IN TONLE SAP LAKE FLOODPLAIN
The population of the six main provinces of the Tonle Sap region is about 4.8 million8 or about 40% of the population of Cambodia excluding Phnom Penh. The Great Lake is widely known for being rich in aquatic resources and rice production. The local communities living within the floodplain and adjacent provincial areas rely upon rice for their livelihoods, and most rural people rely on fish and other aquatic animals for income and as important protein sources.
Communities have adapted their livelihood strategies to the annual pulse of flooding and cyclical droughts by diversifying their income and food security opportunities. Water-based communities rely principally on fishing and some cage culture during the wet season, followed by limited vegetable growing during the dry season. Communities living in an area that usually alternates between flooded and dry every 6 months of the year adopt a more diversified strategy of rice cultivation, cash crops, livestock rearing and home gardening.
THE CASE FOR SCALING OUT OF CFR ENHANCEMENT IN TONLE SAP LAKE FLOODPLAIN
Land-based communities typically do not physically become flooded or inundated except during extreme flooding events, and for most households rice farming is the most important agricultural activity and source of income. However, catching fish further from the lake remains a very important activity for most households, with sales of fish often the second most important income source. Consumption, as shown in the RFFEP and other studies, averages around 60% of the 200–300 kg caught from the various aquatic habitats, of which approximately one-third may be harvested from the rice fields alone. An additional 50–60 kg of other aquatic animals may be harvested from the rice fields and 80–90 kg from all habitat sources. In 2008, an entire rice field in Battambang Province was emptied, revealing a standing biomass of fish and other aquatic animals of 65 kg/hectare (ha; Hortle et al. 2008). Therefore, the contribution of wild-caught fish and other aquatic animals will remain an important source of food and income for many years to come.

20
The dynamics of the floodplain are in a state of constant flux. Agricultural productivity is increasing, crop diversification is improving, new markets and marketing opportunities are opening up, and more and more people are benefiting from improved access to additional skills and knowledge on the above activities and to jobs in the service sector. However, not everyone will benefit, and usually those who are unable to access these opportunities are those who will rely more and more on natural resources for food and income, which when accessible are essentially free. Also, it may be argued that the availability of free fish supports, if not fuels, a more capital-intensive and diversified rural economy, at least until households become less dependent on natural resource-based food. Therefore, rice field fisheries represent an invaluable source of food and income for the transitional period from wild fish dependency to a more intensive agriculture and diversified rural economy. And for some it will be a lifeline.
Moreover, if people better understand the importance of diet quality and the value of fish to improve nutritional well-being, then there is an opportunity to address the so-called “hidden hunger” or undernutrition especially prevalent among children, by maintaining fish supply and by improving preparation for consumption and storage of fish.
RFFEP has demonstrated the importance of rice field fish production for food and nutrition security in the Tonle Sap Lake region. RFFEP has explored several options that demonstrate the potential for productivity increase. In this section, we estimate the possible benefits from the existing 222 CFR conservation areas established in six provinces around the lake.
The RFFEP study shows that rice fields alone yield about 55–75 kg per household in the Tonle Sap Lake region (Table 1a) excluding yields from rice field refuge ponds.9 However, if channels, streams, lakes, rivers and trap ponds within the rice cultivated area (known collectively as rice field fisheries) are included, then households caught approximately 221–258 kg of fish per annum per household and 77–80 kg of other aquatic animals in 2013 and 2014 respectively (Table 1b).
According to the National Committee for Subnational Democratic Development’s database of 2010 (NCDD 2010), the total number of rice farming households in six provinces was 646,901, of which an estimated 81% actively fished the rice field habitats, resulting in a potential 523,990 households benefiting from “free” fish and other aquatic animals. RFFEP determined that on average, 833 households went fishing within the zone of influence10 of the 40 CFR rice field fisheries monitored in the project. If this is scaled to 222 CFRs,11 the total number of households fishing is estimated to be 184,926 or 29% of the total households, including those not fishing. Using extrapolated catch data, the total fish and other aquatic animals harvested for 2013 was 221 kg and 80 kg per household, respectively. An estimated 40,869 t of fish could be potentially harvested from the rice field fisheries connected to 222 CFRs in six provinces. An estimated additional 14,350 t of other aquatic animals supplement the fish catch (Table 3).
To check the accuracy of calculations using household catch to estimate potential, productivity estimates may also be calculated using yield area of the rice field fisheries ecosystem. NCDD (2010) reports that the total rice field fisheries area is 1,221,110 ha. As Table 4 shows, the total area influenced by 222 CFRs in six provinces is 396,048 ha or 32% of the total. This compares well with the household relative proportional method of calculation of 29% and is a substantial proportion of the total rice field fisheries area. Catch and consumption monitoring data reveals an average catch equivalent to 117 kg/ha of fish using an average area of 1.89 ha of cultivated rice per household (NCDD 2010). By comparison, households catch 37 to 59 kg/ha over 2 years from rice fields only. Using data from the 40 project CFRs, the average rice field fisheries area connected to a CFR is estimated to be 1784 ha. This connected area (also known as the zone of influence) is demarcated by hydrological and physical boundaries enclosing an area in which the waterway is connected via rice fields and channels to the CFR in an average year. Therefore, the potential total production for rice field fisheries connected to the 222 CFRs is estimated to be 46,338 t, differing by just 13% from the household method of calculation (Table 4).
THE CASE FOR SCALING OUT OF CFR ENHANCEMENT IN TONLE SAP LAKE FLOODPLAIN

21
THE CASE FOR SCALING OUT OF CFR ENHANCEMENT IN TONLE SAP LAKE FLOODPLAIN
Description AmountNumber of households in six provinces around Tonle Sap Lake involved in rice farminga 646,901 Number of households in six provinces actively fishing (81%)a 523,990 Average households actively fishing per CFR/rice field fisheries systemb 833 Total number of CFRs/rice field fisheries in six provincesa 222 Average fish caught per household per year (kg)b 221 Total number of households actively fishing in 222 CFRs/rice field fisheries in six provinces 184,926
Active fishing households in 222 CFRs as percent of total active fishing households in six provinces 35
Total fish production in 222 CFRs/rice field fisheries before project intervention (t) 40,869 Total fish production in 222 CFRs/rice field fisheries after project intervention (t) with 17% increment 47,816
Total increment after project intervention (t) 6,948 Total value of fish caught calculated from total increment after project intervention with US$ 1500 per metric ton in 222 CFRs/rice field fisheries 10,421,505
Total value of fish caught calculated from total increment after project intervention with US$ 1500 per metric ton in 40 CFRs/rice field fisheries 1,877,749
Notes: a= NCDD (2010), b= RFFEP project data.
Table 3. Approximate intervention value of fish caught based on households, catch.
Description AmountTotal rice field fisheries area in six provinces around Tonle Sap Lake (ha) 1,221,110Average rice field fisheries areas or zone of influence (ha) 1,784Total number of CFRs/rice field fisheries in six provinces 222 Average fish caught per hectare (kg) 117 Total rice field fisheries areas in 222 CFRs/rice field fisheries in six provinces (ha) 396,048 % of total rice field fisheries areas in 222 CFRs/rice field fisheries compared to total rice field fisheries areas (whole CFRs/rice field fisheries in six provinces)
32
Total fish production in 222 CFRs/rice field fisheries before project intervention (t) 46,338 Total fish production in 222 CFRs/rice field fisheries after project intervention (t) with 17% increment
54,215
Total increment after project intervention (t) 7,877 Total value of fish caught calculated from total increment after project intervention with US$ 1500 per metric ton in 222 CFRs/rice field fisheries
11,816,092
Total value of fish caught calculated from total increment after project intervention with US$ 1500 per metric ton in 40 CFRs/rice field fisheries
2,129,026
Table 4. Approximate intervention value of fish caught based on rice field area.
22
Phot
o Cr
edit:
Sea
n Vi
chet
/Wor
ldFi
sh
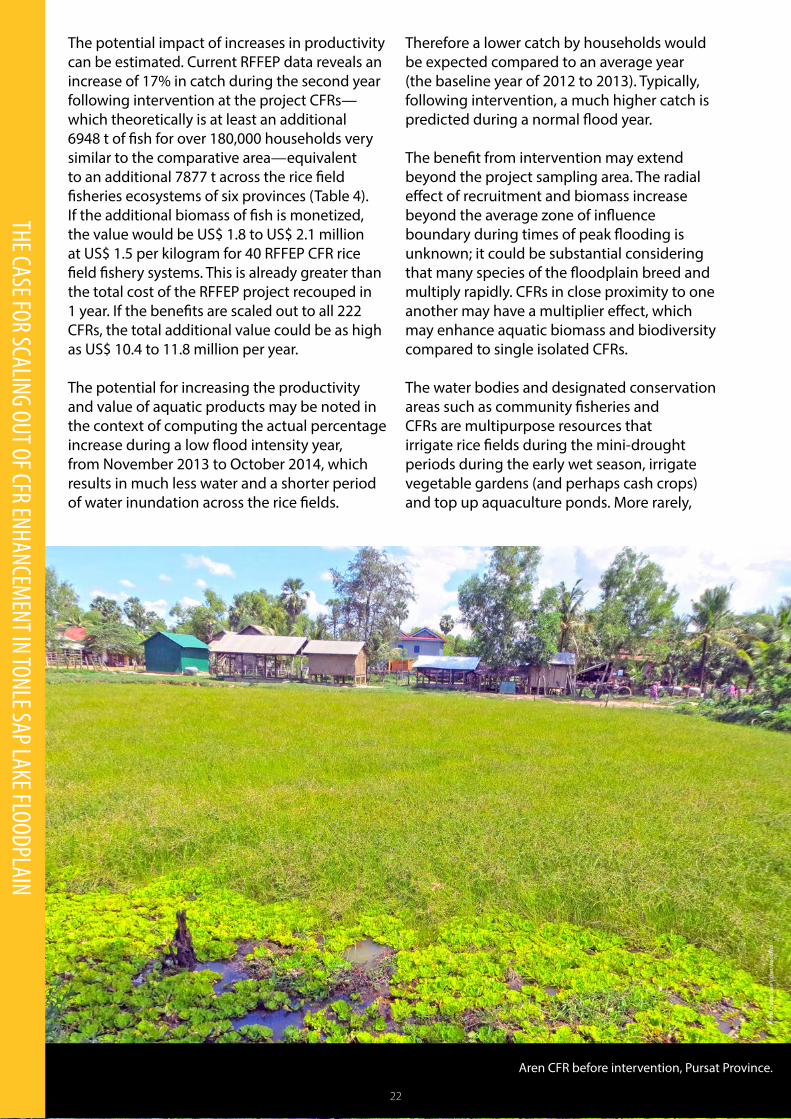
Aren CFR before intervention, Pursat Province.
22
The potential impact of increases in productivity can be estimated. Current RFFEP data reveals an increase of 17% in catch during the second year following intervention at the project CFRs—which theoretically is at least an additional 6948 t of fish for over 180,000 households very similar to the comparative area—equivalent to an additional 7877 t across the rice field fisheries ecosystems of six provinces (Table 4). If the additional biomass of fish is monetized, the value would be US$ 1.8 to US$ 2.1 million at US$ 1.5 per kilogram for 40 RFFEP CFR rice field fishery systems. This is already greater than the total cost of the RFFEP project recouped in 1 year. If the benefits are scaled out to all 222 CFRs, the total additional value could be as high as US$ 10.4 to 11.8 million per year.
The potential for increasing the productivity and value of aquatic products may be noted in the context of computing the actual percentage increase during a low flood intensity year, from November 2013 to October 2014, which results in much less water and a shorter period of water inundation across the rice fields.
Therefore a lower catch by households would be expected compared to an average year (the baseline year of 2012 to 2013). Typically, following intervention, a much higher catch is predicted during a normal flood year.
The benefit from intervention may extend beyond the project sampling area. The radial effect of recruitment and biomass increase beyond the average zone of influence boundary during times of peak flooding is unknown; it could be substantial considering that many species of the floodplain breed and multiply rapidly. CFRs in close proximity to one another may have a multiplier effect, which may enhance aquatic biomass and biodiversity compared to single isolated CFRs.
The water bodies and designated conservation areas such as community fisheries and CFRs are multipurpose resources that irrigate rice fields during the mini-drought periods during the early wet season, irrigate vegetable gardens (and perhaps cash crops) and top up aquaculture ponds. More rarely,
THE CASE FOR SCALING OUT OF CFR ENHANCEMENT IN TONLE SAP LAKE FLOODPLAIN

23
CFRs can also generate tourist income for local communities and serve as a source of potable water (e.g. Lboeuk Keteyuos in Siem Reap Province). In many locations, there are opportunities to improve the productivity of this water in addition to supporting fish stocks and maintaining fish supply to nearby rural communities.
Considering the multiple benefits from water storage areas such as reservoirs with CFRs and community ponds (typically an entire CFR), there is a definite case for further investment in scaling out the enhancement approach for existing CFRs and planning for construction or demarcation in existing water bodies of additional CFRs. Further research is needed to determine the full economic and welfare value of these conservation areas and water storage bodies to justify this expansion strategy. The mitigating effects of these resources on the impact of climate change on water availability should also be assessed.
The recommendations for scaling up in the Tonle Sap Lake floodplain area may be summarized as follows:• The estimated benefits from the 40 project
CFRs should be comprehensively analyzed, independently reviewed and widely communicated.
• A similar intervention approach to enhance management and improve rice field productivity may be initiated for the remaining CFRs in the six provinces and, if resources are available, be extended nationwide.
• Conduct further research on further improving the existing 40 project CFRs by integrating good land and water management practices into the rice field fisheries model to harness the potential of agricultural productivity and promote diversified livelihood options; e.g. small-scale aquaculture, horticulture and homestead gardens. The best practices from climate-smart agriculture will be introduced into the improved rice field fisheries enhancement model. Where appropriate, additional multipurpose benefits learned in the expansion activities above can be included.
• Conduct further research on the radial effect of fish recruitment and biomass increase beyond the average zone of influence boundary during flooding times, as well as the possibility of and potential multiplier effect from CFRs in close proximity to one another in enhancing aquatic biomass and biodiversity compared to single isolated CFRs.
• Draft an investment strategy to install additional community fisheries and CFR conservation areas clearly defining additional potential multifunctional benefits. An improved management strategy for the supply of fish for livelihoods and nutritional well-being should be included. This will focus on the preparation and storage of fish, evening out the peaks and troughs in consumption patterns throughout the year, and more effectively integrate with fish supplied from small-scale aquaculture.
THE CASE FOR SCALING OUT OF CFR ENHANCEMENT IN TONLE SAP LAKE FLOODPLAIN

24
1 The Fish on Farms project (2012–2013) was jointly conducted by the University of British Columbia and Helen Keller International (HKI), with technical assistance from WorldFish, in Prey Veng Province, Cambodia. This project, supported by the International Development Research Centre and the Canadian International Development Agency through the Canadian International Food Security Research Fund, studied how an integrated homestead food production system impacts poverty, food security and nutrition, particularly among women and children.
2 The Fisheries Administration document is entitled Cambodia List of Community Fish Refuges Nationwide as of 2013, developed by the Department of Aquaculture Development, in Khmer.
3 So-called black fish species are those entirely resident on the floodplain, grey fish species migrate short distances within tributaries and the floodplain, and white fish species migrate longer distances along the Mekong River, tributaries and floodplain.
4 Typically Category 1 is an upland reservoir or lake with the CFR as a designated area within. Category 2 is a community pond not prone to flooding and is usually outside Highways 5 and 6 encircling the Tonle Sap Lake. A Category 3 CFR is also a community pond, which typically is prone to flooding and is usually located between Highways 5 and 6. The 4th category is characterized as similar to Category 1 but typically is close to and influenced by the Tonle Sap floodplain. The CFR is a designated area embedded within a larger water body.
5 Small fish—often eaten whole, with head, organs and bones—are particularly rich in calcium; some are also rich in micronutrients, such as vitamin A, iron and zinc (Roos et al. 2007). For the purpose of this study, 17 small fish species in several genera, such as Esomus, Rasbora, Trichogaster, and Trichopsis, were considered “nutrient-dense species.”
6 Within the RFFEP baseline livelihoods survey sample (i.e. 600 households), only 3.6% of the households own a fishpond and no one owns or operates an aquaculture cage.
7 Wild fish enter fishponds when they are flooded, connecting the fishponds to the floodplain. In addition, in Cambodia it is common practice that fishers don’t use protection nets to prevent entry of wild fish into their ponds.
8 Population of Battambang, Siem Reap, Kampong Thom, Kampong Chhnang, Pursat and Banteay Meanchey provinces (https://en.wikipedia.org/wiki/List_of_cities_in_Cambodia).
9 A refuge pond is a deeper area provided for the fish within a rice field. The purpose of the refuge is to provide a place for the fish in case water in the field dries up or is not deep enough. It also serves to facilitate fish harvest at the end of the rice season, or to contain fish for further culture while the rice is harvested (Halwart and Gupta 2004).
10 A rice field fisheries area that is connected to a CFR in an average year with water flowing through channels is considered a CFR “zone of influence.”
11 The unofficial Fisheries Administration document Cambodia List of Community Fish Refuge Nationwide as of 2013 (in Khmer), developed by the Department of Aquaculture.
NOTES
NOTES
25
REFERENCES
Ali AB. 1990. Rice/fish farming in Malaysia: A resource optimization. Ambio 19(8):404–40.
Baran E, Chheng P, Ly V, Nasielski J, Saray S, Touch B, Tress J, Kaing K and Tan S. 2014. Fish resources in Cambodia (2001–2011). In Atlas of Cambodia: Maps on Socio-Economic Development and Environment. Phnom Penh: Save Cambodia’s Wildlife. 37–48.
Brooks A, Kim M, Sieu C, Sean V and Try V. 2015. A characterization of community fish refuge typologies in rice field fisheries ecosystems. Penang, Malaysia: WorldFish.
Chamnan C, Thilsted S, Buoy R, Lieng S, Gerpaci RV and Nanna R. 2009. The role of fisheries resources in rural Cambodia: Combating micronutrient deficiencies in women and children. Phnom Penh: Ministry of Agriculture, Forestry and Fisheries.
[FiA] Fisheries Administration. 2010. Strategic planning framework for fisheries: 2010–2019.
Gregory R. 1997. The Ricefield Fisheries Handbook. Phnom Penh: Cambodia-IRRI-Australia Project.
Gregory R and Guttman H. 2002. The ricefield catch and rural food security. In Edwards P, Little DC and Demaine H, eds. Rural Aquaculture. Wallingford, UK: CABI Publishing. 1–14.
Gregory R, Guttman H and Kekputhearith T. 1996. Poor in all but fish. AIT Aquaculture Working Paper No. 4. Bangkok: Asian Institute of Technology.
Guttman H. 1999. Rice field fisheries: A resource for Cambodia. NAGA, ICLARM Quarterly 22(2):11–15.
Halwart M. 2003. Recent initiatives on the availability and use of aquatic organisms in rice-based farming. In Sustainable Rice Production for Food Security. Proceedings of the 20th Session of the International Rice Commission Bangkok, Thailand, 23–26 July 2002. Retrieved from http://www.fao.org/DOCREP/006/Y4751E/y4751e00.htm#Contents
Halwart M and Gupta MV, eds. 2004. Culture of fish in rice fields. FAO, Rome, Italy, and The WorldFish Center, Penang, Malaysia.
Hortle KG. 2012. Biological monitoring of ricefield fisheries including community fish refuges and associated habitats. A biological monitoring report for the Rice Field Fisheries Enhancement Project. Phnom Penh: WorldFish.
Hortle KG, Troeung R and Lieng S. 2008. Yield and value of the wild fishery of rice fields in Battambang Province, near the Tonle Sap Lake, Cambodia. MRC Technical Paper No.18. Vientiane: Mekong River Commission.
[IFReDI] Inland Fisheries Research and Development Institute. 2013. Food and nutrition security vulnerability to mainstream hydropower dam development in Cambodia. Synthesis report of the FiA/Danida/WWF/Oxfam project. Phnom Penh: IFReDI.
Iqbal A, del Ninno C and Thilsted SH. 1998. Food-based strategies for improving nutrition in Bangladesh. Proceedings of the national workshop on food-based strategies for improving nutrition in Bangladesh, 26–27 April 1998, Dhaka, Bangladesh.
REFERENCES

26
REFERENCES
Joffre O. 2013. How important are the rice field fisheries? A livelihood baseline survey around the Tonle Sap Lake for the Rice Field Fisheries Enhancement Project. Phnom Penh: WorldFish.
Joffre O, Kosal M, Kura Y, Pich S and Thuok N. 2012. Community fish refuges in Cambodia: Lessons learned. Phnom Penh: WorldFish.
Johnstone G, Puskur R, Declerck F, Mam K, Il O, Mak S, Pech B, Seak S, Chan S, Hak S et al.2013. Tonle Sap scoping report. Penang, Malaysia: CGIAR Research Program on Aquatic Agricultural Systems. Project Report: AAS-2013-28.
Mogensen MT. 2001. The importance of fish and other aquatic animals for food and nutrition security in the lower Mekong Basin. [MSc thesis] The Royal Veterinary and Agricultural University, Denmark.
Murshid K. 1998. Food security in an Asian transitional economy: The Cambodian experience. Working Paper No. 6. Phnom Penh: CDRI/UNRISD.
[NCDD] The National Committee for Subnational Democratic Development. 2010. Commune database, 2010, Cambodia.
Roos N, Chamnan C, Loeung D, Jakobsen J and Thilsted SH. 2007. Freshwater fish as a dietary source of vitamin A in Cambodia. Food Chemistry 103(4):1104–11.
Roos N, Islam MdM and Thilsted SH. 2003. Small indigenous fish species in Bangladesh: Contribution to vitamin A, calcium and iron intakes. Journal of Nutrition 133:4021S–6S.
Roos N, Thorseng H, Gondolf UH, Chamnan C, Bukhave K and Thilsted SH. 2006. The potential of small indigenous fish species as a source of readily bioavailable iron in complementary diets in Cambodia. Proceeding of the workshop on bioavailability: Optimizing diets in developing countries, 7–10 March 2006, Chiang Mai, Thailand.
Shams N, Tuy S and Gutierrez D. 2001. Much more than rice: Rice field biodiversity and food security in southeastern Cambodia. Phnom Penh: Catholic Relief Services (CRS).
Shankar B, Halls A and Barr J. 2004. Rice versus fish revisited: On the integrated management of floodplain resources in Bangladesh. Natural Resources Forum 28:91–101.
Sieu C, Albrecht C and Brooks A. 2015a. Rice Fields Fisheries Enhancement Project – Biological monitoring: Trends over 9 events. Phnom Penh: WorldFish.
Sieu C, Albrecht C and Brooks A. 2015b. Rice Fields Fisheries Enhancement Project – Catch and consumption survey: Trends over 13 events. Phnom Penh: WorldFish.
Thuok N. 2009. Community fish refuge husbandry in lowland agricultural ecosystem. [PhD thesis] Build Bright University, Cambodia.
Tickner V. 1996. Tonle Sap fisheries: A case study on floodplain gill net fisheries in Seam Reap. Discussion Paper. Geneva: UNRISD.
Un S, Chheng P, Tress J, Baran E and Simpson V. 2014. Fish productivity by aquatic habitat and estimated fish production in Cambodia. Report for the project “Assessing economic and welfare values of fish in the Lower Mekong Basin.” Phnom Penh: Inland Fisheries Research and Development Institute (IFReDI) and WorldFish.

27
REFERENCESVilain C and Baran E. 2014. Nutritional and health value of fish: The case of Cambodia. Report for the project “Assessing economic and welfare values of fish in the Lower Mekong Basin.” Phnom Penh: WorldFish.
Vromant N, Nguyen THC and Ollevier F. 2001a. The effect of rice seeding rate and fish stocking on the floodwater ecology of the rice field in direct-seeded, concurrent rice-fish systems. Hydrobiologia 445:151–64.
Vromant N, Nguyen THC and Ollevier F. 2001b. The effect of rice-seeding rate and fish stocking on the floodwater ecology of the trench of a concurrent, direct-seeded rice-fish system. Hydrobiologia 457:105–17.
[WHO] World Health Organization. 2001. Iron deficiency anemia: Assessment, prevention, and control – A guide for programme managers. Geneva: WHO.

Paper made fromrecycled material
100% RECYCLED
Contact Details:WorldFish, PO Box 500 GPO,10670 Penang, MALAYSIAwww.worldfishcenter.org
Photo credit: Front cover, Sang Sokny/COWSPhoto credit: Back cover, Try Vanvuth/WorldFish
This publication should be cited as: Brooks A and Sieu C. 2016. The potential of community fish refuges (CFRs) in rice-field agro-ecosystems for improving food and nutrition security in the Tonle Sap region. Penang, Malaysia: WorldFish. Program Report: 2016-10.
© 2016. WorldFish. All rights reserved. This publication may be reproduced without the permission of, but with acknowledgment to, WorldFish.