the new mexico state investment council (“nmsic”)€¦ · the new mexico state investment...
TRANSCRIPT
The New Mexico State Investment Council (“NMSIC”) Second Quarter 2016: Real Assets Performance Measurement Report
Proprietary & Confidential November 2016

1) 2Q16 Economic Dashboard - Market Outlook
• Agriculture Market Update
• Infrastructure Market Update
• Timberland Market Update
• Currency Effects
2) 2Q16 Real Assets Performance Measurement Highlights
Appendix:
A. Additional 2Q16 Performance Measurement Report
B. Definitions
C. 2Q16 Real Assets Flash Report
2
Table of Contents
Disclaimer: This is a public version of the original Performance Measurement Presentation, portions of which have been removed for confidentiality purposes.

1. 2Q16 Economic Dashboard – Market Outlook

Agricultural Market Overview
• U.S. producers remain under pressure due to a strong U.S. dollar and lower commodity prices, and despite a drop-off in production expenses net farm income is expected to drop for the third year after historic highs reached in 2013.
– We expect continued challenges as supply will limit price growth and the U.S. dollar will keep exports less competitive. • Producers in Brazil and Australia have benefited from local currency depreciation as well as improved trade relations with major importers,
most notably China. • Most major agricultural grain and oilseed prices remained flat during the quarter and are expected to remain soft over the near term as
record production levels continue. – Corn and soybeans rallied during the quarter due to weather concerns earlier in the growing season, although corn prices finished
the quarter flat due to revised (higher) supply estimates, but soybean prices were 24% higher at the end of the quarter due to favorable beginning stock estimates and higher export projections.
• Permanent crop prices were mixed although we expect performance to remain relatively good due to strong consumer demand and supporting profitability for producers.
– Almond prices remain below the record highs reached in 2015 which has stimulated strong increased export demand that will help mitigate the price declines for growers.
• The California drought has improved and most reservoirs have been replenished due to a wet 2016 so far and most water delivery curtailments have been reduced or removed completely.
Second Quarter 2016 Source: Itau and Bloomberg (Grains & Oilseeds Price Trends); USDA, Economic Research Service, Farm Income and Wealth Statistics – Aug. 30 2016;
Grains & Oilseeds Price Trends $USD (Nov-15 through Jul-16)
Net farm income and net cash farm income (2000-2016f)
0
0.5
1
1.5
2
2.5
3
3.5
-10%
10%
30%
50%
70%
90%
2000
2001
2002
2003
2004
2005
2006
2007
2008
2009
2010
2011
2012
2013
2014
2015
2016
$ Pr
ice
per P
ound
Tim
e-w
eigh
ted
retu
rn
NFI Almonds/Wine Grapes Crop Performance(Rolling 1-year total returns)
Wine Grapes Almonds Avg. Almond Price4

Agricultural Market Overview
• The NCREIF Farmland Index (“NFI”) reported a 1.3% return for the quarter, which was slightly below last quarter’s return of 1.4% but above the 1.2% prior year’s same quarter return.
– Farmland returns continue to trend down as returns have been normalizing after more than a decade of strong outperformance across the sector.
– A strong U.S. dollar has also continued to pressure U.S. markets limiting exports’ competitiveness. • Permanent crops returned 1.8% driven mostly by appreciation (1.5%) and showing a slight improvement over last quarter’s 1.1% total
return, which was the lowest in over four years. – Almonds provided the largest contribution to quarterly performance, generating a 3.5% return.
• Row crops returned a below-average 0.8% during the quarter and driven entirely by the 0.9% income return. – The Corn Belt and Delta States both had negative appreciation during the quarter as commodity pressure continues while less
competitive exports continue to strain farmer profits. – The Corn Belt has struggled with declining values for seven straight quarters and returning -3.7% over the past four quarters, as
farmers in the region have been hit the hardest by the retrenched commodity markets impacting profitability directly.
Second Quarter 2016 Source: NCREIF
Quarterly Farmland Return Trends by NCREIF Region (2Q15-2Q16)
Total Annual Farmland Returns (rolling one-year returns 1996-2016)
5

Infrastructure Market Overview General • Fundraising was down significantly over the quarter, with only $4.2 billion
raised across 8 funds according to Preqin, the lowest amount since Q3 2012. • Deal volumes were also heavily down, with 225 deals completed with an
aggregate value of $97 billion, a decline of 67% by value from the record highs of Q1, although the first half of the year remains well ahead of the same period in 2015. Renewable energy was again the largest sector with 35% of deals by volume over the quarter, although the two largest deals were both oil refineries in Indonesia.
Europe • The UK’s vote to leave the EU has increased uncertainty for investors
regarding availability of financing, the impact of a depreciating pound, and applicability of EU legislation. In continental Europe, northern Europe’s PPPs continued to advance and there was a revival of renewable activity in Italy and Spain. Offshore wind remains strong, with a number of projects reaching FID in the quarter and the launch of further ~1.7GW of tenders, although steps have also been taken to address existing limited grid capacity. M&A activity in Europe remained strong with major gas and electricity distribution, airport and PPP deals gaining traction in the quarter.
North America • Clean energy investment in the US was down 5% at $23.1 billion, albeit from a
relatively high level the year before. A number of additional US states (Kentucky, New Hampshire, Tennessee) signed P3 legislation into law during the quarter opening the way for the private finance of large transport projects.
Asia Pacific • Asia again saw a large proportion of deals by value, driven by two large oil
refinery deals in Indonesia which accounted for half of the region’s total. Clean energy investment was down across region in H1, with China 34% lower, partially due to falling prices , particularly of solar PV and construction. 6
Source: Preqin Quarterly Infrastructure Update
05
10152025303540
Q1 Q2 Q3 Q4 Q1 Q2 Q3 Q4 Q1 Q2 Q3 Q4 Q1 Q2 Q3 Q4 Q1 Q2
2012 2013 2014 2015 2016
Unlisted Infrastructure Fundraising
No. of Funds Closed Aggregate Capital Raised ($bn)
050
100150200250300350400
Q1 Q2 Q3 Q4 Q1 Q2 Q3 Q4 Q1 Q2 Q3 Q4 Q1 Q2 Q3 Q4 Q1 Q2
2012 2013 2014 2015 2016
Infrastructure Deals Completed
No. of Deals Estimated Aggregate Deal Value ($bn)

Timberland Market Overview Markets Update • U.S. housing starts, a key driver of timber demand, remains below historic averages and projected starts for 2016 were
revised slightly downwards by Forisk Research, from 1.3 million as of January 2016 to 1.2 million as of July 2016. – However, the trend remains positive and Forisk’s 2016 base case for housing starts peaks at 1.6 million in 2020. – Housing starts in May 2016 were 9.5% above May 2015 and for the first five months of 2016, total housing starts
were 11.0% higher than the same period in 2015 according to Hancock Timber. • Softwood lumber prices increased during the quarter, with the RL lumber index up 7.3% year-over-year.
– Lumber pricing primarily driven up by improvement in residential construction along with lower supply inventories. • Log prices generally lag lumber prices, and have remained relatively flat in the U.S. and below long-term averages.
– Continued over-supply from the U.S. South and U.S. dollar strength continuing to favor imports over exports. • South America accounted for 30% of global wood pulp exports in 2015, with additional mills and processing plants being
built in Brazil, Chile and Uruguay. • Demand for wood pellets has increased significantly as an energy source and Australia/New Zealand continue to benefit
through growing demand from the Asia-Pacific regions.
Second Quarter 2016 Source: U.S. Census Bureau; Campbell Timber Trends Source: Timber Mart-South; Campbell Timber Trends
Pine Sawtimber Stumpage in U.S. South by Region
7
U.S. Housing Starts

Timberland Market Overview Performance Update
• The NCREIF Timberland Index (“NTI”) moved back into positive territory with a 1.0% return during the quarter, split between a 0.6% EBITDDA (income) return and a 0.4% appreciation return.
• The South generated the strongest return of 1.1%, which continues to be driven by improvement in the U.S. housing market. – The Northwest’s return of 0.9% is a significant bounce-back from last quarter’s return of -1.4%; the Lake States
generated a modest 0.2% return, while the Northeast remained in slight negative territory with a -0.01% return. • Timberland values per acre increased slightly over the quarter, priced at $1,808 despite that Northwest’s decline of 5%. • Timberland transactions continues to see significant improvement and expectations are the more deal-flow will continue to
persist as maturing “legacy” funds liquidate while vertically integrated forest product companies have re-entered the market. – The continued uptick in deal flow is favorable for the significant capital sitting on the sidelines seeking exposure to the
sector.
Second Quarter 2016 Source: NCREIF; Townsend Source: (left chart); Forisk Research Quarterly 2Q16
U.S. Timberland Transaction Volume in Acres by Year (2010-Q1 2016)
8
250
450
650
850
1050
1250
1450
1650
1850
2050
-5%
0%
5%
10%
15%
20%
2000
2001
2002
2003
2004
2005
2006
2007
2008
2009
2010
2011
2012
2013
2014
2015
2016
Price
Per
Acr
e
Gros
s Tim
e-w
eigh
ted
Retu
rn
NCREIF Timber Index Returns(annualized returns through June 30, 2016)
Total Return
Income Return
$ Per Acre

• Since the end of the GFC, the U.S. market has experienced strong economic expansion galvanized by favorable macro fundamentals and rising FDI volumes, given the lagging recovery experienced across Europe. As a result, the continuous growth of the U.S. market has been reflected in global currency movements characterized by a steady rise in USD compared to other major currencies since 2H14.
• The U.S. Dollar has been experiencing fast growth since 2H14. At quarter-end the British Pound (GBP)/USD and Euro (EUR)/USD exchange rates were 22% and 8% higher than their 25-year average, respectively.
• The USD appreciation is negatively correlated with the cost of imports and has been favorable to local investors and consumers. The decrease and volatility in oil prices has been influenced to some extent by the rise in USD and had similar effects to a tax-break on U.S consumers.
• Worries continue in Great Britain due to the recent decision to leave the European Union but have slowed down a bit for the time being. However, volatility is still expected to be the norm while uncertainty remains. In the meantime, the British Pound continues to weaken against the U.S. dollar and has fallen to 0.76 GBP/USD as of 8/31/16 (post Brexit vote). As of 2Q16, the Euro has stabilized a little bit against the U.S. dollar and slightly strengthened to 0.89 EUR/USD as of 8/31/16.
Currency Effects - Market Trends (2Q16)
9
0.4
0.6
0.8
1.0
1.2
1.4
Jun-
91Ju
n-92
Jun-
93Ju
n-94
Jun-
95Ju
n-96
Jun-
97Ju
n-98
Jun-
99Ju
n-00
Jun-
01Ju
n-02
Jun-
03Ju
n-04
Jun-
05Ju
n-06
Jun-
07Ju
n-08
Jun-
09Ju
n-10
Jun-
11Ju
n-12
Jun-
13Ju
n-14
Jun-
15Ju
n-16
EUR/
USD
Rat
es
EURO-USD Rates over 25 Years
25 year Average: 0.83 EUR/USD
Max: 10/25/20001.21 EUR/USD
Min: 4/22/20080.63 EUR/USD
6/30/2016 0.90 EUR/USD
0.4
0.45
0.5
0.55
0.6
0.65
0.7
0.75
0.8
Jun-
91
Jun-
92
Jun-
93
Jun-
94
Jun-
95
Jun-
96
Jun-
97
Jun-
98
Jun-
99
Jun-
00
Jun-
01
Jun-
02
Jun-
03
Jun-
04
Jun-
05
Jun-
06
Jun-
07
Jun-
08
Jun-
09
Jun-
10
Jun-
11
Jun-
12
Jun-
13
Jun-
14
Jun-
15
Jun-
16
GBP/
USD
Rat
es
GBP-USD Rates over 25 Years
25 year Average: 0.61 GBP/USD
Min: 11/8/20070.47 GBP/USD
Max: 6/27/20160.76 GBP/USD
6/30/20160.75 GBP/USD

• At quarter-end, the Australian Dollar (AUS)/USD and Brazilian Real (BRL)/USD exchange rates were about 1% lower and 58% higher than their 25-year average and 22-year average, respectively.
• U.S. investors with foreign investments have been experiencing short-term fluctuations on their international returns when translated into USD. This trend continued during 2Q16 with the U.S. dollar increasing in value against the British Pound and against the Euro and Australian Dollar while weakening against the Brazilian Real.
Currency Effects - Market Trends (2Q16)
10
0.6
0.8
1.0
1.2
1.4
1.6
1.8
2.0
2.2
Jun-
91Ju
n-92
Jun-
93Ju
n-94
Jun-
95Ju
n-96
Jun-
97Ju
n-98
Jun-
99Ju
n-00
Jun-
01Ju
n-02
Jun-
03Ju
n-04
Jun-
05Ju
n-06
Jun-
07Ju
n-08
Jun-
09Ju
n-10
Jun-
11Ju
n-12
Jun-
13Ju
n-14
Jun-
15Ju
n-16
AUS/
USD
Rat
es
AUS-USD Rates over 25 Years
25 year Average: 1.36 AUS/USD
Max: 4/3/20012.07 AUS/USD
Min: 7/28/20110.90 AUS/USD
6/30/2016 1.34 AUS/USD
0.6
1.0
1.4
1.8
2.2
2.6
3.0
3.4
3.8
4.2
Jun-
94
Jun-
95
Jun-
96
Jun-
97
Jun-
98
Jun-
99
Jun-
00
Jun-
01
Jun-
02
Jun-
03
Jun-
04
Jun-
05
Jun-
06
Jun-
07
Jun-
08
Jun-
09
Jun-
10
Jun-
11
Jun-
12
Jun-
13
Jun-
14
Jun-
15
Jun-
16
BRL/
USD
Rat
es
BRL-USD Rates over 25 Years
21 year Average: 2.03 BRL/USD
Max: 9/23/20154.18 BRL/USD
Min: 10/26/19940.83 BRL/USD
6/30/2016 3.21 BRL/USD

2. 2Q16 Real Assets Performance Measurement Highlights

Highlights
• New Mexico State Investment Council’s (NMSIC) current target allocation to real assets is 9%*.
• NMSIC began investing in real assets in 2011, and through 2016 has committed approximately $1.9 billion across 24 funds with 16 managers.
• No new commitments were made during 2Q16. For the year however, three commitments thus far have been made one each to Infrastructure, Timber, and the Energy sectors totaling $300 million.
• As of 2Q16, NMSIC’s real assets market value represents 4.8% of the aggregate Land Grant Permanent Fund and Severance Tax Permanent Fund assets (“NMSIC’s assets”). When unfunded commitments are included, real assets represents approximately 9.8% of NMSIC’s total plan assets as of 2Q16.
• Over the since inception periods, performance remains strong generating a 16.4% net time weighted return, and a 5.5% net since inception IRR. Recent performance (quarter, one, and three-year) has been volatile but overall has tracked the Real Assets CPI + 300 benchmark. Volatility has come from (i) global currency movements, (ii) fluctuation in energy prices, and (iii) j-curve effect due to the build out of the Real Assets portfolio. Over the longer term these factors are expected to have a lower impact on returns.
• As of 2Q16, 52% of committed capital remains unfunded and most funds are still in their j-curve. Long-term performance is expected to become less volatile as the portfolio matures, becomes income producing, funded capital increases, and new commitments are made.
• NMSIC continues to commit capital across the real asset sectors in order to move the allocation within the target range.
Portfolio Highlights
12 *Real Assets forms part of the Real Return allocation. The long term target for Real Return is 12%. Real Assets is targeted to be 75% of the Real Return allocation.

Portfolio Status
• Since the 2011 inception, NMSIC has committed approximately $1.9 billion to real assets across 24 funds with 16 managers.
• NMSIC’s real asset program incorporates a number of open ended and long dated funds where the capital is either permanently invested or invested for a considerable length of time which contributes to higher historical pacing than forecast projections.
13
Real Assets Portfolio Allocation
1 Fund $50
3 Funds $250
7 Funds $465
5 Funds $325
5 Funds $475
3 Funds$300
$168 $174 $180
0%
1%
2%
3%
4%
5%
6%
7%
8%
9%
10%
11%
$0
$50
$100
$150
$200
$250
$300
$350
$400
$450
$500
2011 2012 2013 2014 2015 2016 YTD 2017 Projected2018 Projected2019 Projected
$ M
illion
s
NMSIC Real Assets Allocation Growth
Annual Commitments (left axis) Per Pacing Model (left axis) Total Commitments % of NMSIC's Assets (right axis) NAV % of NMSIC's Assets (right axis)
Commitments in $ represented on left axis (bars) and % of NMSIC Assets represented on right axis (lines).

14
Real Assets Portfolio Performance – Time Weighted Return Attribution
Performance Attribution
• Accounting for both returns and capital invested, the adjacent chart shows the impact each investment had on NMSIC’s real assets portfolio over the one-year period.
• NMSIC’s real assets portfolio generated a 4.1% net return over the one-year period ending June 30, 2016.
• Infrastructure was again the strongest performer, contributing 4.9% to NMSIC’s one-year return.
• Energy was again the largest detractor to performance taking away -0.8% from NMSIC’s one-year return.
*The exhibit above provides the contribution to the overall composite real assets return by sector. The contribution by sector is a relative measure and is denoted as either positive or negative to the overall portfolio composite return. The contribution of an individual sector to the overall performance relates to the size of 6/30/16 exposure and its returns over the one-year period. Time weighted net returns and values are denoted as of 6/30/16; however, exposures change over the one-year period.
0.0%
1.0%
2.0%
3.0%
4.0%
5.0%
6.0%
Infrastructure ($356.2 M) /
9.8%
Timber ($211.3 M) /
0.5%
Agriculture ($81.3 M) /
-0.2%
Other ($36.2 M) /
-9.4%
Energy ($224.1 M) /
-1.7%
Total ($909.1 M) /
4.1%
Sector Contribution to One-Year Time Weighted Net Return as of 2Q16*
Down
Up
Total Return
NAV/One-Year net TWR

Appendix A: Additional 2Q16 Performance Measurement Report

Portfolio Status
• NMSIC’s real assets allocation target is 9% of total plan assets (based on market value). Current commitments represent 9.8% of total plan assets.
• Due to the closed-ended nature of many of the real asset commitments, NMSIC will seek additional commitments beyond its target allocation for each sub category within real assets (over-commitment factor).
• The real assets portfolio comprises six sub-sectors with target allocation ranges shown in the adjacent chart.
16
Real Assets Portfolio Allocation
As of 2Q16
Sub-Sector
Target Allocation
RangeCommitted Allocation*
Committed Value (millions)
Net Asset Value
Number of Commitments
Agriculture 0-15% 18.9% $325.0 $81.3 3Commodities 0-10% 0.0% $0.0 $0.0 0Energy 0-40% 34.9% $600.0 $224.1 9Infrastructure 0-40% 29.9% $515.0 $356.2 6Timberland 0-40% 21.8% $375.0 $211.3 4Other 0-15% 2.9% $49.8 $36.2 2
Total 108.4% $1,864.8 $909.1 24Al locations as a % of the 9% rea l assets target.

17
Real Assets Portfolio Performance – IRR Analysis
Total Performance
• The adjacent chart presents the inception to date value weighted net IRR’s of NMSIC’s real asset portfolio as well as the market value.
• Given the portfolio is relatively young, early returns were primarily attributable to strong performance from early energy investments with a small relative market value and more recently the infrastructure investments.
• As new commitments are made across asset classes and the portfolio becomes more diversified, overall performance is anticipated to continue to outperform the long-term Consumer Price Index (“CPI”) plus 300 basis points benchmark.
21.9
%
18.5
%
8.5%
3.4%
5.5%
$0
$200
$400
$600
$800
$1,000
0%
5%
10%
15%
20%
25%
December 2012
December 2013
December 2014
December 2015
June 2016
Mar
ket V
alue
in M
illio
ns $
IRR
%
NMSIC Real Asset Portfolio PerformanceInception to Date Net IRRs and Market Value
NMSIC Real Assets Net IRR (%) (left axis) Market Value ($) (right axis)

18
Real Assets Portfolio Cash Flows
Quarterly Cash Flow Activity
• During the quarter, NMSIC’s real asset managers called $140.3 million and distributed $8.0 million in income/gains (distributions) and return of capital distributions (withdrawals). The contributions were primarily from funding the Energy and Timber portfolios.
$725,000,000
$775,000,000
$825,000,000
$875,000,000
$925,000,000
2Q16 NAV Components - Real Assets Portfolio
19
Real Assets Portfolio Diversification
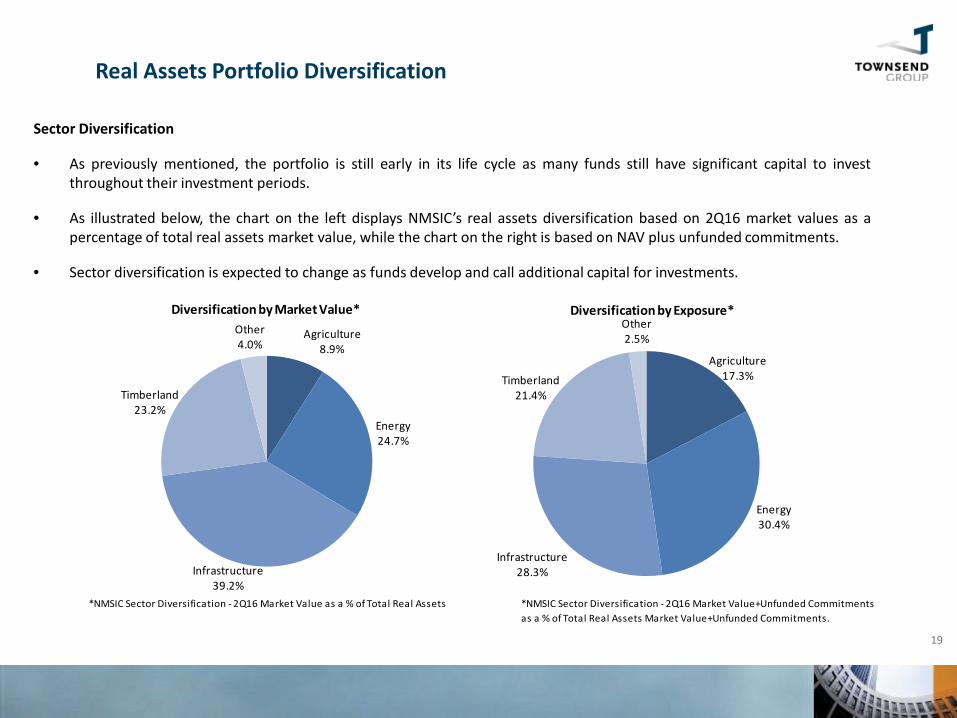
Sector Diversification
• As previously mentioned, the portfolio is still early in its life cycle as many funds still have significant capital to invest throughout their investment periods.
• As illustrated below, the chart on the left displays NMSIC’s real assets diversification based on 2Q16 market values as a percentage of total real assets market value, while the chart on the right is based on NAV plus unfunded commitments.
• Sector diversification is expected to change as funds develop and call additional capital for investments.
Agriculture8.9%
Energy24.7%
Infrastructure39.2%
Timberland23.2%
Other4.0%
Diversification by Market Value*
Agriculture17.3%
Energy30.4%
Infrastructure28.3%
Timberland21.4%
Other2.5%
Diversification by Exposure*
*NMSIC Sector Diversification - 2Q16 Market Value+Unfunded Commitments as a % of Total Real Assets Market Value+Unfunded Commitments.
*NMSIC Sector Diversification - 2Q16 Market Value as a % of Total Real Assets

20
Real Assets Portfolio Diversification
Global Geographic Diversification
• NMSIC’s real asset portfolio is currently weighted to developed Americas and more broadly to OECD countries which make up 86.7% of the portfolio.
• Emerging Americas currently represents investments in Brazil, Chile, and Mexico representing approximately 8.7%, 2.3% and 1.5% of current Real Assets Portfolio Net Asset Value, respectively.
• Many current and pending investments have global mandates and geographic diversification is expected to change as these commitments are drawn and NMSIC makes additional commitments going forward.
Developed Americas
66.2%
Developed Europe13.3%
Developed Asia5.0%
Emerging Americas12.7%
Emerging Europe0.4%
Emerging Asia2.2%
Emerging Middle East and Africa
0.1% Frontier0.0%Other
0.0%
Geographic Diversification by Market Value*
*NMSIC Global Geographic Diversification - 2Q16 Market Value as a % of Total Real Assets

Appendix B: Definitions

Definitions:
• Internal Rate of Return (“IRR”) – IRR is the average rate earned by each and every dollar invested during the period. This rate is influenced not only by movements in financial markets and decisions made by portfolio managers, but also by the timing and size of cash inflows and outflows and the beginning and ending market values.
• Time-Weighted Return (“TWR”) – A rate-of-return measure of portfolio performance that gives equal weight to each period regardless of any differences in amounts invested in each period. TWR are designed to eliminate the effect that the size and timing of cash flows has on the IRR since the pattern of cash flows varies significantly among funds.
22
New Mexico State Investment Council

Definitions (continued):
23
New Mexico State Investment Council
**Frontier is comprised of 151 countries mainly consisting of other developing countries not listed in the Emerging regions as well as Third World countries.
Developed Americas
(2)Developed Europe
(21)Developed Asia
(5)
Developed Middle East and Africa
(1)
Emerging Americas
(6)Emerging Europe
(5)Emerging Asia
(8)
Emerging Middle East and Africa
(3)Frontier**
(151)United States Austria Austra l ia Is rael Brazi l Czech Republ ic China Egypt Other Developing Canada Belgium Hong Kong Chi le Hungary India South Africa and Third World
Denmark Japan Colombia Morocco Indones ia Turkey counti resEngland New Zealand Mexico Poland South KoreaFinland Singapore Peru Russ ia Malays iaFrance Puerto Rico Phi l ippinesGermany TaiwanGreece Thai landIrelandIta lyLuxembourg NetherlandsNorthern Ireland NorwayPortugalScotlandSpainSwedenSwitzerlandUnited KingdomWales
Geographic Diversification

Definitions (continued):
• The NCREIF Timberland Property Index (NTI) – The NCREIF Timberland Property Index represents data collected from the Voting Members of the National Council of Real Estate Investment Fiduciaries (NCREIF). The NTI is an unlevered domestic index, gross of fees, that aggregates the returns of approximately 457 privately owned institutional investment properties valued at $24.2 billion as of 2Q16. All properties have been acquired, at least in part, on behalf of tax-exempt institutions and held in a fiduciary environment. The properties are wholly owned and joint venture investments consisting of Timberland properties only. Note that the NTI is not an investable or duplicable universe. Also, the NTI may not fully illustrate the performance of the institutional property universe.
• The NCREIF Timberland Fund and Separate Account (NFI-TFI) – The NCREIF Timberland Fund Index is a levered domestic capitalization-weighted index based on each Funds’ Net Asset Value, which represents data collected from the Voting Members of the National Council of Real Estate Investment Fiduciaries (NCREIF). The NFI-TFI is a gross and net of fees time-weighted return index consisting of commingled funds and individually managed accounts held in a fiduciary environment for taxable and tax-exempt investors, and mostly comprised of Timber, Timberland and cash equivalent assets, which are invested at 95% or more in the United States. The Funds comprised in the index may change if (i) existing Funds are removed from the index due to recurring underperformance, (ii) liquidation or termination, as well as (iii) entry of new Funds or new members of NCREIF. The NFI-TFI may not fully illustrate the performance of the institutional property universe.
• The NCREIF Farmland Property Index (NFI) – The NCREIF Farmland Property Index represents data collected from the Data Contributing Members of the National Council of Real Estate Investment Fiduciaries (NCREIF). The NFI is an unlevered domestic index, gross of fees, that aggregates the returns of approximately 696 privately owned institutional investment properties valued at $7.5 billion as of 2Q16. All properties have been acquired, at least in part, on behalf of tax-exempt institutions and held in a fiduciary environment. The properties are wholly owned and joint venture investments consisting of Agricultural properties only. Note that the NFI is not an investable or duplicable universe. Also, the NFI may not fully illustrate the performance of the institutional property universe.
24
New Mexico State Investment Council
Source: www.ncreif.org

Definitions (continued):
• The Consumer Price Index (CPI) – The Consumer Price Index illustrates monthly changes in the weighted average of prices of consumers’ good and services, excluding income taxes, financial instruments, and other saving-related items. Data is collected on a monthly basis by the Bureau of Labor Statistics (BSL economic assistants) in 87 urban areas nationwide and from approximately 80,000 items regrouped in more than 200 categories, which includes 24,000 retail and service establishments, as well as 50,000 landlords or tenants. The Consumer Expenditure Survey derives each item’s weight from their reported expenditures.
25
New Mexico State Investment Council
Source: www.bls.gov/cpi

Appendix C: 2Q16 Real Assets Flash Report

1,720,840,626 9.0% 909,138,981 4.8% 962,530,222 5.0% -150,828,577 -0.8%
TGRS TNET TGRS TNET TGRS TNET TGRS TNET4.6 4.0 6.5 4.1 8.1 4.7 22.3 16.51.6 4.1 4.1 4.3
Funding Status ($)Investment
Vintage YearCommitment
AmountFundedAmount
UnfundedCommitments
CapitalReturned
MarketValue
MarketValue (%)
Market Value+ Unfunded
Commitments (%)
Infrastructure 2012 515,000,000 363,840,905 174,290,805 65,641,094 356,190,236 39.2 28.3
Timber 2014 375,000,000 209,461,264 189,705,857 5,150,965 211,282,170 23.2 21.4
Agriculture 2014 325,000,000 95,725,242 242,930,495 13,663,084 81,316,342 8.9 17.3
Energy 2011 600,000,000 275,257,631 345,169,920 54,454,875 224,106,423 24.7 30.4
Other 2013 49,800,000 55,610,253 10,433,145 18,036,546 36,243,810 4.0 2.5
Total Current PortfolioNew Mexico State Investment Council Other Real Assets 2011 1,864,800,000 999,895,295 962,530,222 156,946,564 909,138,981 100.0 100.0
New Mexico State Investment Council Other Real Assets
5 Year (%)Performance Summary Quarter (%) 1 Year (%) 3 Year (%)
Other
CPI + 300 BPS
Infrastructure
Timber
Agriculture
Energy
19,120,451,399
New Mexico State Investment Council Other Real Assets
Second Quarter 2016Portfolio Composition ($)
Total Plan Assets Allocation Market Value Unfunded Commitments Remaining Allocation

INC APP TGRS TNET INC APP TGRS TNET INC APP TGRS TNET INC APP TGRS TNET TGRS TNET
InfrastructureInfrastructure 356,190,236 0.5 2.6 3.1 2.4 2.4 9.7 12.3 9.8 3.0 13.0 16.3 12.8 21.3 16.8 4Q12 10.8 1.2
TimberTimber 211,282,170 0.2 1.2 1.5 1.2 1.9 -1.8 0.1 0.5 7.8 6.6 1Q14 6.0 1.0
AgricultureAgriculture 81,316,342 0.0 3.4 3.4 2.6 1.5 4.7 6.3 -0.2 0.7 -14.9 4Q14 -1.2 1.0
EnergyEnergy 224,106,423 0.7 11.8 12.5 11.3 7.3 -5.4 1.7 -1.7 5.9 -5.5 0.2 -2.8 5.8 9.1 15.3 10.5 16.2 10.7 2Q11 0.8 1.0
OtherOther 36,243,810 1.1 0.5 1.6 1.6 5.5 -15.8 -10.9 -9.4 14.3 -7.9 5.3 0.9 6.2 0.2 2Q13 -2.1 1.0
Total PortfolioNew Mexico State Investment Council Other Real Assets 909,138,981 0.5 4.2 4.6 4.0 3.6 2.8 6.5 4.1 4.5 3.6 8.1 4.7 5.0 16.8 22.3 16.5 22.9 16.4 2Q11 5.5 1.1
IndicesCPI + 300 BPS 1.6 4.1 4.1 4.3 4.4 2Q11NCREIF Timberland Property Index “NTI” 0.7 0.4 1.1 2.6 0.9 3.5 2.7 5.0 7.8 2.7 3.9 6.7 6.5 2Q11NCREIF Fund Index –Timberland Fund Index “NFI-TFI Commingled Value Weight” 2.0 0.9 -0.4 -1.9 5.5 4.4 5.1 4.0 4.9 3.9 2Q11NCREIF Farmland Property Index “NFI” 0.6 0.6 1.2 5.3 4.3 9.7 7.0 5.5 12.8 7.3 7.6 15.2 14.7 2Q11CPI 0.8 1.1 1.1 1.3 1.4 2Q11
NetIRR
EquityMultiple
New Mexico State Investment Council Other Real Assets
Second Quarter 2016
Returns (%)Market Value
($)Quarter 1 Year 3 Year 5 Year Inception TWR
CalculationInception

Advisory Disclosures and Definitions
Disclosure Proprietary information prepared for the use of The New Mexico State Investment Council. Past performance is not indicative of future results. Investing involves risk, including the possible loss of principal. Returns are presented on a time weighted basis and shown both gross and net of underlying third party fees and expenses and may include income, appreciation and/or other earnings. In addition, investment level Net IRR’s and equity multiples are reported. The Townsend Group, on behalf of its client base, collects quarterly limited partner/client level performance data based upon inputs from the underlying investment managers. Data collection is for purposes of calculating investment level performance as well as aggregating and reporting client level total portfolio performance. Quarterly limited partner/client level performance data is collected directly1 from the investment managers via a secure data collection site.
1In select instances where underlying investment managers have ceased reporting limited partner/client level performance data directly to The Townsend Group via a secure data collection site, The Townsend Group may choose to input performance data on behalf of its client based upon the investment managers quarterly capital account statements which are supplied to The Townsend Group and the client alike.