the new mexico state investment council (“nmsic”) · • a pullback in multifamily construction...
TRANSCRIPT

The New Mexico State Investment Council (“NMSIC”) First Quarter 2016: Real Estate Performance Measurement Report
Proprietary & Confidential July 2016

1) Real Estate Market Updates
2) Performance Measurement Highlights 1Q 2016
Appendix:
A. Additional 1Q 2016 Performance Attribution
B. Definitions
C. Flash Report: 1Q 2016
Table of Contents
Disclaimer: This is a public version of the original Performance Measurement Presentation, portions of which have been removed for confidentiality purposes.

1. Real Estate Market Updates

General • Economic activity increased during the first quarter of 2016 at an annual rate of 0.8%, 30 bps above
initial estimates and 2% over 1Q15 levels. Growth during the quarter was supported by positive contributions by the consumer and government sectors. Business investment and net trade however, subtracted from growth during the quarter.
• The consumer sector remained a bright spot in 1Q16, with goods and services expenditure broadly
rising at moderate rates. The labor market also remained relatively upbeat during the quarter. Wages held at about 2.4% y/y growth and employment growth as at 1Q was 3% with a declining trend in initial jobless claims. The same cannot be said for the business sector as capital investment saw a 19% decline from prior year levels. Contracting industrial activity and tighter credit made for a subdued industrial and investment growth environment as reflected in measures of industrial activity such as the PMI (49.8 with 50 as baseline of no sequential growth), Industrial Production Index (-1.07% y/y), and manufacturing orders (-1.8% y/y).
• Macro indicators for real estate remained solid during 1Q16 however, with residential housing starts
and total construction investment rising 17% and 9% y/y respectively although building permits decelerated to a 5.2% y/y growth rate.
Commercial Real Estate • 1Q16 saw $58.5 billion in commercial real estate transaction volume or 44% of global activity. While
solid, this represented a 16% drop vs. 1Q15 which was a cycle high and thus offered a difficult comparison. The U.S. decline was in line with the broad moderating of transaction activity globally during the quarter.
• CMBS issuances declined to $38.7 billion in 1Q16 from 4Q15’s $44.9 billion and 11% down from year
ago levels. Credit conditions continue to tighten as The Fed’s survey of senior loan officers points to stronger demand but tighter standards for commercial real estate loans.
• The U.S. continues to be a top target for transactions activity. Three of the top five cities in transaction
volume (New York, Los Angeles, and Washington DC) accounted for 14% of global transactions. Foreign investment represented approximately 9% of total U.S. activity, a 10 percentage point decrease from 1Q15 with office properties making up about half of all foreign acquisitions during the quarter.
• Transaction cap rates for all traditional property sectors declined between 11 and 32 bps y/y, except
for the hotel sector that saw a 29 bps expansion. On a per square foot basis, transaction pricing was mixed with retail and hotel properties seeing double digit price declines whilst industrial and multifamily logged mid single digit increases.
United States Real Estate Market Update (1Q16)
Sources: Bureau of Economic Analysis, Federal Reserve Board, U.S. Census Bureau, NCREIF, CBRE Global Research and Consulting, Jones Lang LaSalle, Real Capital Analytics, Bloomberg LP.
Source: NCREIF
Source: NCREIF
4
5
6
7
8
9
10 Current Value Cap Rates by Property Type
Apartment Industrial Office Retail
-15
-10
-5
0
5
10
15
20 4-Qtr Rolling NOI Growth by Property Type
Apartment Industrial Office Retail
4

United States Property Matrix (1Q16)
INDUSTRIAL MULTIFAMILY
• Net absorption for 1Q16 was 7.3% higher than new construction causing the vacancy rate to
decline 6.2%, 10 bps lower than year-end 2015 and now represents a 16-year low.
• First quarter y/y investment volumes were down 52.5%, however removing the largest transaction in segment history, volumes were only down 11.4% and still remain 10.2% above the 10-year average for the first-quarter.
• Investment strategies have undergone a complete shift from portfolio transactions to single-asset acquisitions which now represent 74% of investment volume.
• Only 2.9% of deals exceeded $150 million in 1Q16 compared to 56.4% for 2015. The scarcity of large-scale portfolio availability has caused cross-border investors to fall from 40.5% of total volume in 2015 to 5.3% in 1Q16.
• As of 1Q16, industrial properties returned 2.96% and outperformed the NPI by 75 bps.
• Investment for 1Q16 totaled $35.4 billion, 8.6% above 1Q15 and represents the largest 1Q
volume on record.
• Vacancy finished the year at 4.4%, lower than the previous cycle peak of 5.7% from 2005 and 2007. Rents growth increased 80 bps y/y nationally to 4.7%, despite supply beginning to soften in select markets.
• A pullback in multifamily construction is indicated by the six-month trend of construction starts falling at or below the 12-month rolling average. The seasonally adjusted annualized rate was down for the third consecutive month and 12.4% lower y/y.
• The apartment sector delivered a 1.87% return during the quarter, underperforming the NPI by 34 bps.
OFFICE RETAIL
• The office segment experienced 1.0% y/y growth, with $35.4 billion in reported capital
markets activity, making 1Q16 the second most active quarter in the last five years.
• Development volume increased by 9.7 million square feet, which represents a 31.8% sequential increase, bringing the total development pipeline to 96.8 million square feet.
• With 7.7 million square feet of absorption and rents increasing by 3.2%, real estate fundamentals remain strong. The slowdown from 2015 in absorption activity is primarily from supply constraints caused by a lack of expansionary activity.
• Cap rates continue to compress, with nearly 94% of markets seeing compressing or stabilizing yields. Cap rates have declined 30 bps in the last 12 months from 4.8% to 4.5%
• The office sector returned 1.72% in 1Q16, 49 bps below the NPI.
• Retail activity decreased 25.8% y/y to $17.4 billion. Full-year activity is expected to increase
with development activity increasing by 18.1% to 29.4 million square feet from 4Q15.
• Macroeconomic factors and high prices are shifting investor focus from primary to secondary markets for urban retail. Investment volumes in primary markets declined by 68.6% to $1.3 billion from 1Q15, while secondary markets increased by 186.7%, reaching $388.7 million.
• Grocery-anchored investment volume has steadily increased since 2012 to a cycle peak of $5.9 billion in 2015. Despite this trend, grocery-anchored sale volumes were down 27.6% from 4Q15.
• As of 1Q16, the retail sector delivered a quarterly return of 2.96%, beating the NPI by 75 bps.
Sources: Cushman & Wakefield, Jones Lang LaSalle, Bloomberg LP, NCREIF, REIS
5

Global • Global investment activity cooled broadly in 1Q16 to $133 billion, down 14% y/y
coming off a record 2015. Global equity market and geopolitical uncertainty surrounding China and Emerging Markets in general, as well as events such as ‘Brexit’ and the U.S. Elections contributed to the dampening in investment during the quarter.
• New York City saw the highest transaction volume ($9.9 bn) with London dropping to third place behind Los Angeles at $6.1 bn and $5.8 bn respectively. Washington DC and Hong Kong rounded out the top five cities during the quarter.
Europe • First Quarter commercial real estate transaction volume in Europe was €50.3
billion. This represents a decrease of 16.9% compared to 1Q15. • 1Q16 also saw a decline in foreign investment capital (-26% y/y), most notably
from North America (-56% y/y), with U.S. investment falling from €8.3 million in 1Q15 to €4.3 million in 1Q16. Non-European buyers represented only 19% of the market, compared to 27% in 1Q15.
• There is a high level of cross-border investment within the top ten European cities. A prime example is London, where 60% of investments came from foreign buyers. These top ten cities also accounted for 69% of all Asian investment keeping with the theme of foreign investors favoring primary markets.
• Subsequent to quarter end, the Brexit vote has created volatility and uncertainty. Asia • Asia Pacific investment ended the first quarter at $24 billion, down 4% compared
to the prior year. Investment in China was up 10% y/y to $2.8 billion with continued divergence between primary and secondary cities. While institutional capital generally seeks core stabilized assets in primary cities, opportunities exist in distressed and secondary market assets.
• Investment in Australia grew 33% y/y to $3.3 billion, driven by foreign capital within the region looking for high quality, relatively high yielding, and stable markets. Investment in Japan ended the quarter in contraction (-26% y/y) as its economy stalls despite continued central bank stimulus, although low costs of credit could support future transaction demand.
• Hong Kong recorded $2.9 billion in investment during 1Q, more than double year ago levels while Singapore saw increased vacancies and new supply dampen investor outlook.
• India continues to experience year-over-year contraction in transaction activity as investors deem debt and development preferable to direct investment primarily due to a lack of quality assets.
Global Real Estate Market Update (1Q16)
Sources: Jones Lang LaSalle, CBRE Global Research and Consulting, Bloomberg LP
Direct Commercial Real Estate Investment - Regional Volumes, 2014-2016
$ US Billions Q4 15 Q1 16% Change
Q4 15 - Q1 16 Q1 15% Change
Q1 15 - Q1 16 YTD 2014 YTD 2015
% Change YTD 2015 - YTD 2016
Americas 85 61 -28% 73 -16% 302 314 4%EMEA 90 48 -47% 57 -16% 279 267 -4%Asia Pacific 36 24 -33% 25 -4% 131 123 -6%Total 211 133 -37% 155 -14% 712 704 -1%Source: Jones Lang LaSalle, June 2016
Global Outlook - GDP (Real) Growth % pa, 2015-20172015 2016 2017
Global 3.1 3.0 3.2Asia Pacific 4.8 4.7 4.7
Australia 2.5 2.6 2.9China 6.9 6.5 6.3India 7.3 7.5 7.6Japan 0.6 0.5 0.5
North America 2.3 1.8 2.3US 2.4 1.8 2.3
MENA* 3.4 2.5 2.9European Union 2.0 1.8 1.9
France 1.3 1.4 1.5Germany 1.7 1.6 1.6UK 2.3 1.9 2.1
*Middle East North Africa Source: Bloomberg LP, June 2016
6

• Since the end of the GFC, the U.S. market has experienced strong economic expansion galvanized by favorable macro fundamentals and rising FDI volumes, given the lagging recovery experienced across Europe. As a result, the continuous growth of the U.S. market has been reflected in global currency movements characterized by a steady rise in USD compared to other major currencies since 2H14.
• The U.S. Dollar has been experiencing fast growth since 2H14. At quarter-end the British Pound (GBP)/USD and Euro (EUR)/USD exchange rates were 13% and 6% higher than their 25-year average, respectively.
• The USD appreciation is negatively correlated with the cost of imports and has been favorable to local investors and consumers. The decrease in oil prices has been influenced to some extent by the rise in USD and had similar effects to a tax-break on U.S consumers.
• Worries continue in Great Britain due to the recent decision to leave the European Union. Volatility is expected to be the norm while uncertainty remains. In the meantime, the British Pound continues to weaken against the U.S. dollar and has fallen to 0.75 GBP/USD as of 2Q16 (post Brexit vote). As of 2Q16, the Euro has also sharply weakened against the U.S. dollar to 0.90 EUR/USD.
• U.S. investors with foreign investments have been experiencing short-term fluctuations on their international returns when translated into USD. This trend continued during 1Q16 with the U.S. dollar increasing in value against the British Pound while weakening against the Euro, Australian Dollar and Brazilian Real.
Currency Effects - Market Trends (1Q16)
7
0.4
0.6
0.8
1.0
1.2
1.4
Mar
-91
Mar
-92
Mar
-93
Mar
-94
Mar
-95
Mar
-96
Mar
-97
Mar
-98
Mar
-99
Mar
-00
Mar
-01
Mar
-02
Mar
-03
Mar
-04
Mar
-05
Mar
-06
Mar
-07
Mar
-08
Mar
-09
Mar
-10
Mar
-11
Mar
-12
Mar
-13
Mar
-14
Mar
-15
Mar
-16
EUR/
USD
Rat
es
EURO-USD Rates over 25 Years
25 year Average: 0.83 EUR/USD
Max: 10/25/20001.21 EUR/USD
Min: 4/22/20080.63 EUR/USD
3/31/2016 0.88 EUR/USD
0.4
0.45
0.5
0.55
0.6
0.65
0.7
0.75
Mar
-91
Mar
-92
Mar
-93
Mar
-94
Mar
-95
Mar
-96
Mar
-97
Mar
-98
Mar
-99
Mar
-00
Mar
-01
Mar
-02
Mar
-03
Mar
-04
Mar
-05
Mar
-06
Mar
-07
Mar
-08
Mar
-09
Mar
-10
Mar
-11
Mar
-12
Mar
-13
Mar
-14
Mar
-15
Mar
-16
GBP/
USD
Rat
es
GBP-USD Rates over 25 Years
25 year Average: 0.61 GBP/USD
Min: 11/8/20070.47 GBP/USD
Max: 1/25/20090.73 GBP/USD
3/31/20160.70 GBP/USD
2. Performance Measurement Highlights: 1Q 2016

• New Mexico State Investment Council’s (NMSIC) current target allocation to real estate is 10.0%. NMSIC’s 1Q16 real estate market value represents 8.6% of total fund assets.
• The real estate portfolio continues to grow and provide positive performance. As of 1Q16, NMSIC outperformed the NFI-ODCE Index on a net basis over the quarter, one-, and three-year periods. Net underperformance over the five-year was primarily due to underperformance by the Legacy Portfolio; however, five-year net performance has improved considerably from last year (180 bps above 1Q15) compared to the NFI-ODCE (120 bps below 1Q15).
• While the portfolio outperforms the benchmark over the short and medium term periods on a net basis, underperformance over the five-year period can be attributed to the legacy portfolio including:
– Underexposure to high quality core investments over the long term;
– Poor quality and high risk manager selection;
– Overexposure to higher risk, non-core investments including non-strategic JVs; and
– Investment concentration in poor performing vintage years.
• NMSIC real estate commitments made since 2011 (inception of rebalancing) have been accretive to the real estate portfolio, resulting in a net time weighted return of 16.6% (versus 12.6% NFI-ODCE) over the one-year period.
Portfolio Highlights
9
As of 1Q16 Quarter One-Year Three-Year Five-Year TGRS TNET TGRS TNET TGRS TNET TGRS TNET
NMSIC* 2.4 2.0 17.9 15.1 16.4 13.7 14.2 11.9
NFI-ODCE Value Weight* 2.2 2.0 13.7 12.6 13.6 12.6 13.3 12.2
Over/Under Performance 0.2 0.0 4.2 2.5 2.8 1.1 1.0 -0.3 *Time Weighted Returns over the quarter, one-, three-, and five-year periods.

• As of 1Q16, NMSIC’s portfolio consisted of 58% exposure to core investments and 42% exposure to tactical investments, on a NAV basis.
• During the quarter, managers called approximately $33.6 million across the core and tactical investments; return-of-capital combined with income distributions totaled $45.1 million, bringing total distributions to $213.8 million over the last 12 months.
• Strategic Core Portfolio
– Since December 2011, eight strategic core commitments have been made, totaling $910.0 million.
• Per the pacing model and NMSIC’s investment requirements, no additional core commitments will be required in the future, unless modifications occur in NMSIC’s allocation policy. Townsend will continue to consider rebalancing initiatives.
• Tactical Portfolio
– Since December 2011, approximately $1.1 billion has been committed to 18 tactical investments, including $200.0 million to three tactical investments in 2015 and approximately $100.0 million to one Europe focus tactical investment in 2016.
Portfolio Highlights
10
11
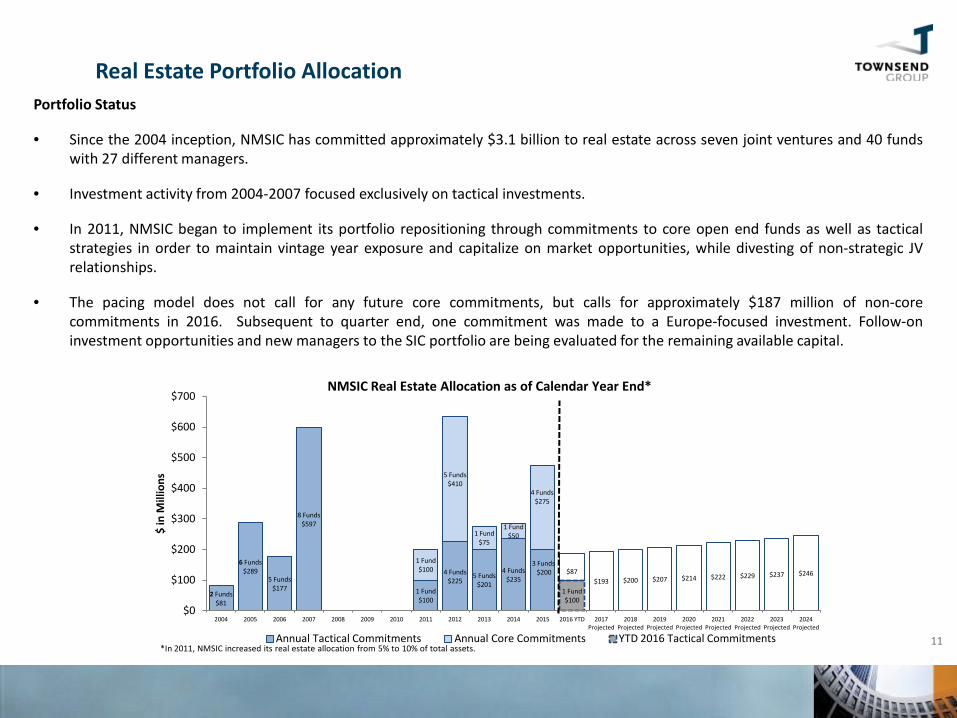
Real Estate Portfolio Allocation Portfolio Status
• Since the 2004 inception, NMSIC has committed approximately $3.1 billion to real estate across seven joint ventures and 40 funds with 27 different managers.
• Investment activity from 2004-2007 focused exclusively on tactical investments.
• In 2011, NMSIC began to implement its portfolio repositioning through commitments to core open end funds as well as tactical strategies in order to maintain vintage year exposure and capitalize on market opportunities, while divesting of non-strategic JV relationships.
• The pacing model does not call for any future core commitments, but calls for approximately $187 million of non-core commitments in 2016. Subsequent to quarter end, one commitment was made to a Europe-focused investment. Follow-on investment opportunities and new managers to the SIC portfolio are being evaluated for the remaining available capital.
2 Funds $81
6 Funds $289
5 Funds $177
8 Funds $597
1 Fund $100
4 Funds $225
5 Funds $201
4 Funds $235
1 Fund $100
5 Funds $410
1 Fund $75
1 Fund $50
3 Funds $200
1 Fund $100
4 Funds $275
$87
$193 $200 $207 $214 $222 $229 $237 $246
$0
$100
$200
$300
$400
$500
$600
$700
2004 2005 2006 2007 2008 2009 2010 2011 2012 2013 2014 2015 2016 YTD 2017 Projected
2018 Projected
2019 Projected
2020 Projected
2021 Projected
2022 Projected
2023 Projected
2024 Projected
$ in
Mill
ions
NMSIC Real Estate Allocation as of Calendar Year End*
Annual Tactical Commitments Annual Core Commitments YTD 2016 Tactical Commitments *In 2011, NMSIC increased its real estate allocation from 5% to 10% of total assets.

12
Real Estate Portfolio Performance
Performance
• The NMSIC real estate portfolio seeks to outperform the NFI-ODCE (net of fees) on a time weighted return basis over a rolling five-year period.
• Underperformance over the five-year timeframe has been impacted by vintage year exposure and investment selection in NMSIC Legacy Holdings1.
1NMSIC Legacy Holdings represent investments made prior to the rebalancing initiative beginning 1Q 2011.
2.0%
15.1%
13.7%
11.9%
5.1%
2.0%
12.6% 12.6% 12.2%
3.4%
13.6% 13.4% 12.7%
0%
2%
4%
6%
8%
10%
12%
14%
16%
Quarter One-Year Three-Year Five-Year Value Weighted Since Inception Net IRR
NMSIC Total Portfolio Performance* As of March 31, 2016
NM SIC (net) NFI-ODCE (net) Portfolio Weighted Benchmark (net)** *Time Weighted Returns over the quarter, one-, three-, and five-year periods. **Portfolio Weighted Benchmark is a market weighted combination of the ODCE, Townsend Value-Added Fund Index, and Townsend Opportunistic Fund Index based on NMSIC's market weights. 4Q15 data is used for the Portfolio Weighted Benchmark due to timing of this report.

13
Real Estate Portfolio Performance – New Commitments Since 2011
Performance
• New commitments made since 2011 are positively contributing to portfolio performance. As of 1Q16, these investments represent approximately 89% of NMSIC real estate NAV.
• Over the past one and three-year periods, new commitments have generated net time-weighted returns of 16.6% and 15.2%, respectively, outperforming the benchmark by 400 and 260 basis points, respectively. Overall, new investments have generated a 14.7% net IRR compared to a -0.4% net IRR from the legacy portfolio, over the since inception period.
• The total portfolio’s one and three-year returns were negatively affected by NMSIC’s legacy holdings, detracting approximately -1.5% of total performance, for each period.
2.1%
16.6%
15.2% 14.7%
2.0%
12.6% 12.6%
3.4%
13.6% 13.4%
0%
2%
4%
6%
8%
10%
12%
14%
16%
18%
Quarter One-Year Three-Year Value Weighted Since Inception Net IRR
NMSIC Performance of New Commitments* As of March 31, 2016
New Commitments Since 2011 (net) NFI-ODCE (net) Portfolio Weighted Benchmark (net)** *Time Weighted Returns over the quarter, one-, three-, and five-year periods. **Portfolio Weighted Benchmark is a market weighted combination of the ODCE, Townsend Value-Added Fund Index, and Townsend Opportunistic Fund Index based on NMSIC's market weights. 4Q15 data is used for the Portfolio Weighted Benchmark due to timing of this report.
Appendix A: Additional 1Q 2016 Performance Attribution
Portfolio Status
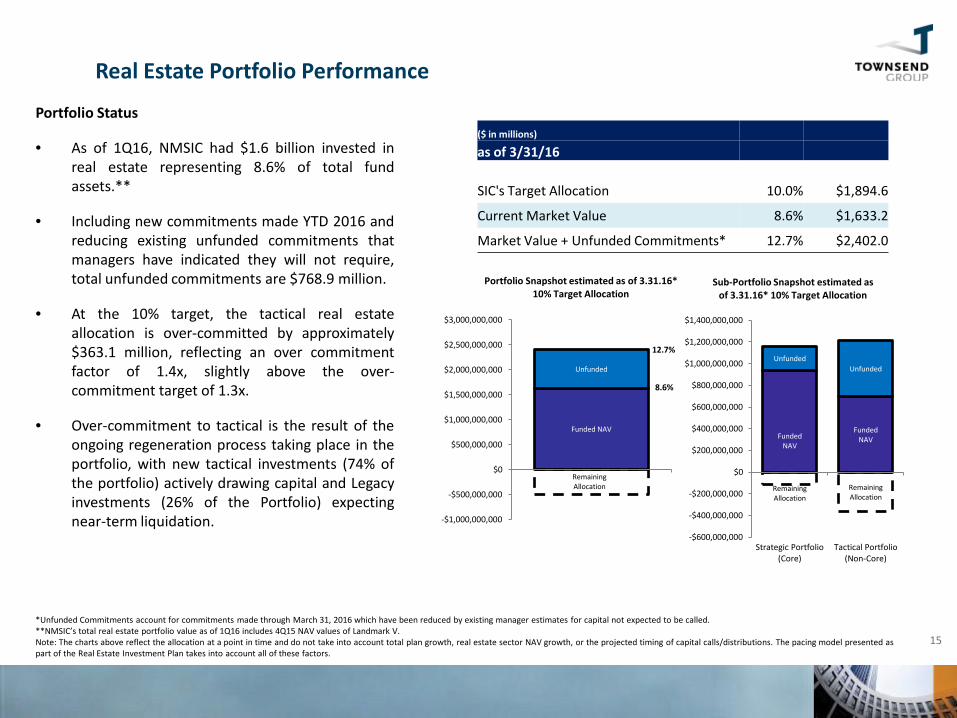
• As of 1Q16, NMSIC had $1.6 billion invested in real estate representing 8.6% of total fund assets.**
• Including new commitments made YTD 2016 and reducing existing unfunded commitments that managers have indicated they will not require, total unfunded commitments are $768.9 million.
• At the 10% target, the tactical real estate allocation is over-committed by approximately $363.1 million, reflecting an over commitment factor of 1.4x, slightly above the over-commitment target of 1.3x.
• Over-commitment to tactical is the result of the ongoing regeneration process taking place in the portfolio, with new tactical investments (74% of the portfolio) actively drawing capital and Legacy investments (26% of the Portfolio) expecting near-term liquidation.
15
Real Estate Portfolio Performance
*Unfunded Commitments account for commitments made through March 31, 2016 which have been reduced by existing manager estimates for capital not expected to be called. **NMSIC’s total real estate portfolio value as of 1Q16 includes 4Q15 NAV values of Landmark V. Note: The charts above reflect the allocation at a point in time and do not take into account total plan growth, real estate sector NAV growth, or the projected timing of capital calls/distributions. The pacing model presented as part of the Real Estate Investment Plan takes into account all of these factors.
($ in millions) as of 3/31/16 SIC's Target Allocation 10.0% $1,894.6
Current Market Value 8.6% $1,633.2
Market Value + Unfunded Commitments* 12.7% $2,402.0
Funded NAV
Unfunded
Remaining Allocation
-$1,000,000,000
-$500,000,000
$0
$500,000,000
$1,000,000,000
$1,500,000,000
$2,000,000,000
$2,500,000,000
$3,000,000,000
Portfolio Snapshot estimated as of 3.31.16* 10% Target Allocation
8.6%
12.7%
Funded NAV
Funded NAV
Unfunded Unfunded
Remaining Allocation
Remaining Allocation
-$600,000,000
-$400,000,000
-$200,000,000
$0
$200,000,000
$400,000,000
$600,000,000
$800,000,000
$1,000,000,000
$1,200,000,000
$1,400,000,000
Strategic Portfolio (Core)
Tactical Portfolio (Non-Core)
Sub-Portfolio Snapshot estimated as of 3.31.16* 10% Target Allocation
16
Real Estate Portfolio Domestic and International Exposure
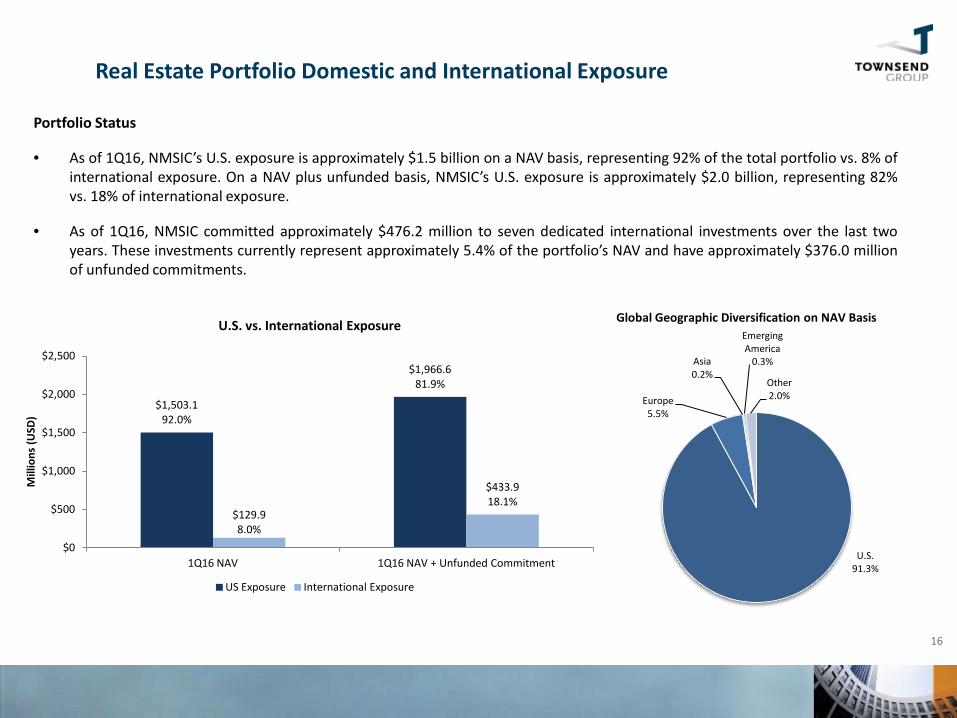
Portfolio Status
• As of 1Q16, NMSIC’s U.S. exposure is approximately $1.5 billion on a NAV basis, representing 92% of the total portfolio vs. 8% of international exposure. On a NAV plus unfunded basis, NMSIC’s U.S. exposure is approximately $2.0 billion, representing 82% vs. 18% of international exposure.
• As of 1Q16, NMSIC committed approximately $476.2 million to seven dedicated international investments over the last two years. These investments currently represent approximately 5.4% of the portfolio’s NAV and have approximately $376.0 million of unfunded commitments.
U.S. 91.3%
Europe 5.5%
Asia 0.2%
Emerging America
0.3%
Other 2.0%
Global Geographic Diversification on NAV Basis
$1,503.1 92.0%
$1,966.6 81.9%
$129.9 8.0%
$433.9 18.1%
$0
$500
$1,000
$1,500
$2,000
$2,500
1Q16 NAV 1Q16 NAV + Unfunded Commitment
Mill
ions
(USD
)
U.S. vs. International Exposure
US Exposure International Exposure

Portfolio Status
• Included in the pacing model presented as part of the Real Estate Investment Plan, a number of NMSIC’s existing investments are selling assets and are projecting to be fully realized over the next 12 to 24 months (see slide 18-19 for more details on Legacy Investments).
• Based on 1Q16 market values, the chart below provides a projection of how much capital NMSIC is likely to receive over this time frame. The projections rely on individual manager feedback as well as life of fund assumptions.
• Based on current market values, approximately 30% of Value-Added investments and 22% of Opportunistic investments are projected to be distributed over the next two years, totaling an estimated value between $150-200 million.
17
Real Estate Portfolio Performance
$0
$200
$400
$600
$800
$1,000
Strategic Core Tactical Non-Core
1Q16
Mar
ket V
alue
Existing Portfolio Projected Exits / Sales Over the next 12-24 Months (Market Value)
Remaining Market Value Projected Exits/Sales
Target Allocation - Strategic Core: $1,042 m Target Allocation -
Tactical: $853 m

18
Real Estate Portfolio Performance – Portfolio One-Year Attribution
One-Year Time Weighted Return Performance
• The charts below show the contribution of each the New Portfolio and the Legacy Portfolio to the total one-year net return, as well as the return contribution of each portfolio by asset risk type.
• Over the one-year period, the New Portfolio was the main driver of NMSIC’s total net return. The New Portfolio’s share of return was 14.2% vs. 1.0% from the Legacy Portfolio. The New Portfolio continues to grow as new commitments are made, which further minimize the effects of the Legacy Portfolio on shorter-term returns.
• Over the one-year period, the Strategic Core Portfolio represented 8.4% of NMSIC’s one-year net return and had the largest impact on the portfolio shorter-term returns due to its weight combined with strong returns.
15.1%
8.4%
4.2%
2.3% 0.3%
0.0%
2.0%
4.0%
6.0%
8.0%
10.0%
12.0%
14.0%
16.0%
18.0%
Strategic Core ($940.2 M / 14.6%)
Tactical Value Add ($313.6 M / 21.5%)
Tactical Opportunistic ($331.9 M / 11.2%)
Tactical Credit ($47.5 M / 10.0%)
Total NMSIC ($1.6 B / 15.1%)
1Q16 One-Year Net Contribution by Risk Type
NAV/One-Year net TWR
15.1%
1.0%
14.2%
0.0%
2.0%
4.0%
6.0%
8.0%
10.0%
12.0%
14.0%
16.0%
Legacy Portfolio ($183.0 M / 6.9%)
New Portfolio ($1.4 B / 16.6%)
Total NMSIC ($1.6 B / 15.1%)
1Q16 One-Year Net Contribution Legacy and New Investments
NAV/One-Year net TWR

19
Real Estate Portfolio Performance – Legacy Investment Distributions
• The charts below illustrate changes in the Legacy Investments since 2010, as well as expected distributions from the Legacy Investments from 2015 to 2017*.
• Out of nine remaining investments, two are expected to be fully liquidated by year-end 2016.
*Charts based on managers’ projections.
$0
$100
$200
$300
$400
$500
$600
$700
$ in
Mill
ions
2010 - 1Q16 NAV Components - Real Estate Legacy Portfolio
$183 m
$6 m $6 m
$147 m
$0
$20
$40
$60
$80
$100
$120
$140
$160
$180
$200
3/31 NAV 2016 Dist. 2016-2017 Dist.
In m
illio
n ($
)
Legacy Portfolio Expected Distribution - 2016 As of March 31, 2016
3Q16 NAV Actual Distributions Projected Distributions
20
Real Estate Portfolio Performance – Diversification
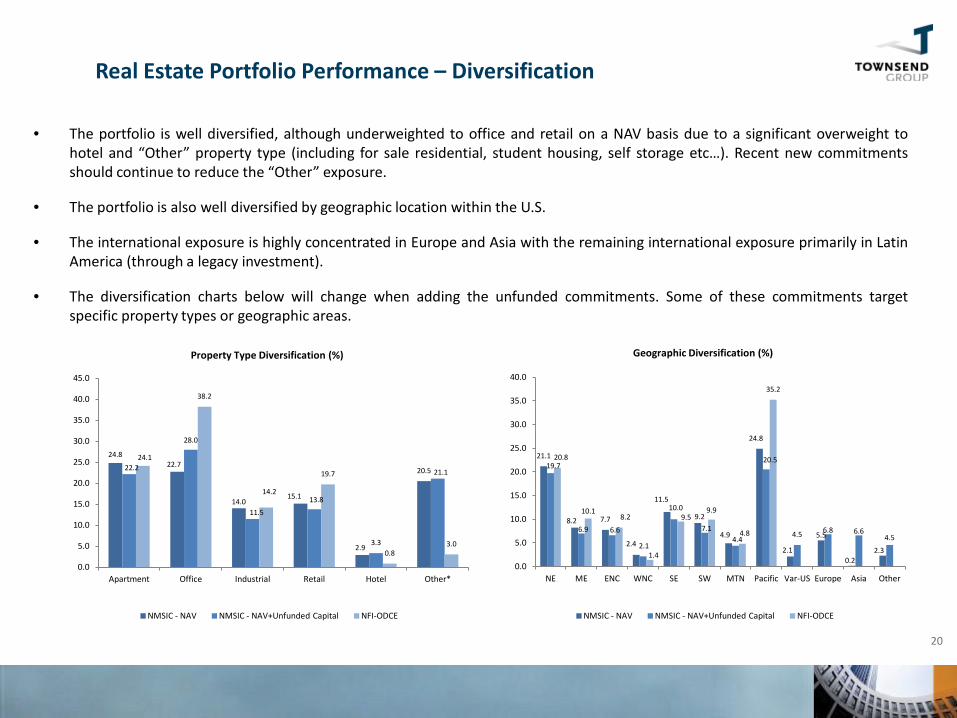
• The portfolio is well diversified, although underweighted to office and retail on a NAV basis due to a significant overweight to hotel and “Other” property type (including for sale residential, student housing, self storage etc…). Recent new commitments should continue to reduce the “Other” exposure.
• The portfolio is also well diversified by geographic location within the U.S.
• The international exposure is highly concentrated in Europe and Asia with the remaining international exposure primarily in Latin America (through a legacy investment).
• The diversification charts below will change when adding the unfunded commitments. Some of these commitments target specific property types or geographic areas.
24.8 22.7
14.0 15.1
2.9
20.5 22.2
28.0
11.5
13.8
3.3
21.1
24.1
38.2
14.2
19.7
0.8 3.0
0.0
5.0
10.0
15.0
20.0
25.0
30.0
35.0
40.0
45.0
Apartment Office Industrial Retail Hotel Other*
Property Type Diversification (%)
NMSIC - NAV NMSIC - NAV+Unfunded Capital NFI-ODCE
21.1
8.2 7.7
2.4
11.5
9.2
4.9
24.8
2.1
5.5
0.2 2.3
19.7
6.9 6.6
2.1
10.0
7.1 4.4
20.5
4.5 6.8 6.6 4.5
20.8
10.1 8.2
1.4
9.5 9.9
4.8
35.2
0.0
5.0
10.0
15.0
20.0
25.0
30.0
35.0
40.0
NE ME ENC WNC SE SW MTN Pacific Var-US Europe Asia Other
Geographic Diversification (%)
NMSIC - NAV NMSIC - NAV+Unfunded Capital NFI-ODCE

Appendix B: Definitions
Definitions:
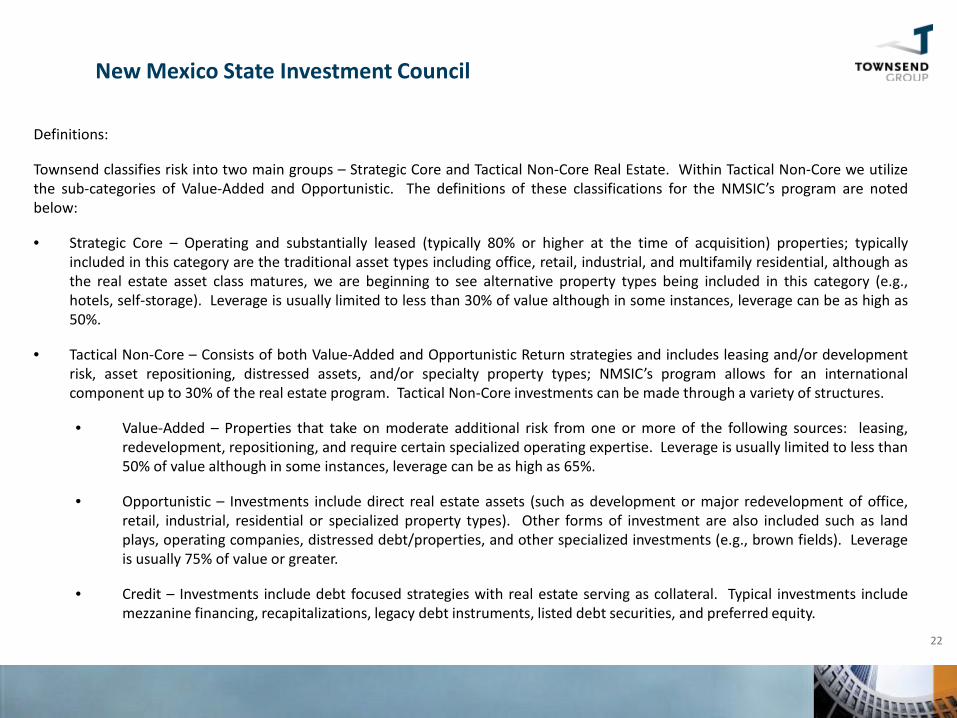
Townsend classifies risk into two main groups – Strategic Core and Tactical Non-Core Real Estate. Within Tactical Non-Core we utilize the sub-categories of Value-Added and Opportunistic. The definitions of these classifications for the NMSIC’s program are noted below:
• Strategic Core – Operating and substantially leased (typically 80% or higher at the time of acquisition) properties; typicallyincluded in this category are the traditional asset types including office, retail, industrial, and multifamily residential, although asthe real estate asset class matures, we are beginning to see alternative property types being included in this category (e.g.,hotels, self-storage). Leverage is usually limited to less than 30% of value although in some instances, leverage can be as high as50%.
• Tactical Non-Core – Consists of both Value-Added and Opportunistic Return strategies and includes leasing and/or developmentrisk, asset repositioning, distressed assets, and/or specialty property types; NMSIC’s program allows for an internationalcomponent up to 30% of the real estate program. Tactical Non-Core investments can be made through a variety of structures.
• Value-Added – Properties that take on moderate additional risk from one or more of the following sources: leasing,redevelopment, repositioning, and require certain specialized operating expertise. Leverage is usually limited to less than50% of value although in some instances, leverage can be as high as 65%.
• Opportunistic – Investments include direct real estate assets (such as development or major redevelopment of office,retail, industrial, residential or specialized property types). Other forms of investment are also included such as landplays, operating companies, distressed debt/properties, and other specialized investments (e.g., brown fields). Leverageis usually 75% of value or greater.
• Credit – Investments include debt focused strategies with real estate serving as collateral. Typical investments includemezzanine financing, recapitalizations, legacy debt instruments, listed debt securities, and preferred equity.
22
New Mexico State Investment Council

Definitions (continued):
• Townsend Portfolio Weighted Index – This Index is a combination of the equal weighted ODCE, Townsend Value Added FundIndex, Townsend Opportunistic Return Fund Index. The equal weighted Index provides a comparison of the investable universesince the NMSIC initiated its real estate portfolio.
• The NCREIF Property Index (NPI) – The NCREIF Property Index represents data collected from the Data Contributing Members ofthe National Council of Real Estate Investment Fiduciaries (NCREIF). The NPI is an unlevered domestic index, gross of fees, thataggregates the returns of approximately 7,225 privately owned institutional investment properties valued at $471.7 billion. Allproperties have been acquired, at least in part, on behalf of tax-exempt institutions and held in a fiduciary environment. Theproperties are wholly owned and joint venture investments consisting of operating properties only – no development projects. Itis not possible for investors to invest in or duplicate the NPI.
• NFI-ODCE – The NFI-ODCE, like the NCREIF Property Index and other stock and bond indices, is a capitalization-weighted indexbased on each fund’s Net Invested Capital. The NFI-ODCE is a gross of fee and net of fee time-weighted return index consisting ofOpen-end Core Funds. Open-end Funds are defined as infinite-life vehicles consisting of multiple investors who have the abilityto enter or exit the fund on a periodic basis, subject to contribution and/or redemption requests, thereby providing a degree ofpotential investment liquidity.
• We believe that given the inherent valuation lag and lack of leverage in the NPI that the Townsend Indices provide the propercomparison to Investors’ Real Estate Portfolios. The composition of these respective Indices represents the investable universe offunds in each sector and includes leverage.
23
New Mexico State Investment Council

Definitions (continued):
• Internal Rate of Return (“IRR”) – IRR is the average rate earned by each and every dollar invested during the period. This rate isinfluenced not only by movements in financial markets and decisions made by portfolio managers, but also by the timing and sizeof cash inflows and outflows and the beginning and ending market values.
• Time-Weighted Return (“TWR”) – A rate-of-return measure of portfolio performance that gives equal weight to each periodregardless of any differences in amounts invested in each period. TWR are designed to eliminate the effect that the size andtiming of cash flows has on the IRR since the pattern of cash flows varies significantly among funds.
24
New Mexico State Investment Council

Definitions (continued):
25
New Mexico State Investment Council
*Frontier is comprised of 151 countries mainly consisting of other developing countries not listed in the Emerging regions as well as Third World countries.
Developed Americas
(2)Developed Europe
(21)Developed Asia
(5)
Developed Middle East and Africa
(1)
Emerging Americas
(6)Emerging Europe
(5)Emerging Asia
(8)
Emerging Middle East and Africa
(3)Frontier*
(151)United States Austria Austra l ia Is rael Brazi l Czech Republ ic China Egypt Other Developing Canada Belgium Hong Kong Chi le Hungary India South Africa and Third World
Denmark Japan Colombia Morocco Indones ia Turkey counti resEngland New Zealand Mexico Poland South KoreaFinland Singapore Peru Russ ia Malays iaFrance Puerto Rico Phi l ippinesGermany TaiwanGreece Thai landIrelandIta lyLuxembourg NetherlandsNorthern Ireland NorwayPortugalScotlandSpainSwedenSwitzerlandUnited KingdomWales
Geographic Diversification

Appendix C: 1Q 2016 Flash Report

1,894,605,253 10.0% 1,633,174,985 8.6% 813,583,809 4.3% -552,153,541 -2.9%
TGRS TNET TGRS TNET TGRS TNET TGRS TNET2.4 2.0 17.9 15.1 16.4 13.7 14.2 11.92.2 2.0 13.7 12.6 13.6 12.6 13.3 12.2
Funding Status ($)Investment
Vintage YearCommitment
AmountFundedAmount
UnfundedCommitments
CapitalReturned
MarketValue
MarketValue (%)
Market Value+ Unfunded
Commitments (%)
Strategic Core Investments 2011 910,000,000 737,229,794 218,968,015 72,552,761 940,164,148 57.6 47.4
Tactical Value-Added Investments 2004 858,346,674 677,451,057 206,595,022 487,292,266 313,638,800 19.2 21.3
Tactical Opportunistic Investments 2005 705,547,981 530,315,398 228,782,967 318,425,450 331,912,981 20.3 22.9
Tactical Credit 2014 210,664,449 49,891,473 159,237,805 5,904,885 47,459,056 2.9 8.4
Total Tactical 2004 1,774,559,104 1,257,657,928 594,615,794 811,622,601 693,010,837 42.4 52.6
Total Current PortfolioNew Mexico State Investment Council 2004 2,684,559,104 1,994,887,722 813,583,809 884,175,362 1,633,174,985 100.0 100.0
NFI-ODCE Value Weight
Strategic Core Investments
Tactical Value-Added Investments
Tactical Opportunistic Investments
Tactical Credit
New Mexico State Investment Council
New Mexico State Investment Council
First Quarter 2016Portfolio Composition ($)
Total Plan Assets Allocation Market Value Unfunded Commitments Remaining Allocation
5 Year (%)
18,946,052,526
Performance Summary Quarter (%) 1 Year (%) 3 Year (%)

INC APP TGRS TNET INC APP TGRS TNET INC APP TGRS TNET INC APP TGRS TNET TGRS TNET
Strategic Core InvestmentsStrategic Core Investments 940,164,148 1.2 1.2 2.4 2.2 4.8 11.0 16.2 14.6 4.9 9.9 15.2 13.8 5.1 9.8 15.3 13.8 15.3 13.8 2Q11 13.4 1.3
Tactical Value-Added InvestmentsTactical Value-Added Investments 313,638,800 1.3 1.5 2.8 2.1 5.8 19.6 26.3 21.5 5.8 13.0 19.4 15.5 6.7 8.1 15.2 12.3 8.7 5.6 3Q04 3.2 1.1
Tactical Opportunistic InvestmentsTactical Opportunistic Investments 331,912,981 -1.8 3.8 2.1 1.5 -0.9 15.4 15.1 11.2 1.7 15.5 17.7 12.9 1.8 12.9 15.0 11.1 5.8 2.8 2Q05 1.6 1.1
Tactical CreditTactical Credit 47,459,056 3.4 -0.5 2.9 0.8 13.7 -0.3 13.4 10.0 8.7 6.2 1Q14 7.8 1.1
Total Tactical 693,010,837 1.3 5.4 6.7 5.6 8.7 9.8 19.1 14.9 5.8 11.6 17.9 13.7 5.6 8.8 14.8 11.6 7.2 4.1 3Q04 2.4 1.1
Total PortfolioNew Mexico State Investment Council 1,633,174,985 0.7 1.8 2.4 2.0 4.2 13.2 17.9 15.1 4.6 11.4 16.4 13.7 5.0 8.9 14.2 11.9 7.0 4.4 3Q04 5.1 1.2
IndicesNFI-ODCE Value Weight 1.1 1.1 2.2 2.0 4.7 8.7 13.7 12.6 5.0 8.3 13.6 12.6 5.1 7.8 13.3 12.2 8.1 7.1 3Q04NCREIF Property Index "NPI" 1.2 1.0 2.2 4.9 6.7 11.8 5.3 6.4 11.9 5.5 6.2 11.9 9.2 3Q04FTSE EPRA/NAREIT Developed Index in USD 5.4 1.3 6.3 8.5 8.5 3Q04
NetIRR
EquityMultiple
New Mexico State Investment Council
First Quarter 2016
Returns (%)Market Value
($)Quarter 1 Year 3 Year 5 Year Inception TWR
CalculationInception

INC APP TGRS TNET INC APP TGRS TNET INC APP TGRS TNET INC APP TGRS TNET TGRS TNET
Legacy PortfolioLegacy Portfolio 183,026,868 -3.2 4.9 1.7 1.4 -3.7 10.3 8.4 6.9 2.6 7.2 10.6 8.6 3.7 5.8 10.1 8.1 5.4 2.9 3Q04 -0.4 1.0
New Portfolio 2011 InceptionNew Portfolio 2011 Inception 1,450,148,117 1.1 1.4 2.5 2.1 4.8 14.3 19.6 16.6 4.6 13.2 18.2 15.2 4.9 11.7 17 14.5 17.0 14.5 2Q11 14.7 1.3
Total PortfolioNew Mexico State Investment Council 1,633,174,985 0.7 1.8 2.4 2.0 4.2 13.2 17.9 15.1 4.6 11.4 16.4 13.7 5.0 8.9 14.2 11.9 7.0 4.4 3Q04 5.1 1.2
IndicesNFI-ODCE Value Weight 1.1 1.1 2.2 2.0 4.7 8.7 13.7 12.6 5.0 8.3 13.6 12.6 5.1 7.8 13.3 12.2 8.1 7.1 3Q04NCREIF Property Index "NPI" 1.2 1.0 2.2 4.9 6.7 11.8 5.3 6.4 11.9 5.5 6.2 11.9 9.2 3Q04FTSE EPRA/NAREIT Developed Index in USD 5.4 1.3 6.3 8.5 8.5 3Q04
New Mexico State Investment Council
First Quarter 2016
NetIRR
EquityMultipleReturns (%)
Market Value($)
Quarter 1 Year 3 Year 5 Year Inception TWR CalculationInception

Advisory Disclosures and Definitions
Disclosure Proprietary information prepared for the use of The New Mexico State Investment Council. Past performance is not indicative of future results. Investing involves risk, including the possible loss of principal. Returns are presented on a time weighted basis and shown both gross and net of underlying third party fees and expenses and may include income, appreciation and/or other earnings. In addition, investment level Net IRR’s and equity multiples are reported. The Townsend Group, on behalf of its client base, collects quarterly limited partner/client level performance data based upon inputs from the underlying investment managers. Data collection is for purposes of calculating investment level performance as well as aggregating and reporting client level total portfolio performance. Quarterly limited partner/client level performance data is collected directly1 from the investment managers via a secure data collection site.
1In select instances where underlying investment managers have ceased reporting limited partner/client level performance data directly to The Townsend Group via a secure data collection site, The Townsend Group may choose to input performance data on behalf of its client based upon the investment managers quarterly capital account statements which are supplied to The Townsend Group and the client alike. Benchmarks The potential universe of available real asset benchmarks are infinite. Any one benchmark, or combination thereof, may be utilized on a gross or net of fees basis with or without basis point premiums attached. These benchmarks may also utilize a blended composition with varying weighting methodologies, including market weighted and static weighted approaches.