the multi-modal australian sciences imaging and ... · pdf filefacilities to the australian...
TRANSCRIPT
METHODS ARTICLEpublished: 27 March 2014
doi: 10.3389/fninf.2014.00030
The multi-modal Australian ScienceS Imaging andVisualization Environment (MASSIVE) high performancecomputing infrastructure: applications in neuroscience andneuroinformatics researchWojtek J. Goscinski1*, Paul McIntosh1, Ulrich Felzmann2, Anton Maksimenko2, Christopher J. Hall2,
Timur Gureyev3, Darren Thompson3, Andrew Janke4, Graham Galloway4, Neil E. B. Killeen5,
Parnesh Raniga6,7, Owen Kaluza1,6, Amanda Ng1,6,8, Govinda Poudel6, David G. Barnes1,6,8,
Toan Nguyen6, Paul Bonnington1 and Gary F. Egan6
1 Monash eResearch Centre, Monash University, Clayton, VIC, Australia2 Australian Synchrotron, Clayton, VIC, Australia3 CSIRO, Clayton, VIC, Australia4 Centre for Advanced Imaging, University of Queensland, St Lucia, QLD, Australia5 The University of Melbourne, Melbourne, VIC, Australia6 Monash Biomedical Imaging, Monash University, Clayton, VIC, Australia7 CSIRO Preventative Health Flagship, CSIRO Computational Informatics, The Australian e-Health Research Centre, Herston, QLD, Australia8 Life Sciences Computation Centre, VLSCI, Parkville, VIC, Australia
Edited by:
Xi Cheng, Lieber Institue for BrainDevelopment, USA
Reviewed by:
Antonio C. Roque, Universidade deSão Paulo, BrazilB. Nolan Nichols, University ofWashington, USA
*Correspondence:
Wojtek J. Goscinski, MonasheResearch Centre, MonashUniversity, Building 75, Clayton,VIC 3168, Australiae-mail: [email protected]
The Multi-modal Australian ScienceS Imaging and Visualization Environment (MASSIVE)is a national imaging and visualization facility established by Monash University, theAustralian Synchrotron, the Commonwealth Scientific Industrial Research Organization(CSIRO), and the Victorian Partnership for Advanced Computing (VPAC), with fundingfrom the National Computational Infrastructure and the Victorian Government. TheMASSIVE facility provides hardware, software, and expertise to drive research in thebiomedical sciences, particularly advanced brain imaging research using synchrotronx-ray and infrared imaging, functional and structural magnetic resonance imaging (MRI),x-ray computer tomography (CT), electron microscopy and optical microscopy. Thedevelopment of MASSIVE has been based on best practice in system integrationmethodologies, frameworks, and architectures. The facility has: (i) integrated multipledifferent neuroimaging analysis software components, (ii) enabled cross-platformand cross-modality integration of neuroinformatics tools, and (iii) brought togetherneuroimaging databases and analysis workflows. MASSIVE is now operational as anationally distributed and integrated facility for neuroinfomatics and brain imagingresearch.
Keywords: neuroinformatics infrastructure, high performance computing, instrument integration, CT
reconstruction, cloud computing, Huntington’s disease, Quantitative susceptibility mapping, digital atlasing
INTRODUCTIONThe “21st century microscope” will not be a single instrument;rather it will be an orchestration of specialized imaging tech-nologies, data storage facilities, and specialized data processingengines. Moreover, scientists increasingly require access to a widerange of imaging instruments, across multiple modalities andmultiple scales, to characterize a scientific sample or perform anexperiment. The Multi-modal Australian ScienceS Imaging andVisualization Environment (MASSIVE—www.massive.org.au) isa high performance computing facility that is specialized for com-putational imaging and visualization, and has been created tounderpin this new landscape.
THE MASSIVE FACILITYMASSIVE has been established by Monash University, theAustralian Synchrotron, the Commonwealth Scientific Industrial
Research Organization (CSIRO), and the Victorian Partnershipfor Advanced Computing (VPAC) to support next-generationimaging and instrumentation. This facility provides computerhardware, software and expertise to drive research in thebiomedical science, materials research, engineering, and neu-roscience communities, and it stimulates advanced imagingresearch that will be exploited across a range of imagingmodalities, including synchrotron x-ray and infrared imaging,functional and structural magnetic resonance imaging, x-raycomputer tomography (CT), electron microscopy, and opticalmicroscopy.
The MASSIVE project has a number of objectives. First,to provide a world-class imaging and visualization facility toresearch groups identified by the MASSIVE stakeholders. Second,to increase the uptake of imaging and visualization servicesby research groups using the Australian Synchrotron and by
Frontiers in Neuroinformatics www.frontiersin.org March 2014 | Volume 8 | Article 30 | 1
NEUROINFORMATICS
Goscinski et al. MASSIVE: applications in neuroinformatics
Australian research groups more generally. Third, to increasethe performance and capability of imaging and visualizationsystems, especially the on-line reconstruction of images gen-erated by the Imaging and Medical Beamline (IMBL) at theAustralian Synchrotron. And fourth, to increase the capabilitiesof research groups to use and develop imaging and visualizationservices.
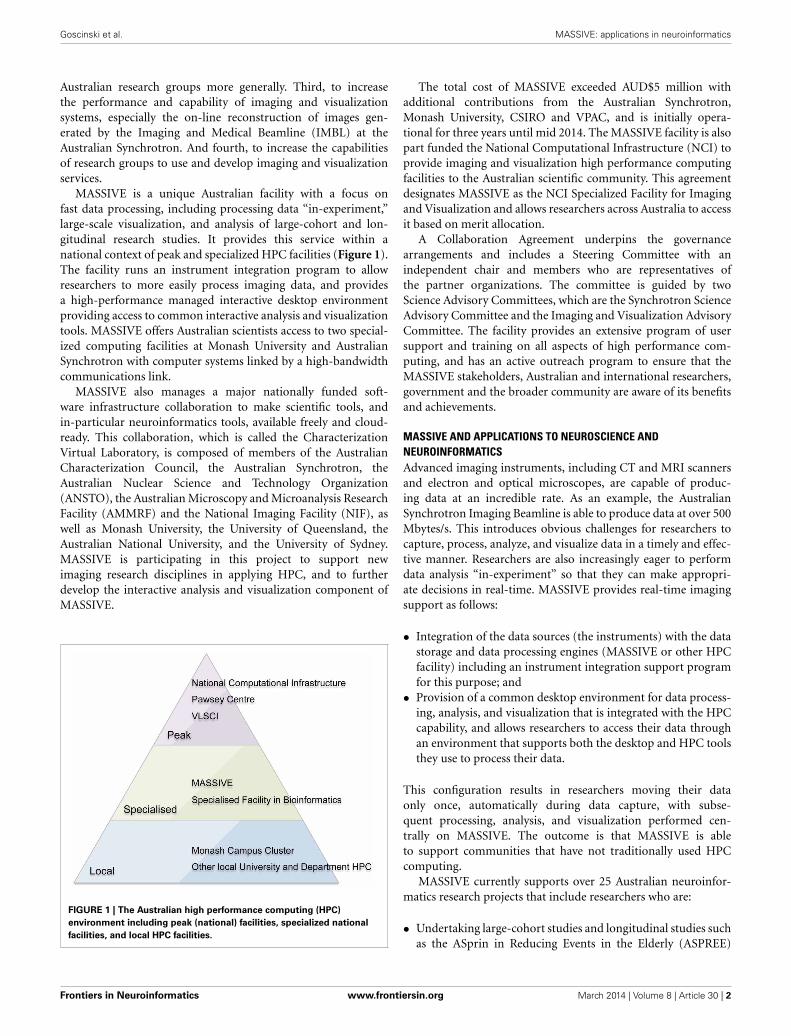
MASSIVE is a unique Australian facility with a focus onfast data processing, including processing data “in-experiment,”large-scale visualization, and analysis of large-cohort and lon-gitudinal research studies. It provides this service within anational context of peak and specialized HPC facilities (Figure 1).The facility runs an instrument integration program to allowresearchers to more easily process imaging data, and providesa high-performance managed interactive desktop environmentproviding access to common interactive analysis and visualizationtools. MASSIVE offers Australian scientists access to two special-ized computing facilities at Monash University and AustralianSynchrotron with computer systems linked by a high-bandwidthcommunications link.
MASSIVE also manages a major nationally funded soft-ware infrastructure collaboration to make scientific tools, andin-particular neuroinformatics tools, available freely and cloud-ready. This collaboration, which is called the CharacterizationVirtual Laboratory, is composed of members of the AustralianCharacterization Council, the Australian Synchrotron, theAustralian Nuclear Science and Technology Organization(ANSTO), the Australian Microscopy and Microanalysis ResearchFacility (AMMRF) and the National Imaging Facility (NIF), aswell as Monash University, the University of Queensland, theAustralian National University, and the University of Sydney.MASSIVE is participating in this project to support newimaging research disciplines in applying HPC, and to furtherdevelop the interactive analysis and visualization component ofMASSIVE.
FIGURE 1 | The Australian high performance computing (HPC)
environment including peak (national) facilities, specialized national
facilities, and local HPC facilities.
The total cost of MASSIVE exceeded AUD$5 million withadditional contributions from the Australian Synchrotron,Monash University, CSIRO and VPAC, and is initially opera-tional for three years until mid 2014. The MASSIVE facility is alsopart funded the National Computational Infrastructure (NCI) toprovide imaging and visualization high performance computingfacilities to the Australian scientific community. This agreementdesignates MASSIVE as the NCI Specialized Facility for Imagingand Visualization and allows researchers across Australia to accessit based on merit allocation.
A Collaboration Agreement underpins the governancearrangements and includes a Steering Committee with anindependent chair and members who are representatives ofthe partner organizations. The committee is guided by twoScience Advisory Committees, which are the Synchrotron ScienceAdvisory Committee and the Imaging and Visualization AdvisoryCommittee. The facility provides an extensive program of usersupport and training on all aspects of high performance com-puting, and has an active outreach program to ensure that theMASSIVE stakeholders, Australian and international researchers,government and the broader community are aware of its benefitsand achievements.
MASSIVE AND APPLICATIONS TO NEUROSCIENCE ANDNEUROINFORMATICSAdvanced imaging instruments, including CT and MRI scannersand electron and optical microscopes, are capable of produc-ing data at an incredible rate. As an example, the AustralianSynchrotron Imaging Beamline is able to produce data at over 500Mbytes/s. This introduces obvious challenges for researchers tocapture, process, analyze, and visualize data in a timely and effec-tive manner. Researchers are also increasingly eager to performdata analysis “in-experiment” so that they can make appropri-ate decisions in real-time. MASSIVE provides real-time imagingsupport as follows:
• Integration of the data sources (the instruments) with the datastorage and data processing engines (MASSIVE or other HPCfacility) including an instrument integration support programfor this purpose; and
• Provision of a common desktop environment for data process-ing, analysis, and visualization that is integrated with the HPCcapability, and allows researchers to access their data throughan environment that supports both the desktop and HPC toolsthey use to process their data.
This configuration results in researchers moving their dataonly once, automatically during data capture, with subse-quent processing, analysis, and visualization performed cen-trally on MASSIVE. The outcome is that MASSIVE is ableto support communities that have not traditionally used HPCcomputing.
MASSIVE currently supports over 25 Australian neuroinfor-matics research projects that include researchers who are:
• Undertaking large-cohort studies and longitudinal studies suchas the ASprin in Reducing Events in the Elderly (ASPREE)
Frontiers in Neuroinformatics www.frontiersin.org March 2014 | Volume 8 | Article 30 | 2

Goscinski et al. MASSIVE: applications in neuroinformatics
study (Nelson et al., 2008) and the IMAGE-HD Huntington’sdisease study (Georgiou-Karistianis et al., 2013);
• Processing, analysing, and viewing data generated by advancedimaging equipment, including the Australian SynchrotronImaging Beamline, new generation Computed Tomography(CT), Magnetic Resonance Imaging (MRI), and other tech-niques;
• Applying computer tomography techniques or volume visual-ization and analysis techniques;
• Applying advanced image processing, image analysis, or visu-alization techniques, or undertaking research in these fields;and
• Developing modeling and simulation applications, in particu-lar applications that are suited to fast file system access or GPUhardware.
COMPUTING INFRASTRUCTURE FOR NEUROINFORMATICSScientific applications of HPC, cloud and grid computing havebeen thoroughly documented and computing is considered anessential scientific tool (Foster and Kesselman, 2003). A numberof specialized undertakings for bioinformatics, and more specif-ically neuroinformatics, have been very successful and deserveparticular comment.
The Biomedical Informatics Research Network (BIRN)(Grethe et al., 2005) is an infrastructure to help communitiesbuild virtual organizations, and includes support for data sharing,security, authentication and authorization, and scientific work-flows. The Functional Bioinformatics Research Network (fBIRN)is a specific application of BIRN for neuroimaging, allowingresearchers to calibrate and collect fMRI data across sites, andmanage and analyse that data (Greve et al., 2010). Similarly,CBRAIN and GBRAIN (Frisoni et al., 2011) are an online collab-orative web platform for neuroimaging allowing users to access awide range of participating HPC resources, in Canada and acrossthe globe.
A number of projects provide dedicated HPC access and sup-port to neuroimaging researchers. These include the NeuGridRedolfi (Redolfi et al., 2009) and it’s successor N4U (Haitasand Glatard, 2012), and the NeuroScience Gateway (NSG)(Sivagnanam et al., 2013). All three projects provide web-basedmechanisms for data management and processing and analysis onHPC systems, and specialized support for neuroimaging.
In addition there are a number of online and desktopworkflow environments that are being applied to general sci-ence and specific bioinformatics and neuroinformatics pur-poses. These include Galaxy (Giardine et al., 2005), theLONI Pipeline (Rex et al., 2003), Kepler (Ludäscher et al.,2006), and Soma-workflow (Laguitton et al., 2011). Theseprojects all provide mechanisms to interface with high per-formance computing resources. Nipype (Gorgolewski et al.,2011) is a workflow for interfacing with a range of neu-roinformatics packages, allowing users to easily comparealgorithms across packages. PSOM (Bellec et al., 2012) isa workflow engine for Octave and Matlab developed forneuroimaging.
The Blue Brain Project (Markram, 2006) is undertaking tosimulate the brain on a HPC. The project commenced by
undertaking to simulate a cellular-level model of a 2-week-old rat somatosensory neocortex based on captured microscopydata, specifically targeting the IBM Blue Gene HPC platform.This project, has now evolved into the broader Human BrainProject (HBP, 2012), which is discussed in Section Large-scaleInternational Initiatives.
MASSIVE shares many of the fundamental goals of theseprojects—to provide neuroscience researchers with access tohigh performance computing capabilities and data management.However, our project differs in a number of ways:
• Integration of scientific instrumentation is a key feature of theproject, allowing scientists to perform sophisticated processingimmediately after data capture, and in some cases performingdata processing as part of the experiment (Section InstrumentIntegration Program);
• Easy access for non HPC-experts is important to support thebroad neuroscience community. Many of the projects discussedapproach this problem by providing access to web portals orworkflow environments. MASSIVE has decided to take theapproach of providing a remote desktop (Section MassiveInteractive Software Environment), which has proved effectivein helping researcher transition from their personal desktop toa HPC environment. It also alleviates the need to wrap tools ina web front-end and means that a vast range of desktop toolscan be supported on the systems.
• We are actively developing the MASSIVE software stack tothe cloud (Section Neuroinformatics in the Cloud) whichwill make MASSIVE more accessible to a wider range ofneuroscientists.
INFRASTRUCTUREHARDWAREMASSIVE consists of two interconnected computers, M1, andM2 respectively, that operate at over 5 and 30 teraflops 1 respec-tively, using traditional CPU processing, and accelerated to over50 and 120 teraflops1, respectively, using co-processors. M1 andthe first stage of M2 were made available to Australian researchersin May 2011. The computers are connected using a dedicatedconnection for fast file transfer and common management. Asummary of the technical specifications of the two systems andthe hardware configuration of the two computers, including theGPU coprocessors and the parallel file systems, are given inTable 1.
GPUs have proved an important part of the MASSIVE envi-ronment. Key applications, including the X-TRACT (Gureyevet al., 2011) CT reconstruction software, have been parallelized totake advantage of the GPUs. This has been critical to performingfast processing of data in a near real-time fashion as discussed inSection Instrument Integration Program. Moreover, GPUs havebecome an important developmental technology for the researchcommunity and MASSIVE has supported a number of projects tosuccessfully port imaging analysis code to the GPU environment.Section GPU reconstruction of quantitative magnetic suscepti-bility maps of the human brain describes a specific example of
1Theoretical performance of the systems.
Frontiers in Neuroinformatics www.frontiersin.org March 2014 | Volume 8 | Article 30 | 3

Goscinski et al. MASSIVE: applications in neuroinformatics
Table 1 | Technical specifications of the MASSIVE high performance
computing system.
M1 AT THE AUSTRALIAN SYNCHROTRON
42 nodes (504 CPU-cores total) in one configuration:
42 nodes with 12 cores per node running at 2.66 GHz
48 GB RAM per node (2016 GB RAM total)
2 NVIDIA M2070 GPUs with 6GB GDDR5 per node (84 GPUs total)
153 TB of fast access parallel file system4x QDR Infiniband Interconnect
M2 AT MONASH UNIVERSITY
118 nodes (1720 CPU-cores total) in four configurations:
32 nodes with 12 cores per node running at 2.66 GHz
48 GB RAM per node (1536 GB RAM total)
2 × NVIDIA M2070 GPUs with 6 GB GDDR5 per node (64 GPUs total)
10 nodes with 12 cores per node (visualization/high memoryconfiguration)
192 GB RAM per node (1920 GB RAM total)
2 × NVIDIA M2070Q GPUs with 6 GB GDDR5 per node (20 GPUstotal)
56 nodes with 16 cores per node running at 2.66 GHz
64 GB RAM per node (3584 GB RAM total)
2 × NVIDIA K20 (9 nodes—18 GPUs total)
2 × Intel PHI (10 nodes—20 coprocessors total)
20 nodes with 16 cores per node running at 2.66 GHz
128 GB RAM per node (2560 GB RAM total)
2 × NVIDIA K20 (40 GPUs total)
345 TB of fast access parallel file system
4 × QDR Infiniband Interconnect
Combined the M1 and M2 have 2,224 CPU-cores.
the application of GPUs to Quantitative Susceptibility Mapping(QSM). Importantly, the GPU capability allows MASSIVE toprovide good support for interactive visualization, includingthrough the MASSIVE Desktop (Section MASSIVE InteractiveSoftware Environment) and through parallel rendering tools suchas Paraview (Henderson et al., 2004).
Both M1 and M2 have a GPFS (Schmuck and Haskin, 2002)file system that is capable of a combined 5 GB+ per second writespeed. This capability has proved essential to support both thefast capture of data from instruments, and file system inten-sive image processing workloads. Section Instrument IntegrationProgram discusses the importance of the file system to supportlarge-scale and real-time CT reconstruction image processingapplications.
INSTRUMENT INTEGRATION PROGRAMMASSIVE has a dedicated program for the integration of imag-ing instruments with high performance computing capability(Figure 2, Table 2) that gives scientists the ability to use com-plex and computationally demanding data processing workflowswithin minutes of acquiring image datasets. Instruments inte-grated with MASSIVE that are of particular interest for neuro-science research include MRI and CT equipment at AustralianNational Imaging Facility locations across Australia, and for near
real-time CT image reconstruction on the Imaging Beamline atthe Australian Synchrotron.
The instrument integration program allows scientists to visu-alize and analyse collected data as an experiment progresses orshortly after it completes, thereby integrating processing, anal-ysis and visualization into the experiment itself. In particular,groups that are imaging live anesthetized animals must be ableto establish whether a previous scan has successfully producedthe desired data before proceeding with the next step of theexperiment. These experiments are typically time-critical as thereis limited instrument availability once an experiment has com-menced. In many cases the images captured by detectors at theImaging Beamline are very large and necessitate the rapid move-ment of TB data sets for processing. These constraints dictatethat significant computing power is required on demand and thatthe computer is tightly coupled to the instruments and readilyavailable to the researchers.
Data management at Monash Biomedical ImagingNeuroimaging studies, especially multi-modal, longitudinal stud-ies of large cohorts of subjects, generate large collections ofdata that need to be stored, archived, and accessed. MRI basedstudies can easily accumulate terabytes of data annually andrequire integration of HPC and informatics platforms with theimaging instrumentation. Integrated systems that combine data,meta-data, and workflows are crucial for achieving the oppor-tunities presented by advances in imaging facilities. MonashUniversity hosts a multi-modality research imaging data man-agement system that manages imaging data obtained from fivebiomedical imaging scanners operated at Monash BiomedicalImaging (MBI) (Figure 3). In addition to Digital Imaging andCommunications in Medicine (DICOM) images, raw data andnon-DICOM biomedical data can be archived and distributedby the system. Research users can securely browse and downloadstored images and data, and upload processed data via subject-oriented informatics frameworks (Egan et al., 2012) including theDistributed and Reflective Informatics System (DaRIS) (Lohreyet al., 2009; DaRIS, 2013), and the Extensible NeuroimagingArchive Toolkit (XNAT) (Marcus et al., 2007).
DaRIS is designed to provide a tightly integrated path frominstrument to repository to compute platform. With this frame-work, the DaRIS system at MBI manages the archiving, process-ing, and secure distribution of imaging data (with the ability tohandle large datasets) acquired from biomedical imaging scan-ners and other data sources. This ensures long-term stability,usability, integrity, integration, and inter-operability of imagingdata. Imaging data are annotated with meta-data according to asubject-centric data model and scientific users can find, down-load, and process data easily. DaRIS users can export their datadirectly into their MASSIVE project environment for analysis.
Recent enhancement of DaRIS (Killeen et al., 2012) pro-vides for the management and operation of workflows (usingthe Nimrod and Kepler technologies) with input and output datamanaged by DaRIS. In this way, large subject-cohort projects canrobustly process (and re-process) data with attendant enhanceddata provenance. Current DaRIS enhancements are focusingon additional efficient data inter-operability capabilities so that
Frontiers in Neuroinformatics www.frontiersin.org March 2014 | Volume 8 | Article 30 | 4

Goscinski et al. MASSIVE: applications in neuroinformatics
FIGURE 2 | A schematic of the integration of access to imaging instrumentation from the MASSIVE desktop and the Cloud via the Characterization
virtual laboratory.
researchers can access their managed data when and where theyneed it.
Australian synchrotron imaging beamline CT reconstructionThe MASSIVE computers have been integrated with a num-ber of beamlines at the Australian Synchrotron, and providea range of data processing services to visiting researchers.These include: near real-time image reconstruction at theIMBL, near-real time automated structural determination at theMacromolecular Crystallography beamline, microspectroscopyat the Infrared beamline, data analysis at the Small and WideAngle Scattering beamlines, and image analysis at the X-rayFluorescence Microprobe Beamline. These techniques are beingapplied to a range of biomedical sciences and neuroimagingapplications.
The IMBL has a capability of near real-time high-resolutionCT imaging of a range of samples, including high-resolution
phase-contrast x-ray imaging of biomedical samples, animalmodels used in neuroscience experiments, and engineeringmaterials. The beamline is 150 meters long, with a satellite build-ing that includes a medical suite for clinical research as well asextensive support facilities for biomedical and clinical researchprograms. Two detectors based on pco-edge cameras are avail-able for use. Typical data acquisition times are dependent uponthe chosen x-ray energy and detector resolution and vary approx-imately between 10 and 60 min for a complete CT scan. Whenimaging data is acquired at the maximum detector resolution andat 50 frames per second, the data rate is 2560 × 2160 × 2 byte ×50 fps = 527.34 Mbytes/s. Figure 4 illustrates the architecture ofthe IMBL CT Reconstruction service.
In order to control the data collection and optimize the exper-imental conditions at IMBL, scientists must be able to visualizecollected data in near real-time as the experiment is in progress.In particular, groups that are imaging live anesthetized animals
Frontiers in Neuroinformatics www.frontiersin.org March 2014 | Volume 8 | Article 30 | 5

Goscinski et al. MASSIVE: applications in neuroinformatics
Table 2 | The computational systems and file system access associated with the imaging instrumentation integrated with MASSIVE and the
Characterization Virtual Laboratory.
Instrument Capture method Service Scientific capability
INTEGRATED
Imaging and Medical Beamline File system integration GPU processing, parallel FS, andinteractive visualization
CT reconstruction and visualization
Macromolecular CrystallographyBeamline
File system mount Compute Structural determination
Infrared Beamline Compute Signal correction
X-ray Fluorescence MicroprobeBeamline
Parallel FS and interactivevisualization
Analysis
Small Angle and Wide Angle X-rayScattering
Compute Modeling
CT and MRI Imaging Instruments DaRIS GPU processing, parallel FS, andinteractive visualization
Data capture, analysis, and visualization
Electron Microscopes Tardis Parallel FS, cloud computing, andinteractive visualization
Data capture, analysis, and visualization
PLANNED OR IN PROGRESS
Biomedical X-ray sources File system mount GPU processing, parallel FS, andinteractive visualization
CT reconstruction and visualization
Atom Probes Tardis Cloud computing and interactivevisualization
Analysis
Electron Microscopes Tardis GPU processing, parallel FS, andinteractive visualization
Structural determination and visualization
Micro-CT X-ray sources File system mount CT reconstruction and visualization
Soft X-ray Beamline CT reconstruction
often need to establish whether a previous scan has successfullyproduced the desired data before proceeding with the next stepof an experiment. The experiments are typically time-critical asthe window of the experiment once begun is short. The imagedatasets captured by detectors at the IMBL require the manip-ulation of data sets in the terabyte range. These experimentalconstraints dictate that significant computing power is tightlycoupled to the experimental detectors and available on-demand.
CT data sets collected at IMBL are typically tens of GB persample consisting of typically 1200–2400 projection images thatcan be acquired from a single sample in less than 1 min. TheX-TRACT package on M1 is the primary software available tousers for reconstruction of CT data, including phase-contrastCT as implemented at IMBL (Goscinski and Gureyev, 2011;Gureyev et al., 2011). Usage of MASSIVE for CT reconstructionvia X-TRACT is offered during the synchrotron experiments andalso via remote access up to 6 months after an experiment hasbeen completed, allowing researchers to process and analyse cap-tured data remotely. The CT reconstruction service has been inproduction since November 2012.
The X-TRACT customized CT image reconstruction softwareis parallelized for the MASSIVE GPU and parallel file systemarchitecture. X-TRACT is an application for advanced process-ing of X-ray images that also provides multiple image processingtools. In particular, there is extensive functionality for X-ray CTimage processing, including multiple methods for CT reconstruc-tion and X-ray phase retrieval and simulation of phase-contrastimaging. Additionally, a large number of operations such asFFT, filtering, algebraic, geometric, and pixel value operations
are provided. X-TRACT has been designed to fully leverage theprocessing capabilities of modern hardware such that computa-tionally intensive operations utilize multiple processors/cores andGPU’s where available to increase performance. The X-TRACTsoftware has been adapted for use on HPC cluster infrastructure,and has been optimized for the MASSIVE systems, to enable it toprocess multi-TB datasets produced at synchrotron light sourcesthat are unable to be processed on standalone desktop machines.
To demonstrate the importance of the file system capabilityin particular, benchmarking of X-TRACT on the M1 cluster hasbeen performed using the Gridrec CT reconstruction algorithm(Rivers and Wang, 2006) for multi-TB datasets. The total recon-struction time and IO time as a proportion of the runtime for aset of CT reconstructions is shown in Figure 5 as a function ofthe number of CPU cores. The input dataset consisted of 8192pre-processed sinogram files (total ∼1.5 TB), and the output wasan 81923 pixel dataset (total ∼2 TB). The results demonstratethat IO represents a significant proportion of the overall runningtime—particularly beyond 36 CPU-cores. We are currently inves-tigating the refinement of the HPC based CT processing workflowto reduce the high proportion of IO time which is currently themajor performance bottleneck.
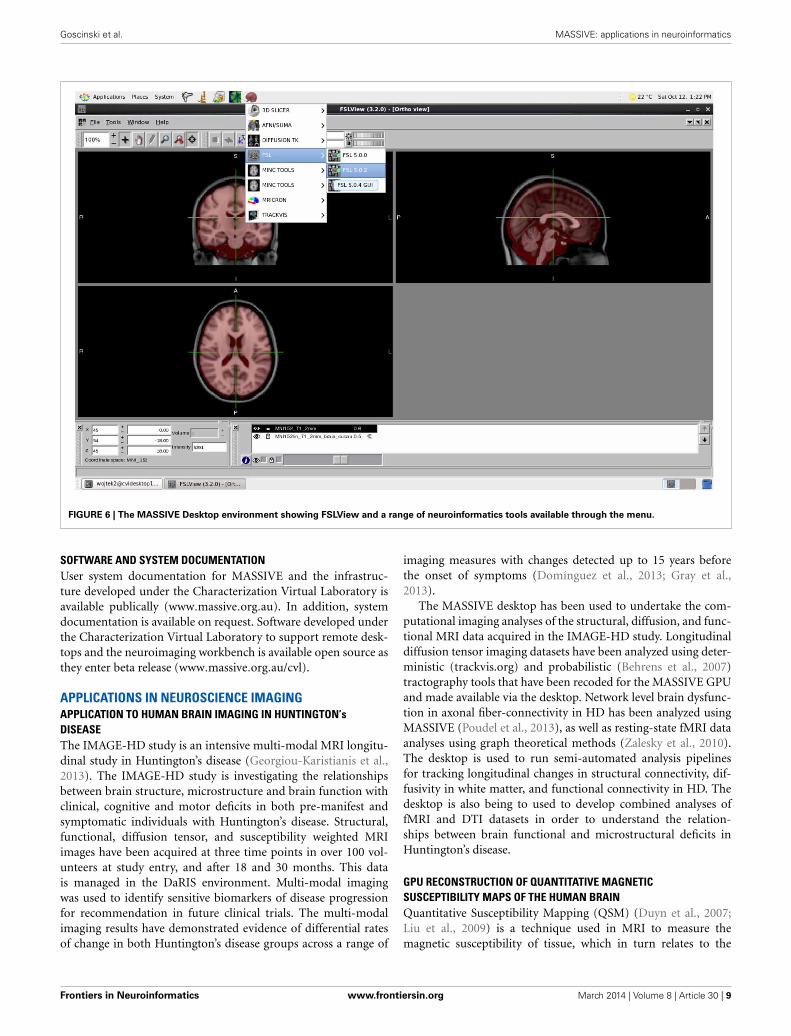
MASSIVE INTERACTIVE SOFTWARE ENVIRONMENTMASSIVE provides users with highly accessible high-performance scientific desktop—an interactive environmentfor analysis and visualization of multi-modal and multi-scaledata (Figure 6). This environment provides researchers withaccess to a range of existing tools and software, including
Frontiers in Neuroinformatics www.frontiersin.org March 2014 | Volume 8 | Article 30 | 6

Goscinski et al. MASSIVE: applications in neuroinformatics
FIGURE 3 | Schematic of the neuroscience image data flow from Monash Biomedical Imaging and the computational processing performed on M2.
FIGURE 4 | Schematic of the architecture of the IMBL CT Reconstruction service provided on M1.
Frontiers in Neuroinformatics www.frontiersin.org March 2014 | Volume 8 | Article 30 | 7

Goscinski et al. MASSIVE: applications in neuroinformatics
FIGURE 5 | The total reconstruction time for CT reconstruction of an
89123 dataset (top) and IO time as a proportion of runtime (bottom)
on M1 as a function of the number of CPU cores.
commercial and open-source neuroinformatics applications.Common neuroimaging applications such as FSL (Smith et al.,2004) and SPM (Friston et al., 1994) have been integrated intothe desktop to allow users to submit HPC jobs without specificHPC knowledge. The continual growth in data and study sizesincreasingly necessitates the analysis and rendering of data atthe location where the data is stored. Furthermore, performinganalysis and visualization on a central facility greatly increasesthe efficiency and flexibility for researchers to access high perfor-mance hardware, including fast file systems and GPUs. Togetherwith the MASSIVE Instrument Integration program, the desktopprovides a fully integrated environment that allows researchers toview and analyze images shortly after the imaging data has beenacquired.
The scientific desktop allows MASSIVE users to access a widerange of analysis tools without rewrapping or reengineering of thetools. The remote desktop has been built using CentOS runningthe KDE or Gnome desktop environment. For remote access, thedesktop uses an open source VNC implementation, TurboVNC(http://www.virtualgl.org/), as it supports remote hardware accel-erated rendering and clients on all three major platforms:Windows, Mac, and Linux. Network latency and bandwidthusing the Australian academic research network (AARNET) issufficient to support TurboVNC across the Australian imagingresearch community and the MASSIVE desktop is commonlyaccessed from every major city in Australia. The MASSIVE desk-top supports a simple launcher called Strudel (short for Scientific
Desktop Launcher) that automates the steps to access a desktopsession. The Launcher launches an interactive visualization jobon the MASSIVE system, and connects using TurboVNC usinga secure SSH connection. The launcher is provided for all threemajor desktop platforms. It is configurable to other facilities andis being applied at other HPC facilities in Australia. It is availableopen source (Section Software and System Documentation).
NEUROINFORMATICS IN THE CLOUDTo make imaging tools more accessible to the scientific com-munity, MASSIVE is a key participant in the AustralianCharacterization Virtual Laboratory (CVL) project that is fundedunder the National eResearch Collaboration Tools and Resources(NeCTAR) project (www.nectar.org.au). The NeCTAR CVLproject is an open source project aimed at porting key scien-tific imaging applications to the cloud with a particular focus onneuroinformatics tools (Goscinski, 2013).
The CVL has developed a managed desktop environment,based on the MASSIVE Desktop, including the NeuroimagingWorkbench to support the neuroscience imaging community.The CVL environment provides access to the MASSIVE file sys-tem and job queues and is supporting further expansion of theinstrument integration program (Figure 2). The NeuroimagingWorkbench has integrated workflow and database systems toallow researchers using instruments managed by the AustralianNational Imaging Facility (NIF) to process and manage large neu-roimaging datasets. The Australian NIF is a national networkof universities and biomedical research institutes that provideskey biomedical imaging instruments and capabilities for theAustralian research community.
Neuroinformatics tools in the cloud have great potential toaccelerate research outcomes. The Neuroimaging Workbenchincludes a project for registration of multi-modal data brain datafor the Australian Mouse Brain Mapping Consortium (Richardset al., 2011). Ultra-high resolution 15 um MRI and micro-CTimages from excised tissue, can be registered with 3D reconstruc-tions of histological stained microscopy sections. The registereddatasets enable the MRI and CT images to be correlated at boththe microscopic (cellular) and macroscopic (whole organ) scales.A mouse brain atlas that combines ultra-high resolution MRI andhistological images has wide ranging application in neuroscience.However, image registration of 3D microscopy and MRI datasetsrequires immense computational power as well as a range of spe-cialized software tools and workflows, the developed workflow isapplicable to all small animal atlas building efforts.
A major objective of the CVL Neuroimaging Workbench isto increase the efficiency for the neuroimaging community toundertake complex image processing and analyses for large andlongitudinal scale studies. The integration of key imaging instru-ments across multiple nodes of NIF is allowing neuroimagingresearchers to efficiently stage data to the cloud for processing onHPC facilities. The workbench provides researchers with simpleand free access to a high performance desktop environment, thatcontains a fully configured set of neuroimaging tools for anal-ysis and visualization, that may obviate the need for high-enddesktop workstations that are currently replicated across manyneuroimaging laboratories.
Frontiers in Neuroinformatics www.frontiersin.org March 2014 | Volume 8 | Article 30 | 8
Goscinski et al. MASSIVE: applications in neuroinformatics
FIGURE 6 | The MASSIVE Desktop environment showing FSLView and a range of neuroinformatics tools available through the menu.
SOFTWARE AND SYSTEM DOCUMENTATIONUser system documentation for MASSIVE and the infrastruc-ture developed under the Characterization Virtual Laboratory isavailable publically (www.massive.org.au). In addition, systemdocumentation is available on request. Software developed underthe Characterization Virtual Laboratory to support remote desk-tops and the neuroimaging workbench is available open source asthey enter beta release (www.massive.org.au/cvl).
APPLICATIONS IN NEUROSCIENCE IMAGINGAPPLICATION TO HUMAN BRAIN IMAGING IN HUNTINGTON’sDISEASEThe IMAGE-HD study is an intensive multi-modal MRI longitu-dinal study in Huntington’s disease (Georgiou-Karistianis et al.,2013). The IMAGE-HD study is investigating the relationshipsbetween brain structure, microstructure and brain function withclinical, cognitive and motor deficits in both pre-manifest andsymptomatic individuals with Huntington’s disease. Structural,functional, diffusion tensor, and susceptibility weighted MRIimages have been acquired at three time points in over 100 vol-unteers at study entry, and after 18 and 30 months. This datais managed in the DaRIS environment. Multi-modal imagingwas used to identify sensitive biomarkers of disease progressionfor recommendation in future clinical trials. The multi-modalimaging results have demonstrated evidence of differential ratesof change in both Huntington’s disease groups across a range of
imaging measures with changes detected up to 15 years beforethe onset of symptoms (Domínguez et al., 2013; Gray et al.,2013).
The MASSIVE desktop has been used to undertake the com-putational imaging analyses of the structural, diffusion, and func-tional MRI data acquired in the IMAGE-HD study. Longitudinaldiffusion tensor imaging datasets have been analyzed using deter-ministic (trackvis.org) and probabilistic (Behrens et al., 2007)tractography tools that have been recoded for the MASSIVE GPUand made available via the desktop. Network level brain dysfunc-tion in axonal fiber-connectivity in HD has been analyzed usingMASSIVE (Poudel et al., 2013), as well as resting-state fMRI dataanalyses using graph theoretical methods (Zalesky et al., 2010).The desktop is used to run semi-automated analysis pipelinesfor tracking longitudinal changes in structural connectivity, dif-fusivity in white matter, and functional connectivity in HD. Thedesktop is also being to used to develop combined analyses offMRI and DTI datasets in order to understand the relation-ships between brain functional and microstructural deficits inHuntington’s disease.
GPU RECONSTRUCTION OF QUANTITATIVE MAGNETICSUSCEPTIBILITY MAPS OF THE HUMAN BRAINQuantitative Susceptibility Mapping (QSM) (Duyn et al., 2007;Liu et al., 2009) is a technique used in MRI to measure themagnetic susceptibility of tissue, which in turn relates to the
Frontiers in Neuroinformatics www.frontiersin.org March 2014 | Volume 8 | Article 30 | 9

Goscinski et al. MASSIVE: applications in neuroinformatics
paramagnetic content of the tissue. Diffusion guided QSM(dQSM) (Ng, 2013) is a new technique that uses diffusion MRIdata to improve the modeling of magnetic susceptibility at eachposition in the image, but it is a computationally challeng-ing problem, requiring the inversion of a multi-terabyte matrix.Diffusion guided QSM treats the magnetic susceptibility effectof each image voxel as isotropic (Liu et al., 2011) or axial (Leeet al., 2012) depending on the fractional anisotropy (FA) in cor-responding diffusion-weighted images. The computation of thematrix formulation of the problem using the Landweber iteration(LI) method is prohibitively expensive on central processing unit(CPU) cores. Acceleration of the algorithm by utilizing graphicsprocessing unit (GPU) cores is necessary to achieve image com-putation times practical for research use today, and for clinicalapplication in the near future. The dQSM problem is suited tothe GPU for the reason that the elements of the matrix in theLandweber iteration formulation can be computed on-demand;without this ability the problem would be intractable on GPUs.By computing the elements of the matrix on-the-fly using theMASSIVE GPU architecture the time for computation of QSMimages has been reduced by a factor of 15.
Several attributes of the Landweber iteration method appliedto the dQSM problem make it particularly suitable to the GPUarchitecture. Computing the solution requires iteratively multi-plying very large matrices, which are computed on-the-fly fromsmaller input buffers, with vectors of voxel input data and addingthe result to the previous values. Each iteration is an Order(N∧2) problem with a high computational load of calculatingthe matrix elements that extensively uses multiply-then-add thatallows fused multiply-add instructions. The conveniently con-tiguous access to most of the read/write data vectors by parallelcomputational threads enables better cache performance andreduced global memory read/write overheads. By computing theelements of the matrix on-the-fly and optimizing to best use theMASSIVE GPU architecture, the time for computation of QSMimages has been reduced by a factor of 15.
The reference CPU solution uses an MPI parallel processingparadigm that already provides a domain decomposition. Thisdecomposition was applied to the GPU implementation to splitseparate sections of the problem over a number of GPUs in anadditional layer of parallelism. The MASSIVE architecture pro-vides two NVIDIA Tesla M2070 or K20 GPUs per compute nodealong with 12 CPU cores. The fast interconnect between nodesenabled excellent scaling on the multiple GPU code with minimalcommunication overhead even when computed on up to 32 GPUsover 16 nodes. Current work involves a more intelligent loadbalancing of the work across multiple GPUs and potentially sep-arating the problem into white-matter voxels (which require theLI technique and therefore the huge level of compute power theGPU provides), and other voxels which can be computed usinga fast Fourier transform based technique. This would permit uti-lization of the CPU cores that sit idle while the GPU computationis performed.
The dQSM method implemented on the MASSIVE GPUarchitecture demonstrates greater accuracy in susceptibilityestimation results compared to methods based solely on aspherical diffusion mode. The major disadvantage is the very
long computation time, which makes the method challeng-ing for routine research and clinical applications. Algorithmicimprovements and the growth in compute capability of GPUstogether with the further speed-up of the GPU implementa-tion being undertaken, is expected to enable clinically-relevantpost-processing times (less than 30 min). Using multi-componentmodels of tissue structures to estimate susceptibility effects willprovide more accurate results with further improvements inimplementation of the dQSM algorithm.
DIGITAL ATLASING OF THE MOUSE BRAINThe mouse is a vital model to elucidate the pathogenesis ofhuman neurological diseases at a cellular and molecular level.The importance of the murine model in neuroscience research isdemonstrated by the multitude and diversity of projects includingthe Allen Brain Atlas (brain-map.org), Waxholm Space (wax-holm.incf.org) developed under the auspices of the InternationalNeuroinformatics Coordinating Facility, the Mouse Brain Library(MBL) (mbl.org) and the Mouse Brain Architecture Project(MBAP) (brainarchitecture.org). Many research groups use non-invasive MRI to structurally map the murine brain in control anddisease model cohorts. Until recently, the construction of mousebrain atlases has been relatively restricted due to the variety ofsample preparation protocols and image sequences used, and thelimited number of segmented brain regions.
The Australian Mouse Brain Mapping Consortium (AMBMC)has recently developed an ultrahigh resolution and highly detailedMRI-based mouse brain atlas (Richards et al., 2011; Ullmannet al., 2012). The AMBMC atlas has initially concentrated onfive primary brain regions, the hippocampus, cortex, cerebellum,thalamus, and basal ganglia and has recently published a segmen-tation guide and probabilistic atlas for over 200 structures. MRIdata from 18 C57BL/6J mice was acquired at 30 µm3 resolution,averaged to create a single image at a resolution of 15 µm3, andplaced in the stereotaxic Waxholm space. The components of thebrain were delineated, on the bases of differences in signal inten-sity and/or their location in reference to landmark structures. Adigital atlas containing over 200 structures with mean region vol-umes, T2∗-weighted signal intensities and probability maps foreach of structure was generated for use as a detailed template forcross modality applications (see www.imaging.org.au/AMBMC).
These components have been integrated and made availablethrough the Neuroimaging Workbench (Janke, 2013).
DISCUSSION AND FUTUREThere are a number of major trends that will influence MASSIVE,both under its current project plan and in the future. Thisincludes technological trends, capabilities such as visualization,and major international initiatives.
MASSIVE CHALLENGESOur experience developing and managing the MASSIVE systemshas highlighted a number of noteworthy challenges.
The MASSIVE systems cannot be managed in the same way asa more traditional HPC facility where computer utilization is akey measure of success. Because we commonly provide access tocompute in a near-realtime or interactive manner, we must keep
Frontiers in Neuroinformatics www.frontiersin.org March 2014 | Volume 8 | Article 30 | 10

Goscinski et al. MASSIVE: applications in neuroinformatics
a proportion of the systems available and waiting for instrumentprocessing or desktop sessions. We aim for CPU-core utilizationof around 70%, as opposed to more traditional systems that areable to achieve between 90 and 100% utilization. We are exper-imenting with strategies such as dynamic provisioning of nodesand short running jobs to fill idle time.
Interactive desktop sessions on our facility run on a dedicatednode. Thus, users have access to two CPU processors runningbetween 8 and 12 cores, and up to 192 GB of memory. We donot allow multiple users onto a single desktop node, because auser can inadvertently affect other users. For example, by launch-ing a multi-core application. However, a significant proportionof desktop users do not require access to the full technical capa-bilities. For example, a user that is using an image viewer toexamine a large dataset might only require one CPU-core. Theresult is wasted computing resources. Our long-term plan to solvethis problem is to host desktop sessions in virtual machines thatwill be provisioned at specific sizes and capabilities. Using virtualmachines allows us to completely isolate multiple users of a singledesktop and ensure a good user experience. In our early experi-ence with provisioning on the cloud (Section Neuroinformaticsin the Cloud) the overhead imposed by a virtual machine isacceptable, but fast access to file systems needs to be carefullyconsidered.
Our most significant challenge is not technical but relates touser support. In a traditional HPC environment users will beaccustomed to submitting jobs to a queue and checking back fortheir results. In an interactive environment, small changes to per-formance and accessibility have a strong effect on user experience.Moreover, users require fast response to problems—particularlyconsidering issues with the computing system can have a majoreffect a physical experiment. Our solution to this problem hasbeen to ensure that have adequate expert staff who are able toquickly triage and prioritize problems.
TRENDS IN SCIENTIFIC COMPUTINGA major trend in HPC has been the application of GPU technol-ogy, developed primarily to support the gaming market, to enablefast parallel processing. This has continued to be driven by thedevelopment of new architectures, such as the Intel Phi.
Likewise, the trend toward centralized cloud hosting, and thecompetition between major cloud vendors has created a land-scape where hosting applications in the cloud is a very economicalsolution, whilst still providing a high degree of control to cus-tomize a solution to a particular science question. Early cloudhardware offerings lacked specialized hardware, such as GPUsor high performance interconnects. However, cloud computingproviders are increasingly providing these capabilities, includingAmazon (Ekanayake and Fox, 2010) (Amazon, 2013). In addition,the development of open source cloud computing middleware,such as OpenStack (OpenStack, 2013), allows a broader range ofproviders to offer cloud solutions and increases the availability ofspecialized services—such as parallel hardware or scientific appli-cations. In particular, through the NeCTAR project, a number ofmajor Australian Universities are developing an OpenStack fed-erated multi-node cloud for the research community (NeCTAR,2013). The CVL project is hosted on this environment allowing
it access to GPUs and, in the future, a low latency and highbandwidth connection to MASSIVE. The Neuroimaging Toolsand Resources Clearinghouse (NITRC) (Buccigrossi et al., 2007)Computational Environment (NITRC, 2013), is an analogousproject that, like the CVL, provides a cloud platform pre-configured for neuroinformatics. This allows any neuroscientistto easily access the latest tools running on the Amazon cloud forbetween $0.02 and $3.10 per hour depending on the hardwareconfiguration.
These trends in computing are creating a landscape wherecloud hosting of scientific applications—including interactivedesktop applications—will become a feasible, economical, andpowerful solution. MASSIVE is supporting this trend by portingneuroimaging applications to the cloud through the CVL project,and integrating key Australian instruments, including the IMBLand imaging equipment through the NIF.
VISUALIZATION FOR NEUROINFORMATICSUnderstanding and visualizing information is a hurdle forresearchers who generally work with 2D screens and rarely use 3Ddisplays. Advances in research imaging technology has dramati-cally increased the volume and complexity of research data thatis routinely collected. New virtual reality technologies now pro-vide the possibility of panoramic 320◦ visual displays that matchhuman visual acuity, and provide visualization opportunities forexploring, and understanding the complexity of neurosciencedata, in particular human brain imaging data. The next gener-ation of neuroscience discoveries underpinned by virtual realitytechnologies and advanced computational approaches have thepotential to initiate a new discipline of visualization led scien-tific discovery in neuroscience. MASSIVE is collaborating witha unique Australian immersive visualization facility, the MonashUniversity CAVE2 facility (CAVE2, 2013), to allow researchers tovisualize MASSIVE 2D and 3D data in an immersive environ-ment. The direct integration of the MASSIVE Desktop with theCAVE2 display facility, including support for 3D display fromapplications the MASSIVE users are already familiar with, is a keyobjective for the initial operating period of the CAVE2.
Scientists are increasingly applying a systems approach tounderstanding the human brain—coupling multiscale models todevelop an understanding of how models work together, howeffects propagate through systems and how high-level outcomesare constructed from fundamental physics and chemistry. There isa desire to provide mechanisms for interacting with and steeringof simulations to understand emergent properties. In particu-lar, the Human Brain Project (HBP, 2012; Markram, 2012) willdevelop mechanisms to gain visual feedback, steer simulations,and interrogate simulated models as if they were a real biolog-ical sample. New visualization tools for easily interacting withcomputational models, large-scale simulations, and big data areimportant to ensure HPC is easily accessible to the neurosciencecommunity.
LARGE-SCALE INTERNATIONAL INITIATIVESSeveral large-scale international brain research initiatives arenow underway in both the US and Europe to accelerate ourunderstanding of the brain and its diseases and disorders. The
Frontiers in Neuroinformatics www.frontiersin.org March 2014 | Volume 8 | Article 30 | 11

Goscinski et al. MASSIVE: applications in neuroinformatics
Human Brain Project (HBP) has been funded with the aim totake advantage of the convergence between ICT and biology tomodel the brain in a single multi-level system. The HBP willuse supercomputers to build and simulate brain models withunprecedented levels of biological detail, and use data from newsequencing and imaging technologies, cloud technology, and neu-roinformatics. The neuroinformatics community is already work-ing closely with the large-scale initiatives to ensure collaborationon computational neuroscience and neuroinformatics standardsand infrastructure.
The International Neuroinformatics Coordinating Facility(INCF) is an international organization established to coordinateinternational neuroinformatics infrastructure, and currently has17 member countries across North America, Europe, Australia,and Asia. With its international network of national nodes, INCFis well positioned to connect scientists from its member coun-tries with international large-scale brain initiatives to strengthenglobal collaboration and accelerate discovery in neuroscience.The INCF will play an increasingly important role in establishingand operating scientific programs to develop standards for neu-roscience data sharing, analysis, modeling, and simulation. Theglobal computational and informatics infrastructure will enablethe integration of neuroscience data and knowledge worldwide,and catalyze insights into brain function in health and disease.MASSIVE participation in the Victorian node of the INCF pro-vides an Australian centralized hardware and software facilityand a national focal point for imaging and neuroinformaticsexpertise.
The HPB and the US-led BRAIN Initiative sit alongside a num-ber of other major grand-challenge scientific endeavors, includingmapping the human genome or understanding the fabric of mat-ter and the universe using the CERN Large Hadron Collider or theSquare Kilometer Array. These endeavors each produce immensevolumes of data and are totally reliant on large-scale data pro-cessing to uncover new knowledge. Likewise, neuroscience isincreasingly a data and simulation driven science and facilitiessuch as MASSIVE are essential to develop new understandings ofthe brain.
CONCLUSIONNeuroscience and neuroinformatics is an area of priorityfor the governments of most research intensive countries.Computational HPC approaches are central to neuroscience andto emerging neuroscience technologies including robotics, intel-ligent systems, and medical bionics. HPC facilities are essentialfor any future economy based on knowledge intensive indus-tries. MASSIVE provides an Australian centralized hardware andsoftware facility and a focal point for imaging and neuroinfor-matics expertise. The development of MASSIVE has been basedon best practice in system integration methodologies, frame-works, and architectures. MASSIVE is now driving research inadvanced brain imaging MRI, x-ray CT, optical microscopy andincreasingly synchrotron x-ray and infrared imaging.
REFERENCESAmazon. (2013). High Performance Computing (HPC) on AWS [Online]. Amazon.
Available online at: http://aws.amazon.com/hpc-applications/ (AccessedOctober 12, 2013).
Behrens, T., Berg, H. J., Jbabdi, S., Rushworth, M., and Woolrich, M. (2007).Probabilistic diffusion tractography with multiple fibre orientations: what canwe gain? Neuroimage 34, 144–155. doi: 10.1016/j.neuroimage.2006.09.018
Bellec, P., Lavoie-Courchesne, S., Dickinson, P., Lerch, J. P., Zijdenbos, A. P., andEvans, A. C. (2012). The pipeline system for Octave and Matlab (PSOM): alightweight scripting framework and execution engine for scientific workflows.Front. Neuroinform. 6:7. doi: 10.3389/fninf.2012.00007
Buccigrossi, R., Ellisman, M., Grethe, J., Haselgrove, C., Kennedy, D. N., Martone,M., et al. (2007). “The neuroimaging informatics tools and resources clearing-house (NITRC),” in AMIA. . . Annual Symposium Proceedings/AMIA Symposium.AMIA Symposium, 1000.
CAVE2. (2013). Monash CAVE2 [Online]. Available online at: http://www.monash.
edu.au/cave2 [Accessed 1/12/2013].DaRIS. (2013). DaRIS [Online]. Available online at: http://nsp.nectar.org.
au/wiki-its-r/doku.php?id=datamanagement:daris (Accessed November 16,2013).
Domínguez, J. F., Egan, G. F., Gray, M. A., Churchyard, A., Chua, P., Stout, J. C.,et al. (2013). Multi-modal neuroimaging in premanifest and early Huntington’sdisease: 18 month longitudinal data from IMAGE-HD. PLoS ONE 8:e74131. doi:10.1371/journal.pone.0074131
Duyn, J. H., Van Gelderen, P., Li, T.-Q., De Zwart, J. A., Koretsky, A. P.,and Fukunaga, M. (2007). High-field MRI of brain cortical substructurebased on signal phase. Proc. Natl. Acad. Sci. U.S.A. 104, 11796–11801. doi:10.1073/pnas.0610821104
Egan, G. F., Barnes, D. G., Killeen, N., Lohrey, J., Liu, W., Goscinksi, W., et al.(2012). “A multi-modality neuroimaging research data informatics system,” in5th International Conference on Neuroinformatic (Munich).
Ekanayake, J., and Fox, G. (2010). “High performance parallel computing withclouds and cloud technologies,” in Cloud Computing, eds D. Avresky, M. Diaz,A. Bode, B. Ciciani, and E. Dekel (Berlin, Heidelberg: Springer), 20–38. doi:10.1007/978-3-642-12636-9_2
Foster, I., and Kesselman, C. (2003). The Grid 2: Blueprint for a New ComputingInfrastructure. San Francisco, CA: Elsevier.
Frisoni, G. B., Redolfi, A., Manset, D., Rousseau, M.-É., Toga, A., and Evans, A. C.(2011). Virtual imaging laboratories for marker discovery in neurodegenerativediseases. Nat. Rev. Neurol. 7, 429–438. doi: 10.1038/nrneurol.2011.99
Friston, K. J., Holmes, A. P., Worsley, K. J., Poline, J. P., Frith, C. D., and Frackowiak,R. S. (1994). Statistical parametric maps in functional imaging: a general linearapproach. Hum. Brain Mapp. 2, 189–210. doi: 10.1002/hbm.460020402
Georgiou-Karistianis, N., Gray, M. A., Domínguez D, J. F., Dymowski, A. R.,Bohanna, I., Johnston, L. A., et al. (2013). Automated differentiation of pre-diagnosis Huntington’s disease from healthy control individuals based onquadratic discriminant analysis of the basal ganglia: the IMAGE-HD study.Neurobiol. Dis. 51, 82–92. doi: 10.1016/j.nbd.2012.10.001
Giardine, B., Riemer, C., Hardison, R. C., Burhans, R., Elnitski, L., Shah, P., et al.(2005). Galaxy: a platform for interactive large-scale genome analysis. GenomeRes. 15, 1451–1455. doi: 10.1101/gr.4086505
Gorgolewski, K., Burns, C. D., Madison, C., Clark, D., Halchenko, Y. O., Waskom,M. L., et al. (2011). Nipype: a flexible, lightweight and extensible neuroimag-ing data processing framework in python. Front. Neuroinform. 5:13. doi:10.3389/fninf.2011.00013
Goscinski, W. (2013). “Informatics infrastructure for the australian neu-roscience community: the multi-modal australian sciences imaging andvisualisation environment and the characterisation virtual laboratory,” inFront. Neuroinform. Conference Abstract: Neuroinformatics 2013 (Stockholm:Frontiers).
Goscinski, W., and Gureyev, T. (2011). “The multi-modal australian sciencesimaging and visualisation environment (MASSIVE) for near realtime CT recon-struction using XLI,” in eResearch Australasia Conference (Melbourne).
Gray, M. A., Egan, G. F., Ando, A., Churchyard, A., Chua, P., Stout, J. C., et al.(2013). Prefrontal activity in Huntington’s disease reflects cognitive and neu-ropsychiatric disturbances: the IMAGE-HD study. Exp. Neurol. 239, 218–228.doi: 10.1016/j.expneurol.2012.10.020
Grethe, J. S., Baru, C., Gupta, A., James, M., Ludaescher, B., Martone, M. E., et al.(2005). Biomedical informatics research network: building a national collabo-ratory to hasten the derivation of new understanding and treatment of disease.Stud. Health Technol. Inform. 112, 100–110.
Greve, D., Mueller, B., Brown, G., Liu, T., and Glover, G. F. (2010).“Processing methods to reduce intersite variability in fMRI,” in Proceedings
Frontiers in Neuroinformatics www.frontiersin.org March 2014 | Volume 8 | Article 30 | 12

Goscinski et al. MASSIVE: applications in neuroinformatics
of the 16th Annual Meeting of the Organization for Human Brain Mapping(Barcelona).
Gureyev, T. E., Nesterets, Y., Ternovski, D., Thompson, D., Wilkins, S. W.,Stevenson, A. W., et al. (2011). “Toolbox for advanced X-ray image process-ing,” in Proc. SPIE 8141 B, 81410, 81410B-14 (San Diego, CA). doi: 10.1117/12.893252
Haitas, N., and Glatard, T. (2012). “Distributed computing for neurosciences: theN4U example,” in Journées Scientifiques Mésocentres et France Grilles.
HBP. (2012). The Human Brain Project: A Report to the European Commission.Lausanne: The HBP-PS Consortium.
Henderson, A., Ahrens, J., and Law, C. (2004). The ParaView Guide, 3rdEdn. Clifton Park, NY: Kitware, Inc. ISBN-10: 1930934211; ISBN-13: 978-1930934214
Janke, A. (2013). Successful Models, How to Make and Distribute Them, Lessons FromThe Past and Future Directions. San Diego, CA: Society For Neuroscience.
Killeen, N. E. B., Lohrey, J. M., Farrell, M., Liu, W., Garic, S., Abramson, D.,et al. (2012). “Integration of modern data management practice with scien-tific workflows,” in Proceedings of 8th IEEE International Conference on eScience(Chicago).
Laguitton, S., Riviere, D., Vincent, T., Fischer, C., Geffroy, D., Souedet, N., et al.(2011). “Soma-workflow: a unified and simple interface to parallel comput-ing resources,” in MICCAI Workshop on High Performance and DistributedComputing for Medical Imaging, Toronto.
Lee, J., Shmueli, K., Kang, B. T., Yao, B., Fukunaga, M., Van Gelderen, P.,et al. (2012). The contribution of myelin to magnetic susceptibility-weightedcontrasts in high-field MRI of the brain. Neuroimage 59, 3967–3975. doi:10.1016/j.neuroimage.2011.10.076
Liu, T., Liu, J., De Rochefort, L., Spincemaille, P., Khalidov, I., Ledoux, J. R.,et al. (2011). Morphology enabled dipole inversion (MEDI) from a single-angleacquisition: comparison with COSMOS in human brain imaging. Magn. Reson.Med. 66, 777–783. doi: 10.1002/mrm.22816
Liu, T., Spincemaille, P., De Rochefort, L., Kressler, B., and Wang, Y.(2009). Calculation of susceptibility through multiple orientation sampling(COSMOS): a method for conditioning the inverse problem from measuredmagnetic field map to susceptibility source image in MRI. Magn. Reson. Med.61, 196–204. doi: 10.1002/mrm.21828
Lohrey, J. M., Killeen, N. E., and Egan, G. F. (2009). An integrated object modeland method framework for subject-centric e-Research applications. Front.Neuroinform. 3:19. doi: 10.3389/neuro.11.019.2009
Ludäscher, B., Altintas, I., Berkley, C., Higgins, D., Jaeger, E., Jones, M., et al. (2006).Scientific workflow management and the Kepler system. Concurr. Comput. 18,1039–1065. doi: 10.1002/cpe.994
Marcus, D. S., Olsen, T. R., Ramaratnam, M., and Buckner, R. L. (2007). The exten-sible neuroimaging archive toolkit. Neuroinformatics 5, 11–33. doi: 10.1385/NI:5:1:11
Markram, H. (2006). The blue brain project. Nat. Rev. Neurosci. 7, 153–160. doi:10.1038/nrn1848
Markram, H. (2012). A countdown to a digital simulation of every last neuron inthe human brain. Sci. Am. 306.
NeCTAR. (2013). National eResearch Collaboration Tools and Resources (NeCTAR)Project [Online]. Available online at: http://www.nectar.org.au/
Nelson, M. R., Reid, C. M., Ames, D. A., Beilin, L. J., Donnan, G. A., Gibbs, P., et al.(2008). Feasibility of conducting a primary prevention trial of low-dose aspirinfor major adverse cardiovascular events in older people in Australia: results fromthe ASPirin in reducing events in the Elderly (ASPREE) pilot study–Research.Med. J. Aust. 189, 105–109.
Ng, A. (2013). Diffusion-Guided Quantitative Susceptibility Mapping. Salt Lake City,UT: ISMRM.
NITRC. (2013). NITRC Computational Environment [Online]. AWS Marketplace.Available online at: https://aws.amazon.com/marketplace/pp/B00AW0MBLO(Accessed October 31, 2013).
OpenStack. (2013). Openstack Cloud Software [Online]. Available online at: http://www.openstack.org/ (Accessed October 8, 2013).
Poudel, G. R., Egan, G. F., Churchyard, A., Chua, P., Stout, J. C., andGeorgiou-Karistianis, N. (2013). Abnormal synchrony of resting state net-works in premanifest and symptomatic Huntington disease: the IMAGE-HD study. J. Psychiatry Neurosci. 38, 120226–120226. doi: 10.1503/jpn.120226
Redolfi, A., McClatchey, R., Anjum, A., Zijdenbos, A., Manset, D., Barkhof, F.,et al. (2009). Grid infrastructures for computational neuroscience: the neuGRIDexample. Future Neurol. 4, 703–722. doi: 10.2217/fnl.09.53
Rex, D. E., Ma, J. Q., and Toga, A. W. (2003). The LONI pipeline processing envi-ronment. Neuroimage 19, 1033–1048. doi: 10.1016/S1053-8119(03)00185-X
Richards, K., Watson, C., Buckley, R. F., Kurniawan, N. D., Yang, Z., Keller, M.D., et al. (2011). Segmentation of the mouse hippocampal formation in mag-netic resonance images. Neuroimage 58, 732–740. doi: 10.1016/j.neuroimage.2011.06.025
Rivers, M. L., and Wang, Y. (2006). “Recent developments in microtomogra-phy at GeoSoilEnviroCARS,” in Optics and Photonics, Vol. 63180J-63180J-15 (San Diego, CA: International Society for Optics and Photonics). doi:10.1117/12.681144
Schmuck, F. B., and Haskin, R. L. (2002). “GPFS: a shared-disk file system for largecomputing clusters,” in FAST 02 Proceedings of the 1st USENIX Conference onFile and Storage Technologies (Monterey, CA), 19. doi: 10.1090/S0002-9947-02-03021-0
Sivagnanam, S., Astakhov, V., Yoshimoto, K., Carnevale, T., Martone, M.,Majumdar, A., et al. (2013). “A neuroscience gateway: software and implemen-tation,” in Proceedings of the Conference on Extreme Science and EngineeringDiscovery Environment: Gateway to Discovery (San Diego, CA: ACM), 31.
Smith, S. M., Jenkinson, M., Woolrich, M. W., Beckmann, C. F., Behrens, T. E.,Johansen-Berg, H., et al. (2004). Advances in functional and structural MRimage analysis and implementation as FSL. Neuroimage 23, S208–S219. doi:10.1016/j.neuroimage.2004.07.051
Ullmann, J. F., Keller, M. D., Watson, C., Janke, A. L., Kurniawan, N.D., Yang, Z., et al. (2012). Segmentation of the C57BL/6J mouse cere-bellum in magnetic resonance images. Neuroimage 62, 1408–1414. doi:10.1016/j.neuroimage.2012.05.061
Zalesky, A., Fornito, A., and Bullmore, E. T. (2010). Network-based statistic:identifying differences in brain networks. Neuroimage 53, 1197–1207. doi:10.1016/j.neuroimage.2010.06.041
Conflict of Interest Statement: The authors declare that the research was con-ducted in the absence of any commercial or financial relationships that could beconstrued as a potential conflict of interest.
Received: 19 December 2013; accepted: 10 March 2014; published online: 27 March2014.Citation: Goscinski WJ, McIntosh P, Felzmann U, Maksimenko A, Hall CJ, GureyevT, Thompson D, Janke A, Galloway G, Killeen NEB, Raniga P, Kaluza O, Ng A,Poudel G, Barnes DG, Nguyen T, Bonnington P and Egan GF (2014) The multi-modalAustralian ScienceS Imaging and Visualization Environment (MASSIVE) high perfor-mance computing infrastructure: applications in neuroscience and neuroinformaticsresearch. Front. Neuroinform. 8:30. doi: 10.3389/fninf.2014.00030This article was submitted to the journal Frontiers in Neuroinformatics.Copyright © 2014 Goscinski, McIntosh, Felzmann, Maksimenko, Hall, Gureyev,Thompson, Janke, Galloway, Killeen, Raniga, Kaluza, Ng, Poudel, Barnes, Nguyen,Bonnington and Egan. This is an open-access article distributed under the terms ofthe Creative Commons Attribution License (CC BY). The use, distribution or repro-duction in other forums is permitted, provided the original author(s) or licensor arecredited and that the original publication in this journal is cited, in accordance withaccepted academic practice. No use, distribution or reproduction is permitted whichdoes not comply with these terms.
Frontiers in Neuroinformatics www.frontiersin.org March 2014 | Volume 8 | Article 30 | 13