scientific visualization - purdue university
TRANSCRIPT

Scientific Visualization
Scott King
Summer School in Geophysical Porous Media: Multidisciplinary Science from Nano- to Global- Scale
July 17-28th Purdue University, West Lafayette

Define Scientific Visualization

Define Scientific Visualization
“There are three kinds of lies: lies, damn lies, and statistics.”

Define Scientific Visualization
“There are three kinds of lies: lies, damn lies, and statistics.”
-> you could replace statistics with scientific visualization

Define Scientific VisualizationVerisimilitude (from Latin verisimilitudo, from verus true + similitudo similitude) is the state or quality of something which exhibits the appearance of truth or reality.

Define Scientific Visualization
usually incorporates massive amounts of data
Verisimilitude (from Latin verisimilitudo, from verus true + similitudo similitude) is the state or quality of something which exhibits the appearance of truth or reality.

Define Scientific Visualization
usually incorporates massive amounts of data
aim for verisimilitude with the phenomena represented
aim to represent entire phenomena represented holistically by interpolation from data
use color extensively to encode magnitude of variables
animation? - often time
usually spatial data
Verisimilitude (from Latin verisimilitudo, from verus true + similitudo similitude) is the state or quality of something which exhibits the appearance of truth or reality.

The Goal: Clear Communication

A True Story

A True Story2 hour run on IBM BlueGene - 16k processors

A True Story2 hour run on IBM BlueGene - 16k processors
2.5 Billion years of evolution of Mercury

A True Story2 hour run on IBM BlueGene - 16k processors
2.5 Billion years of evolution of Mercury
>250,000 output files, >16 hours to tar and gzip

A True Story2 hour run on IBM BlueGene - 16k processors
2.5 Billion years of evolution of Mercury
>250,000 output files, >16 hours to tar and gzip
took 2 weeks to visualize result


Epiphany #10.0
0.2
0.4
0.6
0.8
1.0
Depth
0.0 0.2 0.4 0.6 0.8 1.0Distance
0.10.20.30.40.50.60.70.80 9
0.0 0.1 0.2 0.3 0.4 0.5 0.6 0.7 0.8 0.9 1.0 1.1
Find Errors in boundary
condition

Epiphany #2trying to look at plate topography from 2D convection models
theory: heatflow -> age(-1/2)Plates Control the Large-Scale Heatflow Pattern

Why?

Plate Time Series
-4000
-3000
-2000
-1000
0
1000
2000
3000
4000
Vsurface
0.0100 0.0125 0.0150 0.0175 0.0200
Time
MC3DConmanC2
105105
106
107
Vsu
rfa
ce P
ow
er
Spectr
um
0 20 40 60 80 100 120 140
Harmonic
MC3D
Conman
C2

What is driving advances in scientific visualization?: Graphics Cards

What is driving advances in scientific visualization?: Graphics Cards
780 Mtriangles/sec

What is driving advances in scientific visualization?: Graphics Cards
780 Mtriangles/sec
31.2 Gpixels/sec

What is driving advances in scientific visualization?: Graphics Cards
780 Mtriangles/sec
31.2 Gpixels/sec
cost $500 (Radeon X1900 XTX)

What is driving advances in scientific visualization?: Graphics Cards
780 Mtriangles/sec
31.2 Gpixels/sec
cost $500 (Radeon X1900 XTX)
thanks gamers...

What is driving advances in scientific visualization?: Graphics Cards
780 Mtriangles/sec
31.2 Gpixels/sec
cost $500 (Radeon X1900 XTX)
thanks gamers...
high-end cards pushing 150 Watts!

What is driving advances in scientific visualization?: Graphics Cards
780 Mtriangles/sec
31.2 Gpixels/sec
cost $500 (Radeon X1900 XTX)
thanks gamers...
high-end cards pushing 150 Watts!
projects exploring using the card as a parallel (array) processor

From S. J. Gould, “Full House” (1996) p. 109, Fig. 16
Gould argues that the absence of 400 hitters in baseball since Ted William’s 0.406 average in 1941 is the result of decrease in variability of players rather than an overall decline in talent.
An Example of Bad Graphics

An Example of Bad Graphics
Plotted correctly, it is harder to see a trend supporting the argument, and in fact the most interesting change seems to be from 1880-1910 and not post 1940.
2D Domains

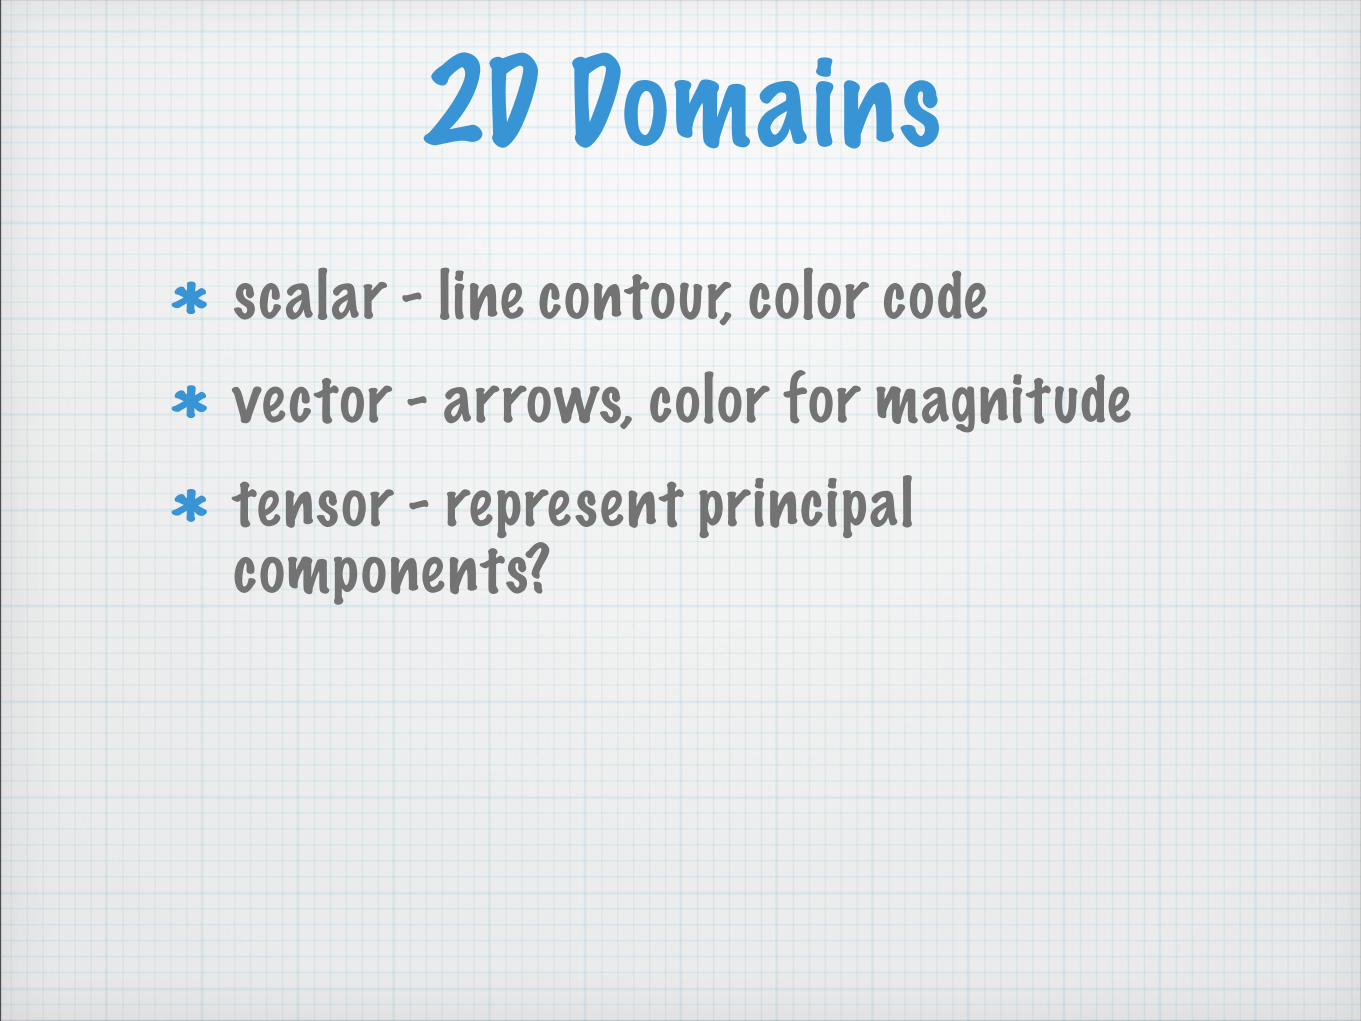
2D Domains
scalar - line contour, color code

2D Domains
scalar - line contour, color code
vector - arrows, color for magnitude
2D Domains
scalar - line contour, color code
vector - arrows, color for magnitude
tensor - represent principal components?

2D Domains
scalar - line contour, color code
vector - arrows, color for magnitude
tensor - represent principal components?
multiple fields? - composition + temperature

2D Domains
scalar - line contour, color code
vector - arrows, color for magnitude
tensor - represent principal components?
multiple fields? - composition + temperature
make use of third dimension?

Color Blindness8-12% of adult male population
0.5 % of female population
most common is red-greed deficiency

2D Examples...
0.0
0.2
0.4
0.6
0.8
1.0
De
pth
0.0 0.2 0.4 0.6 0.8 1.0Distance
0.0 0.1 0.2 0.3 0.4 0.5 0.6 0.7 0.8 0.9 1.0 1.1
0.0
0.2
0.4
0.6
0.8
1.0
De
pth
0.0 0.2 0.4 0.6 0.8 1.0Distance
0.0 0.1 0.2 0.3 0.4 0.5 0.6 0.7 0.8 0.9 1.0

2D Examples...0.0
0.2
0.4
0.6
0.8
1.0
De
pth
0.0 0.2 0.4 0.6 0.8 1.0Distance
0.05 0.15 0.25 0.35 0.45 0.55 0.65 0.75 0.85
0.0
0.2
0.4
0.6
0.8
1.0
De
pth
0.0 0.2 0.4 0.6 0.8 1.0Distance
0.0 0.1 0.2 0.3 0.4 0.5 0.6 0.7 0.8 0.9 1.0

Multiple 2D Fields?
temperature + composition
temperature + velocity (superimpose)
temperature + velocity + pressure

2D Examples...0.0
0.2
0.4
0.6
0.8
1.0
Depth
0.0 0.2 0.4 0.6 0.8 1.0Distance
-2000
-2000
-2000
-2000
-2000
-2000
-1500
-1500
-1500
-1500
-1500
-1500
-1000
-1000
-1000
-1000
-500
-500
-500
-500
0
0
0
0
500
500
500
500
500
500
1000
1000
1000
1000
1000
1000
1500
1500
1500
1500
0.0 0.1 0.2 0.3 0.4 0.5 0.6 0.7 0.8 0.9 1.0
color - temperature
contour - pressure
arrows - velocity

2D Examples...
color - pressure
contour - temperature
arrows - velocity
0.0
0.2
0.4
0.6
0.8
1.0
Depth
0.0 0.2 0.4 0.6 0.8 1.0Distance
0.20.4
0.4
0.4
0.6
0.6
0.6
0.8
-2000-1500-1000 -500 0 500 1000 1500 2000

3D Visualization TechniquesVisualization techniques can be divided into surface rendering techniques, and (direct) volume rendering techniques.
• Surface rendering is an indirect geometry based technique which is used to visualize structures in 3D scalar or vector fields by converting these structures into surface representations first and then using conventional computer graphics techniques to render these surfaces.
• Direct volume rendering is a technique for the visualization of 3D scalar data sets without a conversion to surface representations.

3D Fields
Surface Rendering
isosurface
orthogonal slicers
vector glyphs (arrows, etc.)
streamlines, streaklines

Volume Rendering - Ray Casting
Several implementations exist for ray casting. Here is the implementation used in Visualization Data Explorer.
For every pixel in the output image a ray is shot into the data volume.
At a predetermined number of evenly spaced locations along the ray the color and opacity values are obtained by interpolation.
The interpolated colors and opacities are merged with each other and with the background by compositing in back-to-front order to yield the color of the pixel.
These compositing calculations are simply linear transformations. Specifically, the color of the ray Cout as it leaves each sample location, is related to the color Cin of the ray, as it enters, and to the color c(xi) and the opacity a(x) at that sample location by a transparency formula...

3D Seismic Velocity
Perturbations
Ritsema and van Heijst, 2000
80˚W
80˚W
60˚W
60˚W
40˚W
40˚W
20˚W
20˚W
0˚
0˚
20˚E
20˚E
40˚E
40˚E
40˚S
30˚S
20˚S
10˚S
0˚
10˚N
20˚N
80˚W
80˚W
60˚W
60˚W
40˚W
40˚W
20˚W
20˚W
0˚
0˚
20˚E
20˚E
40˚E
40˚E
40˚S
30˚S
20˚S
10˚S
0˚
10˚N
20˚N
80˚W
80˚W
60˚W
60˚W
40˚W
40˚W
20˚W
20˚W
0˚
0˚
20˚E
20˚E
40˚E
40˚E
40˚S
30˚S
20˚S
10˚S
0˚
10˚N
20˚N
Grand, 2000
80˚W
80˚W
60˚W
60˚W
40˚W
40˚W
20˚W
20˚W
0˚
0˚
20˚E
20˚E
40˚E
40˚E
40˚S
30˚S
20˚S
10˚S
0˚
10˚N
20˚N
80˚W
80˚W
60˚W
60˚W
40˚W
40˚W
20˚W
20˚W
0˚
0˚
20˚E
20˚E
40˚E
40˚E
40˚S
30˚S
20˚S
10˚S
0˚
10˚N
20˚N
80˚W
80˚W
60˚W
60˚W
40˚W
40˚W
20˚W
20˚W
0˚
0˚
20˚E
20˚E
40˚E
40˚E
40˚S
30˚S
20˚S
10˚S
0˚
10˚N
20˚N
-5.0 -2.0 -1.5 -1.0 -0.5 0.0 0.5 1.0 1.5 2.0 5.0
dVs (%)

Isosurfaces

Orthogonal Slices

The problem with slices...

Orthogonal Slices

Stack Layers

3D Plate Movie

Stereo Visualization

Stereo Visualization
CAVE
big
expensive ($500k)
people to maintain it
access?
Passive Stereo (GeoWall)

Passive Stereo, an old idea
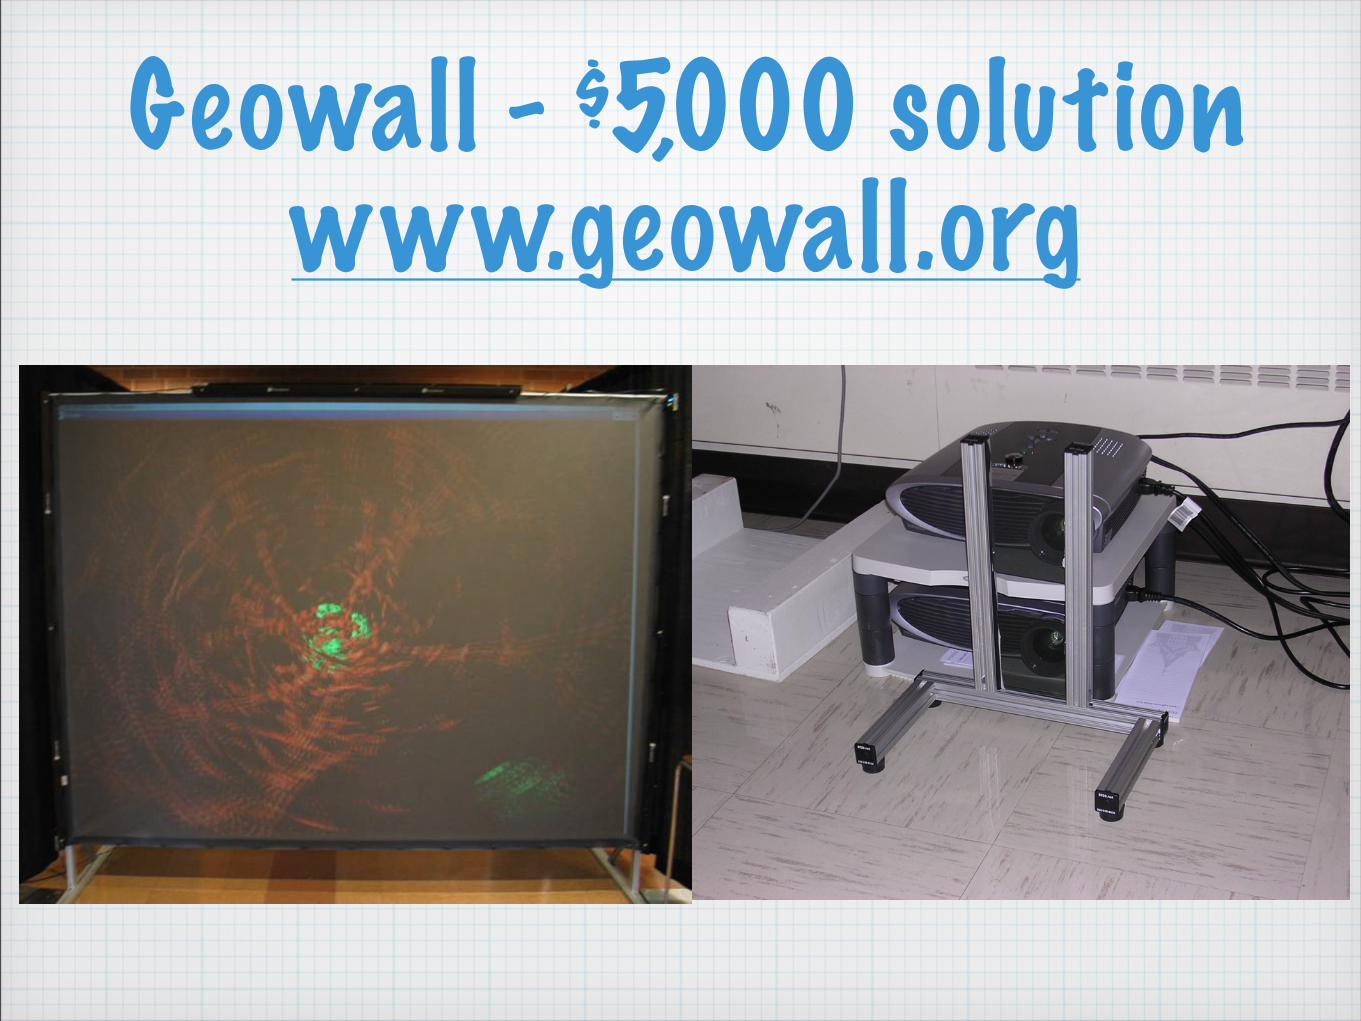

Projection of 3D slidesDual-lens projector, or two single lens projectors
Polarized filters over each projection lens, aligned at right angles
An aluminum (silver) or lenticular screen, not a white one. A white screen will de-polarize the light projected, destroying the stereo effect.
Polarized glasses that match the alignment of the projector lens polarizing filters.

0
50
100
150
200
250
2001
Jan M
arMay Ju
lSe
pNov
2002
Jan M
arMay Ju
lSe
p
Nu
mb
er
of
Wall
s
from Paul Morin

Red-Blue AnaglyphsA stereoscopic picture where the left and right eye images are superimposed, but in different colors. A color filter over each eye only transmits the image component suitable for that eye and the brain interprets the result in 3D.
Got photoshop? You can do it too: nzphoto.tripod.com/sterea/anaglyph_make.html


Tools

Toolsmaps
matlab map package
GMT (gmt.soest.hawaii.edu) - free!
many problem solving environments have their own graphics
avs, dx, IRIS Explorer, IBM Data Explorer, dx is free! www.opendx.org
gnuplot - www.gnuplot.info
amira - www.tgs.com
IDL - www.ittvis.com
NCAR = National Center for Atmospheric Research - ngwww.ucar.edu ; www.ncl.ucar.edu