the malina oceanographic expedition: how do changes in …
TRANSCRIPT

Earth Syst. Sci. Data, 13, 1561–1592, 2021https://doi.org/10.5194/essd-13-1561-2021© Author(s) 2021. This work is distributed underthe Creative Commons Attribution 4.0 License.
The MALINA oceanographic expedition: how do changesin ice cover, permafrost and UV radiation impact
biodiversity and biogeochemical fluxesin the Arctic Ocean?
Philippe Massicotte1, Rainer M. W. Amon2,3, David Antoine4,5, Philippe Archambault6,Sergio Balzano7,8,a, Simon Bélanger9, Ronald Benner10,11, Dominique Boeuf7, Annick Bricaud5,
Flavienne Bruyant1, Gwenaëlle Chaillou12, Malik Chami13, Bruno Charrière14, Jing Chen15,Hervé Claustre5, Pierre Coupel1, Nicole Delsaut14, David Doxaran5, Jens Ehn16, Cédric Fichot17,
Marie-Hélène Forget1, Pingqing Fu18, Jonathan Gagnon1, Nicole Garcia19, Beat Gasser20,Jean-François Ghiglione21, Gaby Gorsky5, Michel Gosselin12, Priscillia Gourvil22, Yves Gratton23,
Pascal Guillot12, Hermann J. Heipieper24, Serge Heussner14, Stanford B. Hooker25, Yannick Huot26,Christian Jeanthon7, Wade Jeffrey27, Fabien Joux21, Kimitaka Kawamura28, Bruno Lansard29,
Edouard Leymarie5, Heike Link30, Connie Lovejoy1, Claudie Marec1,31, Dominique Marie7,Johannie Martin32, Jacobo Martín33,34, Guillaume Massé1,35, Atsushi Matsuoka1, Vanessa McKague36,
Alexandre Mignot5,37, William L. Miller38, Juan-Carlos Miquel20, Alfonso Mucci39, Kaori Ono40,Eva Ortega-Retuerta21, Christos Panagiotopoulos19, Tim Papakyriakou16, Marc Picheral5,Louis Prieur5, Patrick Raimbault19, Joséphine Ras5, Rick A. Reynolds41, André Rochon12,Jean-François Rontani19, Catherine Schmechtig42, Sabine Schmidt43, Richard Sempéré19,
Yuan Shen10,44, Guisheng Song45,46, Dariusz Stramski41, Eri Tachibana40, Alexandre Thirouard5,Imma Tolosa20, Jean-Éric Tremblay1, Mickael Vaïtilingom47, Daniel Vaulot7,48, Frédéric Vaultier19,
John K. Volkman49, Huixiang Xie12, Guangming Zheng41,50,51, and Marcel Babin1
1Département de biologie, Takuvik Joint International Laboratory/UMI 3376,ULAVAL (Canada) – CNRS (France), Université Laval, Québec, QC, Canada
2Department of Marine and Coastal Environmental Science, Texas A&M University Galveston Campus,Galveston, Texas 77553, USA
3Department of Oceanography, Texas A&M University, College Station, Texas 77843, USA4Remote Sensing and Satellite Research Group, School of Earth and Planetary Sciences,
Curtin University, Perth, WA 6845, Australia5Sorbonne Université, CNRS, Laboratoire d’Océanographie de Villefranche (LOV)/UMR 7093,
06230 Villefranche-sur-Mer, France6ArcticNet, Québec-Océan, Takuvik Joint International Laboratory/UMI 3376,ULAVAL (Canada) – CNRS (France), Université Laval, Québec, QC, Canada
7Sorbonne Université, CNRS, Station Biologique de Roscoff – Adaptation et Diversitéen Milieu Marin/UMR 7144, 29680 Roscoff, France
8NIOZ Royal Netherlands Institute for Sea Research, Den Burg, the Netherlands9Département de Biologie, Chimie et Géographie (groupes BORÉAS et Québec-Océan),
Université du Québec à Rimouski, Rimouski, QC, Canada10School of the Earth, Ocean and Environment, University of South Carolina,
Columbia, South Carolina 29208, USA11Department of Biological Sciences, University of South Carolina, Columbia, South Carolina 29208, USA
12Québec-Océan, Institut des sciences de la mer de Rimouski (ISMER),Université du Québec à Rimouski, Rimouski, QC, Canada
Published by Copernicus Publications.

1562 P. Massicotte et al.: The MALINA oceanographic expedition: an overview
13Sorbonne Université, CNRS, Laboratoire Atmosphères Milieux Observations Spatiales(LATMOS)/UMR 8190, Boulevard de l’Observatoire, CS 34229, 06304 Nice CEDEX, France
14Université de Perpignan Via Domitia (UPVD), CNRS, Centre de Formation et de Recherche sur lesEnvironnements Méditerranéens (CEFREM)/UMR 5110, 52 Avenue Paul Alduy,
66860 Perpignan CEDEX, France15School of Environmental Science and Engineering, Tianjin University, Tianjin, 300072, China
16Centre for Earth Observation Science, Department of Environment and Geography,University of Manitoba, Winnipeg, MB, Canada
17Department of Earth and Environment, Boston University, Boston, Massachusetts 02215, USA18Institute of Surface-Earth System Science, Tianjin University, Tianjin, China
19Aix Marseille Université, Université de Toulon, CNRS, IRD, MIO UM 110, 13288 Marseille, France20International Atomic Energy Agency (IAEA)/Environment Laboratories, MC98000, Monaco, Monaco
21Sorbonne Université, CNRS, Laboratoire d’Océanographie Microbienne (LOMIC)/UMR 7621,Observatoire Océanologique de Banyuls, Banyuls sur mer, France
22Sorbonne Université, CNRS, Station Biologique de Roscoff – Centre de recherche et d’enseignementen biologie et écologie marines/FR2424, 29680 Roscoff, France
23Institut national de la recherche scientifique – Centre Eau Terre Environnement (INRS-ETE),Québec, QC, Canada
24Department of Environmental Biotechnology, Helmholtz Centre for Environmental Research – UFZ,Permoserstraße 15, 04318 Leipzig, Germany
25Ocean Ecology Laboratory, NASA Goddard Space Flight Center, Greenbelt, Maryland, United States26Département de géomatique appliquée, Université de Sherbrooke, Sherbrooke, QC, Canada
27Center for Environmental Diagnostics & Bioremediation, University of West Florida,11000 University Parkway, Pensacola, Florida 32514, USA
28Chubu Institute for Advanced Studies, Chubu University, Kasugai, Japan29IPSL and Université Paris-Saclay, CEA-CNRS-UVSQ, Laboratoire des Sciences du Climat et de
l’Environnement (LSCE)/UMR 8212, 91190 Gif-sur-Yvette, France30Department Maritime Systems, University of Rostock, 18059 Rostock, Germany
31Université de Bretagne Occidentale – UBO, CNRS, IRD, Institut Universitaire Européen de la Mer(IUEM)/UMS 3113, 29280 Plouzané, France
32Québec-Océan & Département de biologie, Université Laval, Québec, QC, Canada33Centro Austral de Investigaciones Científicas (CADIC-CONICET), Houssay 200, 9410 Ushuaia, Argentina
34ICPA-UNTDF, Ushuaia, Argentina35Station Marine de Concarneau, MNHN-CNRS-UPMC-IRD, Laboratoire d’océanographie et du climat:
expérimentations et approches numériques (LOCEAN)/UMR 7159, 29900 Concarneau, France36Center for Marine and Environmental Studies, University of the Virgin Islands, St. Thomas, Virgin Islands,
USA37Mercator Ocean International, Parc Technologique du Canal, 8–10 rue Hermès –
Bâtiment C, 31520 Ramonville Saint-Agne, France38Department of Marine Sciences, University of Georgia, 325 Sanford Dive, Athens, Georgia 30602, USA
39GEOTOP and Department of Earth and Planetary Sciences, McGill University, Montréal, QC, Canada40Institute of Low Temperature Science, Hokkaido University, Sapporo, 060-0819, Japan
41Marine Physical Laboratory, Scripps Institution of Oceanography, University of California San Diego,La Jolla, California 92093-0238, USA
42Sorbonne Université, CNRS, Ecce Terra Observatoire des Sciences de l’Univers (OSU) – UMS 3455,4, Place Jussieu 75252 Paris CEDEX 05, France
43Université de Bordeaux, CNRS, OASU, Environnements et PaléoenvironnementsOcéaniques et Continentaux (EPOC)/UMR 5805, 33615 Pessac, France
44State Key Laboratory of Marine Environmental Science, College of Ocean and Earth Sciences,Xiamen University, Xiamen, Fujian, China
45Institut des sciences de la mer de Rimouski (ISMER), Université du Québec à Rimouski,Rimouski, QC, Canada
46School of Marine Science and Technology, Tianjin University, Tianjin, 300072, China47Université des Antilles Pointe-à-Pitre, Laboratoire de Recherche en Géosciences et Energies
(LARGE)/EA 4539, Guadeloupe, France
Earth Syst. Sci. Data, 13, 1561–1592, 2021 https://doi.org/10.5194/essd-13-1561-2021
P. Massicotte et al.: The MALINA oceanographic expedition: an overview 1563
48Asian School of the Environment, Nanyang Technological University, Singapore49CSIRO Marine and Atmospheric Research and CSIRO Wealth from Oceans National Research Flagship,
GPO Box 1538, Hobart, Tasmania 7001, Australia50NOAA/NESDIS Center for Satellite Applications and Research, 5830 University Research Court,
College Park, Maryland 20740, USA51Earth System Science Interdisciplinary Center, University of Maryland Research Park,
5825 University Research Court, College Park, MD 20740, USAapresent address: Stazione Zoologica Anton Dohrn Napoli (SZN), Naples, Italy
Correspondence: Marcel Babin ([email protected])
Received: 26 August 2020 – Discussion started: 19 October 2020Revised: 12 February 2021 – Accepted: 15 February 2021 – Published: 15 April 2021
Abstract. The MALINA oceanographic campaign was conducted during summer 2009 to investigate the car-bon stocks and the processes controlling the carbon fluxes in the Mackenzie River estuary and the Beaufort Sea.During the campaign, an extensive suite of physical, chemical and biological variables were measured acrossseven shelf–basin transects (south–north) to capture the meridional gradient between the estuary and the openocean. Key variables such as temperature, absolute salinity, radiance, irradiance, nutrient concentrations, chloro-phyll a concentration, bacteria, phytoplankton and zooplankton abundance and taxonomy, and carbon stocks andfluxes were routinely measured onboard the Canadian research icebreaker CCGS Amundsen and from a bargein shallow coastal areas or for sampling within broken ice fields. Here, we present the results of a joint effort tocompile and standardize the collected data sets that will facilitate their reuse in further studies of the changingArctic Ocean. The data set is available at https://doi.org/10.17882/75345 (Massicotte et al., 2020).
1 Introduction
The Mackenzie River is the largest source of terrestrial par-ticles entering the Arctic Ocean (see Doxaran et al., 2015,and references therein). During the past decades, tempera-ture rise, permafrost thawing, coastal erosion and increas-ing river runoff have contributed to intensifying the exportof terrestrial carbon by the Mackenzie River to the ArcticOcean (e.g., Tank et al., 2016). Furthermore, the environ-mental changes currently happening in the Arctic may haveprofound impacts on the biogeochemical cycling of this ex-ported carbon. On one hand, reduction in sea ice extent andthickness exposes a larger fraction of the ocean surface tohigher solar radiation and increases the mineralization ofthis carbon into atmospheric CO2 through photo-degradation(Miller and Zepp, 1995; Bélanger et al., 2006b). On the otherhand, the possible increase in nutrients brought by Arcticrivers may contribute to higher autotrophic production andsequestration of organic carbon (Tremblay et al., 2014).
Given that these production and removal processes are op-erating simultaneously, the fate of Arctic river carbon transit-ing toward the Arctic Ocean is not entirely clear. Hence, de-tailed studies about these processes are needed to determineif the Arctic Ocean will become a biological source or a sinkof atmospheric CO2. With regard to this question, the MA-LINA oceanographic expedition was designed to documentand gain insight into the stocks and the processes control-ling carbon fluxes in the Mackenzie River and the Beaufort
Sea. Specifically, the main objective of the MALINA oceano-graphic expedition was to determine how (1) primary pro-duction, (2) bacterial activity and (3) organic-matter photo-oxidation influence carbon fluxes and cycling in the Cana-dian Beaufort Sea. In this article, we present an overviewof an extensive and comprehensive data set acquired froma coordinated international sampling effort conducted in theMackenzie River and in the Beaufort Sea in August 2009.
2 Study area, environmental conditions andsampling strategy
2.1 Study area and environmental conditions
The MALINA oceanographic expedition was conducted be-tween 30 July and 25 August 2009 in the Mackenzie Riverand the Beaufort Sea systems (Fig. 1). Figure 2 shows anoverview of the sea ice conditions that prevailed during theexpedition. In Fig. 2a, a true-color image from MODIS Terrareveals how the sea ice pack was fragmented toward the endof the expedition, specially near the 200 m isobath (identifiedby the continuous red line). On the shelf, the sea ice concen-tration was higher at the beginning of the expedition. Duringthe 4-week cruise, the ice concentration gradually decreasedtoward the north (Fig. 2b).
The Mackenzie River basin is the largest in northernCanada and covers an area of approximately 1 805 000 km2,which represents around 20 % of the total land area of
https://doi.org/10.5194/essd-13-1561-2021 Earth Syst. Sci. Data, 13, 1561–1592, 2021
1564 P. Massicotte et al.: The MALINA oceanographic expedition: an overview
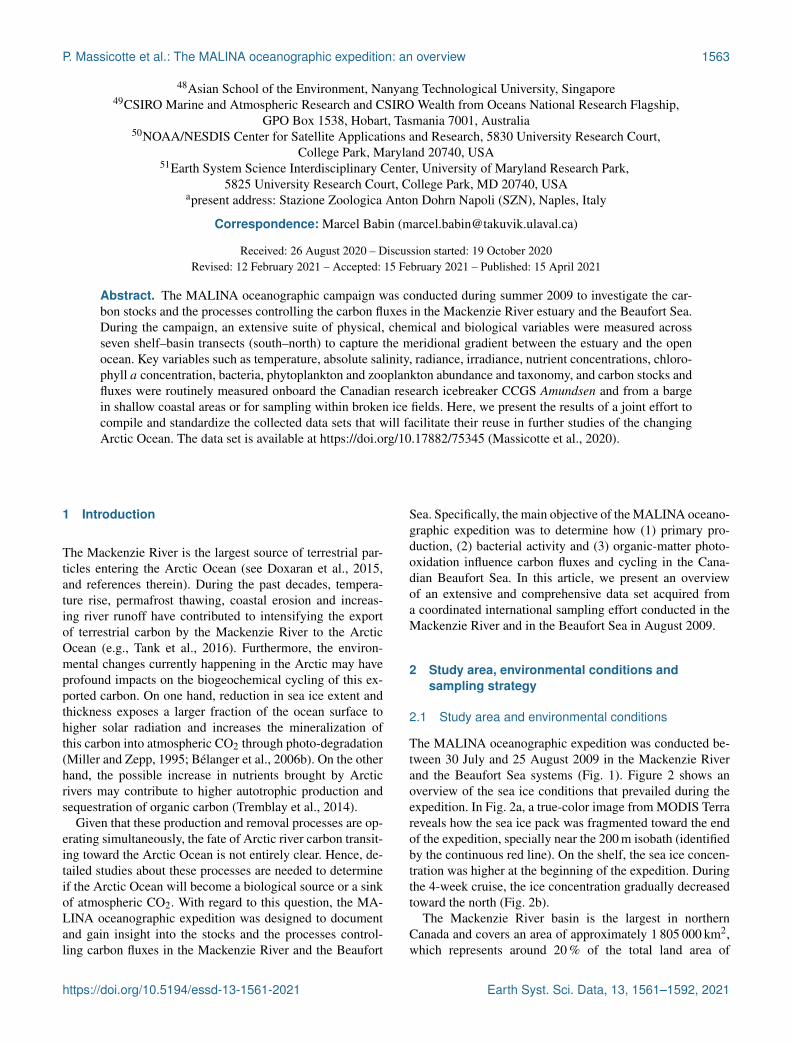
Figure 1. (a) Localizations of the sampling sites visited during the MALINA 2009 campaign. The colors of the dots represent the seventransects visited during the mission. (b) Bathymetric profiles for transects 600 and 300. Bathymetric data from General Bathymetric Chartof the Oceans (GEBCO) (https://download.gebco.net/).
Canada (Abdul Aziz and Burn, 2006). Between 1972 and2016, the average monthly discharge (recorded at the ArcticRed River station) varied between 3296 and 23 241 m3 s−1
(shaded area in Fig. 3a). The period of maximum dischargeusually occurs at the end of May, with decreasing dischargeuntil December, whereas the period of low and stable dis-charge extends between December and May. During the MA-LINA oceanographic cruise, the daily discharge varied be-tween 12 600 and 15 100 m3 s−1 (red segment in Fig. 3a;see also Ehn et al., 2019). Draining a vast watershed, theMackenzie River annually delivers on average 2100 and1400 Gg C yr−1 of particulate organic carbon (POC) and dis-solved organic carbon (DOC), respectively, into the ArcticOcean (Stein and Macdonald, 2004; Raymond et al., 2007).During the expedition conducted onboard the CCGS Amund-sen, the air temperature recorded by the foredeck meteoro-logical tower varied between −2 and 11 ◦C (Fig. 3b). The
average air temperature was 3 ◦C and usually remained above0 ◦C.
2.2 General sampling strategy
The sampling was conducted over a network of samplingstations organized into seven transects identified with threedigits: 100, 200, 300, 400, 500, 600 and 700 (Fig. 1a). Sta-tions were sampled across these seven shelf–basin transects(south–north) to capture the meridional gradient between theestuary and the open ocean (except for transect 100 across themouth of the Amundsen Gulf). Within each transect, stationnumbers were listed in descending order from south to north.Because our goal was to sample in open waters, the order inwhich the transects were visited depended on the ice cover.On 20 July 2009, just before the mission, a relatively largeportion of the shelf was still covered by sea ice (Fig. 2b).Soon after the beginning of the cruise, most of the shelf area
Earth Syst. Sci. Data, 13, 1561–1592, 2021 https://doi.org/10.5194/essd-13-1561-2021

P. Massicotte et al.: The MALINA oceanographic expedition: an overview 1565
Figure 2. (a) True-color image from MODIS Terra (data fromhttps://wvs.earthdata.nasa.gov, last access: 1 February 2021). (b)Weekly sea ice concentration from the US National Ice Center (U.S.National Ice Center, 2020). The red line shows the 200 m isobath(data from http://www.naturalearthdata.com, last access: 1 Febru-ary 2021). The dots represent the stations (see Fig. 1 for the legend).
was ice-free. The shelf region was not ice-free before mid-August. The bathymetry at the sampling stations varied be-tween 2 and 1847 m (394± 512 m, mean± standard devia-tion). The stations located in the Beaufort Sea were sampledonboard the Canadian research icebreaker CCGS Amundsen.Biological, chemical and optical water column sampling wasalmost always restricted to the first 400 m of the water col-umn during daytime. Deeper profiles for sampling the wholewater column and bottom sediment were usually repeated
during nighttime at the same stations. Sediment samplingfor fauna and biogeochemistry was conducted at eight sta-tions (110, 140, 235, 260, 345, 390, 680, 690). Two tran-sects (600 and 300) were extended to very shallow waters onthe shelf and sampled from either a zodiac or a barge (thebathymetry profiles are shown in Fig. 1b). In the context ofthis data paper, these two transects were chosen to present anoverview of the principal variables measured during the MA-LINA campaign. A summary of the various sampling strate-gies is presented below.
2.3 CTD and rosette deployment
Onboard the CCGS Amundsen, a general oceanic rosetteequipped with a CTD (instrument for measuring conductiv-ity, temperature, and depth; Sea-Bird SBE-911+) was de-ployed at each sampling station (Fig. 1). The rosette wasequipped with twenty-four 12 L Niskin bottles. The rosettewas also equipped with a transmissometer sensor (Wetlabs),a photosynthetic active radiation (PAR) sensor (Biospheri-cal), an oxygen sensor (SBE-43), a pH sensor (SBE-18),a nitrate sensor (Satlantic ISUS), a fluorometer (Seapoint)and an altimeter (Benthos). A surface PAR (Biospherical)was also installed on the roof of the rosette control lab-oratory. A UVP5 (underwater vision profiler, Hydroptics)was also mounted on the rosette frame, providing size andabundance of particles above 200 µm and plankton above700 µm. The rosette data processing and quality control aredescribed in detail in Guillot and Gratton (2010). Data pro-cessing included the following steps: validation of the cal-ibration coefficients, conversion of data to physical units,alignment correction and extraction of useless data. Oxy-gen sensor calibration was done using Winkler titrations,and salinity data were compared with water samples ana-lyzed with a Guildline 8400B Autosal. The quality controltests were based on the International Oceanographic Com-mission’s suggested procedures and UNESCO’s algorithmstandards (Commission of the European Community, 1993).The recorded data were averaged every decibar. On 5 August,the pH sensor was replaced by a chromophoric dissolved or-ganic matter (CDOM) fluorometer (excitation: 350–460 nm;emission: 550 nm; half-width (HW) 40 nm; Dr. Haardt Op-tik Mikroelektronik). The rosette depth range was restrictedto the first 1000 m when carrying the pH, PAR and nitratesensors because of their rating.
2.4 Sediment sampling
Surface sediments were sampled using an USNEL box corer(50× 50× 40 cm). Box cores with undisturbed surfaces weresubsampled for (a) lipids (Rontani et al., 2012b) and iso-topic signature of lipid biomarkers (Tolosa et al., 2013), sta-ble isotopes (C, N), and manganese and iron oxides (Linket al., 2013a) in the 1 cm surface layer; (b) sediment pigmentprofiles down to 8 cm; and (c) fluxes at the sediment–water
https://doi.org/10.5194/essd-13-1561-2021 Earth Syst. Sci. Data, 13, 1561–1592, 2021

1566 P. Massicotte et al.: The MALINA oceanographic expedition: an overview
Figure 3. (a) Daily discharge of the Mackenzie River at the Arctic Red River junction (station 10LC014). The black line corresponds tothe 2009 discharge, whereas the colored segment identifies the period of the MALINA campaign. The shaded area is the mean dischargecalculated between 1972 and 2016. Discharge data from the government of Canada (https://wateroffice.ec.gc.ca/search/historical_e.html,last access: 6 September 2019). (b) Hourly air temperature recorded from the foredeck meteorological tower of the Amundsen during thecampaign.
interface using onboard microcosm incubations on subcores(10 cm diameter, 20 cm deep) (Link et al., 2013a, 2019). Atthree stations (140, 345, 390), macrofauna abundance and di-versity were determined from sieved and conserved samples(Link et al., 2019). At station 680, a core was subsampled at1 cm to determine dinocyst abundance and dated using 210Pband 137Cs (Durantou et al., 2012). Samples for (a)–(b) werestored frozen until analysis in the respective home labs.
3 Data quality control and data processing
Different quality control procedures were adopted to ensurethe integrity of the data. First, the raw data were visuallyscreened to eliminate errors originating from the measure-ment devices, including sensors (systematic or random) anderrors inherent from measurement procedures and methods.Statistical summaries such as average, standard deviation andrange were computed to detect and remove anomalous valuesin the data. Then, data were checked for duplicates and re-maining outliers. The complete list of variables is presentedin Table 1.
4 Data description: an overview
The following sections present an overview of a subset ofselected variables from the water column. For these selectedvariables, a brief description of the data collection methodsis presented along with general results.
4.1 Water mass distribution
According to previous studies (Carmack et al., 1989; Mac-donald et al., 1989), five main source water types can bedistinguished in the southeastern Beaufort Sea: (1) mete-oric water (MW; Mackenzie River plus precipitation), (2) seaice meltwater (SIM), (3) winter polar mixed layer (wPML),(4) upper-halocline water (UHW; modified Pacific waterwith core salinity of 33.1 PSU) and (5) lower-halocline wa-ter (LHW; water of Atlantic origin). In this study, we usedthe optimum multiparameter (OMP) algorithm to quantifythe relative contributions of the different source water typesto the observed data (https://omp.geomar.de/, last access:1 February 2021). We used salinity, TA and δ18O as conser-vative tracers as well as temperature and O2 concentration asnon-conservative tracers, to constrain the water mass analy-sis following Lansard et al. (2012). Briefly, the method finds
Earth Syst. Sci. Data, 13, 1561–1592, 2021 https://doi.org/10.5194/essd-13-1561-2021

P. Massicotte et al.: The MALINA oceanographic expedition: an overview 1567
Tabl
e1.
Para
met
ers
mea
sure
ddu
ring
the
MA
LIN
Aoc
eano
grap
hic
expe
ditio
n.Pa
ram
eter
sar
eor
dere
dal
phab
etic
ally
.
Para
met
ers
Sam
plin
gPr
inci
pal
Incl
uded
inth
eR
efer
ence
inve
stig
ator
sda
tare
posi
tory
137 C
sda
ting
ofco
resa
mpl
esG
amm
asp
ectr
omet
erC
alyp
soSq
uare
(CA
SQ)c
orer
Roc
hon
A./S
chm
idt
No
113
7 Cs
datin
gof
core
sam
ples
Gam
ma
spec
trom
etry
Box
core
rR
ocho
nA
.,Sc
hmid
tN
o1
14C
datin
gof
core
sam
ples
Acc
eler
ator
mas
ssp
ectr
omet
ryB
oxco
rer
Roc
hon
A.
No
114
Cda
ting
ofco
resa
mpl
esA
ccel
erat
orm
ass
spec
trom
etry
CA
SQco
rer
Roc
hon
A.
No
115
Nam
mon
ium
assi
mila
tion
15N
spik
ing
–in
cuba
tion
–m
ass
spec
trom
etry
Ros
ette
–de
ckin
cuba
tions
Trem
blay
J.E
.,R
aim
baul
tP.
Yes
2,3,
415
Nam
mon
ium
assi
mila
tion
15N
spik
ing
–in
cuba
tion
–m
ass
spec
trom
etry
Ros
ette
insi
tupr
oduc
tion
line
Trem
blay
J.E
.,R
aim
baul
tP.
Yes
2,3,
415
Nam
mon
ium
oxid
atio
n(n
itrifi
catio
n)15
Nsp
ikin
g–
incu
batio
n–
mas
ssp
ectr
omet
ryR
oset
te–
deck
incu
batio
nsTr
embl
ayJ.
E.,
Rai
mba
ultP
.Y
es2,
3,4
15N
amm
oniu
mox
idat
ion
(nitr
ifica
tion)
15N
spik
ing
–in
cuba
tion
–m
ass
spec
trom
etry
Ros
ette
insi
tupr
oduc
tion
line
Trem
blay
J.E
.,R
aim
baul
tP.
Yes
2,3,
415
Nam
mon
ium
prim
ary
prod
uctio
n(13
C)
15N
spik
ing
–in
cuba
tion
–m
ass
spec
trom
etry
Ros
ette
–de
ckin
cuba
tions
Trem
blay
J.E
.,R
aim
baul
tP.
Yes
2,3,
415
Nam
mon
ium
rege
nera
tion
15N
spik
ing
–in
cuba
tion
–m
ass
spec
trom
etry
Ros
ette
–de
ckin
cuba
tions
Trem
blay
J.E
.,R
aim
baul
tP.
Yes
2,3,
415
Nam
mon
ium
rege
nera
tion
15N
spik
ing
–in
cuba
tion
–m
ass
spec
trom
etry
Ros
ette
insi
tupr
oduc
tion
line
Trem
blay
J.E
.,R
aim
baul
tP.
Yes
2,3,
415
NN
2fix
atio
n15
Nsp
ikin
g–
incu
batio
n–
mas
ssp
ectr
omet
ryR
oset
tew
ater
sam
ple
Trem
blay
J.E
.,R
aim
baul
tP.
No
2,3,
415
Nni
trat
eas
sim
ilatio
n15
Nsp
ikin
g–
incu
batio
n–
mas
ssp
ectr
omet
ryR
oset
te–
deck
incu
batio
nsTr
embl
ayJ.
E.,
Rai
mba
ultP
.Y
es2,
3,4
15N
nitr
ate
assi
mila
tion
15N
spik
ing
–in
cuba
tion
–m
ass
spec
trom
etry
Ros
ette
insi
tupr
oduc
tion
line
Trem
blay
J.E
.,R
aim
baul
tP.
Yes
2,3,
421
0 Pb
geoc
hron
olog
yof
core
sam
ples
209 P
oal
pha
spec
trom
etry
Box
core
rR
ocho
nA
.N
o1
210 P
bge
ochr
onol
ogy
ofco
resa
mpl
es20
9 Po
alph
asp
ectr
omet
ryC
ASQ
core
rR
ocho
nA
.N
o1
234 T
h(1
µm<
part
icle
s>70
µm)
Bet
a-co
untin
gFo
rede
ckin
situ
pum
pG
asse
rB.
Yes
234 T
h(p
artic
les>
70µm
)B
eta-
coun
ting
Fore
deck
insi
tupu
mp
Gas
serB
.Y
es23
4 Th
(Par
ticul
ate)
Bet
a-co
untin
gD
rift
ing
sedi
men
ttra
pG
asse
rB.
Yes
5A
APB
(abu
ndan
ce)
IRm
icro
scop
y,flu
orim
etry
;FIS
HR
oset
tew
ater
sam
ple
Jean
thon
C.,
Boe
ufD
.Y
es6
AA
PB(a
bund
ance
)IR
mic
rosc
opy,
fluor
imet
ry;F
ISH
Zod
iac
wat
ersa
mpl
eJe
anth
onC
.,B
oeuf
D.
Yes
6A
bsor
ptio
n(p
artic
ulat
e)Po
int-
sour
cein
tegr
atin
g-ca
vity
abso
rptio
nm
eter
(PSI
CA
M)
Bar
gew
ater
sam
ple
Ley
mar
ieE
.Y
esA
bsor
ptio
n(p
artic
ulat
e)PS
ICA
MR
oset
tew
ater
sam
ple
Ley
mar
ieE
.Y
esA
bsor
ptio
n(p
artic
ulat
e)Sp
ectr
opho
tom
eter
(filte
rs)
Bar
gew
ater
sam
ple
Bel
ange
rS.
Yes
7,8
Abs
orpt
ion
(par
ticul
ate)
Spec
trop
hoto
met
er(fi
lters
)C
ontin
uous
onw
ayB
elan
gerS
.Y
es7,
8A
bsor
ptio
n(p
artic
ulat
e)Sp
ectr
opho
tom
eter
(filte
rs)
Ros
ette
wat
ersa
mpl
eB
elan
gerS
.Y
es7,
8A
bsor
ptio
n(p
artic
ulat
e)Sp
ectr
opho
tom
eter
(filte
rs)
Zod
iac
profi
ler
Bel
ange
rS.
Yes
7,8
Abs
orpt
ion
(tot
al)
PSIC
AM
Bar
gew
ater
sam
ple
Ley
mar
ieE
.Y
esA
bsor
ptio
n(t
otal
)PS
ICA
MR
oset
tew
ater
sam
ple
Ley
mar
ieE
.Y
esA
bsor
ptio
nco
effic
ient
(tot
al)(
nine
wav
elen
gths
)W
etla
bsA
C9
seri
alno
.156
Ros
ette
profi
ler
Ehn
J.Y
esA
bsor
ptio
nco
effic
ient
(tot
al)(
nine
wav
elen
gths
inIR
)W
etla
bsA
C9
seri
alno
.303
Bar
gepr
ofile
rD
oxar
anD
.Y
es9
Abs
orpt
ion
coef
ficie
nt(t
otal
)(ni
new
avel
engt
hs)
Wet
labs
AC
9se
rial
no.2
79B
arge
profi
ler
Dox
aran
D.
Yes
10,1
1A
irre
lativ
ehu
mid
ityH
umid
ityse
nsor
Fore
deck
met
eoro
logi
calt
ower
Papa
kyri
akou
T.Y
esA
lkal
inity
tota
l(TA
)Po
tent
iom
etry
Bar
gew
ater
sam
ple
Muc
ciA
.,L
ansa
rdB
.Y
es12
,13,
14A
lkal
inity
tota
l(TA
)Po
tent
iom
etry
Ros
ette
Muc
ciA
.,L
ansa
rdB
.Y
es12
,13,
14A
lkal
inity
tota
l(TA
)Po
tent
iom
etry
Zod
iac
wat
ersa
mpl
eM
ucci
A.,
Lan
sard
B.
Yes
12,1
3,14
Alk
anes
Gas
chro
mat
ogra
phy–
mas
ssp
ectr
omet
ry(G
C–M
S)B
oxco
rer
Bou
loub
assi
I.Y
esA
lkan
esG
C–M
SC
ASQ
core
rB
oulo
ubas
siI.
Yes
Am
mon
ium
(NH+ 4
)pho
topr
oduc
tion
appa
rent
quan
tum
yiel
d(A
QY
)Su
nsi
mul
ator
–flu
orim
etry
Ros
ette
wat
ersa
mpl
eX
ieH
.,Tr
embl
ayJ.
E.
Yes
15A
mm
oniu
m(N
H+ 4
)pho
topr
oduc
tion
appa
rent
quan
tum
yiel
d(A
QY
)Su
nsi
mul
ator
–flu
orim
etry
Zod
iac
wat
ersa
mpl
eX
ieH
.,Tr
embl
ayJ.
E.
Yes
15A
rago
nite
:sat
urat
ion
stat
eD
eriv
edpa
ram
eter
Bar
gew
ater
sam
ple
Muc
ciA
.,L
ansa
rdB
.Y
es16
Ara
goni
te:s
atur
atio
nst
ate
Der
ived
para
met
erR
oset
tew
ater
sam
ple
Muc
ciA
.,L
ansa
rdB
.Y
es16
Ara
goni
te:s
atur
atio
nst
ate
Der
ived
para
met
erZ
odia
cw
ater
sam
ple
Muc
ciA
.,L
ansa
rdB
.Y
es16
Atte
nuat
ion
coef
ficie
nt(t
otal
)(ni
new
avel
engt
hsin
IR)
Wet
labs
AC
9se
rial
no.0
303
Bar
gepr
ofile
rD
oxar
anD
.Y
es9
Atte
nuat
ion
coef
ficie
nt(t
otal
)(ni
new
avel
engt
hs)
Wet
labs
AC
9se
rial
no.1
56R
oset
tepr
ofile
rE
hnJ.
Yes
Atte
nuat
ion
coef
ficie
nt(t
otal
)(ni
new
avel
engt
hs)
Wet
labs
AC
9se
rial
no.2
79B
arge
profi
ler
Dox
aran
D.
Yes
10,1
1A
ttenu
atio
nco
effic
ient
at66
0nm
Wet
labs
(CR
over
)tra
nsm
isso
met
erD
rift
ing
profi
ling
float
Dox
aran
D.
Yes
17,1
8B
acks
catte
ring
532
nmW
etla
bs(E
CO
3 )ba
cksc
atte
rom
eter
Dri
ftin
gpr
ofilin
gflo
atD
oxar
anD
.Y
es17
,18
Bac
ksca
tteri
ngco
effic
ient
(thr
eew
avel
engt
hsin
IR)
Wet
labs
EC
O-B
B3
seri
alno
.538
Bar
gepr
ofile
rD
oxar
anD
.Y
es19
,20
Bac
ksca
tteri
ngco
effic
ient
(thr
eew
avel
engt
hs)
Wet
labs
EC
O-B
B3
seri
alno
.028
Bar
gepr
ofile
rD
oxar
anD
.Y
es19
,20
Bac
ksca
tteri
ngco
effic
ient
(eig
htw
avel
engt
hs,s
pect
ral)
Hyd
roSc
at-6
(ser
ialn
o.97
074)
and
two
a-B
eta
(HO
BIL
abs)
Bar
gepr
ofile
rR
eyno
lds
R.
Yes
21,2
2B
acks
catte
ring
coef
ficie
nt(e
ight
wav
elen
gths
,spe
ctra
l)H
ydro
Scat
-6(s
eria
lno.
9707
4)an
dtw
oa-
Bet
a(H
OB
ILab
s)Fo
rede
ckR
eyno
lds
R.
Yes
21,2
2B
acks
catte
ring
coef
ficie
nt(e
ight
wav
elen
gths
)W
etla
bsE
CO
-BB
9se
rial
no.2
74R
oset
tepr
ofile
rE
hnJ.
Yes
Bac
teri
a(a
bund
ance
)Fl
owcy
tom
etry
Ros
ette
wat
ersa
mpl
eV
aulo
tD.
Yes
23B
acte
rial
bio-
volu
me
Epi
fluor
esce
nce
mic
rosc
opy
Ros
ette
wat
ersa
mpl
eJo
uxF.
,Ort
ega-
Ret
uert
aE
.N
o24
,25
https://doi.org/10.5194/essd-13-1561-2021 Earth Syst. Sci. Data, 13, 1561–1592, 2021

1568 P. Massicotte et al.: The MALINA oceanographic expedition: an overview
Table1.C
ontinued.
Parameters
Method
Sampling
PrincipalIncluded
inthe
Reference
investigatorsdata
repository
Bacterialdiversity
CE
-SSCP
and454
tag-pyrosequencingR
osetteand
zodiacw
atersample
JouxF.,J.F.G
higlioneN
o26,27
Bacterialgrow
th(lim
itationby
nutrients)L
eucine- 3Hincubations
–cells
countsR
osettew
atersample
JouxF.,Jeffrey
W.,O
rtega-Retuerta
E.
No
25,28B
acterialproductionL
eucine- 3Hincorporation
Rosette
watersam
pleJoux
F.,JeffreyW
.Y
es25,29,30
Bacterialproduction
Leucine- 3H
incorporationZ
odiacw
atersample
JouxF.,Jeffrey
W.
Yes
25,29,30B
acterialrespiration(w
holecom
munity)
O2
consumption
–W
inkler–Incubations
Rosette
watersam
pleJoux
F.,Ortega-R
etuertaE
.Y
es25,31
Benthic
amm
oniumflux
Incubations–
colorimetry
Box
corerL
inkH
.,Archam
baultP.,Chaillou
G.
Yes
32,33B
enthicm
acrofaunaabundance
Microscopy
Box
corerL
inkH
.,Archam
baultP.,Chaillou
G.
No
33,34,35B
enthicm
acrofaunadiversity
Microscopy
Box
corerL
inkH
.,Archam
baultP.,Chaillou
G.
No
33,34,35B
enthicnitrate
fluxIncubations
–colorim
etry,autoanalyzerB
oxcorer
Link
H.,A
rchambaultP.,C
haillouG
.Y
es32,33,34
Benthic
nitriteflux
Incubations–
colorimetry,autoanalyzer
Box
corerL
inkH
.,Archam
baultP.,Chaillou
G.
Yes
32,33,34B
enthicphosphate
fluxIncubations
–colorim
etry,autoanalyzerB
oxcorer
Link
H.,A
rchambaultP.,C
haillouG
.Y
es32,33,34
Benthic
respirationIncubations
–optic
–oxygen
probeB
oxcorer
Link
H.,A
rchambaultP.,C
haillouG
.Y
es32,33,34
Benthic
silicicacid
fluxIncubations
–colorim
etry,autoanalyzerB
oxcorer
Link
H.,A
rchambaultP.,C
haillouG
.Y
es32,33,34
Calcite:saturation
stateD
erivedparam
eterR
osettew
atersample
MucciA
.,Lansard
B.
Yes
16C
alcite:saturationstate
Derived
parameter
Barge
watersam
pleM
ucciA.,L
ansardB
.Y
es16
Calcite:saturation
stateD
erivedparam
eterZ
odiacw
atersample
MucciA
.,Lansard
B.
Yes
16C
ampesterol,cholesterol,sitosteroland
productsofdegradation
GC
–MS
Rosette
watersam
pleSem
pereR
.Y
es36,37,38
Chrom
ophoricdissolved
organicm
atter(CD
OM
)absorptionPSIC
AM
Barge
watersam
pleL
eymarie
E.
Yes
CD
OM
absorptionPSIC
AM
Rosette
watersam
pleL
eymarie
E.
Yes
CD
OM
absorptionPSIC
AM
Zodiac
watersam
pleL
eymarie
E.
Yes
CD
OM
absorptionSpectrophotom
eterB
argew
atersample
Matsuoka
A.,B
ricaudA
.N
o41,42
CD
OM
absorptionSpectrophotom
eterR
osettew
atersample
Matsuoka
A.,B
ricaudA
.N
o41,42
CD
OM
absorptionSpectrophotom
eterZ
odiacw
atersample
Matsuoka
A.,B
ricaudA
.N
o41,42
CD
OM
absorptionU
ltrapathB
argew
atersample
Bricaud
A.
Yes
39,40C
DO
Mabsorption
Ultrapath
Rosette
watersam
pleB
ricaudA
.Y
es39,40
CD
OM
absorptionU
ltrapathZ
odiacw
atersample
Bricaud
A.
Yes
39,40C
DO
Mfluorescence
Haardtfluorom
eterR
osetteprofiler
BennerR
.,BelangerS.,A
mon
R.,Sem
pereR
.Y
es43,44
CD
OM
fluorescenceW
etlabs(E
CO
3)fluorometer
Drifting
profilingfloat
Doxaran
D.
Yes
18C
DO
Mfluorescence
Wetlabs
WetStarW
SCD
Barge
profilerD
oxaranD
.Y
es18
CD
OM
fluorescenceE
EM
(excitationem
issionm
atrix)Spectrofluorom
etryR
osettew
atersample
Sempere
R.
No
45C
DO
Mfluorescence
EE
M(excitation
emission
matrix)
Spectrofluorometry
Zodiac
watersam
pleSem
pereR
.N
o45
Chlorophyll
aand
pheopigment(concentration)
Fluorimetry
sizefractionated
Rosette
watersam
pleG
osselinM
.,BelangerS.
Yes
46C
hlorophylla
andpheopigm
ent(benthic)Fluorom
etricanalysis
Box
corerL
inkH
.,Archam
baultP.,Chaillou
G.
Yes
32,33,34C
hlorophylla
fluorescence[Fchla
(z)]C
helseaM
ini-Tracka
IIfluorometer
Barge
profilerD
oxaranD
.Y
es18
Chlorophyll
afluorescence
[Fchla(z)]
Seapointfluorometer
Rosette
profilerG
rattonY.,PrieurL
.,Tremblay
J.E.
Yes
Chlorophyll
afluorescence
[Fchla(z)]
Wetlabs
(EC
O3)fluorom
eterD
riftingprofiling
floatD
oxaranD
.Y
es18
CO
photoproductionapparentquantum
yieldforC
DO
MSun
simulator–
reductiongas
analyzerR
osettew
atersample
Xie
H.
Yes
47C
Ophotoproduction
apparentquantumyield
forCD
OM
Sunsim
ulator–reduction
gasanalyzer
Zodiac
watersam
pleX
ieH
.Y
es47
CO
photoproductionapparentquantum
yieldforparticulate
matter
Sunsim
ulator–reduction
gasanalyzer
Rosette
watersam
pleX
ieH
.Y
es47
CO
photoproductionapparentquantum
yieldforparticulate
matter
Sunsim
ulator–reduction
gasanalyzer
Zodiac
watersam
pleX
ieH
.Y
es47
CO
2(atm
)concentrationInfrared
Foredeckm
eteorologicaltower
PapakyriakouT.
Yes
CO
2−
3concentration
Derived
parameter
Barge
watersam
pleM
ucciA.,L
ansardB
.Y
es16
CO
2−
3concentration
Derived
parameter
Rosette
watersam
pleM
ucciA.,L
ansardB
.Y
es16
CO
2−
3concentration
Derived
parameter
Zodiac
watersam
pleM
ucciA.,L
ansardB
.Y
es16
Coccolithophorids
Microscopy
Rosette
watersam
pleC
oupelP.Y
esC
onductivity(z)
SensoronSB
EFastC
AT
CT
Dserialno.175–217
Barge
profilerD
oxaranD
.Y
es48
Conductivity
(z)SensorSea-B
ird4c
onC
TD
SBE
-911R
osetteprofiler
Gratton
Y.,PrieurL.
Yes
CT
DSea-B
irdD
riftingprofiling
floatD
oxaranD
.Y
es48
Cultures
ofsortedpopulations
Sortedby
flowcytom
etry,serialdilutionand
single-cellpipettingR
osettew
atersample
VaulotD
.N
o49
δ 13C–
DIC
Mass
spectrometry
(IRM
S)B
argew
atersample
MucciA
.,Lansard
B.
Yes
δ 13C–
DIC
Mass
spectrometry
(IRM
S)R
osettew
atersample
MucciA
.,Lansard
B.
Yes
δ 13C–
DIC
Mass
spectrometry
(IRM
S)Z
odiacw
atersample
MucciA
.,Lansard
B.
Yes
δ 13Con
suspendedparticulate
matter
Mass
spectrometry
Rosette
watersam
pleTrem
blayJ.E
.,Raim
baultP.N
o50
δ 18O–
water
Mass
spectrometry
(IRM
S)B
argew
atersample
MucciA
.,Lansard
B.
Yes
13
Earth Syst. Sci. Data, 13, 1561–1592, 2021 https://doi.org/10.5194/essd-13-1561-2021

P. Massicotte et al.: The MALINA oceanographic expedition: an overview 1569Ta
ble
1.C
ontin
ued.
Para
met
ers
Met
hod
Sam
plin
gPr
inci
pal
Incl
uded
inth
eR
efer
ence
inve
stig
ator
sda
tare
posi
tory
δ18
O–
wat
erM
ass
spec
trom
etry
(iso
tope
ratio
mas
ssp
ectr
omet
ry,I
RM
S)R
oset
tew
ater
sam
ple
Muc
ciA
.,L
ansa
rdB
.Y
es13
δ18
O–
wat
erM
ass
spec
trom
etry
(IR
MS)
Zod
iac
wat
ersa
mpl
eM
ucci
A.,
Lan
sard
B.
Yes
13D
iaci
dsco
mpo
sitio
nG
C–M
SR
oset
tew
ater
sam
ple
Sem
pere
R.
No
51D
iaci
dsco
mpo
sitio
nG
C–M
SZ
odia
cw
ater
sam
ple
Sem
pere
R.
No
51D
iaci
dsph
otop
rodu
ctio
nap
pare
ntqu
antu
myi
eld
(AQ
Y)
Sun
sim
ulat
or–
GC
–MS
Zod
iac
wat
ersa
mpl
eSe
mpe
reR
.N
o52
Din
ocys
t,po
llen
and
spor
eab
unda
nce
Mic
rosc
opy
Box
core
rR
ocho
nA
.N
o1
Din
ocys
t,po
llen
and
spor
eab
unda
nce
Mic
rosc
opy
CA
SQco
rer
Roc
hon
A.
No
1D
inoc
yst,
polle
nan
dsp
ore
iden
tifica
tion
Mic
rosc
opy
Box
core
rR
ocho
nA
.N
o1
Din
ocys
t,po
llen
and
spor
eid
entifi
catio
nM
icro
scop
yC
ASQ
core
rR
ocho
nA
.N
o1
Din
oflag
ella
tecy
stab
unda
nce
Mic
rosc
opy
Box
core
rR
ocho
nA
.N
o1
Din
oflag
ella
tecy
stab
unda
nce
Mic
rosc
opy
CA
SQco
rer
Roc
hon
A.
No
1D
inofl
agel
late
cyst
iden
tifica
tion
Mic
rosc
opy
Box
core
rR
ocho
nA
.N
o1
Din
oflag
ella
tecy
stid
entifi
catio
nM
icro
scop
yC
ASQ
core
rR
ocho
nA
.N
o1
Dis
solv
ed-i
norg
anic
-car
bon
phot
opro
duct
ion
appa
rent
quan
tum
yiel
dSu
nsi
mul
ator
–in
frar
edC
O2
anal
yzer
Ros
ette
wat
ersa
mpl
eX
ieH
.,B
elan
gerS
.Y
es53
Dis
solv
ed-i
norg
anic
-car
bon
phot
opro
duct
ion
appa
rent
quan
tum
yiel
dSu
nsi
mul
ator
–in
frar
edC
O2
anal
yzer
Zod
iac
wat
ersa
mpl
eX
ieH
.,B
elan
gerS
.Y
es53
Dis
solv
edni
trog
en(t
otal
)(T
DN
)H
igh-
tem
pera
ture
cata
lytic
oxid
atio
nR
oset
tew
ater
sam
ple
Ben
nerR
.Y
es54
Dis
solv
edni
trog
en(t
otal
)(T
DN
)H
igh-
tem
pera
ture
cata
lytic
oxid
atio
nZ
odia
cw
ater
sam
ple
Ben
nerR
.Y
es54
Dis
solv
edor
gani
cca
rbon
(DO
C)
Hig
h-te
mpe
ratu
reca
taly
ticox
idat
ion
Ros
ette
wat
ersa
mpl
eB
enne
rR.
Yes
54D
isso
lved
orga
nic
carb
on(D
OC
)H
igh-
tem
pera
ture
cata
lytic
oxid
atio
nR
oset
tew
ater
sam
ple
Sem
pere
R.
Yes
45,5
5D
isso
lved
orga
nic
carb
on(D
OC
)H
igh-
tem
pera
ture
cata
lytic
oxid
atio
nZ
odia
cw
ater
sam
ple
Ben
nerR
.Y
es54
Dis
solv
edor
gani
cca
rbon
(DO
C)
Hig
h-te
mpe
ratu
reC
atal
ytic
Oxi
datio
nZ
odia
cw
ater
sam
ple
Sem
pere
R.
Yes
45,5
5D
isso
lved
orga
nic
carb
on(D
OC
)W
etox
idat
ion
Ros
ette
wat
ersa
mpl
eTr
embl
ayJ.
E.,
Rai
mba
ultP
.Y
es56
Dis
solv
edor
gani
cni
trog
en(D
ON
)W
etox
idat
ion
Ros
ette
wat
ersa
mpl
eTr
embl
ayJ.
E.,
Rai
mba
ultP
.Y
es56
Dis
solv
edor
gani
cph
osph
orus
(DO
P)W
etox
idat
ion
Ros
ette
wat
ersa
mpl
eTr
embl
ayJ.
E.,
Rai
mba
ultP
.Y
es56
Ed,
Lu,
Eu,
Es
Com
pact
optic
alpr
ofilin
gsy
stem
(C-O
PS)p
acka
ge(3
20,3
40,3
80,3
95nm
)B
arge
profi
ler
Hoo
ker
Yes
57E
lect
ric
resi
stiv
ity(s
edim
entc
ore
phys
ical
prop
ertie
s)G
eote
km
ulti-
sens
orco
relo
gger
Box
core
rR
ocho
nA
.N
o1
Ele
ctri
cre
sist
ivity
(sed
imen
tcor
eph
ysic
alpr
oper
ties)
Geo
tek
mul
ti-se
nsor
core
logg
erC
ASQ
core
rR
ocho
nA
.N
o1
Euk
aryo
tes
(abu
ndan
ce)
DA
PIep
ifluo
resc
ence
mic
rosc
opy
Ros
ette
wat
ersa
mpl
eL
ovej
oyC
.N
o58
Euk
aryo
tes
(bio
mas
s)D
API
epifl
uore
scen
cem
icro
scop
yR
oset
tew
ater
sam
ple
Lov
ejoy
C.
No
58f
CO
2D
eriv
edpa
ram
eter
Bar
gew
ater
sam
ple
Muc
ciA
.,L
ansa
rdB
.Y
es12
fC
O2
Der
ived
para
met
erR
oset
tew
ater
sam
ple
Muc
ciA
.,L
ansa
rdB
.Y
es12
fC
O2
Der
ived
para
met
erZ
odia
cw
ater
sam
ple
Muc
ciA
.,L
ansa
rdB
.Y
es12
Fora
min
ifer
aab
unda
nce
Mic
rosc
opy
Box
core
rR
ocho
nA
.N
o1
Fora
min
ifer
aab
unda
nce
Mic
rosc
opy
CA
SQco
rer
Roc
hon
A.
No
1Fo
ram
inif
era
iden
tifica
tion
Mic
rosc
opy
Box
core
rR
ocho
nA
.N
o1
Fora
min
ifer
aid
entifi
catio
nM
icro
scop
yC
ASQ
core
rR
ocho
nA
.N
o1
Gam
ma
dens
ity(s
edim
entc
ore
phys
ical
prop
ertie
s)G
eote
km
ulti-
sens
orco
relo
gger
Box
core
rR
ocho
nA
.N
o1
Gam
ma
dens
ity(s
edim
entc
ore
phys
ical
prop
ertie
s)G
eote
km
ulti-
sens
orco
relo
gger
CA
SQco
rer
Roc
hon
A.
No
1H
2O(a
tm)c
once
ntra
tion
Infr
ared
gas
anal
yzer
Fore
deck
met
eoro
logi
calt
ower
Papa
kyri
akou
T.Y
esH
CO− 3
conc
entr
atio
nD
eriv
edpa
ram
eter
Bar
gew
ater
sam
ple
Muc
ciA
.,L
ansa
rdB
.Y
es12
,16
HC
O− 3
conc
entr
atio
nD
eriv
edpa
ram
eter
Ros
ette
wat
ersa
mpl
eM
ucci
A.,
Lan
sard
B.
Yes
12,1
6H
CO− 3
conc
entr
atio
nD
eriv
edpa
ram
eter
Zod
iac
wat
ersa
mpl
eM
ucci
A.,
Lan
sard
B.
Yes
12,1
6H
ydro
SCA
MP
(tem
pera
ture
,sal
inity
,chl
orop
hyll,
turb
idity
)Se
lf-C
onta
ined
Aut
onom
ous
Mic
ro-P
rofil
er(S
CA
MP)
In-w
ater
profi
ler
Gra
tton
Y.Y
esH
ydro
lyza
ble
amin
oac
ids
(tot
al)(
TH
AA
s)H
igh-
perf
orm
ance
liqui
dch
rom
atog
raph
y(H
PLC
)R
oset
tew
ater
sam
ple
Ben
nerR
.Y
es54
Hyd
roly
zabl
eam
ino
acid
s(t
otal
)(T
HA
As)
HPL
CZ
odia
cw
ater
sam
ple
Ben
nerR
.Y
es54
Hyd
roxy
lrad
ical
s(O
H)
HPL
CR
oset
tew
ater
sam
ple
Sem
pere
R.
Yes
Hyd
roxy
lrad
ical
s(O
H)
HPL
CZ
odia
cw
ater
sam
ple
Sem
pere
R.
Yes
IP25
(C25
mon
ouns
atur
ated
hydr
ocar
bon)
GC
Box
core
rM
asse
G.
Yes
IP25
(C25
mon
ouns
atur
ated
hydr
ocar
bon)
GC
CA
SQco
rer
Mas
seG
.Y
esIr
radi
ance
Satla
ntic
(PU
V)(
305,
325,
340,
380,
...)
Fore
deck
Sem
pere
R.
Yes
45Ir
radi
ance
(412
,490
,555
nm)
Satla
ntic
(OC
R)r
adio
met
erD
rift
ing
profi
ling
float
Dox
aran
D.
Yes
18L
igni
nph
enol
s(d
isso
lved
)G
C–M
SR
oset
tew
ater
sam
ple
Ben
nerR
.Y
es59
Lig
nin
phen
ols
(dis
solv
ed)
GC
–MS
Zod
iac
wat
ersa
mpl
eB
enne
rR.
No
59L
ipid
biom
arke
rsG
Cfla
me
ioni
zatio
nde
tect
ion,
GC
–MS
Box
core
rTo
losa
I.Y
es60
,61
Lip
idbi
omar
kers
GC
flam
eio
niza
tion
dete
ctio
n,G
C–M
SFo
rede
ckin
situ
pum
pTo
losa
I.Y
es60
,61
Lip
idbi
omar
kers
d13C
GC
–com
bust
ion–
isot
ope
ratio
MS
Box
core
rTo
losa
I.Y
es60
,61
Lip
idbi
omar
kers
d13C
GC
–com
bust
ion–
isot
ope
ratio
MS
Fore
deck
insi
tupu
mp
Tolo
saI.
Yes
60,6
1L
ongw
ave
radi
atio
n(L
win
)Py
rgeo
met
erW
heel
hous
era
diat
ion
plat
form
Papa
kyri
akou
T.Y
esM
agne
ticsu
scep
tibili
ty(s
edim
entc
ore
phys
ical
prop
ertie
s)G
eote
km
ulti-
sens
orco
relo
gger
Box
core
rR
ocho
nA
.N
o1
Mag
netic
susc
eptib
ility
(sed
imen
tcor
eph
ysic
alpr
oper
ties)
Geo
tek
mul
ti-se
nsor
core
logg
erC
ASQ
core
rR
ocho
nA
.N
o1
https://doi.org/10.5194/essd-13-1561-2021 Earth Syst. Sci. Data, 13, 1561–1592, 2021

1570 P. Massicotte et al.: The MALINA oceanographic expedition: an overviewTable
1.Continued.
Parameters
Method
Sampling
PrincipalIncluded
inthe
Reference
investigatorsdata
repository
Majorand
minorelem
entsX
-rayfluorescence
spectroscopy(X
RF)core
scannerC
ASQ
corerM
artinezP.
Yes
Nanoeukaryotes
(abundance)Flow
cytometry
Rosette
watersam
pleV
aulotD.
Yes
62N
H+4
FluorescenceR
osettew
atersample
Tremblay
J.E.,R
aimbaultP.
Yes
63N
itrate(concentration)
SatlanticISU
SR
osetteprofiler
Gratton
Y.,PrieurL.,Trem
blayJ.E
.Y
esN
O−2
Colorim
etry,autoanalyzerR
osettew
atersample
Tremblay
J.E.,R
aimbaultP.
Yes
64N
O−3
Colorim
etry,autoanalyzerR
osettew
atersample
Tremblay
J.E.,R
aimbaultP.
Yes
64O
xygen(dissolved)
Discrete
samples,W
inklermethod
Rosette
watersam
plePrieurL
.Y
esO
xygen(dissolved)
IdronautOcean
SevenO
2sensor
Continuous
horizontalPapakyriakou
T.Y
esO
xygen(dissolved)
Sea-Bird
SBE
-43sensor
Rosette
profilerG
rattonY.,PrieurL
.Y
esP-w
avespeed
(sedimentcore
physicalproperties)G
eotekm
ulti-sensorcorelogger
Box
corerR
ochonA
.N
o1
P-wave
speed(sedim
entcorephysicalproperties)
Geotek
multi-sensorcore
loggerC
ASQ
corerR
ochonA
.N
o1
Paleomagnetism
Cryogenic
magnetom
eterB
oxcorer
Rochon
A.
No
1Paleom
agnetismC
ryogenicm
agnetometer
CA
SQcorer
Rochon
A.
No
1PA
RB
iosphericalsensorB
argeprofiler
WrightV.,H
ookerS.N
o57
PAR
Biosphericalsensor
Rosette
profilerG
rattonY.,PrieurL
.,Tremblay
J.E.
Yes
PAR
PAR
Lite
sensorW
heelhouseradiation
platformPapakyriakou
T.Y
esParticle
sizedistribution
Coultercounter
Barge
watersam
pleR
eynoldsR
.Y
es21,67
Particlesize
distributionL
ISST-100XB
argeprofiler
Reynolds
R.
Yes
21,66Particle
sizedistribution
LISST-100X
Rosette
profilerR
eynoldsR
.Y
es21,66
Particlesize
distributionU
VP-5
(underwatervision
profiler)In-w
aterprofilerPicheralM
.Y
es65
Particlesize
distributionC
oultercounterR
osettew
atersample
Reynolds
R.
Yes
21,67Particulate
organiccarbon
(POC
)C
HN
analyzeronSPM
filtersB
argew
atersample
Doxaran
D.,E
hnJ.,B
abinM
.Y
es68
Particulateorganic
carbon(PO
C)
CH
Nanalyzeron
SPMfilters
Rosette
watersam
pleD
oxaranD
.,Ehn
J.,Babin
M.
Yes
68Particulate
organiccarbon
(POC
)C
HN
analyzeronSPM
filtersZ
odiacw
atersample
Doxaran
D.,E
hnJ.,B
abinM
.Y
es68
Particulateorganic
carbon(PO
C)
Wetoxidation
Rosette
watersam
pleTrem
blayJ.E
.,Raim
baultP.Y
es69
Particulateorganic
nitrogen(PO
N)
Wetoxidation
Rosette
watersam
pleTrem
blayJ.E
.,Raim
baultP.Y
es69
Particulateorganic
phosphorus(PO
P)W
etoxidationR
osettew
atersample
Tremblay
J.E.,R
aimbaultP.
Yes
69pH
(NationalB
ureauofStandards
(NB
S)scale)Sea-B
irdSB
E-18
sensorR
osetteprofiler
Gratton
Y.,PrieurL.,Trem
blayJ.E
.Y
espH
(totalprotonscale)
Derived
parameter
Barge
watersam
pleM
ucciA.,L
ansardB
.Y
es12,16
pH(totalproton
scale)D
erivedparam
eterR
osettew
atersample
MucciA
.,Lansard
B.
Yes
12,16pH
(totalprotonscale)
Derived
parameter
Zodiac
watersam
pleM
ucciA.,L
ansardB
.Y
es12,16
pH(totalproton
scale)Spectrophotom
etryB
argew
atersample
MucciA
.,Lansard
B.
Yes
12,16pH
(totalprotonscale)
Spectrophotometry
Rosette
watersam
pleM
ucciA.,L
ansardB
.Y
es12,16
pH(totalproton
scale)Spectrophotom
etryZ
odiacw
atersample
MucciA
.,Lansard
B.
Yes
12,16Photoheterotrophs
(DN
Adiversity)
DN
Aclone
libraryR
osettew
atersample
JeanthonC
.,BoeufD
.Y
es6,70
Photosyntheticeukaryotes
(diversity)D
NA
clonelibrary
andT
RFL
Pofsorted
populationsR
osettew
atersample
VaulotD
.N
o71
Photosyntheticeukaryotes
(diversity)D
NA
fromfilters
Rosette
watersam
pleV
aulotD.
No
71Photosynthetic
eukaryotes(m
orphology)Scanning
electronm
icroscopyR
osettew
atersample
VaulotD
.N
o72
Photosyntheticparam
eters14C
incubationsR
osettew
atersample
HuotY.
Yes
73Phytoplankton
(abundance)Inverted
microscope
Rosette
watersam
pleG
osselinM
.,BelangerS.
Yes
46,74Phytoplankton
(taxonomy)
Invertedm
icroscopeR
osettew
atersample
Gosselin
M.,B
elangerS.Y
es46,74
Phytoplanktonpigm
entsH
PLC
Barge
watersam
pleW
rightV.,HookerS.
Yes
Phytoplanktonpigm
entsH
PLC
Rosette
watersam
pleR
asJ.,C
laustreH
.Y
esPicoeukaryotes
(abundance)Flow
cytometry
Rosette
watersam
pleV
aulotD.
Yes
62Picoplankton
(diversity)D
NA
amplicon
libraryR
osettew
atersample
Lovejoy
C.
No
75,82,83Picoplankton
(diversity)R
NA
amplicon
libraryR
osettew
atersample
Lovejoy
C.
No
75,82,83Plankton
taxonomy
UV
P-5In-w
aterprofilerPicheralM
.,Marec
C.
Yes
PR-containing
bacteria(abundance)
Q-PC
RR
osettew
atersample
JeanthonC
.,BoeufD
.Y
es70
Pressure(barom
etric)Pressure
sensorForedeck
meteorologicaltow
erPapakyriakou
T.Y
esR
adianceC
amera
luminance
Profilem
odeA
ntoineD
.,Leym
arieE
.Y
es76
Radiance
Cam
eralum
inanceSurface
mode
Antoine
D.,L
eymarie
E.
Yes
76R
adiance:subproduct:averagecosines
Cam
eralum
inanceProfile
mode
Antoine
D.,L
eymarie
E.
Yes
76R
adiance:subproduct:averagecosines
Cam
eralum
inanceSurface
mode
Antoine
D.,L
eymarie
E.
Yes
76R
adiance:subproduct:irradiance(E
)C
amera
luminance
Profilem
odeA
ntoineD
.,Leym
arieE
.Y
es76
Radiance:subproduct:irradiance
(E)
Cam
eralum
inanceSurface
mode
Antoine
D.,L
eymarie
E.
Yes
76R
adiance:subproduct:Lnadir
Cam
eralum
inanceProfile
mode
Antoine
D.,L
eymarie
E.
Yes
76R
adiance:subproduct:Lnadir
Cam
eralum
inanceSurface
mode
Antoine
D.,L
eymarie
E.
Yes
76R
adiance:subproduct:Qnadir
Cam
eralum
inanceProfile
mode
Antoine
D.,L
eymarie
E.
Yes
76R
adiance:subproduct:Qnadir
Cam
eralum
inanceSurface
mode
Antoine
D.,L
eymarie
E.
Yes
76R
adiance:subproduct:scalarirradiance(E
scal)C
amera
luminance
Profilem
odeA
ntoineD
.,Leym
arieE
.Y
es76
Earth Syst. Sci. Data, 13, 1561–1592, 2021 https://doi.org/10.5194/essd-13-1561-2021

P. Massicotte et al.: The MALINA oceanographic expedition: an overview 1571
Tabl
e1.
Con
tinue
d.
Para
met
ers
Met
hod
Sam
plin
gPr
inci
pal
Incl
uded
inth
eR
efer
ence
inve
stig
ator
sda
tare
posi
tory
Rad
ianc
e:su
bpro
duct
:sca
lari
rrad
ianc
e(E
scal
)C
amer
alu
min
ance
Surf
ace
mod
eA
ntoi
neD
.,L
eym
arie
E.
Yes
76R
adia
nce
(sur
face
leav
ing
radi
ance
)B
iosp
heri
calS
urfa
ceO
cean
Refl
ecta
nce
Syst
em(B
IOSO
RS)
Fore
deck
Hoo
ker
Yes
Rad
ianc
e(s
urfa
cele
avin
gra
dian
ce)
Satla
ntic
Hyp
erSA
S(h
yper
spec
tral
surf
ace
acqu
isiti
onsy
stem
)Fo
rede
ckB
elan
gerS
.N
o77
Rad
ianc
e(s
urfa
cele
avin
gra
dian
ce)
TriO
Sab
ove-
wat
erse
nsor
Fore
deck
Dox
aran
D.
No
78Sa
linity
Salin
omet
erB
arge
wat
ersa
mpl
eG
ratto
nY.
,Pri
eurL
.Y
esSa
linity
Salin
omet
erR
oset
tew
ater
sam
ple
Gra
tton
Y.,P
rieu
rL.
Yes
Salin
ity[S
(z)]
Der
ived
para
met
erR
oset
tepr
ofile
rG
ratto
nY.
,Pri
eurL
.,Tr
embl
ayJ.
E.
Yes
Salin
ity[S
(z)]
Der
ived
para
met
erfr
omSB
EFa
stC
AT
LO
CIO
Ppa
ckag
eB
arge
profi
ler
Dox
aran
D.
Yes
48Sh
ortw
ave
radi
atio
n(S
win
)Py
rano
met
erW
heel
hous
era
diat
ion
plat
form
Papa
kyri
akou
T.Y
esSi
(OH
) 4C
olor
imet
ry,a
utoa
naly
zer
Ros
ette
wat
ersa
mpl
eTr
embl
ayJ.
E.,
Rai
mba
ultP
.Y
es64
Solu
ble
reac
tive
phos
phat
eC
olor
imet
ry,a
utoa
naly
zer
Ros
ette
wat
ersa
mpl
eTr
embl
ayJ.
E.,
Rai
mba
ultP
.N
o64
SPM
(sus
pend
edpa
rtic
ulat
em
ater
ial)
Dry
wei
ght(
grav
imet
ry)
Bar
gew
ater
sam
ple
Dox
aran
D.,
Ehn
J.,B
abin
M.
Yes
68SP
M(s
uspe
nded
part
icul
ate
mat
eria
l)D
ryw
eigh
t(gr
avim
etry
)R
oset
tew
ater
sam
ple
Dox
aran
D.,
Ehn
J.,B
abin
M.
Yes
68SP
M(s
uspe
nded
part
icul
ate
mat
eria
l)D
ryw
eigh
t(gr
avim
etry
)Z
odia
cw
ater
sam
ple
Dox
aran
D.,
Ehn
J.,B
abin
M.
Yes
68Su
gars
HPL
CR
oset
tew
ater
sam
ple
Sem
pere
R.
No
79Su
gars
HPL
CZ
odia
cw
ater
sam
ple
Sem
pere
R.
No
79Sy
nech
ococ
cus
(abu
ndan
ce)
Flow
cyto
met
ryR
oset
tew
ater
sam
ple
Vau
lotD
.Y
es62
Tem
pera
ture
(air
)Te
mpe
ratu
rese
nsor
Fore
deck
met
eoro
logi
calt
ower
Papa
kyri
akou
T.Y
esTe
mpe
ratu
re(s
urfa
cesk
in)
IRtr
ansd
ucer
Fore
deck
met
eoro
logi
calt
ower
Papa
kyri
akou
T.Y
esTe
mpe
ratu
re[T
(z)]
Sens
orSe
a-B
ird
3plu
son
CT
DSB
E-9
11R
oset
tepr
ofile
rG
ratto
nY.
,Pri
eurL
.,Tr
embl
ayJ.
E.
Yes
Tem
pera
ture
[T(z
)]Te
mpe
ratu
rese
nsor
onSB
EFa
stC
AT
CT
Dse
rial
no.1
75–2
17B
arge
profi
ler
Dox
aran
D.
Yes
48To
tali
norg
anic
carb
on(T
IC)
Der
ived
para
met
erB
arge
wat
ersa
mpl
eM
ucci
A.,
Lan
sard
B.
Yes
Tota
lino
rgan
icca
rbon
(TIC
)D
eriv
edpa
ram
eter
Ros
ette
wat
ersa
mpl
eM
ucci
A.,
Lan
sard
B.
Yes
Tota
lino
rgan
icca
rbon
(TIC
)D
eriv
edpa
ram
eter
Zod
iac
wat
ersa
mpl
eM
ucci
A.,
Lan
sard
B.
Yes
Tota
lorg
anic
carb
on(T
OC
)W
etox
idat
ion
Ros
ette
wat
ersa
mpl
eTr
embl
ayJ.
E.,
Rai
mba
ultP
.Y
es56
Tota
lorg
anic
nitr
ogen
(TO
N)
Wet
oxid
atio
nR
oset
tew
ater
sam
ple
Trem
blay
J.E
.,R
aim
baul
tP.
Yes
56To
talo
rgan
icph
osph
orus
(TO
P)W
etox
idat
ion
Ros
ette
wat
ersa
mpl
eTr
embl
ayJ.
E.,
Rai
mba
ultP
.Y
es56
Trac
em
etal
sX
-ray
fluor
esce
nce
spec
tros
copy
CA
SQco
rer
Mar
tinez
P.Y
esU
rea
(con
cent
ratio
n)Sp
ectr
opho
tom
etry
Ros
ette
wat
ersa
mpl
eTr
embl
ayJ.
E.,
Rai
mba
ultP
.N
o64
Volu
me
scat
teri
ngfu
nctio
n(V
SF)
Ben
chto
pus
eof
POLV
SM(P
olar
ized
Volu
me
Scat
teri
ngM
eter
)B
arge
wat
ersa
mpl
eC
ham
iM.
No
80,8
1Vo
lum
esc
atte
ring
func
tion
(VSF
)B
ench
top
use
ofPO
LVSM
Ros
ette
wat
ersa
mpl
eC
ham
iM.
No
80,8
1Vo
lum
esc
atte
ring
func
tion
(VSF
)B
ench
top
use
ofPO
LVSM
Zod
iac
wat
ersa
mpl
eC
ham
iM.
No
80,8
1W
ind
dire
ctio
nV
ane
Fore
deck
met
eoro
logi
calt
ower
Papa
kyri
akou
T.Y
esW
ind
spee
dA
nem
omet
erFo
rede
ckm
eteo
rolo
gica
ltow
erPa
paky
riak
ouT.
Yes
(1)D
uran
tou
etal
.(20
12);
(2)R
aim
baul
teta
l.(1
999c
);(3
)Rai
mba
ulta
ndG
arci
a(2
008)
;(4)
Fern
ánde
zan
dR
aim
baul
t(20
07);
(5)M
ique
leta
l.(2
015)
;(6)
Boe
ufet
al.(
2013
);(7
)Bél
ange
reta
l.(2
013a
(@);
(8)R
öttg
ers
and
Geh
nke
(201
2);(
9)D
oxar
anet
al.(
2007
);(1
0)Pe
gau
etal
.(1
997)
;(11
)Sul
livan
etal
.(20
06);
(12)
Muc
ciet
al.(
2010
);(1
3)L
ansa
rdet
al.(
2012
);(1
4)D
icks
onet
al.(
2007
);(1
5)X
ieet
al.(
2012
);(1
6)B
eaup
ré-L
aper
rièr
eet
al.(
2020
);(1
7)Po
teau
etal
.(20
17);
(18)
Xin
get
al.(
2012
);(1
9)D
oxar
anet
al.(
2016
);(2
0)B
oss
and
Pega
u(2
001)
;(2
1)R
eyno
lds
etal
.(20
16);
(22)
Neu
kerm
ans
etal
.(20
16);
(23)
Mar
ieet
al.(
1997
);(2
4)C
ottr
ella
ndD
avid
(200
3);(
25)O
rteg
a-R
etue
rta
etal
.(20
12a)
;(26
)Ort
ega-
Ret
uert
aet
al.(
2013
);(2
7)G
higl
ione
etal
.(20
08);
(28)
Ort
ega-
Ret
uert
aet
al.(
2012
b);(
29)K
irch
man
(201
8);(
30)S
mith
and
Aza
m(1
992)
;(31
)Car
igna
net
al.(
1998
);(3
2)L
ink
etal
.(20
13b)
;(33
)Lin
ket
al.(
2019
);(3
4)L
ink
etal
.(20
13c)
;(35
)Wei
etal
.(20
20);
(36)
Ron
tani
etal
.(20
14);
(37)
Ron
tani
etal
.(20
12a)
;(38
)Ron
tani
etal
.(20
12b)
;(39
)Bri
caud
etal
.(20
10);
(40)
Mat
suok
aet
al.(
2012
b);
(41)
Mat
suok
aet
al.(
2011
);(4
2)M
atsu
oka
etal
.(20
14);
(43)
Am
on(2
003)
;(44
)Coo
pere
tal.
(200
5);(
45)P
ara
etal
.(20
13);
(46)
Bla
iset
al.(
2017
);(4
7)So
nget
al.(
2013
);(4
8)Se
a-B
ird
Scie
ntifi
c.(2
017)
;(49
)Bal
zano
etal
.(20
12a)
;(50
)And
riso
aet
al.(
2019
);(5
1)Se
mpé
réet
al.
(201
9);(
52)T
edet
tiet
al.(
2007
);(5
3)B
élan
gere
tal.
(200
6b);
(54)
Shen
etal
.(20
12);
(55)
Sohr
inan
dSe
mpé
ré(2
005)
;(56
)Rai
mba
ulte
tal.
(199
9b);
(57)
Hoo
kere
tal.
(202
0);(
58)V
aqué
etal
.(20
08);
(59)
Fich
otet
al.(
2016
);(6
0)To
losa
etal
.(20
13);
(61)
Tolo
saan
dde
Mor
a(2
004)
;(6
2)M
arie
etal
.(20
14);
(63)
Hol
mes
etal
.(19
99);
(64)
Am
inot
and
Kér
ouel
(200
7);(
65)P
iche
rale
tal.
(201
0);(
66)R
eyno
lds
etal
.(20
10);
(67)
Run
yan
etal
.(20
20);
(68)
Dox
aran
etal
.(20
12b)
;(69
)Rai
mba
ulte
tal.
(199
9a);
(70)
Boe
ufet
al.(
2016
);(7
1)B
alza
noet
al.(
2012
b);
(72)
Bal
zano
etal
.(20
17);
(73)
Mar
cele
tal.
(199
4);(
74)A
rdyn
aet
al.(
2017
b);(
75)C
omea
uet
al.(
2012
);(7
6)A
ntoi
neet
al.(
2013
b);(
77)M
oble
y(1
999)
;(78
)Rud
dick
etal
.(20
06);
(79)
Pana
giot
opou
los
etal
.(20
14);
(80)
Cha
mie
tal.
(201
4);(
81)H
arm
elet
al.(
2016
);(8
2)M
onie
ret
al.(
2014
);(8
3)M
onie
reta
l.(2
015)
https://doi.org/10.5194/essd-13-1561-2021 Earth Syst. Sci. Data, 13, 1561–1592, 2021

1572 P. Massicotte et al.: The MALINA oceanographic expedition: an overview
the best-fitting fraction (x) of (n+ 1) source water types thatcontribute to the n observed values of the selected tracers ina parcel of water via a solution of an overdetermined systemof linear equations that minimizes the residual error. Bound-ary conditions were applied to the method to guarantee thatall fractions calculated were positive and that the sum of allfractions was 100 % (mass conservation).
During MALINA, the Mackenzie Shelf was for the mostpart entirely ice-free, and the ice pack was located beyond theshelf break (Fig. 2). The transition zone was characterized bydifferent expanses of drifting sea ice. Significant contribu-tions of meteoric water (> 25 %) to the surface mixed layer(SML) were only observed close to the Mackenzie Rivermouth and on the inner shelf (Fig. 4). A relatively small frac-tion of sea ice meltwater was detected beyond the shelf break,mostly along the transect 600. Below the SML, the wPMLwas the predominant water mass down to 100 m depth. TheUHW extends from the interior ocean onto the outer shelffrom 120 to 180 m depth. Relatively high fractions of UHWwere also found at 50 m depth along the Mackenzie and Kug-mallit canyons, which are recognized sites of enhanced shelf-break upwelling caused by wind- and ice-driven ocean sur-face stresses. Below 200 m depth, the LHW with an Atlanticorigin was always the prevailing water mass.
4.2 Temperature and salinity from the CTD
Temperature and salinity for the first 100 m of transects 600and 300, the two transects originating from the MackenzieRiver delta, are presented in Fig. 5. They confirm what wasfound by the water mass analysis (Sect. 4.1): most of thefreshwater is coming from the western part of the MackenzieRiver delta. This is also in accordance with many studies thatdocumented that during the summer, a combination of icemelting and river runoff was generating a highly stratifiedsurface layer (Carmack and Macdonald, 2002; Forest et al.,2013). The signature of an eddy may be observed at 75 m inthe salinity data at 70◦ N, approximately 70 km from shore(Fig. 5b).
4.3 Underwater bio-optical data
4.3.1 Inherent optical property (IOP) profiling from theship, the barge and the zodiac
The total, non-water, spectral absorption (a), attenuation (c)and backscattering (bb) coefficients were measured using anAC9 attenuation and absorption meter and a BB9 scatteringmeter (Wetlabs), a HydroScat-6, and a-Beta sensors (HOBILabs) either attached to the CTD rosette frame onboard theCCGS Amundsen or deployed separately from the barge orthe zodiac tender. These devices were using either 10 or25 cm optical path lengths, depending on the turbidity ofthe water sampled. Detailed information about the deploy-ment and the data processing of the IOP data can be found inDoxaran et al. (2012a).
Figure 6 shows cross-sections of the total absorption andbackscattering coefficients at 440 nm (a(440) and bb(440)),derived as bb = bbp+ bbw, where bbw is the backscatteringcoefficient of pure seawater (Morel, 1974). Both a(440) andbb(440) showed the same patterns along the transects 600 and300. Close to the estuary, higher absorption (Fig. 6a) and to-tal scattering (Fig. 6b) can be observed at the surface, likelyreflecting the important quantities of dissolved and particu-late organic matter delivered by the Mackenzie River. Highervalues are also observed in transect 600 compared to transect300, which is farther away from the mouth of the Macken-zie River. Both a(440) and bb(440) decreased rapidly towardhigher latitudes, where the water of the Mackenzie Rivermixes with seawater from the Beaufort Sea.
4.3.2 Particulate and CDOM absorption
Chromophoric dissolved organic matter absorption (aCDOM)was measured from water samples filtered with 0.2 µm GHP(glass fiber hydrophilic polypropylene) filters (Acrodisc Inc.)using an UltraPath (World Precision Instruments Inc.) be-tween 200 and 735 nm. In most cases, a 2 m optical pathlength was used for the measurement, except for coastalwaters near the Mackenzie River mouth (Fig. 1), where a0.1 m optical path length was used. Particulate absorption(ap) was measured using a filter-pad technique modified fromRöttgers and Gehnke (2012). Briefly, seawater was filteredthrough a 25 mm Whatman GF/F (glass fiber filters) lessthan 3 h after sampling. Filters were placed in the center of a150 mm integrating sphere equipped with a handmade Spec-tralon filter holder. The spectral optical density (OD(λ)) ofthe particles retained on the filter was then measured usinga PerkinElmer Lambda-19 spectrophotometer from 300 to800 nm at 1 nm resolution. More details about particulate-and dissolved-absorption measurements can be found inRöttgers and Gehnke (2012), Bélanger et al. (2013b), andMatsuoka et al. (2012a).
Examples of aCDOM spectra measured at the surface forthe northernmost and the southernmost stations of transects600 and 300 are presented in Fig. 7a. The marked influenceof the organic matter of terrestrial origin can be observed forthe stations located at the mouth of the Mackenzie River (697and 398). Because the organic matter delivered by the riveris highly humic and colored, the absorption at 254 nm wasapproximately 15 times higher at the southern shelf stationsfor both transects compared to the northern stations (620 and320). Likewise, the specific UV absorbance of dissolved or-ganic carbon at 254 nm (SUVA254), a metric commonly usedas a proxy for assessing both chemical (Weishaar et al., 2003;Westerhoff et al., 2004) and biological reactivity (Berggrenet al., 2009; Asmala et al., 2013) of the dissolved organicmatter (DOM) pool in natural aquatic ecosystems, decreasedrapidly along the south–north gradient in both transects 600and 300 (Fig. 7c). This observation is in accordance with aprevious study that showed that SUVA254 was higher in in-
Earth Syst. Sci. Data, 13, 1561–1592, 2021 https://doi.org/10.5194/essd-13-1561-2021

P. Massicotte et al.: The MALINA oceanographic expedition: an overview 1573
Figure 4. Distribution of source water types along transects 600 and 300 (see Fig. 1). Station numbers are identified in light gray on top ofeach panel.
land ecosystems due to elevated lateral connectivity with thesurrounding terrestrial landscape and organic-matter inputsfrom the tributaries (Massicotte et al., 2017). The decrease inSUVA254 toward northern stations (Fig. 7c) suggests that ter-restrially derived DOM transiting toward the ocean is gradu-ally degraded into smaller and more refractory molecules.
Particulate-absorption spectra (ap) for the northernmostand the southernmost stations of transects 600 and 300 arepresented in Fig. 7b. Particulate absorption at the stations lo-cated in the estuary (697 and 398) was much higher than thatmeasured at the open-water stations (620 and 320). For in-stance ap(443) measured at stations 620 (0.03 m−1) and 697(8.62 m−1), the northernmost and the southernmost stationsof transects at the mouth of the Mackenzie River, shows thatap decreases rapidly along the latitudinal axes. This can bepossibly explained because the drained organic and inorganic
material from the surrounding landscape of the Mackenzie’swatershed is degraded or sediments rapidly as it is transferredto the ocean.
4.3.3 Other optical measurements and radiometricquantities
Other optical instruments were attached to the rosette sam-pler. These include a transmissometer (Wetlabs C-Star, path25 cm) for beam attenuation measurement, a chlorophyll flu-orometer (Seapoint) and a CDOM fluorometer (Optic &Mikro Elektronik, Germany; see Amon, 2003). Additionally,a LISST-100X (laser in situ scattering and transmissometry,Sequoia Scientific) was attached to the rosette and providedbeam attenuation (532 nm) and forward light scattering mea-surements at 32 angles, from which particle size distributionwas estimated. Various optical measurements were also made
https://doi.org/10.5194/essd-13-1561-2021 Earth Syst. Sci. Data, 13, 1561–1592, 2021

1574 P. Massicotte et al.: The MALINA oceanographic expedition: an overview
Figure 5. Cross-sections of temperature (a) and salinity (b) measured by the CTD (gray dots) along transects 600 and 300. Station numbersare identified in light gray on top of each panel.
in the laboratory to determine other IOPs. These include theabsorption of colored dissolved (aCDOM) and particulate (ap)organic matter and the absorption coefficients of non-algalparticles (aNAP) and phytoplankton (aphi). Apparent-optical-property (AOPs) measurements included light transmittance(T ), photosynthetically available radiation (PAR), downwardirradiance (Ed), upwelled radiance (Lu) and global solar ir-radiance (Es). The latter three radiometric quantities weremeasured simultaneously using a compact optical-profilingsystem (C-OPS) manufactured by Biospherical InstrumentsInc. (San Diego, California) that was deployed during MA-LINA Leg 2b. The principal data products obtained from theC-OPS data were the diffuse attenuation coefficient (Kd) plusthe water-leaving radiance (LW), including all normalizedforms. Detailed methodology and results derived from C-OPS measurements can be found in Doxaran et al. (2012a),Antoine et al. (2013a), Bélanger et al. (2013b) and Hookeret al. (2013).
4.4 Nutrients
Samples for nitrate, nitrite, soluble reactive phosphorus andsilicate determination were collected into 20 mL polyethy-lene flasks, immediately poisoned with mercuric chloride(Kirkwood, 1992) and stored for subsequent laboratory anal-
ysis according to Raimbault et al. (1990) and Aminot andKérouel (2007). Ammonium concentrations (40 mL col-lected into 60 mL polycarbonate tubes) were measured on-board using the sensitive method of Holmes et al. (1999),with a detection limit of 5 nmol L−1. Samples for organic-matter determination were collected into 50 mL glass Schottbottles, immediately acidified with 100 µL of 0.5 N H2SO4and stored in the dark at 5 ◦C. Dissolved organic carbon(DOC), dissolved organic nitrogen (DON) and dissolved or-ganic phosphorus (DOP) were determined at the laboratoryusing the wet-oxidation procedure according to Raimbaultet al. (1999b).
Nitrate levels were always very low at the surface, withconcentration generally lower than 0.01 µmolL−1, exceptin the Mackenzie plume (Fig. 8). It is interesting to notethat nitrate was never entirely depleted, and some traces(0.005 to 0.01 µmolL−1) were always detectable in sur-face waters (Fig. 8a). Ammonium distribution showed thesame pattern. Even if concentrations were very low (gener-ally< 0.03 µmolL−1), this nutrient, like nitrate, was alwaysdetected, suggesting that in situ sources of nitrate and am-monium exist offshore, certainly due to biological processes.Phosphate concentrations showed the opposite distribution(Fig. 8b). Despite nitrogen depletion, surface waters were al-ways phosphate-replete. The highest concentrations, around
Earth Syst. Sci. Data, 13, 1561–1592, 2021 https://doi.org/10.5194/essd-13-1561-2021

P. Massicotte et al.: The MALINA oceanographic expedition: an overview 1575
Figure 6. Cross-sections of (a) absorption (a(440)) and (b) total scattering (bb(440)) measured from the barge at 440 nm with an AC9 andBB9, respectively, along transects 600 and 300. Station numbers are identified in light gray on top of each panel. Note that the data have beensquare-root-transformed for the visualization.
0.5 µmolL−1, were observed far from Mackenzie’s mouth,revealing a clear west–east gradient. The silicate distributionwas similar to that of nitrate. But surface waters were al-ways silicate-replete, with concentrations largely above thedetection limit (> 4 µmolL−1). The impact of the Macken-zie River was clear close to the coast for inorganic nutrientsand farther offshore for dissolved organic nutrients. A quar-ter of the estimated annual nutrient supply by the MackenzieRiver occurred during July–August. The supply of DON was8 times larger than that of nitrate-N. By contrast, the amountof DOP supplied was only 2.5 times higher than the amountof phosphate (Tremblay et al., 2014). The Mackenzie Riverenriched the western Canadian Beaufort Shelf with inorganicand organic N, potentially supporting most of the primaryproduction but not with phosphate or ammonium. Large de-liveries of N relative to P by rivers relax coastal communitiesfrom N limitation, allowing them to tap into the excess Poriginating from the Pacific Ocean. Then, river inputs locallyrectified the strong regional deficit of inorganic N, i.e., nega-tive N∗ (Tremblay et al., 2014).
4.5 Dissolved organic carbon, total dissolved nitrogen,total hydrolyzable amino acids and total dissolvedlignin phenols
Water samples were collected at selected stations and watermasses for analyses of dissolved organic carbon (DOC), to-tal dissolved nitrogen (TDN), total hydrolyzable amino acid(THAA) and total dissolved lignin phenol (TDLP9) concen-trations. Samples for DOC, TDN and THAAs were gravity-filtered from Niskin bottles using pre-combusted (GF/F) fil-ters (0.7 µm pore size) and stored frozen (−20 ◦C) imme-diately after collection in pre-combusted borosilicate glassvials (Shen et al., 2012). Samples for TDLP9 analysis (be-tween 1 and 10 L) were gravity-filtered from Niskin bot-tles using Whatman Polycap AS cartridges (0.2 µm poresize), acidified to pH between 2.5 and 3 with sulfuric acid,and extracted within a few hours using C-18 cartridges(Louchouarn et al., 2000; Fichot et al., 2013). The C-18cartridges were stored at 4 ◦C until elution with 30 mLof methanol (high-precision-liquid-chromatography-grade,HPLC-grade), and the eluent was stored in sealed, pre-combusted glass vials at −20 ◦C until analysis. DOC andTDN concentrations were measured by high-temperaturecombustion using a Shimadzu total-organic-carbon analyzer
https://doi.org/10.5194/essd-13-1561-2021 Earth Syst. Sci. Data, 13, 1561–1592, 2021

1576 P. Massicotte et al.: The MALINA oceanographic expedition: an overview
Figure 7. (a) Absorption spectra between 254 and 600 nm of chromophoric dissolved organic matter (aCDOM) measured at the surfacefor the northern (620, 320) and southern (697, 398) stations of the transects 600 and 300. (b) Particulate-absorption spectra (ap) measuredbetween 300 and 600 nm measured at the surface for the northernmost and the southernmost stations of the transects 600 and 300. (c) SpecificUV absorbance at 254 nm (SUVA254, i.e., absorption of light at 254 nm per unit of carbon) at surface for stations along transects 600 and 300.Stations are identified in light gray (see Fig. 1 for an overview of the station locations). Note the difference in the y axes used in panels (a)and (b), which highlights the important differences in dissolved and particulate absorption between stations in the estuary and those offshore.
(TOC-V) equipped with an inline chemiluminescence nitro-gen detector and an autosampler (Benner and Strom, 1993).Blanks were negligible, and the coefficient of variation be-tween injections of a given sample was typically less than1 %. Analysis of a deep-seawater reference standard (Univer-sity of Miami) every sixth sample was used to check the ac-curacy and consistency of measured DOC and TDN concen-tration. THAAs were determined as the sum of 18 dissolvedamino acids using an Agilent high-performance liquid chro-matography system equipped with a fluorescence detector(excitation: 330 nm; emission: 450 nm). Samples (100 µL) offiltered seawater were hydrolyzed with 6 mol L−1 hydrochlo-ric acid using a microwave-assisted vapor-phase method(Kaiser and Benner, 2005). Free amino acids liberated duringthe hydrolysis were separated as o-phthaldialdehyde deriva-tives using a LiCrospher RP-18 or Zorbax SB-C18 column
(Shen et al., 2012). Detailed methodological information canbe found in Fichot et al. (2013) and Shen et al. (2012).
Surface DOC concentrations along the transects 300 and600 behaved approximately conservatively with salinity, de-creasing from 458 µmolL−1 in the Mackenzie River end-member (salinity= 0.2 PSU) to 123 µmolL−1 at a salinity of26.69 PSU (Fig. 9a). DOC concentrations in surface watersfurther decreased to minimum values of ≈ 66 µmolL−1 off-shore (Fichot and Benner, 2011). Concentrations generallyincreased by a few µmolL−1 in the upper halocline relativeto surface values but then generally decreased with depth,reaching 53–57 µmolL−1 in the lower halocline and ≈ 43–50 µmolL−1 in deep water masses (depth> 1000 m). Simi-larly to DOC, surface TDLP9 concentrations along transects600 and 300 behaved approximately conservatively withsalinity, decreasing from ≈ 93–96 nmol L−1 in the Macken-zie River end-member (salinity= 0.2 PSU) to≈ 12 nmol L−1
Earth Syst. Sci. Data, 13, 1561–1592, 2021 https://doi.org/10.5194/essd-13-1561-2021

P. Massicotte et al.: The MALINA oceanographic expedition: an overview 1577
Figure 8. Cross-sections of (a) NO−3 and (b) PO3−4 measured from Niskin bottles (gray dots) along transects 600 and 300. (c) N∗ defined
as N − rP , with r =N/P = 13.1 (see the text for the details). Station numbers are identified in light gray on top of each panel.
at a salinity of 26.69 PSU (Fig. 9b). Surface concentrationsreached minimum values of ≈ 2.5 nmol L−1 offshore (Fi-chot et al., 2016). TDLP9 concentrations generally decreasedwith depth, reaching minimum values of < 1.5 nmol L−1 be-low the halocline. Surface concentrations of THAAs alongthe transects 600 and 300 decreased from 576 nmol L−1 inthe Mackenzie River end-member (salinity = 0.2 PSU) to317 nmol L−1 at a salinity of 26.69 PSU (Fig. 9c). UnlikeDOC and TDLP9’s, concentrations of THAAs did not fol-
low a conservative mixing line along the salinity gradient.Elevated concentrations of THAAs were observed in mid-salinity waters in both transects, suggesting plankton produc-tion in these regions. In comparison, THAA concentrationsin the slope and basin waters were lower and decreased withdepth, reaching minimal values of ≈ 70 nmol L−1 below thehalocline (Shen et al., 2012).
https://doi.org/10.5194/essd-13-1561-2021 Earth Syst. Sci. Data, 13, 1561–1592, 2021

1578 P. Massicotte et al.: The MALINA oceanographic expedition: an overview
Figure 9. Surface concentrations of (a) dissolved organic carbon (DOC), (b) total dissolved lignin phenols (TDLP9’s) and (c) total hydrolyz-able amino acids (THAAs) measured along transects 600 and 300 and plotted against salinity.
4.6 Pigments
Water samples (volumes between 0.25 and 2.27 L) were fil-tered through glass fiber GF/F filters (25 mm diameter, par-ticle retention size 0.7 µm). They were immediately frozenat −80 ◦C, transported in liquid nitrogen and then stored at−80 ◦C until analysis on land. Samples were extracted in3 mL HPLC-grade methanol for 2 h minimum. After sonica-tion, the clarified extracts were injected (within 24 h) ontoa reversed-phase C8 Zorbax Eclipse column (dimensions:3× 150 mm; 3.5 µm pore size). The instrumentation com-prised an Agilent Technologies 1100 series HPLC systemwith diode array detection at 450, 667 and 770 nm of phyto-plankton pigments (carotenoids; chlorophylls a, b and c; andbacteriochlorophyll a). A total of 22 pigments were analyzedand quantified. Details of the HPLC analytical procedure canbe found in Ras et al. (2008).
As illustrated in Fig. 10, the phytoplankton biomass, indi-cated by total chlorophyll a concentrations, was the highestat the coast (up to 3.5 mg m−3), decreasing offshore (to about0.010 mg m−3) with the formation of a subsurface chloro-phyll maximum (SCM) around 60 m. In terms of biomassintegrated over the sampled depth, values range from 6.2 and8.9 mg m−2 at the coast to 14.3 and 13.2 mg m−2 offshorefor transects 300 and 600, respectively. In general, the mostpredominant accessory pigment was fucoxanthin, indicatingthat diatoms constitute a large proportion of the phytoplank-ton assemblage. However, in offshore waters and aroundthe SCM, 19’-hexanoyloxyfucoxanthin concentrations wereequivalent to or sometimes higher than fucoxanthin, suggest-ing that, in these waters, haptophytes can predominate overdiatoms. Other pigments such as chlorophyll b and prasi-noxanthin suggest the presence of green algae and probablyMicromonas-type cells, especially in coastal waters and at
Earth Syst. Sci. Data, 13, 1561–1592, 2021 https://doi.org/10.5194/essd-13-1561-2021

P. Massicotte et al.: The MALINA oceanographic expedition: an overview 1579
the surface. For more detailed information, see Coupel et al.(2015), who used this data set applied to the CHEMTAX(CHEMical TAXonomy) chemotaxonomic tool to assess thedistribution of phytoplankton communities.
4.7 Phytoplankton abundance and diversity
The abundance of the eukaryotic pico- and nano-phytoplankton was measured by flow cytometry onboard theAmundsen with a FACSAria instrument (Becton Dickinson,San Jose, CA, USA) following the protocol of Marie et al.(1999).
In transect 300 and 600 (Fig. 11), the abundance of pico-and nano-phytoplankton reached maximal values around5000 and 3000 cells mL−1, respectively. On transect 600,pico-eukaryotes’ higher abundances were restricted to thesurface layer, with a 5- to 10-fold drop at 30 m. In con-trast, nano-eukaryotes formed clear deep maxima, especiallyat stations 610 and 680. On transect 300, pico-eukaryoteswere also abundant in the surface at the more off-shorestations. Still, they decreased sharply near shore, whilenano-eukaryotes’ highest concentrations were near the rivermouth, linked to high diatom concentrations (Balzano et al.,2012a). The composition of eukaryotic phytoplankton wasdetermined with two different approaches. We isolated 164cultures using a range of techniques (single-cell isolation,serial dilution, flow cytometry sorting) that have been char-acterized morphologically and genetically (Balzano et al.,2012a, 2017) and deposited to the Roscoff Culture Collec-tion (http://www.roscoff-culture-collection.org, last access:16 March 2021). Among these cultures, several new specieshave been discovered such as the new species of green al-gae Mantoniella beaufortii (Yau et al., 2020) or the diatomPseudo-nitzschia arctica (Percopo et al., 2016), but moreawait description, in particular among Pelagophyceae. Oneof the strains isolated (RCC2488, Chlamydomonas malinanomen nudum) has been recently found to be suitable forbiotechnology applications (Morales-Sánchez et al., 2020).We also used molecular approaches by sorting pico- andnano-eukaryotic communities and characterizing their tax-onomic composition by TRFLP (terminal-restriction frag-ment length polymorphism) analysis and cloning and se-quencing of the 18S ribosomal RNA gene (Balzano et al.,2012a). While the pico-phytoplankton was dominated by thespecies Micromonas polaris, the nano-phytoplankton wasmore diverse and dominated by diatoms mostly representedby Chaetoceros neogracilis and C. gelidus, with the formermostly present at surface waters and the latter prevailing inthe SCM (Balzano et al., 2012a). Furthermore, C. neogra-cilis sampled from the Beaufort Sea consists of at least fourreproductively isolated genotypes (Balzano et al., 2017). Thecomparison between the taxonomy of natural communitiesand isolated cultures (Fig. 12) reveals that, although we suc-ceeded at isolating some dominant species in the field such asM. polaris, C. neogracilis and C. gelidus, some other impor-
tant taxa such as the diatom Fragilariopsis or the haptophyteChrysochromulina were not recovered.
4.8 Carbon fluxes
In the context of climate change, the main objective of theMALINA oceanographic expedition was to determine how(1) primary production, (2) bacterial activity and (3) photo-degradation influence carbon fluxes and cycling of organicmatter in the Arctic. In the following sections, we presentan overview of these processes in the water column that aredetailed in Ortega-Retuerta et al. (2012a), Xie et al. (2012)and Tremblay et al. (2014) and refer to Link et al. (2013a),Tolosa et al. (2013) and Rontani et al. (2012b) for the relatedprocesses at the sediment–water interface.
4.8.1 Phytoplankton primary production
At each station, when productivity was quantified, rates ofcarbon fixation (primary production) were determined usinga 13C isotopic technique (Raimbault and Garcia, 2008). Forthis purpose, three 580 mL samples were collected at mini-mum sun elevation or before sunrise at six to seven depths be-tween the surface and the depth where irradiance was 0.3 %of the surface value and poured into acid-cleaned polycar-bonate flasks. Incubations were carried out immediately fol-lowing the tracer addition in an on-deck incubator. This con-sisted of six to seven opaque boxes, each with associatedneutral and blue screens, allowing around 50 %, 25 %, 15 %,8 %, 4 %, 1 % and 0.3 % light penetration. At five stations,incubations were also performed in situ on a drifting rig withincubation bottles positioned at the same depth where sam-ples for on-deck incubations were collected. After 24 h, sam-ples were filtered through pre-combusted (450 ◦C) WhatmanGF/F filters (25 mm diameter). After filtration, filters wereplaced into 2 mL glass tubes, dried for 24 h in a 60 ◦C ovenand stored dry until laboratory analysis. These filters wereused to determine the final 13C enrichment ratio in the par-ticulate organic matter on an Integra CN mass spectrometer.Filtrates were poisoned with HgCl2 and stored to estimateammonium regeneration and nitrification rates. The isotopicenrichment of particulate organic matter and dissolved NH+4and NO−3 at the end of incubations were used to calculate netC and N uptake and the recycling of NH+4 and NO−3 (Raim-bault et al., 1999c).
Daily rates of primary production at the surfacewere generally very low across the survey area, rang-ing from 0.1 mg C m−3 d−1 offshore to a maximum of545 mg C m−3 d−1 in Kugmallit Bay (Fig. 13), associatedwith the Mackenzie River discharge (Tremblay et al., 2014).Ammonification and nitrification followed the same coastal-offshore pattern, with rates driving most, if not all, of theNH+4 and NO−3 consumption in the surface layer. Primaryproduction was generally maximum at the surface, but highrates were often observed at depth in the nitracline layer, as-
https://doi.org/10.5194/essd-13-1561-2021 Earth Syst. Sci. Data, 13, 1561–1592, 2021
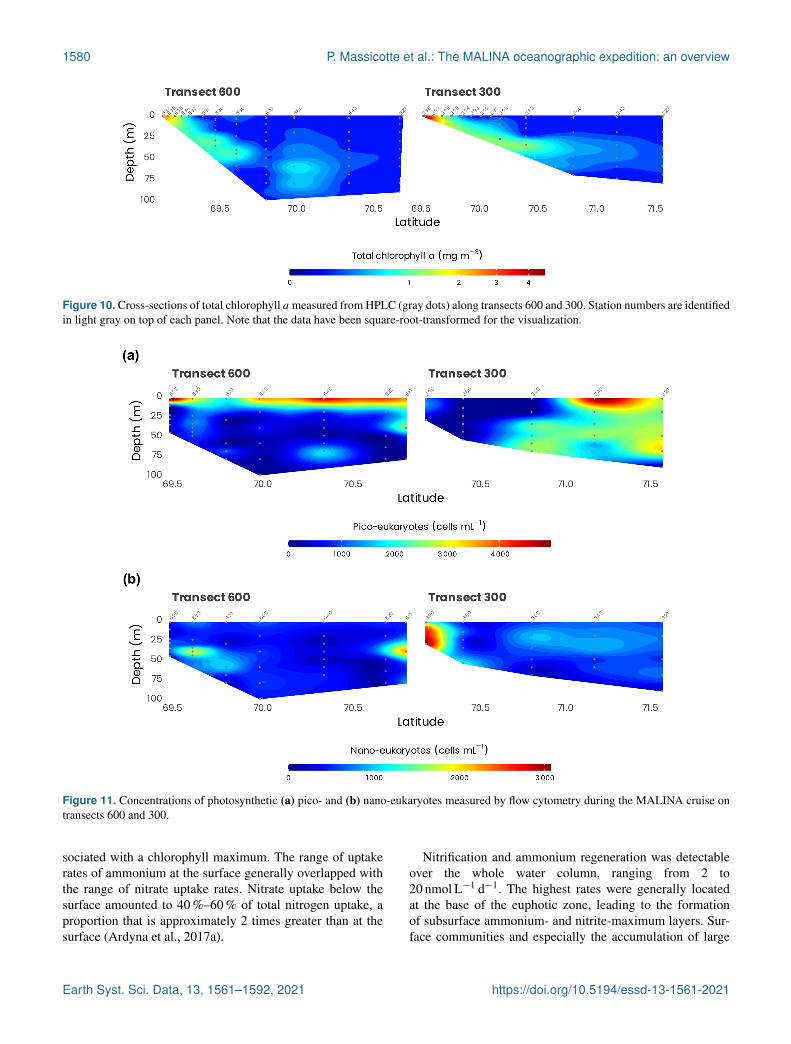
1580 P. Massicotte et al.: The MALINA oceanographic expedition: an overview
Figure 10. Cross-sections of total chlorophyll a measured from HPLC (gray dots) along transects 600 and 300. Station numbers are identifiedin light gray on top of each panel. Note that the data have been square-root-transformed for the visualization.
Figure 11. Concentrations of photosynthetic (a) pico- and (b) nano-eukaryotes measured by flow cytometry during the MALINA cruise ontransects 600 and 300.
sociated with a chlorophyll maximum. The range of uptakerates of ammonium at the surface generally overlapped withthe range of nitrate uptake rates. Nitrate uptake below thesurface amounted to 40 %–60 % of total nitrogen uptake, aproportion that is approximately 2 times greater than at thesurface (Ardyna et al., 2017a).
Nitrification and ammonium regeneration was detectableover the whole water column, ranging from 2 to20 nmol L−1 d−1. The highest rates were generally locatedat the base of the euphotic zone, leading to the formationof subsurface ammonium- and nitrite-maximum layers. Sur-face communities and especially the accumulation of large
Earth Syst. Sci. Data, 13, 1561–1592, 2021 https://doi.org/10.5194/essd-13-1561-2021
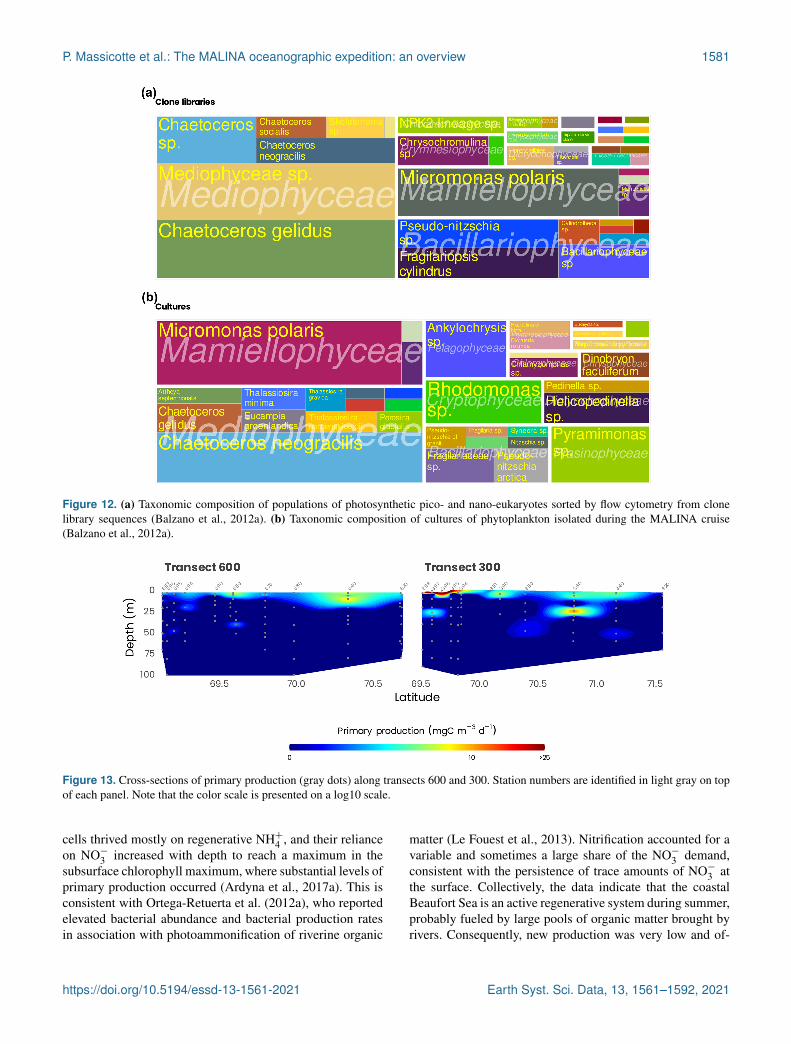
P. Massicotte et al.: The MALINA oceanographic expedition: an overview 1581
Figure 12. (a) Taxonomic composition of populations of photosynthetic pico- and nano-eukaryotes sorted by flow cytometry from clonelibrary sequences (Balzano et al., 2012a). (b) Taxonomic composition of cultures of phytoplankton isolated during the MALINA cruise(Balzano et al., 2012a).
Figure 13. Cross-sections of primary production (gray dots) along transects 600 and 300. Station numbers are identified in light gray on topof each panel. Note that the color scale is presented on a log10 scale.
cells thrived mostly on regenerative NH+4 , and their relianceon NO−3 increased with depth to reach a maximum in thesubsurface chlorophyll maximum, where substantial levels ofprimary production occurred (Ardyna et al., 2017a). This isconsistent with Ortega-Retuerta et al. (2012a), who reportedelevated bacterial abundance and bacterial production ratesin association with photoammonification of riverine organic
matter (Le Fouest et al., 2013). Nitrification accounted for avariable and sometimes a large share of the NO−3 demand,consistent with the persistence of trace amounts of NO−3 atthe surface. Collectively, the data indicate that the coastalBeaufort Sea is an active regenerative system during summer,probably fueled by large pools of organic matter brought byrivers. Consequently, new production was very low and of-
https://doi.org/10.5194/essd-13-1561-2021 Earth Syst. Sci. Data, 13, 1561–1592, 2021

1582 P. Massicotte et al.: The MALINA oceanographic expedition: an overview
Figure 14. (a) CO and CO2 production measured at 295 nm at the surface for stations of transects 600 and 300. (b) Autoxidation of suspendedparticulate material for stations of transects 600 and 300.
ten close to 0 in the 0–40 m layer. But high nitrate uptakerates can be observed at depth (Station 135), often associ-ated with high primary production located in the chlorophyll-maximum layer, which is the place of significant new pro-duction. The impact of the Mackenzie River on shelf pro-ductivity during summer is moderate and associated mostlywith localized nutrient recycling in the near-shore estuarinetransition zone (Tremblay et al., 2014).
4.8.2 Photo-degradation
CO and CO2 production from dissolved organic matter
Surface water samples were gravity-filtered upon collec-tion through a pre-cleaned Pall AcroPak 1000 filtration cap-sule sequentially containing 0.8 and 0.2 µm polyethersulfone
membranes. Filtered water was stored in clear glass bot-tles at 4 ◦C in darkness. CO photoproduction rates (PCO,nmol L−1 h−1) were determined aboard the CCGS Amund-sen immediately after sample collection, whereas CO2 pho-toproduction rates (PCO2 , nmol L−1 h−1) were measuredin a land-based laboratory in Rimouski, Québec, within 3months of sample collection. The sample-pretreatment andirradiation procedures followed those reported previously(Bélanger et al., 2006b; Song et al., 2013). Briefly, after mini-mizing the background CO and CO2 concentrations, sampleswere transferred into combusted, quartz-windowed cylindri-cal cells (CO: interior diameter of 3.4 cm, length of 11.4 cm;CO2: interior diameter of 2.0 cm, length of 14 cm) and ir-radiated at 4 ◦C using a SUNTEST XLS+ solar simulatorequipped with a 1.5 kW xenon lamp. The radiation emitted
Earth Syst. Sci. Data, 13, 1561–1592, 2021 https://doi.org/10.5194/essd-13-1561-2021

P. Massicotte et al.: The MALINA oceanographic expedition: an overview 1583
Figure 15. (a) Cross-sections of bacterial abundance measured from flow cytometry and (b) bacterial production measured along transect600. Station numbers are identified in light gray on top of each panel. (c) Cumulative bar charts comparing the relative class abundances inparticle-attached (PA) and free-living (FL) bacteria for a selected number of samples in transect 600.
from the solar simulator was screened with a Schott long-pass glass filter to remove UV radiation < 295 nm. The ir-radiations lasted for 10 min to 2 h for CO and 24 to 48 hfor CO2. The photon flux reaching the quartz windows ofthe cells was measured to be 835 µmolm−2 s−1 for CO and855 µmolm−2 s−1 for CO2 over the wavelength range from280 to 500 nm.
Both PCO2 and PCO increased landward, with the differ-ence between the most and least saline samples reaching afactor of ≈ 5 along transect 300 and ≈ 8 along transect 600for PCO2 and ≈ 7 along transect 600 for PCO (Fig. 14a).This landward increase in PCO2 and PCO was due princi-pally to the parallel augmentation in CDOM absorption, asdemonstrated by the linear relationships between these tworates with CDOM absorption: PCO2 = 279.1×aCDOM(412)−17.0 (R2
= 0.964,n= 9) and PCO = 17.5× aCDOM(412)−4.8 (R2
= 0.966,n= 7), where aCDOM(412) (m−1) is theCDOM absorption coefficient at 412 nm published previ-ously (Song et al., 2013; Taalba et al., 2013). The irradiance-normalized PCO2/PCO ratio gradually decreased landwardalong transect 600, from 23.5 at station 691 to 16.2 at station697, suggesting that the near-shore samples were more effi-cient at CO photoproduction relative to CO2 photoproduction
than the shelf samples. The PCO2/PCO ratios at the two sta-tions on transect 300 were, however, similar (18.9 for station394 and 20.1 for station 396). Combining the PCO2/PCO ra-tios from both transects results in an average ratio of 19.8(±2.5 SD), with a rather small relative standard deviation of12.5 %.
It should be pointed out that extrapolating the lab-determined CO2 and CO photoproduction rates to the sam-pling area is practically infeasible due to the very differ-ent laboratory and real-environment conditions. For instance,the water column in the Mackenzie estuary and shelf areascontains large numbers of particles (Doxaran et al., 2012a),which are also optically active, whereas the irradiated sam-ples were particle-free. Furthermore, the photoproductionrates in the water column would decrease rapidly with depthbecause of the strong light attenuation by CDOM and parti-cles, while the laboratory radiation at best simulated the radi-ation of the top 1–2 cm layer of the water column even with-out considering the constant vs. varying irradiance from thesolar simulator and natural sunlight, respectively. Estimatingthe areal photoproduction rates in the water column from lab-derived data often requires coupled optical–photochemicalmodeling that incorporates spectral apparent quantum yields
https://doi.org/10.5194/essd-13-1561-2021 Earth Syst. Sci. Data, 13, 1561–1592, 2021

1584 P. Massicotte et al.: The MALINA oceanographic expedition: an overview
of the photoproduct of interest (Bélanger et al., 2006b; Xieet al., 2009; Fichot and Miller, 2010). Using this approachand CO data from the MALINA cruise, Song et al. (2013)estimated a yearly averaged areal CO photoproduction rateof 9.6 µmolm−2 d−1 in the Mackenzie estuary and shelf ar-eas, which implies a yearly averaged areal CO2 photopro-duction rate of 191.1 µmolm−2 d−1 based on the averagePCO2/PCO ratio of 19.8 obtained above. Aggregating theCO2 and CO rates gives a total photomineralization rate of199.7 µmolCm−2 d−1.
Autoxidation of suspended particulate material
Water samples were filtered immediately after collectionthrough a pre-combusted glass fiber filter (Whatman GF/F,0.7 µm) under a low vacuum. The filters were frozen imme-diately at −20 ◦C until analysis and transported to the lab-oratory. Treatment of the filters involved NaBH4 reductionand classical alkaline hydrolysis (Rontani et al., 2012a). Re-duction of labile hydroperoxides to alcohols is essential forestimating the importance of autoxidative degradation in nat-ural samples by gas chromatography–electron impact massspectrometry (GC–EIMS) (Marchand and Rontani, 2001).Autoxidative degradation of terrigenous particulate organicmatter (POM) discharged by the Mackenzie River was moni-tored thanks to specific oxidation products of sitosterol (mainsterol of higher plants) and dehydroabietic acid (a componentof conifers).
The autoxidation state of these tracers increases stronglyat the offshore stations (Fig. 14b) (reaching 89 % and 86 %at station 690 and station 380, respectively, in the case ofsitosterol; see Rontani et al., 2014). These results allowed usto demonstrate that in surface waters of the Beaufort Sea,autoxidation strongly affects vascular plant lipids and prob-ably also the other components of terrestrial organic matter(OM) delivered by the Mackenzie River. Initiation of theseabiotic oxidation processes was attributed to the involvementof some enzymes producing radicals (lipoxygenases), whichare present in higher plant debris and whose activity is en-hanced at high salinities (Galeron et al., 2018).
Bacterial production and respiration
Bacterial production (BP; assessed by 3H-leucine incuba-tions, n= 171) and respiration (BR; assessed by changes inO2 by Winkler titration, n= 13) were measured from the sur-face to 200 m at 44 sampling locations. Bacterial produc-tion ranged from 8.8 to 7078 µg C m−3 d−1 and showed amarked decreasing pattern from the mouth of the Mackenzieto the open Beaufort Sea and from the surface to deep waters(Fig. 15). Temperature and labile dissolved organic matter(indicated as dissolved amino acids) controlled BP variabil-ity (Ortega-Retuerta et al., 2012a), and the nitrogen limita-tion of surface BP during the summer period was demon-strated experimentally (Ortega-Retuerta et al., 2012b). BR
ranged from 5500 to 45 500 µgCm−3 d−1, leading to a bac-terial growth efficiency of 8 % on average. BP and BR werelow with respect to lower latitudes but within the range ofthose in polar ecosystems, suggesting the role of low tem-peratures driving carbon fluxes through bacteria (Kirchmanet al., 2009). Bacterial carbon demand (BP+ BR), which av-eraged 21 500± 14 900 µg C m−3 d−1, was higher than pri-mary production in the whole study area, indicating that theMackenzie River platform and the Beaufort Sea are net het-erotrophic during summer. This may suggest a temporal de-coupling between carbon fixation and remineralization in thearea.
4.8.3 Bacterial diversity
Spatial variations in bacterial-community structure were ex-plored in surface waters from the Mackenzie River to theopen Beaufort Sea (n= 20). By using 16S rRNA-based anal-ysis, we investigated both particle-attached (PA; > 3 µm sizefraction) and free-living (FL; size fraction between 3 and0.2 µm) bacteria along a river-to-open-sea transect. Multi-variate statistical analysis revealed significant differences incommunity structure between the river, coastal and open-sea waters, mainly driven by salinity, particle loads, chloro-phyll a and amino acid concentration (Ortega-Retuerta et al.,2013). Bacterial communities differed between PA and FLfractions only at open-sea stations, likely due to the higherorganic-carbon content in particles with respect to particlesfrom the river and coast, which were enriched in miner-als. Alphaproteobacteria dominated in FL open-sea samples,while the PA fraction was mainly composed of Gammapro-teobacteria, Opitutae (Verrucomicrobia) and Flavobacteria.The coastal and river samples were dominated by Betapro-teobacteria, Alphaproteobacteria and Actinobacteria in boththe PA and FL fractions (Fig. 15c). These results highlightthe importance of particle quality, a variable that is pre-dicted to change along with global warming, in influenc-ing bacterial-community structure and thus likely altering thebiogeochemical cycles that they mediate.
5 Code and data availability
Metadata and detailed information about measurementscan be found in associated MALINA papers presented inTable 1. Data are provided as a collection of comma-separated values (CSV) files that are regrouping measure-ments associated with a particular type of measure. Toaid the user in merging these files, there is a lookup ta-ble file called stations.csv that can serve as a table tojoin all the data together based on date, time, station,cast, depth, longitude and latitude. Additionally, originaldata provided by all the researchers as well as addi-tional metadata are available on the LEFE-CYBER repos-itory (http://www.obs-vlfr.fr/proof/php/malina/x_datalist_1.php?xxop=malina&xxcamp=malina, last access: 8 Febru-
Earth Syst. Sci. Data, 13, 1561–1592, 2021 https://doi.org/10.5194/essd-13-1561-2021
P. Massicotte et al.: The MALINA oceanographic expedition: an overview 1585
ary 2021). The processed and tidied version of the datais hosted at SEANOE (SEA scieNtific Open data Edition)under the CC-BY license (https://doi.org/10.17882/75345;Massicotte et al., 2020). The raw UVP5 large-particulatedata and images are all available from the EcoPart andEcotaxa website (https://ecotaxa.obs-vlfr.fr/, last access:25 February 2021, Picheral et al., 2017). Note that Ta-ble 1 also indicates whether the measured variables aredirectly available in the data files or by contacting theresponsible principal investigators. For specific questions,please contact the principal investigator associated withthe data (see Table 1). If more data become available,they will be added to the SEANOE repository. The codeused to produce the figures and the analysis presentedin this paper is available under the GNU GPLv3 li-cense (https://doi.org/10.5281/zenodo.4518943, Massicotte,2021).
6 Conclusions
The comprehensive data set assembled during the MALINAoceanographic cruise has given unique insights into thestocks and the processes controlling carbon fluxes in theMackenzie River and the Beaufort Sea. In this paper, onlya handful of variables have been presented. The reader canfind the complete list of measured variables in Table 1, allof which are also fully available in the data repository. Theuniqueness and comprehensiveness of this data set offer moreopportunities to reuse it for other applications.
Author contributions. MB and SB designed the MALINAproject, including the scientific objectives and the sampling strat-egy. PM prepared the initial draft of the manuscript. SB was re-sponsible for spectrophotometric measurement of particle absorp-tion and fluorometric chlorophyll a determination onboard and withabove-water radiometry (e.g., continuous incident irradiance mea-surements). JE was the logistic coordinator for the cruise and wasresponsible for IOP measurements from the CTD rosette and con-tributed to SPM, POC and particulate absorption measurementsand processing. PF performed the GC–MS experiments on organicmolecular compositions. AM and BL were in charge of determin-ing carbonate system parameters (pH and total alkalinity) as wellas the stable oxygen isotopic composition of the water and stablecarbon isotopic composition of the dissolved inorganic carbon. BLparticipated in the cruise, collected the samples and compiled andprocessed most of the data. Carbonate system parameters were usedto determine the saturation of waters concerning aragonite as wellas calculate the surface water pCO2. These parameters and otherswere used by the proponents to identify and estimate the contribu-tion of parental waters to the structure of the water column in thestudy area. CM, LP and YG operated the rosette during the MA-LINA cruise. CM was in charge of all the physical instruments dur-ing the cruise. She also operated the UVP5 sensor. YG was in chargeof the physical data processing during and after the cruise. CM andLP processed the LADCP data during the cruise. MP developedand operated the UVP5 sensor and processed the data. GG con-
tributed to the UVP development. CJ processed samples during theMALINA cruise, designed the experiments on photoheterotrophicbacteria and wrote the related manuscripts. DB designed and per-formed the experiments on photoheterotrophic bacteria and wrotethe related manuscripts. DV and DM participated in the MALINAcruise and sampled for flow cytometry, DNA and cultures. DM per-formed flow cytometry measurements and cell sorting. DV also co-ordinated the work on phytoplankton culture and molecular anal-yses. SB performed molecular analyses of flow-cytometry-sortedphotosynthetic pico- and nano-eukaryotes as well as phytoplank-ton cultures. PG isolated and characterized phytoplankton cultures.WJ, EOR and FJ participated in the MALINA cruise, collected sam-ples for bacterial production and respiration and prokaryotic diver-sity, and performed nutrient limitation experiments. RB participatedin the MALINA cruise and collected the samples for DOC, TDN,THAA and TDLP9. CF analyzed the samples for DOC, TDN andTDLP6. YS analyzed the samples for THAA. RA contributed ad-vice for the leads and the measurements of CDOM fluorescence. PGwas in charge of the processing and quality control of the CTD data.CL contributed material, protocols and advice for DNA samplingfor planktonic material. HJH contributed to the data interpretationregarding bacterial diversity and activity. HX and GS participated inthe MALINA cruise, designed and conducted the onboard CO pho-toproduction experiment, and collected samples for the CO2 photo-production experiment. TP oversaw the measurement of meteoro-logical elements from an instrumented tower on the ship’s foredeckand the measurement of incoming solar shortwave, longwave, PARand UV radiation from sensors mounted on top of the ship’s wheel-house. FB and YH participated in the MALINA cruise, performedthe P vs. E curve and the FIRe fluorometer measurements (phyto-plankton photosynthesis efficiency), and sampled for the photosyn-thetic protein analysis. FB also helped gather and merge the initialform of the MALINA database with the help of CAB, who codedfor SQL formatting, and MHF, who coordinated the effort. DD par-ticipated in the MALINA field campaign; measured from the bargethe water temperature, salinity and inherent optical properties as afunction of depth; and processed the data. He was also in charge ofmeasuring the suspended particulate matter and particulate organiccarbon concentrations in collected water samples. RR and GZ par-ticipated in the MALINA field program and collected data on sea-water optical properties and particle characteristics. Together withDS, they conducted processing and curation of these data, formalanalysis, and publication of results. All three authors have reviewedand edited the current paper for accuracy. DA participated in MA-LINA Leg 1. He carried out radiometry measurements, includingfrom the underwater radiance cameras, and then processing, analy-sis and publication of the results. He has contributed to editing thecurrent paper. PA contributed material, protocols and advice of ben-thic sampling and participated in the interpretation of benthic biodi-versity and biodiversity–ecosystem functioning through his Arctic-Net funding. HL participated in the MALINA cruise; was in chargeof sediment sampling with the box corer; designed and performedbenthic incubation experiments onboard; analyzed sediment sam-ples for pigments and macrofauna; processed, analyzed, interpretedand published results obtained from benthic incubations (benthicnutrient fluxes and respiration, macrofauna, TOC, pigments); andcontributed to writing this paper. EL participated in the MALINAcruise and was involved in the radiance camera measurements anddata processing as well as the POLVSM instrument. CS gathered
https://doi.org/10.5194/essd-13-1561-2021 Earth Syst. Sci. Data, 13, 1561–1592, 2021
1586 P. Massicotte et al.: The MALINA oceanographic expedition: an overview
data and metadata for the MALINA cruise through INSU-CNRS(Institut National des Sciences de l’Univers – Centre National dela Recherche Scientifique) funding. MC and AT participated in theMALINA cruise; they operated the POLVSM instrument to measurethe particulate scattering phase function of the water sample. BGand JaM participated in the MALINA cruise, performed samplingof suspended particles with foredeck in situ pumps and assisted CMin the deployment of the drifting sediment trap line. Both performedsample treatment and analysis of 234Th, and JCM participated in theinterpretation of the data and coordination of these operations priorto the cruise. IT performed data analysis and interpretation of lipidbiomarkers and their carbon isotopic ratios in suspended particu-late matter and sediment and sampled respectively with the fore-deck in situ pumps and box corer. VM participated in the MALINAcruise, mainly on the barge to collect inherent optical properties,deploying the optical package to obtain vertical profiles. NG, PRand PC participated in the MALINA cruise by being in charge ofexperimental incubations for the determination of primary produc-tion and nitrogen assimilation rates as well as the preservation ofsamples for inorganic and organic nutrients in the euphotic zone.NG and PR performed the laboratory nutrient analysis and isotopicmeasurements of preserved samples, respectively. PR has compiledand processed the data and has contributed to editing the current pa-per. JÉT and JoM were responsible for the collection of inorganicnutrient samples in the entire water column and their analysis im-mediately on board (fresh). JFR carried out lipid analyses (lipid ex-traction, derivatization and GC–MS analyses) on SPM samples col-lected during the MALINA cruise, interpreted the results obtainedand participated in the writing of the present paper. BC participatedin the MALINA cruise, being in charge of sampling and analysisfor DOC, CDOM, monosaccharides, diacids, and atmospheric un-derwater PAR and UV radiation. AM and AB participated in theMALINA cruise, measured CDOM absorption spectra, processedand analyzed the data, and published the results. RS defined thesampling strategy of DOC, CDOM, monosaccharides, diacids, andatmospheric underwater PAR and UV radiation; interpreted the re-sults obtained; and wrote the related manuscripts. CP performedmonosaccharide analysis and wrote the related manuscript. MV per-formed diacid analysis and wrote the related manuscript. SH in-terpreted the mass flux data and wrote the related paper. MG con-tributed material, equipment, protocols and advice for the determi-nation of chlorophyll a and phaeopigments in the water column(fluorometric method) and participated in the interpretation of thephytoplankton biomass and community composition data. ND per-formed sediment trap sample preparation. AR and GM designedthe MSc. project to study the evolution of sea surface conditions inthe Beaufort Sea. SS performed the analysis and interpretation ofsedimentary 210Pbxs and 137Cs profiles. SBH co-developed the C-OPS instrumentation, designed the experiments, co-developed thesoftware to acquire the data by launching a small vessel from themuch larger icebreaker and co-developed the software to processthe data. HC and JR were in charge of HPLC measurements andparticipated in the interpretation of data. AM collected the samplesfor the HPLC analysis during the MALINA cruise. WLM advisedon in situ optical sampling and photochemical experiments. JFGperformed the data analysis on prokaryotic diversity (see the textabove; together with the team WJ, EOR and FJ). FV was in chargeof lipid extractions. JKV participated in the interpretation of lipiddata. GC contributed materials and protocols to benthic incubations.
She performed the analyses of diagenetic species and participated inthe interpretation of redox conditions and benthic oxygen demand.She contributed to writing the related manuscripts. KK, KO and ETcontributed to the analysis of the aerosol filter samples for organicspecies. JG analyzed all the nutrient samples and managed the data.JC performed the analysis of organic aerosols by GC–MS.
Competing interests. The authors declare that they have no con-flict of interest.
Acknowledgements. This work is dedicated to the memory ofMarc Thibault (commanding officer of the CCGS Amundsen, Cana-dian Coast Guard), Daniel Dubé (CCGS Amundsen helicopter pi-lot, Transport Canada) and Klaus Hochheim (research scientist atthe Centre for Earth Observation Science, University of Manitoba),who died in the CCGS Amundsen helicopter crash on the evening of9 September 2013 in the icy waters of McClure Strait in the Cana-dian Arctic. We are very grateful to the captain (Marc Thibault)and crews of the Canadian research icebreaker CCGS Amundsenduring the MALINA cruise in the Beaufort Sea. The InternationalAtomic Energy Agency is grateful to the government of the Princi-pality of Monaco for the support provided to its Environment Lab-oratories. Abderrahmane Nassim Taalba performed the CO2 photo-production experiment. Lise Durantou carried out the analyses andinterpreted the data. Claude-Anne Bouin helped gather and mergethe initial form of the MALINA database. ArcticNet and Québec-Océan funded several students and analyses for their project.
Financial support. This study was conducted as part of the Ma-lina scientific program funded by ANR (Agence Nationale dela Recherche), INSU-CNRS (Institut National des Sciences del’Univers - Centre National de la Recherche Scientifique), theLEFE-CYBER program, CNES (Centre National d’Études Spa-tiales), the European Commission (Marie Skłodowska-Curie Ac-tions), ESA (European Space Agency) and ArcticNet. US NSFgrants 0713915 and 1504137 to Ronal Banner and 0229302,0425582, 0713991 to Rainer M. W. Amon. US NASA (grantno. NNX07AR20G) awarded to Rick A. Reynolds and Dar-iusz Stramski. Natural Science and Engineerinng Council (Canada)Discovery and Northern supplement to Connie Lovejoy.
Review statement. This paper was edited by Giuseppe M. R.Manzella and reviewed by two anonymous referees.
References
Abdul Aziz, O. I. and Burn, D. H.: Trends and variability in the hy-drological regime of the Mackenzie River Basin, J. Hydrol., 319,282–294, https://doi.org/10.1016/j.jhydrol.2005.06.039, 2006.
Aminot, A. and Kérouel, R.: Dosage automatique des nutrimentsdans les eaux marines, in: Méthodes d’analyse en milieu marin,Ifremer, 188 pp., EAN13 Book 9782759200238, 2007.
Amon, R.: Dissolved organic carbon distribution and ori-gin in the Nordic Seas: Exchanges with the Arctic Ocean
Earth Syst. Sci. Data, 13, 1561–1592, 2021 https://doi.org/10.5194/essd-13-1561-2021
P. Massicotte et al.: The MALINA oceanographic expedition: an overview 1587
and the North Atlantic, J. Geophys. Res., 108, 3221,https://doi.org/10.1029/2002JC001594, 2003.
Andrisoa, A., Stieglitz, T., Rodellas, V., and Raimbault, P.: Pri-mary production in coastal lagoons supported by ground-water discharge and porewater fluxes inferred from nitro-gen and carbon isotope signatures, Mar. Chem., 210, 48–60,https://doi.org/10.1016/j.marchem.2019.03.003, 2019.
Antoine, D., Hooker, S. B., Bélanger, S., Matsuoka, A., and Babin,M.: Apparent optical properties of the Canadian Beaufort Sea –Part 1: Observational overview and water column relationships,Biogeosciences, 10, 4493–4509, https://doi.org/10.5194/bg-10-4493-2013, 2013a.
Antoine, D., Morel, A., Leymarie, E., Houyou, A., Gentili,B., Victori, S., Buis, J.-P., Buis, N., Meunier, S., Canini,M., Crozel, D., Fougnie, B., and Henry, P.: Underwater Ra-diance Distributions Measured with Miniaturized Multispec-tral Radiance Cameras, J. Atmos. Ocean. Tech., 30, 74–95,https://doi.org/10.1175/JTECH-D-11-00215.1, 2013a.
Ardyna, M., Babin, M., Devred, E., Forest, A., Gosselin, M., Raim-bault, P., and Tremblay, J.-É.: Shelf-basin gradients shape eco-logical phytoplankton niches and community composition in thecoastal Arctic Ocean (Beaufort Sea), Limnol. Oceanogr., 62,2113–2132, https://doi.org/10.1002/lno.10554, 2017a.
Ardyna, M., Babin, M., Devred, E., Forest, A., Gosselin, M., Raim-bault, P., and Tremblay, J.-É.: Shelf-basin gradients shape eco-logical phytoplankton niches and community composition in thecoastal Arctic Ocean (Beaufort Sea), Limnol. Oceanogr., 62,2113–2132, https://doi.org/10.1002/lno.10554, 2017b.
Asmala, E., Autio, R., Kaartokallio, H., Pitkänen, L., Stedmon,C. A., and Thomas, D. N.: Bioavailability of riverine dis-solved organic matter in three Baltic Sea estuaries and the ef-fect of catchment land use, Biogeosciences, 10, 6969–6986,https://doi.org/10.5194/bg-10-6969-2013, 2013.
Balzano, S., Gourvil, P., Siano, R., Chanoine, M., Marie, D.,Lessard, S., Sarno, D., and Vaulot, D.: Diversity of cul-tured photosynthetic flagellates in the northeast Pacific andArctic Oceans in summer, Biogeosciences, 9, 4553–4571,https://doi.org/10.5194/bg-9-4553-2012, 2012a.
Balzano, S., Marie, D., Gourvil, P., and Vaulot, D.: Composition ofthe summer photosynthetic pico and nanoplankton communitiesin the Beaufort Sea assessed by T-RFLP and sequences of the18S rRNA gene from flow cytometry sorted samples, ISME J., 6,1480–1498, https://doi.org/10.1038/ismej.2011.213, 2012b.
Balzano, S., Percopo, I., Siano, R., Gourvil, P., Chanoine, M.,Marie, D., Vaulot, D., and Sarno, D.: Morphological and ge-netic diversity of Beaufort Sea diatoms with high contributionsfrom the Chaetoceros neogracilis species complex, J. Phycol., 53,161–187, https://doi.org/10.1111/jpy.12489, 2017.
Beaupré-Laperrière, A., Mucci, A., and Thomas, H.: The re-cent state and variability of the carbonate system of theCanadian Arctic Archipelago and adjacent basins in the con-text of ocean acidification, Biogeosciences, 17, 3923–3942,https://doi.org/10.5194/bg-17-3923-2020, 2020.
Bélanger, S., Xie, H. X., Krotkov, N., Larouche, P., Vin-cent, W. F., and Babin, M.: Photomineralization of ter-rigenous dissolved organic matter in Arctic coastal watersfrom 1979 to 2003: Interannual variability and implicationsof climate change, Global Biogeochem. Cy., 20, GB4005,https://doi.org/10.1029/2006GB002708, 2006a.
Bélanger, S., Babin, M., and Tremblay, J.-É.: Increasing cloudinessin Arctic damps the increase in phytoplankton primary produc-tion due to sea ice receding, Biogeosciences, 10, 4087–4101,https://doi.org/10.5194/bg-10-4087-2013, 2013a.
Bélanger, S., Cizmeli, S. A., Ehn, J., Matsuoka, A., Doxaran, D.,Hooker, S., and Babin, M.: Light absorption and partitioning inArctic Ocean surface waters: impact of multiyear ice melting,Biogeosciences, 10, 6433–6452, https://doi.org/10.5194/bg-10-6433-2013, 2013b.
Benner, R. and Strom, M.: A critical evaluation of the ana-lytical blank associated with DOC measurements by high-temperature catalytic oxidation, Mar. Chem., 41, 153–160,https://doi.org/10.1016/0304-4203(93)90113-3, 1993.
Berggren, M., Laudon, H., and Jansson, M.: Aging of al-lochthonous organic carbon regulates bacterial production inunproductive boreal lakes, Limnol. Oceanogr., 54, 1333–1342,https://doi.org/10.4319/lo.2009.54.4.1333, 2009.
Blais, M., Ardyna, M., Gosselin, M., Dumont, D., Bélanger,S., Tremblay, J.-É., Gratton, Y., Marchese, C., and Poulin,M.: Contrasting interannual changes in phytoplankton pro-ductivity and community structure in the coastal Cana-dian Arctic Ocean, Limnol. Oceanogr., 62, 2480–2497,https://doi.org/10.1002/lno.10581, 2017.
Boeuf, D., Cottrell, M., Kirchman, D. L., Lebaron, P., and Jeanthon,C.: Summer community structure of aerobic anoxygenic pho-totrophic bacteria in the western Arctic Ocean, FEMS Microbiol.Ecol., 85, 417–432, https://doi.org/10.1111/1574-6941.12130,2013.
Boeuf, D., Lami, R., Cunnington, E., and Jeanthon, C.: Sum-mer Abundance and Distribution of Proteorhodopsin Genesin the Western Arctic Ocean, Front. Microbiol., 7, 1584,https://doi.org/10.3389/fmicb.2016.01584, 2016.
Boss, E. and Pegau, W.: Relationship of light scattering at an anglein the backward direction to the backscattering coefficient, Appl.Optics, 40, 5503, https://doi.org/10.1364/AO.40.005503, 2001.
Bricaud, A., Babin, M., Claustre, H., Ras, J., and Tièche,F.: Light absorption properties and absorption budget ofSoutheast Pacific waters, J. Geophys. Res., 115, C08009,https://doi.org/10.1029/2009JC005517, 2010.
Carignan, R., Blais, A.-M., and Vis, C.: Measurement of primaryproduction and community respiration in oligotrophic lakes us-ing the Winkler method, Can. J. Fish. Aquat. Sci., 55, 1078–1084, https://doi.org/10.1139/cjfas-55-5-1078, 1998.
Carmack, E. C. and Macdonald, R. W.: Oceanography of the Cana-dian Shelf of the Beaufort Sea: A Setting for Marine Life, Arctic,55, 29–45, https://doi.org/10.14430/arctic733, 2002.
Carmack, E. C., Macdonald, R. W., and Papadakis,J. E.: Water mass structure and boundaries in theMackenzie shelf estuary, J. Geophys. Res., 94, 18043,https://doi.org/10.1029/JC094iC12p18043, 1989.
Chami, M., Thirouard, A., and Harmel, T.: POLVSM (Po-larized Volume Scattering Meter) instrument: an innova-tive device to measure the directional and polarized scat-tering properties of hydrosols, Opt. Express, 22, 26403,https://doi.org/10.1364/OE.22.026403, 2014.
Comeau, A., Harding, T., Galand, P., Vincent, W., and Lovejoy, C.:Vertical distribution of microbial communities in a perenniallystratified Arctic lake with saline, anoxic bottom waters, Sci. Rep.,2, 604, https://doi.org/10.1038/srep00604, 2012.
https://doi.org/10.5194/essd-13-1561-2021 Earth Syst. Sci. Data, 13, 1561–1592, 2021
1588 P. Massicotte et al.: The MALINA oceanographic expedition: an overview
Commission of the European Community: Manual of qual-ity control procedures for validation of oceanographic data.,436 pp., available at: https://repository.oceanbestpractices.org/handle/11329/167?show=full (last access: 24 February 2014),1993.
Cooper, L., Benner, R., McClelland, J., Peterson, B., Holmes, R.,Raymond, P., Hansell, D., Grebmeier, J., and Codispoti, L.: Link-ages among runoff, dissolved organic carbon, and the stable oxy-gen isotope composition of seawater and other water mass in-dicators in the Arctic Ocean, J. Geophys. Res.-Biogeo., 110,G02013, https://doi.org/10.1029/2005JG000031, 2005.
Cottrell, M. and David, K.: Contribution of major bacterial groupsto bacterial biomass production (thymidine and leucine incorpo-ration) in the Delaware estuary, Limnol. Oceanogr., 48, 168–178,https://doi.org/10.4319/lo.2003.48.1.0168, 2003.
Coupel, P., Matsuoka, A., Ruiz-Pino, D., Gosselin, M., Marie, D.,Tremblay, J.-É., and Babin, M.: Pigment signatures of phyto-plankton communities in the Beaufort Sea, Biogeosciences, 12,991–1006, https://doi.org/10.5194/bg-12-991-2015, 2015.
Dickson, A., Sabine, C., and Christian, J. E.: Guide to Best Prac-tices for Ocean CO2 Measurements, PICES Special Publication,3, 191, ISBN 1-897176-07-4, 2007.
Doxaran, D., Babin, M., and Leymarie, E.: Near-infrared light scat-tering by particles in coastal waters, Opt. Express, 15, 12834,https://doi.org/10.1364/OE.15.012834, 2007.
Doxaran, D., Ehn, J., Bélanger, S., Matsuoka, A., Hooker, S., andBabin, M.: Optical characterisation of suspended particles in theMackenzie River plume (Canadian Arctic Ocean) and implica-tions for ocean colour remote sensing, Biogeosciences, 9, 3213–3229, https://doi.org/10.5194/bg-9-3213-2012, 2012a.
Doxaran, D., Ehn, J., Bélanger, S., Matsuoka, A., Hooker, S., andBabin, M.: Optical characterisation of suspended particles in theMackenzie River plume (Canadian Arctic Ocean) and implica-tions for ocean colour remote sensing, Biogeosciences, 9, 3213–3229, https://doi.org/10.5194/bg-9-3213-2012, 2012b.
Doxaran, D., Devred, E., and Babin, M.: A 50 % increase inthe mass of terrestrial particles delivered by the Macken-zie River into the Beaufort Sea (Canadian Arctic Ocean)over the last 10 years, Biogeosciences, 12, 3551–3565,https://doi.org/10.5194/bg-12-3551-2015, 2015.
Doxaran, D., Leymarie, E., Nechad, B., Dogliotti, A., Rud-dick, K., Gernez, P., and Knaeps, E.: Improved correc-tion methods for field measurements of particulate lightbackscattering in turbid waters, Opt. Express, 24, 3615,https://doi.org/10.1364/OE.24.003615, 2016.
Durantou, L., Rochon, A., Ledu, D., Massé, G., Schmidt, S.,and Babin, M.: Quantitative reconstruction of sea-surface con-ditions over the last 150 yr in the Beaufort Sea based ondinoflagellate cyst assemblages: the role of large-scale at-mospheric circulation patterns, Biogeosciences, 9, 5391–5406,https://doi.org/10.5194/bg-9-5391-2012, 2012.
Ehn, J. K., Reynolds, R. A., Stramski, D., Doxaran, D., Lansard, B.,and Babin, M.: Patterns of suspended particulate matter acrossthe continental margin in the Canadian Beaufort Sea during sum-mer, Biogeosciences, 16, 1583–1605, https://doi.org/10.5194/bg-16-1583-2019, 2019.
Fernández I., C. and Raimbault, P.: Nitrogen regeneration in theNE Atlantic Ocean and its impact on seasonal new, regener-
ated and export production, Mar. Ecol. Prog. Ser., 337, 79–92,https://doi.org/10.3354/meps337079, 2007.
Fichot, C., Benner, R., Kaiser, K., Shen, Y., Amon, R., Ogawa, H.,and Lu, C.-J.: Predicting Dissolved Lignin Phenol Concentra-tions in the Coastal Ocean from Chromophoric Dissolved Or-ganic Matter (CDOM) Absorption Coefficients, Front. Mar. Sci.,3, 7, https://doi.org/10.3389/fmars.2016.00007, 2016.
Fichot, C. G. and Benner, R.: A novel method to esti-mate DOC concentrations from CDOM absorption coeffi-cients in coastal waters, Geophys. Res. Lett., 38, L03610,https://doi.org/10.1029/2010GL046152, 2011.
Fichot, C. G. and Miller, W. L.: An approach to quantifydepth-resolved marine photochemical fluxes using re-mote sensing: Application to carbon monoxide (CO) pho-toproduction, Remote Sens. Environ., 114, 1363–1377,https://doi.org/10.1016/j.rse.2010.01.019, 2010.
Fichot, C. G., Kaiser, K., Hooker, S. B., Amon, R. M. W., Babin,M., Bélanger, S., Walker, S. A., and Benner, R.: Pan-Arctic dis-tributions of continental runoff in the Arctic Ocean, Sci. Rep., 3,1053, https://doi.org/10.1038/srep01053, 2013.
Forest, A., Babin, M., Stemmann, L., Picheral, M., Sampei, M.,Fortier, L., Gratton, Y., Bélanger, S., Devred, E., Sahlin, J.,Doxaran, D., Joux, F., Ortega-Retuerta, E., Martín, J., Jeffrey,W. H., Gasser, B., and Carlos Miquel, J.: Ecosystem functionand particle flux dynamics across the Mackenzie Shelf (Beau-fort Sea, Arctic Ocean): an integrative analysis of spatial vari-ability and biophysical forcings, Biogeosciences, 10, 2833–2866,https://doi.org/10.5194/bg-10-2833-2013, 2013.
Galeron, M.-A., Radakovitch, O., Charrière, B., Vaultier, F., Volk-man, J. K., Bianchi, T. S., Ward, N. D., Medeiros, P. M.,Sawakuchi, H. O., Tank, S., Kerhervé, P., and Rontani, J.-F.: Lipoxygenase-induced autoxidative degradation of terrestrialparticulate organic matter in estuaries: A widespread process en-hanced at high and low latitude, Org. Geochem., 115, 78–92,https://doi.org/10.1016/j.orggeochem.2017.10.013, 2018.
Ghiglione, J. F., Palacios, C., Marty, J. C., Mével, G., Labrune, C.,Conan, P., Pujo-Pay, M., Garcia, N., and Goutx, M.: Role of envi-ronmental factors for the vertical distribution (0–1000 m) of ma-rine bacterial communities in the NW Mediterranean Sea, Bio-geosciences, 5, 1751–1764, https://doi.org/10.5194/bg-5-1751-2008, 2008.
Guillot, P. and Gratton, Y.: Malina 0902 CTD Processing Notes,Quebec Ocean internal report, Technical Report, Rimouski,Canada, 102 pp., 2010.
Harmel, T., Hieronymi, M., Slade, W., Röttgers, R., Roul-lier, F., and Chami, M.: Laboratory experiments for inter-comparison of three volume scattering meters to measure angu-lar scattering properties of hydrosols, Opt. Express, 24, A234,https://doi.org/10.1364/OE.24.00A234, 2016.
Holmes, R., Aminot, A., Kérouel, R., Hooker, B., and Peterson, B.:A simple and precise method for measuring ammonium in ma-rine and freshwater ecosystems, Can. J. Fish. Aquat. Sci., 56,1801–1808, https://doi.org/10.1139/f99-128, 1999.
Hooker, S. B., Morrow, J. H., and Matsuoka, A.: Apparent opticalproperties of the Canadian Beaufort Sea – Part 2: The 1 % and1 cm perspective in deriving and validating AOP data products,Biogeosciences, 10, 4511–4527, https://doi.org/10.5194/bg-10-4511-2013, 2013.
Earth Syst. Sci. Data, 13, 1561–1592, 2021 https://doi.org/10.5194/essd-13-1561-2021

P. Massicotte et al.: The MALINA oceanographic expedition: an overview 1589
Hooker, S. B., Matsuoka, A., Kudela, R. M., Yamashita, Y., Suzuki,K., and Houskeeper, H. F.: A global end-member approach to de-rive aCDOM(440) from near-surface optical measurements, Bio-geosciences, 17, 475–497, https://doi.org/10.5194/bg-17-475-2020, 2020.
Kaiser, K. and Benner, R.: Hydrolysis-induced racemizationof amino acids, Limnol. Oceanogr.-Meth., 3, 318–325,https://doi.org/10.4319/lom.2005.3.318, 2005.
Kirchman, D.: Leucine incorporation as a measure of biomass pro-duction by heterotrophic bacteria, in: Handbook of Methods inAquatic Microbial Ecology, edited by: Kemp, P. F., Sherr, B.F., Sherr, E. B., Cole, J. J., CRC Press, Boca Raton, 509–512,https://doi.org/10.1201/9780203752746, 2018.
Kirchman, D. L., Morán, X. A. G., and Ducklow, H.: Microbialgrowth in the polar oceans – role of temperature and poten-tial impact of climate change, Nat. Rev. Microbiol., 7, 451–459,https://doi.org/10.1038/nrmicro2115, 2009.
Kirkwood, D.: Stability of solutions of nutrient salts during stor-age, Mar. Chem., 38, 151–164, https://doi.org/10.1016/0304-4203(92)90032-6, 1992.
Lansard, B., Mucci, A., Miller, L., Macdonald, R., and Grat-ton, Y.: Seasonal variability of water mass distribution inthe southeastern Beaufort Sea determined by total alka-linity and δ18O, J. Geophys. Res.-Oceans, 117, C03003,https://doi.org/10.1029/2011JC007299, 2012.
Le Fouest, V., Zakardjian, B., Xie, H., Raimbault, P., Joux, F., andBabin, M.: Modeling plankton ecosystem functioning and nitro-gen fluxes in the oligotrophic waters of the Beaufort Sea, Arc-tic Ocean: a focus on light-driven processes, Biogeosciences, 10,4785–4800, https://doi.org/10.5194/bg-10-4785-2013, 2013.
Link, H., Chaillou, G., Forest, A., Piepenburg, D., and Archam-bault, P.: Multivariate benthic ecosystem functioning in the Arc-tic – benthic fluxes explained by environmental parameters inthe southeastern Beaufort Sea, Biogeosciences, 10, 5911–5929,https://doi.org/10.5194/bg-10-5911-2013, 2013a.
Link, H., Chaillou, G., Forest, A., Piepenburg, D., and Archam-bault, P.: Multivariate benthic ecosystem functioning in the Arc-tic – benthic fluxes explained by environmental parameters inthe southeastern Beaufort Sea, Biogeosciences, 10, 5911–5929,https://doi.org/10.5194/bg-10-5911-2013, 2013b.
Link, H., Piepenburg, D., and Archambault, P.: Are Hotspots Al-ways Hotspots? The Relationship between Diversity, Resourceand Ecosystem Functions in the Arctic, PLoS ONE, 8, e74077,https://doi.org/10.1371/journal.pone.0074077, 2013c.
Link, H., Archambault, P., and Piepenburg, D.: Sediment oxy-gen uptake, benthic boundary fluxes, macrofaunal abun-dance and biodiversity, Chl a, phaeopigments and nitro-gen and organic carbon content at the sediment-water in-terface in the Canadian Arctic in 2008 and 2009, Pangaea,https://doi.org/10.1594/PANGAEA.908091, 2019.
Louchouarn, P., Opsahl, S., and Benner, R.: Isolation and Quan-tification of Dissolved Lignin from Natural Waters Using Solid-Phase Extraction and GC/MS, Anal. Chem., 72, 2780–2787,https://doi.org/10.1021/ac9912552, 2000.
Macdonald, R. W., Carmack, E. C., McLaughlin, F. A.,Iseki, K., Macdonald, D. M., and O’Brien, M. C.:Composition and modification of water masses in theMackenzie shelf estuary, J. Geophys. Res., 94, 18057,https://doi.org/10.1029/JC094iC12p18057, 1989.
Marcel, B., Morel, A., and Gagnon, R.: An incubator designedfor extensive and sensitive measurements of phytoplanktonphotosynthetic parameters, Limnol. Oceanogr., 39, 694–702,https://doi.org/10.4319/lo.1994.39.3.0694, 1994.
Marchand, D. and Rontani, J.-F.: Characterisation of photo-oxidation and autoxidation products of phytoplanktonicmonounsaturated fatty acids in marine particulate mat-ter and recent sediments, Org. Geochem., 32, 287–304,https://doi.org/10.1016/S0146-6380(00)00175-3, 2001.
Marie, D., Partensky, F., Jacquet, S., and Vaulot, D.: Enumera-tion and Cell Cycle Analysis of Natural Populations of Ma-rine Picoplankton by Flow Cytometry Using the Nucleic AcidStain SYBR Green I., Appl. Environ. Microb., 63, 186–193,https://doi.org/10.1128/AEM.63.1.186-193.1997, 1997.
Marie, D., Brussaard, C. P. D., Partensky, F., and Vaulot, D.: Flowcytometric analysis of phytoplankton, bacteria and viruses, in:Current protocols in cytometry, edited by: Robinson, J. P., JohnWiley and Sons, New York, USA, 1–15, 1999.
Marie, D., Rigaut-Jalabert, F., and Vaulot, D.: An improvedprotocol for flow cytometry analysis of phytoplankton cul-tures and natural samples, Cytom. Part. A., 85, 962–968,https://doi.org/10.1002/cyto.a.22517, 2014.
Massicotte, P.: MALINA data paper source code, Zen-odo,https://doi.org/10.5281/zenodo.4518943, 2021.
Massicotte, P., Asmala, E., Stedmon, C., and Markager, S.: Globaldistribution of dissolved organic matter along the aquatic contin-uum: Across rivers, lakes and oceans, Sci. Total Environ., 609,180–191, https://doi.org/10.1016/j.scitotenv.2017.07.076, 2017.
Massicotte, P., Amon, R., Antoine, D., Archambault, P., Balzano,S., Bélanger, S., Benner, R., Boeuf, D., Bricaud, A., Bruyant, F.,Chaillou, G., Chami, M., Charrière, B., Chen, J., Claustre, H.,Coupel, P., Delsaut, N., Doxaran, D., Ehn, J., Fichot, C., For-get, M.-H., Fu, P., Gagnon, J., Garcia, N., Gasser, B., Ghiglione,J.-F., Gorsky, G., Gosselin, M., Gourvil, P., Gratton, Y., Guil-lot, P., Heipieper, H. J., Heussner, S., Hooker, S., Huot, Y., Jacq,V., Jeanthon, C., Jeffrey, W., Joux, F., Kawamura, K., Lansard,B., Leymarie, E., Link, H., Lovejoy, C., Marec, C., Marie, D.,Martin, J., Massé, G., Matsuoka, A., McKague, V., Mignot, A.,Miller, W. L., Miquel, J.-C., Mucci, A., Ono, K., Ortega, E.,Panagiotopoulos, C., Papakyriakou, T., Para, J., Picheral, M.,Piepenburg, D., Prieur, L., Raimbault, P., Ras, J., Reynolds,R. A., Rochon, A., Rontani, J.-F., Schmechtig, C., Schmidt, S.,Sempéré, R., Shen, Y., Song, G., Stramski, D., Stroud, G., D.,Tachibana, E., Thirouard, A., Tolosa, I., Tremblay, J.-É., Vaïtilin-gom, M., Vaulot, D., Vaultier, F., Volkman, J. K., Vonk, J. E., Xie,H., Zheng, G., and Babin, M.: The Malina oceanographic expedi-tion: How do changes in ice cover, permafrost and UV radiationimpact on biodiversity and biogeochemical fluxes in the ArcticOcean?, SEANOE, https://doi.org/10.17882/75345, 2020.
Matsuoka, A., Hill, V., Huot, Y., Babin, M., and Bricaud, A.: Sea-sonal variability in the light absorption properties of westernArctic waters: Parameterization of the individual components ofabsorption for ocean color applications, J. Geophys. Res., 116,C02007, https://doi.org/10.1029/2009JC005594, 2011.
Matsuoka, A., Bricaud, A., Benner, R., Para, J., Sempéré, R., Prieur,L., Bélanger, S., and Babin, M.: Tracing the transport of col-ored dissolved organic matter in water masses of the South-ern Beaufort Sea: relationship with hydrographic characteristics,
https://doi.org/10.5194/essd-13-1561-2021 Earth Syst. Sci. Data, 13, 1561–1592, 2021
1590 P. Massicotte et al.: The MALINA oceanographic expedition: an overview
Biogeosciences, 9, 925–940, https://doi.org/10.5194/bg-9-925-2012, 2012a.
Matsuoka, A., Bricaud, A., Benner, R., Para, J., Sempéré, R., Prieur,L., Bélanger, S., and Babin, M.: Tracing the transport of col-ored dissolved organic matter in water masses of the South-ern Beaufort Sea: relationship with hydrographic characteristics,Biogeosciences, 9, 925–940, https://doi.org/10.5194/bg-9-925-2012, 2012b.
Matsuoka, A., Babin, M., Doxaran, D., Hooker, S. B., Mitchell, B.G., Bélanger, S., and Bricaud, A.: A synthesis of light absorptionproperties of the Arctic Ocean: application to semianalytical es-timates of dissolved organic carbon concentrations from space,Biogeosciences, 11, 3131–3147, https://doi.org/10.5194/bg-11-3131-2014, 2014.
Miller, W. L. and Zepp, R. G.: Photochemical production of dis-solved inorganic carbon from terrestrial organic matter: Signifi-cance to the oceanic organic carbon cycle, Geophys. Res. Lett.,22, 417–420, https://doi.org/10.1029/94GL03344, 1995.
Miquel, J.-C., Gasser, B., Martín, J., Marec, C., Babin, M., Fortier,L., and Forest, A.: Downward particle flux and carbon exportin the Beaufort Sea, Arctic Ocean; the role of zooplankton,Biogeosciences, 12, 5103–5117, https://doi.org/10.5194/bg-12-5103-2015, 2015.
Mobley, C.: Estimation of the remote-sensing reflectancefrom above-surface measurements, Appl. Optics, 38, 7442,https://doi.org/10.1364/AO.38.007442, 1999.
Monier, A., Findlay, H., Charvet, S., and Lovejoy, C.: Latewinter under ice pelagic microbial communities in thehigh Arctic Ocean and the impact of short-term expo-sure to elevated CO2 levels, Front. Microbiol., 5, 490,https://doi.org/10.3389/fmicb.2014.00490, 2014.
Monier, A., Comte, J., Babin, M., Forest, A., Matsuoka, A., andLovejoy, C.: Oceanographic structure drives the assembly pro-cesses of microbial eukaryotic communities, ISME J., 9, 990–1002, https://doi.org/10.1038/ismej.2014.197, 2015.
Morales-Sánchez, D., Schulze, P. S., Kiron, V., and Wijffels,R. H.: Production of carbohydrates, lipids and polyunsat-urated fatty acids (PUFA) by the polar marine microalgaChlamydomonas malina RCC2488, Algal Res., 50, 102016,https://doi.org/10.1016/j.algal.2020.102016, 2020.
Morel, A.: Optical properties of pure water and pure sea water,in: Optical Aspects of Oceanography, edited by: Jerlov, N. andNielsen, E. S., Academic Press, New York, USA, 1–24, 1974.
Mucci, A., Lansard, B., Miller, L., and Papakyriakou, T.: CO2fluxes across the air-sea interface in the southeastern Beau-fort Sea: Ice-free period, J. Geophys. Res., 115, C04003,https://doi.org/10.1029/2009JC005330, 2010.
Neukermans, G., Reynolds, R., and Stramski, D.: Optical classifica-tion and characterization of marine particle assemblages withinthe western Arctic Ocean, Limnol. Oceanogr., 61, 1472–1494,https://doi.org/10.1002/lno.10316, 2016.
Ortega-Retuerta, E., Jeffrey, W. H., Babin, M., Bélanger, S., Benner,R., Marie, D., Matsuoka, A., Raimbault, P., and Joux, F.: Carbonfluxes in the Canadian Arctic: patterns and drivers of bacterialabundance, production and respiration on the Beaufort Sea mar-gin, Biogeosciences, 9, 3679–3692, https://doi.org/10.5194/bg-9-3679-2012, 2012a.
Ortega-Retuerta, E., Jeffrey, W. H., Ghiglione, J. F., and Joux,F.: Evidence of heterotrophic prokaryotic activity limitation by
nitrogen in the Western Arctic Ocean during summer, PolarBiol., 35, 785–794, https://doi.org/10.1007/s00300-011-1109-8,2012b.
Ortega-Retuerta, E., Joux, F., Jeffrey, W. H., and Ghiglione, J. F.:Spatial variability of particle-attached and free-living bacterialdiversity in surface waters from the Mackenzie River to theBeaufort Sea (Canadian Arctic), Biogeosciences, 10, 2747–2759,https://doi.org/10.5194/bg-10-2747-2013, 2013.
Panagiotopoulos, C., Sempéré, R., Jacq, V., and Charrière, B.: Com-position and distribution of dissolved carbohydrates in the Beau-fort Sea Mackenzie margin (Arctic Ocean), Mar. Chem., 166, 92–102, https://doi.org/10.1016/j.marchem.2014.09.004, 2014.
Para, J., Charrière, B., Matsuoka, A., Miller, W. L., Rontani, J.F., and Sempéré, R.: UV/PAR radiation and DOM propertiesin surface coastal waters of the Canadian shelf of the Beau-fort Sea during summer 2009, Biogeosciences, 10, 2761–2774,https://doi.org/10.5194/bg-10-2761-2013, 2013.
Pegau, W. S., Gray, D., and Zaneveld, J.: Absorption and at-tenuation of visible and near-infrared light in water: depen-dence on temperature and salinity, Appl. Optics, 36, 6035,https://doi.org/10.1364/AO.36.006035, 1997.
Percopo, I., Ruggiero, M. V., Balzano, S., Gourvil, P., Lundholm,N., Siano, R., Tammilehto, A., Vaulot, D., and Sarno, D.: Pseudo-nitzschia arctica sp. nov., a new cold-water cryptic Pseudo-nitzschia species within the P. pseudodelicatissima complex, J.Phycol., 52, 184–199, https://doi.org/10.1111/jpy.12395, 2016.
Picheral, M., Guidi, L., Stemmann, L., Karl, D., Iddaoud, G., andGorsky, G.: The Underwater Vision Profiler 5: An advancedinstrument for high spatial resolution studies of particle sizespectra and zooplankton, Limnol. Oceanogr.-Meth, 8, 462–473,https://doi.org/10.4319/lom.2010.8.462, 2010.
Picheral, M., Colin, S., and Irisson, J.-O.: EcoTaxa, a tool for thetaxonomic classification of images, available at: http://ecotaxa.obs-vlfr.fr (last access: 25 February 2021), 2017.
Poteau, A., Boss, E., and Claustre, H.: Particulate concen-tration and seasonal dynamics in the mesopelagic oceanbased on the backscattering coefficient measured withBiogeochemical-Argo floats, Geophys. Res. Lett., 44, 6933–6939, https://doi.org/10.1002/2017GL073949, 2017.
Raimbault, P. and Garcia, N.: Evidence for efficient regener-ated production and dinitrogen fixation in nitrogen-deficientwaters of the South Pacific Ocean: impact on new andexport production estimates, Biogeosciences, 5, 323–338,https://doi.org/10.5194/bg-5-323-2008, 2008.
Raimbault, P., Slawyk, G., Coste, B., and Fry, J.: Feasibilityof using an automated colorimetric procedure for the deter-mination of seawater nitrate in the 0 to 100 nM range: Ex-amples from field and culture, Mar. Biol., 104, 347–351,https://doi.org/10.1007/BF01313277, 1990.
Raimbault, P., Diaz, F., Pouvesle, W., and Boudjellal, B.: Simul-taneous determination of particulate organic carbon, nitrogenand phosphorus collected on filters, using a semi-automaticwet-oxidation method, Mar. Ecol. Prog. Ser., 180, 289–295,https://doi.org/10.3354/meps180289, 1999a.
Raimbault, P., Pouvesle, W., Diaz, F., Garcia, N., and Sem-péré, R.: Wet-oxidation and automated colorimetry for si-multaneous determination of organic carbon, nitrogen andphosphorus dissolved in seawater, Mar. Chem., 66, 161–169,https://doi.org/10.1016/S0304-4203(99)00038-9, 1999b.
Earth Syst. Sci. Data, 13, 1561–1592, 2021 https://doi.org/10.5194/essd-13-1561-2021

P. Massicotte et al.: The MALINA oceanographic expedition: an overview 1591
Raimbault, P., Slawyk, G., Boudjellal, B., Coatanoan, C., Co-nan, P., Coste, B., Garcia, N., Moutin, T., and Pujo-Pay,M.: Carbon and nitrogen uptake and export in the equato-rial Pacific at 150◦W: Evidence of an efficient regeneratedproduction cycle, J. Geophys. Res.-Oceans, 104, 3341–3356,https://doi.org/10.1029/1998JC900004, 1999c.
Ras, J., Claustre, H., and Uitz, J.: Spatial variability of phytoplank-ton pigment distributions in the Subtropical South Pacific Ocean:comparison between in situ and predicted data, Biogeosciences,5, 353–369, https://doi.org/10.5194/bg-5-353-2008, 2008.
Raymond, P. A., McClelland, J. W., Holmes, R. M., Zhulidov,A. V., Mull, K., Peterson, B. J., Striegl, R. G., Aiken, G. R.,and Gurtovaya, T. Y.: Flux and age of dissolved organic car-bon exported to the Arctic Ocean: A carbon isotopic study of thefive largest arctic rivers, Global Biogeochem. Cy., 21, GB4011,https://doi.org/10.1029/2007GB002934, 2007.
Reynolds, R., Stramski, D., and Neukermans, G.: Opticalbackscattering by particles in Arctic seawater and rela-tionships to particle mass concentration, size distribution,and bulk composition, Limnol. Oceanogr., 61, 1869–1890,https://doi.org/10.1002/lno.10341, 2016.
Reynolds, R. A., Stramski, D., Wright, V. M., and Wozniak,S. B.: Measurements and characterization of particle size dis-tributions in coastal waters, J. Geophys. Res., 115, C08024,https://doi.org/10.1029/2009JC005930, 2010.
Rontani, J.-F., Charriere, B., Forest, A., Heussner, S., Vaultier, F.,Petit, M., Delsaut, N., Fortier, L., and Sempéré, R.: Intense pho-tooxidative degradation of planktonic and bacterial lipids in sink-ing particles collected with sediment traps across the CanadianBeaufort Shelf (Arctic Ocean), Biogeosciences, 9, 4787–4802,https://doi.org/10.5194/bg-9-4787-2012, 2012a.
Rontani, J.-F., Charriere, B., Petit, M., Vaultier, F., Heipieper,H. J., Link, H., Chaillou, G., and Sempéré, R.: Degradationstate of organic matter in surface sediments from the SouthernBeaufort Sea: a lipid approach, Biogeosciences, 9, 3513–3530,https://doi.org/10.5194/bg-9-3513-2012, 2012b.
Rontani, J.-F., Charrière, B., Sempéré, R., Doxaran, D., Vaultier,F., Vonk, J. E., and Volkman, J. K.: Degradation of sterolsand terrigenous organic matter in waters of the Macken-zie Shelf, Canadian Arctic, Org. Geochem., 75, 61–73,https://doi.org/10.1016/j.orggeochem.2014.06.002, 2014.
Röttgers, R. and Gehnke, S.: Measurement of light absorption byaquatic particles: improvement of the quantitative filter techniqueby use of an integrating sphere approach, Appl. Optics, 51, 1336,https://doi.org/10.1364/AO.51.001336, 2012.
Ruddick, K., De Cauwer, V., Park, Y.-J., and Moore, G.: Seabornemeasurements of near infrared water-leaving reflectance: Thesimilarity spectrum for turbid waters, Limnol. Oceanogr., 51,1167–1179, https://doi.org/10.4319/lo.2006.51.2.1167, 2006.
Runyan, H., Reynolds, R., and Stramski, D.: Evaluation of Parti-cle Size Distribution Metrics to Estimate the Relative Contri-butions of Different Size Fractions Based on Measurements inArctic Waters, J. Geophys. Res.-Oceans, 125, e2020JC016218,https://doi.org/10.1029/2020JC016218, 2020.
Sea-Bird Scientific.: Software Manual Seasoft V2: SBE DataProcessing CTD Data Processing and Plotting Software, Sea-Bird Scientific, available at: https://www.seabird.com/asset-get.download.jsa?code=251446, last access: 9 December 2017.
Sempéré, R., Vaïtilingom, M., Charrière, B., Kawamura,K., and Panagiotopoulos, C.: Dicarboxylic and Oxocar-boxylic Acids in the Arctic Coastal Ocean (Beaufort Sea-Mackenzie Margin), Global Biogeochem. Cy., 33, 927–940,https://doi.org/10.1029/2018GB006165, 2019.
Shen, Y., Fichot, C. G., and Benner, R.: Dissolved organic mat-ter composition and bioavailability reflect ecosystem productiv-ity in the Western Arctic Ocean, Biogeosciences, 9, 4993–5005,https://doi.org/10.5194/bg-9-4993-2012, 2012.
Smith, D. and Azam, F.: A simple, economical meth- od for measur-ing bacterial protein synthesis rates in seawater using 3H-leucine,Mar. Microb. Food Webs, 6, 107–114, 1992.
Sohrin, R. and Sempéré, R.: Seasonal variation in total organic car-bon in the northeast Atlantic in 2000–2001, J. Geophys. Res.,110, C10S90, https://doi.org/10.1029/2004JC002731, 2005.
Song, G., Xie, H., Bélanger, S., Leymarie, E., and Babin, M.: Spec-trally resolved efficiencies of carbon monoxide (CO) photopro-duction in the western Canadian Arctic: particles versus solutes,Biogeosciences, 10, 3731–3748, https://doi.org/10.5194/bg-10-3731-2013, 2013.
Stein, R. and Macdonald, R. W.: Organic Carbon Budget: Arc-tic Ocean vs. Global Ocean, in: The Organic Carbon Cyclein the Arctic Ocean, edited by: Stein, R. and MacDonald,R. W., Springer, Berlin and Heidelberg, Germany, 315–322,https://doi.org/10.1007/978-3-642-18912-8_8, 2004.
Sullivan, J., Twardowski, M., Zaneveld, J., Moore, C., Barnard,A., Donaghay, P., and Rhoades, B.: Hyperspectral temperatureand salt dependencies of absorption by water and heavy wa-ter in the 400–750 nm spectral range, Appl. Optics, 45, 5294,https://doi.org/10.1364/AO.45.005294, 2006.
Taalba, A., Xie, H., Scarratt, M. G., Bélanger, S., and Levasseur, M.:Photooxidation of dimethylsulfide (DMS) in the Canadian Arc-tic, Biogeosciences, 10, 6793–6806, https://doi.org/10.5194/bg-10-6793-2013, 2013.
Tank, S. E., Striegl, R. G., McClelland, J. W., and Kokelj, S. V.:Multi-decadal increases in dissolved organic carbon and alkalin-ity flux from the Mackenzie drainage basin to the Arctic Ocean,Environ. Res. Lett., 11, 054015, https://doi.org/10.1088/1748-9326/11/5/054015, 2016.
Tedetti, M., Kawamura, K., Narukawa, M., Joux, F., Charrière, B.,and Sempéré, R.: Hydroxyl radical-induced photochemical for-mation of dicarboxylic acids from unsaturated fatty acid (oleicacid) in aqueous solution, J. Photoch. Photobio. A, 188, 135–139, https://doi.org/10.1016/j.jphotochem.2006.11.029, 2007.
Tolosa, I. and de Mora, S.: Isolation of neutral and acidic lipidbiomarker classes for compound-specific-carbon isotope anal-ysis by means of solvent extraction and normal-phase high-performance liquid chromatography, J. Chromatogr. A, 1045,71–84, https://doi.org/10.1016/j.chroma.2004.06.037, 2004.
Tolosa, I., Fiorini, S., Gasser, B., Martín, J., and Miquel, J. C.: Car-bon sources in suspended particles and surface sediments fromthe Beaufort Sea revealed by molecular lipid biomarkers andcompound-specific isotope analysis, Biogeosciences, 10, 2061–2087, https://doi.org/10.5194/bg-10-2061-2013, 2013.
Tremblay, J.-É., Raimbault, P., Garcia, N., Lansard, B., Babin,M., and Gagnon, J.: Impact of river discharge, upwelling andvertical mixing on the nutrient loading and productivity ofthe Canadian Beaufort Shelf, Biogeosciences, 11, 4853–4868,https://doi.org/10.5194/bg-11-4853-2014, 2014.
https://doi.org/10.5194/essd-13-1561-2021 Earth Syst. Sci. Data, 13, 1561–1592, 2021

1592 P. Massicotte et al.: The MALINA oceanographic expedition: an overview
U.S. National Ice Center: U.S. National Ice Center Arctic andAntarctic Sea Ice Concentration and Climatologies in GriddedFormat, NSIDC, G10033, https://doi.org/10.7265/46CC-3952,2020.
Vaqué, D., Guadayol, Ò., Peters, F., Felipe, J., Angel-Ripoll,L., Terrado, R., Lovejoy, C., and Pedrós-Alioó, C.: Sea-sonal changes in planktonic bacterivory rates under the ice-covered coastal Arctic Ocean, Limnol. Oceanogr., 53, 2427–2438, https://doi.org/10.4319/lo.2008.53.6.2427, 2008.
Wei, C., Cusson, M., Archambault, P., Belley, R., Brown, T.,Burd, B., Edinger, E., Kenchington, E., Gilkinson, K., Law-ton, P., Link, H., Ramey-Balci, P., Scrosati, R., and Snelgrove,P.: Seafloor biodiversity of Canada’s three oceans: Patterns,hotspots and potential drivers, Divers. Distrib., 26, 226–241,https://doi.org/10.1111/ddi.13013, 2020.
Weishaar, J. L., Aiken, G. R., Bergamaschi, B. A., Fram, M. S.,Fujii, R., and Mopper, K.: Evaluation of Specific Ultraviolet Ab-sorbance as an Indicator of the Chemical Composition and Reac-tivity of Dissolved Organic Carbon, Environ. Sci. Technol., 37,4702–4708, https://doi.org/10.1021/es030360x, 2003.
Westerhoff, P., Chao, P., and Mash, H.: Reactivity of natural organicmatter with aqueous chlorine and bromine, Water Res., 38, 1502–1513, https://doi.org/10.1016/j.watres.2003.12.014, 2004.
Xie, H., Bélanger, S., Demers, S., Vincent, W. F., andPapakyriakou, T. N.: Photobiogeochemical cycling ofcarbon monoxide in the southeastern Beaufort Sea inspring and autumn, Limnol. Oceanogr., 54, 234–249,https://doi.org/10.4319/lo.2009.54.1.0234, 2009.
Xie, H., Bélanger, S., Song, G., Benner, R., Taalba, A., Blais, M.,Tremblay, J.-É., and Babin, M.: Photoproduction of ammoniumin the southeastern Beaufort Sea and its biogeochemical implica-tions, Biogeosciences, 9, 3047–3061, https://doi.org/10.5194/bg-9-3047-2012, 2012.
Xing, X., Morel, A., Claustre, H., D’Ortenzio, F., and Poteau,A.: Combined processing and mutual interpretation ofradiometry and fluorometry from autonomous profilingBio-Argo floats: 2. Colored dissolved organic matter ab-sorption retrieval, J. Geophys. Res.-Oceans, 117, C04022,https://doi.org/10.1029/2011JC007632, 2012.
Yau, S., Lopes dos Santos, A., Eikrem, W., Gérikas Ribeiro,C., Gourvil, P., Balzano, S., Escande, M.-L., Moreau, H., andVaulot, D.: Mantoniella beaufortii and Mantoniella baffinen-sis sp. nov. (Mamiellales, Mamiellophyceae), two new greenalgal species from the high arctic 1, J. Phycol., 56, 37–51,https://doi.org/10.1111/jpy.12932, 2020.
Earth Syst. Sci. Data, 13, 1561–1592, 2021 https://doi.org/10.5194/essd-13-1561-2021