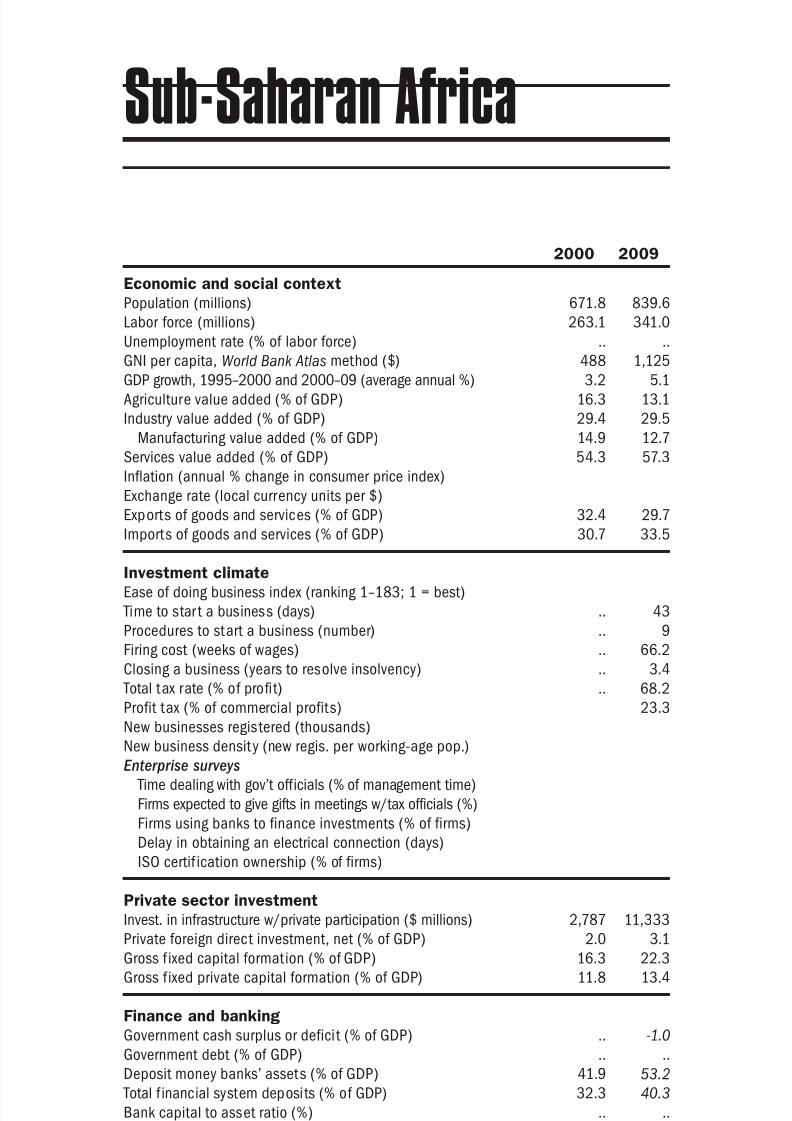
the little data book on private sector development 2011
TRANSCRIPT
8/6/2019 The Little Data Book on Private Sector Development 2011
http://slidepdf.com/reader/full/the-little-data-book-on-private-sector-development-2011 1/246
From World Development Indicators
The Little Data Book onPrivate SectorDevelopment
Economic and social context
Investment climate
Private sector investment
Finance and banking
Infrastructure

8/6/2019 The Little Data Book on Private Sector Development 2011
http://slidepdf.com/reader/full/the-little-data-book-on-private-sector-development-2011 2/246

8/6/2019 The Little Data Book on Private Sector Development 2011
http://slidepdf.com/reader/full/the-little-data-book-on-private-sector-development-2011 3/246
2011THE LITTLE DATA BOOK
ON PRIVATE SECTORDEVELOPMENT

8/6/2019 The Little Data Book on Private Sector Development 2011
http://slidepdf.com/reader/full/the-little-data-book-on-private-sector-development-2011 4/246
Copyright ©2011 by the International Bank for
Reconstruction and Development/THE WORLD BANK
1818 H Street, N.W., Washington, D.C. 20433
U.S.A.
All rights reserved
Manufactured in the United States of America
First printing July 2011
ISBN: 978-0 -8213-8861-7
eISBN: 978-0-8213-8884-6
DOI: 10.1596/978-0-8213-8861-7
SKU: 18861
The Little Data Book on Private Sector Development 2011 is a product
of the Development Data Group of the Development Economics
Vice Presidency and the Investment Climate Department of the Financial
and Private Sector Development Vice Presidency of the World Bank Group.
Design by Communications Development Incorporated, Washington, D.C.
8/6/2019 The Little Data Book on Private Sector Development 2011
http://slidepdf.com/reader/full/the-little-data-book-on-private-sector-development-2011 5/246
iiiThe Little Data Book on Private Sector Development 2011
ContentsAcknowledgments. . . . . . . . . . . . . . . . . . . . . . . . . . . . . . . . . . . . . . . . . . . iv
Preface . . . . . . . . . . . . . . . . . . . . . . . . . . . . . . . . . . . . . . . . . . . . . . . . . . v
Data notes . . . . . . . . . . . . . . . . . . . . . . . . . . . . . . . . . . . . . . . . . . . . . . . . vi
Regional tables. . . . . . . . . . . . . . . . . . . . . . . . . . . . . . . . . . . . . . . . . . . . . 1
World . . . . . . . . . . . . . . . . . . . . . . . . . . . . . . . . . . . . . . . . . . . . . . . . . 2
East Asia and Pacific. . . . . . . . . . . . . . . . . . . . . . . . . . . . . . . . . . . . . . 3
Europe and Central Asia . . . . . . . . . . . . . . . . . . . . . . . . . . . . . . . . . . . 4
Latin America and the Caribbean . . . . . . . . . . . . . . . . . . . . . . . . . . . . . 5
Middle East and North Africa . . . . . . . . . . . . . . . . . . . . . . . . . . . . . . . . 6
South Asia . . . . . . . . . . . . . . . . . . . . . . . . . . . . . . . . . . . . . . . . . . . . . 7
Sub-Saharan Africa . . . . . . . . . . . . . . . . . . . . . . . . . . . . . . . . . . . . . . . 8
Income group tables . . . . . . . . . . . . . . . . . . . . . . . . . . . . . . . . . . . . . . . . . 9
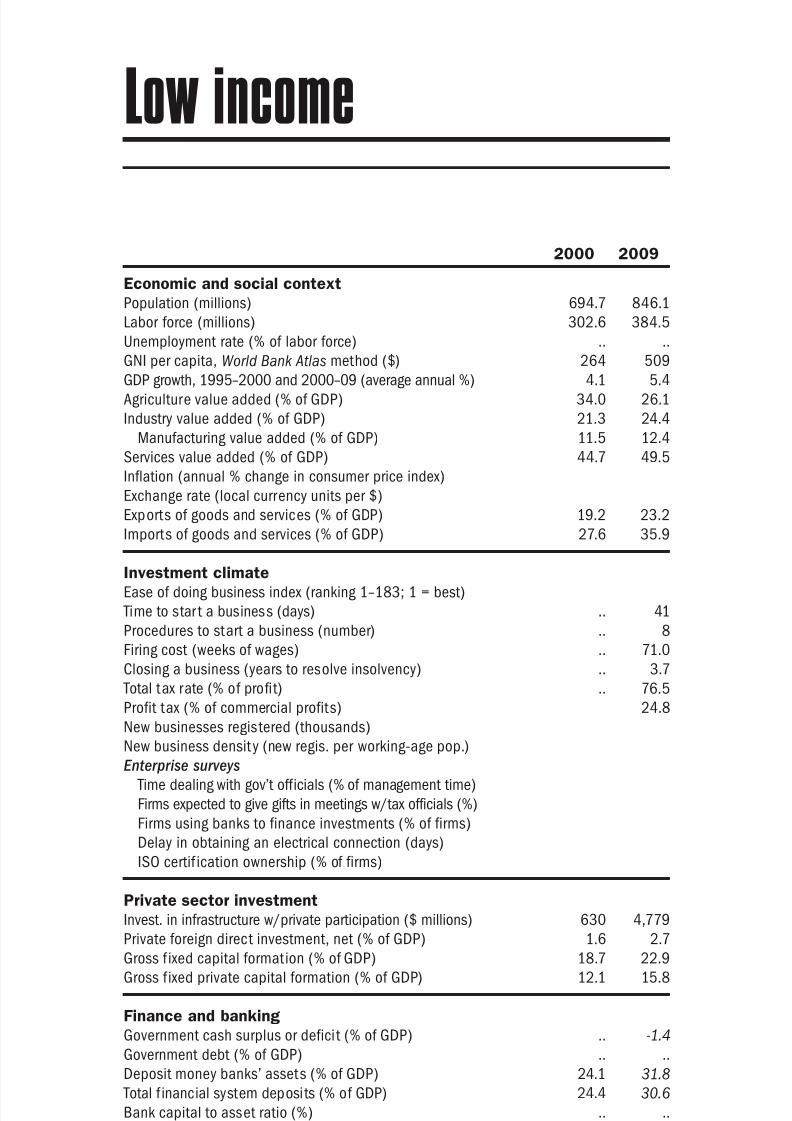
Low income . . . . . . . . . . . . . . . . . . . . . . . . . . . . . . . . . . . . . . . . . . . 10
Middle income . . . . . . . . . . . . . . . . . . . . . . . . . . . . . . . . . . . . . . . . . 11
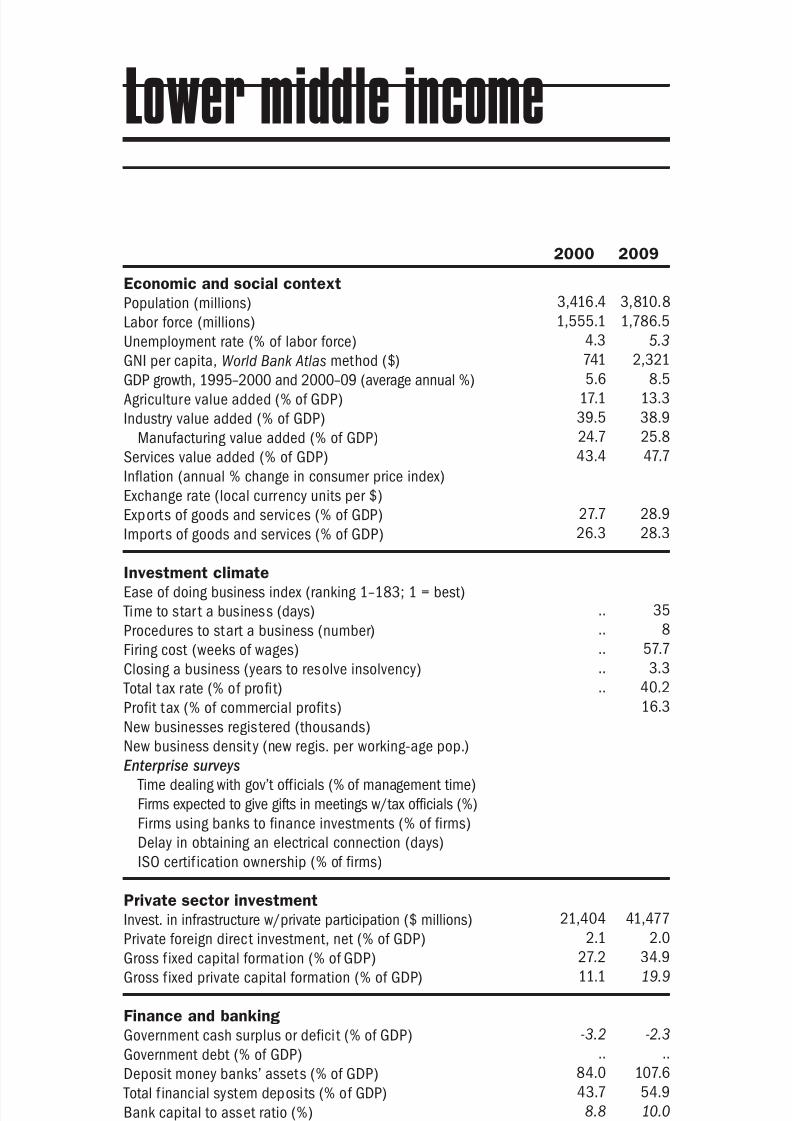
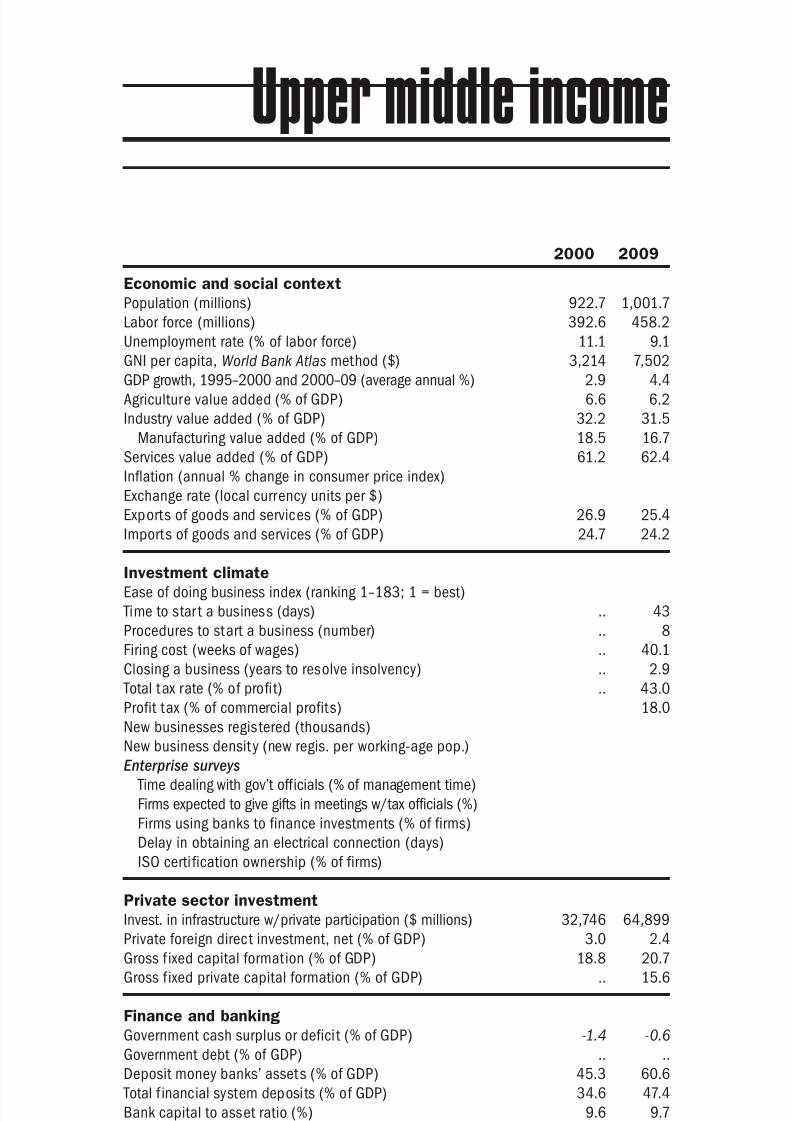
Lower middle income . . . . . . . . . . . . . . . . . . . . . . . . . . . . . . . . . . . . 12 Upper middle income . . . . . . . . . . . . . . . . . . . . . . . . . . . . . . . . . . . . 13
Low and middle income. . . . . . . . . . . . . . . . . . . . . . . . . . . . . . . . . . . 14
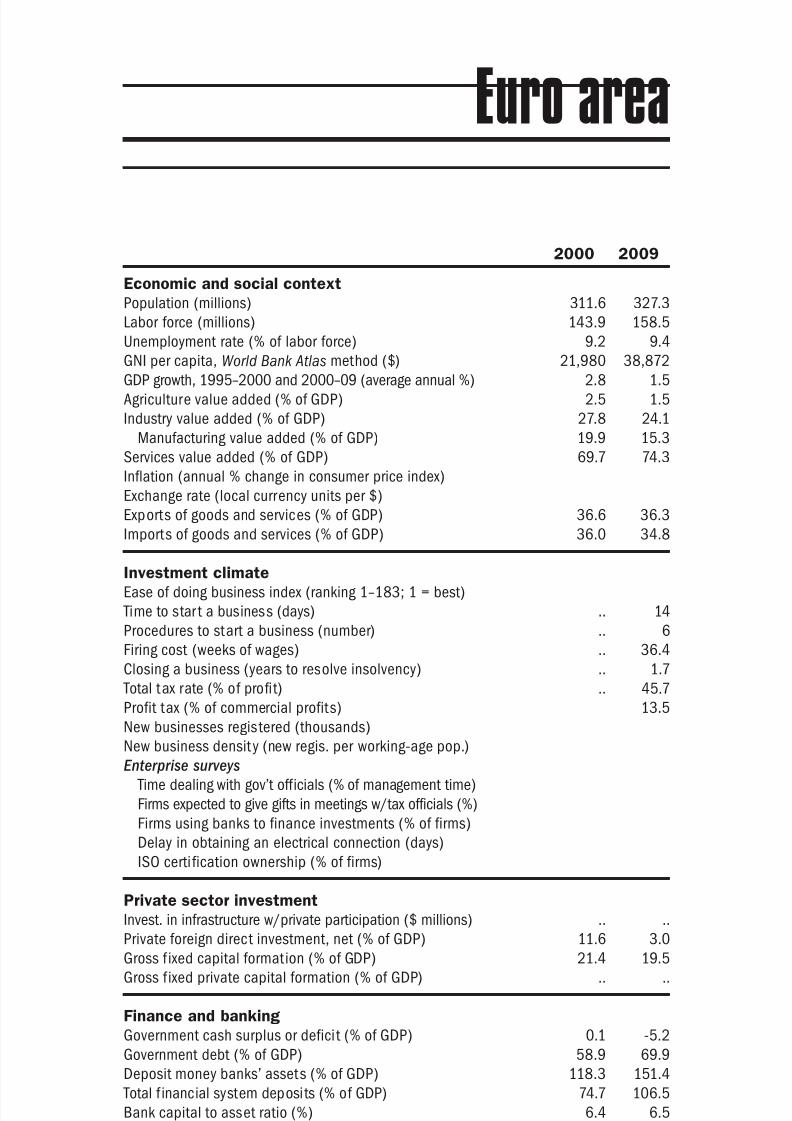
Euro area . . . . . . . . . . . . . . . . . . . . . . . . . . . . . . . . . . . . . . . . . . . . . 15
High income . . . . . . . . . . . . . . . . . . . . . . . . . . . . . . . . . . . . . . . . . . . 16
Country tables (in alphabetical order) . . . . . . . . . . . . . . . . . . . . . . . . . . . . 17
Glossary. . . . . . . . . . . . . . . . . . . . . . . . . . . . . . . . . . . . . . . . . . . . . . . . 231
8/6/2019 The Little Data Book on Private Sector Development 2011
http://slidepdf.com/reader/full/the-little-data-book-on-private-sector-development-2011 6/246
iv 2011 The Little Data Book on Private Sector Development
The Little Data Book on Private Sector Development 2011 is based on World
Development Indicators 2011 and its accompanying CD-ROM, with a focus
on the private sector in development. The Little Data Book on Private Sector
Development 2011 is the result of close collaboration between the staff of
the World Bank’s Development Data Group of the Development Economics
Vice Presidency and the Investment Climate Department of the Financial and
Private Sector Development Vice Presidency. The Development Data Group
team included Azita Amjadi, David Cieslikowski, Federico Escaler, Buyant
Erdene Khaltarkhuu, Alison Kwong, William Prince, and Jomo Tariku. The
Investment Climate Department's team included Nathalie David and Ayse
Boybeyi. The work was carried out under the management of Shaida Badiee,
director of the Development Data Group, and Pierre Guislain, director of the
Investment Climate Department. The book was typeset by Jomo Tariku. Staff
from External Affairs oversaw publication and dissemination of the book.
Acknowledgments
8/6/2019 The Little Data Book on Private Sector Development 2011
http://slidepdf.com/reader/full/the-little-data-book-on-private-sector-development-2011 7/246
vThe Little Data Book on Private Sector Development 2011
Preface Access to reliable cross-country data on private sector development is crucial
when formulating responses to economic crisis. When downturns affect
exports, investment and growth negatively, making life easier for business
is a significant step towards economic recovery. This became very obvious
during the global financial crises when governments were trying to stimulate
economic growth through the creation of more robust private and finance
markets. Improving the investment climate facilitates economic adjustment
as it helps attract capital to create jobs and provide basic services.
Unsurprisingly, the availability of cross-country data on the business
environment has rapidly expanded in recent years, including data from the
World Bank’s Doing Business project, Enterprise Surveys, and the World
Bank Group Entrepreneurship Snapshots.
The data sources presented in this book report on the scope and types of
regulations that enhance — and constrain — business activity and provide
information on business owners’ assessment of the business environment.
The data have led to new research, enabled benchmarking, and informed
the reform process in many developing countries.
Included in this guide are indicators on the economic and social context,
the investment climate, private sector investment, finance and banking, and
infrastructure. Though a pocket guide cannot include all relevant variables,
the indicators that are included provide users with a general understanding
of the private sector in each country. Indicators displayed in the tables are
defined in the Glossary , which also lists data sources.
We welcome your suggestions on how to improve future editions and make
them more useful.
8/6/2019 The Little Data Book on Private Sector Development 2011
http://slidepdf.com/reader/full/the-little-data-book-on-private-sector-development-2011 8/246
vi 2011 The Little Data Book on Private Sector Development
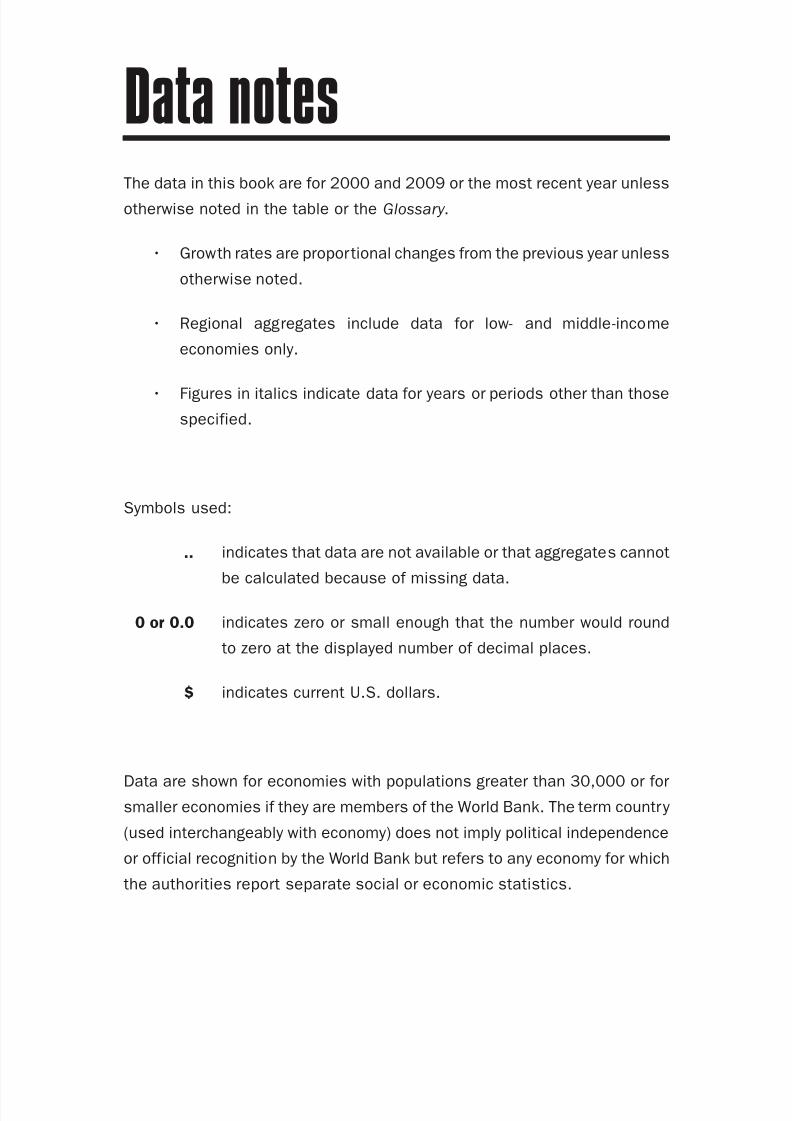
The data in this book are for 2000 and 2009 or the most recent year unless
otherwise noted in the table or the Glossary .
• Growth rates are proportional changes from the previous year unless
otherwise noted.
• Regional aggregates include data for low- and middle-income
economies only.
• Figures in italics indicate data for years or periods other than those
specified.
Symbols used:
.. indicates that data are not available or that aggregates cannot
be calculated because of missing data.
0 or 0.0 indicates zero or small enough that the number would round
to zero at the displayed number of decimal places.
$ indicates current U.S. dollars.
Data are shown for economies with populations greater than 30,000 or for
smaller economies if they are members of the World Bank. The term country
(used interchangeably with economy) does not imply political independence
or official recognition by the World Bank but refers to any economy for which
the authorities report separate social or economic statistics.
Data notes
8/6/2019 The Little Data Book on Private Sector Development 2011
http://slidepdf.com/reader/full/the-little-data-book-on-private-sector-development-2011 9/246

8/6/2019 The Little Data Book on Private Sector Development 2011
http://slidepdf.com/reader/full/the-little-data-book-on-private-sector-development-2011 10/246
Economic and social context
Population (millions)
Labor force (millions)
Unemployment rate (% of labor force)
GNI per capita, World Bank Atlas method ($)GDP growth, 1995–2000 and 2000–09 (average annual %)
Agriculture value added (% of GDP)
Industry value added (% of GDP)
Manufacturing value added (% of GDP)
Services value added (% of GDP)
Inflation (annual % change in consumer price index)
Exchange rate (local currency units per $)
Exports of goods and services (% of GDP)
Imports of goods and services (% of GDP) Investment climate
Ease of doing business index (ranking 1–183; 1 = best)
Time to star t a business (days)
Procedures to start a business (number)
Firing cost (weeks of wages)
Closing a business (years to resolve insolvency)
Total tax rate (% of profit)
Profit tax (% of commercial profits)New businesses registered (thousands)
New business density (new regis. per working-age pop.)
Enterprise surveys
Time dealing with gov’t officials (% of management time)
Firms expected to give gifts in meetings w/tax officials (%)
Firms using banks to finance investments (% of firms)
Delay in obtaining an electrical connection (days)
ISO certif ication ownership (% of firms)
Private sector investment
Invest. in infrastructure w/private participation ($ millions)
Private foreign direct investment, net (% of GDP)
Gross f ixed capital formation (% of GDP)
Gross f ixed private capital formation (% of GDP)
Finance and banking
Government cash surplus or deficit (% of GDP)
Government debt (% of GDP)
Deposit money banks’ assets (% of GDP) Total f inancial system deposits (% of GDP)
Bank capital to asset ratio (%)
Bank nonperforming loans to total gross loans ratio (%)
Domestic credit to the private sector (% of GDP)
Real interest rate (%)
Interest rate spread (percentage points)
Infrastructure
Paved roads (% of total roads)Electr ic power consumption (kWh per capita)
Power outages in a typical month (number)
Mobile cellular subscriptions (per 100 people)
Internet users (per 100 people)
2 2011 The Little Data Book on Private Sector Development
World
2000 2009
6,085.0 6,775.2
2,755.3 3,175.8
5.6 6.6
5,293 8,7323.3 2.9
3.6 2.9
28.9 27.0
19.2 16.8
67.5 70.2
24.4 24.2
24.5 24.3
.. 34
.. 8
.. 51.2
.. 2.9
.. 47.8
17.9
.. ..
5.0 2.0
21.6 19.5
.. ..
-0.2 -7.1
.. ..
103.9 124.688.6 91.5
8.7 9.4
9.5 4.2
129.3 138.2
7.0 6.2
49.0 ..2,389 2,875
12.2 69.0
6.7 27.1
8/6/2019 The Little Data Book on Private Sector Development 2011
http://slidepdf.com/reader/full/the-little-data-book-on-private-sector-development-2011 11/246
Economic and social context
Population (millions)
Labor force (millions)
Unemployment rate (% of labor force)
GNI per capita, World Bank Atlas method ($)GDP growth, 1995–2000 and 2000–09 (average annual %)
Agriculture value added (% of GDP)
Industry value added (% of GDP)
Manufacturing value added (% of GDP)
Services value added (% of GDP)
Inflation (annual % change in consumer price index)
Exchange rate (local currency units per $)
Exports of goods and services (% of GDP)
Imports of goods and services (% of GDP) Investment climate
Ease of doing business index (ranking 1–183; 1 = best)
Time to star t a business (days)
Procedures to start a business (number)
Firing cost (weeks of wages)
Closing a business (years to resolve insolvency)
Total tax rate (% of profit)
Profit tax (% of commercial profits)New businesses registered (thousands)
New business density (new regis. per working-age pop.)
Enterprise surveys
Time dealing with gov’t officials (% of management time)
Firms expected to give gifts in meetings w/tax officials (%)
Firms using banks to finance investments (% of firms)
Delay in obtaining an electrical connection (days)
ISO certi fication ownership (% of firms)
Private sector investment
Invest. in infrastructure w/private participation ($ millions)
Private foreign direct investment, net (% of GDP)
Gross f ixed capital formation (% of GDP)
Gross f ixed private capital formation (% of GDP)
Finance and banking
Government cash surplus or deficit (% of GDP)
Government debt (% of GDP)
Deposit money banks’ assets (% of GDP) Total f inancial system deposits (% of GDP)
Bank capital to asset ratio (%)
Bank nonperforming loans to total gross loans ratio (%)
Domestic credit to the private sector (% of GDP)
Real interest rate (%)
Interest rate spread (percentage points)
Infrastructure
Paved roads (% of total roads)Electr ic power consumption (kWh per capita)
Power outages in a typical month (number)
Mobile cellular subscriptions (per 100 people)
Internet users (per 100 people)
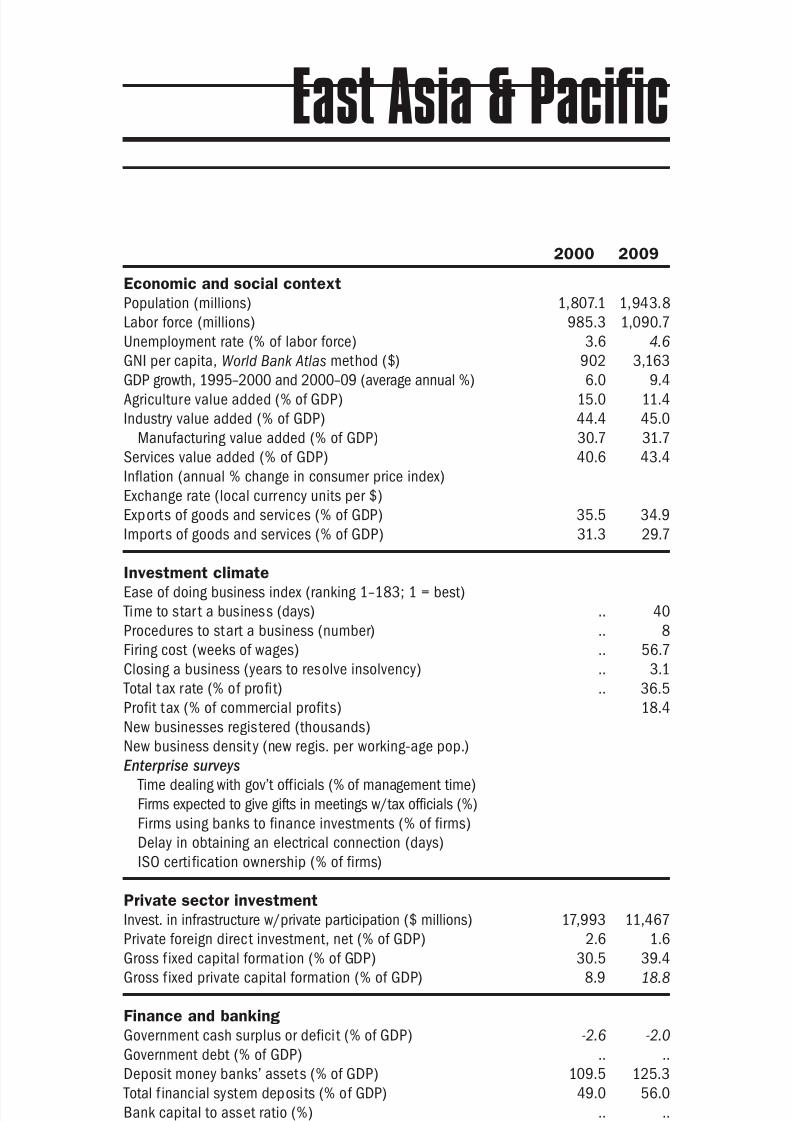
3The Little Data Book on Private Sector Development 2011
East Asia & Pacific
2000 2009
1,807.1 1,943.8
985.3 1,090.7
3.6 4.6
902 3,1636.0 9.4
15.0 11.4
44.4 45.0
30.7 31.7
40.6 43.4
35.5 34.9
31.3 29.7
.. 40
.. 8
.. 56.7
.. 3.1
.. 36.5
18.4
17,993 11,467
2.6 1.6
30.5 39.4
8.9 18.8
-2.6 -2.0
.. ..
109.5 125.349.0 56.0
.. ..
.. ..
98.9 117.0
6.9 7.1
11.4 ..879 1,972
5.8 61.6
1.9 24.1

8/6/2019 The Little Data Book on Private Sector Development 2011
http://slidepdf.com/reader/full/the-little-data-book-on-private-sector-development-2011 12/246
Economic and social context
Population (millions)
Labor force (millions)
Unemployment rate (% of labor force)
GNI per capita, World Bank Atlas method ($)GDP growth, 1995–2000 and 2000–09 (average annual %)
Agriculture value added (% of GDP)
Industry value added (% of GDP)
Manufacturing value added (% of GDP)
Services value added (% of GDP)
Inflation (annual % change in consumer price index)
Exchange rate (local currency units per $)
Exports of goods and services (% of GDP)
Imports of goods and services (% of GDP) Investment climate
Ease of doing business index (ranking 1–183; 1 = best)
Time to star t a business (days)
Procedures to start a business (number)
Firing cost (weeks of wages)
Closing a business (years to resolve insolvency)
Total tax rate (% of profit)
Profit tax (% of commercial profits)New businesses registered (thousands)
New business density (new regis. per working-age pop.)
Enterprise surveys
Time dealing with gov’t officials (% of management time)
Firms expected to give gifts in meetings w/tax officials (%)
Firms using banks to finance investments (% of firms)
Delay in obtaining an electrical connection (days)
ISO certif ication ownership (% of firms)
Private sector investment
Invest. in infrastructure w/private participation ($ millions)
Private foreign direct investment, net (% of GDP)
Gross f ixed capital formation (% of GDP)
Gross f ixed private capital formation (% of GDP)
Finance and banking
Government cash surplus or deficit (% of GDP)
Government debt (% of GDP)
Deposit money banks’ assets (% of GDP) Total f inancial system deposits (% of GDP)
Bank capital to asset ratio (%)
Bank nonperforming loans to total gross loans ratio (%)
Domestic credit to the private sector (% of GDP)
Real interest rate (%)
Interest rate spread (percentage points)
Infrastructure
Paved roads (% of total roads)Electr ic power consumption (kWh per capita)
Power outages in a typical month (number)
Mobile cellular subscriptions (per 100 people)
Internet users (per 100 people)
4 2011 The Little Data Book on Private Sector Development
Europe & Central Asia
2000 2009
399.7 404.2
176.4 187.2
10.2 9.2
1,756 6,7932.1 5.9
10.8 7.5
34.7 30.4
18.2 16.6
54.5 62.1
37.0 29.8
31.0 28.7
.. 18
.. 6
.. 25.9
.. 2.9
.. 42.2
10.0
8,448 23,082
1.3 3.3
18.8 21.1
15.6 17.2
.. -0.4
.. ..
27.7 54.322.3 40.2
14.0 13.3
11.0 9.3
14.8 45.0
14.8 5.7
67.4 ..3,316 4,052
6.5 118.7
2.0 36.4
8/6/2019 The Little Data Book on Private Sector Development 2011
http://slidepdf.com/reader/full/the-little-data-book-on-private-sector-development-2011 13/246
Economic and social context
Population (millions)
Labor force (millions)
Unemployment rate (% of labor force)
GNI per capita, World Bank Atlas method ($)GDP growth, 1995–2000 and 2000–09 (average annual %)
Agriculture value added (% of GDP)
Industry value added (% of GDP)
Manufacturing value added (% of GDP)
Services value added (% of GDP)
Inflation (annual % change in consumer price index)
Exchange rate (local currency units per $)
Exports of goods and services (% of GDP)
Imports of goods and services (% of GDP) Investment climate
Ease of doing business index (ranking 1–183; 1 = best)
Time to star t a business (days)
Procedures to start a business (number)
Firing cost (weeks of wages)
Closing a business (years to resolve insolvency)
Total tax rate (% of profit)
Profit tax (% of commercial profits)New businesses registered (thousands)
New business density (new regis. per working-age pop.)
Enterprise surveys
Time dealing with gov’t officials (% of management time)
Firms expected to give gifts in meetings w/tax officials (%)
Firms using banks to finance investments (% of firms)
Delay in obtaining an electrical connection (days)
ISO certi fication ownership (% of firms)
Private sector investment
Invest. in infrastructure w/private participation ($ millions)
Private foreign direct investment, net (% of GDP)
Gross f ixed capital formation (% of GDP)
Gross f ixed private capital formation (% of GDP)
Finance and banking
Government cash surplus or deficit (% of GDP)
Government debt (% of GDP)
Deposit money banks’ assets (% of GDP) Total f inancial system deposits (% of GDP)
Bank capital to asset ratio (%)
Bank nonperforming loans to total gross loans ratio (%)
Domestic credit to the private sector (% of GDP)
Real interest rate (%)
Interest rate spread (percentage points)
Infrastructure
Paved roads (% of total roads)Electr ic power consumption (kWh per capita)
Power outages in a typical month (number)
Mobile cellular subscriptions (per 100 people)
Internet users (per 100 people)
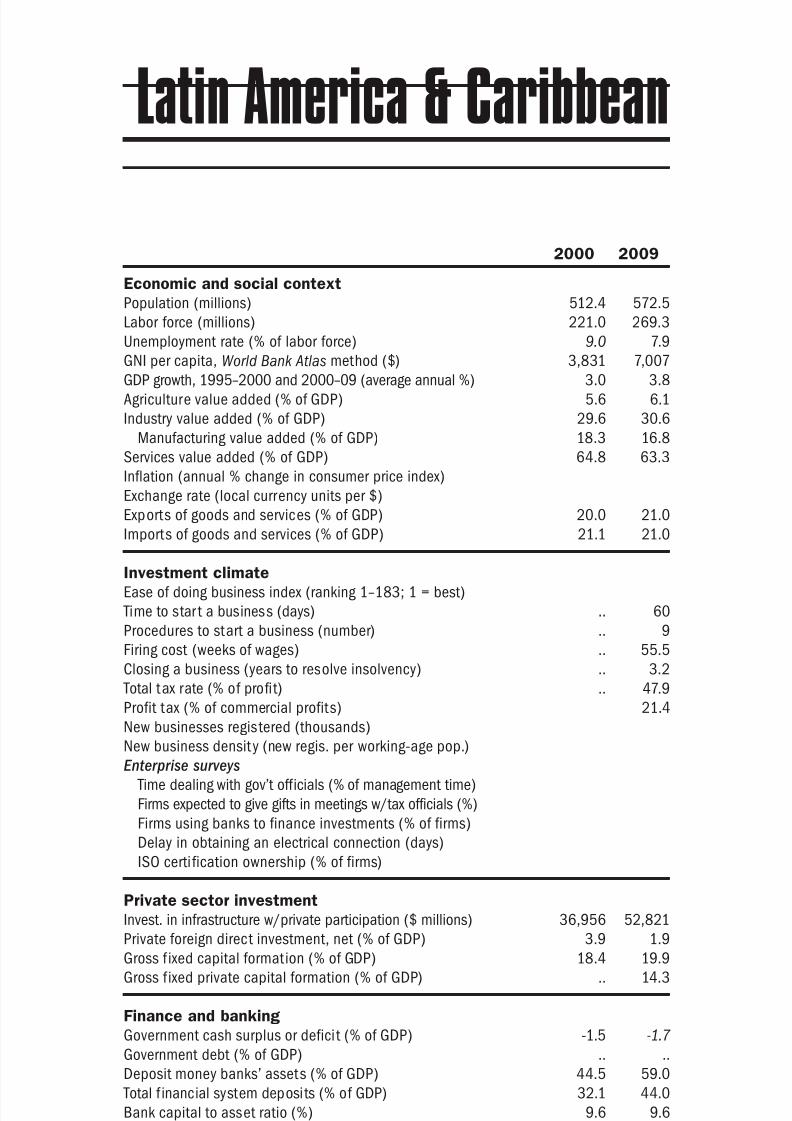
5The Little Data Book on Private Sector Development 2011
Latin America & Caribbean
2000 2009
512.4 572.5
221.0 269.3
9.0 7.9
3,831 7,0073.0 3.8
5.6 6.1
29.6 30.6
18.3 16.8
64.8 63.3
20.0 21.0
21.1 21.0
.. 60
.. 9
.. 55.5
.. 3.2
.. 47.9
21.4
36,956 52,821
3.9 1.9
18.4 19.9
.. 14.3
-1.5 -1.7
.. ..
44.5 59.032.1 44.0
9.6 9.6
7.5 3.0
27.0 40.8
8.3 7.7
24.3 ..1,568 1,907
12.1 89.5
3.8 31.5
8/6/2019 The Little Data Book on Private Sector Development 2011
http://slidepdf.com/reader/full/the-little-data-book-on-private-sector-development-2011 14/246
8/6/2019 The Little Data Book on Private Sector Development 2011
http://slidepdf.com/reader/full/the-little-data-book-on-private-sector-development-2011 15/246
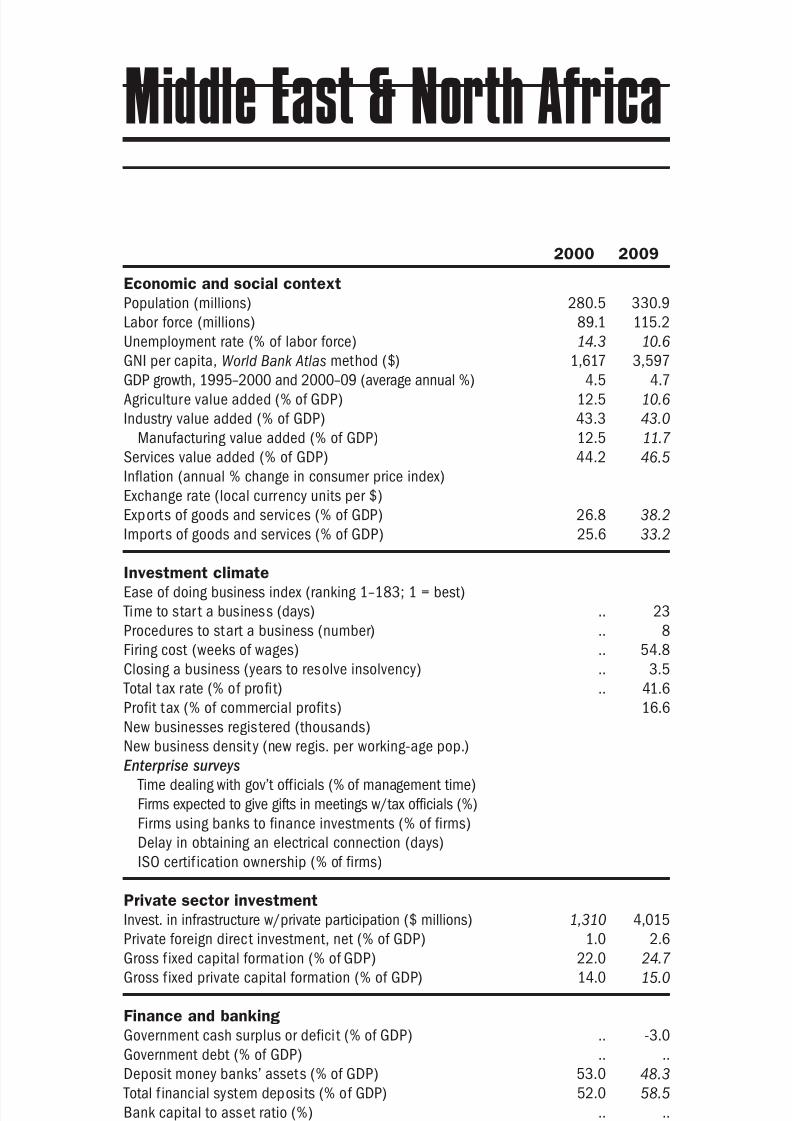
Economic and social context
Population (millions)
Labor force (millions)
Unemployment rate (% of labor force)
GNI per capita, World Bank Atlas method ($)GDP growth, 1995–2000 and 2000–09 (average annual %)
Agriculture value added (% of GDP)
Industry value added (% of GDP)
Manufacturing value added (% of GDP)
Services value added (% of GDP)
Inflation (annual % change in consumer price index)
Exchange rate (local currency units per $)
Exports of goods and services (% of GDP)
Imports of goods and services (% of GDP) Investment climate
Ease of doing business index (ranking 1–183; 1 = best)
Time to star t a business (days)
Procedures to start a business (number)
Firing cost (weeks of wages)
Closing a business (years to resolve insolvency)
Total tax rate (% of profit)
Profit tax (% of commercial profits)New businesses registered (thousands)
New business density (new regis. per working-age pop.)
Enterprise surveys
Time dealing with gov’t officials (% of management time)
Firms expected to give gifts in meetings w/tax officials (%)
Firms using banks to finance investments (% of firms)
Delay in obtaining an electrical connection (days)
ISO certi fication ownership (% of firms)
Private sector investment
Invest. in infrastructure w/private participation ($ millions)
Private foreign direct investment, net (% of GDP)
Gross f ixed capital formation (% of GDP)
Gross f ixed private capital formation (% of GDP)
Finance and banking
Government cash surplus or deficit (% of GDP)
Government debt (% of GDP)
Deposit money banks’ assets (% of GDP) Total f inancial system deposits (% of GDP)
Bank capital to asset ratio (%)
Bank nonperforming loans to total gross loans ratio (%)
Domestic credit to the private sector (% of GDP)
Real interest rate (%)
Interest rate spread (percentage points)
Infrastructure
Paved roads (% of total roads)Electr ic power consumption (kWh per capita)
Power outages in a typical month (number)
Mobile cellular subscriptions (per 100 people)
Internet users (per 100 people)
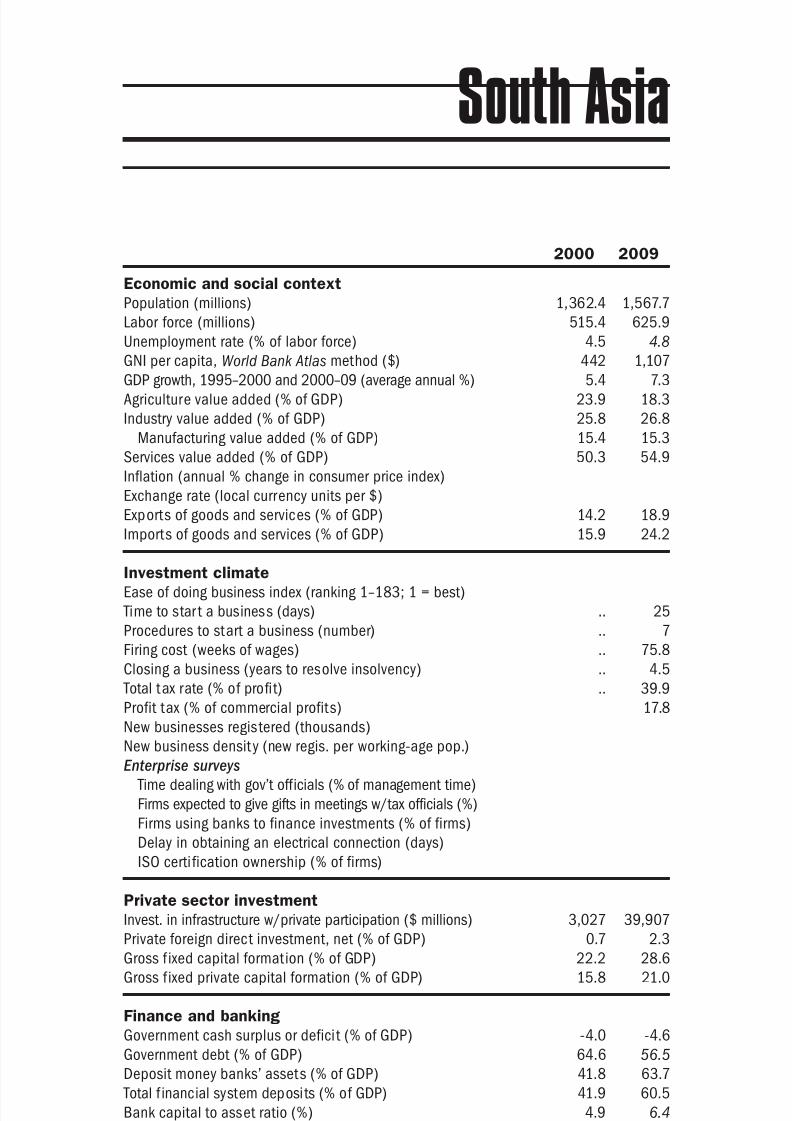
7The Little Data Book on Private Sector Development 2011
South Asia
2000 2009
1,362.4 1,567.7
515.4 625.9
4.5 4.8
442 1,1075.4 7.3
23.9 18.3
25.8 26.8
15.4 15.3
50.3 54.9
14.2 18.9
15.9 24.2
.. 25
.. 7
.. 75.8
.. 4.5
.. 39.9
17.8
3,027 39,907
0.7 2.3
22.2 28.6
15.8 21.0
-4.0 -4.6
64.6 56.5
41.8 63.741.9 60.5
4.9 6.4
19.5 10.5
27.7 43.5
6.9 5.9
47.5 51.8359 503
0.3 45.5
0.5 5.5
8/6/2019 The Little Data Book on Private Sector Development 2011
http://slidepdf.com/reader/full/the-little-data-book-on-private-sector-development-2011 16/246
8/6/2019 The Little Data Book on Private Sector Development 2011
http://slidepdf.com/reader/full/the-little-data-book-on-private-sector-development-2011 17/246
9The Little Data Book on Private Sector Development 2011
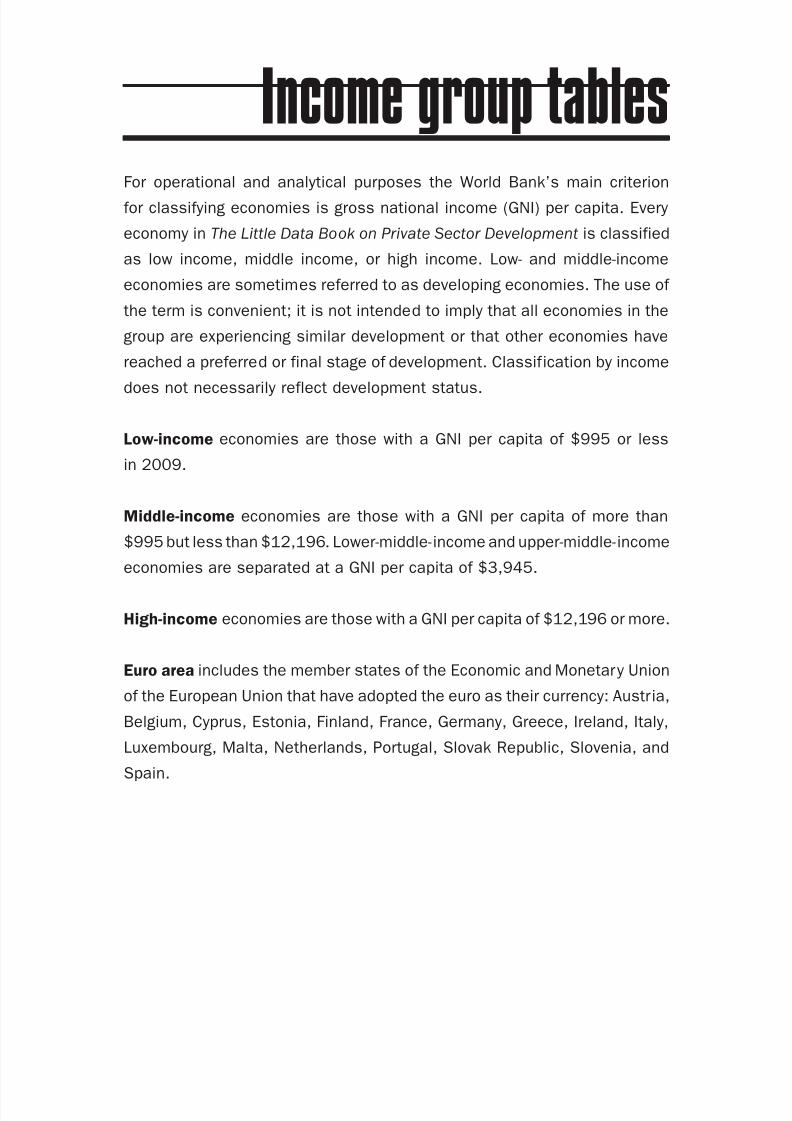
For operational and analytical purposes the World Bank’s main criterion
for classifying economies is gross national income (GNI) per capita. Every
economy in The Little Data Book on Private Sector Development is classified
as low income, middle income, or high income. Low- and middle-income
economies are sometimes referred to as developing economies. The use of
the term is convenient; it is not intended to imply that all economies in the
group are experiencing similar development or that other economies have
reached a preferred or final stage of development. Classification by income
does not necessarily reflect development status.
Low-income economies are those with a GNI per capita of $995 or less
in 2009.
Middle-income economies are those with a GNI per capita of more than
$995 but less than $12,196. Lower-middle-income and upper-middle-income
economies are separated at a GNI per capita of $3,945.
High-income economies are those with a GNI per capita of $12,196 or more.
Euro area includes the member states of the Economic and Monetary Union
of the European Union that have adopted the euro as their currency: Austria,
Belgium, Cyprus, Estonia, Finland, France, Germany, Greece, Ireland, Italy,
Luxembourg, Malta, Netherlands, Portugal, Slovak Republic, Slovenia, and
Spain.
Income group tables
8/6/2019 The Little Data Book on Private Sector Development 2011
http://slidepdf.com/reader/full/the-little-data-book-on-private-sector-development-2011 18/246

8/6/2019 The Little Data Book on Private Sector Development 2011
http://slidepdf.com/reader/full/the-little-data-book-on-private-sector-development-2011 19/246
Economic and social context
Population (millions)
Labor force (millions)
Unemployment rate (% of labor force)
GNI per capita, World Bank Atlas method ($)GDP growth, 1995–2000 and 2000–09 (average annual %)
Agriculture value added (% of GDP)
Industry value added (% of GDP)
Manufacturing value added (% of GDP)
Services value added (% of GDP)
Inflation (annual % change in consumer price index)
Exchange rate (local currency units per $)
Exports of goods and services (% of GDP)
Imports of goods and services (% of GDP) Investment climate
Ease of doing business index (ranking 1–183; 1 = best)
Time to star t a business (days)
Procedures to start a business (number)
Firing cost (weeks of wages)
Closing a business (years to resolve insolvency)
Total tax rate (% of profit)
Profit tax (% of commercial profits)New businesses registered (thousands)
New business density (new regis. per working-age pop.)
Enterprise surveys
Time dealing with gov’t officials (% of management time)
Firms expected to give gifts in meetings w/tax officials (%)
Firms using banks to finance investments (% of firms)
Delay in obtaining an electrical connection (days)
ISO certi fication ownership (% of firms)
Private sector investment
Invest. in infrastructure w/private participation ($ millions)
Private foreign direct investment, net (% of GDP)
Gross f ixed capital formation (% of GDP)
Gross f ixed private capital formation (% of GDP)
Finance and banking
Government cash surplus or deficit (% of GDP)
Government debt (% of GDP)
Deposit money banks’ assets (% of GDP) Total f inancial system deposits (% of GDP)
Bank capital to asset ratio (%)
Bank nonperforming loans to total gross loans ratio (%)
Domestic credit to the private sector (% of GDP)
Real interest rate (%)
Interest rate spread (percentage points)
Infrastructure
Paved roads (% of total roads)Electr ic power consumption (kWh per capita)
Power outages in a typical month (number)
Mobile cellular subscriptions (per 100 people)
Internet users (per 100 people)
11The Little Data Book on Private Sector Development 2011
Middle income
2000 2009
4,339.2 4,812.5
1,947.7 2,244.8
5.4 6.2
1,267 3,3974.1 6.4
11.4 9.6
35.5 35.0
21.5 21.0
53.1 55.4
27.3 27.0
25.4 26.1
.. 39
.. 8
.. 49.5
.. 3.1
.. 41.5
17.1
80,173 142,107
2.6 2.2
22.6 27.3
13.3 18.4
-2.3 -1.5
.. ..
62.9 86.438.7 51.5
9.5 10.1
11.3 4.8
50.2 72.8
8.2 6.3
35.4 ..1,071 1,670
4.9 66.7
1.7 20.9
8/6/2019 The Little Data Book on Private Sector Development 2011
http://slidepdf.com/reader/full/the-little-data-book-on-private-sector-development-2011 20/246
Economic and social context
Population (millions)
Labor force (millions)
Unemployment rate (% of labor force)
GNI per capita, World Bank Atlas method ($)GDP growth, 1995–2000 and 2000–09 (average annual %)
Agriculture value added (% of GDP)
Industry value added (% of GDP)
Manufacturing value added (% of GDP)
Services value added (% of GDP)
Inflation (annual % change in consumer price index)
Exchange rate (local currency units per $)
Exports of goods and services (% of GDP)
Imports of goods and services (% of GDP) Investment climate
Ease of doing business index (ranking 1–183; 1 = best)
Time to star t a business (days)
Procedures to start a business (number)
Firing cost (weeks of wages)
Closing a business (years to resolve insolvency)
Total tax rate (% of profit)
Profit tax (% of commercial profits)New businesses registered (thousands)
New business density (new regis. per working-age pop.)
Enterprise surveys
Time dealing with gov’t officials (% of management time)
Firms expected to give gifts in meetings w/tax officials (%)
Firms using banks to finance investments (% of firms)
Delay in obtaining an electrical connection (days)
ISO certif ication ownership (% of firms)
Private sector investment
Invest. in infrastructure w/private participation ($ millions)
Private foreign direct investment, net (% of GDP)
Gross f ixed capital formation (% of GDP)
Gross f ixed private capital formation (% of GDP)
Finance and banking
Government cash surplus or deficit (% of GDP)
Government debt (% of GDP)
Deposit money banks’ assets (% of GDP) Total f inancial system deposits (% of GDP)
Bank capital to asset ratio (%)
Bank nonperforming loans to total gross loans ratio (%)
Domestic credit to the private sector (% of GDP)
Real interest rate (%)
Interest rate spread (percentage points)
Infrastructure
Paved roads (% of total roads)Electr ic power consumption (kWh per capita)
Power outages in a typical month (number)
Mobile cellular subscriptions (per 100 people)
Internet users (per 100 people)
12 2011 The Little Data Book on Private Sector Development
Lower middle income
2000 2009
3,416.4 3,810.8
1,555.1 1,786.5
4.3 5.3
741 2,3215.6 8.5
17.1 13.3
39.5 38.9
24.7 25.8
43.4 47.7
27.7 28.9
26.3 28.3
.. 35
.. 8
.. 57.7
.. 3.3
.. 40.2
16.3
21,404 41,477
2.1 2.0
27.2 34.9
11.1 19.9
-3.2 -2.3
.. ..
84.0 107.643.7 54.9
8.8 10.0
16.8 5.1
71.9 92.9
8.3 7.3
35.4 ..693 1,318
3.3 57.8
1.1 17.2
8/6/2019 The Little Data Book on Private Sector Development 2011
http://slidepdf.com/reader/full/the-little-data-book-on-private-sector-development-2011 21/246
Economic and social context
Population (millions)
Labor force (millions)
Unemployment rate (% of labor force)
GNI per capita, World Bank Atlas method ($)GDP growth, 1995–2000 and 2000–09 (average annual %)
Agriculture value added (% of GDP)
Industry value added (% of GDP)
Manufacturing value added (% of GDP)
Services value added (% of GDP)
Inflation (annual % change in consumer price index)
Exchange rate (local currency units per $)
Exports of goods and services (% of GDP)
Imports of goods and services (% of GDP) Investment climate
Ease of doing business index (ranking 1–183; 1 = best)
Time to star t a business (days)
Procedures to start a business (number)
Firing cost (weeks of wages)
Closing a business (years to resolve insolvency)
Total tax rate (% of profit)
Profit tax (% of commercial profits)New businesses registered (thousands)
New business density (new regis. per working-age pop.)
Enterprise surveys
Time dealing with gov’t officials (% of management time)
Firms expected to give gifts in meetings w/tax officials (%)
Firms using banks to finance investments (% of firms)
Delay in obtaining an electrical connection (days)
ISO certi fication ownership (% of firms)
Private sector investment
Invest. in infrastructure w/private participation ($ millions)
Private foreign direct investment, net (% of GDP)
Gross f ixed capital formation (% of GDP)
Gross f ixed private capital formation (% of GDP)
Finance and banking
Government cash surplus or deficit (% of GDP)
Government debt (% of GDP)
Deposit money banks’ assets (% of GDP) Total f inancial system deposits (% of GDP)
Bank capital to asset ratio (%)
Bank nonperforming loans to total gross loans ratio (%)
Domestic credit to the private sector (% of GDP)
Real interest rate (%)
Interest rate spread (percentage points)
Infrastructure
Paved roads (% of total roads)Electr ic power consumption (kWh per capita)
Power outages in a typical month (number)
Mobile cellular subscriptions (per 100 people)
Internet users (per 100 people)
13The Little Data Book on Private Sector Development 2011
Upper middle income
2000 2009
922.7 1,001.7
392.6 458.2
11.1 9.1
3,214 7,5022.9 4.4
6.6 6.2
32.2 31.5
18.5 16.7
61.2 62.4
26.9 25.4
24.7 24.2
.. 43
.. 8
.. 40.1
.. 2.9
.. 43.0
18.0
32,746 64,899
3.0 2.4
18.8 20.7
.. 15.6
-1.4 -0.6
.. ..
45.3 60.634.6 47.4
9.6 9.7
8.1 4.2
32.0 47.8
7.8 5.5
36.8 ..2,469 3,001
10.8 100.6
3.8 34.6

8/6/2019 The Little Data Book on Private Sector Development 2011
http://slidepdf.com/reader/full/the-little-data-book-on-private-sector-development-2011 22/246
Economic and social context
Population (millions)
Labor force (millions)
Unemployment rate (% of labor force)
GNI per capita, World Bank Atlas method ($)GDP growth, 1995–2000 and 2000–09 (average annual %)
Agriculture value added (% of GDP)
Industry value added (% of GDP)
Manufacturing value added (% of GDP)
Services value added (% of GDP)
Inflation (annual % change in consumer price index)
Exchange rate (local currency units per $)
Exports of goods and services (% of GDP)
Imports of goods and services (% of GDP) Investment climate
Ease of doing business index (ranking 1–183; 1 = best)
Time to star t a business (days)
Procedures to start a business (number)
Firing cost (weeks of wages)
Closing a business (years to resolve insolvency)
Total tax rate (% of profit)
Profit tax (% of commercial profits)New businesses registered (thousands)
New business density (new regis. per working-age pop.)
Enterprise surveys
Time dealing with gov’t officials (% of management time)
Firms expected to give gifts in meetings w/tax officials (%)
Firms using banks to finance investments (% of firms)
Delay in obtaining an electrical connection (days)
ISO certif ication ownership (% of firms)
Private sector investment
Invest. in infrastructure w/private participation ($ millions)
Private foreign direct investment, net (% of GDP)
Gross f ixed capital formation (% of GDP)
Gross f ixed private capital formation (% of GDP)
Finance and banking
Government cash surplus or deficit (% of GDP)
Government debt (% of GDP)
Deposit money banks’ assets (% of GDP) Total f inancial system deposits (% of GDP)
Bank capital to asset ratio (%)
Bank nonperforming loans to total gross loans ratio (%)
Domestic credit to the private sector (% of GDP)
Real interest rate (%)
Interest rate spread (percentage points)
Infrastructure
Paved roads (% of total roads)Electr ic power consumption (kWh per capita)
Power outages in a typical month (number)
Mobile cellular subscriptions (per 100 people)
Internet users (per 100 people)
14 2011 The Little Data Book on Private Sector Development
Low and middle income
2000 2009
5,033.9 5,658.7
2,250.3 2,629.2
5.3 6.5
1,128 2,9684.1 6.4
12.1 10.0
35.1 34.7
21.2 20.8
52.8 55.2
27.0 26.9
25.5 26.4
.. 39
.. 8
.. 55.7
.. 3.3
.. 51.1
19.2
40,472 127,613
2.6 2.2
22.5 27.2
13.2 18.4
-2.3 -1.5
.. ..
62.0 85.938.4 51.3
.. ..
12.0 5.3
49.4 72.0
8.7 6.8
24.3 ..975 1,505
4.3 60.7
1.5 18.1
8/6/2019 The Little Data Book on Private Sector Development 2011
http://slidepdf.com/reader/full/the-little-data-book-on-private-sector-development-2011 23/246
Economic and social context
Population (millions)
Labor force (millions)
Unemployment rate (% of labor force)
GNI per capita, World Bank Atlas method ($)GDP growth, 1995–2000 and 2000–09 (average annual %)
Agriculture value added (% of GDP)
Industry value added (% of GDP)
Manufacturing value added (% of GDP)
Services value added (% of GDP)
Inflation (annual % change in consumer price index)
Exchange rate (local currency units per $)
Exports of goods and services (% of GDP)
Imports of goods and services (% of GDP) Investment climate
Ease of doing business index (ranking 1–183; 1 = best)
Time to star t a business (days)
Procedures to start a business (number)
Firing cost (weeks of wages)
Closing a business (years to resolve insolvency)
Total tax rate (% of profit)
Profit tax (% of commercial profits)New businesses registered (thousands)
New business density (new regis. per working-age pop.)
Enterprise surveys
Time dealing with gov’t officials (% of management time)
Firms expected to give gifts in meetings w/tax officials (%)
Firms using banks to finance investments (% of firms)
Delay in obtaining an electrical connection (days)
ISO certi fication ownership (% of firms)
Private sector investment
Invest. in infrastructure w/private participation ($ millions)
Private foreign direct investment, net (% of GDP)
Gross f ixed capital formation (% of GDP)
Gross f ixed private capital formation (% of GDP)
Finance and banking
Government cash surplus or deficit (% of GDP)
Government debt (% of GDP)
Deposit money banks’ assets (% of GDP) Total f inancial system deposits (% of GDP)
Bank capital to asset ratio (%)
Bank nonperforming loans to total gross loans ratio (%)
Domestic credit to the private sector (% of GDP)
Real interest rate (%)
Interest rate spread (percentage points)
Infrastructure
Paved roads (% of total roads)Electr ic power consumption (kWh per capita)
Power outages in a typical month (number)
Mobile cellular subscriptions (per 100 people)
Internet users (per 100 people)
15The Little Data Book on Private Sector Development 2011
Euro area
2000 2009
311.6 327.3
143.9 158.5
9.2 9.4
21,980 38,8722.8 1.5
2.5 1.5
27.8 24.1
19.9 15.3
69.7 74.3
36.6 36.3
36.0 34.8
.. 14
.. 6
.. 36.4
.. 1.7
.. 45.7
13.5
.. ..
11.6 3.0
21.4 19.5
.. ..
0.1 -5.2
58.9 69.9
118.3 151.474.7 106.5
6.4 6.5
2.6 3.6
97.7 133.1
4.2 3.5
91.8 100.06,363 6,970
60.3 123.2
22.8 67.3
8/6/2019 The Little Data Book on Private Sector Development 2011
http://slidepdf.com/reader/full/the-little-data-book-on-private-sector-development-2011 24/246
Economic and social context
Population (millions)
Labor force (millions)
Unemployment rate (% of labor force)
GNI per capita, World Bank Atlas method ($)GDP growth, 1995–2000 and 2000–09 (average annual %)
Agriculture value added (% of GDP)
Industry value added (% of GDP)
Manufacturing value added (% of GDP)
Services value added (% of GDP)
Inflation (annual % change in consumer price index)
Exchange rate (local currency units per $)
Exports of goods and services (% of GDP)
Imports of goods and services (% of GDP) Investment climate
Ease of doing business index (ranking 1–183; 1 = best)
Time to star t a business (days)
Procedures to start a business (number)
Firing cost (weeks of wages)
Closing a business (years to resolve insolvency)
Total tax rate (% of profit)
Profit tax (% of commercial profits)New businesses registered (thousands)
New business density (new regis. per working-age pop.)
Enterprise surveys
Time dealing with gov’t officials (% of management time)
Firms expected to give gifts in meetings w/tax officials (%)
Firms using banks to finance investments (% of firms)
Delay in obtaining an electrical connection (days)
ISO certif ication ownership (% of firms)
Private sector investment
Invest. in infrastructure w/private participation ($ millions)
Private foreign direct investment, net (% of GDP)
Gross f ixed capital formation (% of GDP)
Gross f ixed private capital formation (% of GDP)
Finance and banking
Government cash surplus or deficit (% of GDP)
Government debt (% of GDP)
Deposit money banks’ assets (% of GDP) Total f inancial system deposits (% of GDP)
Bank capital to asset ratio (%)
Bank nonperforming loans to total gross loans ratio (%)
Domestic credit to the private sector (% of GDP)
Real interest rate (%)
Interest rate spread (percentage points)
Infrastructure
Paved roads (% of total roads)Electr ic power consumption (kWh per capita)
Power outages in a typical month (number)
Mobile cellular subscriptions (per 100 people)
Internet users (per 100 people)
16 2011 The Little Data Book on Private Sector Development
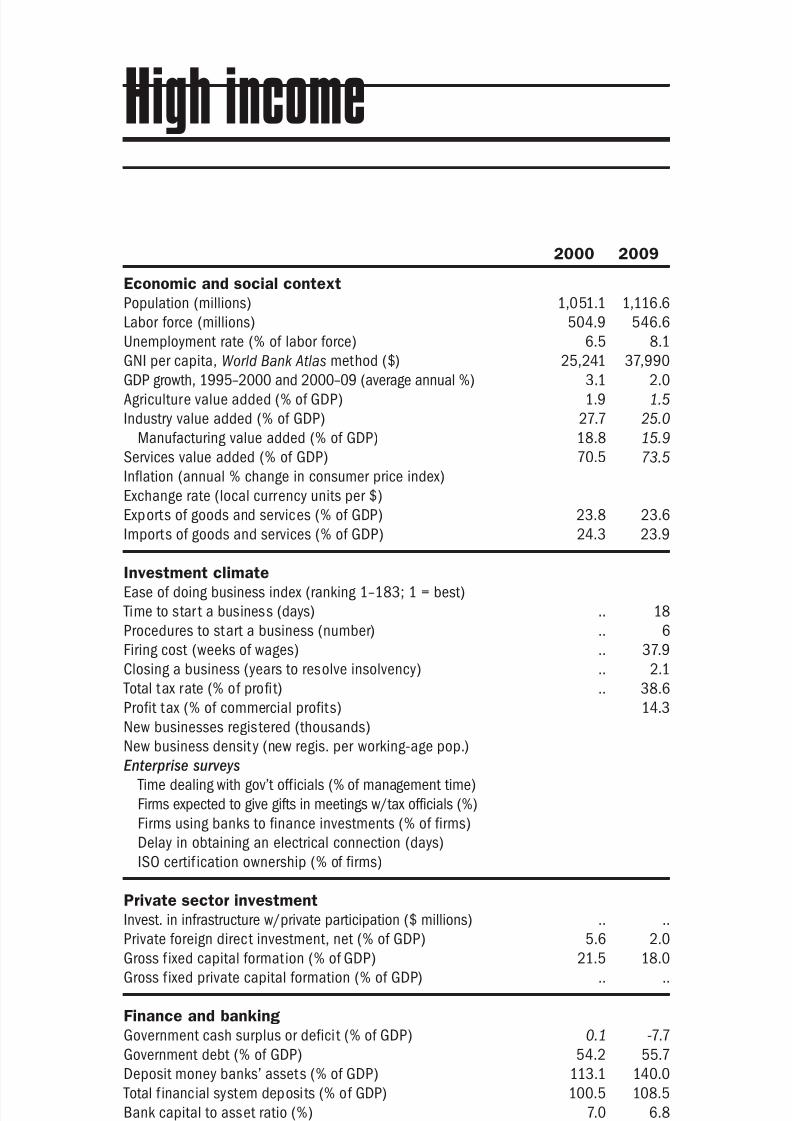
High income
2000 2009
1,051.1 1,116.6
504.9 546.6
6.5 8.1
25,241 37,9903.1 2.0
1.9 1.5
27.7 25.0
18.8 15.9
70.5 73.5
23.8 23.6
24.3 23.9
.. 18
.. 6
.. 37.9
.. 2.1
.. 38.6
14.3
.. ..
5.6 2.0
21.5 18.0
.. ..
0.1 -7.7
54.2 55.7
113.1 140.0100.5 108.5
7.0 6.8
4.4 3.4
147.0 165.1
4.3 3.8
88.5 93.48,939 9,518
49.9 111.2
30.5 72.3
8/6/2019 The Little Data Book on Private Sector Development 2011
http://slidepdf.com/reader/full/the-little-data-book-on-private-sector-development-2011 25/246
17The Little Data Book on Private Sector Development 2011
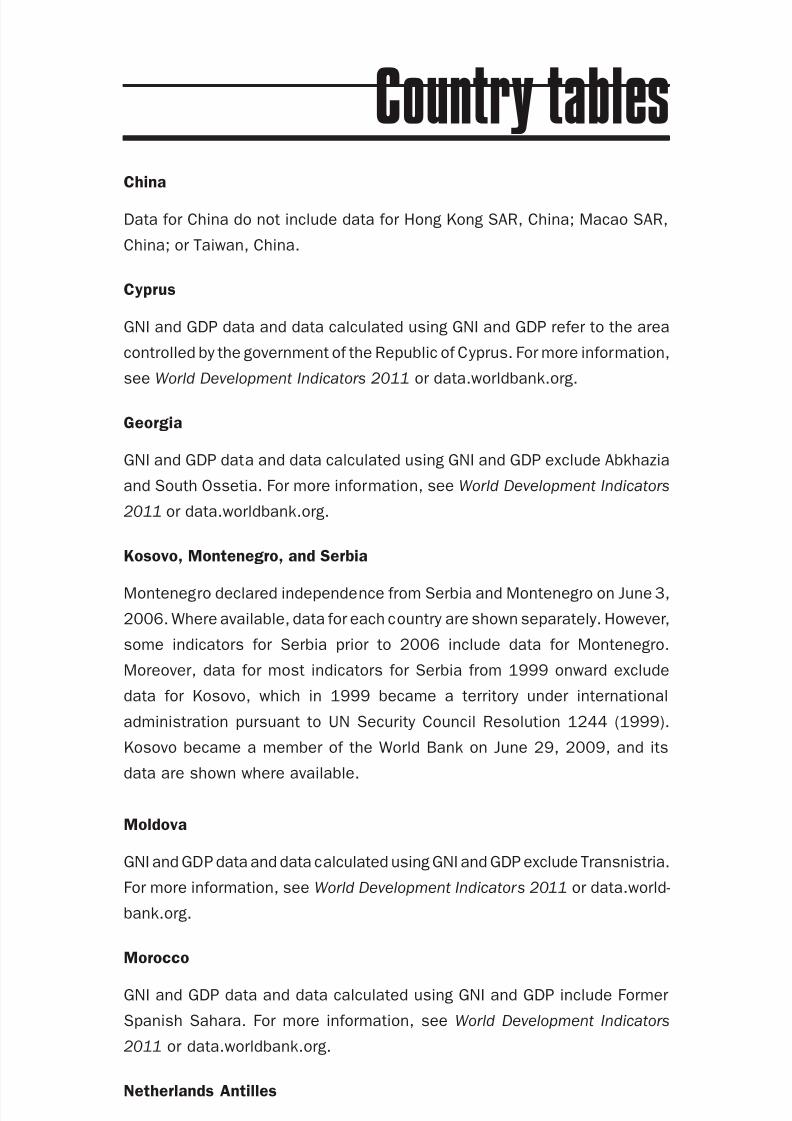
China
Data for China do not include data for Hong Kong SAR, China; Macao SAR,
China; or Taiwan, China.
Cyprus
GNI and GDP data and data calculated using GNI and GDP refer to the area
controlled by the government of the Republic of Cyprus. For more information,see World Development Indicators 2011 or data.worldbank.org.
Georgia
GNI and GDP data and data calculated using GNI and GDP exclude Abkhazia
and South Ossetia. For more information, see World Development Indicators
2011 or data.worldbank.org.
Kosovo, Montenegro, and Serbia
Montenegro declared independence from Serbia and Montenegro on June 3,
2006. Where available, data for each country are shown separately. However,
some indicators for Serbia prior to 2006 include data for Montenegro.
Moreover, data for most indicators for Serbia from 1999 onward exclude
data for Kosovo, which in 1999 became a territory under international
administration pursuant to UN Security Council Resolution 1244 (1999).
Kosovo became a member of the World Bank on June 29, 2009, and its
data are shown where available.
Moldova
GNI and GDP data and data calculated using GNI and GDP exclude Transnistria.
For more information, see World Development Indicators 2011 or data.world-bank.org.
Morocco
GNI and GDP data and data calculated using GNI and GDP include Former
Spanish Sahara. For more information, see World Development Indicators
2011 or data.worldbank.org.
Netherlands Antilles
Netherlands Antilles ceased to exist on October 10, 2010. Curacao and St.
Maarten became countries within the Kingdom of Netherlands. Bonaire,
St. Eustatius, and Saba became special municipalities of the Netherlands.
Tanzania
GNI and GDP data and data calculated using GNI and GDP refer to mainland
Tanzania only. For more information, see World Development Indicators 2011
or data.worldbank.org.
Country tables
8/6/2019 The Little Data Book on Private Sector Development 2011
http://slidepdf.com/reader/full/the-little-data-book-on-private-sector-development-2011 26/246
Economic and social context
Population (millions)
Labor force (millions)
Unemployment rate (% of labor force)
GNI per capita, World Bank Atlas method ($)GDP growth, 1995–2000 and 2000–09 (average annual %)
Agriculture value added (% of GDP)
Industry value added (% of GDP)
Manufacturing value added (% of GDP)
Services value added (% of GDP)
Inflation (annual % change in consumer price index)
Exchange rate (local currency units per $)
Exports of goods and services (% of GDP)
Imports of goods and services (% of GDP) Investment climate
Ease of doing business index (ranking 1–183; 1 = best)
Time to star t a business (days)
Procedures to start a business (number)
Firing cost (weeks of wages)
Closing a business (years to resolve insolvency)
Total tax rate (% of profit)
Profit tax (% of commercial profits)New businesses registered (thousands)
New business density (new regis. per working-age pop.)
Enterprise surveys
Time dealing with gov’t officials (% of management time)
Firms expected to give gifts in meetings w/tax officials (%)
Firms using banks to finance investments (% of firms)
Delay in obtaining an electrical connection (days)
ISO certif ication ownership (% of firms)
Private sector investment
Invest. in infrastructure w/private participation ($ millions)
Private foreign direct investment, net (% of GDP)
Gross f ixed capital formation (% of GDP)
Gross f ixed private capital formation (% of GDP)
Finance and banking
Government cash surplus or deficit (% of GDP)
Government debt (% of GDP)
Deposit money banks’ assets (% of GDP) Total f inancial system deposits (% of GDP)
Bank capital to asset ratio (%)
Bank nonperforming loans to total gross loans ratio (%)
Domestic credit to the private sector (% of GDP)
Real interest rate (%)
Interest rate spread (percentage points)
Infrastructure
Paved roads (% of total roads)Electr ic power consumption (kWh per capita)
Power outages in a typical month (number)
Mobile cellular subscriptions (per 100 people)
Internet users (per 100 people)
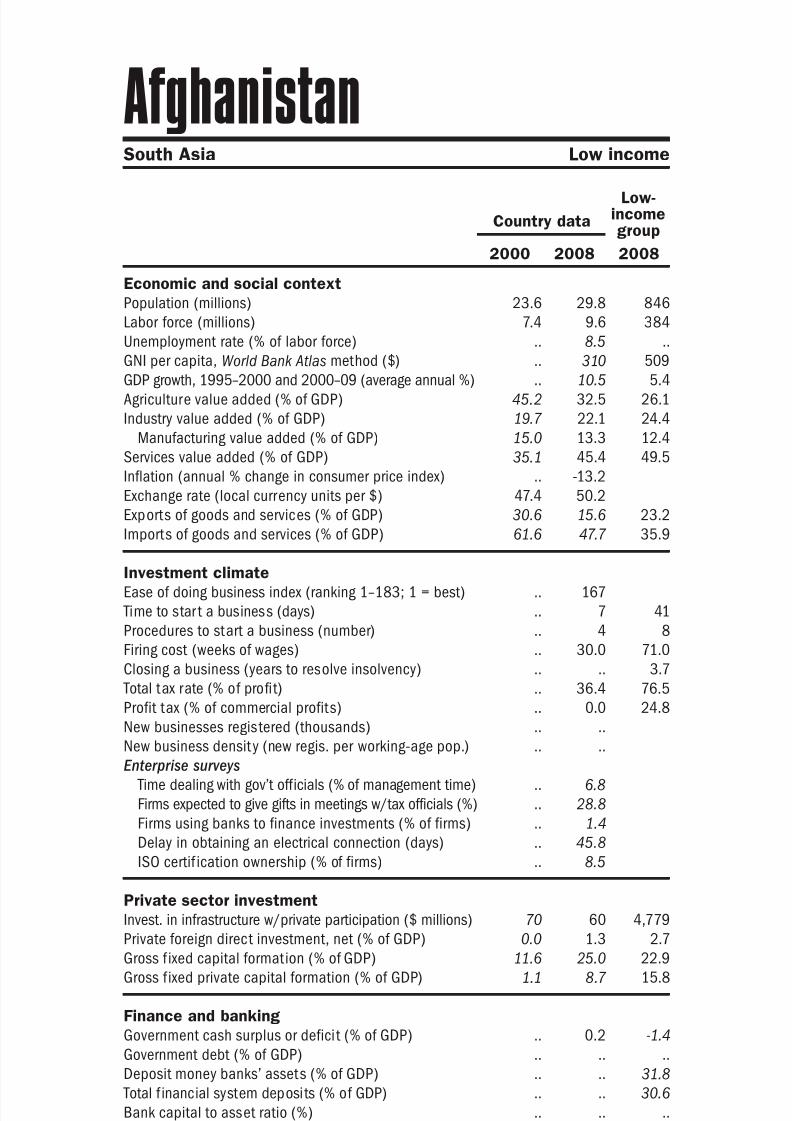
18 2011 The Little Data Book on Private Sector Development
Country data
Low-incomegroup
2000 2008 2008
AfghanistanSouth Asia Low income
23.6 29.8 846
7.4 9.6 384
.. 8.5 ..
.. 310 509
.. 10.5 5.4
45.2 32.5 26.1
19.7 22.1 24.4
15.0 13.3 12.4
35.1 45.4 49.5
.. -13.2
47.4 50.2
30.6 15.6 23.2
61.6 47.7 35.9
.. 167
.. 7 41
.. 4 8
.. 30.0 71.0
.. .. 3.7
.. 36.4 76.5
.. 0.0 24.8.. ..
.. ..
.. 6.8
.. 28.8
.. 1.4
.. 45.8
.. 8.5
70 60 4,779
0.0 1.3 2.7
11.6 25.0 22.9
1.1 8.7 15.8
.. 0.2 -1.4
.. .. ..
.. .. 31.8
.. .. 30.6
.. .. ..
.. .. ..
.. 9.1 26.3
.. 36.1
.. .. 11.5
.. 29.3 12.0
.. .. 231
.. 20.3
0.0 40.3 26.6
0.0 3.4 2.7
8/6/2019 The Little Data Book on Private Sector Development 2011
http://slidepdf.com/reader/full/the-little-data-book-on-private-sector-development-2011 27/246
Economic and social context
Population (millions)
Labor force (millions)
Unemployment rate (% of labor force)
GNI per capita, World Bank Atlas method ($)GDP growth, 1995–2000 and 2000–09 (average annual %)
Agriculture value added (% of GDP)
Industry value added (% of GDP)
Manufacturing value added (% of GDP)
Services value added (% of GDP)
Inflation (annual % change in consumer price index)
Exchange rate (local currency units per $)
Exports of goods and services (% of GDP)
Imports of goods and services (% of GDP) Investment climate
Ease of doing business index (ranking 1–183; 1 = best)
Time to star t a business (days)
Procedures to start a business (number)
Firing cost (weeks of wages)
Closing a business (years to resolve insolvency)
Total tax rate (% of profit)
Profit tax (% of commercial profits)New businesses registered (thousands)
New business density (new regis. per working-age pop.)
Enterprise surveys
Time dealing with gov’t officials (% of management time)
Firms expected to give gifts in meetings w/tax officials (%)
Firms using banks to finance investments (% of firms)
Delay in obtaining an electrical connection (days)
ISO certi fication ownership (% of firms)
Private sector investment
Invest. in infrastructure w/private participation ($ millions)
Private foreign direct investment, net (% of GDP)
Gross f ixed capital formation (% of GDP)
Gross f ixed private capital formation (% of GDP)
Finance and banking
Government cash surplus or deficit (% of GDP)
Government debt (% of GDP)
Deposit money banks’ assets (% of GDP) Total f inancial system deposits (% of GDP)
Bank capital to asset ratio (%)
Bank nonperforming loans to total gross loans ratio (%)
Domestic credit to the private sector (% of GDP)
Real interest rate (%)
Interest rate spread (percentage points)
Infrastructure
Paved roads (% of total roads)Electr ic power consumption (kWh per capita)
Power outages in a typical month (number)
Mobile cellular subscriptions (per 100 people)
Internet users (per 100 people)
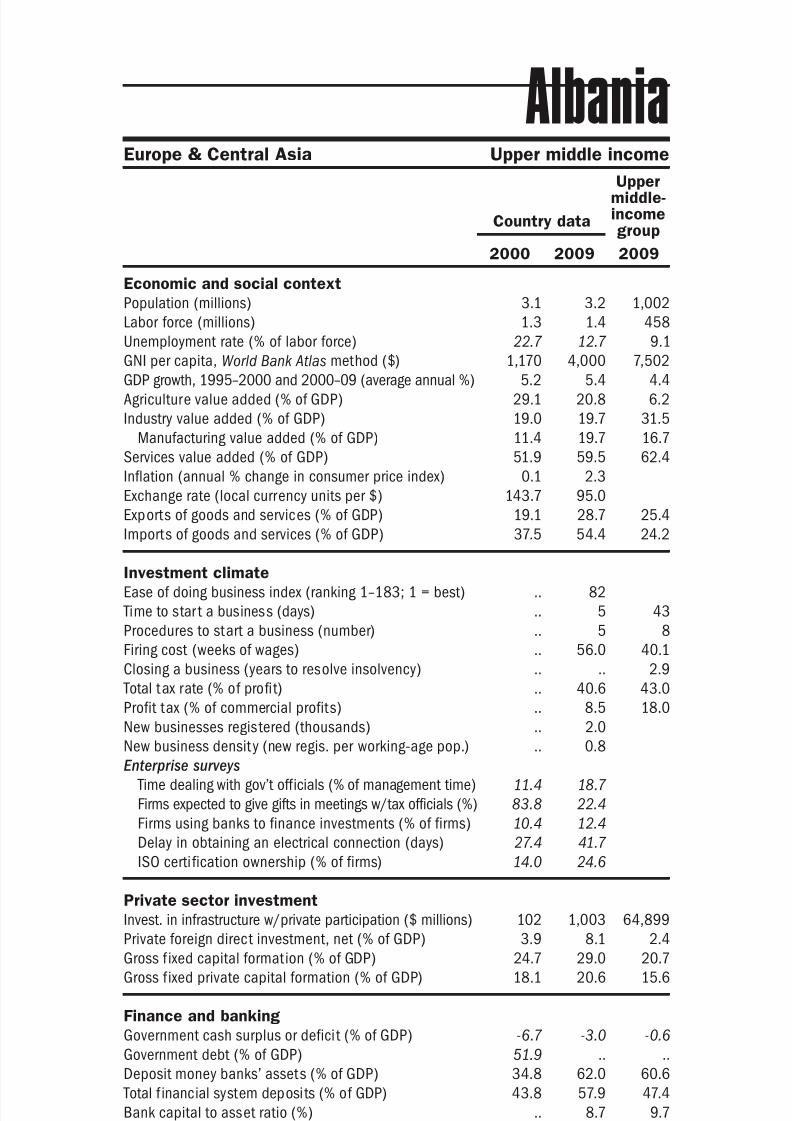
19The Little Data Book on Private Sector Development 2011
Europe & Central Asia Upper middle income
Country data
Uppermiddle-incomegroup
2000 2009 2009
Albania
3.1 3.2 1,002
1.3 1.4 458
22.7 12.7 9.1
1,170 4,000 7,5025.2 5.4 4.4
29.1 20.8 6.2
19.0 19.7 31.5
11.4 19.7 16.7
51.9 59.5 62.4
0.1 2.3
143.7 95.0
19.1 28.7 25.4
37.5 54.4 24.2
.. 82
.. 5 43
.. 5 8
.. 56.0 40.1
.. .. 2.9
.. 40.6 43.0
.. 8.5 18.0.. 2.0
.. 0.8
11.4 18.7
83.8 22.4
10.4 12.4
27.4 41.7
14.0 24.6
102 1,003 64,899
3.9 8.1 2.4
24.7 29.0 20.7
18.1 20.6 15.6
-6.7 -3.0 -0.6
51.9 .. ..
34.8 62.0 60.643.8 57.9 47.4
.. 8.7 9.7
.. 10.5 4.2
4.7 37.0 47.8
17.0 10.1
13.8 5.9 5.5
39.0 .. 36.81,218 1,372 3,001
.. 37.8
1.0 131.9 100.6
0.1 41.2 34.6
8/6/2019 The Little Data Book on Private Sector Development 2011
http://slidepdf.com/reader/full/the-little-data-book-on-private-sector-development-2011 28/246
Economic and social context
Population (millions)
Labor force (millions)
Unemployment rate (% of labor force)
GNI per capita, World Bank Atlas method ($)GDP growth, 1995–2000 and 2000–09 (average annual %)
Agriculture value added (% of GDP)
Industry value added (% of GDP)
Manufacturing value added (% of GDP)
Services value added (% of GDP)
Inflation (annual % change in consumer price index)
Exchange rate (local currency units per $)
Exports of goods and services (% of GDP)
Imports of goods and services (% of GDP) Investment climate
Ease of doing business index (ranking 1–183; 1 = best)
Time to star t a business (days)
Procedures to start a business (number)
Firing cost (weeks of wages)
Closing a business (years to resolve insolvency)
Total tax rate (% of profit)
Profit tax (% of commercial profits)New businesses registered (thousands)
New business density (new regis. per working-age pop.)
Enterprise surveys
Time dealing with gov’t officials (% of management time)
Firms expected to give gifts in meetings w/tax officials (%)
Firms using banks to finance investments (% of firms)
Delay in obtaining an electrical connection (days)
ISO certif ication ownership (% of firms)
Private sector investment
Invest. in infrastructure w/private participation ($ millions)
Private foreign direct investment, net (% of GDP)
Gross f ixed capital formation (% of GDP)
Gross f ixed private capital formation (% of GDP)
Finance and banking
Government cash surplus or deficit (% of GDP)
Government debt (% of GDP)
Deposit money banks’ assets (% of GDP) Total f inancial system deposits (% of GDP)
Bank capital to asset ratio (%)
Bank nonperforming loans to total gross loans ratio (%)
Domestic credit to the private sector (% of GDP)
Real interest rate (%)
Interest rate spread (percentage points)
Infrastructure
Paved roads (% of total roads)Electr ic power consumption (kWh per capita)
Power outages in a typical month (number)
Mobile cellular subscriptions (per 100 people)
Internet users (per 100 people)
20 2011 The Little Data Book on Private Sector Development
Country data
Uppermiddle-incomegroup
2000 2009 2009
Middle East & North Africa Upper middle income
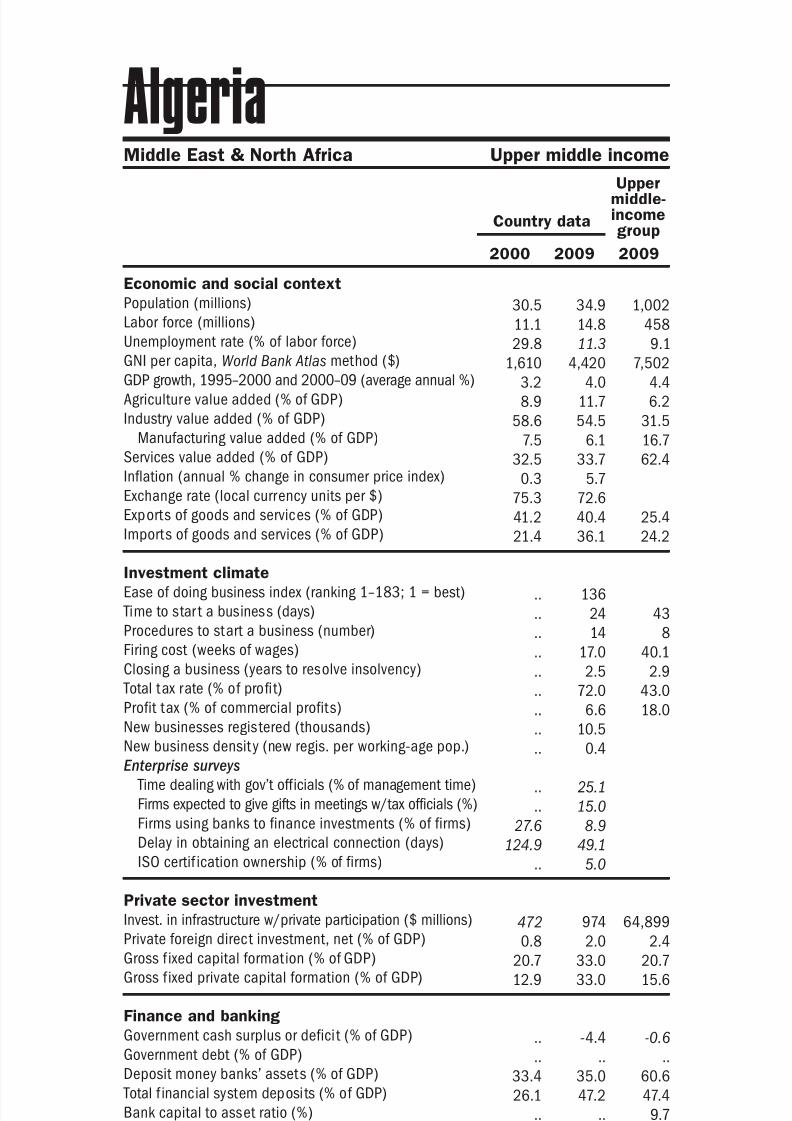
Algeria
30.5 34.9 1,002
11.1 14.8 458
29.8 11.3 9.1
1,610 4,420 7,502
3.2 4.0 4.4
8.9 11.7 6.2
58.6 54.5 31.5
7.5 6.1 16.7
32.5 33.7 62.4
0.3 5.7
75.3 72.6
41.2 40.4 25.4
21.4 36.1 24.2
.. 136
.. 24 43
.. 14 8
.. 17.0 40.1
.. 2.5 2.9
.. 72.0 43.0
.. 6.6 18.0
.. 10.5
.. 0.4
.. 25.1
.. 15.0
27.6 8.9
124.9 49.1
.. 5.0
472 974 64,899
0.8 2.0 2.4
20.7 33.0 20.7
12.9 33.0 15.6
.. -4.4 -0.6
.. .. ..
33.4 35.0 60.626.1 47.2 47.4
.. .. 9.7
.. .. 4.2
6.0 16.2 47.8
-11.7 19.2
2.5 6.3 5.5
68.9 73.5 36.8695 957 3,001
.. 4.8
0.3 93.8 100.6
0.5 13.5 34.6

8/6/2019 The Little Data Book on Private Sector Development 2011
http://slidepdf.com/reader/full/the-little-data-book-on-private-sector-development-2011 29/246
Economic and social context
Population (millions)
Labor force (millions)
Unemployment rate (% of labor force)
GNI per capita, World Bank Atlas method ($)GDP growth, 1995–2000 and 2000–09 (average annual %)
Agriculture value added (% of GDP)
Industry value added (% of GDP)
Manufacturing value added (% of GDP)
Services value added (% of GDP)
Inflation (annual % change in consumer price index)
Exchange rate (local currency units per $)
Exports of goods and services (% of GDP)
Imports of goods and services (% of GDP) Investment climate
Ease of doing business index (ranking 1–183; 1 = best)
Time to star t a business (days)
Procedures to start a business (number)
Firing cost (weeks of wages)
Closing a business (years to resolve insolvency)
Total tax rate (% of profit)
Profit tax (% of commercial profits)New businesses registered (thousands)
New business density (new regis. per working-age pop.)
Enterprise surveys
Time dealing with gov’t officials (% of management time)
Firms expected to give gifts in meetings w/tax officials (%)
Firms using banks to finance investments (% of firms)
Delay in obtaining an electrical connection (days)
ISO certi fication ownership (% of firms)
Private sector investment
Invest. in infrastructure w/private participation ($ millions)
Private foreign direct investment, net (% of GDP)
Gross f ixed capital formation (% of GDP)
Gross f ixed private capital formation (% of GDP)
Finance and banking
Government cash surplus or deficit (% of GDP)
Government debt (% of GDP)
Deposit money banks’ assets (% of GDP) Total f inancial system deposits (% of GDP)
Bank capital to asset ratio (%)
Bank nonperforming loans to total gross loans ratio (%)
Domestic credit to the private sector (% of GDP)
Real interest rate (%)
Interest rate spread (percentage points)
Infrastructure
Paved roads (% of total roads)Electr ic power consumption (kWh per capita)
Power outages in a typical month (number)
Mobile cellular subscriptions (per 100 people)
Internet users (per 100 people)
21The Little Data Book on Private Sector Development 2011
Country data
Uppermiddle-incomegroup
2000 2009 2009
East Asia & Pacific Upper middle income
American Samoa
0.06 0.07 1,002
.. .. 458
5.1 .. 9.1
.. .. 7,502
.. .. 4.4
.. .. 6.2
.. .. 31.5
.. .. 16.7
.. .. 62.4
.. ..
.. ..
.. .. 25.4
.. .. 24.2
.. ..
.. .. 43
.. .. 8
.. .. 40.1
.. .. 2.9
.. .. 43.0
.. .. 18.0.. ..
.. ..
.. ..
.. ..
.. ..
.. ..
.. ..
.. .. 64,899
.. .. 2.4
.. .. 20.7
.. .. 15.6
.. .. -0.6
.. .. ..
.. .. 60.6
.. .. 47.4
.. .. 9.7
.. .. 4.2
.. .. 47.8
.. ..
.. .. 5.5
.. .. 36.8
.. .. 3,001
.. ..
3.5 3.6 100.6
.. .. 34.6

8/6/2019 The Little Data Book on Private Sector Development 2011
http://slidepdf.com/reader/full/the-little-data-book-on-private-sector-development-2011 30/246
Economic and social context
Population (millions)
Labor force (millions)
Unemployment rate (% of labor force)
GNI per capita, World Bank Atlas method ($)GDP growth, 1995–2000 and 2000–09 (average annual %)
Agriculture value added (% of GDP)
Industry value added (% of GDP)
Manufacturing value added (% of GDP)
Services value added (% of GDP)
Inflation (annual % change in consumer price index)
Exchange rate (local currency units per $)
Exports of goods and services (% of GDP)
Imports of goods and services (% of GDP) Investment climate
Ease of doing business index (ranking 1–183; 1 = best)
Time to star t a business (days)
Procedures to start a business (number)
Firing cost (weeks of wages)
Closing a business (years to resolve insolvency)
Total tax rate (% of profit)
Profit tax (% of commercial profits)New businesses registered (thousands)
New business density (new regis. per working-age pop.)
Enterprise surveys
Time dealing with gov’t officials (% of management time)
Firms expected to give gifts in meetings w/tax officials (%)
Firms using banks to finance investments (% of firms)
Delay in obtaining an electrical connection (days)
ISO certif ication ownership (% of firms)
Private sector investment
Invest. in infrastructure w/private participation ($ millions)
Private foreign direct investment, net (% of GDP)
Gross f ixed capital formation (% of GDP)
Gross f ixed private capital formation (% of GDP)
Finance and banking
Government cash surplus or deficit (% of GDP)
Government debt (% of GDP)
Deposit money banks’ assets (% of GDP) Total f inancial system deposits (% of GDP)
Bank capital to asset ratio (%)
Bank nonperforming loans to total gross loans ratio (%)
Domestic credit to the private sector (% of GDP)
Real interest rate (%)
Interest rate spread (percentage points)
Infrastructure
Paved roads (% of total roads)Electr ic power consumption (kWh per capita)
Power outages in a typical month (number)
Mobile cellular subscriptions (per 100 people)
Internet users (per 100 people)
22 2011 The Little Data Book on Private Sector Development
Country data
High-incomegroup
2000 2009 2009
High income
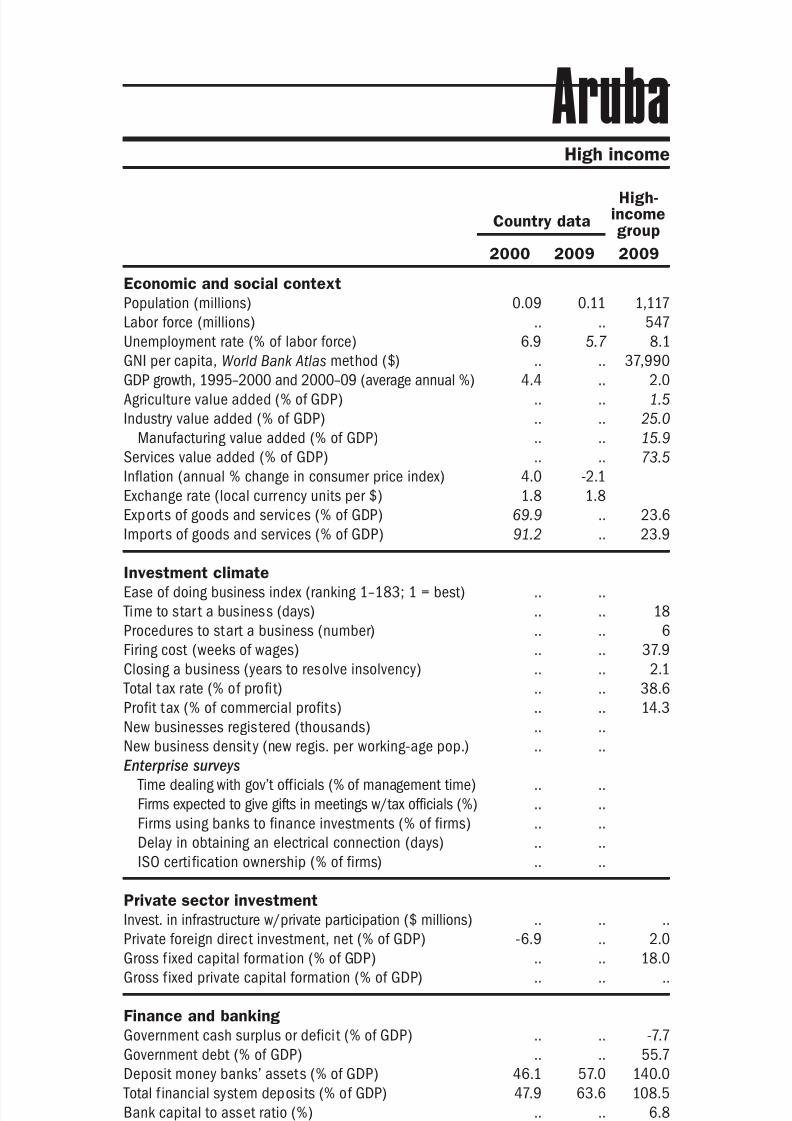
Andorra
.. 0.09 1,117
.. .. 547
.. .. 8.1
.. 41,130 37,9904.6 5.9 2.0
.. .. 1.5
.. .. 25.0
.. .. 15.9
.. .. 73.5
.. ..
.. ..
.. .. 23.6
.. .. 23.9
.. ..
.. .. 18
.. .. 6
.. .. 37.9
.. .. 2.1
.. .. 38.6
.. .. 14.3.. ..
.. ..
.. ..
.. ..
.. ..
.. ..
.. ..
.. .. ..
.. .. 2.0
.. .. 18.0
.. .. ..
.. .. -7.7
.. .. 55.7
.. .. 140.0
.. .. 108.5
.. .. 6.8
.. .. 3.4
.. .. 165.1
.. ..
.. .. 3.8
.. .. 93.4
.. .. 9,518
.. ..
.. 76.6 111.2
.. 70.5 72.3
8/6/2019 The Little Data Book on Private Sector Development 2011
http://slidepdf.com/reader/full/the-little-data-book-on-private-sector-development-2011 31/246
Economic and social context
Population (millions)
Labor force (millions)
Unemployment rate (% of labor force)
GNI per capita, World Bank Atlas method ($)GDP growth, 1995–2000 and 2000–09 (average annual %)
Agriculture value added (% of GDP)
Industry value added (% of GDP)
Manufacturing value added (% of GDP)
Services value added (% of GDP)
Inflation (annual % change in consumer price index)
Exchange rate (local currency units per $)
Exports of goods and services (% of GDP)
Imports of goods and services (% of GDP) Investment climate
Ease of doing business index (ranking 1–183; 1 = best)
Time to star t a business (days)
Procedures to start a business (number)
Firing cost (weeks of wages)
Closing a business (years to resolve insolvency)
Total tax rate (% of profit)
Profit tax (% of commercial profits)New businesses registered (thousands)
New business density (new regis. per working-age pop.)
Enterprise surveys
Time dealing with gov’t officials (% of management time)
Firms expected to give gifts in meetings w/tax officials (%)
Firms using banks to finance investments (% of firms)
Delay in obtaining an electrical connection (days)
ISO certi fication ownership (% of firms)
Private sector investment
Invest. in infrastructure w/private participation ($ millions)
Private foreign direct investment, net (% of GDP)
Gross f ixed capital formation (% of GDP)
Gross f ixed private capital formation (% of GDP)
Finance and banking
Government cash surplus or deficit (% of GDP)
Government debt (% of GDP)
Deposit money banks’ assets (% of GDP) Total f inancial system deposits (% of GDP)
Bank capital to asset ratio (%)
Bank nonperforming loans to total gross loans ratio (%)
Domestic credit to the private sector (% of GDP)
Real interest rate (%)
Interest rate spread (percentage points)
Infrastructure
Paved roads (% of total roads)Electr ic power consumption (kWh per capita)
Power outages in a typical month (number)
Mobile cellular subscriptions (per 100 people)
Internet users (per 100 people)
23The Little Data Book on Private Sector Development 2011
Sub-Saharan Africa Lower middle income
Country data
Lowermiddle-incomegroup
2000 2009 2009
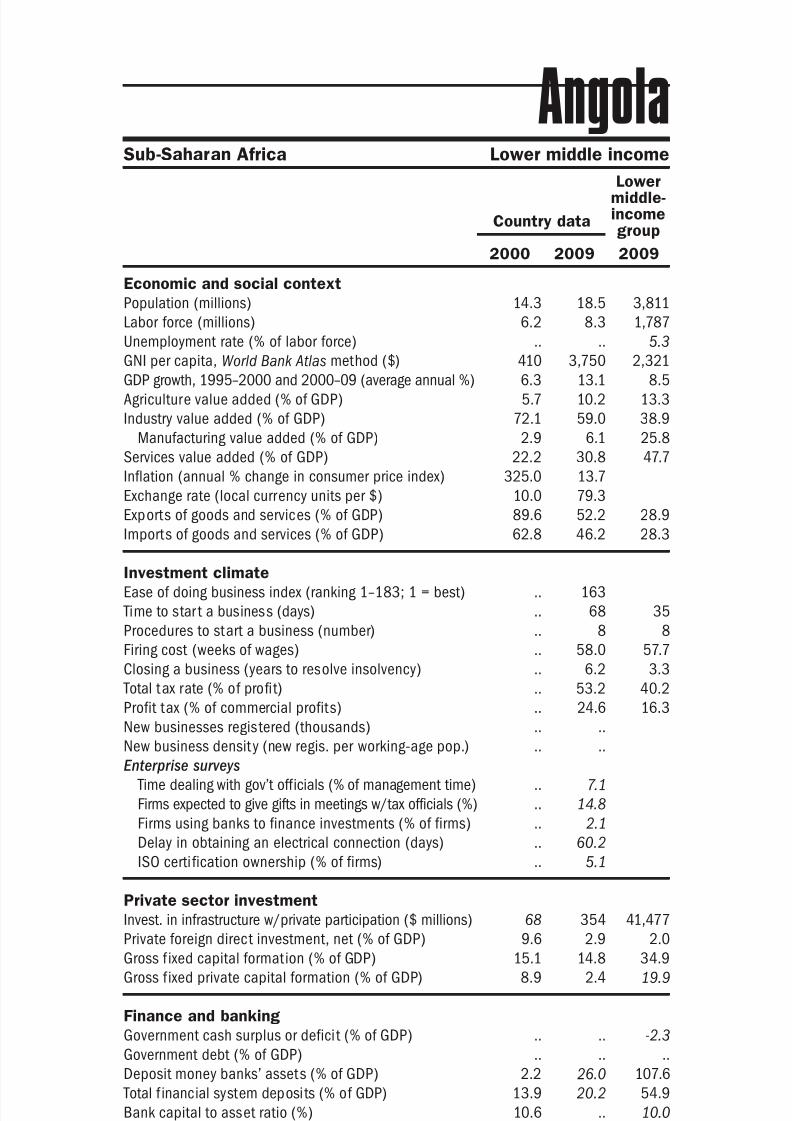
Angola
14.3 18.5 3,811
6.2 8.3 1,787
.. .. 5.3
410 3,750 2,3216.3 13.1 8.5
5.7 10.2 13.3
72.1 59.0 38.9
2.9 6.1 25.8
22.2 30.8 47.7
325.0 13.7
10.0 79.3
89.6 52.2 28.9
62.8 46.2 28.3
.. 163
.. 68 35
.. 8 8
.. 58.0 57.7
.. 6.2 3.3
.. 53.2 40.2
.. 24.6 16.3.. ..
.. ..
.. 7.1
.. 14.8
.. 2.1
.. 60.2
.. 5.1
68 354 41,477
9.6 2.9 2.0
15.1 14.8 34.9
8.9 2.4 19.9
.. .. -2.3
.. .. ..
2.2 26.0 107.613.9 20.2 54.9
10.6 .. 10.0
10.4 .. 5.1
2.0 21.2 92.9
-60.8 22.8
63.6 8.1 7.3
10.4 .. 36.386 189 1,318
.. 7.6
0.2 43.8 57.8
0.1 3.3 17.2
8/6/2019 The Little Data Book on Private Sector Development 2011
http://slidepdf.com/reader/full/the-little-data-book-on-private-sector-development-2011 32/246
Economic and social context
Population (millions)
Labor force (millions)
Unemployment rate (% of labor force)
GNI per capita, World Bank Atlas method ($)GDP growth, 1995–2000 and 2000–09 (average annual %)
Agriculture value added (% of GDP)
Industry value added (% of GDP)
Manufacturing value added (% of GDP)
Services value added (% of GDP)
Inflation (annual % change in consumer price index)
Exchange rate (local currency units per $)
Exports of goods and services (% of GDP)
Imports of goods and services (% of GDP) Investment climate
Ease of doing business index (ranking 1–183; 1 = best)
Time to star t a business (days)
Procedures to start a business (number)
Firing cost (weeks of wages)
Closing a business (years to resolve insolvency)
Total tax rate (% of profit)
Profit tax (% of commercial profits)New businesses registered (thousands)
New business density (new regis. per working-age pop.)
Enterprise surveys
Time dealing with gov’t officials (% of management time)
Firms expected to give gifts in meetings w/tax officials (%)
Firms using banks to finance investments (% of firms)
Delay in obtaining an electrical connection (days)
ISO certif ication ownership (% of firms)
Private sector investment
Invest. in infrastructure w/private participation ($ millions)
Private foreign direct investment, net (% of GDP)
Gross f ixed capital formation (% of GDP)
Gross f ixed private capital formation (% of GDP)
Finance and banking
Government cash surplus or deficit (% of GDP)
Government debt (% of GDP)
Deposit money banks’ assets (% of GDP) Total f inancial system deposits (% of GDP)
Bank capital to asset ratio (%)
Bank nonperforming loans to total gross loans ratio (%)
Domestic credit to the private sector (% of GDP)
Real interest rate (%)
Interest rate spread (percentage points)
Infrastructure
Paved roads (% of total roads)Electr ic power consumption (kWh per capita)
Power outages in a typical month (number)
Mobile cellular subscriptions (per 100 people)
Internet users (per 100 people)
24 2011 The Little Data Book on Private Sector Development
Country data
Uppermiddle-incomegroup
2000 2009 2009
Latin America & Caribbean Upper middle income
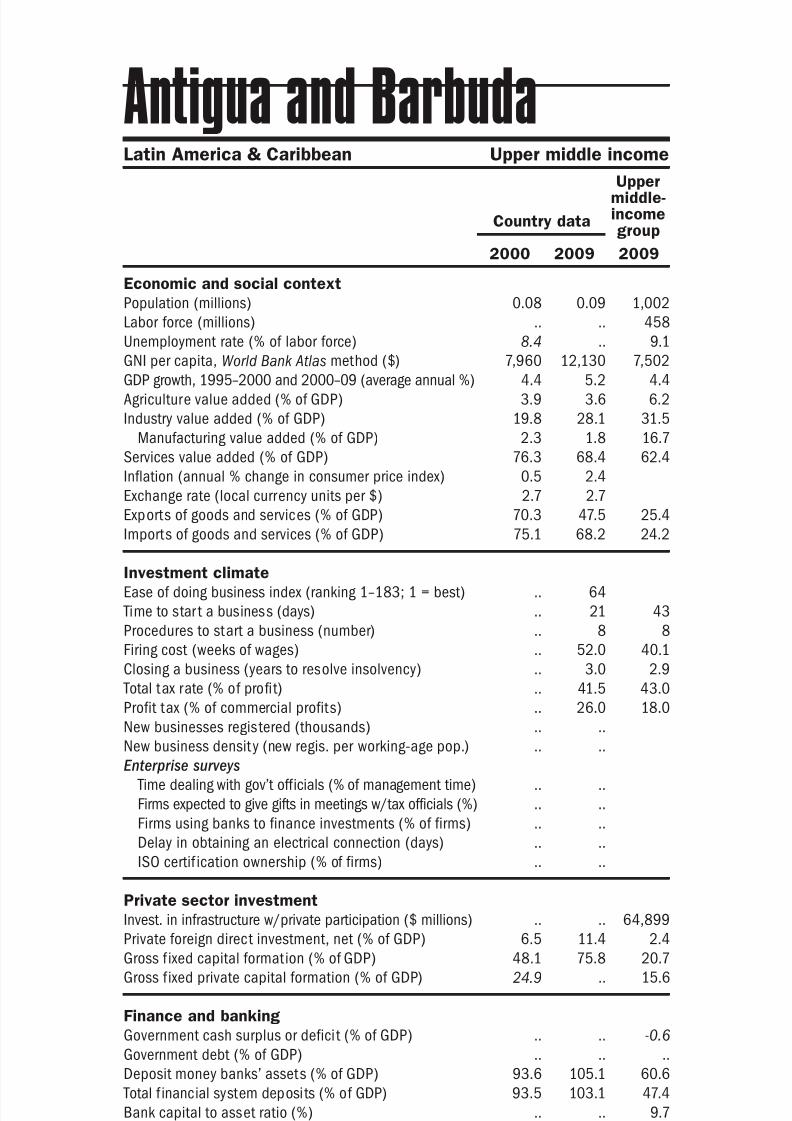
Antigua and Barbuda
0.08 0.09 1,002
.. .. 458
8.4 .. 9.1
7,960 12,130 7,5024.4 5.2 4.4
3.9 3.6 6.2
19.8 28.1 31.5
2.3 1.8 16.7
76.3 68.4 62.4
0.5 2.4
2.7 2.7
70.3 47.5 25.4
75.1 68.2 24.2
.. 64
.. 21 43
.. 8 8
.. 52.0 40.1
.. 3.0 2.9
.. 41.5 43.0
.. 26.0 18.0.. ..
.. ..
.. ..
.. ..
.. ..
.. ..
.. ..
.. .. 64,899
6.5 11.4 2.4
48.1 75.8 20.7
24.9 .. 15.6
.. .. -0.6
.. .. ..
93.6 105.1 60.693.5 103.1 47.4
.. .. 9.7
.. .. 4.2
72.9 80.6 47.8
11.7 7.1
7.0 6.6 5.5
33.0 .. 36.8.. .. 3,001
.. ..
28.5 154.0 100.6
6.5 74.2 34.6

8/6/2019 The Little Data Book on Private Sector Development 2011
http://slidepdf.com/reader/full/the-little-data-book-on-private-sector-development-2011 33/246
Economic and social context
Population (millions)
Labor force (millions)
Unemployment rate (% of labor force)
GNI per capita, World Bank Atlas method ($)GDP growth, 1995–2000 and 2000–09 (average annual %)
Agriculture value added (% of GDP)
Industry value added (% of GDP)
Manufacturing value added (% of GDP)
Services value added (% of GDP)
Inflation (annual % change in consumer price index)
Exchange rate (local currency units per $)
Exports of goods and services (% of GDP)
Imports of goods and services (% of GDP) Investment climate
Ease of doing business index (ranking 1–183; 1 = best)
Time to star t a business (days)
Procedures to start a business (number)
Firing cost (weeks of wages)
Closing a business (years to resolve insolvency)
Total tax rate (% of profit)
Profit tax (% of commercial profits)New businesses registered (thousands)
New business density (new regis. per working-age pop.)
Enterprise surveys
Time dealing with gov’t officials (% of management time)
Firms expected to give gifts in meetings w/tax officials (%)
Firms using banks to finance investments (% of firms)
Delay in obtaining an electrical connection (days)
ISO certi fication ownership (% of firms)
Private sector investment
Invest. in infrastructure w/private participation ($ millions)
Private foreign direct investment, net (% of GDP)
Gross f ixed capital formation (% of GDP)
Gross f ixed private capital formation (% of GDP)
Finance and banking
Government cash surplus or deficit (% of GDP)
Government debt (% of GDP)
Deposit money banks’ assets (% of GDP) Total f inancial system deposits (% of GDP)
Bank capital to asset ratio (%)
Bank nonperforming loans to total gross loans ratio (%)
Domestic credit to the private sector (% of GDP)
Real interest rate (%)
Interest rate spread (percentage points)
Infrastructure
Paved roads (% of total roads)Electr ic power consumption (kWh per capita)
Power outages in a typical month (number)
Mobile cellular subscriptions (per 100 people)
Internet users (per 100 people)
25The Little Data Book on Private Sector Development 2011
Latin America & Caribbean Upper middle income
Country data
Uppermiddle-incomegroup
2000 2009 2009
Argentina
36.9 40.3 1,002
16.3 19.6 458
15.0 8.6 9.1
7,460 7,550 7,5022.7 5.4 4.4
5.0 7.5 6.2
27.6 31.8 31.5
17.5 21.2 16.7
67.4 60.7 62.4
-0.9 6.3
1.0 3.7
10.9 21.4 25.4
11.5 16.0 24.2
.. 115
.. 26 43
.. 14 8
.. 95.0 40.1
.. 2.8 2.9
.. 108.2 43.0
.. 2.8 18.0.. 11.9
.. 0.5
.. 13.8
.. 4.3
.. 6.9
.. 45.9
.. 26.9
4,863 1,670 64,899
3.7 1.3 2.4
16.2 20.9 20.7
15.2 20.4 15.6
-5.7 -0.5 -0.6
.. .. ..
33.2 23.0 60.627.5 20.2 47.4
.. 13.3 9.7
16.0 3.0 4.2
23.9 13.5 47.8
9.9 5.2
2.7 4.1 5.5
29.4 30.0 36.82,085 2,789 3,001
.. 1.1
17.6 128.8 100.6
7.0 30.4 34.6

8/6/2019 The Little Data Book on Private Sector Development 2011
http://slidepdf.com/reader/full/the-little-data-book-on-private-sector-development-2011 34/246
Economic and social context
Population (millions)
Labor force (millions)
Unemployment rate (% of labor force)
GNI per capita, World Bank Atlas method ($)GDP growth, 1995–2000 and 2000–09 (average annual %)
Agriculture value added (% of GDP)
Industry value added (% of GDP)
Manufacturing value added (% of GDP)
Services value added (% of GDP)
Inflation (annual % change in consumer price index)
Exchange rate (local currency units per $)
Exports of goods and services (% of GDP)
Imports of goods and services (% of GDP) Investment climate
Ease of doing business index (ranking 1–183; 1 = best)
Time to star t a business (days)
Procedures to start a business (number)
Firing cost (weeks of wages)
Closing a business (years to resolve insolvency)
Total tax rate (% of profit)
Profit tax (% of commercial profits)New businesses registered (thousands)
New business density (new regis. per working-age pop.)
Enterprise surveys
Time dealing with gov’t officials (% of management time)
Firms expected to give gifts in meetings w/tax officials (%)
Firms using banks to finance investments (% of firms)
Delay in obtaining an electrical connection (days)
ISO certif ication ownership (% of firms)
Private sector investment
Invest. in infrastructure w/private participation ($ millions)
Private foreign direct investment, net (% of GDP)
Gross f ixed capital formation (% of GDP)
Gross f ixed private capital formation (% of GDP)
Finance and banking
Government cash surplus or deficit (% of GDP)
Government debt (% of GDP)
Deposit money banks’ assets (% of GDP) Total f inancial system deposits (% of GDP)
Bank capital to asset ratio (%)
Bank nonperforming loans to total gross loans ratio (%)
Domestic credit to the private sector (% of GDP)
Real interest rate (%)
Interest rate spread (percentage points)
Infrastructure
Paved roads (% of total roads)Electr ic power consumption (kWh per capita)
Power outages in a typical month (number)
Mobile cellular subscriptions (per 100 people)
Internet users (per 100 people)
26 2011 The Little Data Book on Private Sector Development
Country data
Lowermiddle-incomegroup
2000 2009 2009
Europe & Central Asia Lower middle income
Armenia
3.1 3.1 3,811
1.5 1.6 1,787
35.9 28.6 5.3
660 3,100 2,3215.1 10.5 8.5
25.5 20.7 13.3
35.4 34.6 38.9
24.1 15.7 25.8
39.0 44.8 47.7
-0.8 3.4
539.5 363.3
23.4 12.0 28.9
50.5 36.5 28.3
.. 48
.. 15 35
.. 6 8
.. 13.0 57.7
.. 1.9 3.3
.. 40.7 40.2
.. 16.6 16.3.. 2.7
.. 1.3
1.9 10.3
33.7 13.3
5.3 31.9
2.3 16.3
12.6 26.9
33 199 41,477
5.5 8.9 2.0
18.4 30.8 34.9
15.9 25.6 19.9
.. -7.5 -2.3
.. .. ..
11.6 24.6 107.68.9 17.4 54.9
14.3 21.0 10.0
17.5 4.8 5.1
9.9 23.1 92.9
33.4 17.1
13.5 10.1 7.3
96.8 90.5 36.31,295 1,578 1,318
.. 2.2
0.6 85.0 57.8
1.3 6.8 17.2
8/6/2019 The Little Data Book on Private Sector Development 2011
http://slidepdf.com/reader/full/the-little-data-book-on-private-sector-development-2011 35/246
Economic and social context
Population (millions)
Labor force (millions)
Unemployment rate (% of labor force)
GNI per capita, World Bank Atlas method ($)GDP growth, 1995–2000 and 2000–09 (average annual %)
Agriculture value added (% of GDP)
Industry value added (% of GDP)
Manufacturing value added (% of GDP)
Services value added (% of GDP)
Inflation (annual % change in consumer price index)
Exchange rate (local currency units per $)
Exports of goods and services (% of GDP)
Imports of goods and services (% of GDP) Investment climate
Ease of doing business index (ranking 1–183; 1 = best)
Time to star t a business (days)
Procedures to start a business (number)
Firing cost (weeks of wages)
Closing a business (years to resolve insolvency)
Total tax rate (% of profit)
Profit tax (% of commercial profits)New businesses registered (thousands)
New business density (new regis. per working-age pop.)
Enterprise surveys
Time dealing with gov’t officials (% of management time)
Firms expected to give gifts in meetings w/tax officials (%)
Firms using banks to finance investments (% of firms)
Delay in obtaining an electrical connection (days)
ISO certi fication ownership (% of firms)
Private sector investment
Invest. in infrastructure w/private participation ($ millions)
Private foreign direct investment, net (% of GDP)
Gross f ixed capital formation (% of GDP)
Gross f ixed private capital formation (% of GDP)
Finance and banking
Government cash surplus or deficit (% of GDP)
Government debt (% of GDP)
Deposit money banks’ assets (% of GDP) Total f inancial system deposits (% of GDP)
Bank capital to asset ratio (%)
Bank nonperforming loans to total gross loans ratio (%)
Domestic credit to the private sector (% of GDP)
Real interest rate (%)
Interest rate spread (percentage points)
Infrastructure
Paved roads (% of total roads)Electr ic power consumption (kWh per capita)
Power outages in a typical month (number)
Mobile cellular subscriptions (per 100 people)
Internet users (per 100 people)
27The Little Data Book on Private Sector Development 2011
High income
Country data
High-incomegroup
2000 2009 2009
Aruba
0.09 0.11 1,117
.. .. 547
6.9 5.7 8.1
.. .. 37,9904.4 .. 2.0
.. .. 1.5
.. .. 25.0
.. .. 15.9
.. .. 73.5
4.0 -2.1
1.8 1.8
69.9 .. 23.6
91.2 .. 23.9
.. ..
.. .. 18
.. .. 6
.. .. 37.9
.. .. 2.1
.. .. 38.6
.. .. 14.3.. ..
.. ..
.. ..
.. ..
.. ..
.. ..
.. ..
.. .. ..
-6.9 .. 2.0
.. .. 18.0
.. .. ..
.. .. -7.7
.. .. 55.7
46.1 57.0 140.047.9 63.6 108.5
.. .. 6.8
.. .. 3.4
45.2 57.0 165.1
7.7 9.8
5.9 7.4 3.8
.. .. 93.4
.. .. 9,518
.. ..
16.5 120.2 111.2
15.4 22.5 72.3
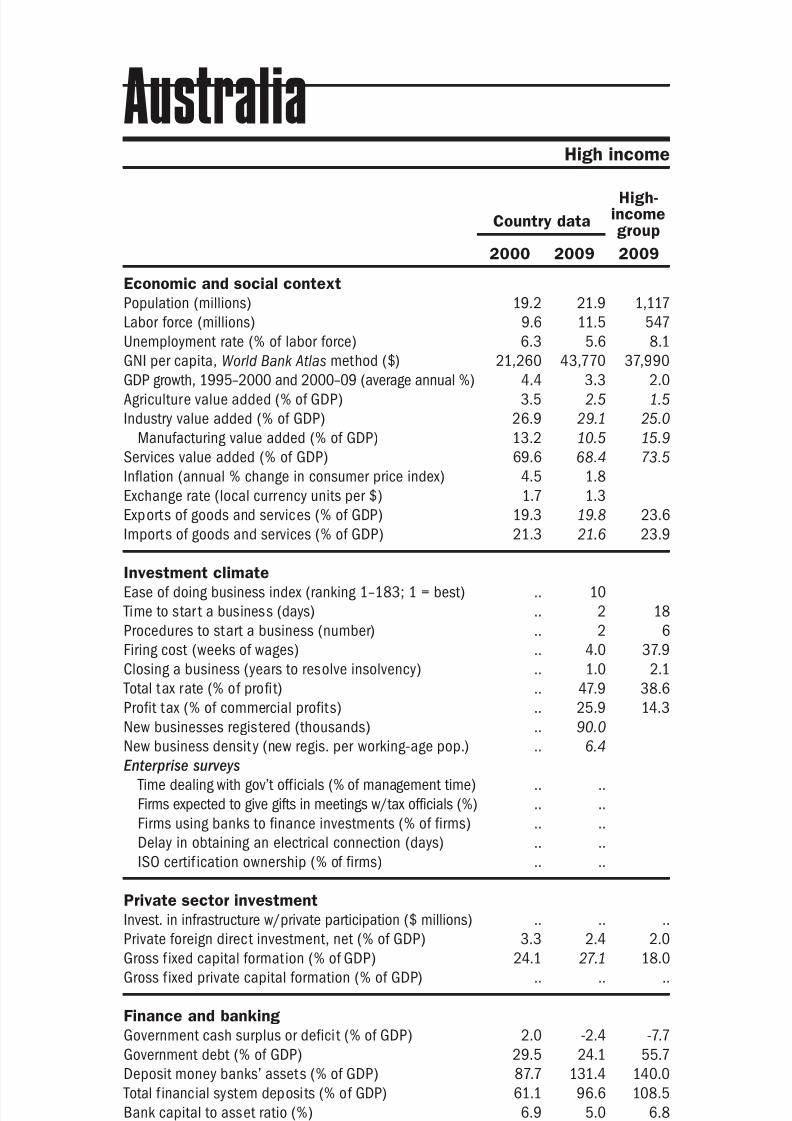
8/6/2019 The Little Data Book on Private Sector Development 2011
http://slidepdf.com/reader/full/the-little-data-book-on-private-sector-development-2011 36/246
Economic and social context
Population (millions)
Labor force (millions)
Unemployment rate (% of labor force)
GNI per capita, World Bank Atlas method ($)GDP growth, 1995–2000 and 2000–09 (average annual %)
Agriculture value added (% of GDP)
Industry value added (% of GDP)
Manufacturing value added (% of GDP)
Services value added (% of GDP)
Inflation (annual % change in consumer price index)
Exchange rate (local currency units per $)
Exports of goods and services (% of GDP)
Imports of goods and services (% of GDP) Investment climate
Ease of doing business index (ranking 1–183; 1 = best)
Time to star t a business (days)
Procedures to start a business (number)
Firing cost (weeks of wages)
Closing a business (years to resolve insolvency)
Total tax rate (% of profit)
Profit tax (% of commercial profits)New businesses registered (thousands)
New business density (new regis. per working-age pop.)
Enterprise surveys
Time dealing with gov’t officials (% of management time)
Firms expected to give gifts in meetings w/tax officials (%)
Firms using banks to finance investments (% of firms)
Delay in obtaining an electrical connection (days)
ISO certif ication ownership (% of firms)
Private sector investment
Invest. in infrastructure w/private participation ($ millions)
Private foreign direct investment, net (% of GDP)
Gross f ixed capital formation (% of GDP)
Gross f ixed private capital formation (% of GDP)
Finance and banking
Government cash surplus or deficit (% of GDP)
Government debt (% of GDP)
Deposit money banks’ assets (% of GDP) Total f inancial system deposits (% of GDP)
Bank capital to asset ratio (%)
Bank nonperforming loans to total gross loans ratio (%)
Domestic credit to the private sector (% of GDP)
Real interest rate (%)
Interest rate spread (percentage points)
Infrastructure
Paved roads (% of total roads)Electr ic power consumption (kWh per capita)
Power outages in a typical month (number)
Mobile cellular subscriptions (per 100 people)
Internet users (per 100 people)
28 2011 The Little Data Book on Private Sector Development
Country data
High-incomegroup
2000 2009 2009
High income
Australia
19.2 21.9 1,117
9.6 11.5 547
6.3 5.6 8.1
21,260 43,770 37,9904.4 3.3 2.0
3.5 2.5 1.5
26.9 29.1 25.0
13.2 10.5 15.9
69.6 68.4 73.5
4.5 1.8
1.7 1.3
19.3 19.8 23.6
21.3 21.6 23.9
.. 10
.. 2 18
.. 2 6
.. 4.0 37.9
.. 1.0 2.1
.. 47.9 38.6
.. 25.9 14.3.. 90.0
.. 6.4
.. ..
.. ..
.. ..
.. ..
.. ..
.. .. ..
3.3 2.4 2.0
24.1 27.1 18.0
.. .. ..
2.0 -2.4 -7.7
29.5 24.1 55.7
87.7 131.4 140.061.1 96.6 108.5
6.9 5.0 6.8
0.5 1.2 3.4
87.4 127.8 165.1
6.5 1.0
5.1 3.2 3.8
38.7 .. 93.410,194 11,217 9,518
.. ..
44.7 110.7 111.2
46.8 72.0 72.3

8/6/2019 The Little Data Book on Private Sector Development 2011
http://slidepdf.com/reader/full/the-little-data-book-on-private-sector-development-2011 37/246
Economic and social context
Population (millions)
Labor force (millions)
Unemployment rate (% of labor force)
GNI per capita, World Bank Atlas method ($)GDP growth, 1995–2000 and 2000–09 (average annual %)
Agriculture value added (% of GDP)
Industry value added (% of GDP)
Manufacturing value added (% of GDP)
Services value added (% of GDP)
Inflation (annual % change in consumer price index)
Exchange rate (local currency units per $)
Exports of goods and services (% of GDP)
Imports of goods and services (% of GDP) Investment climate
Ease of doing business index (ranking 1–183; 1 = best)
Time to star t a business (days)
Procedures to start a business (number)
Firing cost (weeks of wages)
Closing a business (years to resolve insolvency)
Total tax rate (% of profit)
Profit tax (% of commercial profits)New businesses registered (thousands)
New business density (new regis. per working-age pop.)
Enterprise surveys
Time dealing with gov’t officials (% of management time)
Firms expected to give gifts in meetings w/tax officials (%)
Firms using banks to finance investments (% of firms)
Delay in obtaining an electrical connection (days)
ISO certi fication ownership (% of firms)
Private sector investment
Invest. in infrastructure w/private participation ($ millions)
Private foreign direct investment, net (% of GDP)
Gross f ixed capital formation (% of GDP)
Gross f ixed private capital formation (% of GDP)
Finance and banking
Government cash surplus or deficit (% of GDP)
Government debt (% of GDP)
Deposit money banks’ assets (% of GDP) Total f inancial system deposits (% of GDP)
Bank capital to asset ratio (%)
Bank nonperforming loans to total gross loans ratio (%)
Domestic credit to the private sector (% of GDP)
Real interest rate (%)
Interest rate spread (percentage points)
Infrastructure
Paved roads (% of total roads)Electr ic power consumption (kWh per capita)
Power outages in a typical month (number)
Mobile cellular subscriptions (per 100 people)
Internet users (per 100 people)
29The Little Data Book on Private Sector Development 2011
High income
Country data
High-incomegroup
2000 2009 2009
Austria
8.0 8.4 1,117
3.9 4.3 547
3.5 4.8 8.1
25,840 46,450 37,9903.0 2.0 2.0
2.0 1.5 1.5
30.8 29.2 25.0
20.6 18.6 15.9
67.2 69.3 73.5
2.4 0.5
12.4 ..
46.4 50.5 23.6
44.7 46.0 23.9
.. 32
.. 28 18
.. 8 6
.. 2.0 37.9
.. 1.1 2.1
.. 55.5 38.6
.. 15.7 14.3.. 3.2
.. 0.6
.. ..
.. ..
.. ..
.. ..
.. ..
.. .. ..
4.5 2.3 2.0
24.0 21.1 18.0
.. .. ..
-2.0 -2.6 -7.7
65.9 70.7 55.7
125.1 139.7 140.080.8 100.8 108.5
5.2 7.0 6.8
2.4 2.3 3.4
103.1 126.9 165.1
5.2 ..
3.4 .. 3.8
100.0 100.0 93.47,109 8,218 9,518
.. ..
76.4 140.8 111.2
33.7 73.5 72.3
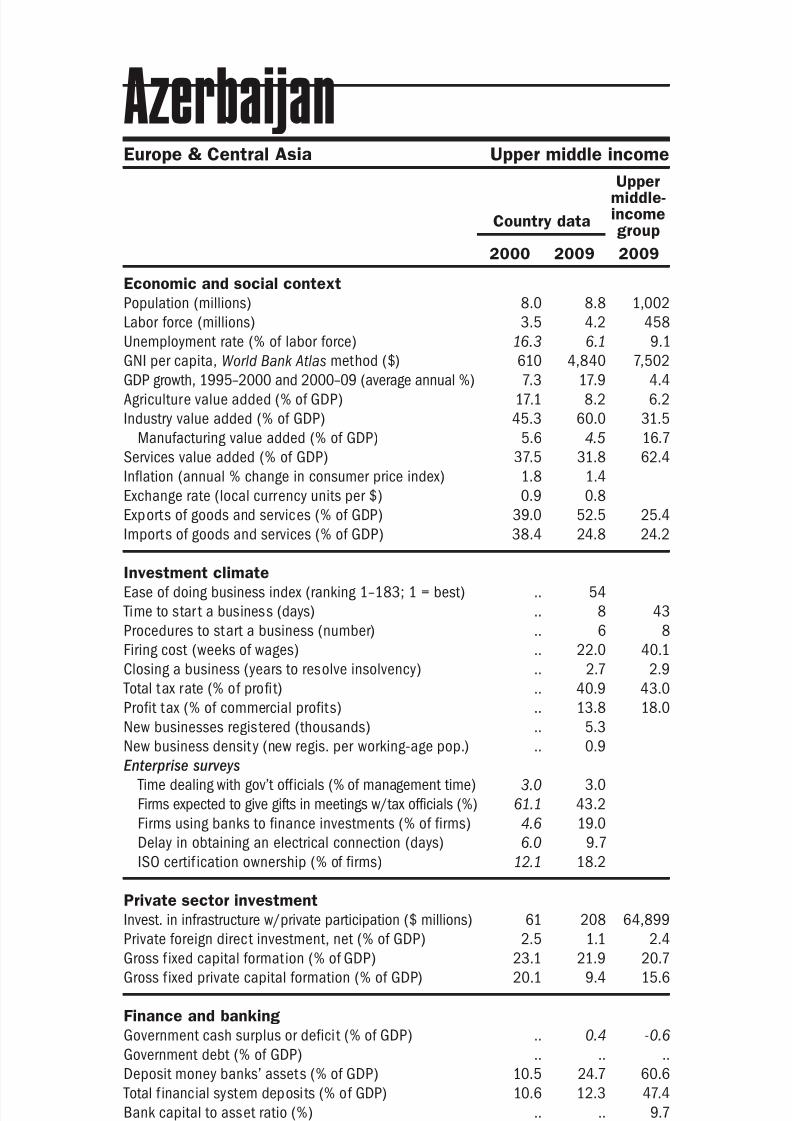
8/6/2019 The Little Data Book on Private Sector Development 2011
http://slidepdf.com/reader/full/the-little-data-book-on-private-sector-development-2011 38/246
Economic and social context
Population (millions)
Labor force (millions)
Unemployment rate (% of labor force)
GNI per capita, World Bank Atlas method ($)GDP growth, 1995–2000 and 2000–09 (average annual %)
Agriculture value added (% of GDP)
Industry value added (% of GDP)
Manufacturing value added (% of GDP)
Services value added (% of GDP)
Inflation (annual % change in consumer price index)
Exchange rate (local currency units per $)
Exports of goods and services (% of GDP)
Imports of goods and services (% of GDP) Investment climate
Ease of doing business index (ranking 1–183; 1 = best)
Time to star t a business (days)
Procedures to start a business (number)
Firing cost (weeks of wages)
Closing a business (years to resolve insolvency)
Total tax rate (% of profit)
Profit tax (% of commercial profits)New businesses registered (thousands)
New business density (new regis. per working-age pop.)
Enterprise surveys
Time dealing with gov’t officials (% of management time)
Firms expected to give gifts in meetings w/tax officials (%)
Firms using banks to finance investments (% of firms)
Delay in obtaining an electrical connection (days)
ISO certif ication ownership (% of firms)
Private sector investment
Invest. in infrastructure w/private participation ($ millions)
Private foreign direct investment, net (% of GDP)
Gross f ixed capital formation (% of GDP)
Gross f ixed private capital formation (% of GDP)
Finance and banking
Government cash surplus or deficit (% of GDP)
Government debt (% of GDP)
Deposit money banks’ assets (% of GDP) Total f inancial system deposits (% of GDP)
Bank capital to asset ratio (%)
Bank nonperforming loans to total gross loans ratio (%)
Domestic credit to the private sector (% of GDP)
Real interest rate (%)
Interest rate spread (percentage points)
Infrastructure
Paved roads (% of total roads)Electr ic power consumption (kWh per capita)
Power outages in a typical month (number)
Mobile cellular subscriptions (per 100 people)
Internet users (per 100 people)
30 2011 The Little Data Book on Private Sector Development
Country data
Uppermiddle-incomegroup
2000 2009 2009
Europe & Central Asia Upper middle income
Azerbaijan
8.0 8.8 1,002
3.5 4.2 458
16.3 6.1 9.1
610 4,840 7,5027.3 17.9 4.4
17.1 8.2 6.2
45.3 60.0 31.5
5.6 4.5 16.7
37.5 31.8 62.4
1.8 1.4
0.9 0.8
39.0 52.5 25.4
38.4 24.8 24.2
.. 54
.. 8 43
.. 6 8
.. 22.0 40.1
.. 2.7 2.9
.. 40.9 43.0
.. 13.8 18.0.. 5.3
.. 0.9
3.0 3.0
61.1 43.2
4.6 19.0
6.0 9.7
12.1 18.2
61 208 64,899
2.5 1.1 2.4
23.1 21.9 20.7
20.1 9.4 15.6
.. 0.4 -0.6
.. .. ..
10.5 24.7 60.610.6 12.3 47.4
.. .. 9.7
28.0 .. 4.2
5.9 19.6 47.8
6.4 44.2
6.8 7.8 5.5
.. 50.6 36.82,040 2,317 3,001
.. 2.9
5.2 88.3 100.6
0.1 42.0 34.6
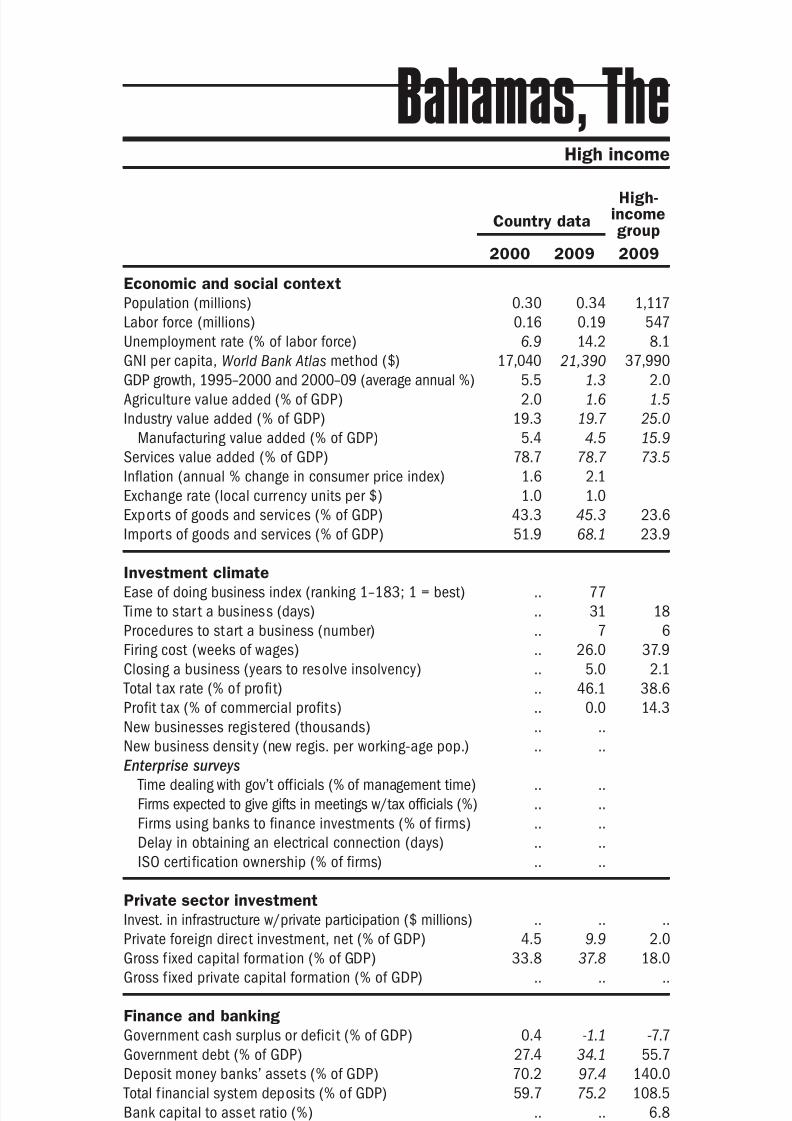
8/6/2019 The Little Data Book on Private Sector Development 2011
http://slidepdf.com/reader/full/the-little-data-book-on-private-sector-development-2011 39/246
Economic and social context
Population (millions)
Labor force (millions)
Unemployment rate (% of labor force)
GNI per capita, World Bank Atlas method ($)GDP growth, 1995–2000 and 2000–09 (average annual %)
Agriculture value added (% of GDP)
Industry value added (% of GDP)
Manufacturing value added (% of GDP)
Services value added (% of GDP)
Inflation (annual % change in consumer price index)
Exchange rate (local currency units per $)
Exports of goods and services (% of GDP)
Imports of goods and services (% of GDP) Investment climate
Ease of doing business index (ranking 1–183; 1 = best)
Time to star t a business (days)
Procedures to start a business (number)
Firing cost (weeks of wages)
Closing a business (years to resolve insolvency)
Total tax rate (% of profit)
Profit tax (% of commercial profits)New businesses registered (thousands)
New business density (new regis. per working-age pop.)
Enterprise surveys
Time dealing with gov’t officials (% of management time)
Firms expected to give gifts in meetings w/tax officials (%)
Firms using banks to finance investments (% of firms)
Delay in obtaining an electrical connection (days)
ISO certi fication ownership (% of firms)
Private sector investment
Invest. in infrastructure w/private participation ($ millions)
Private foreign direct investment, net (% of GDP)
Gross f ixed capital formation (% of GDP)
Gross f ixed private capital formation (% of GDP)
Finance and banking
Government cash surplus or deficit (% of GDP)
Government debt (% of GDP)
Deposit money banks’ assets (% of GDP) Total f inancial system deposits (% of GDP)
Bank capital to asset ratio (%)
Bank nonperforming loans to total gross loans ratio (%)
Domestic credit to the private sector (% of GDP)
Real interest rate (%)
Interest rate spread (percentage points)
Infrastructure
Paved roads (% of total roads)Electr ic power consumption (kWh per capita)
Power outages in a typical month (number)
Mobile cellular subscriptions (per 100 people)
Internet users (per 100 people)
31The Little Data Book on Private Sector Development 2011
High income
Country data
High-incomegroup
2000 2009 2009
Bahamas, The
0.30 0.34 1,117
0.16 0.19 547
6.9 14.2 8.1
17,040 21,390 37,9905.5 1.3 2.0
2.0 1.6 1.5
19.3 19.7 25.0
5.4 4.5 15.9
78.7 78.7 73.5
1.6 2.1
1.0 1.0
43.3 45.3 23.6
51.9 68.1 23.9
.. 77
.. 31 18
.. 7 6
.. 26.0 37.9
.. 5.0 2.1
.. 46.1 38.6
.. 0.0 14.3.. ..
.. ..
.. ..
.. ..
.. ..
.. ..
.. ..
.. .. ..
4.5 9.9 2.0
33.8 37.8 18.0
.. .. ..
0.4 -1.1 -7.7
27.4 34.1 55.7
70.2 97.4 140.059.7 75.2 108.5
.. .. 6.8
.. .. 3.4
65.5 86.0 165.1
3.0 3.1
1.9 1.7 3.8
57.4 .. 93.4.. .. 9,518
.. ..
10.3 105.0 111.2
4.3 33.9 72.3
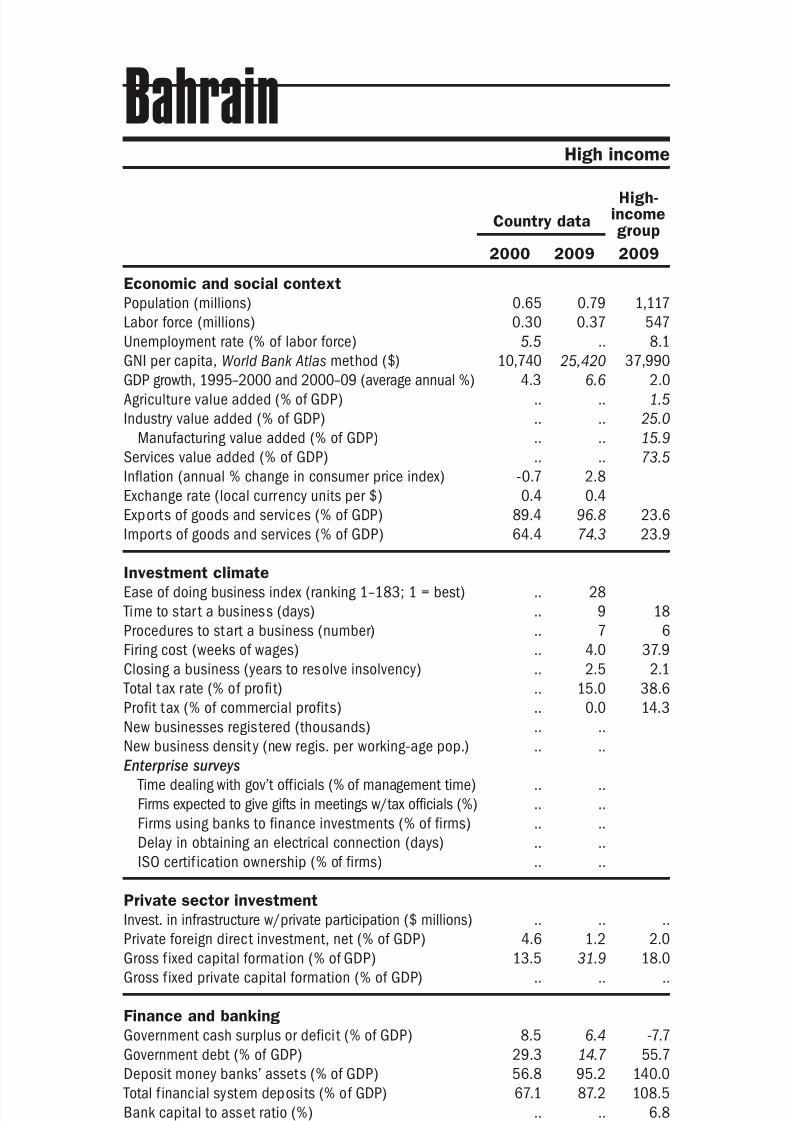
8/6/2019 The Little Data Book on Private Sector Development 2011
http://slidepdf.com/reader/full/the-little-data-book-on-private-sector-development-2011 40/246
Economic and social context
Population (millions)
Labor force (millions)
Unemployment rate (% of labor force)
GNI per capita, World Bank Atlas method ($)GDP growth, 1995–2000 and 2000–09 (average annual %)
Agriculture value added (% of GDP)
Industry value added (% of GDP)
Manufacturing value added (% of GDP)
Services value added (% of GDP)
Inflation (annual % change in consumer price index)
Exchange rate (local currency units per $)
Exports of goods and services (% of GDP)
Imports of goods and services (% of GDP) Investment climate
Ease of doing business index (ranking 1–183; 1 = best)
Time to star t a business (days)
Procedures to start a business (number)
Firing cost (weeks of wages)
Closing a business (years to resolve insolvency)
Total tax rate (% of profit)
Profit tax (% of commercial profits)New businesses registered (thousands)
New business density (new regis. per working-age pop.)
Enterprise surveys
Time dealing with gov’t officials (% of management time)
Firms expected to give gifts in meetings w/tax officials (%)
Firms using banks to finance investments (% of firms)
Delay in obtaining an electrical connection (days)
ISO certif ication ownership (% of firms)
Private sector investment
Invest. in infrastructure w/private participation ($ millions)
Private foreign direct investment, net (% of GDP)
Gross f ixed capital formation (% of GDP)
Gross f ixed private capital formation (% of GDP)
Finance and banking
Government cash surplus or deficit (% of GDP)
Government debt (% of GDP)
Deposit money banks’ assets (% of GDP) Total f inancial system deposits (% of GDP)
Bank capital to asset ratio (%)
Bank nonperforming loans to total gross loans ratio (%)
Domestic credit to the private sector (% of GDP)
Real interest rate (%)
Interest rate spread (percentage points)
Infrastructure
Paved roads (% of total roads)Electr ic power consumption (kWh per capita)
Power outages in a typical month (number)
Mobile cellular subscriptions (per 100 people)
Internet users (per 100 people)
32 2011 The Little Data Book on Private Sector Development
Country data
High-incomegroup
2000 2009 2009
High income
Bahrain
0.65 0.79 1,117
0.30 0.37 547
5.5 .. 8.1
10,740 25,420 37,9904.3 6.6 2.0
.. .. 1.5
.. .. 25.0
.. .. 15.9
.. .. 73.5
-0.7 2.8
0.4 0.4
89.4 96.8 23.6
64.4 74.3 23.9
.. 28
.. 9 18
.. 7 6
.. 4.0 37.9
.. 2.5 2.1
.. 15.0 38.6
.. 0.0 14.3.. ..
.. ..
.. ..
.. ..
.. ..
.. ..
.. ..
.. .. ..
4.6 1.2 2.0
13.5 31.9 18.0
.. .. ..
8.5 6.4 -7.7
29.3 14.7 55.7
56.8 95.2 140.067.1 87.2 108.5
.. .. 6.8
.. .. 3.4
46.1 79.6 165.1
-2.4 -3.0
5.8 6.4 3.8
77.6 81.5 93.48,831 13,144 9,518
.. ..
31.6 199.4 111.2
6.2 82.0 72.3
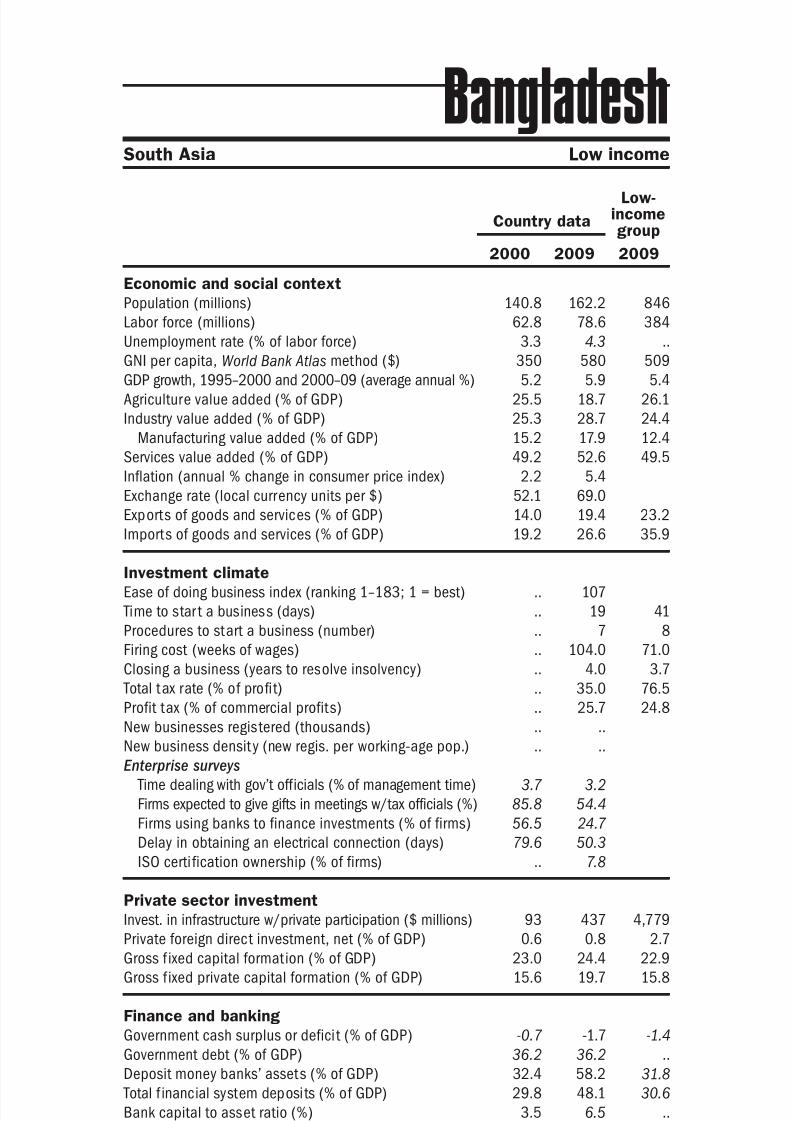
8/6/2019 The Little Data Book on Private Sector Development 2011
http://slidepdf.com/reader/full/the-little-data-book-on-private-sector-development-2011 41/246
Economic and social context
Population (millions)
Labor force (millions)
Unemployment rate (% of labor force)
GNI per capita, World Bank Atlas method ($)GDP growth, 1995–2000 and 2000–09 (average annual %)
Agriculture value added (% of GDP)
Industry value added (% of GDP)
Manufacturing value added (% of GDP)
Services value added (% of GDP)
Inflation (annual % change in consumer price index)
Exchange rate (local currency units per $)
Exports of goods and services (% of GDP)
Imports of goods and services (% of GDP) Investment climate
Ease of doing business index (ranking 1–183; 1 = best)
Time to star t a business (days)
Procedures to start a business (number)
Firing cost (weeks of wages)
Closing a business (years to resolve insolvency)
Total tax rate (% of profit)
Profit tax (% of commercial profits)New businesses registered (thousands)
New business density (new regis. per working-age pop.)
Enterprise surveys
Time dealing with gov’t officials (% of management time)
Firms expected to give gifts in meetings w/tax officials (%)
Firms using banks to finance investments (% of firms)
Delay in obtaining an electrical connection (days)
ISO certi fication ownership (% of firms)
Private sector investment
Invest. in infrastructure w/private participation ($ millions)
Private foreign direct investment, net (% of GDP)
Gross f ixed capital formation (% of GDP)
Gross f ixed private capital formation (% of GDP)
Finance and banking
Government cash surplus or deficit (% of GDP)
Government debt (% of GDP)
Deposit money banks’ assets (% of GDP) Total f inancial system deposits (% of GDP)
Bank capital to asset ratio (%)
Bank nonperforming loans to total gross loans ratio (%)
Domestic credit to the private sector (% of GDP)
Real interest rate (%)
Interest rate spread (percentage points)
Infrastructure
Paved roads (% of total roads)Electr ic power consumption (kWh per capita)
Power outages in a typical month (number)
Mobile cellular subscriptions (per 100 people)
Internet users (per 100 people)
33The Little Data Book on Private Sector Development 2011
South Asia Low income
Country data
Low-incomegroup
2000 2009 2009
Bangladesh
140.8 162.2 846
62.8 78.6 384
3.3 4.3 ..
350 580 5095.2 5.9 5.4
25.5 18.7 26.1
25.3 28.7 24.4
15.2 17.9 12.4
49.2 52.6 49.5
2.2 5.4
52.1 69.0
14.0 19.4 23.2
19.2 26.6 35.9
.. 107
.. 19 41
.. 7 8
.. 104.0 71.0
.. 4.0 3.7
.. 35.0 76.5
.. 25.7 24.8.. ..
.. ..
3.7 3.2
85.8 54.4
56.5 24.7
79.6 50.3
.. 7.8
93 437 4,779
0.6 0.8 2.7
23.0 24.4 22.9
15.6 19.7 15.8
-0.7 -1.7 -1.4
36.2 36.2 ..
32.4 58.2 31.829.8 48.1 30.6
3.5 6.5 ..
34.9 11.2 ..
24.7 41.5 26.3
13.4 7.6
6.9 6.4 11.5
9.5 9.5 12.095 208 231
.. 101.6
0.2 31.1 26.6
0.1 0.4 2.7
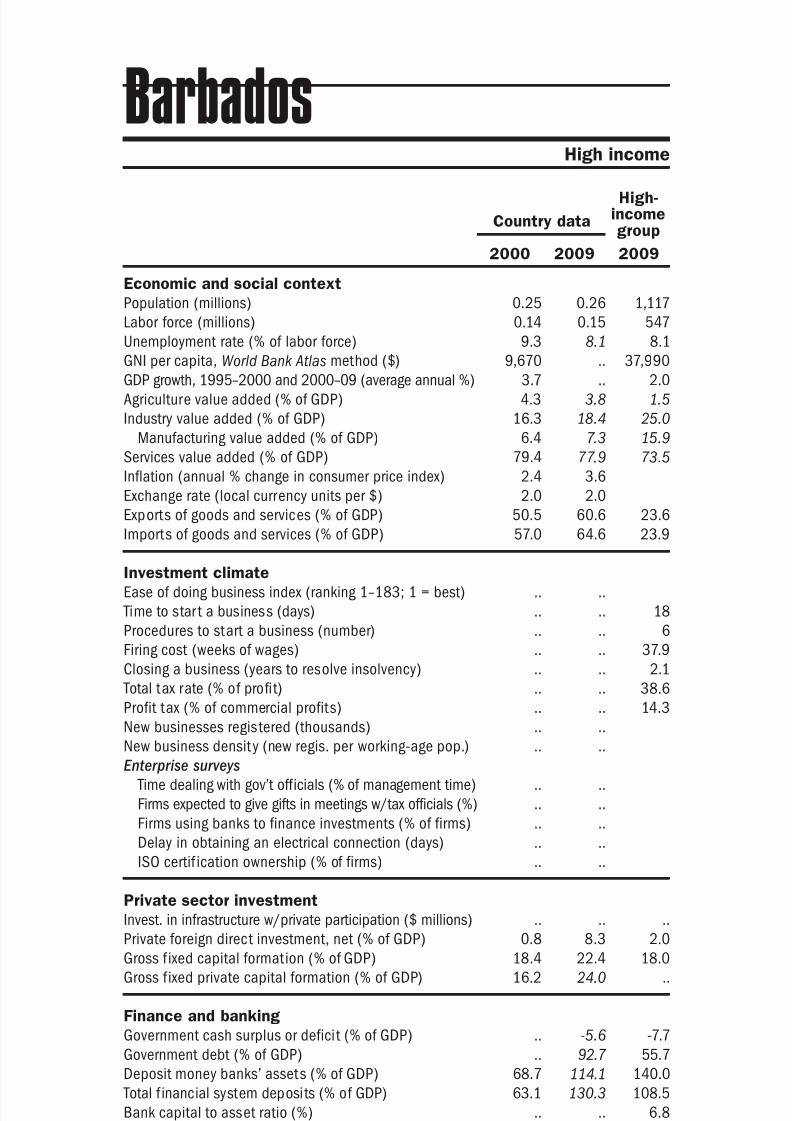
8/6/2019 The Little Data Book on Private Sector Development 2011
http://slidepdf.com/reader/full/the-little-data-book-on-private-sector-development-2011 42/246
Economic and social context
Population (millions)
Labor force (millions)
Unemployment rate (% of labor force)
GNI per capita, World Bank Atlas method ($)GDP growth, 1995–2000 and 2000–09 (average annual %)
Agriculture value added (% of GDP)
Industry value added (% of GDP)
Manufacturing value added (% of GDP)
Services value added (% of GDP)
Inflation (annual % change in consumer price index)
Exchange rate (local currency units per $)
Exports of goods and services (% of GDP)
Imports of goods and services (% of GDP) Investment climate
Ease of doing business index (ranking 1–183; 1 = best)
Time to star t a business (days)
Procedures to start a business (number)
Firing cost (weeks of wages)
Closing a business (years to resolve insolvency)
Total tax rate (% of profit)
Profit tax (% of commercial profits)New businesses registered (thousands)
New business density (new regis. per working-age pop.)
Enterprise surveys
Time dealing with gov’t officials (% of management time)
Firms expected to give gifts in meetings w/tax officials (%)
Firms using banks to finance investments (% of firms)
Delay in obtaining an electrical connection (days)
ISO certif ication ownership (% of firms)
Private sector investment
Invest. in infrastructure w/private participation ($ millions)
Private foreign direct investment, net (% of GDP)
Gross f ixed capital formation (% of GDP)
Gross f ixed private capital formation (% of GDP)
Finance and banking
Government cash surplus or deficit (% of GDP)
Government debt (% of GDP)
Deposit money banks’ assets (% of GDP) Total f inancial system deposits (% of GDP)
Bank capital to asset ratio (%)
Bank nonperforming loans to total gross loans ratio (%)
Domestic credit to the private sector (% of GDP)
Real interest rate (%)
Interest rate spread (percentage points)
Infrastructure
Paved roads (% of total roads)Electr ic power consumption (kWh per capita)
Power outages in a typical month (number)
Mobile cellular subscriptions (per 100 people)
Internet users (per 100 people)
34 2011 The Little Data Book on Private Sector Development
Country data
High-incomegroup
2000 2009 2009
High income
Barbados
0.25 0.26 1,117
0.14 0.15 547
9.3 8.1 8.1
9,670 .. 37,9903.7 .. 2.0
4.3 3.8 1.5
16.3 18.4 25.0
6.4 7.3 15.9
79.4 77.9 73.5
2.4 3.6
2.0 2.0
50.5 60.6 23.6
57.0 64.6 23.9
.. ..
.. .. 18
.. .. 6
.. .. 37.9
.. .. 2.1
.. .. 38.6
.. .. 14.3.. ..
.. ..
.. ..
.. ..
.. ..
.. ..
.. ..
.. .. ..
0.8 8.3 2.0
18.4 22.4 18.0
16.2 24.0 ..
.. -5.6 -7.7
.. 92.7 55.7
68.7 114.1 140.063.1 130.3 108.5
.. .. 6.8
.. .. 3.4
57.3 102.9 165.1
9.4 ..
5.2 6.3 3.8
98.6 100.0 93.4.. .. 9,518
.. ..
11.3 131.7 111.2
4.0 56.1 72.3

8/6/2019 The Little Data Book on Private Sector Development 2011
http://slidepdf.com/reader/full/the-little-data-book-on-private-sector-development-2011 43/246
Economic and social context
Population (millions)
Labor force (millions)
Unemployment rate (% of labor force)
GNI per capita, World Bank Atlas method ($)GDP growth, 1995–2000 and 2000–09 (average annual %)
Agriculture value added (% of GDP)
Industry value added (% of GDP)
Manufacturing value added (% of GDP)
Services value added (% of GDP)
Inflation (annual % change in consumer price index)
Exchange rate (local currency units per $)
Exports of goods and services (% of GDP)
Imports of goods and services (% of GDP) Investment climate
Ease of doing business index (ranking 1–183; 1 = best)
Time to star t a business (days)
Procedures to start a business (number)
Firing cost (weeks of wages)
Closing a business (years to resolve insolvency)
Total tax rate (% of profit)
Profit tax (% of commercial profits)New businesses registered (thousands)
New business density (new regis. per working-age pop.)
Enterprise surveys
Time dealing with gov’t officials (% of management time)
Firms expected to give gifts in meetings w/tax officials (%)
Firms using banks to finance investments (% of firms)
Delay in obtaining an electrical connection (days)
ISO certi fication ownership (% of firms)
Private sector investment
Invest. in infrastructure w/private participation ($ millions)
Private foreign direct investment, net (% of GDP)
Gross f ixed capital formation (% of GDP)
Gross f ixed private capital formation (% of GDP)
Finance and banking
Government cash surplus or deficit (% of GDP)
Government debt (% of GDP)
Deposit money banks’ assets (% of GDP) Total f inancial system deposits (% of GDP)
Bank capital to asset ratio (%)
Bank nonperforming loans to total gross loans ratio (%)
Domestic credit to the private sector (% of GDP)
Real interest rate (%)
Interest rate spread (percentage points)
Infrastructure
Paved roads (% of total roads)Electr ic power consumption (kWh per capita)
Power outages in a typical month (number)
Mobile cellular subscriptions (per 100 people)
Internet users (per 100 people)
35The Little Data Book on Private Sector Development 2011
Europe & Central Asia Upper middle income
Country data
Uppermiddle-incomegroup
2000 2009 2009
Belarus
10.0 9.7 1,002
4.8 5.0 458
.. .. 9.1
1,380 5,560 7,5026.7 8.4 4.4
14.2 9.6 6.2
39.2 42.5 31.5
31.6 30.0 16.7
46.7 47.9 62.4
168.6 12.9
876.8 2,789.5
69.2 50.7 25.4
72.4 62.1 24.2
.. 68
.. 5 43
.. 5 8
.. 22.0 40.1
.. 5.8 2.9
.. 80.4 43.0
.. 22.0 18.0.. 5.5
.. 0.8
6.2 13.6
34.5 6.4
11.4 35.8
14.7 15.2
10.6 13.9
39 833 64,899
0.9 3.8 2.4
25.2 36.9 20.7
22.7 28.6 15.6
0.1 0.2 -0.6
15.0 18.1 ..
18.2 44.3 60.614.9 24.0 47.4
15.1 16.6 9.7
10.8 4.2 4.2
8.9 37.3 47.8
-41.2 7.5
30.1 1.0 5.5
95.6 88.6 36.82,989 3,427 3,001
.. 1.4
0.5 100.2 100.6
1.9 45.9 34.6
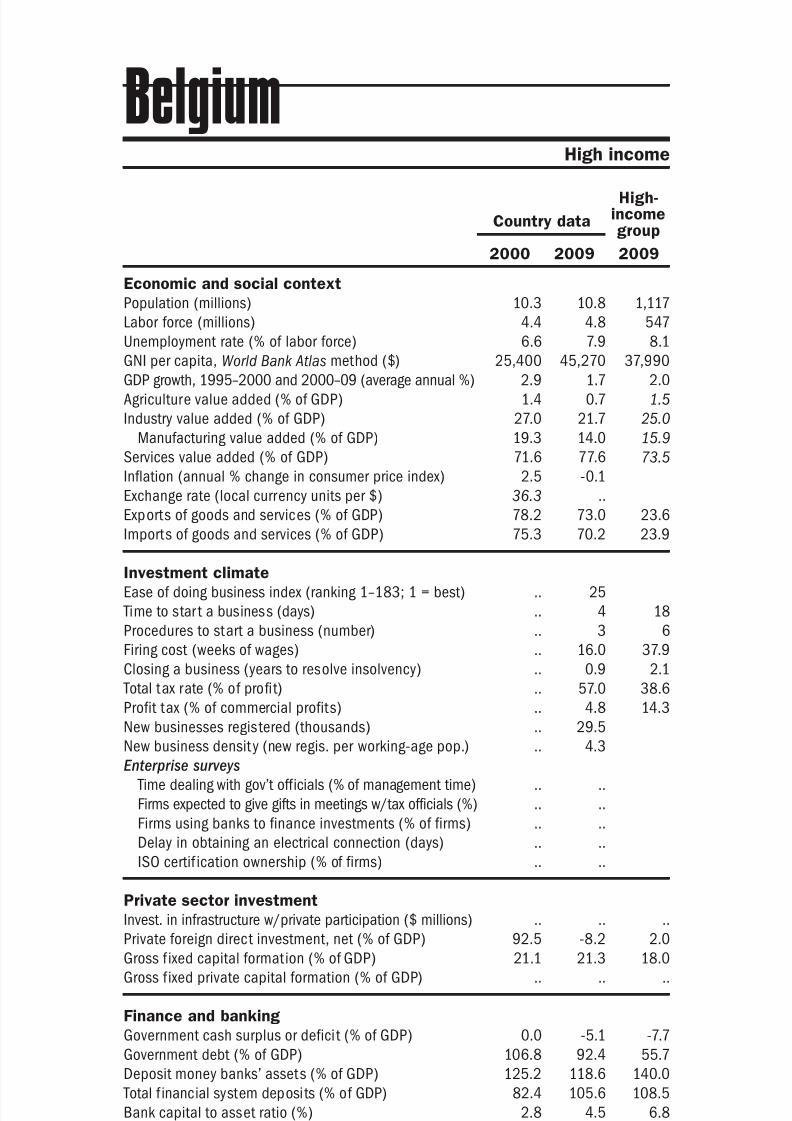
8/6/2019 The Little Data Book on Private Sector Development 2011
http://slidepdf.com/reader/full/the-little-data-book-on-private-sector-development-2011 44/246
Economic and social context
Population (millions)
Labor force (millions)
Unemployment rate (% of labor force)
GNI per capita, World Bank Atlas method ($)GDP growth, 1995–2000 and 2000–09 (average annual %)
Agriculture value added (% of GDP)
Industry value added (% of GDP)
Manufacturing value added (% of GDP)
Services value added (% of GDP)
Inflation (annual % change in consumer price index)
Exchange rate (local currency units per $)
Exports of goods and services (% of GDP)
Imports of goods and services (% of GDP) Investment climate
Ease of doing business index (ranking 1–183; 1 = best)
Time to star t a business (days)
Procedures to start a business (number)
Firing cost (weeks of wages)
Closing a business (years to resolve insolvency)
Total tax rate (% of profit)
Profit tax (% of commercial profits)New businesses registered (thousands)
New business density (new regis. per working-age pop.)
Enterprise surveys
Time dealing with gov’t officials (% of management time)
Firms expected to give gifts in meetings w/tax officials (%)
Firms using banks to finance investments (% of firms)
Delay in obtaining an electrical connection (days)
ISO certif ication ownership (% of firms)
Private sector investment
Invest. in infrastructure w/private participation ($ millions)
Private foreign direct investment, net (% of GDP)
Gross f ixed capital formation (% of GDP)
Gross f ixed private capital formation (% of GDP)
Finance and banking
Government cash surplus or deficit (% of GDP)
Government debt (% of GDP)
Deposit money banks’ assets (% of GDP) Total f inancial system deposits (% of GDP)
Bank capital to asset ratio (%)
Bank nonperforming loans to total gross loans ratio (%)
Domestic credit to the private sector (% of GDP)
Real interest rate (%)
Interest rate spread (percentage points)
Infrastructure
Paved roads (% of total roads)Electr ic power consumption (kWh per capita)
Power outages in a typical month (number)
Mobile cellular subscriptions (per 100 people)
Internet users (per 100 people)
36 2011 The Little Data Book on Private Sector Development
Country data
High-incomegroup
2000 2009 2009
High income
Belgium
10.3 10.8 1,117
4.4 4.8 547
6.6 7.9 8.1
25,400 45,270 37,9902.9 1.7 2.0
1.4 0.7 1.5
27.0 21.7 25.0
19.3 14.0 15.9
71.6 77.6 73.5
2.5 -0.1
36.3 ..
78.2 73.0 23.6
75.3 70.2 23.9
.. 25
.. 4 18
.. 3 6
.. 16.0 37.9
.. 0.9 2.1
.. 57.0 38.6
.. 4.8 14.3.. 29.5
.. 4.3
.. ..
.. ..
.. ..
.. ..
.. ..
.. .. ..
92.5 -8.2 2.0
21.1 21.3 18.0
.. .. ..
0.0 -5.1 -7.7
106.8 92.4 55.7
125.2 118.6 140.082.4 105.6 108.5
2.8 4.5 6.8
2.8 2.7 3.4
77.9 97.9 165.1
5.9 7.1
4.4 5.2 3.8
78.2 78.2 93.48,247 8,523 9,518
.. ..
54.9 115.1 111.2
29.3 75.2 72.3

8/6/2019 The Little Data Book on Private Sector Development 2011
http://slidepdf.com/reader/full/the-little-data-book-on-private-sector-development-2011 45/246
Economic and social context
Population (millions)
Labor force (millions)
Unemployment rate (% of labor force)
GNI per capita, World Bank Atlas method ($)GDP growth, 1995–2000 and 2000–09 (average annual %)
Agriculture value added (% of GDP)
Industry value added (% of GDP)
Manufacturing value added (% of GDP)
Services value added (% of GDP)
Inflation (annual % change in consumer price index)
Exchange rate (local currency units per $)
Exports of goods and services (% of GDP)
Imports of goods and services (% of GDP) Investment climate
Ease of doing business index (ranking 1–183; 1 = best)
Time to star t a business (days)
Procedures to start a business (number)
Firing cost (weeks of wages)
Closing a business (years to resolve insolvency)
Total tax rate (% of profit)
Profit tax (% of commercial profits)New businesses registered (thousands)
New business density (new regis. per working-age pop.)
Enterprise surveys
Time dealing with gov’t officials (% of management time)
Firms expected to give gifts in meetings w/tax officials (%)
Firms using banks to finance investments (% of firms)
Delay in obtaining an electrical connection (days)
ISO certi fication ownership (% of firms)
Private sector investment
Invest. in infrastructure w/private participation ($ millions)
Private foreign direct investment, net (% of GDP)
Gross f ixed capital formation (% of GDP)
Gross f ixed private capital formation (% of GDP)
Finance and banking
Government cash surplus or deficit (% of GDP)
Government debt (% of GDP)
Deposit money banks’ assets (% of GDP) Total f inancial system deposits (% of GDP)
Bank capital to asset ratio (%)
Bank nonperforming loans to total gross loans ratio (%)
Domestic credit to the private sector (% of GDP)
Real interest rate (%)
Interest rate spread (percentage points)
Infrastructure
Paved roads (% of total roads)Electr ic power consumption (kWh per capita)
Power outages in a typical month (number)
Mobile cellular subscriptions (per 100 people)
Internet users (per 100 people)
37The Little Data Book on Private Sector Development 2011
Latin America & Caribbean Lower middle income
Country data
Lowermiddle-incomegroup
2000 2009 2009
Belize
0.25 0.33 3,811
0.09 0.14 1,787
9.1 8.2 5.3
3,110 3,740 2,3215.8 4.2 8.5
16.7 12.2 13.3
21.2 22.8 38.9
10.9 14.3 25.8
62.1 65.1 47.7
0.6 -1.1
2.0 2.0
53.0 62.1 28.9
73.7 70.0 28.3
.. 99
.. 44 35
.. 9 8
.. 24.0 57.7
.. 1.0 3.3
.. 33.2 40.2
.. 24.7 16.3.. 0.5
.. 3.0
.. ..
.. ..
.. ..
.. ..
.. ..
18 22 41,477
2.8 7.0 2.0
28.7 25.5 34.9
.. .. 19.9
-2.9 .. -2.3
.. .. ..
46.7 69.6 107.648.0 71.6 54.9
.. .. 10.0
.. .. 5.1
40.8 65.9 92.9
15.5 14.5
8.3 5.7 7.3
17.0 .. 36.3.. .. 1,318
.. ..
6.7 48.6 57.8
6.0 10.8 17.2
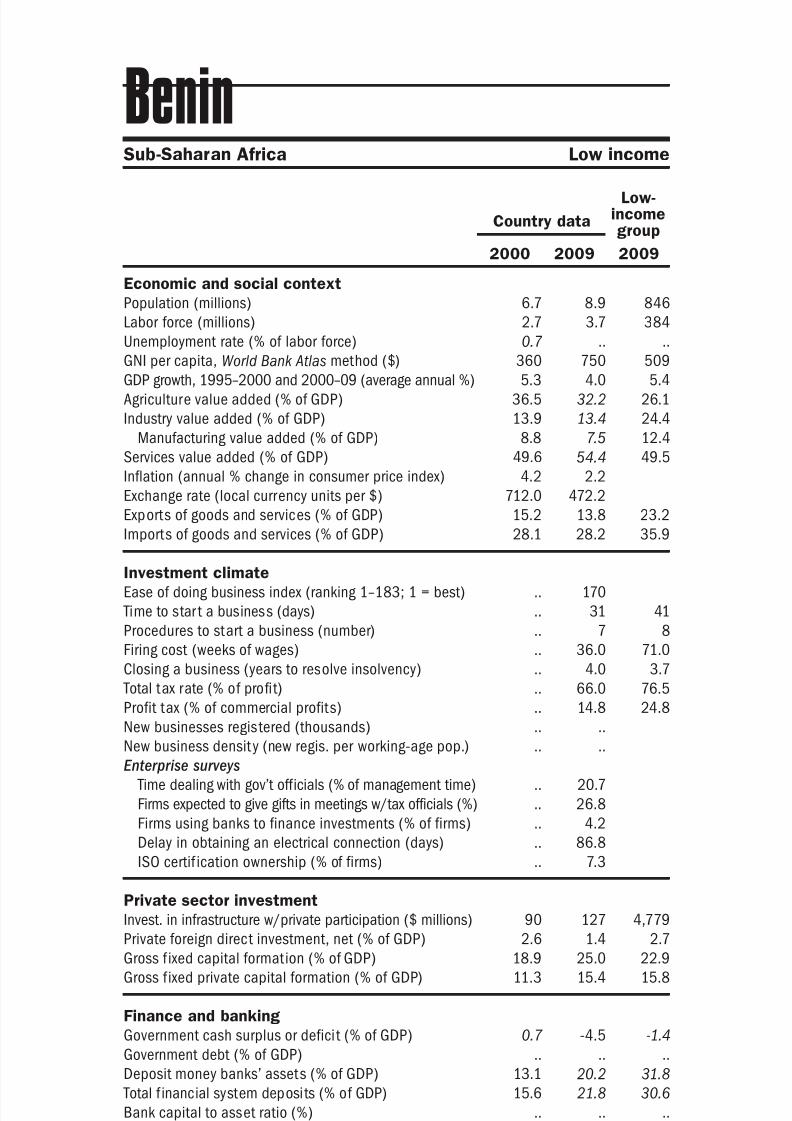
8/6/2019 The Little Data Book on Private Sector Development 2011
http://slidepdf.com/reader/full/the-little-data-book-on-private-sector-development-2011 46/246
Economic and social context
Population (millions)
Labor force (millions)
Unemployment rate (% of labor force)
GNI per capita, World Bank Atlas method ($)GDP growth, 1995–2000 and 2000–09 (average annual %)
Agriculture value added (% of GDP)
Industry value added (% of GDP)
Manufacturing value added (% of GDP)
Services value added (% of GDP)
Inflation (annual % change in consumer price index)
Exchange rate (local currency units per $)
Exports of goods and services (% of GDP)
Imports of goods and services (% of GDP) Investment climate
Ease of doing business index (ranking 1–183; 1 = best)
Time to star t a business (days)
Procedures to start a business (number)
Firing cost (weeks of wages)
Closing a business (years to resolve insolvency)
Total tax rate (% of profit)
Profit tax (% of commercial profits)New businesses registered (thousands)
New business density (new regis. per working-age pop.)
Enterprise surveys
Time dealing with gov’t officials (% of management time)
Firms expected to give gifts in meetings w/tax officials (%)
Firms using banks to finance investments (% of firms)
Delay in obtaining an electrical connection (days)
ISO certif ication ownership (% of firms)
Private sector investment
Invest. in infrastructure w/private participation ($ millions)
Private foreign direct investment, net (% of GDP)
Gross f ixed capital formation (% of GDP)
Gross f ixed private capital formation (% of GDP)
Finance and banking
Government cash surplus or deficit (% of GDP)
Government debt (% of GDP)
Deposit money banks’ assets (% of GDP) Total f inancial system deposits (% of GDP)
Bank capital to asset ratio (%)
Bank nonperforming loans to total gross loans ratio (%)
Domestic credit to the private sector (% of GDP)
Real interest rate (%)
Interest rate spread (percentage points)
Infrastructure
Paved roads (% of total roads)Electr ic power consumption (kWh per capita)
Power outages in a typical month (number)
Mobile cellular subscriptions (per 100 people)
Internet users (per 100 people)
38 2011 The Little Data Book on Private Sector Development
Country data
Low-incomegroup
2000 2009 2009
Sub-Saharan Africa Low income
Benin
6.7 8.9 846
2.7 3.7 384
0.7 .. ..
360 750 5095.3 4.0 5.4
36.5 32.2 26.1
13.9 13.4 24.4
8.8 7.5 12.4
49.6 54.4 49.5
4.2 2.2
712.0 472.2
15.2 13.8 23.2
28.1 28.2 35.9
.. 170
.. 31 41
.. 7 8
.. 36.0 71.0
.. 4.0 3.7
.. 66.0 76.5
.. 14.8 24.8.. ..
.. ..
.. 20.7
.. 26.8
.. 4.2
.. 86.8
.. 7.3
90 127 4,779
2.6 1.4 2.7
18.9 25.0 22.9
11.3 15.4 15.8
0.7 -4.5 -1.4
.. .. ..
13.1 20.2 31.815.6 21.8 30.6
.. .. ..
.. .. ..
12.1 22.2 26.3
.. ..
.. .. 11.5
20.0 9.5 12.060 76 231
.. 13.9
0.8 56.3 26.6
0.2 2.2 2.7
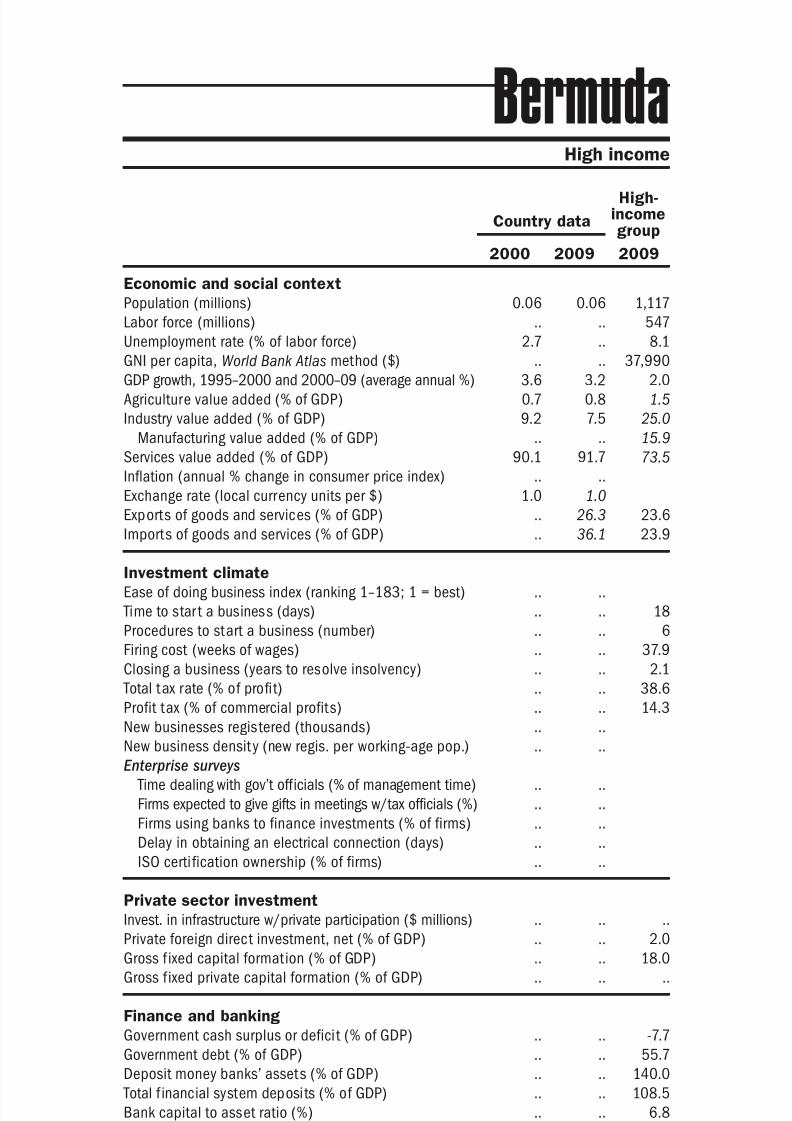
8/6/2019 The Little Data Book on Private Sector Development 2011
http://slidepdf.com/reader/full/the-little-data-book-on-private-sector-development-2011 47/246
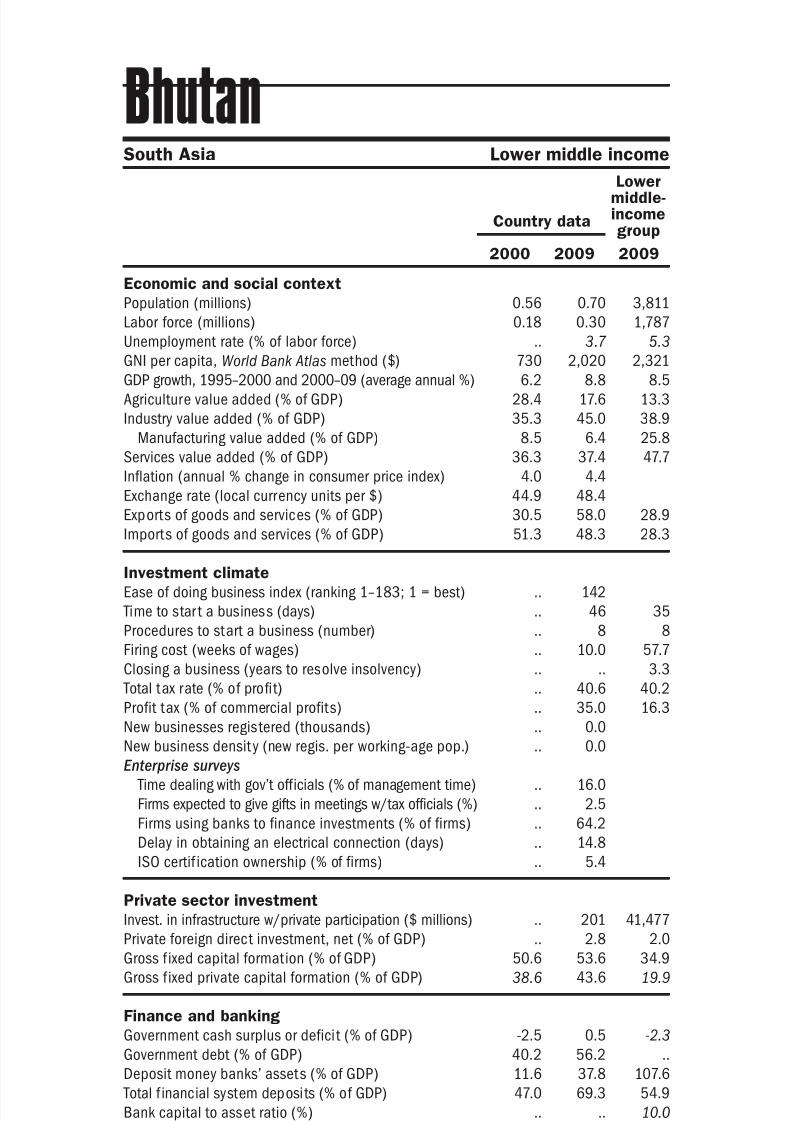
8/6/2019 The Little Data Book on Private Sector Development 2011
http://slidepdf.com/reader/full/the-little-data-book-on-private-sector-development-2011 48/246

8/6/2019 The Little Data Book on Private Sector Development 2011
http://slidepdf.com/reader/full/the-little-data-book-on-private-sector-development-2011 49/246
41The Little Data Book on Private Sector Development 2011
Latin America & Caribbean Lower middle income
Country data
Lowermiddle-incomegroup
2000 2009 2009
Bolivia
8.3 9.9 3,811
3.6 4.5 1,787
4.8 5.2 5.3
1,000 1,630 2,3213.5 4.1 8.5
15.0 13.8 13.3
29.8 36.2 38.9
15.3 14.4 25.8
55.2 49.9 47.7
4.6 3.3
6.2 7.0
18.3 35.7 28.9
27.3 32.9 28.3
.. 149
.. 50 35
.. 15 8
.. ..a 57.7
.. 1.8 3.3
.. 80.0 40.2
.. 0.0 16.3.. 2.5
.. 0.4
.. 13.5
.. 19.6
.. 22.2
.. 15.2
.. 13.8
323 37 41,477
8.8 2.4 2.0
17.9 16.5 34.9
12.8 6.6 19.9
-8.7 1.2 -2.3
.. .. ..
61.0 33.5 107.646.1 38.8 54.9
9.8 8.7 10.0
10.3 3.5 5.1
58.7 37.0 92.9
27.9 15.1
23.6 8.9 7.3
6.6 7.0 36.3421 561 1,318
.. 0.8
7.0 72.5 57.8
1.4 11.2 17.2
Economic and social context
Population (millions)
Labor force (millions)
Unemployment rate (% of labor force)
GNI per capita, World Bank Atlas method ($)GDP growth, 1995–2000 and 2000–09 (average annual %)
Agriculture value added (% of GDP)
Industry value added (% of GDP)
Manufacturing value added (% of GDP)
Services value added (% of GDP)
Inflation (annual % change in consumer price index)
Exchange rate (local currency units per $)
Exports of goods and services (% of GDP)
Imports of goods and services (% of GDP) Investment climate
Ease of doing business index (ranking 1–183; 1 = best)
Time to star t a business (days)
Procedures to start a business (number)
Firing cost (weeks of wages)
Closing a business (years to resolve insolvency)
Total tax rate (% of profit)
Profit tax (% of commercial profits)New businesses registered (thousands)
New business density (new regis. per working-age pop.)
Enterprise surveys
Time dealing with gov’t officials (% of management time)
Firms expected to give gifts in meetings w/tax officials (%)
Firms using banks to finance investments (% of firms)
Delay in obtaining an electrical connection (days)
ISO certi fication ownership (% of firms)
Private sector investment
Invest. in infrastructure w/private participation ($ millions)
Private foreign direct investment, net (% of GDP)
Gross f ixed capital formation (% of GDP)
Gross f ixed private capital formation (% of GDP)
Finance and banking
Government cash surplus or deficit (% of GDP)
Government debt (% of GDP)
Deposit money banks’ assets (% of GDP) Total f inancial system deposits (% of GDP)
Bank capital to asset ratio (%)
Bank nonperforming loans to total gross loans ratio (%)
Domestic credit to the private sector (% of GDP)
Real interest rate (%)
Interest rate spread (percentage points)
Infrastructure
Paved roads (% of total roads)Electr ic power consumption (kWh per capita)
Power outages in a typical month (number)
Mobile cellular subscriptions (per 100 people)
Internet users (per 100 people)
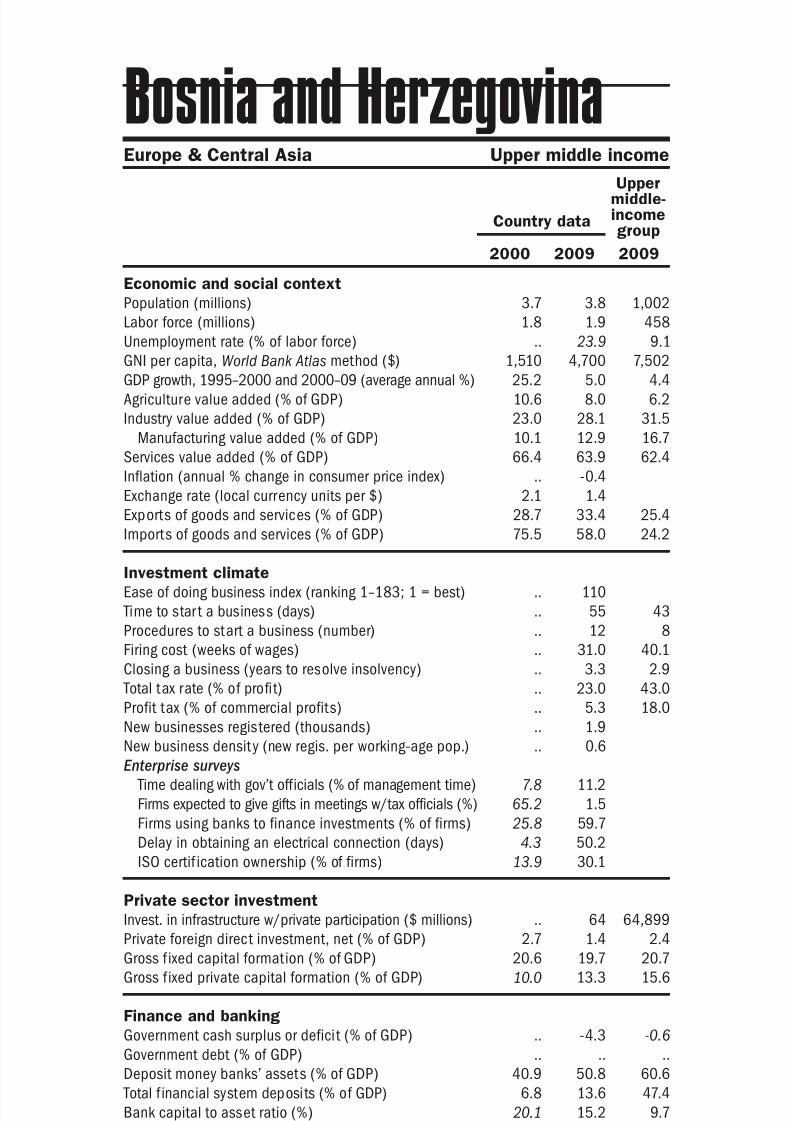
8/6/2019 The Little Data Book on Private Sector Development 2011
http://slidepdf.com/reader/full/the-little-data-book-on-private-sector-development-2011 50/246
Economic and social context
Population (millions)
Labor force (millions)
Unemployment rate (% of labor force)
GNI per capita, World Bank Atlas method ($)GDP growth, 1995–2000 and 2000–09 (average annual %)
Agriculture value added (% of GDP)
Industry value added (% of GDP)
Manufacturing value added (% of GDP)
Services value added (% of GDP)
Inflation (annual % change in consumer price index)
Exchange rate (local currency units per $)
Exports of goods and services (% of GDP)
Imports of goods and services (% of GDP) Investment climate
Ease of doing business index (ranking 1–183; 1 = best)
Time to star t a business (days)
Procedures to start a business (number)
Firing cost (weeks of wages)
Closing a business (years to resolve insolvency)
Total tax rate (% of profit)
Profit tax (% of commercial profits)New businesses registered (thousands)
New business density (new regis. per working-age pop.)
Enterprise surveys
Time dealing with gov’t officials (% of management time)
Firms expected to give gifts in meetings w/tax officials (%)
Firms using banks to finance investments (% of firms)
Delay in obtaining an electrical connection (days)
ISO certif ication ownership (% of firms)
Private sector investment
Invest. in infrastructure w/private participation ($ millions)
Private foreign direct investment, net (% of GDP)
Gross f ixed capital formation (% of GDP)
Gross f ixed private capital formation (% of GDP)
Finance and banking
Government cash surplus or deficit (% of GDP)
Government debt (% of GDP)
Deposit money banks’ assets (% of GDP) Total f inancial system deposits (% of GDP)
Bank capital to asset ratio (%)
Bank nonperforming loans to total gross loans ratio (%)
Domestic credit to the private sector (% of GDP)
Real interest rate (%)
Interest rate spread (percentage points)
Infrastructure
Paved roads (% of total roads)Electr ic power consumption (kWh per capita)
Power outages in a typical month (number)
Mobile cellular subscriptions (per 100 people)
Internet users (per 100 people)
42 2011 The Little Data Book on Private Sector Development
Country data
Uppermiddle-incomegroup
2000 2009 2009
Europe & Central Asia Upper middle income
Bosnia and Herzegovina
3.7 3.8 1,002
1.8 1.9 458
.. 23.9 9.1
1,510 4,700 7,50225.2 5.0 4.4
10.6 8.0 6.2
23.0 28.1 31.5
10.1 12.9 16.7
66.4 63.9 62.4
.. -0.4
2.1 1.4
28.7 33.4 25.4
75.5 58.0 24.2
.. 110
.. 55 43
.. 12 8
.. 31.0 40.1
.. 3.3 2.9
.. 23.0 43.0
.. 5.3 18.0.. 1.9
.. 0.6
7.8 11.2
65.2 1.5
25.8 59.7
4.3 50.2
13.9 30.1
.. 64 64,899
2.7 1.4 2.4
20.6 19.7 20.7
10.0 13.3 15.6
.. -4.3 -0.6
.. .. ..
40.9 50.8 60.66.8 13.6 47.4
20.1 15.2 9.7
9.9 5.9 4.2
37.4 57.3 47.8
1.3 7.9
15.8 4.3 5.5
52.3 52.3 36.82,062 2,467 3,001
.. 3.2
2.5 86.5 100.6
1.1 37.7 34.6
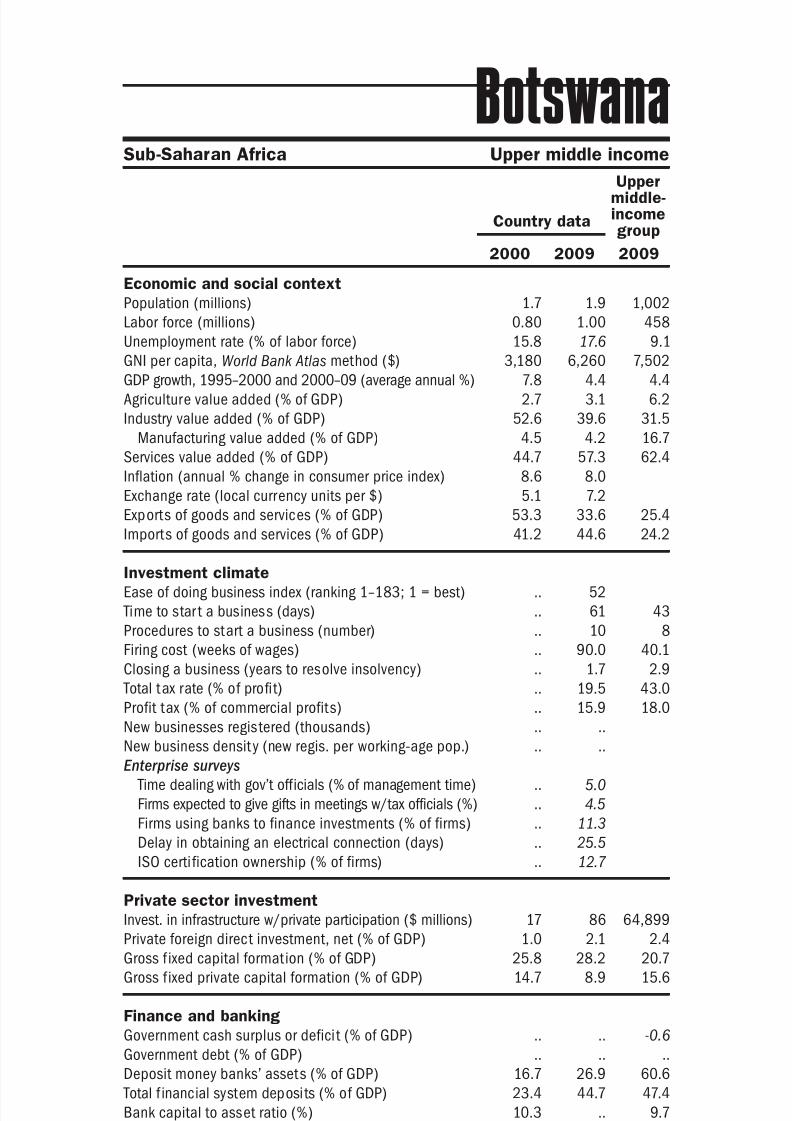
8/6/2019 The Little Data Book on Private Sector Development 2011
http://slidepdf.com/reader/full/the-little-data-book-on-private-sector-development-2011 51/246
Economic and social context
Population (millions)
Labor force (millions)
Unemployment rate (% of labor force)
GNI per capita, World Bank Atlas method ($)GDP growth, 1995–2000 and 2000–09 (average annual %)
Agriculture value added (% of GDP)
Industry value added (% of GDP)
Manufacturing value added (% of GDP)
Services value added (% of GDP)
Inflation (annual % change in consumer price index)
Exchange rate (local currency units per $)
Exports of goods and services (% of GDP)
Imports of goods and services (% of GDP) Investment climate
Ease of doing business index (ranking 1–183; 1 = best)
Time to star t a business (days)
Procedures to start a business (number)
Firing cost (weeks of wages)
Closing a business (years to resolve insolvency)
Total tax rate (% of profit)
Profit tax (% of commercial profits)New businesses registered (thousands)
New business density (new regis. per working-age pop.)
Enterprise surveys
Time dealing with gov’t officials (% of management time)
Firms expected to give gifts in meetings w/tax officials (%)
Firms using banks to finance investments (% of firms)
Delay in obtaining an electrical connection (days)
ISO certi fication ownership (% of firms)
Private sector investment
Invest. in infrastructure w/private participation ($ millions)
Private foreign direct investment, net (% of GDP)
Gross f ixed capital formation (% of GDP)
Gross f ixed private capital formation (% of GDP)
Finance and banking
Government cash surplus or deficit (% of GDP)
Government debt (% of GDP)
Deposit money banks’ assets (% of GDP) Total f inancial system deposits (% of GDP)
Bank capital to asset ratio (%)
Bank nonperforming loans to total gross loans ratio (%)
Domestic credit to the private sector (% of GDP)
Real interest rate (%)
Interest rate spread (percentage points)
Infrastructure
Paved roads (% of total roads)Electr ic power consumption (kWh per capita)
Power outages in a typical month (number)
Mobile cellular subscriptions (per 100 people)
Internet users (per 100 people)
43The Little Data Book on Private Sector Development 2011
Sub-Saharan Africa Upper middle income
Country data
Uppermiddle-incomegroup
2000 2009 2009
Botswana
1.7 1.9 1,002
0.80 1.00 458
15.8 17.6 9.1
3,180 6,260 7,5027.8 4.4 4.4
2.7 3.1 6.2
52.6 39.6 31.5
4.5 4.2 16.7
44.7 57.3 62.4
8.6 8.0
5.1 7.2
53.3 33.6 25.4
41.2 44.6 24.2
.. 52
.. 61 43
.. 10 8
.. 90.0 40.1
.. 1.7 2.9
.. 19.5 43.0
.. 15.9 18.0.. ..
.. ..
.. 5.0
.. 4.5
.. 11.3
.. 25.5
.. 12.7
17 86 64,899
1.0 2.1 2.4
25.8 28.2 20.7
14.7 8.9 15.6
.. .. -0.6
.. .. ..
16.7 26.9 60.623.4 44.7 47.4
10.3 .. 9.7
1.7 .. 4.2
15.1 25.5 47.8
15.4 20.6
6.1 6.3 5.5
35.3 32.6 36.8924 1,503 3,001
.. 1.7
12.9 96.1 100.6
2.9 6.2 34.6
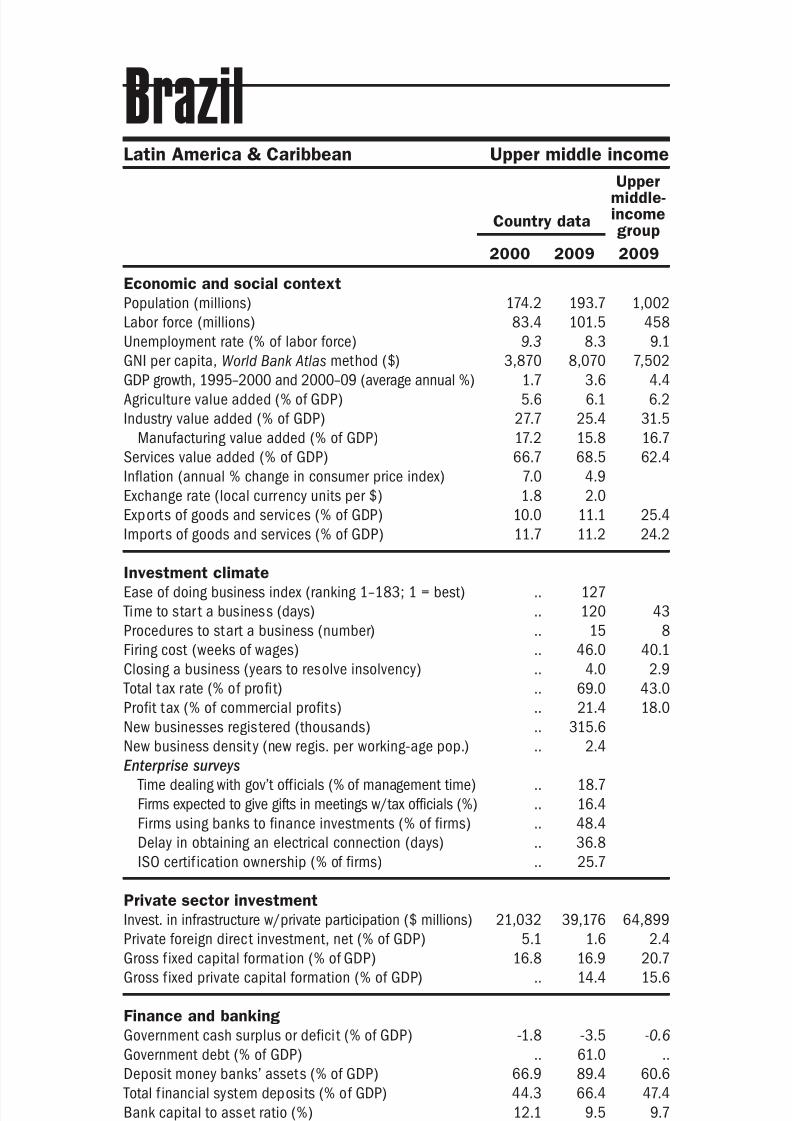
8/6/2019 The Little Data Book on Private Sector Development 2011
http://slidepdf.com/reader/full/the-little-data-book-on-private-sector-development-2011 52/246
Economic and social context
Population (millions)
Labor force (millions)
Unemployment rate (% of labor force)
GNI per capita, World Bank Atlas method ($)GDP growth, 1995–2000 and 2000–09 (average annual %)
Agriculture value added (% of GDP)
Industry value added (% of GDP)
Manufacturing value added (% of GDP)
Services value added (% of GDP)
Inflation (annual % change in consumer price index)
Exchange rate (local currency units per $)
Exports of goods and services (% of GDP)
Imports of goods and services (% of GDP) Investment climate
Ease of doing business index (ranking 1–183; 1 = best)
Time to star t a business (days)
Procedures to start a business (number)
Firing cost (weeks of wages)
Closing a business (years to resolve insolvency)
Total tax rate (% of profit)
Profit tax (% of commercial profits)New businesses registered (thousands)
New business density (new regis. per working-age pop.)
Enterprise surveys
Time dealing with gov’t officials (% of management time)
Firms expected to give gifts in meetings w/tax officials (%)
Firms using banks to finance investments (% of firms)
Delay in obtaining an electrical connection (days)
ISO certif ication ownership (% of firms)
Private sector investment
Invest. in infrastructure w/private participation ($ millions)
Private foreign direct investment, net (% of GDP)
Gross f ixed capital formation (% of GDP)
Gross f ixed private capital formation (% of GDP)
Finance and banking
Government cash surplus or deficit (% of GDP)
Government debt (% of GDP)
Deposit money banks’ assets (% of GDP) Total f inancial system deposits (% of GDP)
Bank capital to asset ratio (%)
Bank nonperforming loans to total gross loans ratio (%)
Domestic credit to the private sector (% of GDP)
Real interest rate (%)
Interest rate spread (percentage points)
Infrastructure
Paved roads (% of total roads)Electr ic power consumption (kWh per capita)
Power outages in a typical month (number)
Mobile cellular subscriptions (per 100 people)
Internet users (per 100 people)
44 2011 The Little Data Book on Private Sector Development
Country data
Uppermiddle-incomegroup
2000 2009 2009
Latin America & Caribbean Upper middle income
Brazil
174.2 193.7 1,002
83.4 101.5 458
9.3 8.3 9.1
3,870 8,070 7,5021.7 3.6 4.4
5.6 6.1 6.2
27.7 25.4 31.5
17.2 15.8 16.7
66.7 68.5 62.4
7.0 4.9
1.8 2.0
10.0 11.1 25.4
11.7 11.2 24.2
.. 127
.. 120 43
.. 15 8
.. 46.0 40.1
.. 4.0 2.9
.. 69.0 43.0
.. 21.4 18.0.. 315.6
.. 2.4
.. 18.7
.. 16.4
.. 48.4
.. 36.8
.. 25.7
21,032 39,176 64,899
5.1 1.6 2.4
16.8 16.9 20.7
.. 14.4 15.6
-1.8 -3.5 -0.6
.. 61.0 ..
66.9 89.4 60.644.3 66.4 47.4
12.1 9.5 9.7
8.3 4.2 4.2
31.7 54.0 47.8
47.7 36.8
39.6 35.4 5.5
5.5 .. 36.81,894 2,232 3,001
.. 2.7
13.3 89.8 100.6
2.9 39.2 34.6

8/6/2019 The Little Data Book on Private Sector Development 2011
http://slidepdf.com/reader/full/the-little-data-book-on-private-sector-development-2011 53/246
Economic and social context
Population (millions)
Labor force (millions)
Unemployment rate (% of labor force)
GNI per capita, World Bank Atlas method ($)GDP growth, 1995–2000 and 2000–09 (average annual %)
Agriculture value added (% of GDP)
Industry value added (% of GDP)
Manufacturing value added (% of GDP)
Services value added (% of GDP)
Inflation (annual % change in consumer price index)
Exchange rate (local currency units per $)
Exports of goods and services (% of GDP)
Imports of goods and services (% of GDP) Investment climate
Ease of doing business index (ranking 1–183; 1 = best)
Time to star t a business (days)
Procedures to start a business (number)
Firing cost (weeks of wages)
Closing a business (years to resolve insolvency)
Total tax rate (% of profit)
Profit tax (% of commercial profits)New businesses registered (thousands)
New business density (new regis. per working-age pop.)
Enterprise surveys
Time dealing with gov’t officials (% of management time)
Firms expected to give gifts in meetings w/tax officials (%)
Firms using banks to finance investments (% of firms)
Delay in obtaining an electrical connection (days)
ISO certi fication ownership (% of firms)
Private sector investment
Invest. in infrastructure w/private participation ($ millions)
Private foreign direct investment, net (% of GDP)
Gross f ixed capital formation (% of GDP)
Gross f ixed private capital formation (% of GDP)
Finance and banking
Government cash surplus or deficit (% of GDP)
Government debt (% of GDP)
Deposit money banks’ assets (% of GDP) Total f inancial system deposits (% of GDP)
Bank capital to asset ratio (%)
Bank nonperforming loans to total gross loans ratio (%)
Domestic credit to the private sector (% of GDP)
Real interest rate (%)
Interest rate spread (percentage points)
Infrastructure
Paved roads (% of total roads)Electr ic power consumption (kWh per capita)
Power outages in a typical month (number)
Mobile cellular subscriptions (per 100 people)
Internet users (per 100 people)
45The Little Data Book on Private Sector Development 2011
Country data
High-incomegroup
2000 2009 2009
High income
Brunei Darussalam
0.33 0.40 1,117
0.15 0.20 547
.. .. 8.1
14,670 27,050 37,9901.0 2.1 2.0
1.0 0.7 1.5
63.7 71.0 25.0
15.4 10.4 15.9
35.3 28.3 73.5
1.6 1.0
1.7 1.5
67.4 67.7 23.6
35.8 27.8 23.9
.. 112
.. 105 18
.. 15 6
.. 4.0 37.9
.. 2.5 2.1
.. 29.8 38.6
.. 24.2 14.3.. ..
.. ..
.. ..
.. ..
.. ..
.. ..
.. ..
.. .. ..
1.1 0.8 2.0
13.0 13.0 18.0
.. .. ..
.. .. -7.7
.. .. 55.7
69.9 33.8 140.0111.3 71.8 108.5
.. .. 6.8
.. .. 3.4
50.3 37.4 165.1
-18.2 4.5
.. 4.8 3.8
34.7 77.2 93.47,539 8,308 9,518
.. ..
28.5 106.7 111.2
9.0 79.8 72.3

8/6/2019 The Little Data Book on Private Sector Development 2011
http://slidepdf.com/reader/full/the-little-data-book-on-private-sector-development-2011 54/246
Economic and social context
Population (millions)
Labor force (millions)
Unemployment rate (% of labor force)
GNI per capita, World Bank Atlas method ($)GDP growth, 1995–2000 and 2000–09 (average annual %)
Agriculture value added (% of GDP)
Industry value added (% of GDP)
Manufacturing value added (% of GDP)
Services value added (% of GDP)
Inflation (annual % change in consumer price index)
Exchange rate (local currency units per $)
Exports of goods and services (% of GDP)
Imports of goods and services (% of GDP) Investment climate
Ease of doing business index (ranking 1–183; 1 = best)
Time to star t a business (days)
Procedures to start a business (number)
Firing cost (weeks of wages)
Closing a business (years to resolve insolvency)
Total tax rate (% of profit)
Profit tax (% of commercial profits)New businesses registered (thousands)
New business density (new regis. per working-age pop.)
Enterprise surveys
Time dealing with gov’t officials (% of management time)
Firms expected to give gifts in meetings w/tax officials (%)
Firms using banks to finance investments (% of firms)
Delay in obtaining an electrical connection (days)
ISO certif ication ownership (% of firms)
Private sector investment
Invest. in infrastructure w/private participation ($ millions)
Private foreign direct investment, net (% of GDP)
Gross f ixed capital formation (% of GDP)
Gross f ixed private capital formation (% of GDP)
Finance and banking
Government cash surplus or deficit (% of GDP)
Government debt (% of GDP)
Deposit money banks’ assets (% of GDP) Total f inancial system deposits (% of GDP)
Bank capital to asset ratio (%)
Bank nonperforming loans to total gross loans ratio (%)
Domestic credit to the private sector (% of GDP)
Real interest rate (%)
Interest rate spread (percentage points)
Infrastructure
Paved roads (% of total roads)Electr ic power consumption (kWh per capita)
Power outages in a typical month (number)
Mobile cellular subscriptions (per 100 people)
Internet users (per 100 people)
46 2011 The Little Data Book on Private Sector Development
Country data
Uppermiddle-incomegroup
2000 2009 2009
Europe & Central Asia Upper middle income
Bulgaria
8.1 7.6 1,002
3.6 3.6 458
16.2 6.8 9.1
1,640 6,060 7,5020.7 5.4 4.4
13.6 5.6 6.2
25.9 30.3 31.5
17.6 15.4 16.7
60.6 64.1 62.4
10.3 2.8
2.1 1.4
50.5 47.8 25.4
55.8 55.8 24.2
.. 51
.. 18 43
.. 4 8
.. 9.0 40.1
.. 3.3 2.9
.. 29.0 43.0
.. 4.6 18.0.. 35.5
.. 7.2
2.6 10.6
53.4 6.6
19.2 34.7
5.0 44.8
14.7 19.9
157 810 64,899
7.8 9.4 2.4
15.8 24.4 20.7
11.8 19.4 15.6
-0.4 -0.1 -0.6
.. .. ..
15.5 78.5 60.622.7 57.5 47.4
15.3 10.8 9.7
17.3 6.4 4.2
12.3 75.6 47.8
4.4 7.0
8.2 5.2 5.5
92.1 98.4 36.83,724 4,594 3,001
.. 3.7
9.2 140.0 100.6
5.3 44.8 34.6
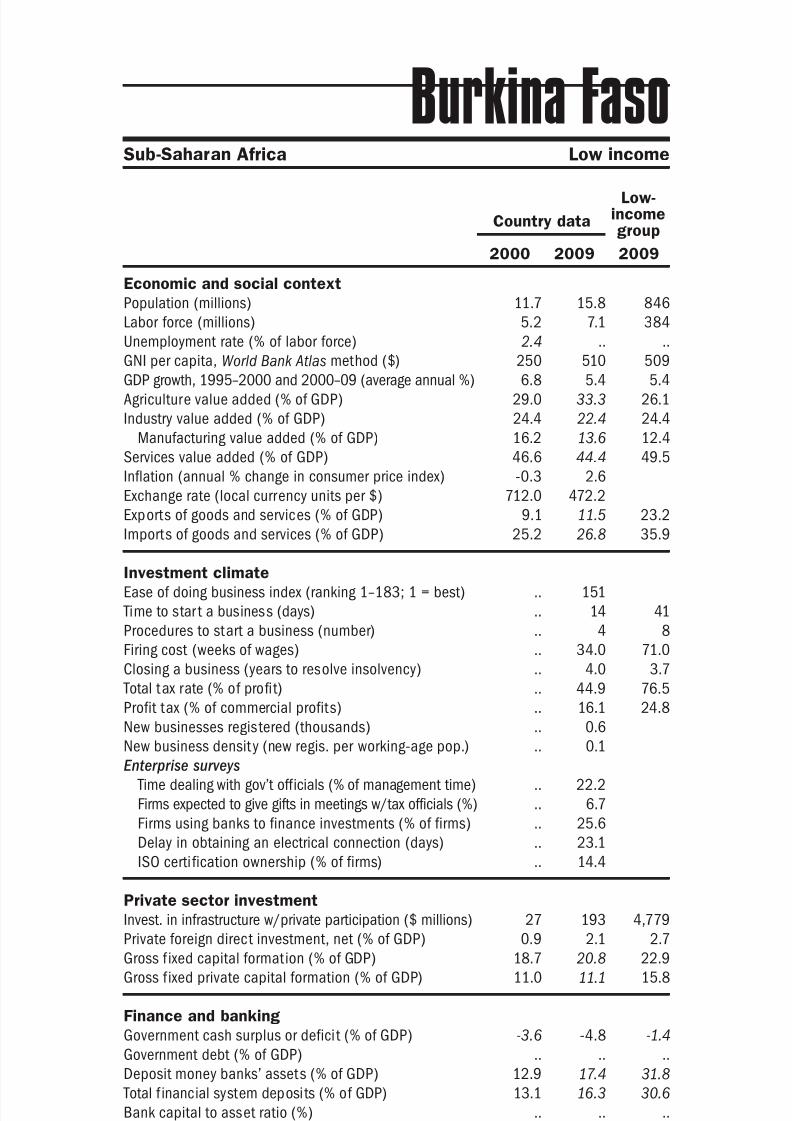
8/6/2019 The Little Data Book on Private Sector Development 2011
http://slidepdf.com/reader/full/the-little-data-book-on-private-sector-development-2011 55/246
Economic and social context
Population (millions)
Labor force (millions)
Unemployment rate (% of labor force)
GNI per capita, World Bank Atlas method ($)GDP growth, 1995–2000 and 2000–09 (average annual %)
Agriculture value added (% of GDP)
Industry value added (% of GDP)
Manufacturing value added (% of GDP)
Services value added (% of GDP)
Inflation (annual % change in consumer price index)
Exchange rate (local currency units per $)
Exports of goods and services (% of GDP)
Imports of goods and services (% of GDP) Investment climate
Ease of doing business index (ranking 1–183; 1 = best)
Time to star t a business (days)
Procedures to start a business (number)
Firing cost (weeks of wages)
Closing a business (years to resolve insolvency)
Total tax rate (% of profit)
Profit tax (% of commercial profits)New businesses registered (thousands)
New business density (new regis. per working-age pop.)
Enterprise surveys
Time dealing with gov’t officials (% of management time)
Firms expected to give gifts in meetings w/tax officials (%)
Firms using banks to finance investments (% of firms)
Delay in obtaining an electrical connection (days)
ISO certi fication ownership (% of firms)
Private sector investment
Invest. in infrastructure w/private participation ($ millions)
Private foreign direct investment, net (% of GDP)
Gross f ixed capital formation (% of GDP)
Gross f ixed private capital formation (% of GDP)
Finance and banking
Government cash surplus or deficit (% of GDP)
Government debt (% of GDP)
Deposit money banks’ assets (% of GDP) Total f inancial system deposits (% of GDP)
Bank capital to asset ratio (%)
Bank nonperforming loans to total gross loans ratio (%)
Domestic credit to the private sector (% of GDP)
Real interest rate (%)
Interest rate spread (percentage points)
Infrastructure
Paved roads (% of total roads)Electr ic power consumption (kWh per capita)
Power outages in a typical month (number)
Mobile cellular subscriptions (per 100 people)
Internet users (per 100 people)
47The Little Data Book on Private Sector Development 2011
Sub-Saharan Africa Low income
Country data
Low-incomegroup
2000 2009 2009
Burkina Faso
11.7 15.8 846
5.2 7.1 384
2.4 .. ..
250 510 5096.8 5.4 5.4
29.0 33.3 26.1
24.4 22.4 24.4
16.2 13.6 12.4
46.6 44.4 49.5
-0.3 2.6
712.0 472.2
9.1 11.5 23.2
25.2 26.8 35.9
.. 151
.. 14 41
.. 4 8
.. 34.0 71.0
.. 4.0 3.7
.. 44.9 76.5
.. 16.1 24.8.. 0.6
.. 0.1
.. 22.2
.. 6.7
.. 25.6
.. 23.1
.. 14.4
27 193 4,779
0.9 2.1 2.7
18.7 20.8 22.9
11.0 11.1 15.8
-3.6 -4.8 -1.4
.. .. ..
12.9 17.4 31.813.1 16.3 30.6
.. .. ..
.. .. ..
11.7 17.5 26.3
.. ..
.. .. 11.5
16.0 4.2 12.0.. .. 231
.. 10.8
0.2 20.9 26.6
0.1 1.1 2.7

8/6/2019 The Little Data Book on Private Sector Development 2011
http://slidepdf.com/reader/full/the-little-data-book-on-private-sector-development-2011 56/246
Economic and social context
Population (millions)
Labor force (millions)
Unemployment rate (% of labor force)
GNI per capita, World Bank Atlas method ($)GDP growth, 1995–2000 and 2000–09 (average annual %)
Agriculture value added (% of GDP)
Industry value added (% of GDP)
Manufacturing value added (% of GDP)
Services value added (% of GDP)
Inflation (annual % change in consumer price index)
Exchange rate (local currency units per $)
Exports of goods and services (% of GDP)
Imports of goods and services (% of GDP) Investment climate
Ease of doing business index (ranking 1–183; 1 = best)
Time to star t a business (days)
Procedures to start a business (number)
Firing cost (weeks of wages)
Closing a business (years to resolve insolvency)
Total tax rate (% of profit)
Profit tax (% of commercial profits)New businesses registered (thousands)
New business density (new regis. per working-age pop.)
Enterprise surveys
Time dealing with gov’t officials (% of management time)
Firms expected to give gifts in meetings w/tax officials (%)
Firms using banks to finance investments (% of firms)
Delay in obtaining an electrical connection (days)
ISO certif ication ownership (% of firms)
Private sector investment
Invest. in infrastructure w/private participation ($ millions)
Private foreign direct investment, net (% of GDP)
Gross f ixed capital formation (% of GDP)
Gross f ixed private capital formation (% of GDP)
Finance and banking
Government cash surplus or deficit (% of GDP)
Government debt (% of GDP)
Deposit money banks’ assets (% of GDP) Total f inancial system deposits (% of GDP)
Bank capital to asset ratio (%)
Bank nonperforming loans to total gross loans ratio (%)
Domestic credit to the private sector (% of GDP)
Real interest rate (%)
Interest rate spread (percentage points)
Infrastructure
Paved roads (% of total roads)Electr ic power consumption (kWh per capita)
Power outages in a typical month (number)
Mobile cellular subscriptions (per 100 people)
Internet users (per 100 people)
48 2011 The Little Data Book on Private Sector Development
Country data
Low-incomegroup
2000 2009 2009
Sub-Saharan Africa Low income
Burundi
6.5 8.3 846
3.1 4.6 384
.. .. ..
120 150 509-0.7 3.0 5.4
40.4 34.8 26.1
18.8 20.0 24.4
8.7 8.8 12.4
40.8 45.1 49.5
24.3 11.0
720.7 1,230.2
7.8 10.7 23.2
19.9 47.0 35.9
.. 181
.. 32 41
.. 11 8
.. 26.0 71.0
.. .. 3.7
.. 153.4 76.5
.. 19.4 24.8.. ..
.. ..
.. 5.7
.. 22.6
.. 12.3
.. 24.1
.. 7.1
36 6 4,779
1.6 0.0 2.7
6.1 16.4 22.9
0.8 1.7 15.8
-2.4 .. -1.4
162.6 .. ..
20.4 24.2 31.814.5 31.5 30.6
.. .. ..
.. .. ..
25.0 21.7 26.3
2.3 0.4
.. .. 11.5
7.1 10.4 12.0.. .. 231
.. 12.0
0.3 10.1 26.6
0.1 0.8 2.7
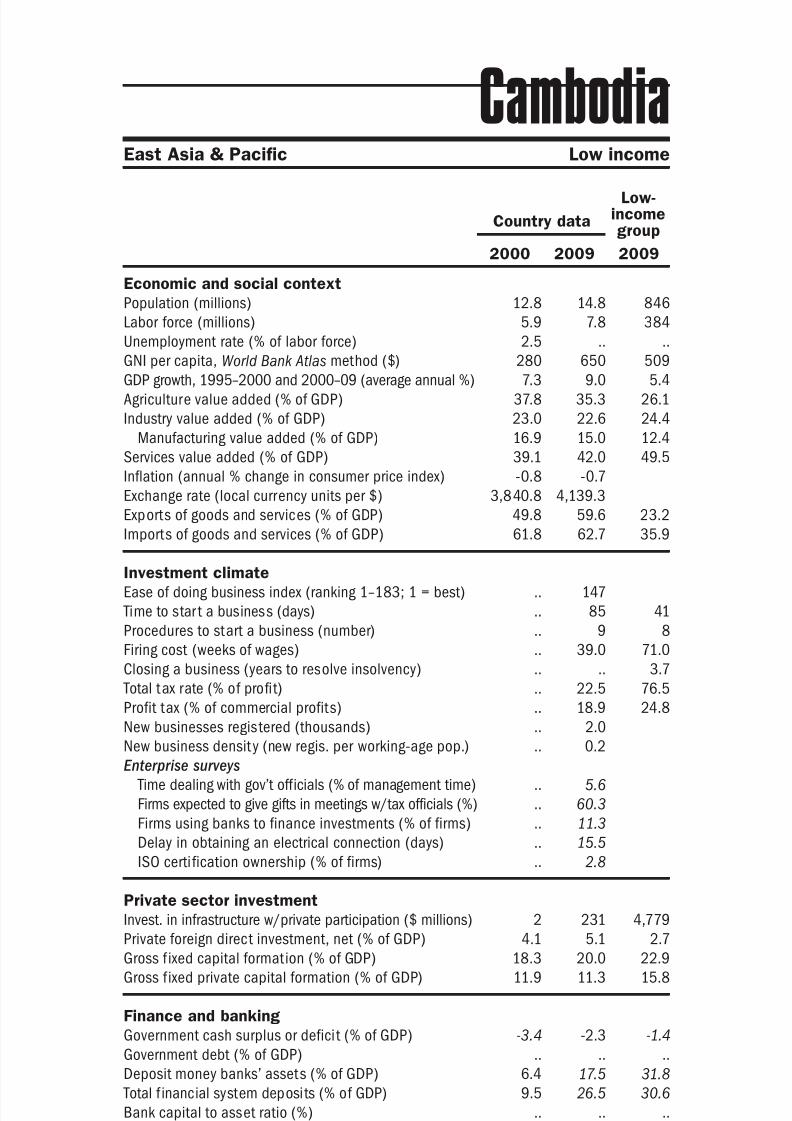
8/6/2019 The Little Data Book on Private Sector Development 2011
http://slidepdf.com/reader/full/the-little-data-book-on-private-sector-development-2011 57/246
Economic and social context
Population (millions)
Labor force (millions)
Unemployment rate (% of labor force)
GNI per capita, World Bank Atlas method ($)GDP growth, 1995–2000 and 2000–09 (average annual %)
Agriculture value added (% of GDP)
Industry value added (% of GDP)
Manufacturing value added (% of GDP)
Services value added (% of GDP)
Inflation (annual % change in consumer price index)
Exchange rate (local currency units per $)
Exports of goods and services (% of GDP)
Imports of goods and services (% of GDP) Investment climate
Ease of doing business index (ranking 1–183; 1 = best)
Time to star t a business (days)
Procedures to start a business (number)
Firing cost (weeks of wages)
Closing a business (years to resolve insolvency)
Total tax rate (% of profit)
Profit tax (% of commercial profits)New businesses registered (thousands)
New business density (new regis. per working-age pop.)
Enterprise surveys
Time dealing with gov’t officials (% of management time)
Firms expected to give gifts in meetings w/tax officials (%)
Firms using banks to finance investments (% of firms)
Delay in obtaining an electrical connection (days)
ISO certi fication ownership (% of firms)
Private sector investment
Invest. in infrastructure w/private participation ($ millions)
Private foreign direct investment, net (% of GDP)
Gross f ixed capital formation (% of GDP)
Gross f ixed private capital formation (% of GDP)
Finance and banking
Government cash surplus or deficit (% of GDP)
Government debt (% of GDP)
Deposit money banks’ assets (% of GDP) Total f inancial system deposits (% of GDP)
Bank capital to asset ratio (%)
Bank nonperforming loans to total gross loans ratio (%)
Domestic credit to the private sector (% of GDP)
Real interest rate (%)
Interest rate spread (percentage points)
Infrastructure
Paved roads (% of total roads)Electr ic power consumption (kWh per capita)
Power outages in a typical month (number)
Mobile cellular subscriptions (per 100 people)
Internet users (per 100 people)
49The Little Data Book on Private Sector Development 2011
East Asia & Pacific Low income
Country data
Low-incomegroup
2000 2009 2009
Cambodia
12.8 14.8 846
5.9 7.8 384
2.5 .. ..
280 650 5097.3 9.0 5.4
37.8 35.3 26.1
23.0 22.6 24.4
16.9 15.0 12.4
39.1 42.0 49.5
-0.8 -0.7
3,840.8 4,139.3
49.8 59.6 23.2
61.8 62.7 35.9
.. 147
.. 85 41
.. 9 8
.. 39.0 71.0
.. .. 3.7
.. 22.5 76.5
.. 18.9 24.8.. 2.0
.. 0.2
.. 5.6
.. 60.3
.. 11.3
.. 15.5
.. 2.8
2 231 4,779
4.1 5.1 2.7
18.3 20.0 22.9
11.9 11.3 15.8
-3.4 -2.3 -1.4
.. .. ..
6.4 17.5 31.89.5 26.5 30.6
.. .. ..
.. .. ..
6.4 24.5 26.3
.. ..
.. .. 11.5
7.5 6.3 12.029 113 231
.. 27.0
1.0 37.8 26.6
0.0 0.5 2.7
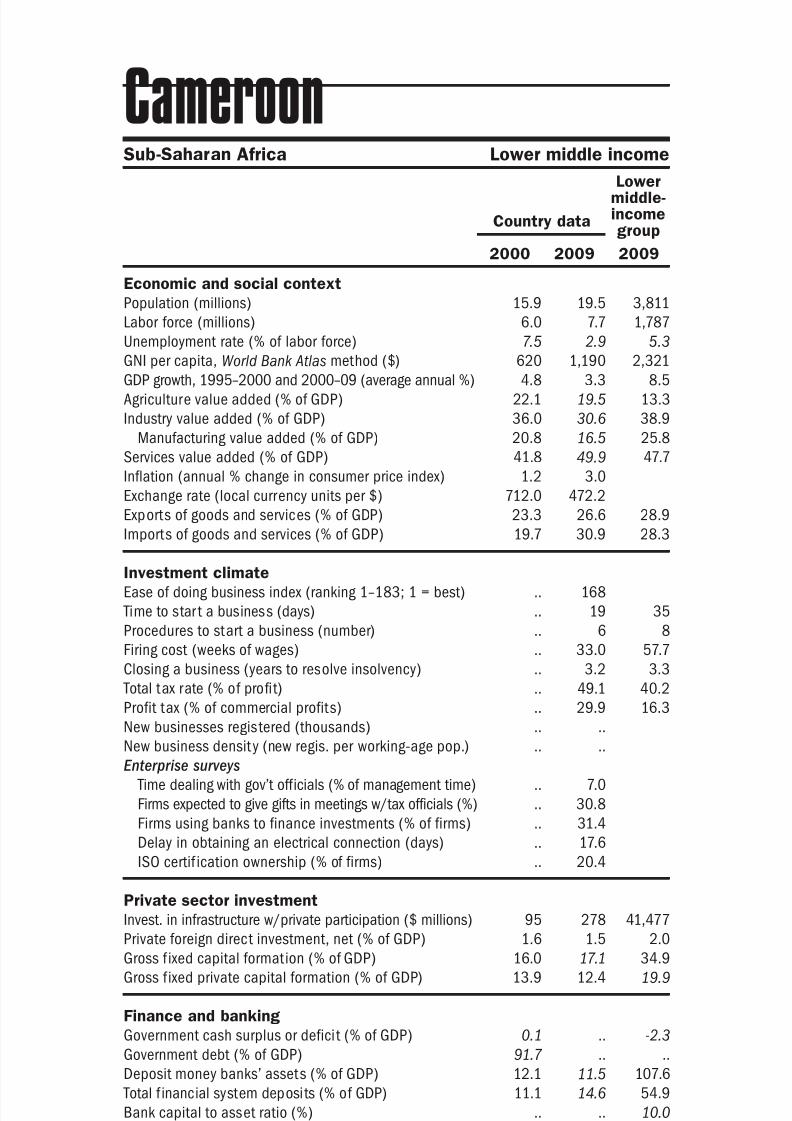
8/6/2019 The Little Data Book on Private Sector Development 2011
http://slidepdf.com/reader/full/the-little-data-book-on-private-sector-development-2011 58/246
Economic and social context
Population (millions)
Labor force (millions)
Unemployment rate (% of labor force)
GNI per capita, World Bank Atlas method ($)GDP growth, 1995–2000 and 2000–09 (average annual %)
Agriculture value added (% of GDP)
Industry value added (% of GDP)
Manufacturing value added (% of GDP)
Services value added (% of GDP)
Inflation (annual % change in consumer price index)
Exchange rate (local currency units per $)
Exports of goods and services (% of GDP)
Imports of goods and services (% of GDP) Investment climate
Ease of doing business index (ranking 1–183; 1 = best)
Time to star t a business (days)
Procedures to start a business (number)
Firing cost (weeks of wages)
Closing a business (years to resolve insolvency)
Total tax rate (% of profit)
Profit tax (% of commercial profits)New businesses registered (thousands)
New business density (new regis. per working-age pop.)
Enterprise surveys
Time dealing with gov’t officials (% of management time)
Firms expected to give gifts in meetings w/tax officials (%)
Firms using banks to finance investments (% of firms)
Delay in obtaining an electrical connection (days)
ISO certif ication ownership (% of firms)
Private sector investment
Invest. in infrastructure w/private participation ($ millions)
Private foreign direct investment, net (% of GDP)
Gross f ixed capital formation (% of GDP)
Gross f ixed private capital formation (% of GDP)
Finance and banking
Government cash surplus or deficit (% of GDP)
Government debt (% of GDP)
Deposit money banks’ assets (% of GDP) Total f inancial system deposits (% of GDP)
Bank capital to asset ratio (%)
Bank nonperforming loans to total gross loans ratio (%)
Domestic credit to the private sector (% of GDP)
Real interest rate (%)
Interest rate spread (percentage points)
Infrastructure
Paved roads (% of total roads)Electr ic power consumption (kWh per capita)
Power outages in a typical month (number)
Mobile cellular subscriptions (per 100 people)
Internet users (per 100 people)
50 2011 The Little Data Book on Private Sector Development
Sub-Saharan Africa Lower middle income
Country data
Lowermiddle-incomegroup
2000 2009 2009
Cameroon
15.9 19.5 3,811
6.0 7.7 1,787
7.5 2.9 5.3
620 1,190 2,3214.8 3.3 8.5
22.1 19.5 13.3
36.0 30.6 38.9
20.8 16.5 25.8
41.8 49.9 47.7
1.2 3.0
712.0 472.2
23.3 26.6 28.9
19.7 30.9 28.3
.. 168
.. 19 35
.. 6 8
.. 33.0 57.7
.. 3.2 3.3
.. 49.1 40.2
.. 29.9 16.3.. ..
.. ..
.. 7.0
.. 30.8
.. 31.4
.. 17.6
.. 20.4
95 278 41,477
1.6 1.5 2.0
16.0 17.1 34.9
13.9 12.4 19.9
0.1 .. -2.3
91.7 .. ..
12.1 11.5 107.611.1 14.6 54.9
.. .. 10.0
.. .. 5.1
8.2 11.3 92.9
18.6 12.7
17.0 10.8 7.3
8.1 8.4 36.3171 263 1,318
.. 10.5
0.7 37.9 57.8
0.3 3.8 17.2

8/6/2019 The Little Data Book on Private Sector Development 2011
http://slidepdf.com/reader/full/the-little-data-book-on-private-sector-development-2011 59/246

8/6/2019 The Little Data Book on Private Sector Development 2011
http://slidepdf.com/reader/full/the-little-data-book-on-private-sector-development-2011 60/246
Economic and social context
Population (millions)
Labor force (millions)
Unemployment rate (% of labor force)
GNI per capita, World Bank Atlas method ($)GDP growth, 1995–2000 and 2000–09 (average annual %)
Agriculture value added (% of GDP)
Industry value added (% of GDP)
Manufacturing value added (% of GDP)
Services value added (% of GDP)
Inflation (annual % change in consumer price index)
Exchange rate (local currency units per $)
Exports of goods and services (% of GDP)
Imports of goods and services (% of GDP) Investment climate
Ease of doing business index (ranking 1–183; 1 = best)
Time to star t a business (days)
Procedures to start a business (number)
Firing cost (weeks of wages)
Closing a business (years to resolve insolvency)
Total tax rate (% of profit)
Profit tax (% of commercial profits)New businesses registered (thousands)
New business density (new regis. per working-age pop.)
Enterprise surveys
Time dealing with gov’t officials (% of management time)
Firms expected to give gifts in meetings w/tax officials (%)
Firms using banks to finance investments (% of firms)
Delay in obtaining an electrical connection (days)
ISO certif ication ownership (% of firms)
Private sector investment
Invest. in infrastructure w/private participation ($ millions)
Private foreign direct investment, net (% of GDP)
Gross f ixed capital formation (% of GDP)
Gross f ixed private capital formation (% of GDP)
Finance and banking
Government cash surplus or deficit (% of GDP)
Government debt (% of GDP)
Deposit money banks’ assets (% of GDP) Total f inancial system deposits (% of GDP)
Bank capital to asset ratio (%)
Bank nonperforming loans to total gross loans ratio (%)
Domestic credit to the private sector (% of GDP)
Real interest rate (%)
Interest rate spread (percentage points)
Infrastructure
Paved roads (% of total roads)Electr ic power consumption (kWh per capita)
Power outages in a typical month (number)
Mobile cellular subscriptions (per 100 people)
Internet users (per 100 people)
52 2011 The Little Data Book on Private Sector Development
Country data
Lowermiddle-incomegroup
2000 2009 2009
Sub-Saharan Africa Lower middle income
Cape Verde
0.44 0.51 3,811
0.16 0.21 1,787
.. .. 5.3
1,310 3,010 2,3216.6 6.4 8.5
12.0 9.2 13.3
17.9 20.1 38.9
9.3 6.7 25.8
70.2 70.7 47.7
-2.5 1.0
119.7 79.4
27.5 23.6 28.9
61.4 65.4 28.3
.. 132
.. 11 35
.. 8 8
.. 93.0 57.7
.. .. 3.3
.. 37.1 40.2
.. 17.8 16.3.. ..
.. ..
.. 4.3
.. 1.1
.. 35.3
.. 30.5
.. 15.9
.. 23 41,477
6.3 7.7 2.0
19.7 53.8 34.9
7.2 42.7 19.9
.. -3.8 -2.3
.. .. ..
51.3 60.8 107.654.4 73.6 54.9
.. .. 10.0
.. .. 5.1
40.7 64.0 92.9
13.3 6.9
7.6 8.1 7.3
69.0 .. 36.3.. .. 1,318
.. 4.9
4.5 77.5 57.8
1.8 29.7 17.2
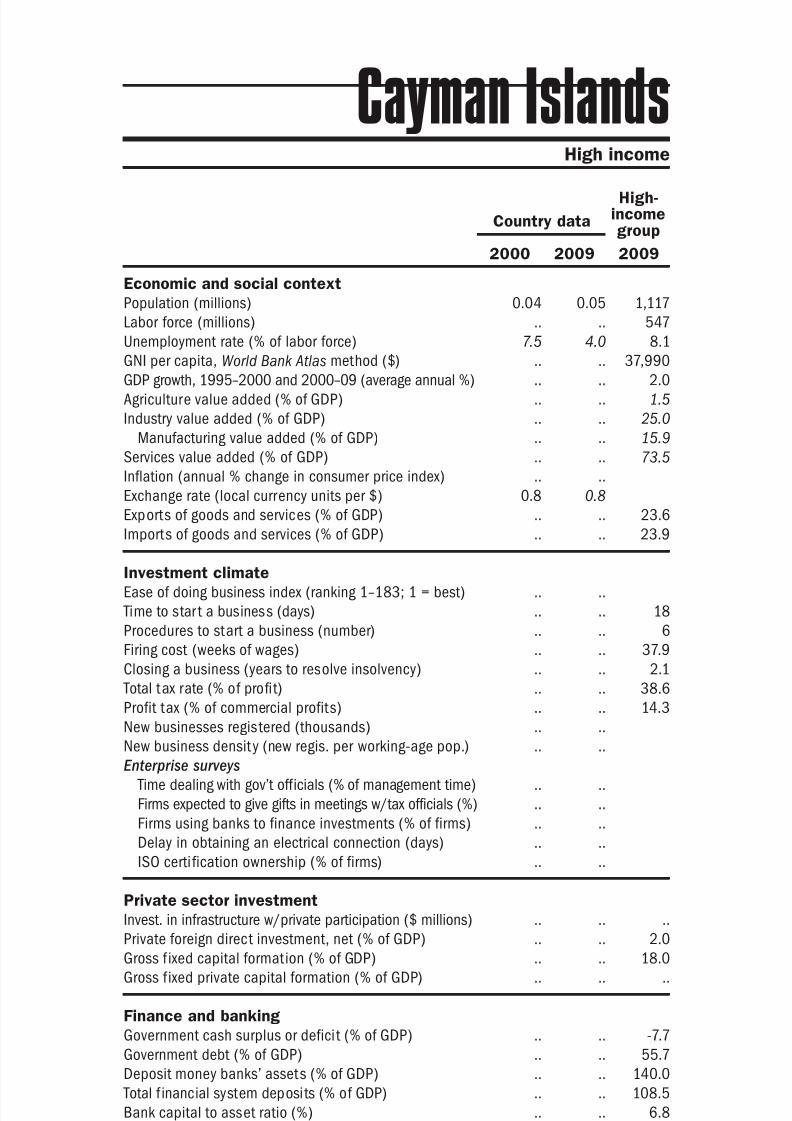
8/6/2019 The Little Data Book on Private Sector Development 2011
http://slidepdf.com/reader/full/the-little-data-book-on-private-sector-development-2011 61/246
Economic and social context
Population (millions)
Labor force (millions)
Unemployment rate (% of labor force)
GNI per capita, World Bank Atlas method ($)GDP growth, 1995–2000 and 2000–09 (average annual %)
Agriculture value added (% of GDP)
Industry value added (% of GDP)
Manufacturing value added (% of GDP)
Services value added (% of GDP)
Inflation (annual % change in consumer price index)
Exchange rate (local currency units per $)
Exports of goods and services (% of GDP)
Imports of goods and services (% of GDP) Investment climate
Ease of doing business index (ranking 1–183; 1 = best)
Time to star t a business (days)
Procedures to start a business (number)
Firing cost (weeks of wages)
Closing a business (years to resolve insolvency)
Total tax rate (% of profit)
Profit tax (% of commercial profits)New businesses registered (thousands)
New business density (new regis. per working-age pop.)
Enterprise surveys
Time dealing with gov’t officials (% of management time)
Firms expected to give gifts in meetings w/tax officials (%)
Firms using banks to finance investments (% of firms)
Delay in obtaining an electrical connection (days)
ISO certi fication ownership (% of firms)
Private sector investment
Invest. in infrastructure w/private participation ($ millions)
Private foreign direct investment, net (% of GDP)
Gross f ixed capital formation (% of GDP)
Gross f ixed private capital formation (% of GDP)
Finance and banking
Government cash surplus or deficit (% of GDP)
Government debt (% of GDP)
Deposit money banks’ assets (% of GDP) Total f inancial system deposits (% of GDP)
Bank capital to asset ratio (%)
Bank nonperforming loans to total gross loans ratio (%)
Domestic credit to the private sector (% of GDP)
Real interest rate (%)
Interest rate spread (percentage points)
Infrastructure
Paved roads (% of total roads)Electr ic power consumption (kWh per capita)
Power outages in a typical month (number)
Mobile cellular subscriptions (per 100 people)
Internet users (per 100 people)
53The Little Data Book on Private Sector Development 2011
High income
Country data
High-incomegroup
2000 2009 2009
Cayman Islands
0.04 0.05 1,117
.. .. 547
7.5 4.0 8.1
.. .. 37,990
.. .. 2.0
.. .. 1.5
.. .. 25.0
.. .. 15.9
.. .. 73.5
.. ..
0.8 0.8
.. .. 23.6
.. .. 23.9
.. ..
.. .. 18
.. .. 6
.. .. 37.9
.. .. 2.1
.. .. 38.6
.. .. 14.3.. ..
.. ..
.. ..
.. ..
.. ..
.. ..
.. ..
.. .. ..
.. .. 2.0
.. .. 18.0
.. .. ..
.. .. -7.7
.. .. 55.7
.. .. 140.0
.. .. 108.5
.. .. 6.8
.. .. 3.4
.. .. 165.1
.. ..
.. .. 3.8
.. .. 93.4
.. .. 9,518
.. ..
26.6 84.0 111.2
.. 43.7 72.3
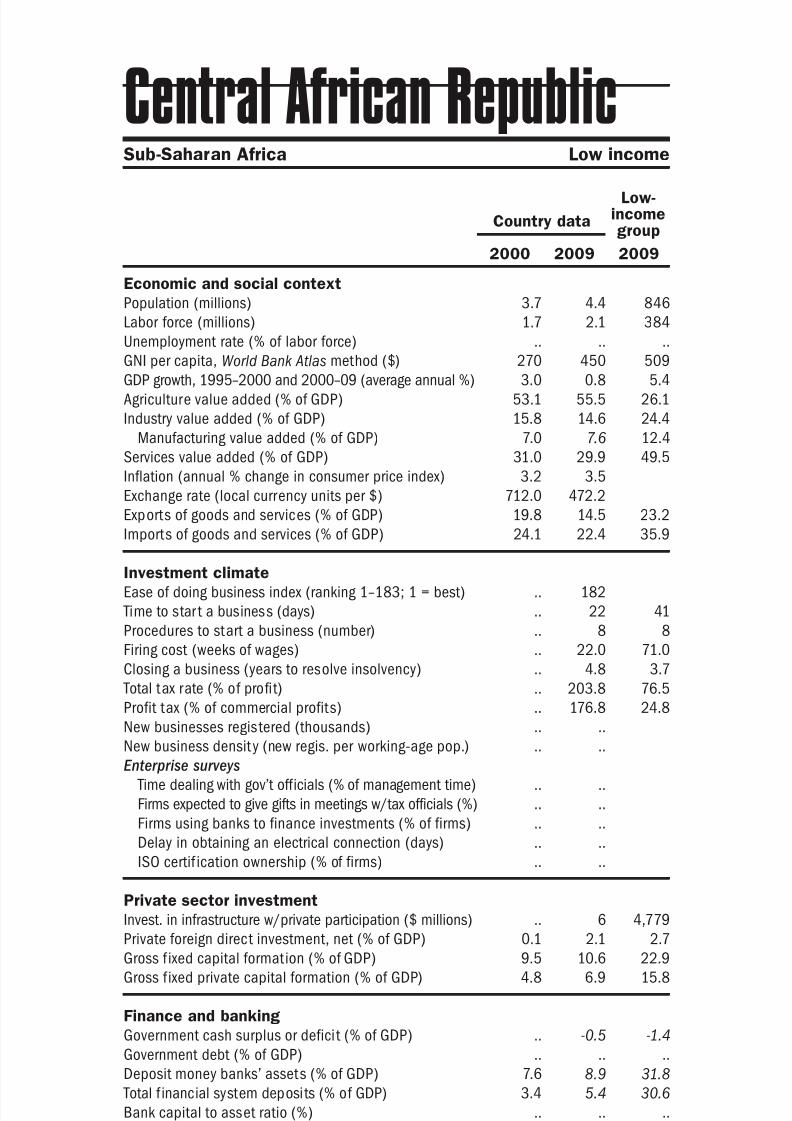
8/6/2019 The Little Data Book on Private Sector Development 2011
http://slidepdf.com/reader/full/the-little-data-book-on-private-sector-development-2011 62/246
Economic and social context
Population (millions)
Labor force (millions)
Unemployment rate (% of labor force)
GNI per capita, World Bank Atlas method ($)GDP growth, 1995–2000 and 2000–09 (average annual %)
Agriculture value added (% of GDP)
Industry value added (% of GDP)
Manufacturing value added (% of GDP)
Services value added (% of GDP)
Inflation (annual % change in consumer price index)
Exchange rate (local currency units per $)
Exports of goods and services (% of GDP)
Imports of goods and services (% of GDP) Investment climate
Ease of doing business index (ranking 1–183; 1 = best)
Time to star t a business (days)
Procedures to start a business (number)
Firing cost (weeks of wages)
Closing a business (years to resolve insolvency)
Total tax rate (% of profit)
Profit tax (% of commercial profits)New businesses registered (thousands)
New business density (new regis. per working-age pop.)
Enterprise surveys
Time dealing with gov’t officials (% of management time)
Firms expected to give gifts in meetings w/tax officials (%)
Firms using banks to finance investments (% of firms)
Delay in obtaining an electrical connection (days)
ISO certif ication ownership (% of firms)
Private sector investment
Invest. in infrastructure w/private participation ($ millions)
Private foreign direct investment, net (% of GDP)
Gross f ixed capital formation (% of GDP)
Gross f ixed private capital formation (% of GDP)
Finance and banking
Government cash surplus or deficit (% of GDP)
Government debt (% of GDP)
Deposit money banks’ assets (% of GDP) Total f inancial system deposits (% of GDP)
Bank capital to asset ratio (%)
Bank nonperforming loans to total gross loans ratio (%)
Domestic credit to the private sector (% of GDP)
Real interest rate (%)
Interest rate spread (percentage points)
Infrastructure
Paved roads (% of total roads)Electr ic power consumption (kWh per capita)
Power outages in a typical month (number)
Mobile cellular subscriptions (per 100 people)
Internet users (per 100 people)
54 2011 The Little Data Book on Private Sector Development
Country data
Low-incomegroup
2000 2009 2009
Sub-Saharan Africa Low income
Central African Republic
3.7 4.4 846
1.7 2.1 384
.. .. ..
270 450 5093.0 0.8 5.4
53.1 55.5 26.1
15.8 14.6 24.4
7.0 7.6 12.4
31.0 29.9 49.5
3.2 3.5
712.0 472.2
19.8 14.5 23.2
24.1 22.4 35.9
.. 182
.. 22 41
.. 8 8
.. 22.0 71.0
.. 4.8 3.7
.. 203.8 76.5
.. 176.8 24.8.. ..
.. ..
.. ..
.. ..
.. ..
.. ..
.. ..
.. 6 4,779
0.1 2.1 2.7
9.5 10.6 22.9
4.8 6.9 15.8
.. -0.5 -1.4
.. .. ..
7.6 8.9 31.83.4 5.4 30.6
.. .. ..
.. .. ..
4.5 7.0 26.3
18.3 12.2
17.0 10.8 11.5
2.7 .. 12.0.. .. 231
.. ..
0.1 3.8 26.6
0.1 0.5 2.7
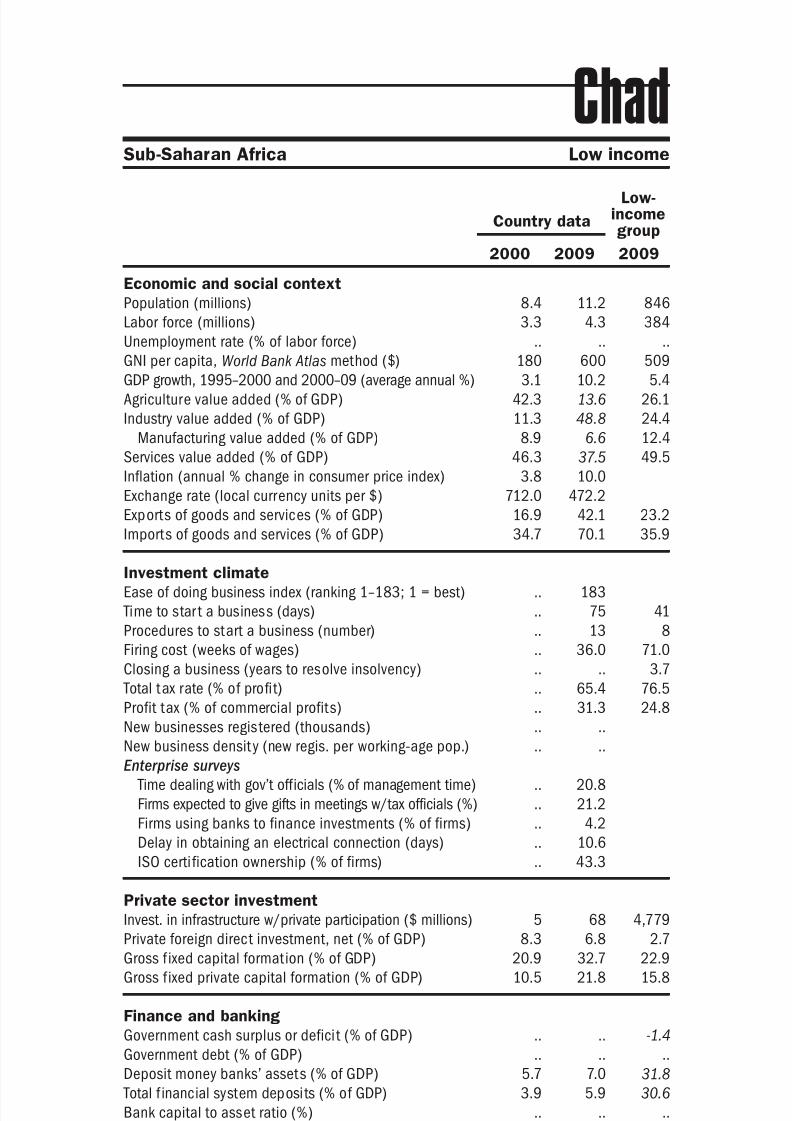
8/6/2019 The Little Data Book on Private Sector Development 2011
http://slidepdf.com/reader/full/the-little-data-book-on-private-sector-development-2011 63/246
Economic and social context
Population (millions)
Labor force (millions)
Unemployment rate (% of labor force)
GNI per capita, World Bank Atlas method ($)GDP growth, 1995–2000 and 2000–09 (average annual %)
Agriculture value added (% of GDP)
Industry value added (% of GDP)
Manufacturing value added (% of GDP)
Services value added (% of GDP)
Inflation (annual % change in consumer price index)
Exchange rate (local currency units per $)
Exports of goods and services (% of GDP)
Imports of goods and services (% of GDP) Investment climate
Ease of doing business index (ranking 1–183; 1 = best)
Time to star t a business (days)
Procedures to start a business (number)
Firing cost (weeks of wages)
Closing a business (years to resolve insolvency)
Total tax rate (% of profit)
Profit tax (% of commercial profits)New businesses registered (thousands)
New business density (new regis. per working-age pop.)
Enterprise surveys
Time dealing with gov’t officials (% of management time)
Firms expected to give gifts in meetings w/tax officials (%)
Firms using banks to finance investments (% of firms)
Delay in obtaining an electrical connection (days)
ISO certi fication ownership (% of firms)
Private sector investment
Invest. in infrastructure w/private participation ($ millions)
Private foreign direct investment, net (% of GDP)
Gross f ixed capital formation (% of GDP)
Gross f ixed private capital formation (% of GDP)
Finance and banking
Government cash surplus or deficit (% of GDP)
Government debt (% of GDP)
Deposit money banks’ assets (% of GDP) Total f inancial system deposits (% of GDP)
Bank capital to asset ratio (%)
Bank nonperforming loans to total gross loans ratio (%)
Domestic credit to the private sector (% of GDP)
Real interest rate (%)
Interest rate spread (percentage points)
Infrastructure
Paved roads (% of total roads)Electr ic power consumption (kWh per capita)
Power outages in a typical month (number)
Mobile cellular subscriptions (per 100 people)
Internet users (per 100 people)
55The Little Data Book on Private Sector Development 2011
Sub-Saharan Africa Low income
Country data
Low-incomegroup
2000 2009 2009
Chad
8.4 11.2 846
3.3 4.3 384
.. .. ..
180 600 5093.1 10.2 5.4
42.3 13.6 26.1
11.3 48.8 24.4
8.9 6.6 12.4
46.3 37.5 49.5
3.8 10.0
712.0 472.2
16.9 42.1 23.2
34.7 70.1 35.9
.. 183
.. 75 41
.. 13 8
.. 36.0 71.0
.. .. 3.7
.. 65.4 76.5
.. 31.3 24.8.. ..
.. ..
.. 20.8
.. 21.2
.. 4.2
.. 10.6
.. 43.3
5 68 4,779
8.3 6.8 2.7
20.9 32.7 22.9
10.5 21.8 15.8
.. .. -1.4
.. .. ..
5.7 7.0 31.83.9 5.9 30.6
.. .. ..
.. .. ..
3.5 5.2 26.3
15.9 9.4
17.0 10.8 11.5
0.8 .. 12.0.. .. 231
.. 22.6
0.1 24.0 26.6
0.0 1.7 2.7
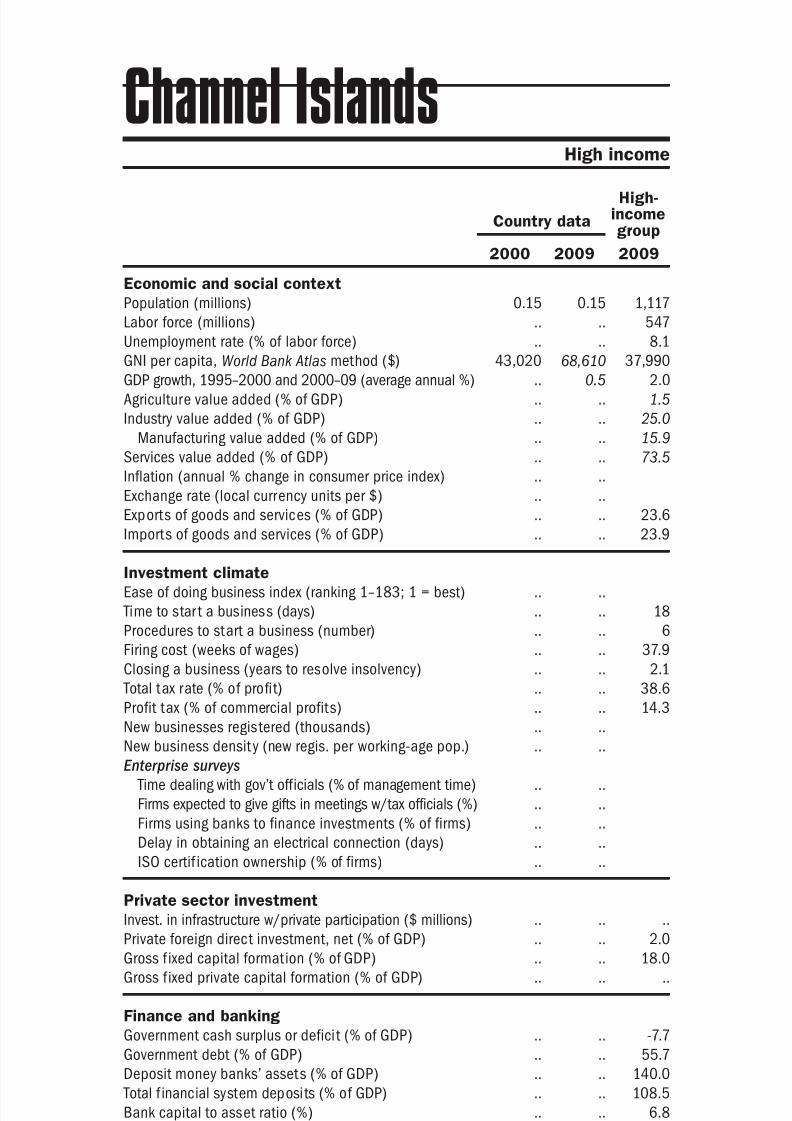
8/6/2019 The Little Data Book on Private Sector Development 2011
http://slidepdf.com/reader/full/the-little-data-book-on-private-sector-development-2011 64/246
Economic and social context
Population (millions)
Labor force (millions)
Unemployment rate (% of labor force)
GNI per capita, World Bank Atlas method ($)GDP growth, 1995–2000 and 2000–09 (average annual %)
Agriculture value added (% of GDP)
Industry value added (% of GDP)
Manufacturing value added (% of GDP)
Services value added (% of GDP)
Inflation (annual % change in consumer price index)
Exchange rate (local currency units per $)
Exports of goods and services (% of GDP)
Imports of goods and services (% of GDP) Investment climate
Ease of doing business index (ranking 1–183; 1 = best)
Time to star t a business (days)
Procedures to start a business (number)
Firing cost (weeks of wages)
Closing a business (years to resolve insolvency)
Total tax rate (% of profit)
Profit tax (% of commercial profits)New businesses registered (thousands)
New business density (new regis. per working-age pop.)
Enterprise surveys
Time dealing with gov’t officials (% of management time)
Firms expected to give gifts in meetings w/tax officials (%)
Firms using banks to finance investments (% of firms)
Delay in obtaining an electrical connection (days)
ISO certif ication ownership (% of firms)
Private sector investment
Invest. in infrastructure w/private participation ($ millions)
Private foreign direct investment, net (% of GDP)
Gross f ixed capital formation (% of GDP)
Gross f ixed private capital formation (% of GDP)
Finance and banking
Government cash surplus or deficit (% of GDP)
Government debt (% of GDP)
Deposit money banks’ assets (% of GDP) Total f inancial system deposits (% of GDP)
Bank capital to asset ratio (%)
Bank nonperforming loans to total gross loans ratio (%)
Domestic credit to the private sector (% of GDP)
Real interest rate (%)
Interest rate spread (percentage points)
Infrastructure
Paved roads (% of total roads)Electr ic power consumption (kWh per capita)
Power outages in a typical month (number)
Mobile cellular subscriptions (per 100 people)
Internet users (per 100 people)
56 2011 The Little Data Book on Private Sector Development
Country data
High-incomegroup
2000 2009 2009
High income
Channel Islands
0.15 0.15 1,117
.. .. 547
.. .. 8.1
43,020 68,610 37,990.. 0.5 2.0
.. .. 1.5
.. .. 25.0
.. .. 15.9
.. .. 73.5
.. ..
.. ..
.. .. 23.6
.. .. 23.9
.. ..
.. .. 18
.. .. 6
.. .. 37.9
.. .. 2.1
.. .. 38.6
.. .. 14.3.. ..
.. ..
.. ..
.. ..
.. ..
.. ..
.. ..
.. .. ..
.. .. 2.0
.. .. 18.0
.. .. ..
.. .. -7.7
.. .. 55.7
.. .. 140.0
.. .. 108.5
.. .. 6.8
.. .. 3.4
.. .. 165.1
.. ..
.. .. 3.8
.. .. 93.4
.. .. 9,518
.. ..
.. .. 111.2
.. .. 72.3
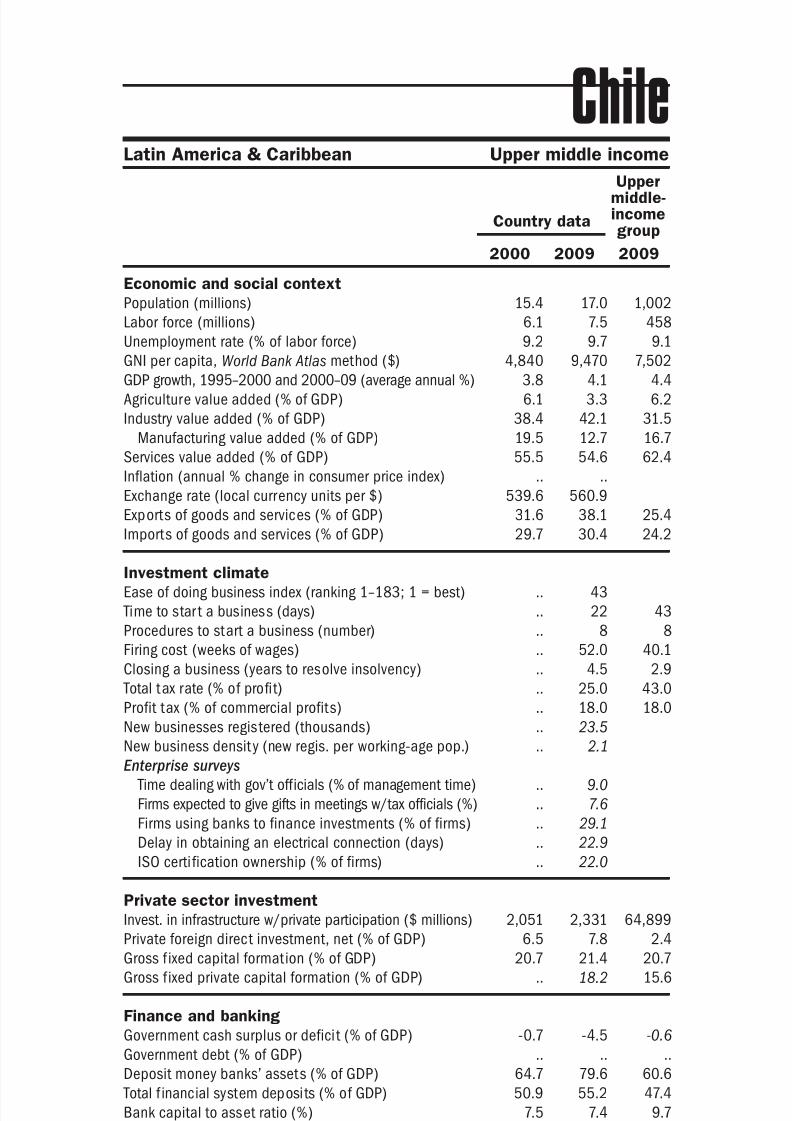
8/6/2019 The Little Data Book on Private Sector Development 2011
http://slidepdf.com/reader/full/the-little-data-book-on-private-sector-development-2011 65/246
Economic and social context
Population (millions)
Labor force (millions)
Unemployment rate (% of labor force)
GNI per capita, World Bank Atlas method ($)GDP growth, 1995–2000 and 2000–09 (average annual %)
Agriculture value added (% of GDP)
Industry value added (% of GDP)
Manufacturing value added (% of GDP)
Services value added (% of GDP)
Inflation (annual % change in consumer price index)
Exchange rate (local currency units per $)
Exports of goods and services (% of GDP)
Imports of goods and services (% of GDP) Investment climate
Ease of doing business index (ranking 1–183; 1 = best)
Time to star t a business (days)
Procedures to start a business (number)
Firing cost (weeks of wages)
Closing a business (years to resolve insolvency)
Total tax rate (% of profit)
Profit tax (% of commercial profits)New businesses registered (thousands)
New business density (new regis. per working-age pop.)
Enterprise surveys
Time dealing with gov’t officials (% of management time)
Firms expected to give gifts in meetings w/tax officials (%)
Firms using banks to finance investments (% of firms)
Delay in obtaining an electrical connection (days)
ISO certi fication ownership (% of firms)
Private sector investment
Invest. in infrastructure w/private participation ($ millions)
Private foreign direct investment, net (% of GDP)
Gross f ixed capital formation (% of GDP)
Gross f ixed private capital formation (% of GDP)
Finance and banking
Government cash surplus or deficit (% of GDP)
Government debt (% of GDP)
Deposit money banks’ assets (% of GDP) Total f inancial system deposits (% of GDP)
Bank capital to asset ratio (%)
Bank nonperforming loans to total gross loans ratio (%)
Domestic credit to the private sector (% of GDP)
Real interest rate (%)
Interest rate spread (percentage points)
Infrastructure
Paved roads (% of total roads)Electr ic power consumption (kWh per capita)
Power outages in a typical month (number)
Mobile cellular subscriptions (per 100 people)
Internet users (per 100 people)
57The Little Data Book on Private Sector Development 2011
Latin America & Caribbean Upper middle income
Country data
Uppermiddle-incomegroup
2000 2009 2009
Chile
15.4 17.0 1,002
6.1 7.5 458
9.2 9.7 9.1
4,840 9,470 7,5023.8 4.1 4.4
6.1 3.3 6.2
38.4 42.1 31.5
19.5 12.7 16.7
55.5 54.6 62.4
.. ..
539.6 560.9
31.6 38.1 25.4
29.7 30.4 24.2
.. 43
.. 22 43
.. 8 8
.. 52.0 40.1
.. 4.5 2.9
.. 25.0 43.0
.. 18.0 18.0.. 23.5
.. 2.1
.. 9.0
.. 7.6
.. 29.1
.. 22.9
.. 22.0
2,051 2,331 64,899
6.5 7.8 2.4
20.7 21.4 20.7
.. 18.2 15.6
-0.7 -4.5 -0.6
.. .. ..
64.7 79.6 60.650.9 55.2 47.4
7.5 7.4 9.7
1.7 3.0 4.2
73.6 97.5 47.8
9.8 2.9
5.6 5.2 5.5
18.4 .. 36.82,487 3,319 3,001
.. 1.7
22.1 96.9 100.6
16.6 34.0 34.6

8/6/2019 The Little Data Book on Private Sector Development 2011
http://slidepdf.com/reader/full/the-little-data-book-on-private-sector-development-2011 66/246
Economic and social context
Population (millions)
Labor force (millions)
Unemployment rate (% of labor force)
GNI per capita, World Bank Atlas method ($)GDP growth, 1995–2000 and 2000–09 (average annual %)
Agriculture value added (% of GDP)
Industry value added (% of GDP)
Manufacturing value added (% of GDP)
Services value added (% of GDP)
Inflation (annual % change in consumer price index)
Exchange rate (local currency units per $)
Exports of goods and services (% of GDP)
Imports of goods and services (% of GDP) Investment climate
Ease of doing business index (ranking 1–183; 1 = best)
Time to star t a business (days)
Procedures to start a business (number)
Firing cost (weeks of wages)
Closing a business (years to resolve insolvency)
Total tax rate (% of profit)
Profit tax (% of commercial profits)New businesses registered (thousands)
New business density (new regis. per working-age pop.)
Enterprise surveys
Time dealing with gov’t officials (% of management time)
Firms expected to give gifts in meetings w/tax officials (%)
Firms using banks to finance investments (% of firms)
Delay in obtaining an electrical connection (days)
ISO certif ication ownership (% of firms)
Private sector investment
Invest. in infrastructure w/private participation ($ millions)
Private foreign direct investment, net (% of GDP)
Gross f ixed capital formation (% of GDP)
Gross f ixed private capital formation (% of GDP)
Finance and banking
Government cash surplus or deficit (% of GDP)
Government debt (% of GDP)
Deposit money banks’ assets (% of GDP) Total f inancial system deposits (% of GDP)
Bank capital to asset ratio (%)
Bank nonperforming loans to total gross loans ratio (%)
Domestic credit to the private sector (% of GDP)
Real interest rate (%)
Interest rate spread (percentage points)
Infrastructure
Paved roads (% of total roads)Electr ic power consumption (kWh per capita)
Power outages in a typical month (number)
Mobile cellular subscriptions (per 100 people)
Internet users (per 100 people)
58 2011 The Little Data Book on Private Sector Development
Country data
Lowermiddle-incomegroup
2000 2009 2009
East Asia & Pacific Lower middle income
China
1,262.6 1,331.5 3,811
726.0 783.2 1,787
3.1 4.3 5.3
930 3,650 2,3218.5 10.9 8.5
15.1 10.3 13.3
45.9 46.3 38.9
32.1 33.9 25.8
39.0 43.4 47.7
0.3 -0.7
8.3 6.8
23.3 26.7 28.9
20.9 22.3 28.3
.. 79
.. 38 35
.. 14 8
.. 91.0 57.7
.. 1.7 3.3
.. 63.5 40.2
.. 6.0 16.3.. ..
.. ..
.. 18.3
.. 38.7
.. 28.8
.. 27.8
.. 35.9
8,131 6,120 41,477
3.2 1.6 2.0
34.1 45.6 34.9
7.5 19.8 19.9
-2.6 -2.1 -2.3
11.6 .. ..
120.2 138.3 107.639.0 53.7 54.9
4.1 5.6 10.0
22.4 1.6 5.1
112.3 127.3 92.9
3.7 6.0
3.6 3.1 7.3
.. 53.5 36.3993 2,455 1,318
.. ..
6.8 56.1 57.8
1.8 28.8 17.2
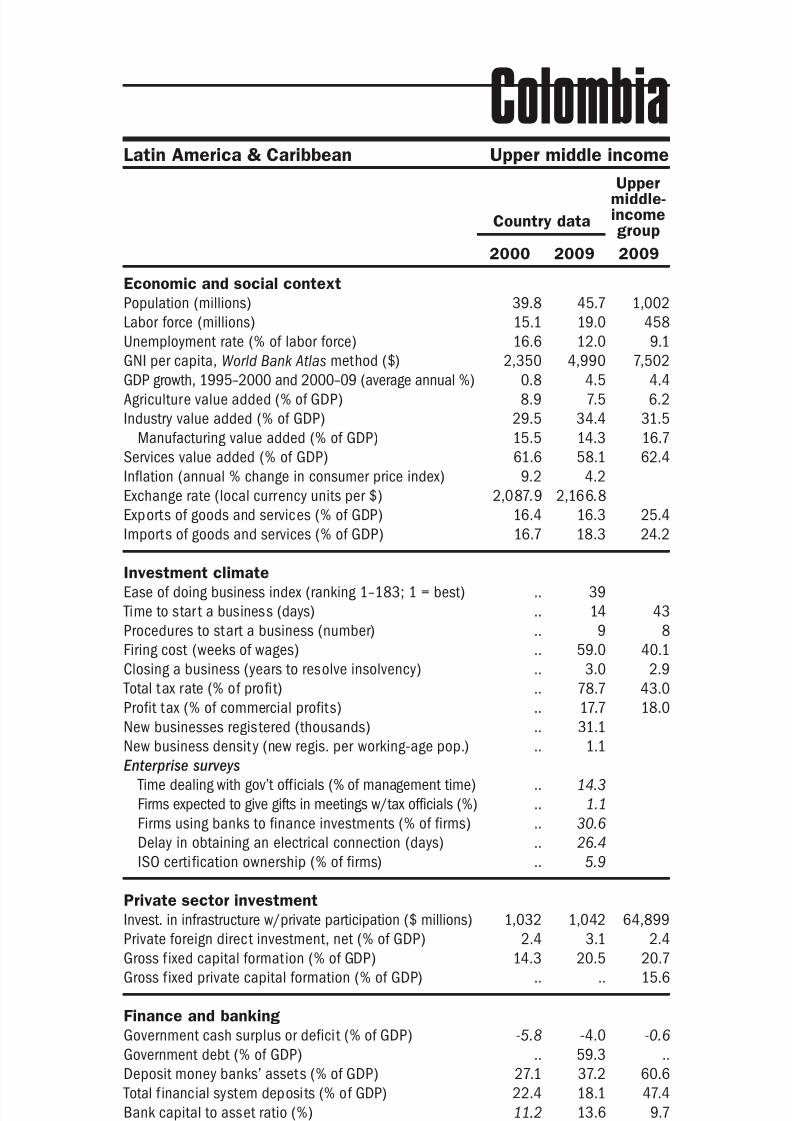
8/6/2019 The Little Data Book on Private Sector Development 2011
http://slidepdf.com/reader/full/the-little-data-book-on-private-sector-development-2011 67/246
Economic and social context
Population (millions)
Labor force (millions)
Unemployment rate (% of labor force)
GNI per capita, World Bank Atlas method ($)GDP growth, 1995–2000 and 2000–09 (average annual %)
Agriculture value added (% of GDP)
Industry value added (% of GDP)
Manufacturing value added (% of GDP)
Services value added (% of GDP)
Inflation (annual % change in consumer price index)
Exchange rate (local currency units per $)
Exports of goods and services (% of GDP)
Imports of goods and services (% of GDP) Investment climate
Ease of doing business index (ranking 1–183; 1 = best)
Time to star t a business (days)
Procedures to start a business (number)
Firing cost (weeks of wages)
Closing a business (years to resolve insolvency)
Total tax rate (% of profit)
Profit tax (% of commercial profits)New businesses registered (thousands)
New business density (new regis. per working-age pop.)
Enterprise surveys
Time dealing with gov’t officials (% of management time)
Firms expected to give gifts in meetings w/tax officials (%)
Firms using banks to finance investments (% of firms)
Delay in obtaining an electrical connection (days)
ISO certi fication ownership (% of firms)
Private sector investment
Invest. in infrastructure w/private participation ($ millions)
Private foreign direct investment, net (% of GDP)
Gross f ixed capital formation (% of GDP)
Gross f ixed private capital formation (% of GDP)
Finance and banking
Government cash surplus or deficit (% of GDP)
Government debt (% of GDP)
Deposit money banks’ assets (% of GDP) Total f inancial system deposits (% of GDP)
Bank capital to asset ratio (%)
Bank nonperforming loans to total gross loans ratio (%)
Domestic credit to the private sector (% of GDP)
Real interest rate (%)
Interest rate spread (percentage points)
Infrastructure
Paved roads (% of total roads)Electr ic power consumption (kWh per capita)
Power outages in a typical month (number)
Mobile cellular subscriptions (per 100 people)
Internet users (per 100 people)
59The Little Data Book on Private Sector Development 2011
Latin America & Caribbean Upper middle income
Country data
Uppermiddle-incomegroup
2000 2009 2009
Colombia
39.8 45.7 1,002
15.1 19.0 458
16.6 12.0 9.1
2,350 4,990 7,5020.8 4.5 4.4
8.9 7.5 6.2
29.5 34.4 31.5
15.5 14.3 16.7
61.6 58.1 62.4
9.2 4.2
2,087.9 2,166.8
16.4 16.3 25.4
16.7 18.3 24.2
.. 39
.. 14 43
.. 9 8
.. 59.0 40.1
.. 3.0 2.9
.. 78.7 43.0
.. 17.7 18.0.. 31.1
.. 1.1
.. 14.3
.. 1.1
.. 30.6
.. 26.4
.. 5.9
1,032 1,042 64,899
2.4 3.1 2.4
14.3 20.5 20.7
.. .. 15.6
-5.8 -4.0 -0.6
.. 59.3 ..
27.1 37.2 60.622.4 18.1 47.4
11.2 13.6 9.7
11.0 4.1 4.2
20.9 29.9 47.8
-10.3 7.7
6.6 6.9 5.5
14.4 .. 36.8844 974 3,001
.. 1.0
5.7 92.3 100.6
2.2 45.5 34.6
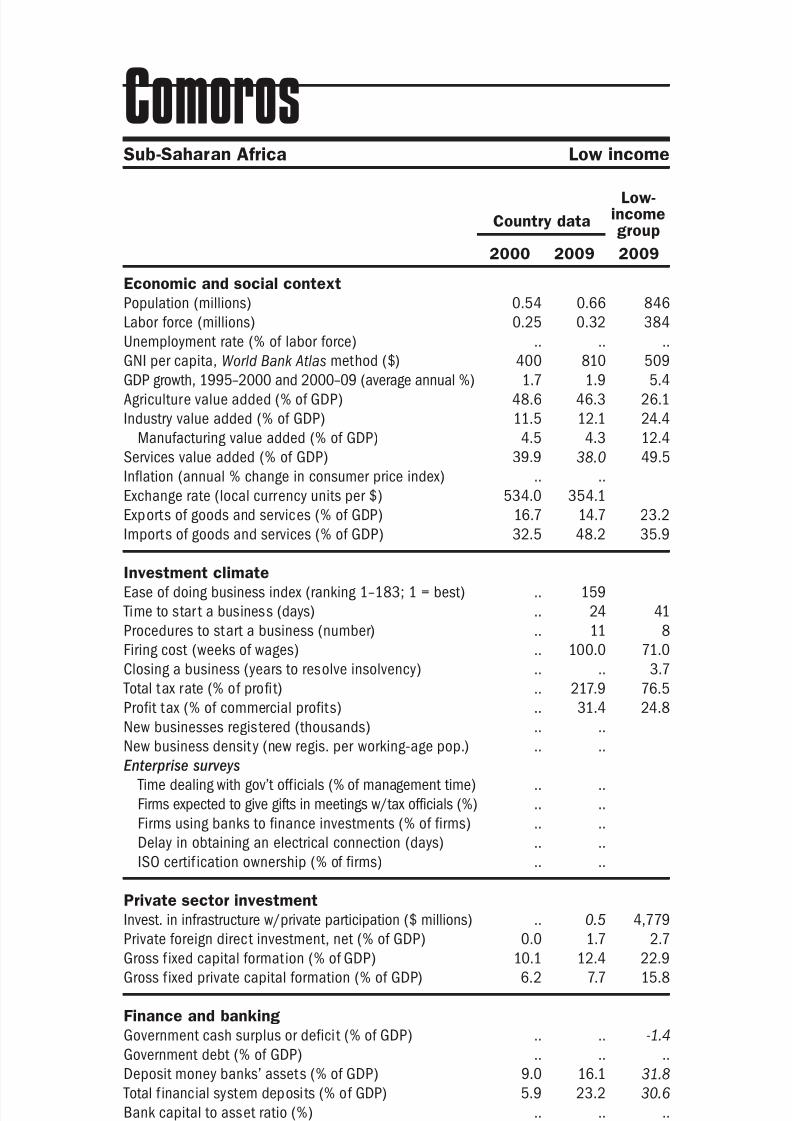
8/6/2019 The Little Data Book on Private Sector Development 2011
http://slidepdf.com/reader/full/the-little-data-book-on-private-sector-development-2011 68/246
Economic and social context
Population (millions)
Labor force (millions)
Unemployment rate (% of labor force)
GNI per capita, World Bank Atlas method ($)GDP growth, 1995–2000 and 2000–09 (average annual %)
Agriculture value added (% of GDP)
Industry value added (% of GDP)
Manufacturing value added (% of GDP)
Services value added (% of GDP)
Inflation (annual % change in consumer price index)
Exchange rate (local currency units per $)
Exports of goods and services (% of GDP)
Imports of goods and services (% of GDP) Investment climate
Ease of doing business index (ranking 1–183; 1 = best)
Time to star t a business (days)
Procedures to start a business (number)
Firing cost (weeks of wages)
Closing a business (years to resolve insolvency)
Total tax rate (% of profit)
Profit tax (% of commercial profits)New businesses registered (thousands)
New business density (new regis. per working-age pop.)
Enterprise surveys
Time dealing with gov’t officials (% of management time)
Firms expected to give gifts in meetings w/tax officials (%)
Firms using banks to finance investments (% of firms)
Delay in obtaining an electrical connection (days)
ISO certif ication ownership (% of firms)
Private sector investment
Invest. in infrastructure w/private participation ($ millions)
Private foreign direct investment, net (% of GDP)
Gross f ixed capital formation (% of GDP)
Gross f ixed private capital formation (% of GDP)
Finance and banking
Government cash surplus or deficit (% of GDP)
Government debt (% of GDP)
Deposit money banks’ assets (% of GDP) Total f inancial system deposits (% of GDP)
Bank capital to asset ratio (%)
Bank nonperforming loans to total gross loans ratio (%)
Domestic credit to the private sector (% of GDP)
Real interest rate (%)
Interest rate spread (percentage points)
Infrastructure
Paved roads (% of total roads)Electr ic power consumption (kWh per capita)
Power outages in a typical month (number)
Mobile cellular subscriptions (per 100 people)
Internet users (per 100 people)
60 2011 The Little Data Book on Private Sector Development
Country data
Low-incomegroup
2000 2009 2009
Sub-Saharan Africa Low income
Comoros
0.54 0.66 846
0.25 0.32 384
.. .. ..
400 810 5091.7 1.9 5.4
48.6 46.3 26.1
11.5 12.1 24.4
4.5 4.3 12.4
39.9 38.0 49.5
.. ..
534.0 354.1
16.7 14.7 23.2
32.5 48.2 35.9
.. 159
.. 24 41
.. 11 8
.. 100.0 71.0
.. .. 3.7
.. 217.9 76.5
.. 31.4 24.8.. ..
.. ..
.. ..
.. ..
.. ..
.. ..
.. ..
.. 0.5 4,779
0.0 1.7 2.7
10.1 12.4 22.9
6.2 7.7 15.8
.. .. -1.4
.. .. ..
9.0 16.1 31.85.9 23.2 30.6
.. .. ..
.. .. ..
11.9 16.0 26.3
8.3 5.7
9.0 8.6 11.5
76.5 .. 12.0.. .. 231
.. ..
0.0 15.2 26.6
0.3 3.7 2.7
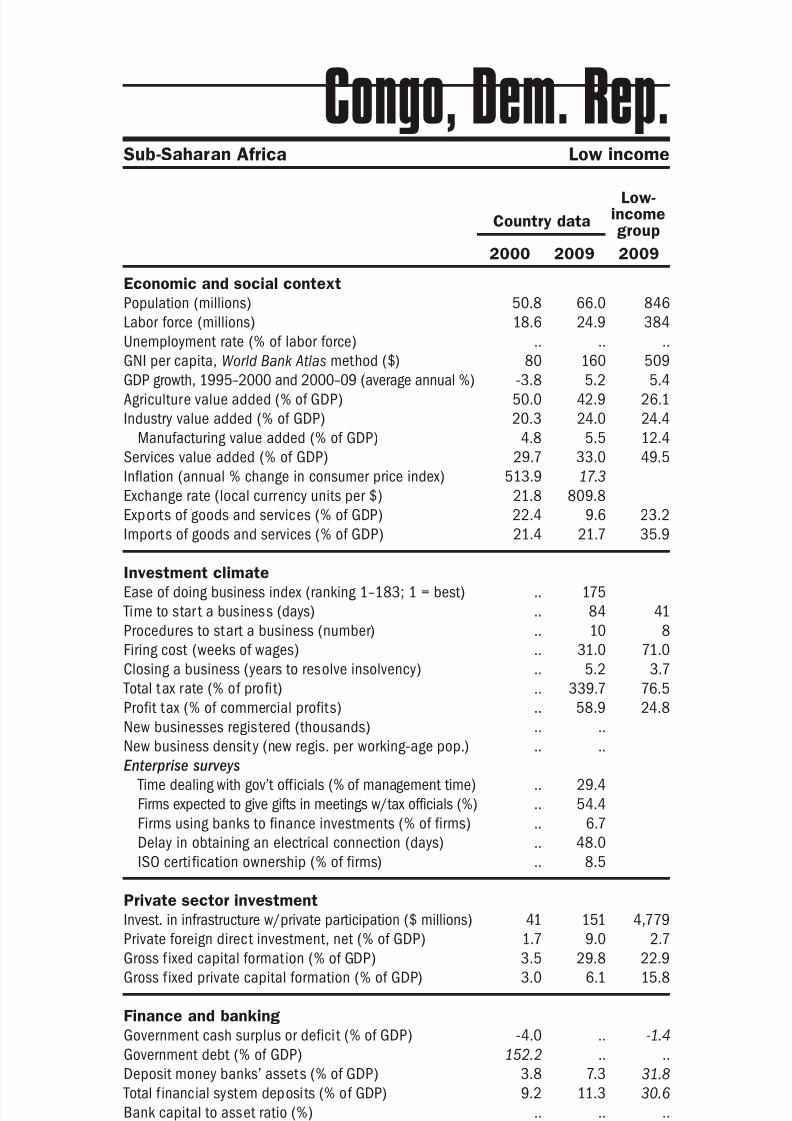
8/6/2019 The Little Data Book on Private Sector Development 2011
http://slidepdf.com/reader/full/the-little-data-book-on-private-sector-development-2011 69/246
Economic and social context
Population (millions)
Labor force (millions)
Unemployment rate (% of labor force)
GNI per capita, World Bank Atlas method ($)GDP growth, 1995–2000 and 2000–09 (average annual %)
Agriculture value added (% of GDP)
Industry value added (% of GDP)
Manufacturing value added (% of GDP)
Services value added (% of GDP)
Inflation (annual % change in consumer price index)
Exchange rate (local currency units per $)
Exports of goods and services (% of GDP)
Imports of goods and services (% of GDP) Investment climate
Ease of doing business index (ranking 1–183; 1 = best)
Time to star t a business (days)
Procedures to start a business (number)
Firing cost (weeks of wages)
Closing a business (years to resolve insolvency)
Total tax rate (% of profit)
Profit tax (% of commercial profits)New businesses registered (thousands)
New business density (new regis. per working-age pop.)
Enterprise surveys
Time dealing with gov’t officials (% of management time)
Firms expected to give gifts in meetings w/tax officials (%)
Firms using banks to finance investments (% of firms)
Delay in obtaining an electrical connection (days)
ISO certi fication ownership (% of firms)
Private sector investment
Invest. in infrastructure w/private participation ($ millions)
Private foreign direct investment, net (% of GDP)
Gross f ixed capital formation (% of GDP)
Gross f ixed private capital formation (% of GDP)
Finance and banking
Government cash surplus or deficit (% of GDP)
Government debt (% of GDP)
Deposit money banks’ assets (% of GDP) Total f inancial system deposits (% of GDP)
Bank capital to asset ratio (%)
Bank nonperforming loans to total gross loans ratio (%)
Domestic credit to the private sector (% of GDP)
Real interest rate (%)
Interest rate spread (percentage points)
Infrastructure
Paved roads (% of total roads)Electr ic power consumption (kWh per capita)
Power outages in a typical month (number)
Mobile cellular subscriptions (per 100 people)
Internet users (per 100 people)
61The Little Data Book on Private Sector Development 2011
Sub-Saharan Africa Low income
Country data
Low-incomegroup
2000 2009 2009
Congo, Dem. Rep.
50.8 66.0 846
18.6 24.9 384
.. .. ..
80 160 509-3.8 5.2 5.4
50.0 42.9 26.1
20.3 24.0 24.4
4.8 5.5 12.4
29.7 33.0 49.5
513.9 17.3
21.8 809.8
22.4 9.6 23.2
21.4 21.7 35.9
.. 175
.. 84 41
.. 10 8
.. 31.0 71.0
.. 5.2 3.7
.. 339.7 76.5
.. 58.9 24.8.. ..
.. ..
.. 29.4
.. 54.4
.. 6.7
.. 48.0
.. 8.5
41 151 4,779
1.7 9.0 2.7
3.5 29.8 22.9
3.0 6.1 15.8
-4.0 .. -1.4
152.2 .. ..
3.8 7.3 31.89.2 11.3 30.6
.. .. ..
.. .. ..
0.7 7.5 26.3
.. 27.0
.. 49.5 11.5
.. 1.8 12.089 95 231
.. 21.8
0.0 15.4 26.6
0.0 0.6 2.7
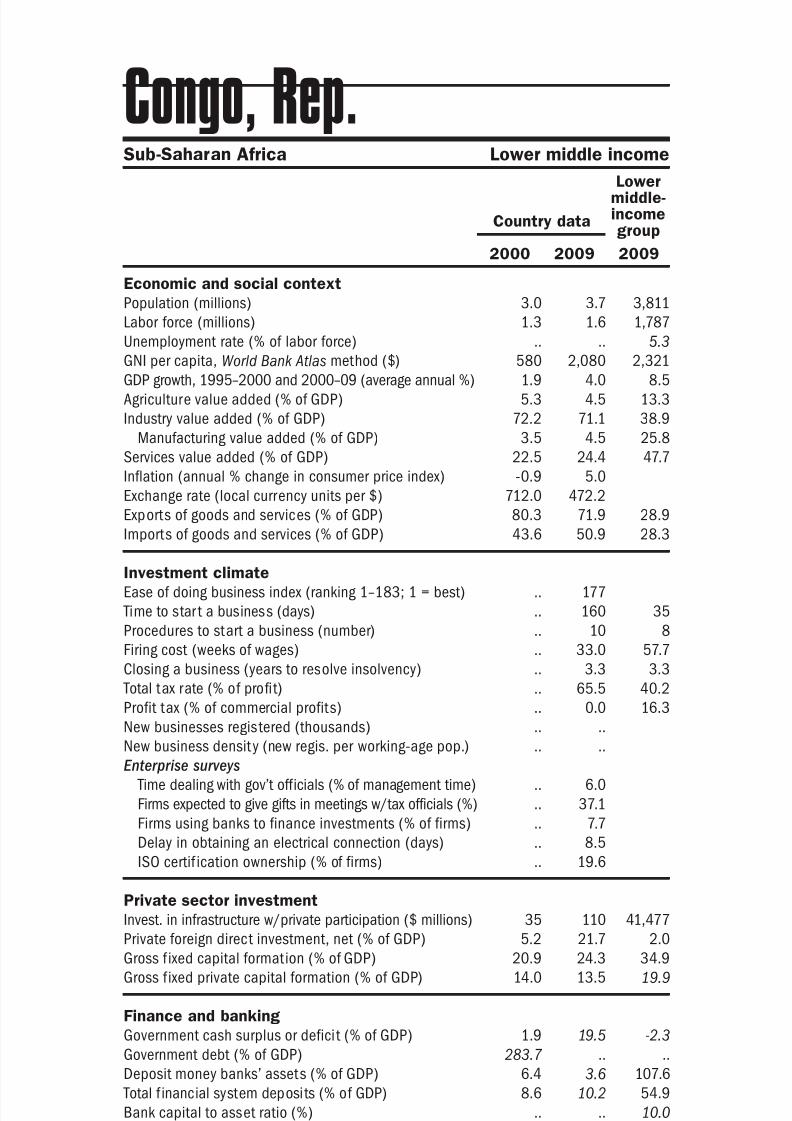
8/6/2019 The Little Data Book on Private Sector Development 2011
http://slidepdf.com/reader/full/the-little-data-book-on-private-sector-development-2011 70/246
Economic and social context
Population (millions)
Labor force (millions)
Unemployment rate (% of labor force)
GNI per capita, World Bank Atlas method ($)GDP growth, 1995–2000 and 2000–09 (average annual %)
Agriculture value added (% of GDP)
Industry value added (% of GDP)
Manufacturing value added (% of GDP)
Services value added (% of GDP)
Inflation (annual % change in consumer price index)
Exchange rate (local currency units per $)
Exports of goods and services (% of GDP)
Imports of goods and services (% of GDP) Investment climate
Ease of doing business index (ranking 1–183; 1 = best)
Time to star t a business (days)
Procedures to start a business (number)
Firing cost (weeks of wages)
Closing a business (years to resolve insolvency)
Total tax rate (% of profit)
Profit tax (% of commercial profits)New businesses registered (thousands)
New business density (new regis. per working-age pop.)
Enterprise surveys
Time dealing with gov’t officials (% of management time)
Firms expected to give gifts in meetings w/tax officials (%)
Firms using banks to finance investments (% of firms)
Delay in obtaining an electrical connection (days)
ISO certif ication ownership (% of firms)
Private sector investment
Invest. in infrastructure w/private participation ($ millions)
Private foreign direct investment, net (% of GDP)
Gross f ixed capital formation (% of GDP)
Gross f ixed private capital formation (% of GDP)
Finance and banking
Government cash surplus or deficit (% of GDP)
Government debt (% of GDP)
Deposit money banks’ assets (% of GDP) Total f inancial system deposits (% of GDP)
Bank capital to asset ratio (%)
Bank nonperforming loans to total gross loans ratio (%)
Domestic credit to the private sector (% of GDP)
Real interest rate (%)
Interest rate spread (percentage points)
Infrastructure
Paved roads (% of total roads)Electr ic power consumption (kWh per capita)
Power outages in a typical month (number)
Mobile cellular subscriptions (per 100 people)
Internet users (per 100 people)
62 2011 The Little Data Book on Private Sector Development
Country data
Lowermiddle-incomegroup
2000 2009 2009
Sub-Saharan Africa Lower middle income
Congo, Rep.
3.0 3.7 3,811
1.3 1.6 1,787
.. .. 5.3
580 2,080 2,3211.9 4.0 8.5
5.3 4.5 13.3
72.2 71.1 38.9
3.5 4.5 25.8
22.5 24.4 47.7
-0.9 5.0
712.0 472.2
80.3 71.9 28.9
43.6 50.9 28.3
.. 177
.. 160 35
.. 10 8
.. 33.0 57.7
.. 3.3 3.3
.. 65.5 40.2
.. 0.0 16.3.. ..
.. ..
.. 6.0
.. 37.1
.. 7.7
.. 8.5
.. 19.6
35 110 41,477
5.2 21.7 2.0
20.9 24.3 34.9
14.0 13.5 19.9
1.9 19.5 -2.3
283.7 .. ..
6.4 3.6 107.68.6 10.2 54.9
.. .. 10.0
.. .. 5.1
4.8 4.8 92.9
-17.0 14.4
17.0 10.8 7.3
9.7 7.1 36.399 150 1,318
.. 25.3
2.3 58.9 57.8
0.0 6.7 17.2
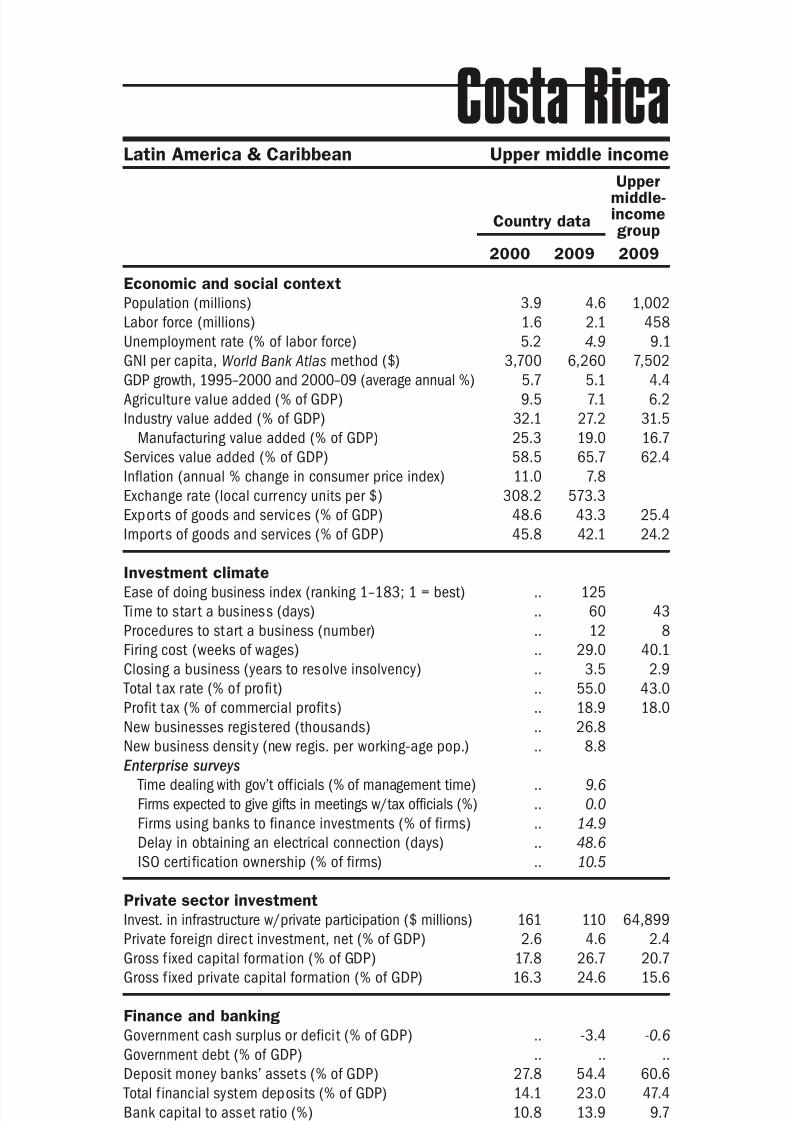
8/6/2019 The Little Data Book on Private Sector Development 2011
http://slidepdf.com/reader/full/the-little-data-book-on-private-sector-development-2011 71/246
Economic and social context
Population (millions)
Labor force (millions)
Unemployment rate (% of labor force)
GNI per capita, World Bank Atlas method ($)GDP growth, 1995–2000 and 2000–09 (average annual %)
Agriculture value added (% of GDP)
Industry value added (% of GDP)
Manufacturing value added (% of GDP)
Services value added (% of GDP)
Inflation (annual % change in consumer price index)
Exchange rate (local currency units per $)
Exports of goods and services (% of GDP)
Imports of goods and services (% of GDP) Investment climate
Ease of doing business index (ranking 1–183; 1 = best)
Time to star t a business (days)
Procedures to start a business (number)
Firing cost (weeks of wages)
Closing a business (years to resolve insolvency)
Total tax rate (% of profit)
Profit tax (% of commercial profits)New businesses registered (thousands)
New business density (new regis. per working-age pop.)
Enterprise surveys
Time dealing with gov’t officials (% of management time)
Firms expected to give gifts in meetings w/tax officials (%)
Firms using banks to finance investments (% of firms)
Delay in obtaining an electrical connection (days)
ISO certi fication ownership (% of firms)
Private sector investment
Invest. in infrastructure w/private participation ($ millions)
Private foreign direct investment, net (% of GDP)
Gross f ixed capital formation (% of GDP)
Gross f ixed private capital formation (% of GDP)
Finance and banking
Government cash surplus or deficit (% of GDP)
Government debt (% of GDP)
Deposit money banks’ assets (% of GDP) Total f inancial system deposits (% of GDP)
Bank capital to asset ratio (%)
Bank nonperforming loans to total gross loans ratio (%)
Domestic credit to the private sector (% of GDP)
Real interest rate (%)
Interest rate spread (percentage points)
Infrastructure
Paved roads (% of total roads)Electr ic power consumption (kWh per capita)
Power outages in a typical month (number)
Mobile cellular subscriptions (per 100 people)
Internet users (per 100 people)
63The Little Data Book on Private Sector Development 2011
Country data
Uppermiddle-incomegroup
2000 2009 2009
Latin America & Caribbean Upper middle income
Costa Rica
3.9 4.6 1,002
1.6 2.1 458
5.2 4.9 9.1
3,700 6,260 7,5025.7 5.1 4.4
9.5 7.1 6.2
32.1 27.2 31.5
25.3 19.0 16.7
58.5 65.7 62.4
11.0 7.8
308.2 573.3
48.6 43.3 25.4
45.8 42.1 24.2
.. 125
.. 60 43
.. 12 8
.. 29.0 40.1
.. 3.5 2.9
.. 55.0 43.0
.. 18.9 18.0.. 26.8
.. 8.8
.. 9.6
.. 0.0
.. 14.9
.. 48.6
.. 10.5
161 110 64,899
2.6 4.6 2.4
17.8 26.7 20.7
16.3 24.6 15.6
.. -3.4 -0.6
.. .. ..
27.8 54.4 60.614.1 23.0 47.4
10.8 13.9 9.7
3.5 2.0 4.2
24.0 49.4 47.8
16.7 9.9
11.5 12.8 5.5
22.0 25.3 36.81,519 1,866 3,001
.. ..
5.4 42.6 100.6
5.8 34.5 34.6
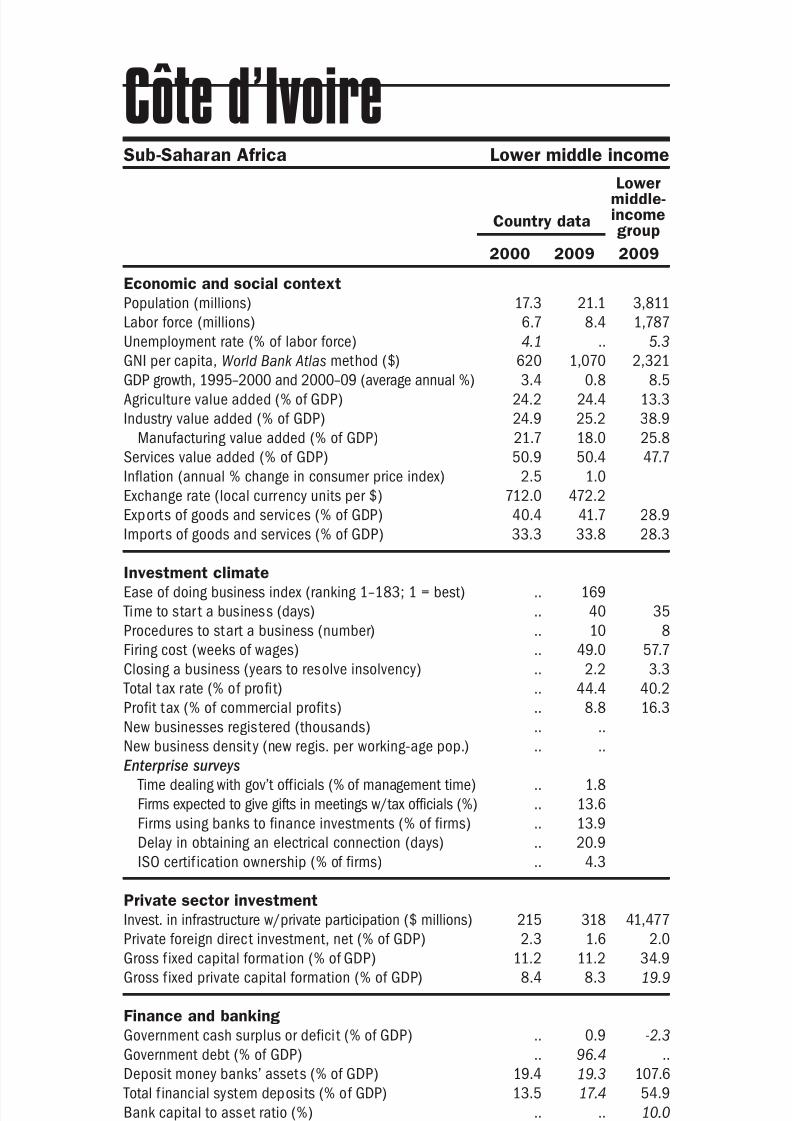
8/6/2019 The Little Data Book on Private Sector Development 2011
http://slidepdf.com/reader/full/the-little-data-book-on-private-sector-development-2011 72/246
Economic and social context
Population (millions)
Labor force (millions)
Unemployment rate (% of labor force)
GNI per capita, World Bank Atlas method ($)GDP growth, 1995–2000 and 2000–09 (average annual %)
Agriculture value added (% of GDP)
Industry value added (% of GDP)
Manufacturing value added (% of GDP)
Services value added (% of GDP)
Inflation (annual % change in consumer price index)
Exchange rate (local currency units per $)
Exports of goods and services (% of GDP)
Imports of goods and services (% of GDP) Investment climate
Ease of doing business index (ranking 1–183; 1 = best)
Time to star t a business (days)
Procedures to start a business (number)
Firing cost (weeks of wages)
Closing a business (years to resolve insolvency)
Total tax rate (% of profit)
Profit tax (% of commercial profits)New businesses registered (thousands)
New business density (new regis. per working-age pop.)
Enterprise surveys
Time dealing with gov’t officials (% of management time)
Firms expected to give gifts in meetings w/tax officials (%)
Firms using banks to finance investments (% of firms)
Delay in obtaining an electrical connection (days)
ISO certif ication ownership (% of firms)
Private sector investment
Invest. in infrastructure w/private participation ($ millions)
Private foreign direct investment, net (% of GDP)
Gross f ixed capital formation (% of GDP)
Gross f ixed private capital formation (% of GDP)
Finance and banking
Government cash surplus or deficit (% of GDP)
Government debt (% of GDP)
Deposit money banks’ assets (% of GDP) Total f inancial system deposits (% of GDP)
Bank capital to asset ratio (%)
Bank nonperforming loans to total gross loans ratio (%)
Domestic credit to the private sector (% of GDP)
Real interest rate (%)
Interest rate spread (percentage points)
Infrastructure
Paved roads (% of total roads)Electr ic power consumption (kWh per capita)
Power outages in a typical month (number)
Mobile cellular subscriptions (per 100 people)
Internet users (per 100 people)
64 2011 The Little Data Book on Private Sector Development
Country data
Lowermiddle-incomegroup
2000 2009 2009
Sub-Saharan Africa Lower middle income
Côte d’Ivoire
17.3 21.1 3,811
6.7 8.4 1,787
4.1 .. 5.3
620 1,070 2,3213.4 0.8 8.5
24.2 24.4 13.3
24.9 25.2 38.9
21.7 18.0 25.8
50.9 50.4 47.7
2.5 1.0
712.0 472.2
40.4 41.7 28.9
33.3 33.8 28.3
.. 169
.. 40 35
.. 10 8
.. 49.0 57.7
.. 2.2 3.3
.. 44.4 40.2
.. 8.8 16.3.. ..
.. ..
.. 1.8
.. 13.6
.. 13.9
.. 20.9
.. 4.3
215 318 41,477
2.3 1.6 2.0
11.2 11.2 34.9
8.4 8.3 19.9
.. 0.9 -2.3
.. 96.4 ..
19.4 19.3 107.613.5 17.4 54.9
.. .. 10.0
.. .. 5.1
15.5 17.1 92.9
.. ..
.. .. 7.3
9.7 7.9 36.3166 186 1,318
.. 3.8
2.7 63.3 57.8
0.2 4.6 17.2
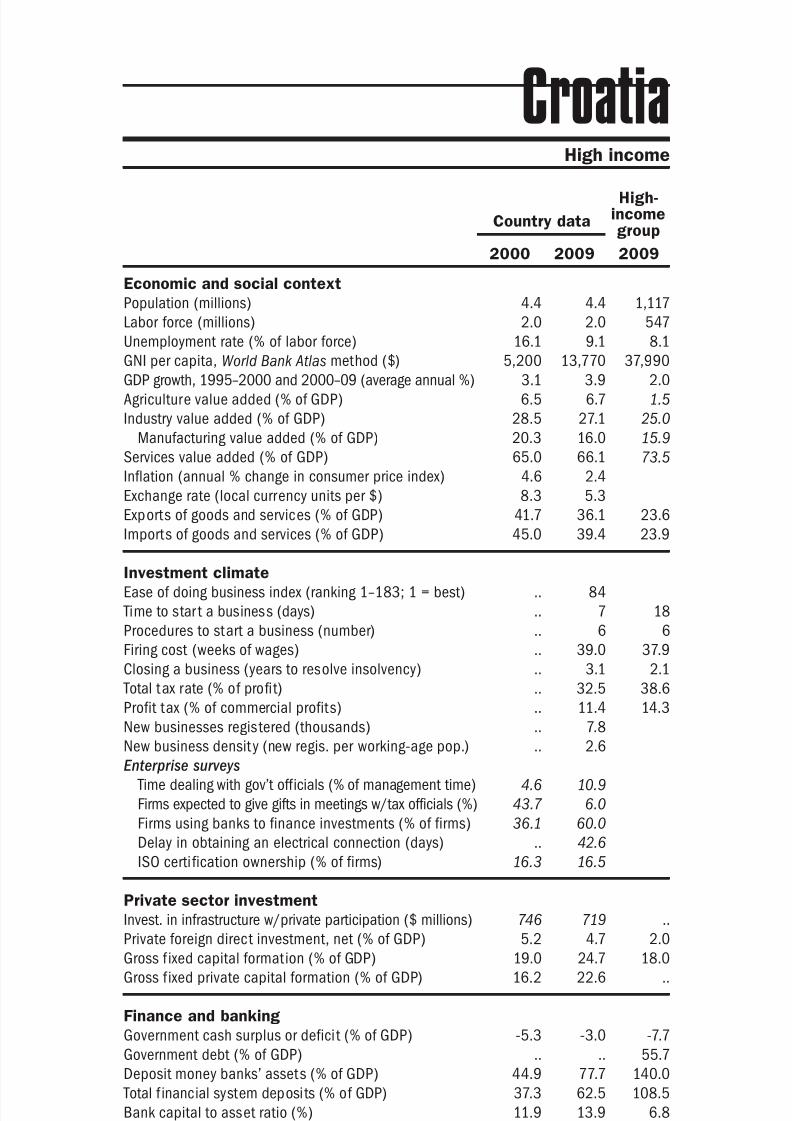
8/6/2019 The Little Data Book on Private Sector Development 2011
http://slidepdf.com/reader/full/the-little-data-book-on-private-sector-development-2011 73/246
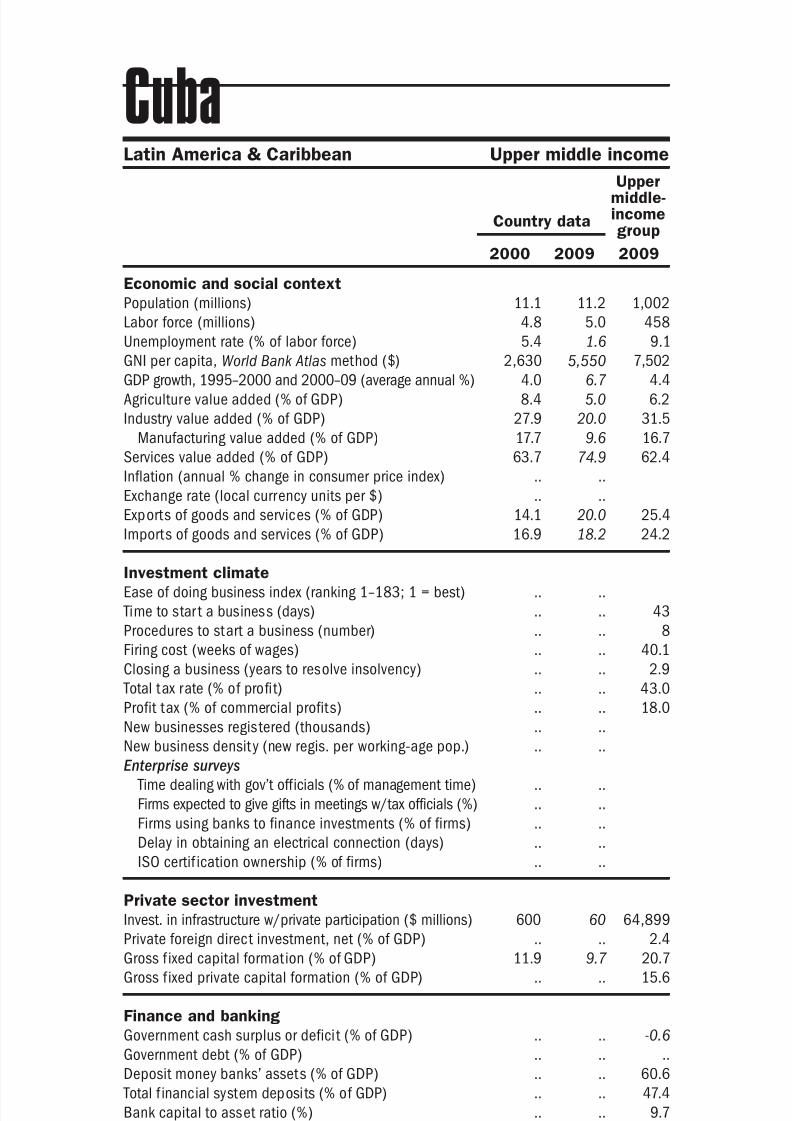
8/6/2019 The Little Data Book on Private Sector Development 2011
http://slidepdf.com/reader/full/the-little-data-book-on-private-sector-development-2011 74/246
Economic and social context
Population (millions)
Labor force (millions)
Unemployment rate (% of labor force)
GNI per capita, World Bank Atlas method ($)GDP growth, 1995–2000 and 2000–09 (average annual %)
Agriculture value added (% of GDP)
Industry value added (% of GDP)
Manufacturing value added (% of GDP)
Services value added (% of GDP)
Inflation (annual % change in consumer price index)
Exchange rate (local currency units per $)
Exports of goods and services (% of GDP)
Imports of goods and services (% of GDP) Investment climate
Ease of doing business index (ranking 1–183; 1 = best)
Time to star t a business (days)
Procedures to start a business (number)
Firing cost (weeks of wages)
Closing a business (years to resolve insolvency)
Total tax rate (% of profit)
Profit tax (% of commercial profits)New businesses registered (thousands)
New business density (new regis. per working-age pop.)
Enterprise surveys
Time dealing with gov’t officials (% of management time)
Firms expected to give gifts in meetings w/tax officials (%)
Firms using banks to finance investments (% of firms)
Delay in obtaining an electrical connection (days)
ISO certif ication ownership (% of firms)
Private sector investment
Invest. in infrastructure w/private participation ($ millions)
Private foreign direct investment, net (% of GDP)
Gross f ixed capital formation (% of GDP)
Gross f ixed private capital formation (% of GDP)
Finance and banking
Government cash surplus or deficit (% of GDP)
Government debt (% of GDP)
Deposit money banks’ assets (% of GDP) Total f inancial system deposits (% of GDP)
Bank capital to asset ratio (%)
Bank nonperforming loans to total gross loans ratio (%)
Domestic credit to the private sector (% of GDP)
Real interest rate (%)
Interest rate spread (percentage points)
Infrastructure
Paved roads (% of total roads)Electr ic power consumption (kWh per capita)
Power outages in a typical month (number)
Mobile cellular subscriptions (per 100 people)
Internet users (per 100 people)
66 2011 The Little Data Book on Private Sector Development
Country data
Uppermiddle-incomegroup
2000 2009 2009
Latin America & Caribbean Upper middle income
Cuba
11.1 11.2 1,002
4.8 5.0 458
5.4 1.6 9.1
2,630 5,550 7,5024.0 6.7 4.4
8.4 5.0 6.2
27.9 20.0 31.5
17.7 9.6 16.7
63.7 74.9 62.4
.. ..
.. ..
14.1 20.0 25.4
16.9 18.2 24.2
.. ..
.. .. 43
.. .. 8
.. .. 40.1
.. .. 2.9
.. .. 43.0
.. .. 18.0.. ..
.. ..
.. ..
.. ..
.. ..
.. ..
.. ..
600 60 64,899
.. .. 2.4
11.9 9.7 20.7
.. .. 15.6
.. .. -0.6
.. .. ..
.. .. 60.6
.. .. 47.4
.. .. 9.7
.. .. 4.2
.. .. 47.8
.. ..
.. .. 5.5
49.0 .. 36.81,142 1,327 3,001
.. ..
0.1 4.0 100.6
0.5 14.3 34.6
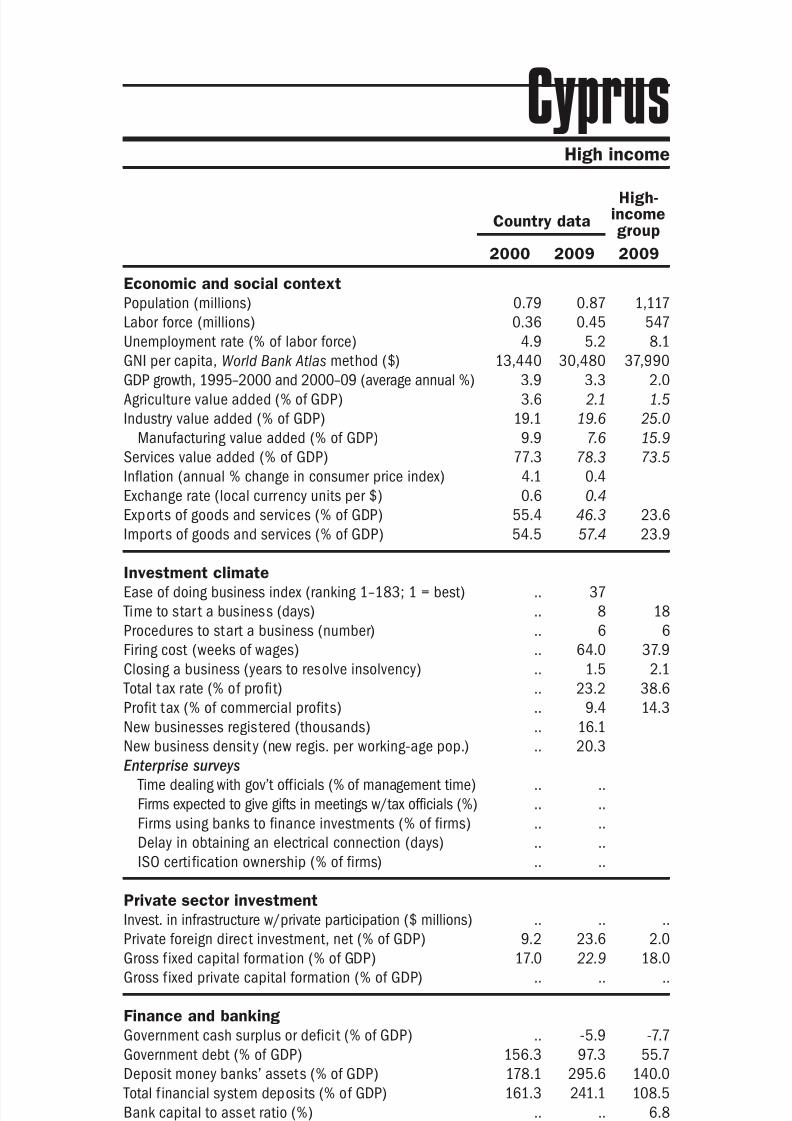
8/6/2019 The Little Data Book on Private Sector Development 2011
http://slidepdf.com/reader/full/the-little-data-book-on-private-sector-development-2011 75/246
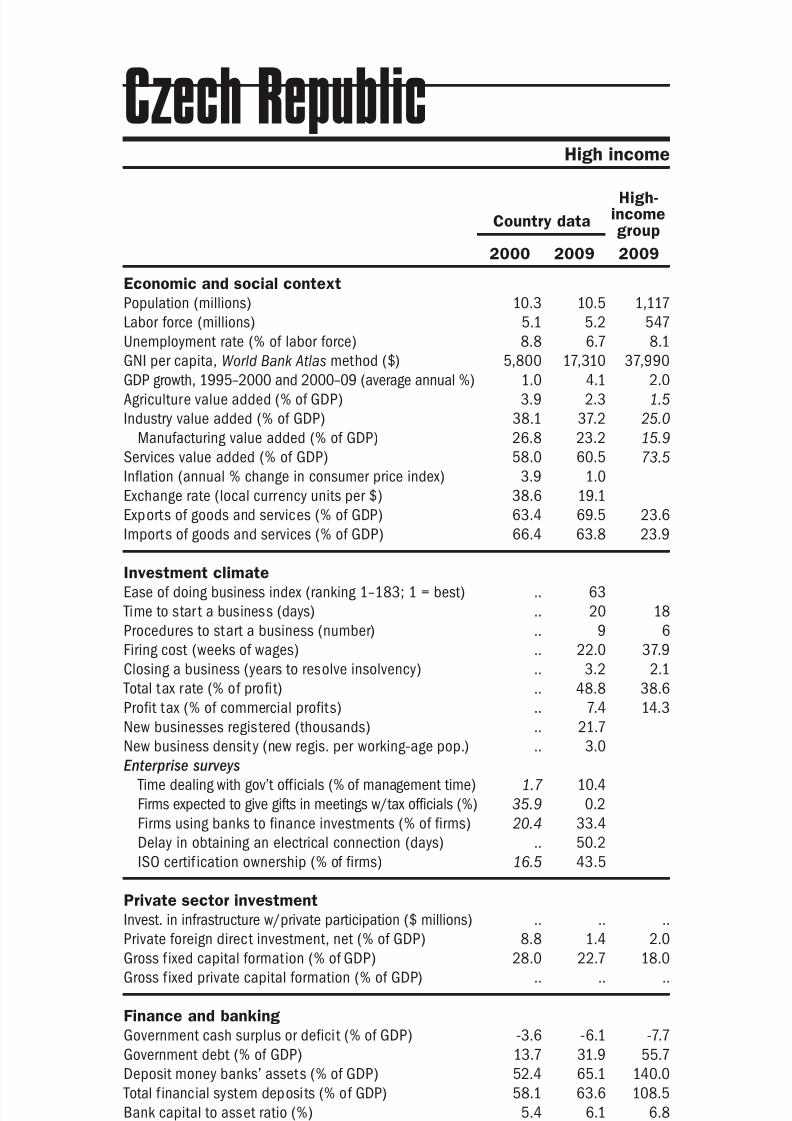
8/6/2019 The Little Data Book on Private Sector Development 2011
http://slidepdf.com/reader/full/the-little-data-book-on-private-sector-development-2011 76/246
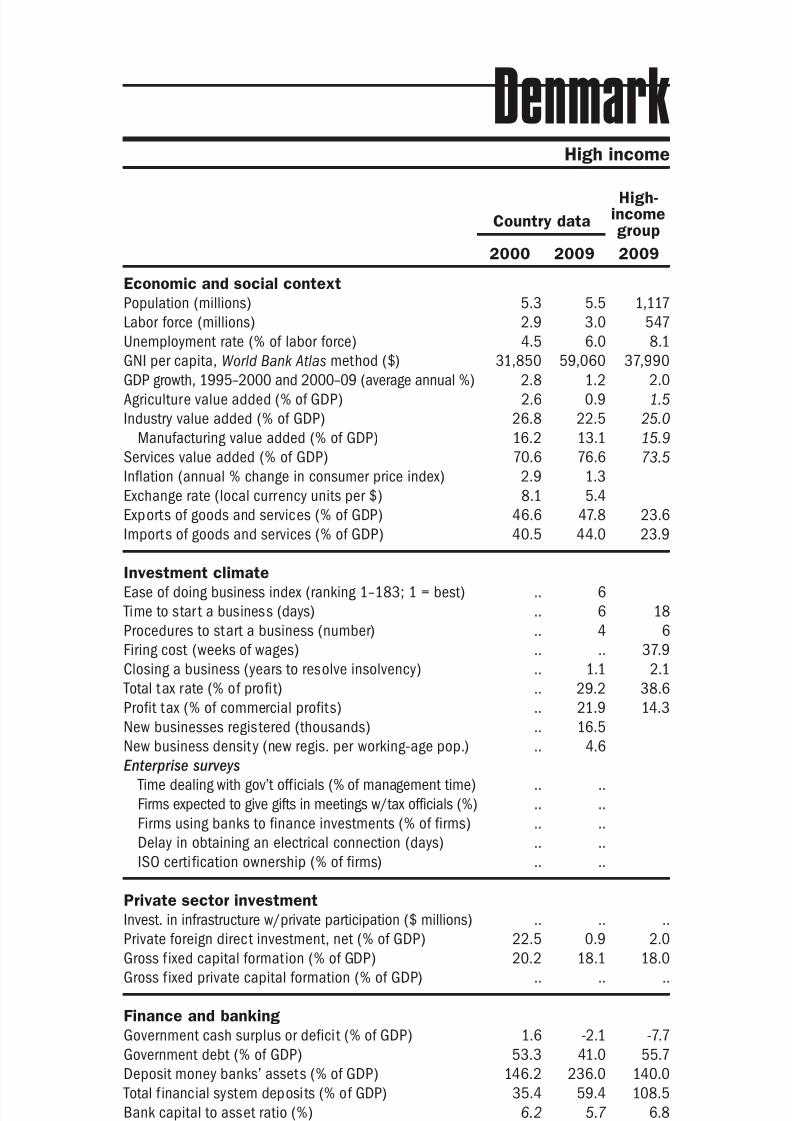
8/6/2019 The Little Data Book on Private Sector Development 2011
http://slidepdf.com/reader/full/the-little-data-book-on-private-sector-development-2011 77/246
Economic and social context
Population (millions)
Labor force (millions)
Unemployment rate (% of labor force)
GNI per capita, World Bank Atlas method ($)GDP growth, 1995–2000 and 2000–09 (average annual %)
Agriculture value added (% of GDP)
Industry value added (% of GDP)
Manufacturing value added (% of GDP)
Services value added (% of GDP)
Inflation (annual % change in consumer price index)
Exchange rate (local currency units per $)
Exports of goods and services (% of GDP)
Imports of goods and services (% of GDP) Investment climate
Ease of doing business index (ranking 1–183; 1 = best)
Time to star t a business (days)
Procedures to start a business (number)
Firing cost (weeks of wages)
Closing a business (years to resolve insolvency)
Total tax rate (% of profit)
Profit tax (% of commercial profits)New businesses registered (thousands)
New business density (new regis. per working-age pop.)
Enterprise surveys
Time dealing with gov’t officials (% of management time)
Firms expected to give gifts in meetings w/tax officials (%)
Firms using banks to finance investments (% of firms)
Delay in obtaining an electrical connection (days)
ISO certi fication ownership (% of firms)
Private sector investment
Invest. in infrastructure w/private participation ($ millions)
Private foreign direct investment, net (% of GDP)
Gross f ixed capital formation (% of GDP)
Gross f ixed private capital formation (% of GDP)
Finance and banking
Government cash surplus or deficit (% of GDP)
Government debt (% of GDP)
Deposit money banks’ assets (% of GDP) Total f inancial system deposits (% of GDP)
Bank capital to asset ratio (%)
Bank nonperforming loans to total gross loans ratio (%)
Domestic credit to the private sector (% of GDP)
Real interest rate (%)
Interest rate spread (percentage points)
Infrastructure
Paved roads (% of total roads)Electr ic power consumption (kWh per capita)
Power outages in a typical month (number)
Mobile cellular subscriptions (per 100 people)
Internet users (per 100 people)
69The Little Data Book on Private Sector Development 2011
High income
Country data
High-incomegroup
2000 2009 2009
Denmark
5.3 5.5 1,117
2.9 3.0 547
4.5 6.0 8.1
31,850 59,060 37,9902.8 1.2 2.0
2.6 0.9 1.5
26.8 22.5 25.0
16.2 13.1 15.9
70.6 76.6 73.5
2.9 1.3
8.1 5.4
46.6 47.8 23.6
40.5 44.0 23.9
.. 6
.. 6 18
.. 4 6
.. .. 37.9
.. 1.1 2.1
.. 29.2 38.6
.. 21.9 14.3.. 16.5
.. 4.6
.. ..
.. ..
.. ..
.. ..
.. ..
.. .. ..
22.5 0.9 2.0
20.2 18.1 18.0
.. .. ..
1.6 -2.1 -7.7
53.3 41.0 55.7
146.2 236.0 140.035.4 59.4 108.5
6.2 5.7 6.8
0.7 0.3 3.4
135.3 231.6 165.1
4.9 ..
4.9 .. 3.8
100.0 100.0 93.46,485 6,460 9,518
.. ..
63.0 133.9 111.2
39.2 85.9 72.3
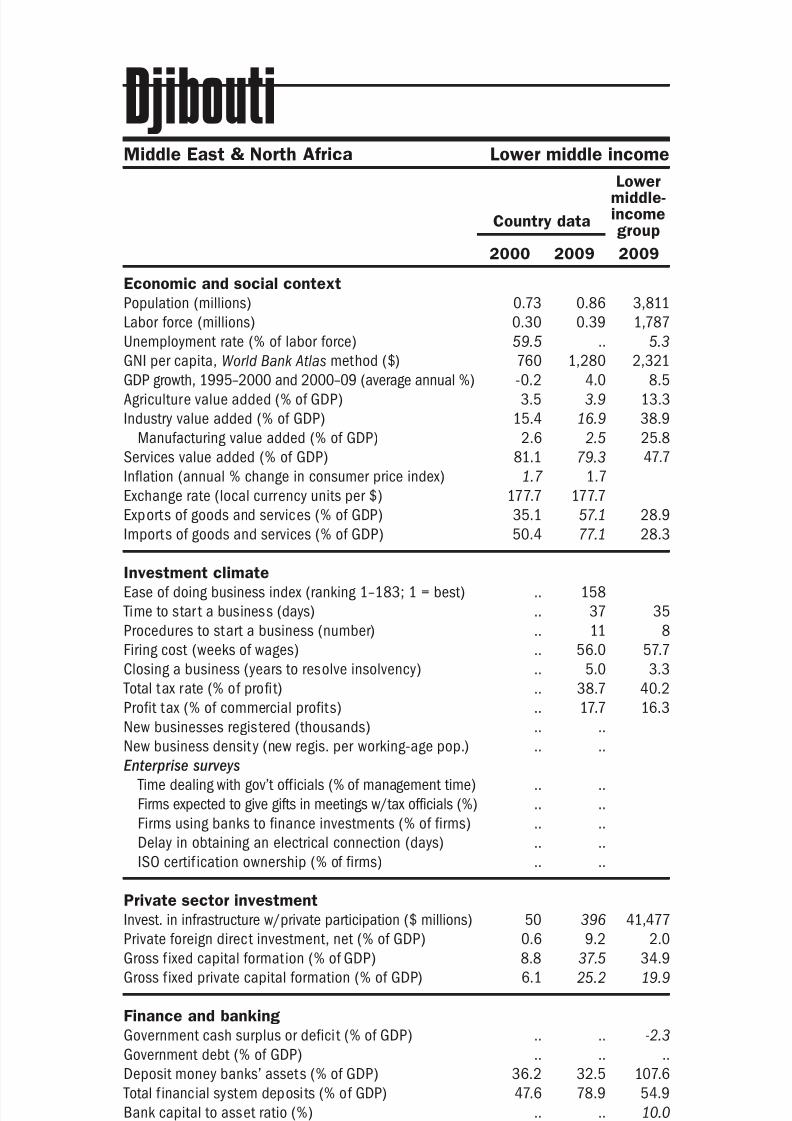
8/6/2019 The Little Data Book on Private Sector Development 2011
http://slidepdf.com/reader/full/the-little-data-book-on-private-sector-development-2011 78/246
Economic and social context
Population (millions)
Labor force (millions)
Unemployment rate (% of labor force)
GNI per capita, World Bank Atlas method ($)GDP growth, 1995–2000 and 2000–09 (average annual %)
Agriculture value added (% of GDP)
Industry value added (% of GDP)
Manufacturing value added (% of GDP)
Services value added (% of GDP)
Inflation (annual % change in consumer price index)
Exchange rate (local currency units per $)
Exports of goods and services (% of GDP)
Imports of goods and services (% of GDP) Investment climate
Ease of doing business index (ranking 1–183; 1 = best)
Time to star t a business (days)
Procedures to start a business (number)
Firing cost (weeks of wages)
Closing a business (years to resolve insolvency)
Total tax rate (% of profit)
Profit tax (% of commercial profits)New businesses registered (thousands)
New business density (new regis. per working-age pop.)
Enterprise surveys
Time dealing with gov’t officials (% of management time)
Firms expected to give gifts in meetings w/tax officials (%)
Firms using banks to finance investments (% of firms)
Delay in obtaining an electrical connection (days)
ISO certif ication ownership (% of firms)
Private sector investment
Invest. in infrastructure w/private participation ($ millions)
Private foreign direct investment, net (% of GDP)
Gross f ixed capital formation (% of GDP)
Gross f ixed private capital formation (% of GDP)
Finance and banking
Government cash surplus or deficit (% of GDP)
Government debt (% of GDP)
Deposit money banks’ assets (% of GDP) Total f inancial system deposits (% of GDP)
Bank capital to asset ratio (%)
Bank nonperforming loans to total gross loans ratio (%)
Domestic credit to the private sector (% of GDP)
Real interest rate (%)
Interest rate spread (percentage points)
Infrastructure
Paved roads (% of total roads)Electr ic power consumption (kWh per capita)
Power outages in a typical month (number)
Mobile cellular subscriptions (per 100 people)
Internet users (per 100 people)
70 2011 The Little Data Book on Private Sector Development
Country data
Lowermiddle-incomegroup
2000 2009 2009
Middle East & North Africa Lower middle income
Djibouti
0.73 0.86 3,811
0.30 0.39 1,787
59.5 .. 5.3
760 1,280 2,321-0.2 4.0 8.5
3.5 3.9 13.3
15.4 16.9 38.9
2.6 2.5 25.8
81.1 79.3 47.7
1.7 1.7
177.7 177.7
35.1 57.1 28.9
50.4 77.1 28.3
.. 158
.. 37 35
.. 11 8
.. 56.0 57.7
.. 5.0 3.3
.. 38.7 40.2
.. 17.7 16.3.. ..
.. ..
.. ..
.. ..
.. ..
.. ..
.. ..
50 396 41,477
0.6 9.2 2.0
8.8 37.5 34.9
6.1 25.2 19.9
.. .. -2.3
.. .. ..
36.2 32.5 107.647.6 78.9 54.9
.. .. 10.0
.. .. 5.1
32.1 29.3 92.9
-2.3 1.9
8.6 9.4 7.3
45.0 .. 36.3.. .. 1,318
.. ..
0.0 14.9 57.8
0.2 3.0 17.2

8/6/2019 The Little Data Book on Private Sector Development 2011
http://slidepdf.com/reader/full/the-little-data-book-on-private-sector-development-2011 79/246
Economic and social context
Population (millions)
Labor force (millions)
Unemployment rate (% of labor force)
GNI per capita, World Bank Atlas method ($)GDP growth, 1995–2000 and 2000–09 (average annual %)
Agriculture value added (% of GDP)
Industry value added (% of GDP)
Manufacturing value added (% of GDP)
Services value added (% of GDP)
Inflation (annual % change in consumer price index)
Exchange rate (local currency units per $)
Exports of goods and services (% of GDP)
Imports of goods and services (% of GDP) Investment climate
Ease of doing business index (ranking 1–183; 1 = best)
Time to star t a business (days)
Procedures to start a business (number)
Firing cost (weeks of wages)
Closing a business (years to resolve insolvency)
Total tax rate (% of profit)
Profit tax (% of commercial profits)New businesses registered (thousands)
New business density (new regis. per working-age pop.)
Enterprise surveys
Time dealing with gov’t officials (% of management time)
Firms expected to give gifts in meetings w/tax officials (%)
Firms using banks to finance investments (% of firms)
Delay in obtaining an electrical connection (days)
ISO certi fication ownership (% of firms)
Private sector investment
Invest. in infrastructure w/private participation ($ millions)
Private foreign direct investment, net (% of GDP)
Gross f ixed capital formation (% of GDP)
Gross f ixed private capital formation (% of GDP)
Finance and banking
Government cash surplus or deficit (% of GDP)
Government debt (% of GDP)
Deposit money banks’ assets (% of GDP) Total f inancial system deposits (% of GDP)
Bank capital to asset ratio (%)
Bank nonperforming loans to total gross loans ratio (%)
Domestic credit to the private sector (% of GDP)
Real interest rate (%)
Interest rate spread (percentage points)
Infrastructure
Paved roads (% of total roads)Electr ic power consumption (kWh per capita)
Power outages in a typical month (number)
Mobile cellular subscriptions (per 100 people)
Internet users (per 100 people)
71The Little Data Book on Private Sector Development 2011
Latin America & Caribbean Upper middle income
Country data
Uppermiddle-incomegroup
2000 2009 2009
Dominica
0.07 0.07 1,002
.. .. 458
11.0 .. 9.1
3,200 4,900 7,5022.2 2.9 4.4
18.1 19.5 6.2
23.5 23.2 31.5
8.8 4.2 16.7
58.4 57.3 62.4
0.9 0.1
2.7 2.7
53.3 38.4 25.4
67.5 65.5 24.2
.. 88
.. 14 43
.. 5 8
.. 58.0 40.1
.. .. 2.9
.. 37.0 43.0
.. 25.9 18.0.. 0.2
.. 3.3
.. ..
.. ..
.. ..
.. ..
.. ..
19 5 64,899
6.5 13.3 2.4
28.1 29.5 20.7
8.1 6.9 15.6
.. .. -0.6
.. .. ..
79.9 63.0 60.668.6 101.1 47.4
.. .. 9.7
.. .. 4.2
62.0 63.3 47.8
11.0 8.2
7.8 6.8 5.5
50.4 .. 36.8.. .. 3,001
.. ..
1.7 144.0 100.6
8.4 38.0 34.6
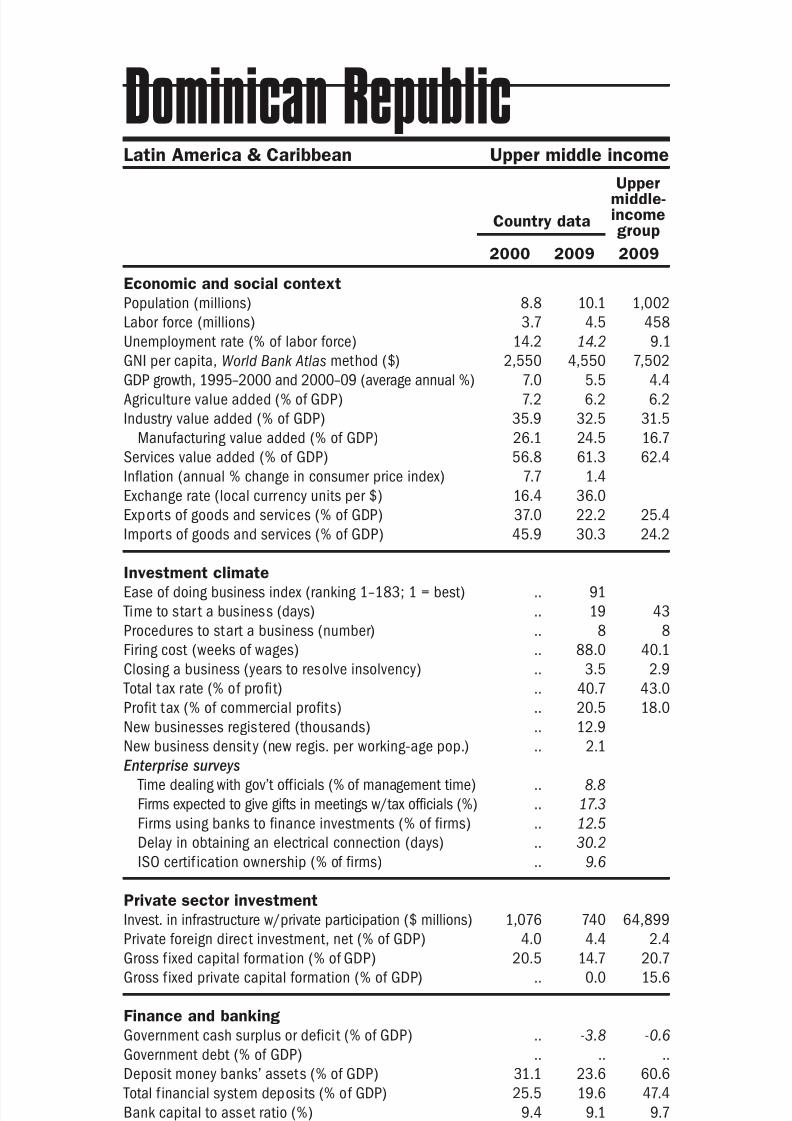
8/6/2019 The Little Data Book on Private Sector Development 2011
http://slidepdf.com/reader/full/the-little-data-book-on-private-sector-development-2011 80/246
Economic and social context
Population (millions)
Labor force (millions)
Unemployment rate (% of labor force)
GNI per capita, World Bank Atlas method ($)GDP growth, 1995–2000 and 2000–09 (average annual %)
Agriculture value added (% of GDP)
Industry value added (% of GDP)
Manufacturing value added (% of GDP)
Services value added (% of GDP)
Inflation (annual % change in consumer price index)
Exchange rate (local currency units per $)
Exports of goods and services (% of GDP)
Imports of goods and services (% of GDP) Investment climate
Ease of doing business index (ranking 1–183; 1 = best)
Time to star t a business (days)
Procedures to start a business (number)
Firing cost (weeks of wages)
Closing a business (years to resolve insolvency)
Total tax rate (% of profit)
Profit tax (% of commercial profits)New businesses registered (thousands)
New business density (new regis. per working-age pop.)
Enterprise surveys
Time dealing with gov’t officials (% of management time)
Firms expected to give gifts in meetings w/tax officials (%)
Firms using banks to finance investments (% of firms)
Delay in obtaining an electrical connection (days)
ISO certif ication ownership (% of firms)
Private sector investment
Invest. in infrastructure w/private participation ($ millions)
Private foreign direct investment, net (% of GDP)
Gross f ixed capital formation (% of GDP)
Gross f ixed private capital formation (% of GDP)
Finance and banking
Government cash surplus or deficit (% of GDP)
Government debt (% of GDP)
Deposit money banks’ assets (% of GDP) Total f inancial system deposits (% of GDP)
Bank capital to asset ratio (%)
Bank nonperforming loans to total gross loans ratio (%)
Domestic credit to the private sector (% of GDP)
Real interest rate (%)
Interest rate spread (percentage points)
Infrastructure
Paved roads (% of total roads)Electr ic power consumption (kWh per capita)
Power outages in a typical month (number)
Mobile cellular subscriptions (per 100 people)
Internet users (per 100 people)
72 2011 The Little Data Book on Private Sector Development
Country data
Uppermiddle-incomegroup
2000 2009 2009
Latin America & Caribbean Upper middle income
Dominican Republic
8.8 10.1 1,002
3.7 4.5 458
14.2 14.2 9.1
2,550 4,550 7,5027.0 5.5 4.4
7.2 6.2 6.2
35.9 32.5 31.5
26.1 24.5 16.7
56.8 61.3 62.4
7.7 1.4
16.4 36.0
37.0 22.2 25.4
45.9 30.3 24.2
.. 91
.. 19 43
.. 8 8
.. 88.0 40.1
.. 3.5 2.9
.. 40.7 43.0
.. 20.5 18.0.. 12.9
.. 2.1
.. 8.8
.. 17.3
.. 12.5
.. 30.2
.. 9.6
1,076 740 64,899
4.0 4.4 2.4
20.5 14.7 20.7
.. 0.0 15.6
.. -3.8 -0.6
.. .. ..
31.1 23.6 60.625.5 19.6 47.4
9.4 9.1 9.7
2.6 4.0 4.2
29.0 21.3 47.8
18.6 14.7
9.1 10.3 5.5
49.4 .. 36.8709 1,377 3,001
.. ..
8.0 85.5 100.6
3.7 26.8 34.6
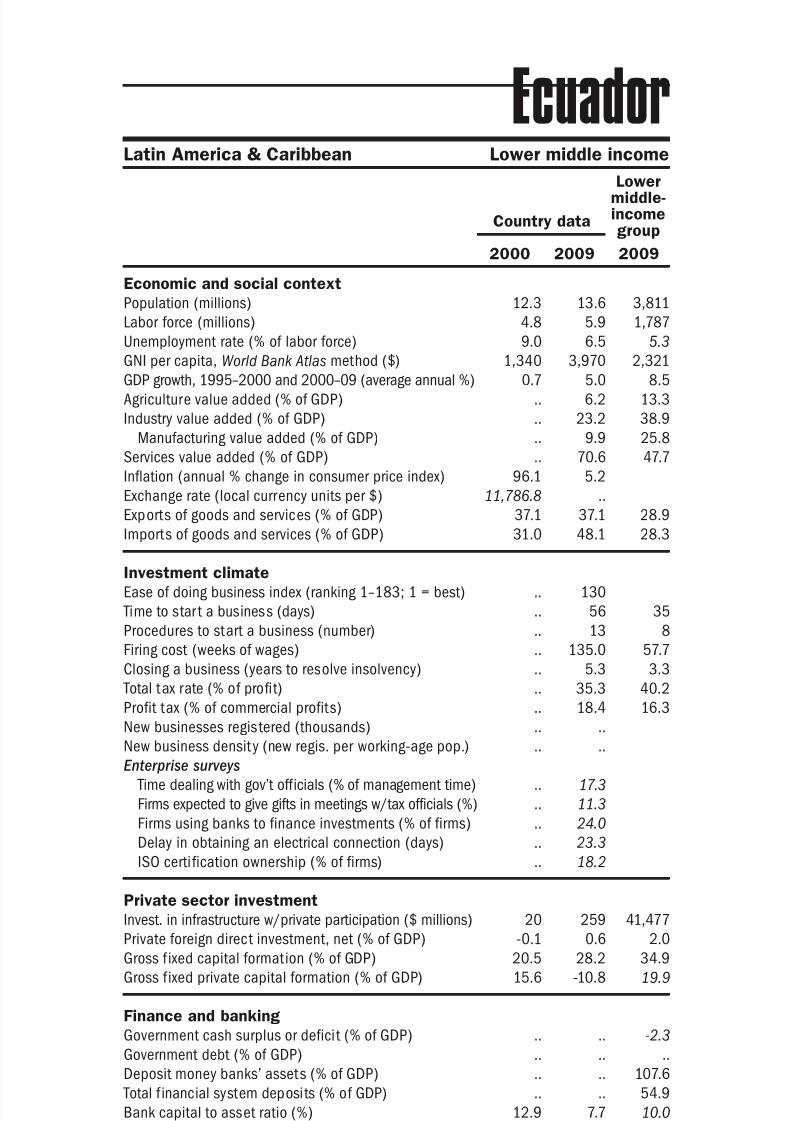
8/6/2019 The Little Data Book on Private Sector Development 2011
http://slidepdf.com/reader/full/the-little-data-book-on-private-sector-development-2011 81/246
Economic and social context
Population (millions)
Labor force (millions)
Unemployment rate (% of labor force)
GNI per capita, World Bank Atlas method ($)GDP growth, 1995–2000 and 2000–09 (average annual %)
Agriculture value added (% of GDP)
Industry value added (% of GDP)
Manufacturing value added (% of GDP)
Services value added (% of GDP)
Inflation (annual % change in consumer price index)
Exchange rate (local currency units per $)
Exports of goods and services (% of GDP)
Imports of goods and services (% of GDP) Investment climate
Ease of doing business index (ranking 1–183; 1 = best)
Time to star t a business (days)
Procedures to start a business (number)
Firing cost (weeks of wages)
Closing a business (years to resolve insolvency)
Total tax rate (% of profit)
Profit tax (% of commercial profits)New businesses registered (thousands)
New business density (new regis. per working-age pop.)
Enterprise surveys
Time dealing with gov’t officials (% of management time)
Firms expected to give gifts in meetings w/tax officials (%)
Firms using banks to finance investments (% of firms)
Delay in obtaining an electrical connection (days)
ISO certi fication ownership (% of firms)
Private sector investment
Invest. in infrastructure w/private participation ($ millions)
Private foreign direct investment, net (% of GDP)
Gross f ixed capital formation (% of GDP)
Gross f ixed private capital formation (% of GDP)
Finance and banking
Government cash surplus or deficit (% of GDP)
Government debt (% of GDP)
Deposit money banks’ assets (% of GDP) Total f inancial system deposits (% of GDP)
Bank capital to asset ratio (%)
Bank nonperforming loans to total gross loans ratio (%)
Domestic credit to the private sector (% of GDP)
Real interest rate (%)
Interest rate spread (percentage points)
Infrastructure
Paved roads (% of total roads)Electr ic power consumption (kWh per capita)
Power outages in a typical month (number)
Mobile cellular subscriptions (per 100 people)
Internet users (per 100 people)
73The Little Data Book on Private Sector Development 2011
Latin America & Caribbean Lower middle income
Country data
Lowermiddle-incomegroup
2000 2009 2009
Ecuador
12.3 13.6 3,811
4.8 5.9 1,787
9.0 6.5 5.3
1,340 3,970 2,3210.7 5.0 8.5
.. 6.2 13.3
.. 23.2 38.9
.. 9.9 25.8
.. 70.6 47.7
96.1 5.2
11,786.8 ..
37.1 37.1 28.9
31.0 48.1 28.3
.. 130
.. 56 35
.. 13 8
.. 135.0 57.7
.. 5.3 3.3
.. 35.3 40.2
.. 18.4 16.3.. ..
.. ..
.. 17.3
.. 11.3
.. 24.0
.. 23.3
.. 18.2
20 259 41,477
-0.1 0.6 2.0
20.5 28.2 34.9
15.6 -10.8 19.9
.. .. -2.3
.. .. ..
.. .. 107.6
.. .. 54.9
12.9 7.7 10.0
31.0 2.9 5.1
29.9 25.3 92.9
26.0 6.3
8.3 7.1 7.3
18.9 14.8 36.3654 1,137 1,318
.. 2.5
3.9 100.1 57.8
1.5 15.1 17.2
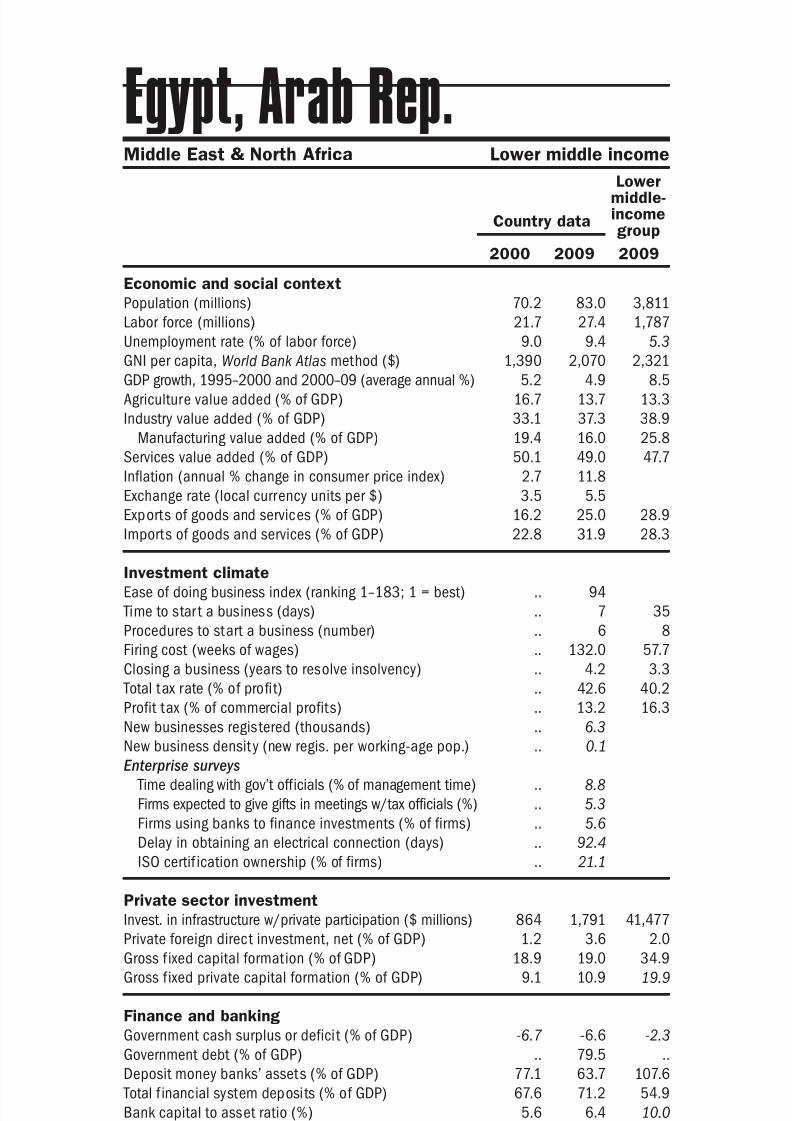
8/6/2019 The Little Data Book on Private Sector Development 2011
http://slidepdf.com/reader/full/the-little-data-book-on-private-sector-development-2011 82/246
Economic and social context
Population (millions)
Labor force (millions)
Unemployment rate (% of labor force)
GNI per capita, World Bank Atlas method ($)GDP growth, 1995–2000 and 2000–09 (average annual %)
Agriculture value added (% of GDP)
Industry value added (% of GDP)
Manufacturing value added (% of GDP)
Services value added (% of GDP)
Inflation (annual % change in consumer price index)
Exchange rate (local currency units per $)
Exports of goods and services (% of GDP)
Imports of goods and services (% of GDP) Investment climate
Ease of doing business index (ranking 1–183; 1 = best)
Time to star t a business (days)
Procedures to start a business (number)
Firing cost (weeks of wages)
Closing a business (years to resolve insolvency)
Total tax rate (% of profit)
Profit tax (% of commercial profits)New businesses registered (thousands)
New business density (new regis. per working-age pop.)
Enterprise surveys
Time dealing with gov’t officials (% of management time)
Firms expected to give gifts in meetings w/tax officials (%)
Firms using banks to finance investments (% of firms)
Delay in obtaining an electrical connection (days)
ISO certif ication ownership (% of firms)
Private sector investment
Invest. in infrastructure w/private participation ($ millions)
Private foreign direct investment, net (% of GDP)
Gross f ixed capital formation (% of GDP)
Gross f ixed private capital formation (% of GDP)
Finance and banking
Government cash surplus or deficit (% of GDP)
Government debt (% of GDP)
Deposit money banks’ assets (% of GDP) Total f inancial system deposits (% of GDP)
Bank capital to asset ratio (%)
Bank nonperforming loans to total gross loans ratio (%)
Domestic credit to the private sector (% of GDP)
Real interest rate (%)
Interest rate spread (percentage points)
Infrastructure
Paved roads (% of total roads)Electr ic power consumption (kWh per capita)
Power outages in a typical month (number)
Mobile cellular subscriptions (per 100 people)
Internet users (per 100 people)
74 2011 The Little Data Book on Private Sector Development
Country data
Lowermiddle-incomegroup
2000 2009 2009
Middle East & North Africa Lower middle income
Egypt, Arab Rep.
70.2 83.0 3,811
21.7 27.4 1,787
9.0 9.4 5.3
1,390 2,070 2,3215.2 4.9 8.5
16.7 13.7 13.3
33.1 37.3 38.9
19.4 16.0 25.8
50.1 49.0 47.7
2.7 11.8
3.5 5.5
16.2 25.0 28.9
22.8 31.9 28.3
.. 94
.. 7 35
.. 6 8
.. 132.0 57.7
.. 4.2 3.3
.. 42.6 40.2
.. 13.2 16.3.. 6.3
.. 0.1
.. 8.8
.. 5.3
.. 5.6
.. 92.4
.. 21.1
864 1,791 41,477
1.2 3.6 2.0
18.9 19.0 34.9
9.1 10.9 19.9
-6.7 -6.6 -2.3
.. 79.5 ..
77.1 63.7 107.667.6 71.2 54.9
5.6 6.4 10.0
13.6 13.4 5.1
52.0 36.2 92.9
7.9 1.0
3.8 5.5 7.3
78.1 86.9 36.3958 1,425 1,318
.. 1.1
1.9 66.7 57.8
0.6 20.0 17.2
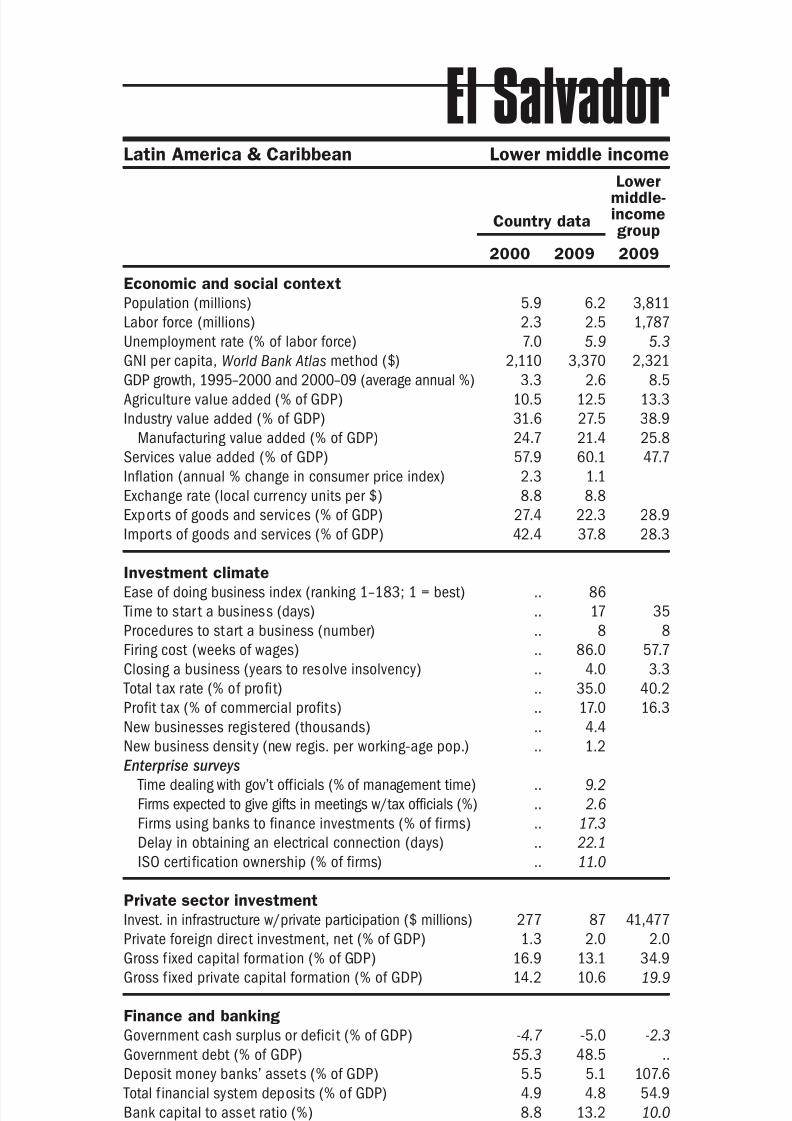
8/6/2019 The Little Data Book on Private Sector Development 2011
http://slidepdf.com/reader/full/the-little-data-book-on-private-sector-development-2011 83/246
Economic and social context
Population (millions)
Labor force (millions)
Unemployment rate (% of labor force)
GNI per capita, World Bank Atlas method ($)GDP growth, 1995–2000 and 2000–09 (average annual %)
Agriculture value added (% of GDP)
Industry value added (% of GDP)
Manufacturing value added (% of GDP)
Services value added (% of GDP)
Inflation (annual % change in consumer price index)
Exchange rate (local currency units per $)
Exports of goods and services (% of GDP)
Imports of goods and services (% of GDP) Investment climate
Ease of doing business index (ranking 1–183; 1 = best)
Time to star t a business (days)
Procedures to start a business (number)
Firing cost (weeks of wages)
Closing a business (years to resolve insolvency)
Total tax rate (% of profit)
Profit tax (% of commercial profits)New businesses registered (thousands)
New business density (new regis. per working-age pop.)
Enterprise surveys
Time dealing with gov’t officials (% of management time)
Firms expected to give gifts in meetings w/tax officials (%)
Firms using banks to finance investments (% of firms)
Delay in obtaining an electrical connection (days)
ISO certi fication ownership (% of firms)
Private sector investment
Invest. in infrastructure w/private participation ($ millions)
Private foreign direct investment, net (% of GDP)
Gross f ixed capital formation (% of GDP)
Gross f ixed private capital formation (% of GDP)
Finance and banking
Government cash surplus or deficit (% of GDP)
Government debt (% of GDP)
Deposit money banks’ assets (% of GDP) Total f inancial system deposits (% of GDP)
Bank capital to asset ratio (%)
Bank nonperforming loans to total gross loans ratio (%)
Domestic credit to the private sector (% of GDP)
Real interest rate (%)
Interest rate spread (percentage points)
Infrastructure
Paved roads (% of total roads)Electr ic power consumption (kWh per capita)
Power outages in a typical month (number)
Mobile cellular subscriptions (per 100 people)
Internet users (per 100 people)
75The Little Data Book on Private Sector Development 2011
Latin America & Caribbean Lower middle income
Country data
Lowermiddle-incomegroup
2000 2009 2009
El Salvador
5.9 6.2 3,811
2.3 2.5 1,787
7.0 5.9 5.3
2,110 3,370 2,3213.3 2.6 8.5
10.5 12.5 13.3
31.6 27.5 38.9
24.7 21.4 25.8
57.9 60.1 47.7
2.3 1.1
8.8 8.8
27.4 22.3 28.9
42.4 37.8 28.3
.. 86
.. 17 35
.. 8 8
.. 86.0 57.7
.. 4.0 3.3
.. 35.0 40.2
.. 17.0 16.3.. 4.4
.. 1.2
.. 9.2
.. 2.6
.. 17.3
.. 22.1
.. 11.0
277 87 41,477
1.3 2.0 2.0
16.9 13.1 34.9
14.2 10.6 19.9
-4.7 -5.0 -2.3
55.3 48.5 ..
5.5 5.1 107.64.9 4.8 54.9
8.8 13.2 10.0
4.3 3.6 5.1
45.2 41.3 92.9
10.5 ..
4.6 .. 7.3
19.8 .. 36.3680 953 1,318
.. 2.3
12.5 122.8 57.8
1.2 14.4 17.2
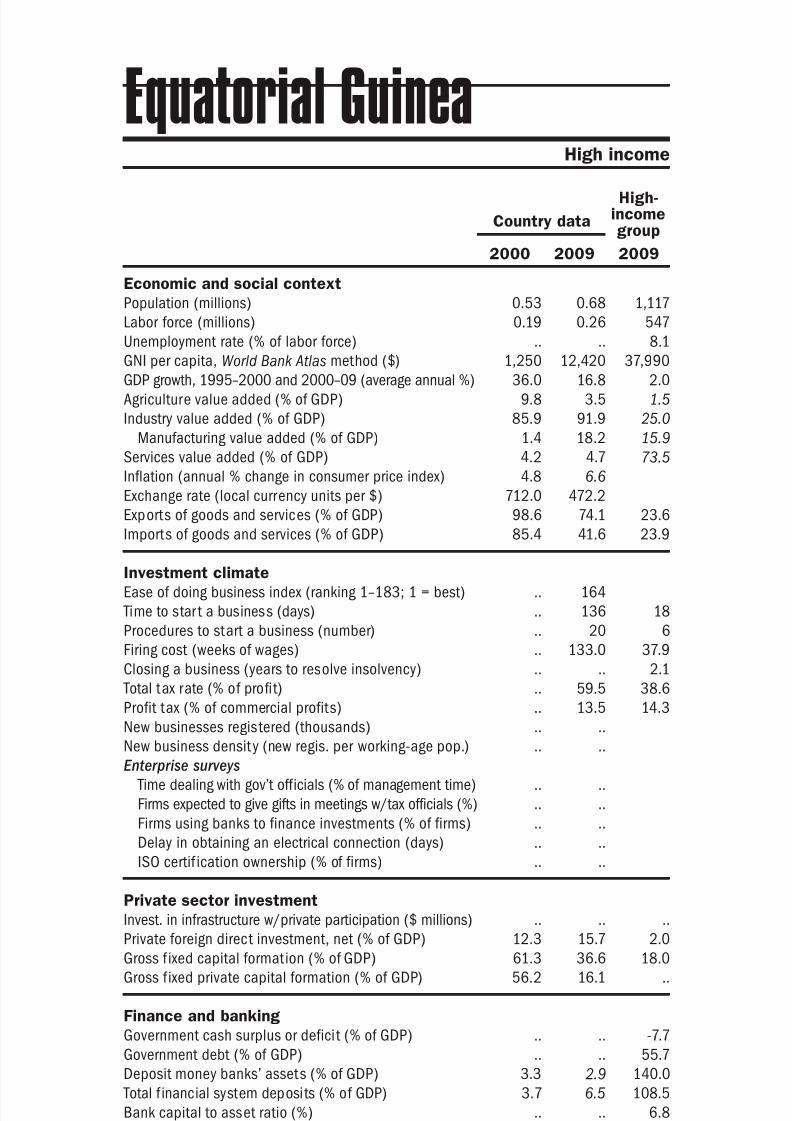
8/6/2019 The Little Data Book on Private Sector Development 2011
http://slidepdf.com/reader/full/the-little-data-book-on-private-sector-development-2011 84/246
Economic and social context
Population (millions)
Labor force (millions)
Unemployment rate (% of labor force)
GNI per capita, World Bank Atlas method ($)GDP growth, 1995–2000 and 2000–09 (average annual %)
Agriculture value added (% of GDP)
Industry value added (% of GDP)
Manufacturing value added (% of GDP)
Services value added (% of GDP)
Inflation (annual % change in consumer price index)
Exchange rate (local currency units per $)
Exports of goods and services (% of GDP)
Imports of goods and services (% of GDP) Investment climate
Ease of doing business index (ranking 1–183; 1 = best)
Time to star t a business (days)
Procedures to start a business (number)
Firing cost (weeks of wages)
Closing a business (years to resolve insolvency)
Total tax rate (% of profit)
Profit tax (% of commercial profits)New businesses registered (thousands)
New business density (new regis. per working-age pop.)
Enterprise surveys
Time dealing with gov’t officials (% of management time)
Firms expected to give gifts in meetings w/tax officials (%)
Firms using banks to finance investments (% of firms)
Delay in obtaining an electrical connection (days)
ISO certif ication ownership (% of firms)
Private sector investment
Invest. in infrastructure w/private participation ($ millions)
Private foreign direct investment, net (% of GDP)
Gross f ixed capital formation (% of GDP)
Gross f ixed private capital formation (% of GDP)
Finance and banking
Government cash surplus or deficit (% of GDP)
Government debt (% of GDP)
Deposit money banks’ assets (% of GDP) Total f inancial system deposits (% of GDP)
Bank capital to asset ratio (%)
Bank nonperforming loans to total gross loans ratio (%)
Domestic credit to the private sector (% of GDP)
Real interest rate (%)
Interest rate spread (percentage points)
Infrastructure
Paved roads (% of total roads)Electr ic power consumption (kWh per capita)
Power outages in a typical month (number)
Mobile cellular subscriptions (per 100 people)
Internet users (per 100 people)
76 2011 The Little Data Book on Private Sector Development
Country data
High-incomegroup
2000 2009 2009
High income
Equatorial Guinea
0.53 0.68 1,117
0.19 0.26 547
.. .. 8.1
1,250 12,420 37,99036.0 16.8 2.0
9.8 3.5 1.5
85.9 91.9 25.0
1.4 18.2 15.9
4.2 4.7 73.5
4.8 6.6
712.0 472.2
98.6 74.1 23.6
85.4 41.6 23.9
.. 164
.. 136 18
.. 20 6
.. 133.0 37.9
.. .. 2.1
.. 59.5 38.6
.. 13.5 14.3.. ..
.. ..
.. ..
.. ..
.. ..
.. ..
.. ..
.. .. ..
12.3 15.7 2.0
61.3 36.6 18.0
56.2 16.1 ..
.. .. -7.7
.. .. 55.7
3.3 2.9 140.03.7 6.5 108.5
.. .. 6.8
.. .. 3.4
3.0 7.7 165.1
-16.8 16.4
17.0 10.8 3.8
.. .. 93.4
.. .. 9,518
.. ..
0.9 65.8 111.2
0.1 2.1 72.3
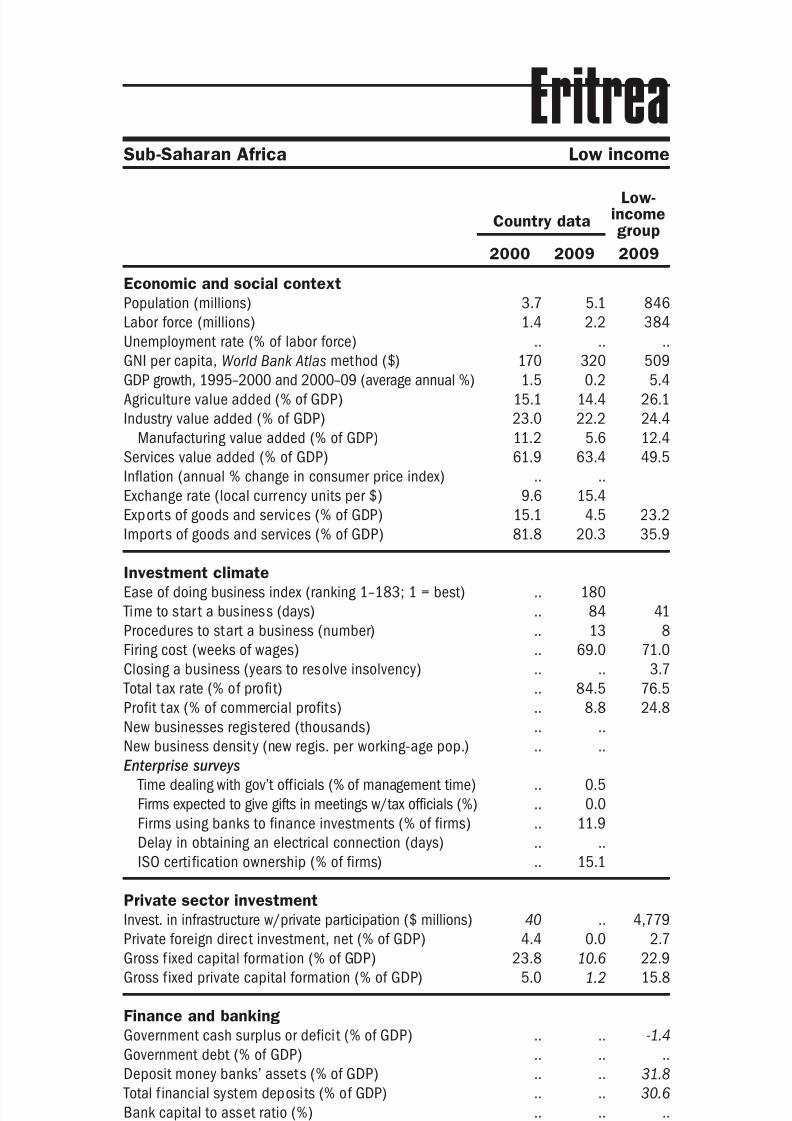
8/6/2019 The Little Data Book on Private Sector Development 2011
http://slidepdf.com/reader/full/the-little-data-book-on-private-sector-development-2011 85/246
Economic and social context
Population (millions)
Labor force (millions)
Unemployment rate (% of labor force)
GNI per capita, World Bank Atlas method ($)GDP growth, 1995–2000 and 2000–09 (average annual %)
Agriculture value added (% of GDP)
Industry value added (% of GDP)
Manufacturing value added (% of GDP)
Services value added (% of GDP)
Inflation (annual % change in consumer price index)
Exchange rate (local currency units per $)
Exports of goods and services (% of GDP)
Imports of goods and services (% of GDP) Investment climate
Ease of doing business index (ranking 1–183; 1 = best)
Time to star t a business (days)
Procedures to start a business (number)
Firing cost (weeks of wages)
Closing a business (years to resolve insolvency)
Total tax rate (% of profit)
Profit tax (% of commercial profits)New businesses registered (thousands)
New business density (new regis. per working-age pop.)
Enterprise surveys
Time dealing with gov’t officials (% of management time)
Firms expected to give gifts in meetings w/tax officials (%)
Firms using banks to finance investments (% of firms)
Delay in obtaining an electrical connection (days)
ISO certi fication ownership (% of firms)
Private sector investment
Invest. in infrastructure w/private participation ($ millions)
Private foreign direct investment, net (% of GDP)
Gross f ixed capital formation (% of GDP)
Gross f ixed private capital formation (% of GDP)
Finance and banking
Government cash surplus or deficit (% of GDP)
Government debt (% of GDP)
Deposit money banks’ assets (% of GDP) Total f inancial system deposits (% of GDP)
Bank capital to asset ratio (%)
Bank nonperforming loans to total gross loans ratio (%)
Domestic credit to the private sector (% of GDP)
Real interest rate (%)
Interest rate spread (percentage points)
Infrastructure
Paved roads (% of total roads)Electr ic power consumption (kWh per capita)
Power outages in a typical month (number)
Mobile cellular subscriptions (per 100 people)
Internet users (per 100 people)
77The Little Data Book on Private Sector Development 2011
Sub-Saharan Africa Low income
Country data
Low-incomegroup
2000 2009 2009
Eritrea
3.7 5.1 846
1.4 2.2 384
.. .. ..
170 320 5091.5 0.2 5.4
15.1 14.4 26.1
23.0 22.2 24.4
11.2 5.6 12.4
61.9 63.4 49.5
.. ..
9.6 15.4
15.1 4.5 23.2
81.8 20.3 35.9
.. 180
.. 84 41
.. 13 8
.. 69.0 71.0
.. .. 3.7
.. 84.5 76.5
.. 8.8 24.8.. ..
.. ..
.. 0.5
.. 0.0
.. 11.9
.. ..
.. 15.1
40 .. 4,779
4.4 0.0 2.7
23.8 10.6 22.9
5.0 1.2 15.8
.. .. -1.4
.. .. ..
.. .. 31.8
.. .. 30.6
.. .. ..
.. .. ..
32.5 16.6 26.3
.. ..
.. .. 11.5
21.8 .. 12.0.. .. 231
.. 3.0
0.0 2.8 26.6
0.1 4.9 2.7
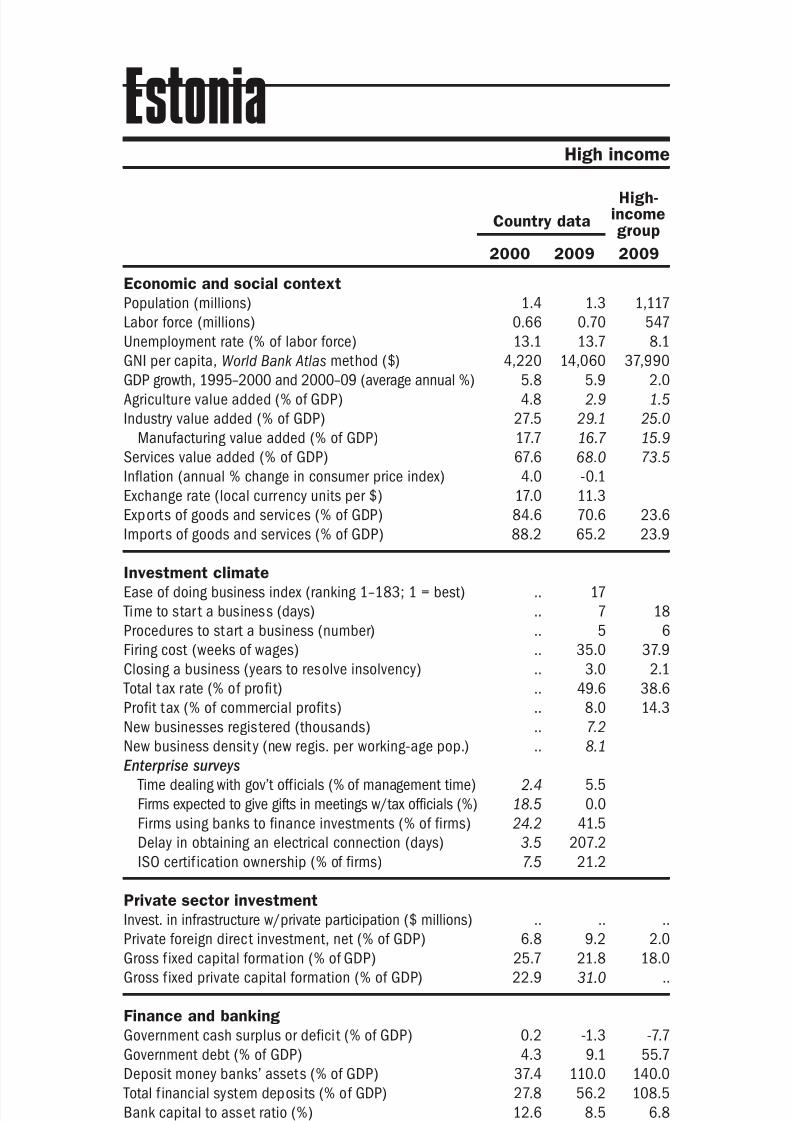
8/6/2019 The Little Data Book on Private Sector Development 2011
http://slidepdf.com/reader/full/the-little-data-book-on-private-sector-development-2011 86/246
Economic and social context
Population (millions)
Labor force (millions)
Unemployment rate (% of labor force)
GNI per capita, World Bank Atlas method ($)GDP growth, 1995–2000 and 2000–09 (average annual %)
Agriculture value added (% of GDP)
Industry value added (% of GDP)
Manufacturing value added (% of GDP)
Services value added (% of GDP)
Inflation (annual % change in consumer price index)
Exchange rate (local currency units per $)
Exports of goods and services (% of GDP)
Imports of goods and services (% of GDP) Investment climate
Ease of doing business index (ranking 1–183; 1 = best)
Time to star t a business (days)
Procedures to start a business (number)
Firing cost (weeks of wages)
Closing a business (years to resolve insolvency)
Total tax rate (% of profit)
Profit tax (% of commercial profits)New businesses registered (thousands)
New business density (new regis. per working-age pop.)
Enterprise surveys
Time dealing with gov’t officials (% of management time)
Firms expected to give gifts in meetings w/tax officials (%)
Firms using banks to finance investments (% of firms)
Delay in obtaining an electrical connection (days)
ISO certif ication ownership (% of firms)
Private sector investment
Invest. in infrastructure w/private participation ($ millions)
Private foreign direct investment, net (% of GDP)
Gross f ixed capital formation (% of GDP)
Gross f ixed private capital formation (% of GDP)
Finance and banking
Government cash surplus or deficit (% of GDP)
Government debt (% of GDP)
Deposit money banks’ assets (% of GDP) Total f inancial system deposits (% of GDP)
Bank capital to asset ratio (%)
Bank nonperforming loans to total gross loans ratio (%)
Domestic credit to the private sector (% of GDP)
Real interest rate (%)
Interest rate spread (percentage points)
Infrastructure
Paved roads (% of total roads)Electr ic power consumption (kWh per capita)
Power outages in a typical month (number)
Mobile cellular subscriptions (per 100 people)
Internet users (per 100 people)
78 2011 The Little Data Book on Private Sector Development
Country data
High-incomegroup
2000 2009 2009
High income
Estonia
1.4 1.3 1,117
0.66 0.70 547
13.1 13.7 8.1
4,220 14,060 37,9905.8 5.9 2.0
4.8 2.9 1.5
27.5 29.1 25.0
17.7 16.7 15.9
67.6 68.0 73.5
4.0 -0.1
17.0 11.3
84.6 70.6 23.6
88.2 65.2 23.9
.. 17
.. 7 18
.. 5 6
.. 35.0 37.9
.. 3.0 2.1
.. 49.6 38.6
.. 8.0 14.3.. 7.2
.. 8.1
2.4 5.5
18.5 0.0
24.2 41.5
3.5 207.2
7.5 21.2
.. .. ..
6.8 9.2 2.0
25.7 21.8 18.0
22.9 31.0 ..
0.2 -1.3 -7.7
4.3 9.1 55.7
37.4 110.0 140.027.8 56.2 108.5
12.6 8.5 6.8
1.0 5.2 3.4
36.1 110.2 165.1
2.4 10.0
3.7 4.6 3.8
20.1 28.8 93.44,629 6,348 9,518
.. 1.2
40.7 203.0 111.2
28.6 72.3 72.3
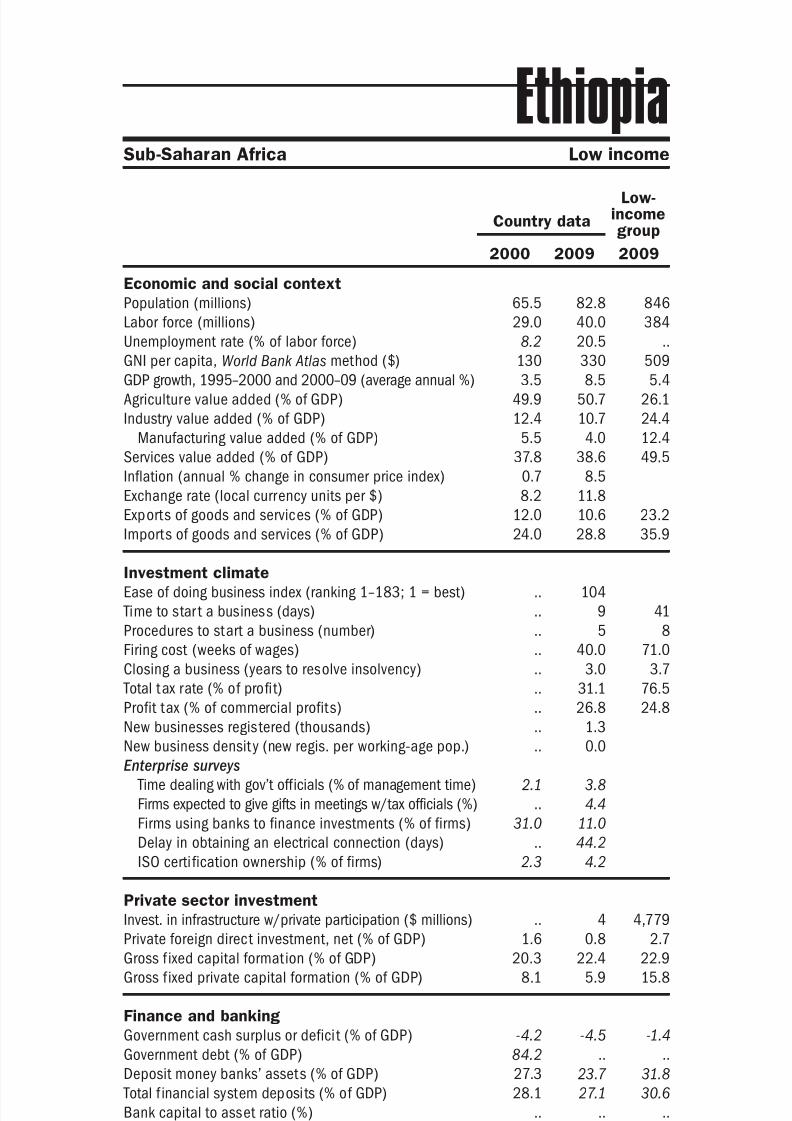
8/6/2019 The Little Data Book on Private Sector Development 2011
http://slidepdf.com/reader/full/the-little-data-book-on-private-sector-development-2011 87/246
Economic and social context
Population (millions)
Labor force (millions)
Unemployment rate (% of labor force)
GNI per capita, World Bank Atlas method ($)GDP growth, 1995–2000 and 2000–09 (average annual %)
Agriculture value added (% of GDP)
Industry value added (% of GDP)
Manufacturing value added (% of GDP)
Services value added (% of GDP)
Inflation (annual % change in consumer price index)
Exchange rate (local currency units per $)
Exports of goods and services (% of GDP)
Imports of goods and services (% of GDP) Investment climate
Ease of doing business index (ranking 1–183; 1 = best)
Time to star t a business (days)
Procedures to start a business (number)
Firing cost (weeks of wages)
Closing a business (years to resolve insolvency)
Total tax rate (% of profit)
Profit tax (% of commercial profits)New businesses registered (thousands)
New business density (new regis. per working-age pop.)
Enterprise surveys
Time dealing with gov’t officials (% of management time)
Firms expected to give gifts in meetings w/tax officials (%)
Firms using banks to finance investments (% of firms)
Delay in obtaining an electrical connection (days)
ISO certi fication ownership (% of firms)
Private sector investment
Invest. in infrastructure w/private participation ($ millions)
Private foreign direct investment, net (% of GDP)
Gross f ixed capital formation (% of GDP)
Gross f ixed private capital formation (% of GDP)
Finance and banking
Government cash surplus or deficit (% of GDP)
Government debt (% of GDP)
Deposit money banks’ assets (% of GDP) Total f inancial system deposits (% of GDP)
Bank capital to asset ratio (%)
Bank nonperforming loans to total gross loans ratio (%)
Domestic credit to the private sector (% of GDP)
Real interest rate (%)
Interest rate spread (percentage points)
Infrastructure
Paved roads (% of total roads)Electr ic power consumption (kWh per capita)
Power outages in a typical month (number)
Mobile cellular subscriptions (per 100 people)
Internet users (per 100 people)
79The Little Data Book on Private Sector Development 2011
Sub-Saharan Africa Low income
Country data
Low-incomegroup
2000 2009 2009
Ethiopia
65.5 82.8 846
29.0 40.0 384
8.2 20.5 ..
130 330 5093.5 8.5 5.4
49.9 50.7 26.1
12.4 10.7 24.4
5.5 4.0 12.4
37.8 38.6 49.5
0.7 8.5
8.2 11.8
12.0 10.6 23.2
24.0 28.8 35.9
.. 104
.. 9 41
.. 5 8
.. 40.0 71.0
.. 3.0 3.7
.. 31.1 76.5
.. 26.8 24.8.. 1.3
.. 0.0
2.1 3.8
.. 4.4
31.0 11.0
.. 44.2
2.3 4.2
.. 4 4,779
1.6 0.8 2.7
20.3 22.4 22.9
8.1 5.9 15.8
-4.2 -4.5 -1.4
84.2 .. ..
27.3 23.7 31.828.1 27.1 30.6
.. .. ..
.. .. ..
23.1 17.8 26.3
3.8 -17.2
4.9 3.3 11.5
12.0 13.7 12.023 42 231
.. 5.0
0.0 4.9 26.6
0.0 0.5 2.7
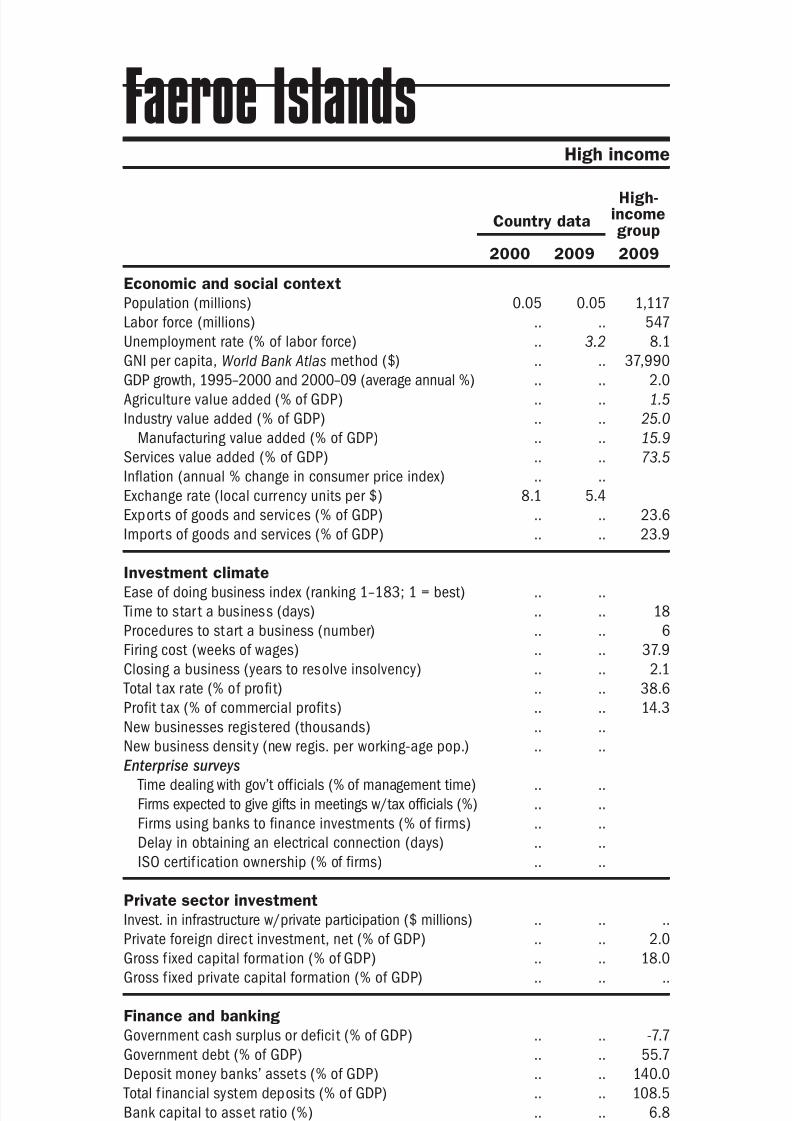
8/6/2019 The Little Data Book on Private Sector Development 2011
http://slidepdf.com/reader/full/the-little-data-book-on-private-sector-development-2011 88/246
Economic and social context
Population (millions)
Labor force (millions)
Unemployment rate (% of labor force)
GNI per capita, World Bank Atlas method ($)GDP growth, 1995–2000 and 2000–09 (average annual %)
Agriculture value added (% of GDP)
Industry value added (% of GDP)
Manufacturing value added (% of GDP)
Services value added (% of GDP)
Inflation (annual % change in consumer price index)
Exchange rate (local currency units per $)
Exports of goods and services (% of GDP)
Imports of goods and services (% of GDP) Investment climate
Ease of doing business index (ranking 1–183; 1 = best)
Time to star t a business (days)
Procedures to start a business (number)
Firing cost (weeks of wages)
Closing a business (years to resolve insolvency)
Total tax rate (% of profit)
Profit tax (% of commercial profits)New businesses registered (thousands)
New business density (new regis. per working-age pop.)
Enterprise surveys
Time dealing with gov’t officials (% of management time)
Firms expected to give gifts in meetings w/tax officials (%)
Firms using banks to finance investments (% of firms)
Delay in obtaining an electrical connection (days)
ISO certif ication ownership (% of firms)
Private sector investment
Invest. in infrastructure w/private participation ($ millions)
Private foreign direct investment, net (% of GDP)
Gross f ixed capital formation (% of GDP)
Gross f ixed private capital formation (% of GDP)
Finance and banking
Government cash surplus or deficit (% of GDP)
Government debt (% of GDP)
Deposit money banks’ assets (% of GDP) Total f inancial system deposits (% of GDP)
Bank capital to asset ratio (%)
Bank nonperforming loans to total gross loans ratio (%)
Domestic credit to the private sector (% of GDP)
Real interest rate (%)
Interest rate spread (percentage points)
Infrastructure
Paved roads (% of total roads)Electr ic power consumption (kWh per capita)
Power outages in a typical month (number)
Mobile cellular subscriptions (per 100 people)
Internet users (per 100 people)
80 2011 The Little Data Book on Private Sector Development
Country data
High-incomegroup
2000 2009 2009
High income
Faeroe Islands
0.05 0.05 1,117
.. .. 547
.. 3.2 8.1
.. .. 37,990
.. .. 2.0
.. .. 1.5
.. .. 25.0
.. .. 15.9
.. .. 73.5
.. ..
8.1 5.4
.. .. 23.6
.. .. 23.9
.. ..
.. .. 18
.. .. 6
.. .. 37.9
.. .. 2.1
.. .. 38.6
.. .. 14.3.. ..
.. ..
.. ..
.. ..
.. ..
.. ..
.. ..
.. .. ..
.. .. 2.0
.. .. 18.0
.. .. ..
.. .. -7.7
.. .. 55.7
.. .. 140.0
.. .. 108.5
.. .. 6.8
.. .. 3.4
.. .. 165.1
.. ..
.. .. 3.8
.. .. 93.4
.. .. 9,518
.. ..
37.1 117.2 111.2
32.8 77.1 72.3
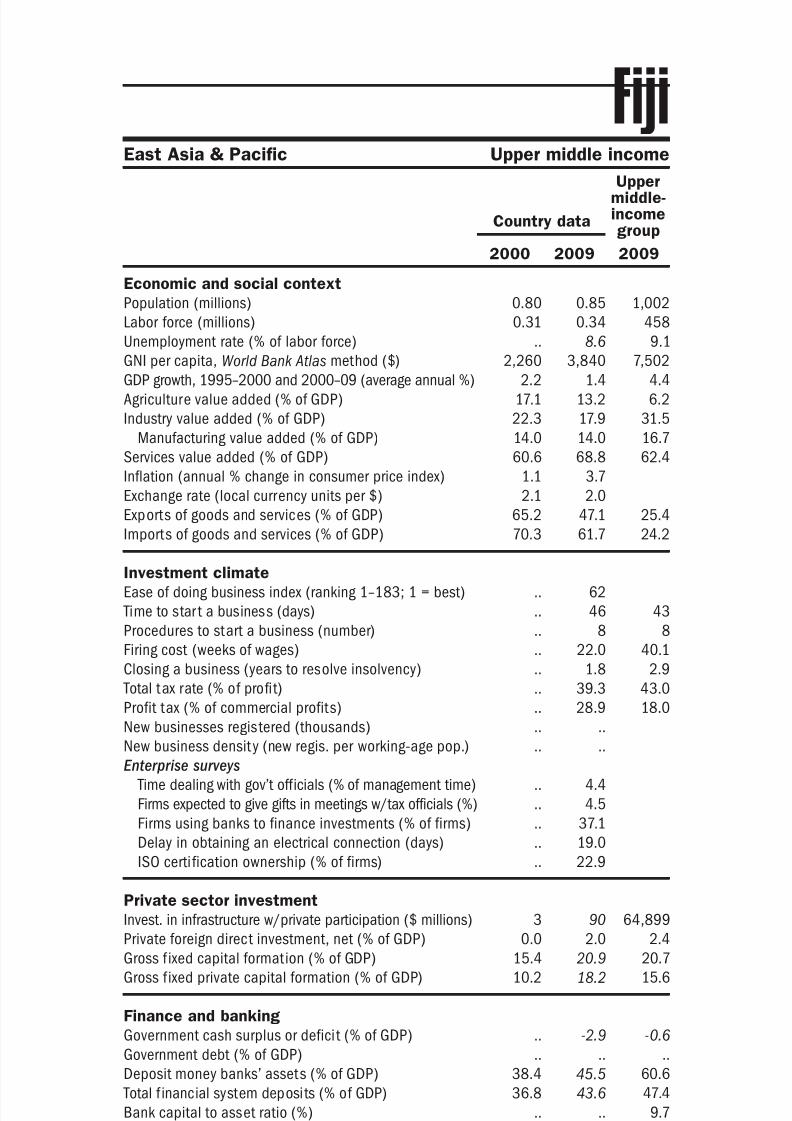
8/6/2019 The Little Data Book on Private Sector Development 2011
http://slidepdf.com/reader/full/the-little-data-book-on-private-sector-development-2011 89/246
Economic and social context
Population (millions)
Labor force (millions)
Unemployment rate (% of labor force)
GNI per capita, World Bank Atlas method ($)GDP growth, 1995–2000 and 2000–09 (average annual %)
Agriculture value added (% of GDP)
Industry value added (% of GDP)
Manufacturing value added (% of GDP)
Services value added (% of GDP)
Inflation (annual % change in consumer price index)
Exchange rate (local currency units per $)
Exports of goods and services (% of GDP)
Imports of goods and services (% of GDP) Investment climate
Ease of doing business index (ranking 1–183; 1 = best)
Time to star t a business (days)
Procedures to start a business (number)
Firing cost (weeks of wages)
Closing a business (years to resolve insolvency)
Total tax rate (% of profit)
Profit tax (% of commercial profits)New businesses registered (thousands)
New business density (new regis. per working-age pop.)
Enterprise surveys
Time dealing with gov’t officials (% of management time)
Firms expected to give gifts in meetings w/tax officials (%)
Firms using banks to finance investments (% of firms)
Delay in obtaining an electrical connection (days)
ISO certi fication ownership (% of firms)
Private sector investment
Invest. in infrastructure w/private participation ($ millions)
Private foreign direct investment, net (% of GDP)
Gross f ixed capital formation (% of GDP)
Gross f ixed private capital formation (% of GDP)
Finance and banking
Government cash surplus or deficit (% of GDP)
Government debt (% of GDP)
Deposit money banks’ assets (% of GDP) Total f inancial system deposits (% of GDP)
Bank capital to asset ratio (%)
Bank nonperforming loans to total gross loans ratio (%)
Domestic credit to the private sector (% of GDP)
Real interest rate (%)
Interest rate spread (percentage points)
Infrastructure
Paved roads (% of total roads)Electr ic power consumption (kWh per capita)
Power outages in a typical month (number)
Mobile cellular subscriptions (per 100 people)
Internet users (per 100 people)
81The Little Data Book on Private Sector Development 2011
East Asia & Pacific Upper middle income
Country data
Uppermiddle-incomegroup
2000 2009 2009
Fiji
0.80 0.85 1,002
0.31 0.34 458
.. 8.6 9.1
2,260 3,840 7,5022.2 1.4 4.4
17.1 13.2 6.2
22.3 17.9 31.5
14.0 14.0 16.7
60.6 68.8 62.4
1.1 3.7
2.1 2.0
65.2 47.1 25.4
70.3 61.7 24.2
.. 62
.. 46 43
.. 8 8
.. 22.0 40.1
.. 1.8 2.9
.. 39.3 43.0
.. 28.9 18.0.. ..
.. ..
.. 4.4
.. 4.5
.. 37.1
.. 19.0
.. 22.9
3 90 64,899
0.0 2.0 2.4
15.4 20.9 20.7
10.2 18.2 15.6
.. -2.9 -0.6
.. .. ..
38.4 45.5 60.636.8 43.6 47.4
.. .. 9.7
.. .. 4.2
32.0 49.9 47.8
13.7 7.5
7.5 7.1 5.5
49.2 .. 36.8.. .. 3,001
.. 1.7
6.9 75.4 100.6
1.5 13.4 34.6
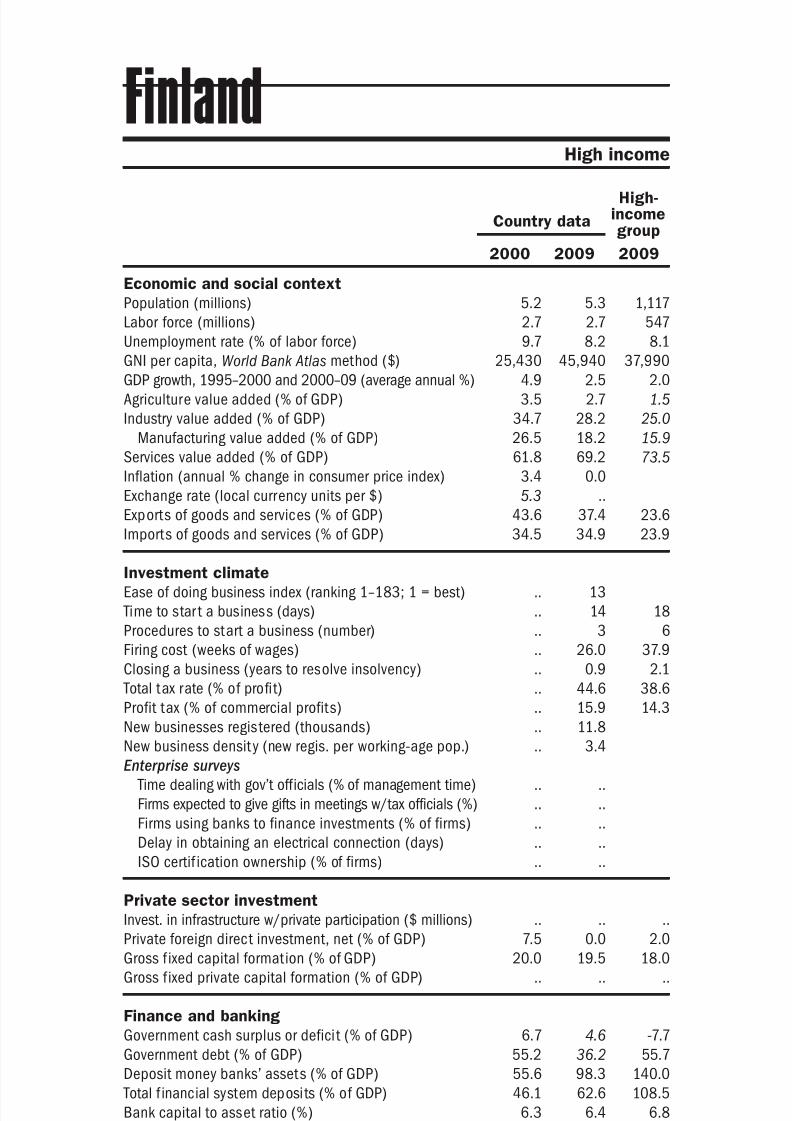
8/6/2019 The Little Data Book on Private Sector Development 2011
http://slidepdf.com/reader/full/the-little-data-book-on-private-sector-development-2011 90/246
Economic and social context
Population (millions)
Labor force (millions)
Unemployment rate (% of labor force)
GNI per capita, World Bank Atlas method ($)GDP growth, 1995–2000 and 2000–09 (average annual %)
Agriculture value added (% of GDP)
Industry value added (% of GDP)
Manufacturing value added (% of GDP)
Services value added (% of GDP)
Inflation (annual % change in consumer price index)
Exchange rate (local currency units per $)
Exports of goods and services (% of GDP)
Imports of goods and services (% of GDP) Investment climate
Ease of doing business index (ranking 1–183; 1 = best)
Time to star t a business (days)
Procedures to start a business (number)
Firing cost (weeks of wages)
Closing a business (years to resolve insolvency)
Total tax rate (% of profit)
Profit tax (% of commercial profits)New businesses registered (thousands)
New business density (new regis. per working-age pop.)
Enterprise surveys
Time dealing with gov’t officials (% of management time)
Firms expected to give gifts in meetings w/tax officials (%)
Firms using banks to finance investments (% of firms)
Delay in obtaining an electrical connection (days)
ISO certif ication ownership (% of firms)
Private sector investment
Invest. in infrastructure w/private participation ($ millions)
Private foreign direct investment, net (% of GDP)
Gross f ixed capital formation (% of GDP)
Gross f ixed private capital formation (% of GDP)
Finance and banking
Government cash surplus or deficit (% of GDP)
Government debt (% of GDP)
Deposit money banks’ assets (% of GDP) Total f inancial system deposits (% of GDP)
Bank capital to asset ratio (%)
Bank nonperforming loans to total gross loans ratio (%)
Domestic credit to the private sector (% of GDP)
Real interest rate (%)
Interest rate spread (percentage points)
Infrastructure
Paved roads (% of total roads)Electr ic power consumption (kWh per capita)
Power outages in a typical month (number)
Mobile cellular subscriptions (per 100 people)
Internet users (per 100 people)
82 2011 The Little Data Book on Private Sector Development
Country data
High-incomegroup
2000 2009 2009
High income
Finland
5.2 5.3 1,117
2.7 2.7 547
9.7 8.2 8.1
25,430 45,940 37,9904.9 2.5 2.0
3.5 2.7 1.5
34.7 28.2 25.0
26.5 18.2 15.9
61.8 69.2 73.5
3.4 0.0
5.3 ..
43.6 37.4 23.6
34.5 34.9 23.9
.. 13
.. 14 18
.. 3 6
.. 26.0 37.9
.. 0.9 2.1
.. 44.6 38.6
.. 15.9 14.3.. 11.8
.. 3.4
.. ..
.. ..
.. ..
.. ..
.. ..
.. .. ..
7.5 0.0 2.0
20.0 19.5 18.0
.. .. ..
6.7 4.6 -7.7
55.2 36.2 55.7
55.6 98.3 140.046.1 62.6 108.5
6.3 6.4 6.8
0.6 0.7 3.4
53.2 94.4 165.1
2.9 3.2
4.0 2.7 3.8
62.0 65.5 93.415,286 16,350 9,518
.. ..
72.0 144.2 111.2
37.2 83.9 72.3
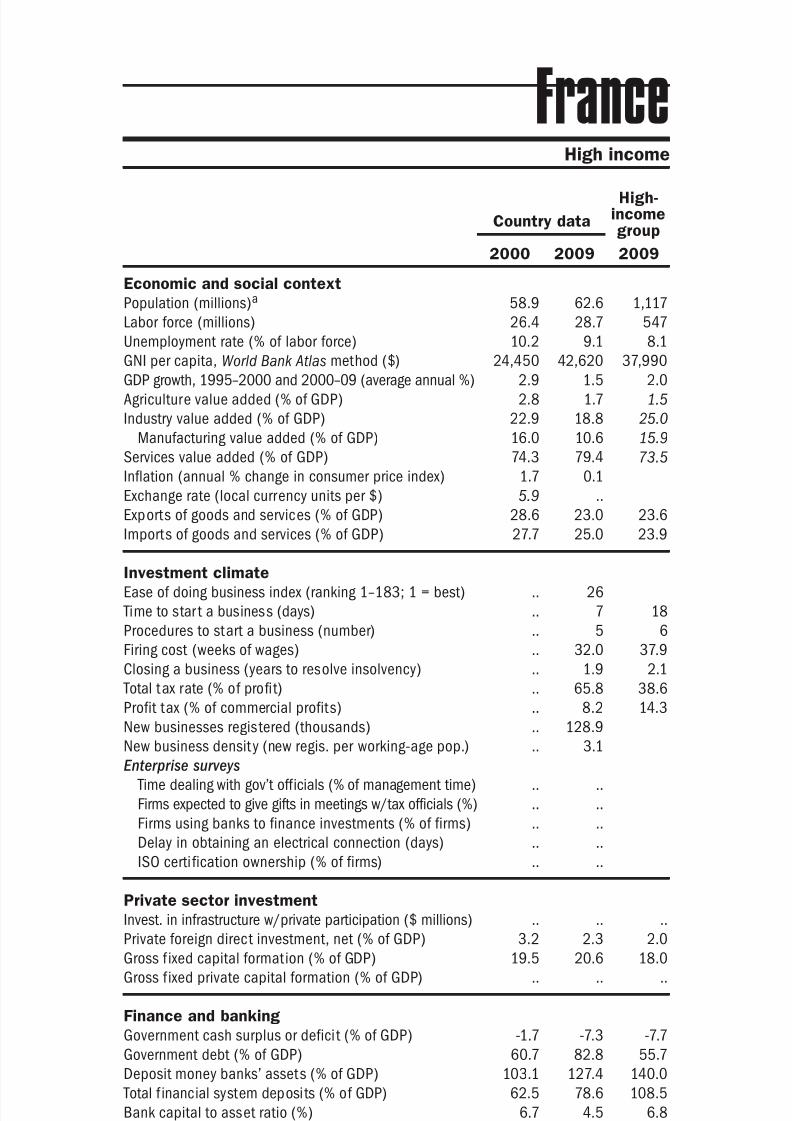
8/6/2019 The Little Data Book on Private Sector Development 2011
http://slidepdf.com/reader/full/the-little-data-book-on-private-sector-development-2011 91/246
Economic and social context
Population (millions)a
Labor force (millions)
Unemployment rate (% of labor force)
GNI per capita, World Bank Atlas method ($)GDP growth, 1995–2000 and 2000–09 (average annual %)
Agriculture value added (% of GDP)
Industry value added (% of GDP)
Manufacturing value added (% of GDP)
Services value added (% of GDP)
Inflation (annual % change in consumer price index)
Exchange rate (local currency units per $)
Exports of goods and services (% of GDP)
Imports of goods and services (% of GDP) Investment climate
Ease of doing business index (ranking 1–183; 1 = best)
Time to star t a business (days)
Procedures to start a business (number)
Firing cost (weeks of wages)
Closing a business (years to resolve insolvency)
Total tax rate (% of profit)
Profit tax (% of commercial profits)New businesses registered (thousands)
New business density (new regis. per working-age pop.)
Enterprise surveys
Time dealing with gov’t officials (% of management time)
Firms expected to give gifts in meetings w/tax officials (%)
Firms using banks to finance investments (% of firms)
Delay in obtaining an electrical connection (days)
ISO certi fication ownership (% of firms)
Private sector investment
Invest. in infrastructure w/private participation ($ millions)
Private foreign direct investment, net (% of GDP)
Gross f ixed capital formation (% of GDP)
Gross f ixed private capital formation (% of GDP)
Finance and banking
Government cash surplus or deficit (% of GDP)
Government debt (% of GDP)
Deposit money banks’ assets (% of GDP) Total f inancial system deposits (% of GDP)
Bank capital to asset ratio (%)
Bank nonperforming loans to total gross loans ratio (%)
Domestic credit to the private sector (% of GDP)
Real interest rate (%)
Interest rate spread (percentage points)
Infrastructure
Paved roads (% of total roads)Electr ic power consumption (kWh per capita)
Power outages in a typical month (number)
Mobile cellular subscriptions (per 100 people)
Internet users (per 100 people)
83The Little Data Book on Private Sector Development 2011
High income
Country data
High-incomegroup
2000 2009 2009
France
58.9 62.6 1,117
26.4 28.7 547
10.2 9.1 8.1
24,450 42,620 37,9902.9 1.5 2.0
2.8 1.7 1.5
22.9 18.8 25.0
16.0 10.6 15.9
74.3 79.4 73.5
1.7 0.1
5.9 ..
28.6 23.0 23.6
27.7 25.0 23.9
.. 26
.. 7 18
.. 5 6
.. 32.0 37.9
.. 1.9 2.1
.. 65.8 38.6
.. 8.2 14.3.. 128.9
.. 3.1
.. ..
.. ..
.. ..
.. ..
.. ..
.. .. ..
3.2 2.3 2.0
19.5 20.6 18.0
.. .. ..
-1.7 -7.3 -7.7
60.7 82.8 55.7
103.1 127.4 140.062.5 78.6 108.5
6.7 4.5 6.8
5.0 3.6 3.4
85.0 110.3 165.1
5.2 4.9
4.1 4.4 3.8
100.0 100.0 93.47,485 7,931 9,518
.. ..
49.3 95.1 111.2
14.4 71.3 72.3
a. Excludes the French overseas departments of French Guiana, Guadeloupe, Martinique, and Reunion.
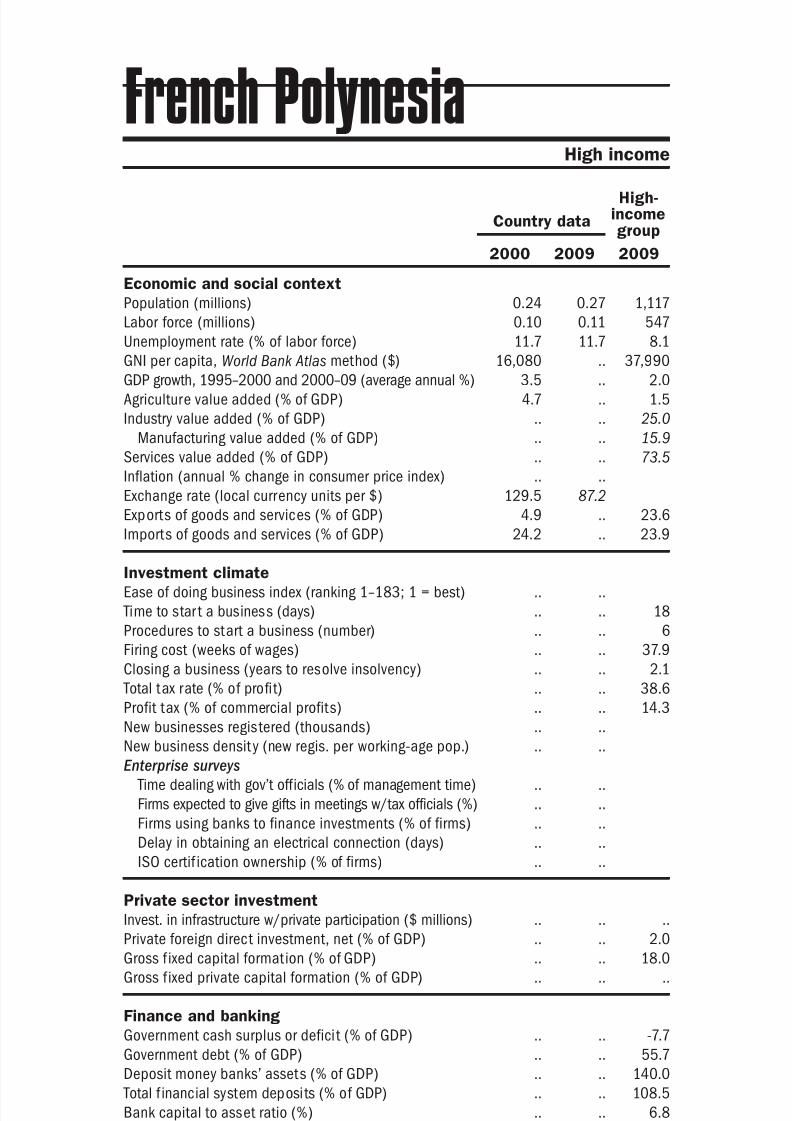
8/6/2019 The Little Data Book on Private Sector Development 2011
http://slidepdf.com/reader/full/the-little-data-book-on-private-sector-development-2011 92/246
Economic and social context
Population (millions)
Labor force (millions)
Unemployment rate (% of labor force)
GNI per capita, World Bank Atlas method ($)GDP growth, 1995–2000 and 2000–09 (average annual %)
Agriculture value added (% of GDP)
Industry value added (% of GDP)
Manufacturing value added (% of GDP)
Services value added (% of GDP)
Inflation (annual % change in consumer price index)
Exchange rate (local currency units per $)
Exports of goods and services (% of GDP)
Imports of goods and services (% of GDP) Investment climate
Ease of doing business index (ranking 1–183; 1 = best)
Time to star t a business (days)
Procedures to start a business (number)
Firing cost (weeks of wages)
Closing a business (years to resolve insolvency)
Total tax rate (% of profit)
Profit tax (% of commercial profits)New businesses registered (thousands)
New business density (new regis. per working-age pop.)
Enterprise surveys
Time dealing with gov’t officials (% of management time)
Firms expected to give gifts in meetings w/tax officials (%)
Firms using banks to finance investments (% of firms)
Delay in obtaining an electrical connection (days)
ISO certif ication ownership (% of firms)
Private sector investment
Invest. in infrastructure w/private participation ($ millions)
Private foreign direct investment, net (% of GDP)
Gross f ixed capital formation (% of GDP)
Gross f ixed private capital formation (% of GDP)
Finance and banking
Government cash surplus or deficit (% of GDP)
Government debt (% of GDP)
Deposit money banks’ assets (% of GDP) Total f inancial system deposits (% of GDP)
Bank capital to asset ratio (%)
Bank nonperforming loans to total gross loans ratio (%)
Domestic credit to the private sector (% of GDP)
Real interest rate (%)
Interest rate spread (percentage points)
Infrastructure
Paved roads (% of total roads)Electr ic power consumption (kWh per capita)
Power outages in a typical month (number)
Mobile cellular subscriptions (per 100 people)
Internet users (per 100 people)
84 2011 The Little Data Book on Private Sector Development
Country data
High-incomegroup
2000 2009 2009
High income
French Polynesia
0.24 0.27 1,117
0.10 0.11 547
11.7 11.7 8.1
16,080 .. 37,9903.5 .. 2.0
4.7 .. 1.5
.. .. 25.0
.. .. 15.9
.. .. 73.5
.. ..
129.5 87.2
4.9 .. 23.6
24.2 .. 23.9
.. ..
.. .. 18
.. .. 6
.. .. 37.9
.. .. 2.1
.. .. 38.6
.. .. 14.3.. ..
.. ..
.. ..
.. ..
.. ..
.. ..
.. ..
.. .. ..
.. .. 2.0
.. .. 18.0
.. .. ..
.. .. -7.7
.. .. 55.7
.. .. 140.0
.. .. 108.5
.. .. 6.8
.. .. 3.4
.. .. 165.1
.. ..
.. .. 3.8
.. .. 93.4
.. .. 9,518
.. ..
16.9 77.4 111.2
6.4 44.6 72.3
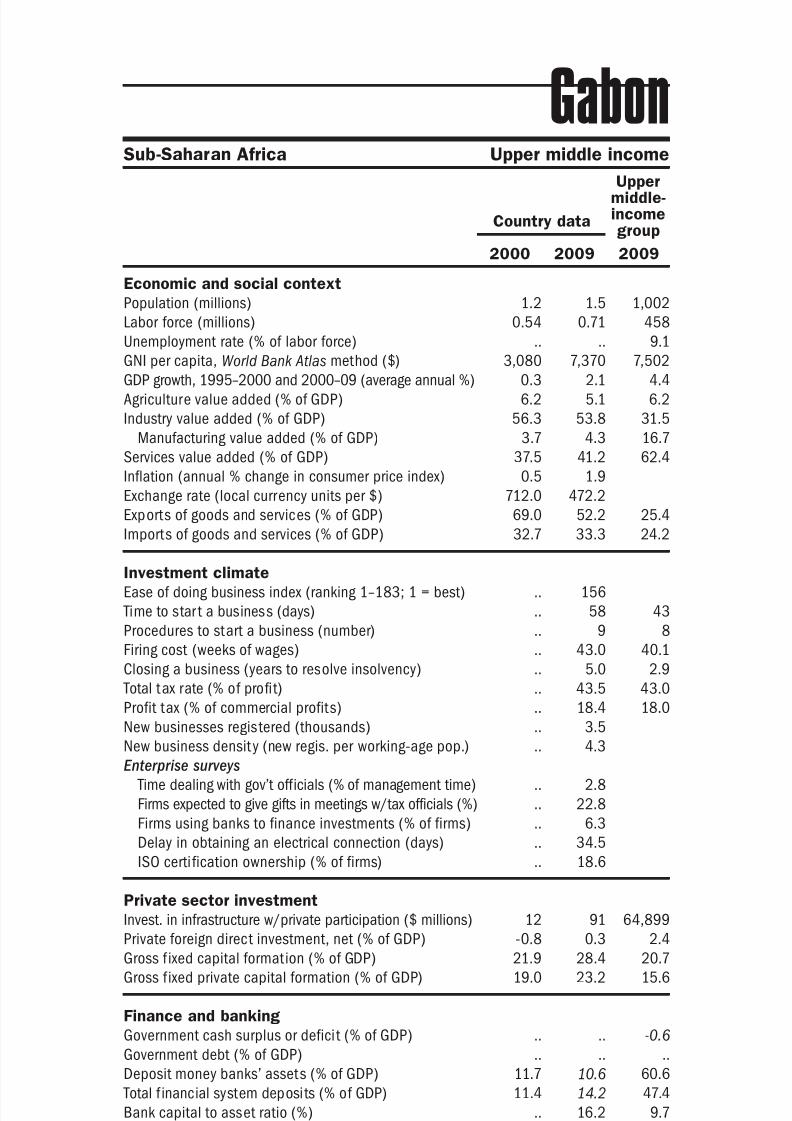
8/6/2019 The Little Data Book on Private Sector Development 2011
http://slidepdf.com/reader/full/the-little-data-book-on-private-sector-development-2011 93/246
Economic and social context
Population (millions)
Labor force (millions)
Unemployment rate (% of labor force)
GNI per capita, World Bank Atlas method ($)GDP growth, 1995–2000 and 2000–09 (average annual %)
Agriculture value added (% of GDP)
Industry value added (% of GDP)
Manufacturing value added (% of GDP)
Services value added (% of GDP)
Inflation (annual % change in consumer price index)
Exchange rate (local currency units per $)
Exports of goods and services (% of GDP)
Imports of goods and services (% of GDP) Investment climate
Ease of doing business index (ranking 1–183; 1 = best)
Time to star t a business (days)
Procedures to start a business (number)
Firing cost (weeks of wages)
Closing a business (years to resolve insolvency)
Total tax rate (% of profit)
Profit tax (% of commercial profits)New businesses registered (thousands)
New business density (new regis. per working-age pop.)
Enterprise surveys
Time dealing with gov’t officials (% of management time)
Firms expected to give gifts in meetings w/tax officials (%)
Firms using banks to finance investments (% of firms)
Delay in obtaining an electrical connection (days)
ISO certi fication ownership (% of firms)
Private sector investment
Invest. in infrastructure w/private participation ($ millions)
Private foreign direct investment, net (% of GDP)
Gross f ixed capital formation (% of GDP)
Gross f ixed private capital formation (% of GDP)
Finance and banking
Government cash surplus or deficit (% of GDP)
Government debt (% of GDP)
Deposit money banks’ assets (% of GDP) Total f inancial system deposits (% of GDP)
Bank capital to asset ratio (%)
Bank nonperforming loans to total gross loans ratio (%)
Domestic credit to the private sector (% of GDP)
Real interest rate (%)
Interest rate spread (percentage points)
Infrastructure
Paved roads (% of total roads)Electr ic power consumption (kWh per capita)
Power outages in a typical month (number)
Mobile cellular subscriptions (per 100 people)
Internet users (per 100 people)
85The Little Data Book on Private Sector Development 2011
Sub-Saharan Africa Upper middle income
Country data
Uppermiddle-incomegroup
2000 2009 2009
Gabon
1.2 1.5 1,002
0.54 0.71 458
.. .. 9.1
3,080 7,370 7,5020.3 2.1 4.4
6.2 5.1 6.2
56.3 53.8 31.5
3.7 4.3 16.7
37.5 41.2 62.4
0.5 1.9
712.0 472.2
69.0 52.2 25.4
32.7 33.3 24.2
.. 156
.. 58 43
.. 9 8
.. 43.0 40.1
.. 5.0 2.9
.. 43.5 43.0
.. 18.4 18.0.. 3.5
.. 4.3
.. 2.8
.. 22.8
.. 6.3
.. 34.5
.. 18.6
12 91 64,899
-0.8 0.3 2.4
21.9 28.4 20.7
19.0 23.2 15.6
.. .. -0.6
.. .. ..
11.7 10.6 60.611.4 14.2 47.4
.. 16.2 9.7
6.6 9.8 4.2
8.7 10.1 47.8
-4.8 9.3
17.0 10.8 5.5
9.9 10.2 36.8876 1,158 3,001
.. 7.2
9.7 93.1 100.6
1.2 6.7 34.6
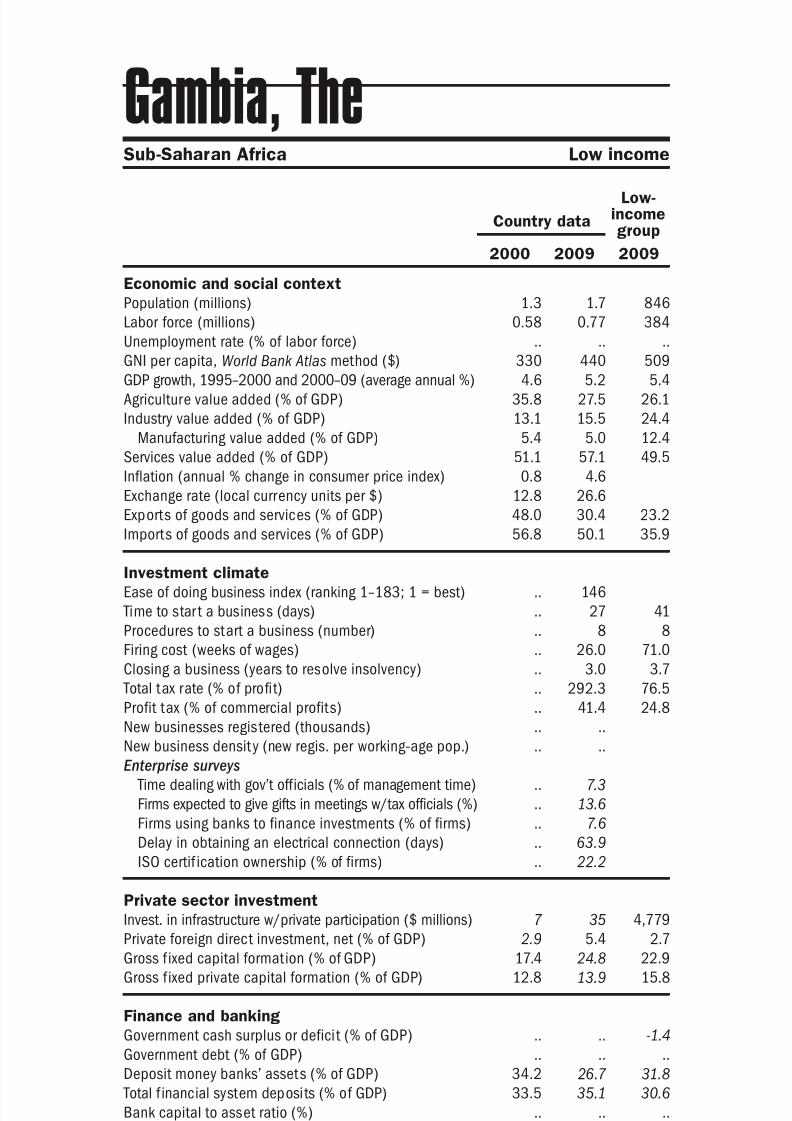
8/6/2019 The Little Data Book on Private Sector Development 2011
http://slidepdf.com/reader/full/the-little-data-book-on-private-sector-development-2011 94/246
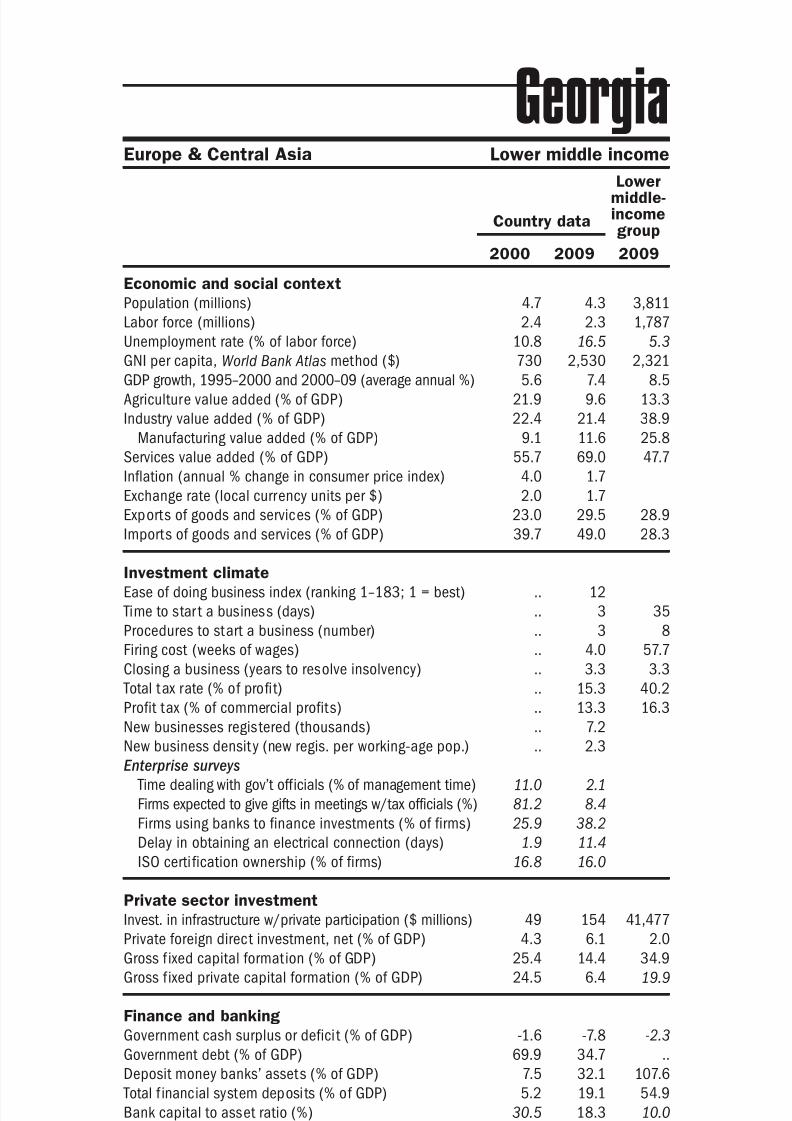
8/6/2019 The Little Data Book on Private Sector Development 2011
http://slidepdf.com/reader/full/the-little-data-book-on-private-sector-development-2011 95/246
Economic and social context
Population (millions)
Labor force (millions)
Unemployment rate (% of labor force)
GNI per capita, World Bank Atlas method ($)GDP growth, 1995–2000 and 2000–09 (average annual %)
Agriculture value added (% of GDP)
Industry value added (% of GDP)
Manufacturing value added (% of GDP)
Services value added (% of GDP)
Inflation (annual % change in consumer price index)
Exchange rate (local currency units per $)
Exports of goods and services (% of GDP)
Imports of goods and services (% of GDP) Investment climate
Ease of doing business index (ranking 1–183; 1 = best)
Time to star t a business (days)
Procedures to start a business (number)
Firing cost (weeks of wages)
Closing a business (years to resolve insolvency)
Total tax rate (% of profit)
Profit tax (% of commercial profits)New businesses registered (thousands)
New business density (new regis. per working-age pop.)
Enterprise surveys
Time dealing with gov’t officials (% of management time)
Firms expected to give gifts in meetings w/tax officials (%)
Firms using banks to finance investments (% of firms)
Delay in obtaining an electrical connection (days)
ISO certi fication ownership (% of firms)
Private sector investment
Invest. in infrastructure w/private participation ($ millions)
Private foreign direct investment, net (% of GDP)
Gross f ixed capital formation (% of GDP)
Gross f ixed private capital formation (% of GDP)
Finance and banking
Government cash surplus or deficit (% of GDP)
Government debt (% of GDP)
Deposit money banks’ assets (% of GDP) Total f inancial system deposits (% of GDP)
Bank capital to asset ratio (%)
Bank nonperforming loans to total gross loans ratio (%)
Domestic credit to the private sector (% of GDP)
Real interest rate (%)
Interest rate spread (percentage points)
Infrastructure
Paved roads (% of total roads)Electr ic power consumption (kWh per capita)
Power outages in a typical month (number)
Mobile cellular subscriptions (per 100 people)
Internet users (per 100 people)
87The Little Data Book on Private Sector Development 2011
Europe & Central Asia Lower middle income
Country data
Lowermiddle-incomegroup
2000 2009 2009
Georgia
4.7 4.3 3,811
2.4 2.3 1,787
10.8 16.5 5.3
730 2,530 2,3215.6 7.4 8.5
21.9 9.6 13.3
22.4 21.4 38.9
9.1 11.6 25.8
55.7 69.0 47.7
4.0 1.7
2.0 1.7
23.0 29.5 28.9
39.7 49.0 28.3
.. 12
.. 3 35
.. 3 8
.. 4.0 57.7
.. 3.3 3.3
.. 15.3 40.2
.. 13.3 16.3.. 7.2
.. 2.3
11.0 2.1
81.2 8.4
25.9 38.2
1.9 11.4
16.8 16.0
49 154 41,477
4.3 6.1 2.0
25.4 14.4 34.9
24.5 6.4 19.9
-1.6 -7.8 -2.3
69.9 34.7 ..
7.5 32.1 107.65.2 19.1 54.9
30.5 18.3 10.0
11.6 6.3 5.1
8.7 31.2 92.9
26.8 28.1
22.6 15.2 7.3
93.4 94.1 36.31,353 1,678 1,318
.. 3.3
4.1 66.6 57.8
0.5 30.5 17.2

8/6/2019 The Little Data Book on Private Sector Development 2011
http://slidepdf.com/reader/full/the-little-data-book-on-private-sector-development-2011 96/246
Economic and social context
Population (millions)
Labor force (millions)
Unemployment rate (% of labor force)
GNI per capita, World Bank Atlas method ($)GDP growth, 1995–2000 and 2000–09 (average annual %)
Agriculture value added (% of GDP)
Industry value added (% of GDP)
Manufacturing value added (% of GDP)
Services value added (% of GDP)
Inflation (annual % change in consumer price index)
Exchange rate (local currency units per $)
Exports of goods and services (% of GDP)
Imports of goods and services (% of GDP) Investment climate
Ease of doing business index (ranking 1–183; 1 = best)
Time to star t a business (days)
Procedures to start a business (number)
Firing cost (weeks of wages)
Closing a business (years to resolve insolvency)
Total tax rate (% of profit)
Profit tax (% of commercial profits)New businesses registered (thousands)
New business density (new regis. per working-age pop.)
Enterprise surveys
Time dealing with gov’t officials (% of management time)
Firms expected to give gifts in meetings w/tax officials (%)
Firms using banks to finance investments (% of firms)
Delay in obtaining an electrical connection (days)
ISO certif ication ownership (% of firms)
Private sector investment
Invest. in infrastructure w/private participation ($ millions)
Private foreign direct investment, net (% of GDP)
Gross f ixed capital formation (% of GDP)
Gross f ixed private capital formation (% of GDP)
Finance and banking
Government cash surplus or deficit (% of GDP)
Government debt (% of GDP)
Deposit money banks’ assets (% of GDP) Total f inancial system deposits (% of GDP)
Bank capital to asset ratio (%)
Bank nonperforming loans to total gross loans ratio (%)
Domestic credit to the private sector (% of GDP)
Real interest rate (%)
Interest rate spread (percentage points)
Infrastructure
Paved roads (% of total roads)Electr ic power consumption (kWh per capita)
Power outages in a typical month (number)
Mobile cellular subscriptions (per 100 people)
Internet users (per 100 people)
88 2011 The Little Data Book on Private Sector Development
Country data
High-incomegroup
2000 2009 2009
High income
Germany
82.2 81.9 1,117
40.4 42.3 547
7.7 7.7 8.1
25,510 42,450 37,9902.0 1.0 2.0
1.3 0.8 1.5
30.3 26.5 25.0
22.9 19.1 15.9
68.5 72.7 73.5
1.5 0.3
1.8 ..
33.4 40.8 23.6
33.0 35.9 23.9
.. 22
.. 15 18
.. 9 6
.. 69.0 37.9
.. 1.2 2.1
.. 48.2 38.6
.. 23.0 14.3.. 64.8
.. 1.2
.. 1.2
.. 14.8
.. 45.0
.. 3.2
.. ..
.. .. ..
11.1 1.2 2.0
21.5 17.6 18.0
.. .. ..
1.4 -2.2 -7.7
37.8 47.2 55.7
145.2 132.2 140.090.8 117.2 108.5
4.2 4.8 6.8
4.7 3.3 3.4
118.6 112.3 165.1
10.4 ..
6.2 .. 3.8
.. 100.0 93.46,636 7,149 9,518
.. ..
58.6 128.2 111.2
30.2 79.5 72.3
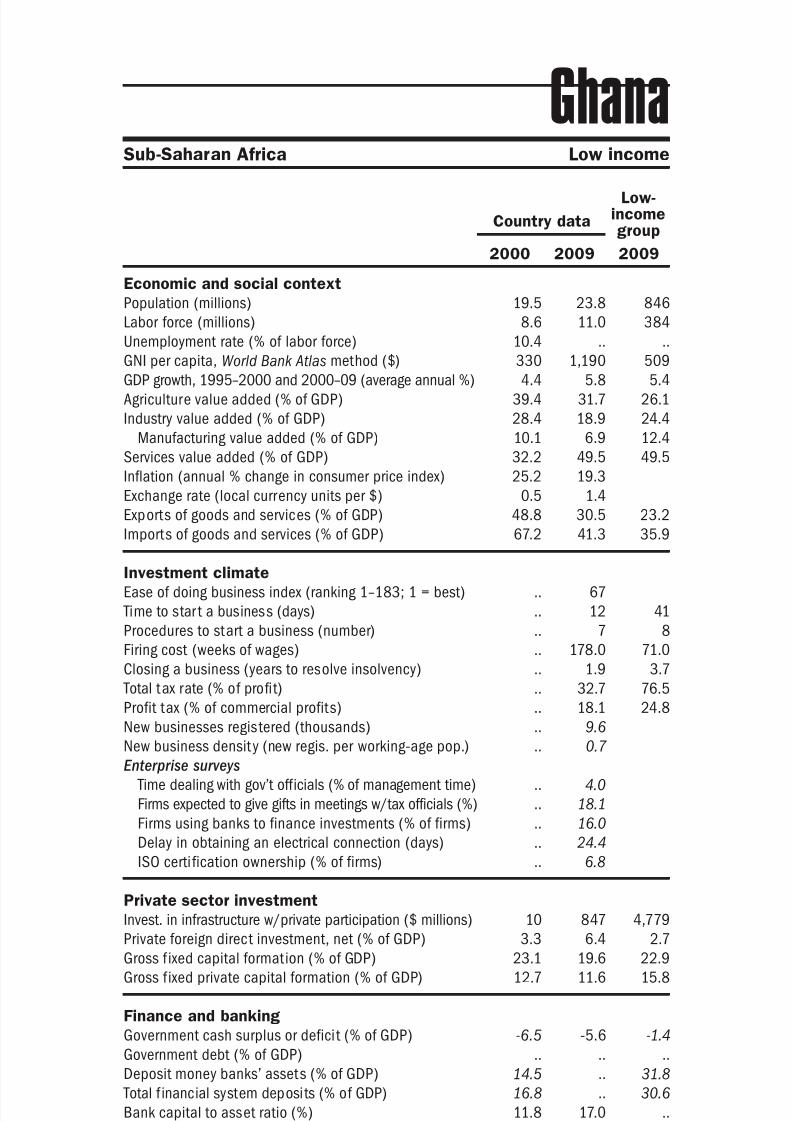
8/6/2019 The Little Data Book on Private Sector Development 2011
http://slidepdf.com/reader/full/the-little-data-book-on-private-sector-development-2011 97/246
Economic and social context
Population (millions)
Labor force (millions)
Unemployment rate (% of labor force)
GNI per capita, World Bank Atlas method ($)GDP growth, 1995–2000 and 2000–09 (average annual %)
Agriculture value added (% of GDP)
Industry value added (% of GDP)
Manufacturing value added (% of GDP)
Services value added (% of GDP)
Inflation (annual % change in consumer price index)
Exchange rate (local currency units per $)
Exports of goods and services (% of GDP)
Imports of goods and services (% of GDP) Investment climate
Ease of doing business index (ranking 1–183; 1 = best)
Time to star t a business (days)
Procedures to start a business (number)
Firing cost (weeks of wages)
Closing a business (years to resolve insolvency)
Total tax rate (% of profit)
Profit tax (% of commercial profits)New businesses registered (thousands)
New business density (new regis. per working-age pop.)
Enterprise surveys
Time dealing with gov’t officials (% of management time)
Firms expected to give gifts in meetings w/tax officials (%)
Firms using banks to finance investments (% of firms)
Delay in obtaining an electrical connection (days)
ISO certi fication ownership (% of firms)
Private sector investment
Invest. in infrastructure w/private participation ($ millions)
Private foreign direct investment, net (% of GDP)
Gross f ixed capital formation (% of GDP)
Gross f ixed private capital formation (% of GDP)
Finance and banking
Government cash surplus or deficit (% of GDP)
Government debt (% of GDP)
Deposit money banks’ assets (% of GDP) Total f inancial system deposits (% of GDP)
Bank capital to asset ratio (%)
Bank nonperforming loans to total gross loans ratio (%)
Domestic credit to the private sector (% of GDP)
Real interest rate (%)
Interest rate spread (percentage points)
Infrastructure
Paved roads (% of total roads)Electr ic power consumption (kWh per capita)
Power outages in a typical month (number)
Mobile cellular subscriptions (per 100 people)
Internet users (per 100 people)
89The Little Data Book on Private Sector Development 2011
Sub-Saharan Africa Low income
Country data
Low-incomegroup
2000 2009 2009
Ghana
19.5 23.8 846
8.6 11.0 384
10.4 .. ..
330 1,190 5094.4 5.8 5.4
39.4 31.7 26.1
28.4 18.9 24.4
10.1 6.9 12.4
32.2 49.5 49.5
25.2 19.3
0.5 1.4
48.8 30.5 23.2
67.2 41.3 35.9
.. 67
.. 12 41
.. 7 8
.. 178.0 71.0
.. 1.9 3.7
.. 32.7 76.5
.. 18.1 24.8.. 9.6
.. 0.7
.. 4.0
.. 18.1
.. 16.0
.. 24.4
.. 6.8
10 847 4,779
3.3 6.4 2.7
23.1 19.6 22.9
12.7 11.6 15.8
-6.5 -5.6 -1.4
.. .. ..
14.5 .. 31.816.8 .. 30.6
11.8 17.0 ..
11.9 16.2 ..
14.0 15.9 26.3
.. ..
.. .. 11.5
29.6 14.9 12.0324 268 231
.. 9.7
0.7 63.4 26.6
0.2 5.4 2.7
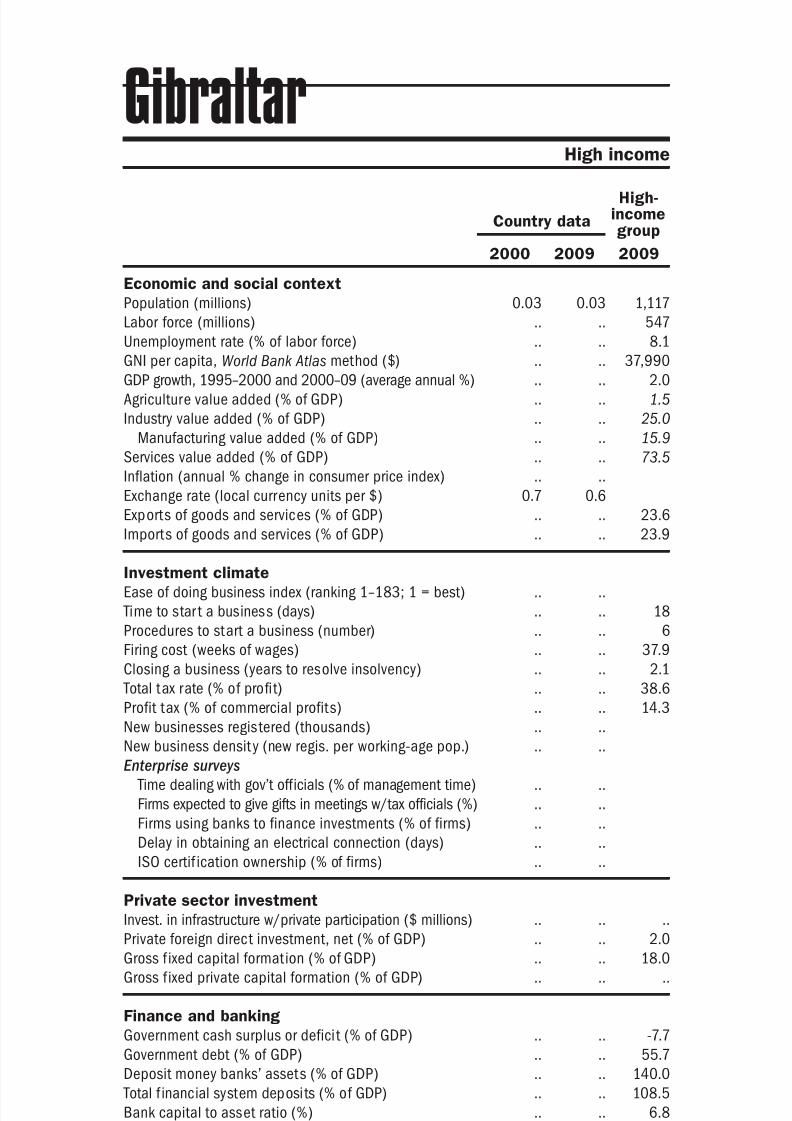
8/6/2019 The Little Data Book on Private Sector Development 2011
http://slidepdf.com/reader/full/the-little-data-book-on-private-sector-development-2011 98/246
Economic and social context
Population (millions)
Labor force (millions)
Unemployment rate (% of labor force)
GNI per capita, World Bank Atlas method ($)GDP growth, 1995–2000 and 2000–09 (average annual %)
Agriculture value added (% of GDP)
Industry value added (% of GDP)
Manufacturing value added (% of GDP)
Services value added (% of GDP)
Inflation (annual % change in consumer price index)
Exchange rate (local currency units per $)
Exports of goods and services (% of GDP)
Imports of goods and services (% of GDP) Investment climate
Ease of doing business index (ranking 1–183; 1 = best)
Time to star t a business (days)
Procedures to start a business (number)
Firing cost (weeks of wages)
Closing a business (years to resolve insolvency)
Total tax rate (% of profit)
Profit tax (% of commercial profits)New businesses registered (thousands)
New business density (new regis. per working-age pop.)
Enterprise surveys
Time dealing with gov’t officials (% of management time)
Firms expected to give gifts in meetings w/tax officials (%)
Firms using banks to finance investments (% of firms)
Delay in obtaining an electrical connection (days)
ISO certif ication ownership (% of firms)
Private sector investment
Invest. in infrastructure w/private participation ($ millions)
Private foreign direct investment, net (% of GDP)
Gross f ixed capital formation (% of GDP)
Gross f ixed private capital formation (% of GDP)
Finance and banking
Government cash surplus or deficit (% of GDP)
Government debt (% of GDP)
Deposit money banks’ assets (% of GDP) Total f inancial system deposits (% of GDP)
Bank capital to asset ratio (%)
Bank nonperforming loans to total gross loans ratio (%)
Domestic credit to the private sector (% of GDP)
Real interest rate (%)
Interest rate spread (percentage points)
Infrastructure
Paved roads (% of total roads)Electr ic power consumption (kWh per capita)
Power outages in a typical month (number)
Mobile cellular subscriptions (per 100 people)
Internet users (per 100 people)
90 2011 The Little Data Book on Private Sector Development
Country data
High-incomegroup
2000 2009 2009
High income
0.03 0.03 1,117
.. .. 547
.. .. 8.1
.. .. 37,990
.. .. 2.0
.. .. 1.5
.. .. 25.0
.. .. 15.9
.. .. 73.5
.. ..
0.7 0.6
.. .. 23.6
.. .. 23.9
.. ..
.. .. 18
.. .. 6
.. .. 37.9
.. .. 2.1
.. .. 38.6
.. .. 14.3.. ..
.. ..
.. ..
.. ..
.. ..
.. ..
.. ..
.. .. ..
.. .. 2.0
.. .. 18.0
.. .. ..
.. .. -7.7
.. .. 55.7
.. .. 140.0
.. .. 108.5
.. .. 6.8
.. .. 3.4
.. .. 165.1
.. ..
.. .. 3.8
.. .. 93.44,325 5,349 9,518
.. ..
19.2 92.1 111.2
19.1 65.1 72.3
Gibraltar

8/6/2019 The Little Data Book on Private Sector Development 2011
http://slidepdf.com/reader/full/the-little-data-book-on-private-sector-development-2011 99/246
Economic and social context
Population (millions)
Labor force (millions)
Unemployment rate (% of labor force)
GNI per capita, World Bank Atlas method ($)GDP growth, 1995–2000 and 2000–09 (average annual %)
Agriculture value added (% of GDP)
Industry value added (% of GDP)
Manufacturing value added (% of GDP)
Services value added (% of GDP)
Inflation (annual % change in consumer price index)
Exchange rate (local currency units per $)
Exports of goods and services (% of GDP)
Imports of goods and services (% of GDP) Investment climate
Ease of doing business index (ranking 1–183; 1 = best)
Time to star t a business (days)
Procedures to start a business (number)
Firing cost (weeks of wages)
Closing a business (years to resolve insolvency)
Total tax rate (% of profit)
Profit tax (% of commercial profits)New businesses registered (thousands)
New business density (new regis. per working-age pop.)
Enterprise surveys
Time dealing with gov’t officials (% of management time)
Firms expected to give gifts in meetings w/tax officials (%)
Firms using banks to finance investments (% of firms)
Delay in obtaining an electrical connection (days)
ISO certi fication ownership (% of firms)
Private sector investment
Invest. in infrastructure w/private participation ($ millions)
Private foreign direct investment, net (% of GDP)
Gross f ixed capital formation (% of GDP)
Gross f ixed private capital formation (% of GDP)
Finance and banking
Government cash surplus or deficit (% of GDP)
Government debt (% of GDP)
Deposit money banks’ assets (% of GDP) Total f inancial system deposits (% of GDP)
Bank capital to asset ratio (%)
Bank nonperforming loans to total gross loans ratio (%)
Domestic credit to the private sector (% of GDP)
Real interest rate (%)
Interest rate spread (percentage points)
Infrastructure
Paved roads (% of total roads)Electr ic power consumption (kWh per capita)
Power outages in a typical month (number)
Mobile cellular subscriptions (per 100 people)
Internet users (per 100 people)
91The Little Data Book on Private Sector Development 2011
High income
Country data
High-incomegroup
2000 2009 2009
Greece
10.9 11.3 1,117
4.9 5.2 547
11.1 9.5 8.1
12,560 29,040 37,9903.5 3.6 2.0
6.6 3.1 1.5
21.0 17.5 25.0
11.1 10.1 15.9
72.5 79.3 73.5
3.2 1.2
365.4 ..
24.9 18.6 23.6
38.4 29.3 23.9
.. 109
.. 19 18
.. 15 6
.. 24.0 37.9
.. 2.0 2.1
.. 47.2 38.6
.. 13.9 14.3.. 8.4
.. 1.2
.. 1.8
.. 55.9
.. 25.9
.. 7.0
.. 11.7
.. .. ..
0.9 0.7 2.0
21.6 16.9 18.0
.. .. ..
-3.7 -15.2 -7.7
123.9 138.5 55.7
78.1 109.0 140.050.5 103.1 108.5
8.9 6.1 6.8
12.3 7.7 3.4
47.0 91.7 165.1
8.6 2.8
6.2 4.3 3.8
91.8 .. 93.44,539 5,723 9,518
.. ..
54.3 117.8 111.2
9.2 44.1 72.3
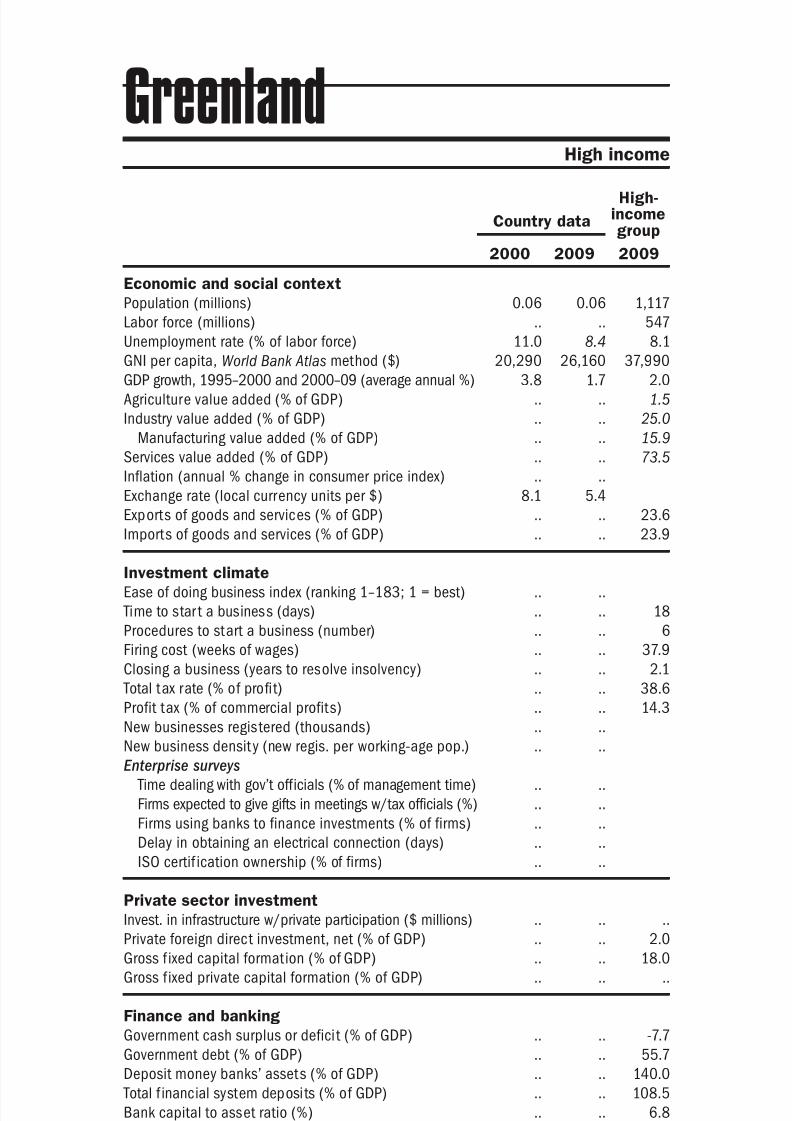
8/6/2019 The Little Data Book on Private Sector Development 2011
http://slidepdf.com/reader/full/the-little-data-book-on-private-sector-development-2011 100/246
Economic and social context
Population (millions)
Labor force (millions)
Unemployment rate (% of labor force)
GNI per capita, World Bank Atlas method ($)GDP growth, 1995–2000 and 2000–09 (average annual %)
Agriculture value added (% of GDP)
Industry value added (% of GDP)
Manufacturing value added (% of GDP)
Services value added (% of GDP)
Inflation (annual % change in consumer price index)
Exchange rate (local currency units per $)
Exports of goods and services (% of GDP)
Imports of goods and services (% of GDP) Investment climate
Ease of doing business index (ranking 1–183; 1 = best)
Time to star t a business (days)
Procedures to start a business (number)
Firing cost (weeks of wages)
Closing a business (years to resolve insolvency)
Total tax rate (% of profit)
Profit tax (% of commercial profits)New businesses registered (thousands)
New business density (new regis. per working-age pop.)
Enterprise surveys
Time dealing with gov’t officials (% of management time)
Firms expected to give gifts in meetings w/tax officials (%)
Firms using banks to finance investments (% of firms)
Delay in obtaining an electrical connection (days)
ISO certif ication ownership (% of firms)
Private sector investment
Invest. in infrastructure w/private participation ($ millions)
Private foreign direct investment, net (% of GDP)
Gross f ixed capital formation (% of GDP)
Gross f ixed private capital formation (% of GDP)
Finance and banking
Government cash surplus or deficit (% of GDP)
Government debt (% of GDP)
Deposit money banks’ assets (% of GDP) Total f inancial system deposits (% of GDP)
Bank capital to asset ratio (%)
Bank nonperforming loans to total gross loans ratio (%)
Domestic credit to the private sector (% of GDP)
Real interest rate (%)
Interest rate spread (percentage points)
Infrastructure
Paved roads (% of total roads)Electr ic power consumption (kWh per capita)
Power outages in a typical month (number)
Mobile cellular subscriptions (per 100 people)
Internet users (per 100 people)
92 2011 The Little Data Book on Private Sector Development
Country data
High-incomegroup
2000 2009 2009
High income
Greenland
0.06 0.06 1,117
.. .. 547
11.0 8.4 8.1
20,290 26,160 37,9903.8 1.7 2.0
.. .. 1.5
.. .. 25.0
.. .. 15.9
.. .. 73.5
.. ..
8.1 5.4
.. .. 23.6
.. .. 23.9
.. ..
.. .. 18
.. .. 6
.. .. 37.9
.. .. 2.1
.. .. 38.6
.. .. 14.3.. ..
.. ..
.. ..
.. ..
.. ..
.. ..
.. ..
.. .. ..
.. .. 2.0
.. .. 18.0
.. .. ..
.. .. -7.7
.. .. 55.7
.. .. 140.0
.. .. 108.5
.. .. 6.8
.. .. 3.4
.. .. 165.1
.. ..
.. .. 3.8
.. .. 93.4
.. .. 9,518
.. ..
26.9 95.4 111.2
31.7 64.2 72.3

8/6/2019 The Little Data Book on Private Sector Development 2011
http://slidepdf.com/reader/full/the-little-data-book-on-private-sector-development-2011 101/246
Economic and social context
Population (millions)
Labor force (millions)
Unemployment rate (% of labor force)
GNI per capita, World Bank Atlas method ($)GDP growth, 1995–2000 and 2000–09 (average annual %)
Agriculture value added (% of GDP)
Industry value added (% of GDP)
Manufacturing value added (% of GDP)
Services value added (% of GDP)
Inflation (annual % change in consumer price index)
Exchange rate (local currency units per $)
Exports of goods and services (% of GDP)
Imports of goods and services (% of GDP) Investment climate
Ease of doing business index (ranking 1–183; 1 = best)
Time to star t a business (days)
Procedures to start a business (number)
Firing cost (weeks of wages)
Closing a business (years to resolve insolvency)
Total tax rate (% of profit)
Profit tax (% of commercial profits)New businesses registered (thousands)
New business density (new regis. per working-age pop.)
Enterprise surveys
Time dealing with gov’t officials (% of management time)
Firms expected to give gifts in meetings w/tax officials (%)
Firms using banks to finance investments (% of firms)
Delay in obtaining an electrical connection (days)
ISO certi fication ownership (% of firms)
Private sector investment
Invest. in infrastructure w/private participation ($ millions)
Private foreign direct investment, net (% of GDP)
Gross f ixed capital formation (% of GDP)
Gross f ixed private capital formation (% of GDP)
Finance and banking
Government cash surplus or deficit (% of GDP)
Government debt (% of GDP)
Deposit money banks’ assets (% of GDP) Total f inancial system deposits (% of GDP)
Bank capital to asset ratio (%)
Bank nonperforming loans to total gross loans ratio (%)
Domestic credit to the private sector (% of GDP)
Real interest rate (%)
Interest rate spread (percentage points)
Infrastructure
Paved roads (% of total roads)Electr ic power consumption (kWh per capita)
Power outages in a typical month (number)
Mobile cellular subscriptions (per 100 people)
Internet users (per 100 people)
93The Little Data Book on Private Sector Development 2011
Country data
Uppermiddle-incomegroup
2000 2009 2009
Latin America & Caribbean Upper middle income
Grenada
0.10 0.10 1,002
.. .. 458
10.2 .. 9.1
3,870 5,580 7,5027.4 1.8 4.4
7.3 6.5 6.2
22.2 18.4 31.5
6.5 4.1 16.7
70.5 75.1 62.4
3.5 -2.4
2.7 2.7
54.9 26.8 25.4
72.2 56.6 24.2
.. 92
.. 15 43
.. 6 8
.. 29.0 40.1
.. .. 2.9
.. 45.3 43.0
.. 27.6 18.0.. ..
.. ..
.. ..
.. ..
.. ..
.. ..
.. ..
7 16 64,899
8.7 14.5 2.4
41.8 23.2 20.7
35.0 18.8 15.6
.. .. -0.6
.. .. ..
88.1 112.0 60.689.5 114.5 47.4
.. .. 9.7
.. .. 4.2
75.7 97.7 47.8
11.1 12.0
7.4 7.7 5.5
61.0 .. 36.8.. .. 3,001
.. ..
4.2 61.6 100.6
4.1 24.1 34.6
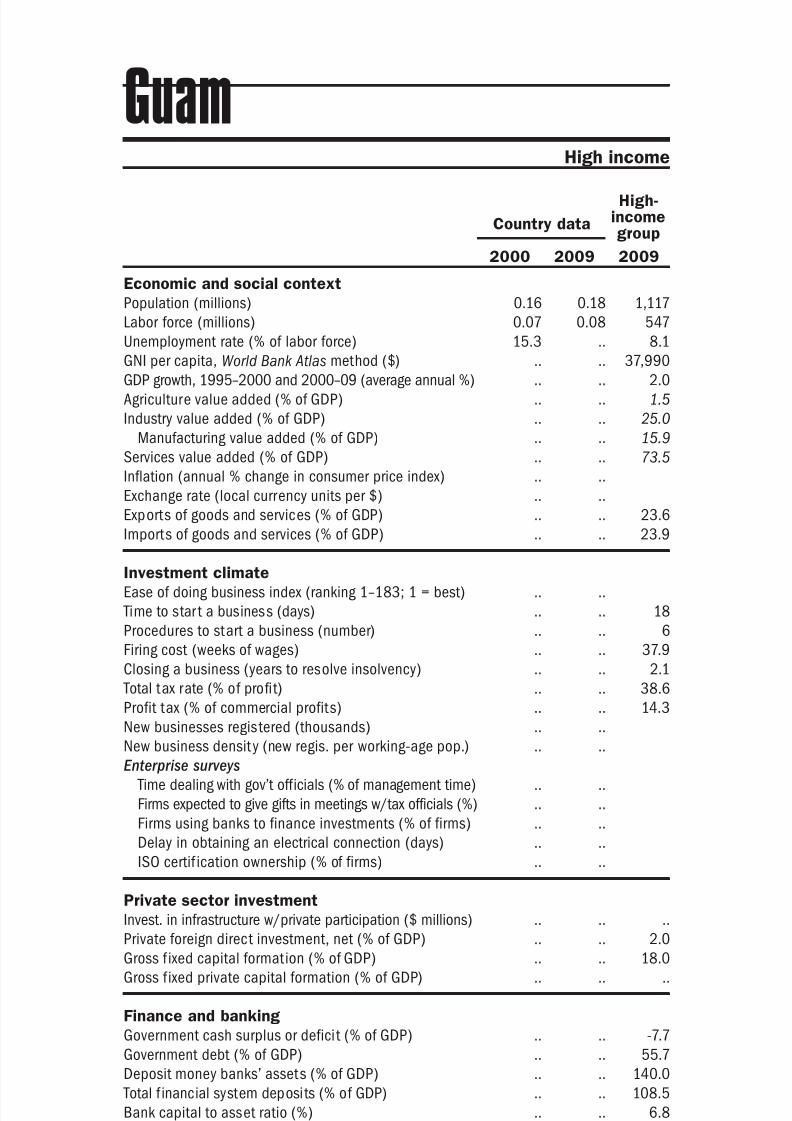
8/6/2019 The Little Data Book on Private Sector Development 2011
http://slidepdf.com/reader/full/the-little-data-book-on-private-sector-development-2011 102/246
Economic and social context
Population (millions)
Labor force (millions)
Unemployment rate (% of labor force)
GNI per capita, World Bank Atlas method ($)GDP growth, 1995–2000 and 2000–09 (average annual %)
Agriculture value added (% of GDP)
Industry value added (% of GDP)
Manufacturing value added (% of GDP)
Services value added (% of GDP)
Inflation (annual % change in consumer price index)
Exchange rate (local currency units per $)
Exports of goods and services (% of GDP)
Imports of goods and services (% of GDP) Investment climate
Ease of doing business index (ranking 1–183; 1 = best)
Time to star t a business (days)
Procedures to start a business (number)
Firing cost (weeks of wages)
Closing a business (years to resolve insolvency)
Total tax rate (% of profit)
Profit tax (% of commercial profits)New businesses registered (thousands)
New business density (new regis. per working-age pop.)
Enterprise surveys
Time dealing with gov’t officials (% of management time)
Firms expected to give gifts in meetings w/tax officials (%)
Firms using banks to finance investments (% of firms)
Delay in obtaining an electrical connection (days)
ISO certif ication ownership (% of firms)
Private sector investment
Invest. in infrastructure w/private participation ($ millions)
Private foreign direct investment, net (% of GDP)
Gross f ixed capital formation (% of GDP)
Gross f ixed private capital formation (% of GDP)
Finance and banking
Government cash surplus or deficit (% of GDP)
Government debt (% of GDP)
Deposit money banks’ assets (% of GDP) Total f inancial system deposits (% of GDP)
Bank capital to asset ratio (%)
Bank nonperforming loans to total gross loans ratio (%)
Domestic credit to the private sector (% of GDP)
Real interest rate (%)
Interest rate spread (percentage points)
Infrastructure
Paved roads (% of total roads)Electr ic power consumption (kWh per capita)
Power outages in a typical month (number)
Mobile cellular subscriptions (per 100 people)
Internet users (per 100 people)
94 2011 The Little Data Book on Private Sector Development
High income
Country data
High-incomegroup
2000 2009 2009
Guam
0.16 0.18 1,117
0.07 0.08 547
15.3 .. 8.1
.. .. 37,990
.. .. 2.0
.. .. 1.5
.. .. 25.0
.. .. 15.9
.. .. 73.5
.. ..
.. ..
.. .. 23.6
.. .. 23.9
.. ..
.. .. 18
.. .. 6
.. .. 37.9
.. .. 2.1
.. .. 38.6
.. .. 14.3.. ..
.. ..
.. ..
.. ..
.. ..
.. ..
.. ..
.. .. ..
.. .. 2.0
.. .. 18.0
.. .. ..
.. .. -7.7
.. .. 55.7
.. .. 140.0
.. .. 108.5
.. .. 6.8
.. .. 3.4
.. .. 165.1
.. ..
.. .. 3.8
.. .. 93.4
.. .. 9,518
.. ..
17.5 59.1 111.2
16.1 50.6 72.3

8/6/2019 The Little Data Book on Private Sector Development 2011
http://slidepdf.com/reader/full/the-little-data-book-on-private-sector-development-2011 103/246
Economic and social context
Population (millions)
Labor force (millions)
Unemployment rate (% of labor force)
GNI per capita, World Bank Atlas method ($)GDP growth, 1995–2000 and 2000–09 (average annual %)
Agriculture value added (% of GDP)
Industry value added (% of GDP)
Manufacturing value added (% of GDP)
Services value added (% of GDP)
Inflation (annual % change in consumer price index)
Exchange rate (local currency units per $)
Exports of goods and services (% of GDP)
Imports of goods and services (% of GDP) Investment climate
Ease of doing business index (ranking 1–183; 1 = best)
Time to star t a business (days)
Procedures to start a business (number)
Firing cost (weeks of wages)
Closing a business (years to resolve insolvency)
Total tax rate (% of profit)
Profit tax (% of commercial profits)New businesses registered (thousands)
New business density (new regis. per working-age pop.)
Enterprise surveys
Time dealing with gov’t officials (% of management time)
Firms expected to give gifts in meetings w/tax officials (%)
Firms using banks to finance investments (% of firms)
Delay in obtaining an electrical connection (days)
ISO certi fication ownership (% of firms)
Private sector investment
Invest. in infrastructure w/private participation ($ millions)
Private foreign direct investment, net (% of GDP)
Gross f ixed capital formation (% of GDP)
Gross f ixed private capital formation (% of GDP)
Finance and banking
Government cash surplus or deficit (% of GDP)
Government debt (% of GDP)
Deposit money banks’ assets (% of GDP) Total f inancial system deposits (% of GDP)
Bank capital to asset ratio (%)
Bank nonperforming loans to total gross loans ratio (%)
Domestic credit to the private sector (% of GDP)
Real interest rate (%)
Interest rate spread (percentage points)
Infrastructure
Paved roads (% of total roads)Electr ic power consumption (kWh per capita)
Power outages in a typical month (number)
Mobile cellular subscriptions (per 100 people)
Internet users (per 100 people)
95The Little Data Book on Private Sector Development 2011
Country data
Lowermiddle-incomegroup
2000 2009 2009
Latin America & Caribbean Lower middle income
Guatemala
11.2 14.0 3,811
4.0 5.5 1,787
1.4 1.8 5.3
1,730 2,650 2,3214.1 3.7 8.5
15.1 12.4 13.3
29.1 28.5 38.9
21.3 19.8 25.8
55.8 59.2 47.7
6.0 1.9
7.8 8.2
20.2 23.4 28.9
29.0 33.1 28.3
.. 101
.. 37 35
.. 12 8
.. 101.0 57.7
.. 3.0 3.3
.. 40.9 40.2
.. 25.9 16.3.. 5.1
.. 0.7
.. 9.2
.. 3.8
.. 12.8
.. 35.3
.. 8.0
147 206 41,477
1.2 1.6 2.0
16.1 15.1 34.9
13.7 12.0 19.9
-1.8 -3.2 -2.3
17.0 23.3 ..
22.1 36.0 107.618.2 39.0 54.9
8.9 10.5 10.0
7.9 2.7 5.1
19.8 25.4 92.9
13.2 11.2
10.7 8.3 7.3
34.5 .. 36.3343 543 1,318
.. 3.0
7.6 123.4 57.8
0.7 16.3 17.2
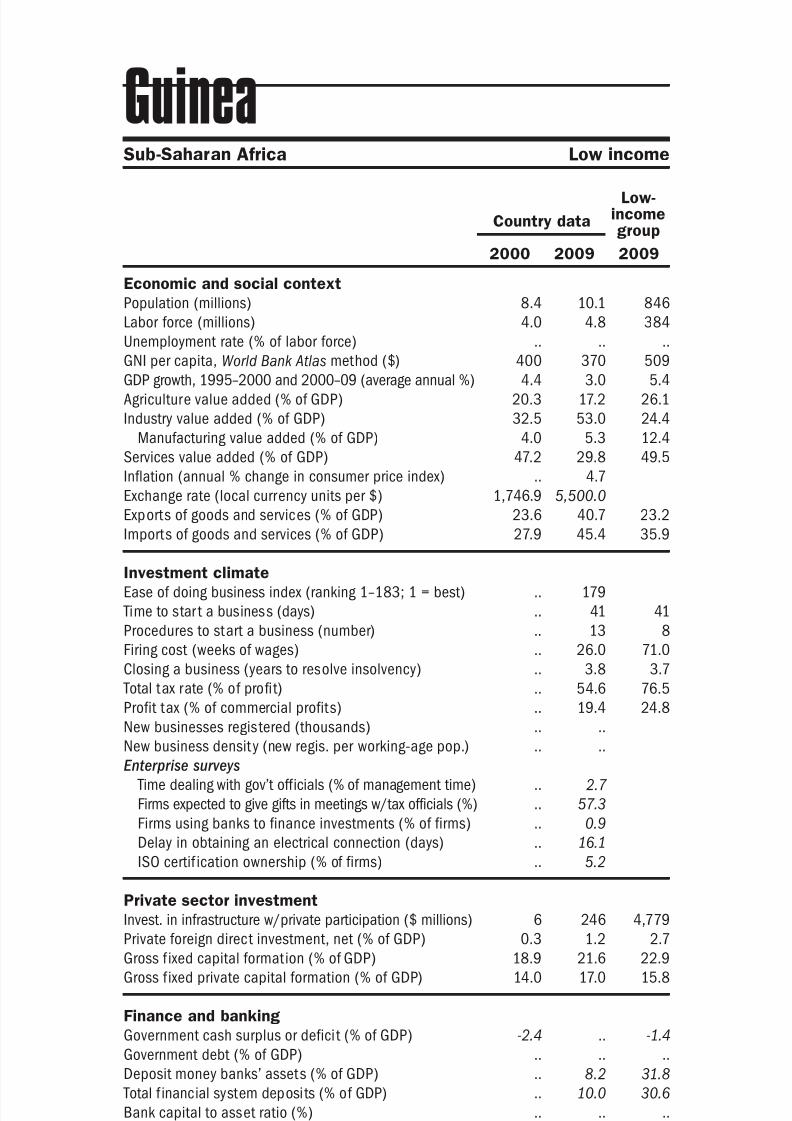
8/6/2019 The Little Data Book on Private Sector Development 2011
http://slidepdf.com/reader/full/the-little-data-book-on-private-sector-development-2011 104/246
Economic and social context
Population (millions)
Labor force (millions)
Unemployment rate (% of labor force)
GNI per capita, World Bank Atlas method ($)GDP growth, 1995–2000 and 2000–09 (average annual %)
Agriculture value added (% of GDP)
Industry value added (% of GDP)
Manufacturing value added (% of GDP)
Services value added (% of GDP)
Inflation (annual % change in consumer price index)
Exchange rate (local currency units per $)
Exports of goods and services (% of GDP)
Imports of goods and services (% of GDP) Investment climate
Ease of doing business index (ranking 1–183; 1 = best)
Time to star t a business (days)
Procedures to start a business (number)
Firing cost (weeks of wages)
Closing a business (years to resolve insolvency)
Total tax rate (% of profit)
Profit tax (% of commercial profits)New businesses registered (thousands)
New business density (new regis. per working-age pop.)
Enterprise surveys
Time dealing with gov’t officials (% of management time)
Firms expected to give gifts in meetings w/tax officials (%)
Firms using banks to finance investments (% of firms)
Delay in obtaining an electrical connection (days)
ISO certif ication ownership (% of firms)
Private sector investment
Invest. in infrastructure w/private participation ($ millions)
Private foreign direct investment, net (% of GDP)
Gross f ixed capital formation (% of GDP)
Gross f ixed private capital formation (% of GDP)
Finance and banking
Government cash surplus or deficit (% of GDP)
Government debt (% of GDP)
Deposit money banks’ assets (% of GDP) Total f inancial system deposits (% of GDP)
Bank capital to asset ratio (%)
Bank nonperforming loans to total gross loans ratio (%)
Domestic credit to the private sector (% of GDP)
Real interest rate (%)
Interest rate spread (percentage points)
Infrastructure
Paved roads (% of total roads)Electr ic power consumption (kWh per capita)
Power outages in a typical month (number)
Mobile cellular subscriptions (per 100 people)
Internet users (per 100 people)
96 2011 The Little Data Book on Private Sector Development
Sub-Saharan Africa Low income
Country data
Low-incomegroup
2000 2009 2009
Guinea
8.4 10.1 846
4.0 4.8 384
.. .. ..
400 370 5094.4 3.0 5.4
20.3 17.2 26.1
32.5 53.0 24.4
4.0 5.3 12.4
47.2 29.8 49.5
.. 4.7
1,746.9 5,500.0
23.6 40.7 23.2
27.9 45.4 35.9
.. 179
.. 41 41
.. 13 8
.. 26.0 71.0
.. 3.8 3.7
.. 54.6 76.5
.. 19.4 24.8.. ..
.. ..
.. 2.7
.. 57.3
.. 0.9
.. 16.1
.. 5.2
6 246 4,779
0.3 1.2 2.7
18.9 21.6 22.9
14.0 17.0 15.8
-2.4 .. -1.4
.. .. ..
.. 8.2 31.8
.. 10.0 30.6
.. .. ..
.. .. ..
3.8 5.7 26.3
7.4 ..
11.9 .. 11.5
16.5 9.8 12.0.. .. 231
.. 33.9
0.5 55.7 26.6
0.1 0.9 2.7

8/6/2019 The Little Data Book on Private Sector Development 2011
http://slidepdf.com/reader/full/the-little-data-book-on-private-sector-development-2011 105/246
Economic and social context
Population (millions)
Labor force (millions)
Unemployment rate (% of labor force)
GNI per capita, World Bank Atlas method ($)GDP growth, 1995–2000 and 2000–09 (average annual %)
Agriculture value added (% of GDP)
Industry value added (% of GDP)
Manufacturing value added (% of GDP)
Services value added (% of GDP)
Inflation (annual % change in consumer price index)
Exchange rate (local currency units per $)
Exports of goods and services (% of GDP)
Imports of goods and services (% of GDP) Investment climate
Ease of doing business index (ranking 1–183; 1 = best)
Time to star t a business (days)
Procedures to start a business (number)
Firing cost (weeks of wages)
Closing a business (years to resolve insolvency)
Total tax rate (% of profit)
Profit tax (% of commercial profits)New businesses registered (thousands)
New business density (new regis. per working-age pop.)
Enterprise surveys
Time dealing with gov’t officials (% of management time)
Firms expected to give gifts in meetings w/tax officials (%)
Firms using banks to finance investments (% of firms)
Delay in obtaining an electrical connection (days)
ISO certi fication ownership (% of firms)
Private sector investment
Invest. in infrastructure w/private participation ($ millions)
Private foreign direct investment, net (% of GDP)
Gross f ixed capital formation (% of GDP)
Gross f ixed private capital formation (% of GDP)
Finance and banking
Government cash surplus or deficit (% of GDP)
Government debt (% of GDP)
Deposit money banks’ assets (% of GDP) Total f inancial system deposits (% of GDP)
Bank capital to asset ratio (%)
Bank nonperforming loans to total gross loans ratio (%)
Domestic credit to the private sector (% of GDP)
Real interest rate (%)
Interest rate spread (percentage points)
Infrastructure
Paved roads (% of total roads)Electr ic power consumption (kWh per capita)
Power outages in a typical month (number)
Mobile cellular subscriptions (per 100 people)
Internet users (per 100 people)
97The Little Data Book on Private Sector Development 2011
Country data
Low-incomegroup
2000 2009 2009
Sub-Saharan Africa Low income
Guinea-Bissau
1.3 1.6 846
0.54 0.66 384
.. .. ..
170 510 509-2.7 1.0 5.4
56.4 .. 26.1
13.0 .. 24.4
10.5 .. 12.4
30.6 .. 49.5
8.6 -1.7
712.0 472.2
31.8 .. 23.2
51.6 .. 35.9
.. 176
.. 216 41
.. 17 8
.. 87.0 71.0
.. .. 3.7
.. 45.9 76.5
.. 14.9 24.8.. ..
.. ..
.. 2.9
.. 22.7
.. 0.7
.. 20.5
.. 8.4
3 28 4,779
0.3 1.7 2.7
11.3 .. 22.9
1.3 .. 15.8
.. .. -1.4
.. .. ..
7.9 7.1 31.813.7 9.4 30.6
.. .. ..
.. .. ..
7.9 5.6 26.3
.. ..
.. .. 11.5
27.9 .. 12.0.. .. 231
.. 9.2
0.0 34.8 26.6
0.2 2.3 2.7
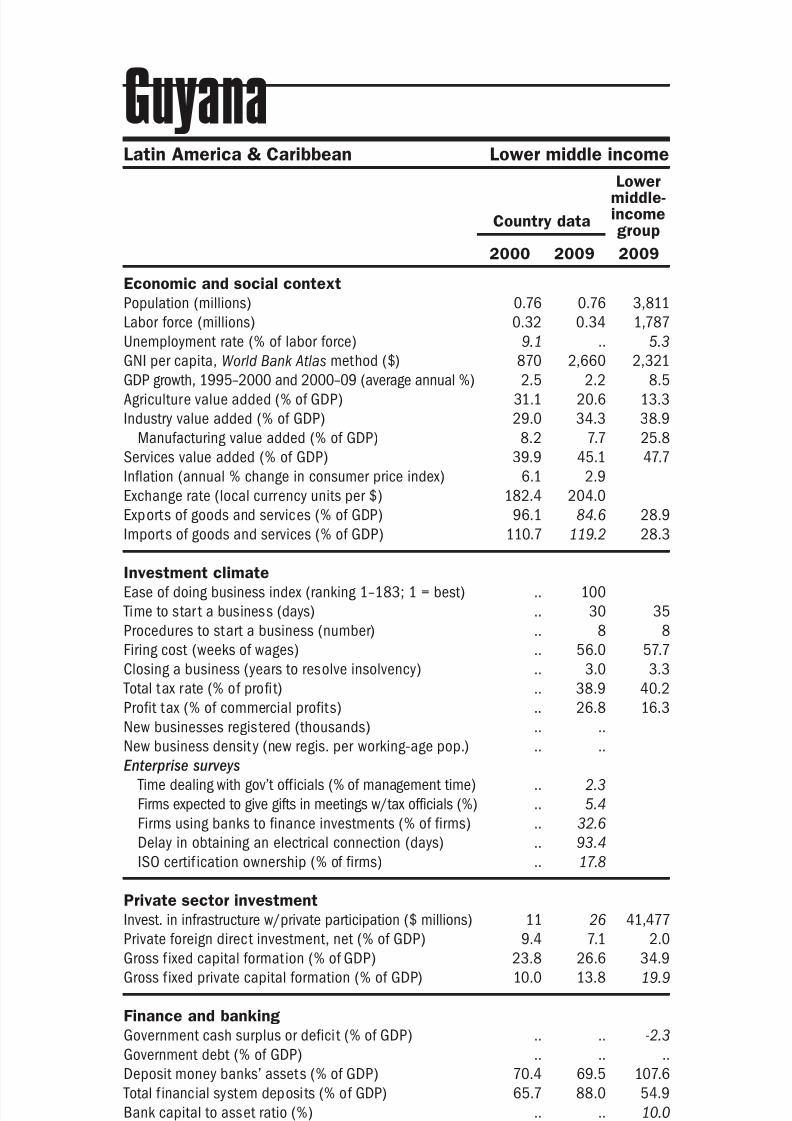
8/6/2019 The Little Data Book on Private Sector Development 2011
http://slidepdf.com/reader/full/the-little-data-book-on-private-sector-development-2011 106/246
Economic and social context
Population (millions)
Labor force (millions)
Unemployment rate (% of labor force)
GNI per capita, World Bank Atlas method ($)GDP growth, 1995–2000 and 2000–09 (average annual %)
Agriculture value added (% of GDP)
Industry value added (% of GDP)
Manufacturing value added (% of GDP)
Services value added (% of GDP)
Inflation (annual % change in consumer price index)
Exchange rate (local currency units per $)
Exports of goods and services (% of GDP)
Imports of goods and services (% of GDP) Investment climate
Ease of doing business index (ranking 1–183; 1 = best)
Time to star t a business (days)
Procedures to start a business (number)
Firing cost (weeks of wages)
Closing a business (years to resolve insolvency)
Total tax rate (% of profit)
Profit tax (% of commercial profits)New businesses registered (thousands)
New business density (new regis. per working-age pop.)
Enterprise surveys
Time dealing with gov’t officials (% of management time)
Firms expected to give gifts in meetings w/tax officials (%)
Firms using banks to finance investments (% of firms)
Delay in obtaining an electrical connection (days)
ISO certif ication ownership (% of firms)
Private sector investment
Invest. in infrastructure w/private participation ($ millions)
Private foreign direct investment, net (% of GDP)
Gross f ixed capital formation (% of GDP)
Gross f ixed private capital formation (% of GDP)
Finance and banking
Government cash surplus or deficit (% of GDP)
Government debt (% of GDP)
Deposit money banks’ assets (% of GDP) Total f inancial system deposits (% of GDP)
Bank capital to asset ratio (%)
Bank nonperforming loans to total gross loans ratio (%)
Domestic credit to the private sector (% of GDP)
Real interest rate (%)
Interest rate spread (percentage points)
Infrastructure
Paved roads (% of total roads)Electr ic power consumption (kWh per capita)
Power outages in a typical month (number)
Mobile cellular subscriptions (per 100 people)
Internet users (per 100 people)
98 2011 The Little Data Book on Private Sector Development
Latin America & Caribbean Lower middle income
Country data
Lowermiddle-incomegroup
2000 2009 2009
Guyana
0.76 0.76 3,811
0.32 0.34 1,787
9.1 .. 5.3
870 2,660 2,3212.5 2.2 8.5
31.1 20.6 13.3
29.0 34.3 38.9
8.2 7.7 25.8
39.9 45.1 47.7
6.1 2.9
182.4 204.0
96.1 84.6 28.9
110.7 119.2 28.3
.. 100
.. 30 35
.. 8 8
.. 56.0 57.7
.. 3.0 3.3
.. 38.9 40.2
.. 26.8 16.3.. ..
.. ..
.. 2.3
.. 5.4
.. 32.6
.. 93.4
.. 17.8
11 26 41,477
9.4 7.1 2.0
23.8 26.6 34.9
10.0 13.8 19.9
.. .. -2.3
.. .. ..
70.4 69.5 107.665.7 88.0 54.9
.. .. 10.0
.. .. 5.1
57.1 36.5 92.9
10.0 13.1
8.6 12.2 7.3
7.4 .. 36.3.. .. 1,318
.. ..
5.3 36.8 57.8
6.6 28.9 17.2
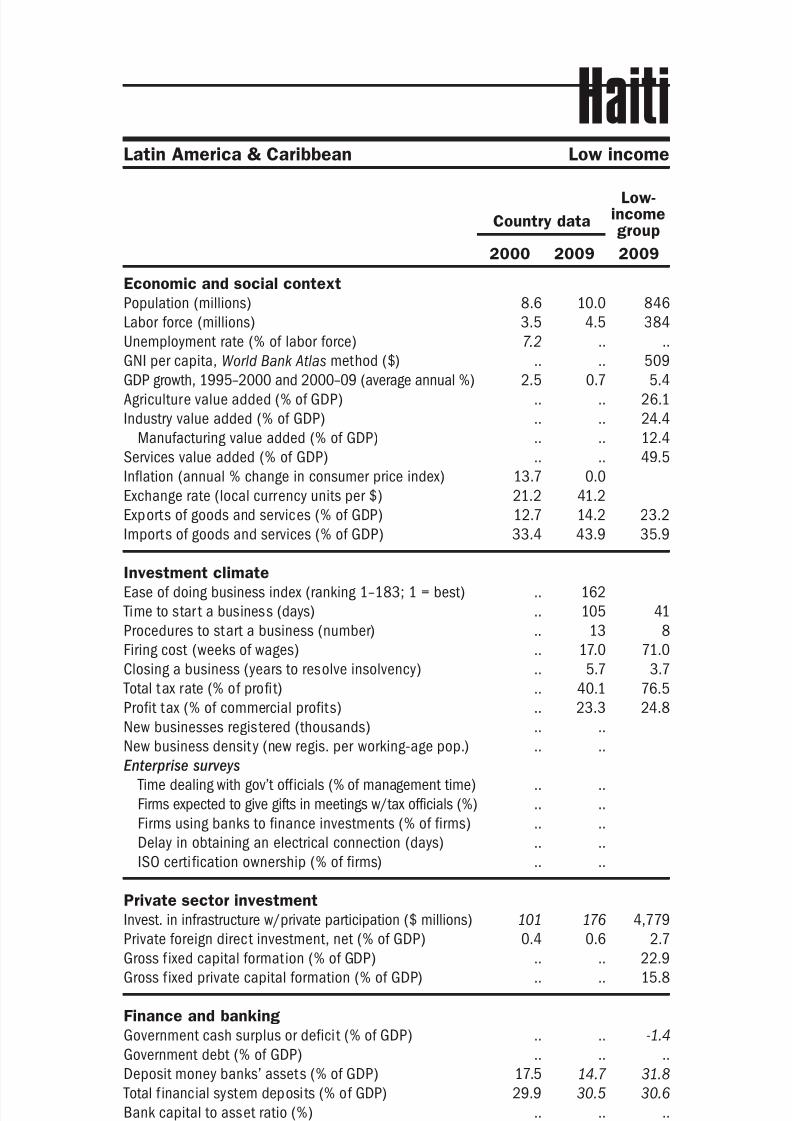
8/6/2019 The Little Data Book on Private Sector Development 2011
http://slidepdf.com/reader/full/the-little-data-book-on-private-sector-development-2011 107/246
Economic and social context
Population (millions)
Labor force (millions)
Unemployment rate (% of labor force)
GNI per capita, World Bank Atlas method ($)GDP growth, 1995–2000 and 2000–09 (average annual %)
Agriculture value added (% of GDP)
Industry value added (% of GDP)
Manufacturing value added (% of GDP)
Services value added (% of GDP)
Inflation (annual % change in consumer price index)
Exchange rate (local currency units per $)
Exports of goods and services (% of GDP)
Imports of goods and services (% of GDP) Investment climate
Ease of doing business index (ranking 1–183; 1 = best)
Time to star t a business (days)
Procedures to start a business (number)
Firing cost (weeks of wages)
Closing a business (years to resolve insolvency)
Total tax rate (% of profit)
Profit tax (% of commercial profits)New businesses registered (thousands)
New business density (new regis. per working-age pop.)
Enterprise surveys
Time dealing with gov’t officials (% of management time)
Firms expected to give gifts in meetings w/tax officials (%)
Firms using banks to finance investments (% of firms)
Delay in obtaining an electrical connection (days)
ISO certi fication ownership (% of firms)
Private sector investment
Invest. in infrastructure w/private participation ($ millions)
Private foreign direct investment, net (% of GDP)
Gross f ixed capital formation (% of GDP)
Gross f ixed private capital formation (% of GDP)
Finance and banking
Government cash surplus or deficit (% of GDP)
Government debt (% of GDP)
Deposit money banks’ assets (% of GDP) Total f inancial system deposits (% of GDP)
Bank capital to asset ratio (%)
Bank nonperforming loans to total gross loans ratio (%)
Domestic credit to the private sector (% of GDP)
Real interest rate (%)
Interest rate spread (percentage points)
Infrastructure
Paved roads (% of total roads)Electr ic power consumption (kWh per capita)
Power outages in a typical month (number)
Mobile cellular subscriptions (per 100 people)
Internet users (per 100 people)
99The Little Data Book on Private Sector Development 2011
Latin America & Caribbean Low income
Country data
Low-incomegroup
2000 2009 2009
Haiti
8.6 10.0 846
3.5 4.5 384
7.2 .. ..
.. .. 5092.5 0.7 5.4
.. .. 26.1
.. .. 24.4
.. .. 12.4
.. .. 49.5
13.7 0.0
21.2 41.2
12.7 14.2 23.2
33.4 43.9 35.9
.. 162
.. 105 41
.. 13 8
.. 17.0 71.0
.. 5.7 3.7
.. 40.1 76.5
.. 23.3 24.8.. ..
.. ..
.. ..
.. ..
.. ..
.. ..
.. ..
101 176 4,779
0.4 0.6 2.7
.. .. 22.9
.. .. 15.8
.. .. -1.4
.. .. ..
17.5 14.7 31.829.9 30.5 30.6
.. .. ..
.. .. ..
15.5 14.5 26.3
7.3 13.3
7.0 16.2 11.5
24.3 .. 12.035 23 231
.. ..
0.6 36.4 26.6
0.2 10.0 2.7

8/6/2019 The Little Data Book on Private Sector Development 2011
http://slidepdf.com/reader/full/the-little-data-book-on-private-sector-development-2011 108/246
Economic and social context
Population (millions)
Labor force (millions)
Unemployment rate (% of labor force)
GNI per capita, World Bank Atlas method ($)GDP growth, 1995–2000 and 2000–09 (average annual %)
Agriculture value added (% of GDP)
Industry value added (% of GDP)
Manufacturing value added (% of GDP)
Services value added (% of GDP)
Inflation (annual % change in consumer price index)
Exchange rate (local currency units per $)
Exports of goods and services (% of GDP)
Imports of goods and services (% of GDP) Investment climate
Ease of doing business index (ranking 1–183; 1 = best)
Time to star t a business (days)
Procedures to start a business (number)
Firing cost (weeks of wages)
Closing a business (years to resolve insolvency)
Total tax rate (% of profit)
Profit tax (% of commercial profits)New businesses registered (thousands)
New business density (new regis. per working-age pop.)
Enterprise surveys
Time dealing with gov’t officials (% of management time)
Firms expected to give gifts in meetings w/tax officials (%)
Firms using banks to finance investments (% of firms)
Delay in obtaining an electrical connection (days)
ISO certif ication ownership (% of firms)
Private sector investment
Invest. in infrastructure w/private participation ($ millions)
Private foreign direct investment, net (% of GDP)
Gross f ixed capital formation (% of GDP)
Gross f ixed private capital formation (% of GDP)
Finance and banking
Government cash surplus or deficit (% of GDP)
Government debt (% of GDP)
Deposit money banks’ assets (% of GDP) Total f inancial system deposits (% of GDP)
Bank capital to asset ratio (%)
Bank nonperforming loans to total gross loans ratio (%)
Domestic credit to the private sector (% of GDP)
Real interest rate (%)
Interest rate spread (percentage points)
Infrastructure
Paved roads (% of total roads)Electr ic power consumption (kWh per capita)
Power outages in a typical month (number)
Mobile cellular subscriptions (per 100 people)
Internet users (per 100 people)
100 2011 The Little Data Book on Private Sector Development
Latin America & Caribbean Lower middle income
Country data
Lowermiddle-incomegroup
2000 2009 2009
Honduras
6.2 7.5 3,811
2.4 2.8 1,787
4.1 2.9 5.3
930 1,800 2,3212.8 4.9 8.5
15.9 12.5 13.3
32.5 27.1 38.9
22.7 18.6 25.8
51.7 60.4 47.7
11.0 5.5
14.8 18.9
54.0 42.1 28.9
66.4 60.8 28.3
.. 131
.. 14 35
.. 13 8
.. 95.0 57.7
.. 3.8 3.3
.. 48.3 40.2
.. 26.7 16.3.. ..
.. ..
.. 4.6
.. 6.1
.. 8.5
.. 27.6
.. 16.5
127 277 41,477
5.4 3.5 2.0
25.8 22.6 34.9
20.3 19.1 19.9
.. -4.5 -2.3
.. .. ..
34.7 51.9 107.635.2 46.5 54.9
8.8 .. 10.0
10.6 .. 5.1
34.1 52.6 92.9
-3.1 14.4
10.9 8.6 7.3
20.4 .. 36.3515 708 1,318
.. 2.9
2.5 103.3 57.8
1.2 9.8 17.2
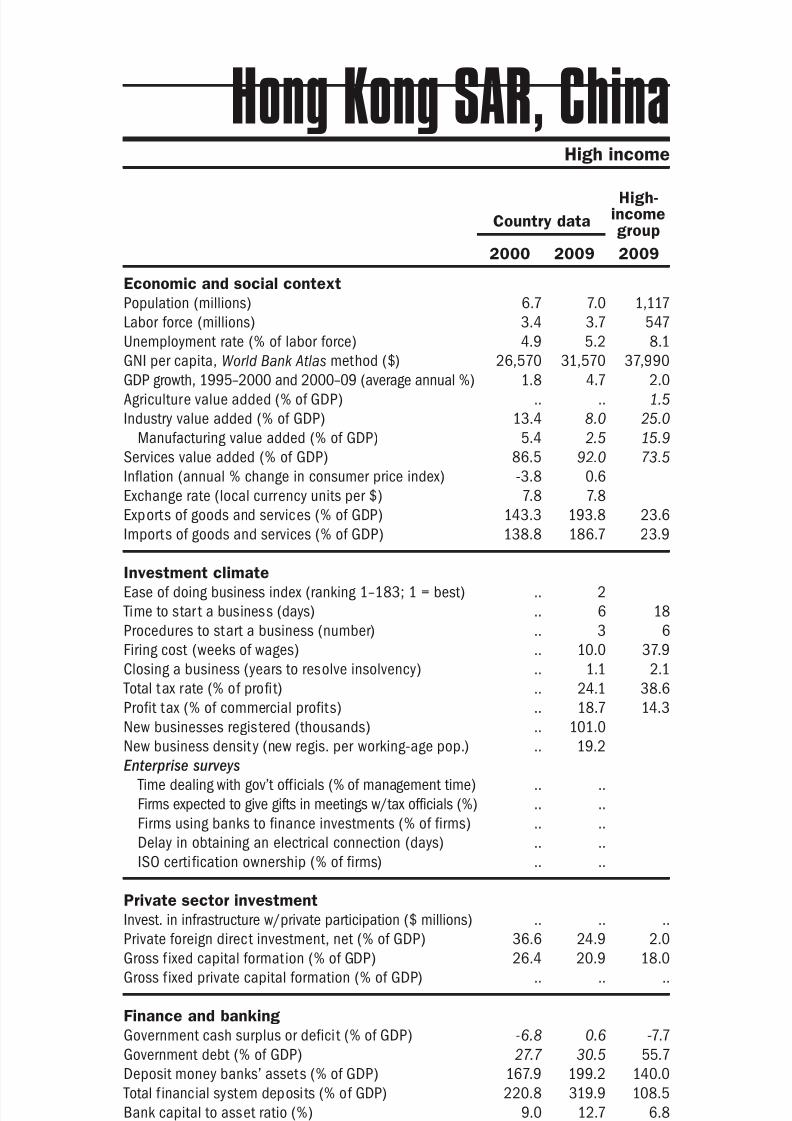
8/6/2019 The Little Data Book on Private Sector Development 2011
http://slidepdf.com/reader/full/the-little-data-book-on-private-sector-development-2011 109/246
Economic and social context
Population (millions)
Labor force (millions)
Unemployment rate (% of labor force)
GNI per capita, World Bank Atlas method ($)GDP growth, 1995–2000 and 2000–09 (average annual %)
Agriculture value added (% of GDP)
Industry value added (% of GDP)
Manufacturing value added (% of GDP)
Services value added (% of GDP)
Inflation (annual % change in consumer price index)
Exchange rate (local currency units per $)
Exports of goods and services (% of GDP)
Imports of goods and services (% of GDP) Investment climate
Ease of doing business index (ranking 1–183; 1 = best)
Time to star t a business (days)
Procedures to start a business (number)
Firing cost (weeks of wages)
Closing a business (years to resolve insolvency)
Total tax rate (% of profit)
Profit tax (% of commercial profits)New businesses registered (thousands)
New business density (new regis. per working-age pop.)
Enterprise surveys
Time dealing with gov’t officials (% of management time)
Firms expected to give gifts in meetings w/tax officials (%)
Firms using banks to finance investments (% of firms)
Delay in obtaining an electrical connection (days)
ISO certi fication ownership (% of firms)
Private sector investment
Invest. in infrastructure w/private participation ($ millions)
Private foreign direct investment, net (% of GDP)
Gross f ixed capital formation (% of GDP)
Gross f ixed private capital formation (% of GDP)
Finance and banking
Government cash surplus or deficit (% of GDP)
Government debt (% of GDP)
Deposit money banks’ assets (% of GDP) Total f inancial system deposits (% of GDP)
Bank capital to asset ratio (%)
Bank nonperforming loans to total gross loans ratio (%)
Domestic credit to the private sector (% of GDP)
Real interest rate (%)
Interest rate spread (percentage points)
Infrastructure
Paved roads (% of total roads)Electr ic power consumption (kWh per capita)
Power outages in a typical month (number)
Mobile cellular subscriptions (per 100 people)
Internet users (per 100 people)
101The Little Data Book on Private Sector Development 2011
High income
Country data
High-incomegroup
2000 2009 2009
Hong Kong SAR, China
6.7 7.0 1,117
3.4 3.7 547
4.9 5.2 8.1
26,570 31,570 37,9901.8 4.7 2.0
.. .. 1.5
13.4 8.0 25.0
5.4 2.5 15.9
86.5 92.0 73.5
-3.8 0.6
7.8 7.8
143.3 193.8 23.6
138.8 186.7 23.9
.. 2
.. 6 18
.. 3 6
.. 10.0 37.9
.. 1.1 2.1
.. 24.1 38.6
.. 18.7 14.3.. 101.0
.. 19.2
.. ..
.. ..
.. ..
.. ..
.. ..
.. .. ..
36.6 24.9 2.0
26.4 20.9 18.0
.. .. ..
-6.8 0.6 -7.7
27.7 30.5 55.7
167.9 199.2 140.0220.8 319.9 108.5
9.0 12.7 6.8
7.3 1.1 3.4
152.6 158.0 165.1
13.6 4.8
4.7 5.0 3.8
100.0 100.0 93.45,447 5,866 9,518
.. ..
81.7 174.3 111.2
27.8 61.4 72.3

8/6/2019 The Little Data Book on Private Sector Development 2011
http://slidepdf.com/reader/full/the-little-data-book-on-private-sector-development-2011 110/246
Economic and social context
Population (millions)
Labor force (millions)
Unemployment rate (% of labor force)
GNI per capita, World Bank Atlas method ($)GDP growth, 1995–2000 and 2000–09 (average annual %)
Agriculture value added (% of GDP)
Industry value added (% of GDP)
Manufacturing value added (% of GDP)
Services value added (% of GDP)
Inflation (annual % change in consumer price index)
Exchange rate (local currency units per $)
Exports of goods and services (% of GDP)
Imports of goods and services (% of GDP) Investment climate
Ease of doing business index (ranking 1–183; 1 = best)
Time to star t a business (days)
Procedures to start a business (number)
Firing cost (weeks of wages)
Closing a business (years to resolve insolvency)
Total tax rate (% of profit)
Profit tax (% of commercial profits)New businesses registered (thousands)
New business density (new regis. per working-age pop.)
Enterprise surveys
Time dealing with gov’t officials (% of management time)
Firms expected to give gifts in meetings w/tax officials (%)
Firms using banks to finance investments (% of firms)
Delay in obtaining an electrical connection (days)
ISO certif ication ownership (% of firms)
Private sector investment
Invest. in infrastructure w/private participation ($ millions)
Private foreign direct investment, net (% of GDP)
Gross f ixed capital formation (% of GDP)
Gross f ixed private capital formation (% of GDP)
Finance and banking
Government cash surplus or deficit (% of GDP)
Government debt (% of GDP)
Deposit money banks’ assets (% of GDP) Total f inancial system deposits (% of GDP)
Bank capital to asset ratio (%)
Bank nonperforming loans to total gross loans ratio (%)
Domestic credit to the private sector (% of GDP)
Real interest rate (%)
Interest rate spread (percentage points)
Infrastructure
Paved roads (% of total roads)Electr ic power consumption (kWh per capita)
Power outages in a typical month (number)
Mobile cellular subscriptions (per 100 people)
Internet users (per 100 people)
102 2011 The Little Data Book on Private Sector Development
Country data
High-incomegroup
2000 2009 2009
High income
Hungary
10.2 10.0 1,117
4.2 4.3 547
6.4 10.0 8.1
4,700 12,980 37,9904.3 2.9 2.0
5.4 4.3 1.5
32.2 29.4 25.0
23.5 21.7 15.9
62.4 66.2 73.5
9.8 4.2
282.2 202.3
72.2 81.4 23.6
75.8 80.2 23.9
.. 46
.. 4 18
.. 4 6
.. 35.0 37.9
.. 2.0 2.1
.. 53.3 38.6
.. 16.7 14.3.. 43.0
.. 6.3
5.2 13.5
27.4 0.7
21.6 48.7
9.6 48.0
32.6 39.4
1,168 2,645 ..
5.8 2.2 2.0
23.0 20.1 18.0
.. .. ..
-2.7 -4.0 -7.7
61.0 81.7 55.7
41.1 82.7 140.038.0 47.4 108.5
8.3 8.5 6.8
3.0 6.7 3.4
31.4 71.3 165.1
0.9 6.1
3.1 5.2 3.8
43.7 37.7 93.43,309 3,989 9,518
.. 2.9
30.1 117.7 111.2
7.0 61.6 72.3
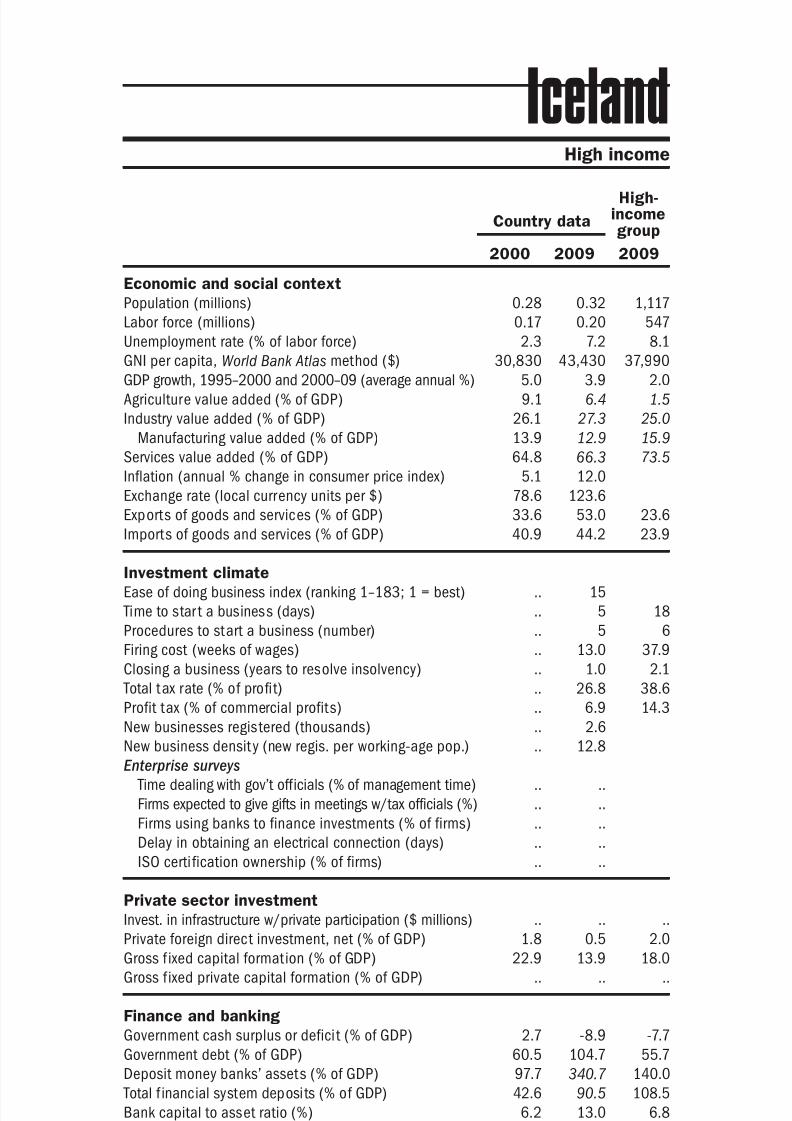
8/6/2019 The Little Data Book on Private Sector Development 2011
http://slidepdf.com/reader/full/the-little-data-book-on-private-sector-development-2011 111/246
Economic and social context
Population (millions)
Labor force (millions)
Unemployment rate (% of labor force)
GNI per capita, World Bank Atlas method ($)GDP growth, 1995–2000 and 2000–09 (average annual %)
Agriculture value added (% of GDP)
Industry value added (% of GDP)
Manufacturing value added (% of GDP)
Services value added (% of GDP)
Inflation (annual % change in consumer price index)
Exchange rate (local currency units per $)
Exports of goods and services (% of GDP)
Imports of goods and services (% of GDP) Investment climate
Ease of doing business index (ranking 1–183; 1 = best)
Time to star t a business (days)
Procedures to start a business (number)
Firing cost (weeks of wages)
Closing a business (years to resolve insolvency)
Total tax rate (% of profit)
Profit tax (% of commercial profits)New businesses registered (thousands)
New business density (new regis. per working-age pop.)
Enterprise surveys
Time dealing with gov’t officials (% of management time)
Firms expected to give gifts in meetings w/tax officials (%)
Firms using banks to finance investments (% of firms)
Delay in obtaining an electrical connection (days)
ISO certi fication ownership (% of firms)
Private sector investment
Invest. in infrastructure w/private participation ($ millions)
Private foreign direct investment, net (% of GDP)
Gross f ixed capital formation (% of GDP)
Gross f ixed private capital formation (% of GDP)
Finance and banking
Government cash surplus or deficit (% of GDP)
Government debt (% of GDP)
Deposit money banks’ assets (% of GDP) Total f inancial system deposits (% of GDP)
Bank capital to asset ratio (%)
Bank nonperforming loans to total gross loans ratio (%)
Domestic credit to the private sector (% of GDP)
Real interest rate (%)
Interest rate spread (percentage points)
Infrastructure
Paved roads (% of total roads)Electr ic power consumption (kWh per capita)
Power outages in a typical month (number)
Mobile cellular subscriptions (per 100 people)
Internet users (per 100 people)
103The Little Data Book on Private Sector Development 2011
Country data
High-incomegroup
2000 2009 2009
High income
Iceland
0.28 0.32 1,117
0.17 0.20 547
2.3 7.2 8.1
30,830 43,430 37,9905.0 3.9 2.0
9.1 6.4 1.5
26.1 27.3 25.0
13.9 12.9 15.9
64.8 66.3 73.5
5.1 12.0
78.6 123.6
33.6 53.0 23.6
40.9 44.2 23.9
.. 15
.. 5 18
.. 5 6
.. 13.0 37.9
.. 1.0 2.1
.. 26.8 38.6
.. 6.9 14.3.. 2.6
.. 12.8
.. ..
.. ..
.. ..
.. ..
.. ..
.. .. ..
1.8 0.5 2.0
22.9 13.9 18.0
.. .. ..
2.7 -8.9 -7.7
60.5 104.7 55.7
97.7 340.7 140.042.6 90.5 108.5
6.2 13.0 6.8
1.5 61.2 3.4
97.1 261.2 165.1
12.7 9.6
6.2 7.2 3.8
29.5 36.6 93.426,221 50,067 9,518
.. ..
76.5 109.4 111.2
44.5 94.5 72.3
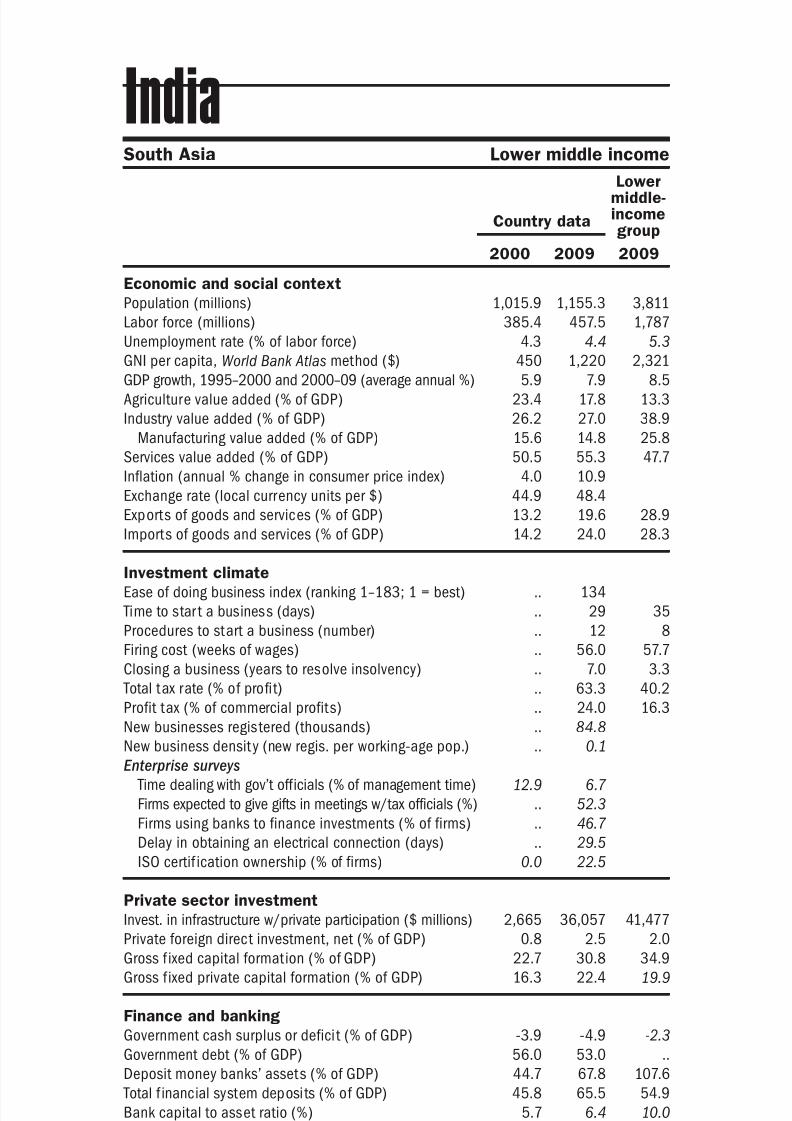
8/6/2019 The Little Data Book on Private Sector Development 2011
http://slidepdf.com/reader/full/the-little-data-book-on-private-sector-development-2011 112/246
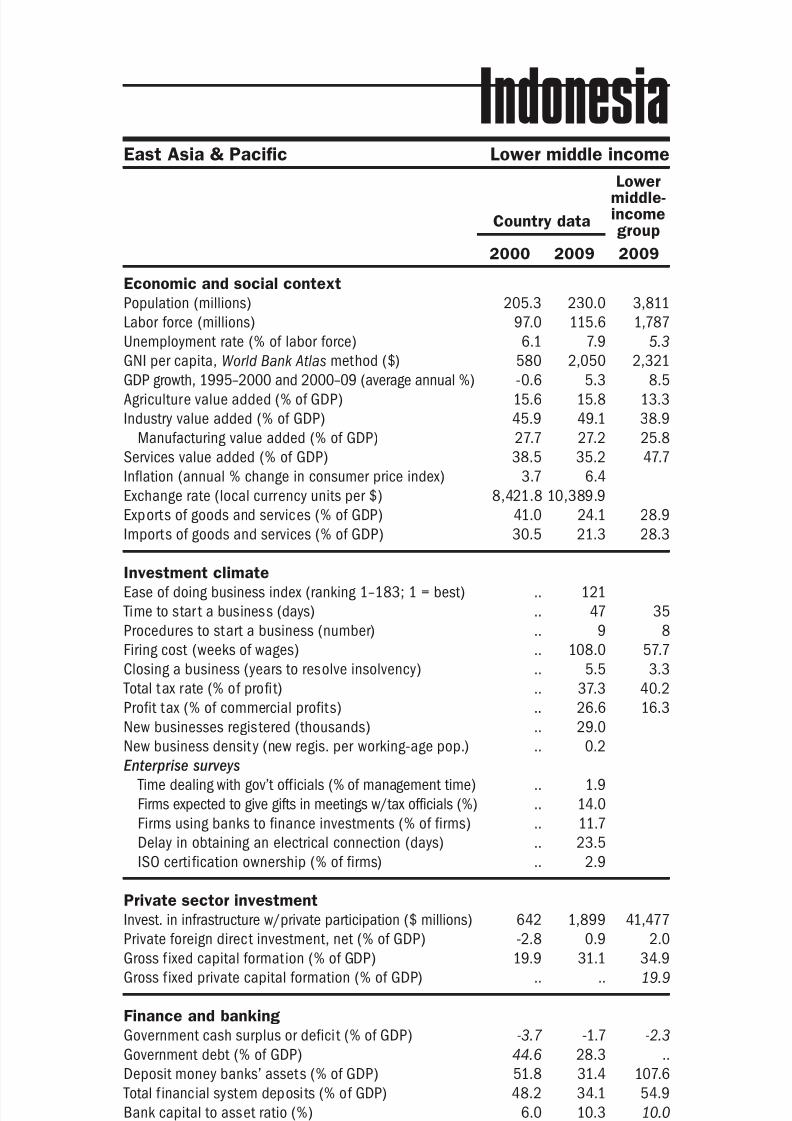
8/6/2019 The Little Data Book on Private Sector Development 2011
http://slidepdf.com/reader/full/the-little-data-book-on-private-sector-development-2011 113/246
Economic and social context
Population (millions)
Labor force (millions)
Unemployment rate (% of labor force)
GNI per capita, World Bank Atlas method ($)GDP growth, 1995–2000 and 2000–09 (average annual %)
Agriculture value added (% of GDP)
Industry value added (% of GDP)
Manufacturing value added (% of GDP)
Services value added (% of GDP)
Inflation (annual % change in consumer price index)
Exchange rate (local currency units per $)
Exports of goods and services (% of GDP)
Imports of goods and services (% of GDP) Investment climate
Ease of doing business index (ranking 1–183; 1 = best)
Time to star t a business (days)
Procedures to start a business (number)
Firing cost (weeks of wages)
Closing a business (years to resolve insolvency)
Total tax rate (% of profit)
Profit tax (% of commercial profits)New businesses registered (thousands)
New business density (new regis. per working-age pop.)
Enterprise surveys
Time dealing with gov’t officials (% of management time)
Firms expected to give gifts in meetings w/tax officials (%)
Firms using banks to finance investments (% of firms)
Delay in obtaining an electrical connection (days)
ISO certi fication ownership (% of firms)
Private sector investment
Invest. in infrastructure w/private participation ($ millions)
Private foreign direct investment, net (% of GDP)
Gross f ixed capital formation (% of GDP)
Gross f ixed private capital formation (% of GDP)
Finance and banking
Government cash surplus or deficit (% of GDP)
Government debt (% of GDP)
Deposit money banks’ assets (% of GDP) Total f inancial system deposits (% of GDP)
Bank capital to asset ratio (%)
Bank nonperforming loans to total gross loans ratio (%)
Domestic credit to the private sector (% of GDP)
Real interest rate (%)
Interest rate spread (percentage points)
Infrastructure
Paved roads (% of total roads)Electr ic power consumption (kWh per capita)
Power outages in a typical month (number)
Mobile cellular subscriptions (per 100 people)
Internet users (per 100 people)
105The Little Data Book on Private Sector Development 2011
Country data
Lowermiddle-incomegroup
2000 2009 2009
East Asia & Pacific Lower middle income
Indonesia
205.3 230.0 3,811
97.0 115.6 1,787
6.1 7.9 5.3
580 2,050 2,321-0.6 5.3 8.5
15.6 15.8 13.3
45.9 49.1 38.9
27.7 27.2 25.8
38.5 35.2 47.7
3.7 6.4
8,421.8 10,389.9
41.0 24.1 28.9
30.5 21.3 28.3
.. 121
.. 47 35
.. 9 8
.. 108.0 57.7
.. 5.5 3.3
.. 37.3 40.2
.. 26.6 16.3.. 29.0
.. 0.2
.. 1.9
.. 14.0
.. 11.7
.. 23.5
.. 2.9
642 1,899 41,477
-2.8 0.9 2.0
19.9 31.1 34.9
.. .. 19.9
-3.7 -1.7 -2.3
44.6 28.3 ..
51.8 31.4 107.648.2 34.1 54.9
6.0 10.3 10.0
34.4 3.3 5.1
19.9 27.6 92.9
-1.7 5.6
6.0 5.2 7.3
57.1 59.1 36.3402 591 1,318
.. 2.1
1.8 69.2 57.8
0.9 8.7 17.2
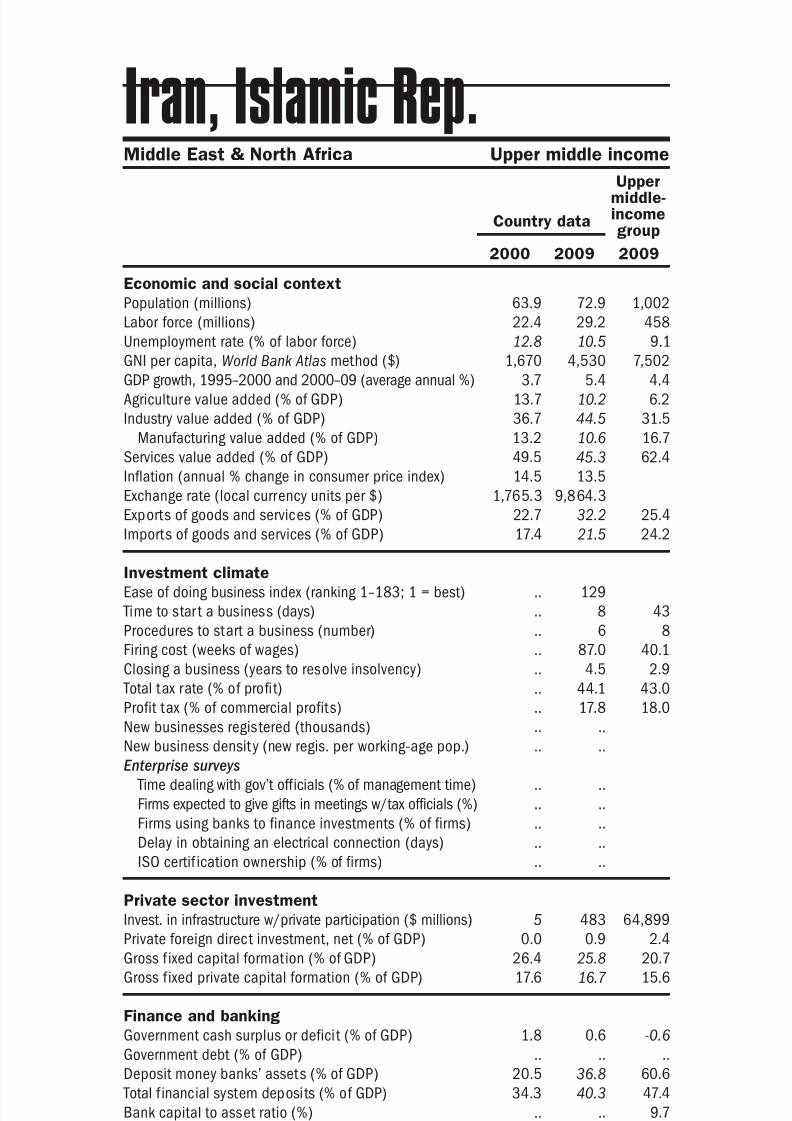
8/6/2019 The Little Data Book on Private Sector Development 2011
http://slidepdf.com/reader/full/the-little-data-book-on-private-sector-development-2011 114/246
Economic and social context
Population (millions)
Labor force (millions)
Unemployment rate (% of labor force)
GNI per capita, World Bank Atlas method ($)GDP growth, 1995–2000 and 2000–09 (average annual %)
Agriculture value added (% of GDP)
Industry value added (% of GDP)
Manufacturing value added (% of GDP)
Services value added (% of GDP)
Inflation (annual % change in consumer price index)
Exchange rate (local currency units per $)
Exports of goods and services (% of GDP)
Imports of goods and services (% of GDP) Investment climate
Ease of doing business index (ranking 1–183; 1 = best)
Time to star t a business (days)
Procedures to start a business (number)
Firing cost (weeks of wages)
Closing a business (years to resolve insolvency)
Total tax rate (% of profit)
Profit tax (% of commercial profits)New businesses registered (thousands)
New business density (new regis. per working-age pop.)
Enterprise surveys
Time dealing with gov’t officials (% of management time)
Firms expected to give gifts in meetings w/tax officials (%)
Firms using banks to finance investments (% of firms)
Delay in obtaining an electrical connection (days)
ISO certif ication ownership (% of firms)
Private sector investment
Invest. in infrastructure w/private participation ($ millions)
Private foreign direct investment, net (% of GDP)
Gross f ixed capital formation (% of GDP)
Gross f ixed private capital formation (% of GDP)
Finance and banking
Government cash surplus or deficit (% of GDP)
Government debt (% of GDP)
Deposit money banks’ assets (% of GDP) Total f inancial system deposits (% of GDP)
Bank capital to asset ratio (%)
Bank nonperforming loans to total gross loans ratio (%)
Domestic credit to the private sector (% of GDP)
Real interest rate (%)
Interest rate spread (percentage points)
Infrastructure
Paved roads (% of total roads)Electr ic power consumption (kWh per capita)
Power outages in a typical month (number)
Mobile cellular subscriptions (per 100 people)
Internet users (per 100 people)
106 2011 The Little Data Book on Private Sector Development
Middle East & North Africa Upper middle income
Country data
Uppermiddle-incomegroup
2000 2009 2009
Iran, Islamic Rep.
63.9 72.9 1,002
22.4 29.2 458
12.8 10.5 9.1
1,670 4,530 7,5023.7 5.4 4.4
13.7 10.2 6.2
36.7 44.5 31.5
13.2 10.6 16.7
49.5 45.3 62.4
14.5 13.5
1,765.3 9,864.3
22.7 32.2 25.4
17.4 21.5 24.2
.. 129
.. 8 43
.. 6 8
.. 87.0 40.1
.. 4.5 2.9
.. 44.1 43.0
.. 17.8 18.0.. ..
.. ..
.. ..
.. ..
.. ..
.. ..
.. ..
5 483 64,899
0.0 0.9 2.4
26.4 25.8 20.7
17.6 16.7 15.6
1.8 0.6 -0.6
.. .. ..
20.5 36.8 60.634.3 40.3 47.4
.. .. 9.7
.. .. 4.2
19.5 36.7 47.8
.. 11.3
.. -1.1 5.5
64.8 73.3 36.81,586 2,423 3,001
.. ..
1.5 72.1 100.6
1.0 38.3 34.6
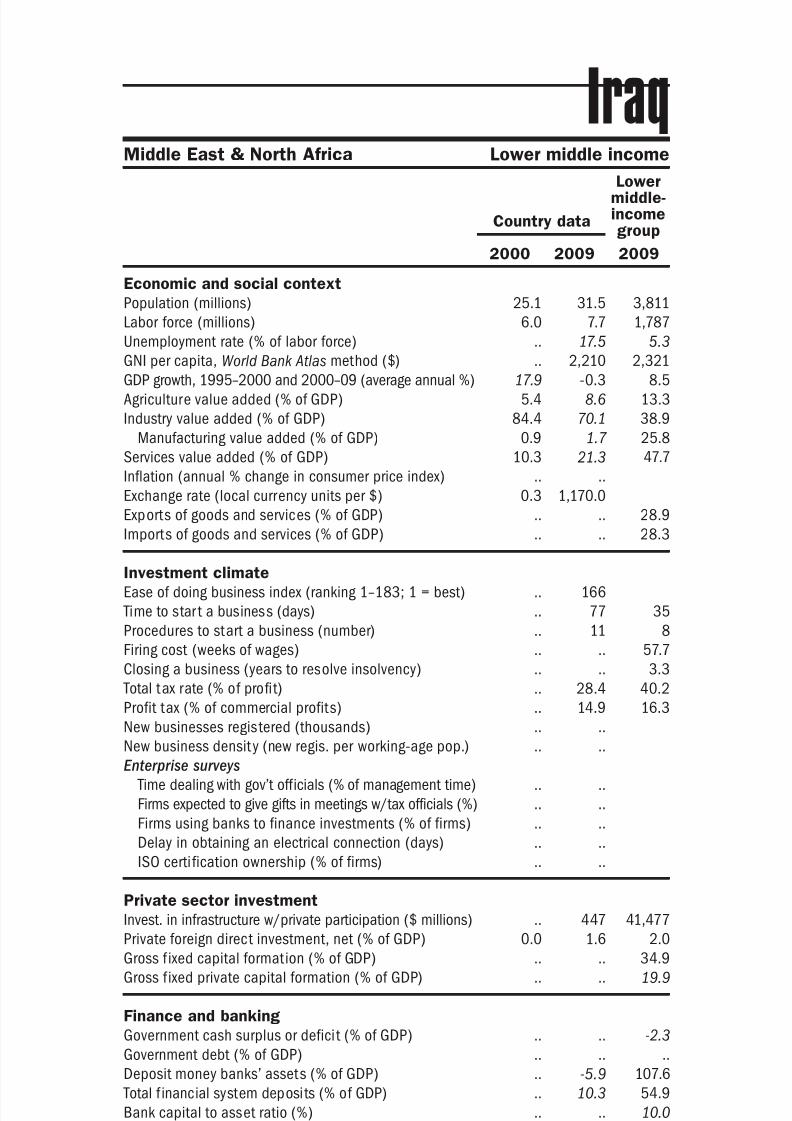
8/6/2019 The Little Data Book on Private Sector Development 2011
http://slidepdf.com/reader/full/the-little-data-book-on-private-sector-development-2011 115/246
Economic and social context
Population (millions)
Labor force (millions)
Unemployment rate (% of labor force)
GNI per capita, World Bank Atlas method ($)GDP growth, 1995–2000 and 2000–09 (average annual %)
Agriculture value added (% of GDP)
Industry value added (% of GDP)
Manufacturing value added (% of GDP)
Services value added (% of GDP)
Inflation (annual % change in consumer price index)
Exchange rate (local currency units per $)
Exports of goods and services (% of GDP)
Imports of goods and services (% of GDP) Investment climate
Ease of doing business index (ranking 1–183; 1 = best)
Time to star t a business (days)
Procedures to start a business (number)
Firing cost (weeks of wages)
Closing a business (years to resolve insolvency)
Total tax rate (% of profit)
Profit tax (% of commercial profits)New businesses registered (thousands)
New business density (new regis. per working-age pop.)
Enterprise surveys
Time dealing with gov’t officials (% of management time)
Firms expected to give gifts in meetings w/tax officials (%)
Firms using banks to finance investments (% of firms)
Delay in obtaining an electrical connection (days)
ISO certi fication ownership (% of firms)
Private sector investment
Invest. in infrastructure w/private participation ($ millions)
Private foreign direct investment, net (% of GDP)
Gross f ixed capital formation (% of GDP)
Gross f ixed private capital formation (% of GDP)
Finance and banking
Government cash surplus or deficit (% of GDP)
Government debt (% of GDP)
Deposit money banks’ assets (% of GDP) Total f inancial system deposits (% of GDP)
Bank capital to asset ratio (%)
Bank nonperforming loans to total gross loans ratio (%)
Domestic credit to the private sector (% of GDP)
Real interest rate (%)
Interest rate spread (percentage points)
Infrastructure
Paved roads (% of total roads)Electr ic power consumption (kWh per capita)
Power outages in a typical month (number)
Mobile cellular subscriptions (per 100 people)
Internet users (per 100 people)
107The Little Data Book on Private Sector Development 2011
Country data
Lowermiddle-incomegroup
2000 2009 2009
Middle East & North Africa Lower middle income
Iraq
25.1 31.5 3,811
6.0 7.7 1,787
.. 17.5 5.3
.. 2,210 2,32117.9 -0.3 8.5
5.4 8.6 13.3
84.4 70.1 38.9
0.9 1.7 25.8
10.3 21.3 47.7
.. ..
0.3 1,170.0
.. .. 28.9
.. .. 28.3
.. 166
.. 77 35
.. 11 8
.. .. 57.7
.. .. 3.3
.. 28.4 40.2
.. 14.9 16.3.. ..
.. ..
.. ..
.. ..
.. ..
.. ..
.. ..
.. 447 41,477
0.0 1.6 2.0
.. .. 34.9
.. .. 19.9
.. .. -2.3
.. .. ..
.. -5.9 107.6
.. 10.3 54.9
.. .. 10.0
.. .. 5.1
.. 6.4 92.9
.. 61.5
.. 7.8 7.3
84.3 .. 36.31,161 1,164 1,318
.. ..
0.0 62.6 57.8
0.0 1.0 17.2
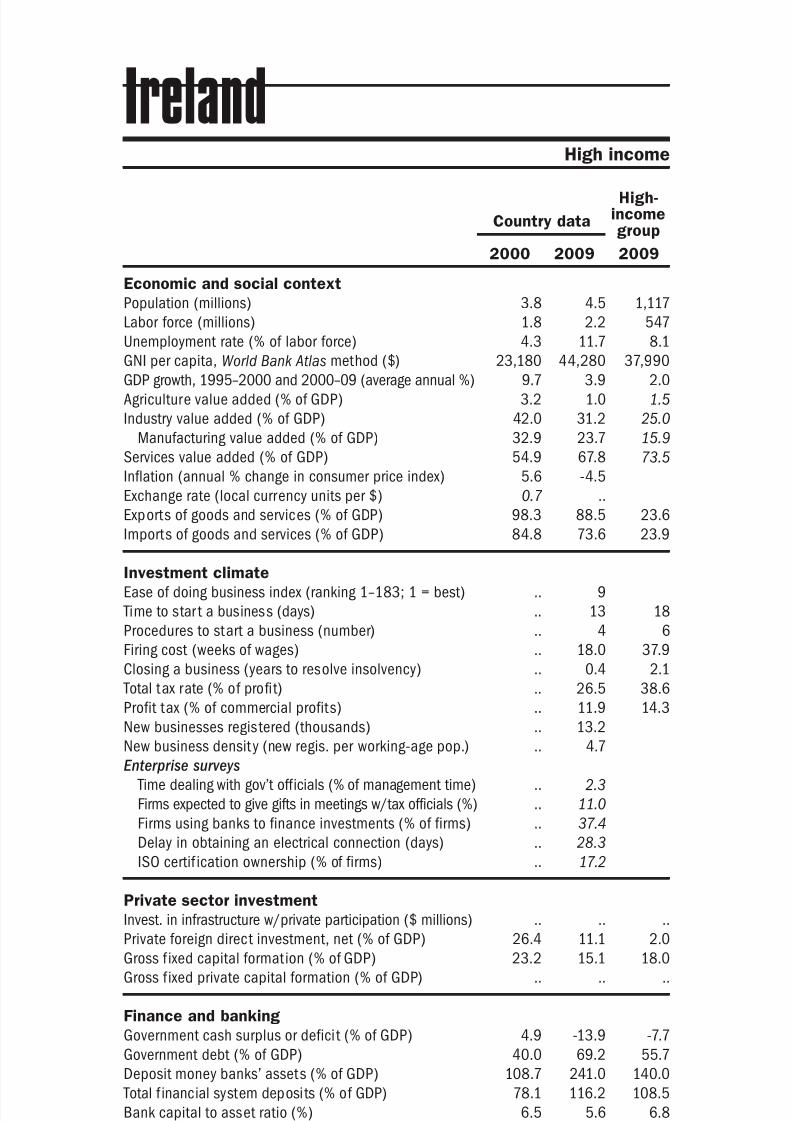
8/6/2019 The Little Data Book on Private Sector Development 2011
http://slidepdf.com/reader/full/the-little-data-book-on-private-sector-development-2011 116/246
Economic and social context
Population (millions)
Labor force (millions)
Unemployment rate (% of labor force)
GNI per capita, World Bank Atlas method ($)GDP growth, 1995–2000 and 2000–09 (average annual %)
Agriculture value added (% of GDP)
Industry value added (% of GDP)
Manufacturing value added (% of GDP)
Services value added (% of GDP)
Inflation (annual % change in consumer price index)
Exchange rate (local currency units per $)
Exports of goods and services (% of GDP)
Imports of goods and services (% of GDP) Investment climate
Ease of doing business index (ranking 1–183; 1 = best)
Time to star t a business (days)
Procedures to start a business (number)
Firing cost (weeks of wages)
Closing a business (years to resolve insolvency)
Total tax rate (% of profit)
Profit tax (% of commercial profits)New businesses registered (thousands)
New business density (new regis. per working-age pop.)
Enterprise surveys
Time dealing with gov’t officials (% of management time)
Firms expected to give gifts in meetings w/tax officials (%)
Firms using banks to finance investments (% of firms)
Delay in obtaining an electrical connection (days)
ISO certif ication ownership (% of firms)
Private sector investment
Invest. in infrastructure w/private participation ($ millions)
Private foreign direct investment, net (% of GDP)
Gross f ixed capital formation (% of GDP)
Gross f ixed private capital formation (% of GDP)
Finance and banking
Government cash surplus or deficit (% of GDP)
Government debt (% of GDP)
Deposit money banks’ assets (% of GDP) Total f inancial system deposits (% of GDP)
Bank capital to asset ratio (%)
Bank nonperforming loans to total gross loans ratio (%)
Domestic credit to the private sector (% of GDP)
Real interest rate (%)
Interest rate spread (percentage points)
Infrastructure
Paved roads (% of total roads)Electr ic power consumption (kWh per capita)
Power outages in a typical month (number)
Mobile cellular subscriptions (per 100 people)
Internet users (per 100 people)
108 2011 The Little Data Book on Private Sector Development
High income
Country data
High-incomegroup
2000 2009 2009
Ireland
3.8 4.5 1,117
1.8 2.2 547
4.3 11.7 8.1
23,180 44,280 37,9909.7 3.9 2.0
3.2 1.0 1.5
42.0 31.2 25.0
32.9 23.7 15.9
54.9 67.8 73.5
5.6 -4.5
0.7 ..
98.3 88.5 23.6
84.8 73.6 23.9
.. 9
.. 13 18
.. 4 6
.. 18.0 37.9
.. 0.4 2.1
.. 26.5 38.6
.. 11.9 14.3.. 13.2
.. 4.7
.. 2.3
.. 11.0
.. 37.4
.. 28.3
.. 17.2
.. .. ..
26.4 11.1 2.0
23.2 15.1 18.0
.. .. ..
4.9 -13.9 -7.7
40.0 69.2 55.7
108.7 241.0 140.078.1 116.2 108.5
6.5 5.6 6.8
1.0 9.0 3.4
105.6 230.3 165.1
-1.1 0.2
4.7 2.6 3.8
100.0 100.0 93.45,796 6,301 9,518
.. ..
64.7 109.5 111.2
17.8 68.4 72.3
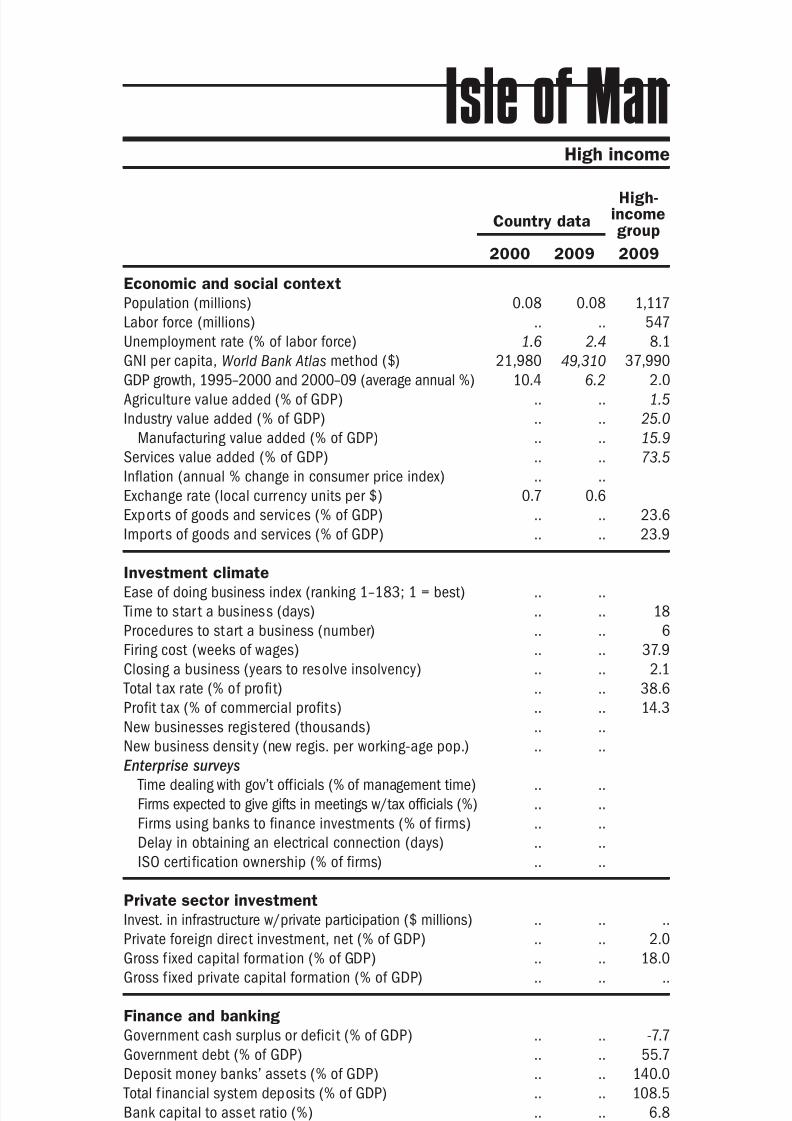
8/6/2019 The Little Data Book on Private Sector Development 2011
http://slidepdf.com/reader/full/the-little-data-book-on-private-sector-development-2011 117/246
Economic and social context
Population (millions)
Labor force (millions)
Unemployment rate (% of labor force)
GNI per capita, World Bank Atlas method ($)GDP growth, 1995–2000 and 2000–09 (average annual %)
Agriculture value added (% of GDP)
Industry value added (% of GDP)
Manufacturing value added (% of GDP)
Services value added (% of GDP)
Inflation (annual % change in consumer price index)
Exchange rate (local currency units per $)
Exports of goods and services (% of GDP)
Imports of goods and services (% of GDP) Investment climate
Ease of doing business index (ranking 1–183; 1 = best)
Time to star t a business (days)
Procedures to start a business (number)
Firing cost (weeks of wages)
Closing a business (years to resolve insolvency)
Total tax rate (% of profit)
Profit tax (% of commercial profits)New businesses registered (thousands)
New business density (new regis. per working-age pop.)
Enterprise surveys
Time dealing with gov’t officials (% of management time)
Firms expected to give gifts in meetings w/tax officials (%)
Firms using banks to finance investments (% of firms)
Delay in obtaining an electrical connection (days)
ISO certi fication ownership (% of firms)
Private sector investment
Invest. in infrastructure w/private participation ($ millions)
Private foreign direct investment, net (% of GDP)
Gross f ixed capital formation (% of GDP)
Gross f ixed private capital formation (% of GDP)
Finance and banking
Government cash surplus or deficit (% of GDP)
Government debt (% of GDP)
Deposit money banks’ assets (% of GDP) Total f inancial system deposits (% of GDP)
Bank capital to asset ratio (%)
Bank nonperforming loans to total gross loans ratio (%)
Domestic credit to the private sector (% of GDP)
Real interest rate (%)
Interest rate spread (percentage points)
Infrastructure
Paved roads (% of total roads)Electr ic power consumption (kWh per capita)
Power outages in a typical month (number)
Mobile cellular subscriptions (per 100 people)
Internet users (per 100 people)
109The Little Data Book on Private Sector Development 2011
Country data
High-incomegroup
2000 2009 2009
High income
Isle of Man
0.08 0.08 1,117
.. .. 547
1.6 2.4 8.1
21,980 49,310 37,99010.4 6.2 2.0
.. .. 1.5
.. .. 25.0
.. .. 15.9
.. .. 73.5
.. ..
0.7 0.6
.. .. 23.6
.. .. 23.9
.. ..
.. .. 18
.. .. 6
.. .. 37.9
.. .. 2.1
.. .. 38.6
.. .. 14.3.. ..
.. ..
.. ..
.. ..
.. ..
.. ..
.. ..
.. .. ..
.. .. 2.0
.. .. 18.0
.. .. ..
.. .. -7.7
.. .. 55.7
.. .. 140.0
.. .. 108.5
.. .. 6.8
.. .. 3.4
.. .. 165.1
.. ..
.. .. 3.8
.. .. 93.4
.. .. 9,518
.. ..
.. .. 111.2
.. .. 72.3
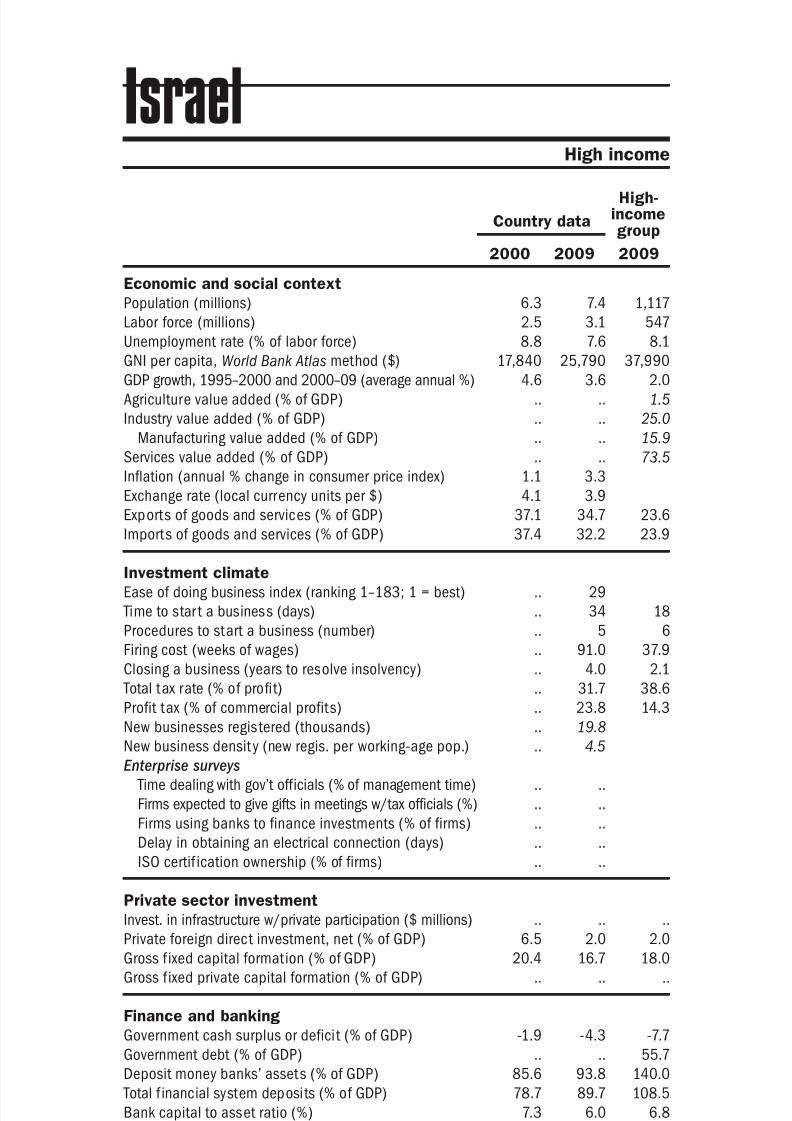
8/6/2019 The Little Data Book on Private Sector Development 2011
http://slidepdf.com/reader/full/the-little-data-book-on-private-sector-development-2011 118/246
Economic and social context
Population (millions)
Labor force (millions)
Unemployment rate (% of labor force)
GNI per capita, World Bank Atlas method ($)GDP growth, 1995–2000 and 2000–09 (average annual %)
Agriculture value added (% of GDP)
Industry value added (% of GDP)
Manufacturing value added (% of GDP)
Services value added (% of GDP)
Inflation (annual % change in consumer price index)
Exchange rate (local currency units per $)
Exports of goods and services (% of GDP)
Imports of goods and services (% of GDP) Investment climate
Ease of doing business index (ranking 1–183; 1 = best)
Time to star t a business (days)
Procedures to start a business (number)
Firing cost (weeks of wages)
Closing a business (years to resolve insolvency)
Total tax rate (% of profit)
Profit tax (% of commercial profits)New businesses registered (thousands)
New business density (new regis. per working-age pop.)
Enterprise surveys
Time dealing with gov’t officials (% of management time)
Firms expected to give gifts in meetings w/tax officials (%)
Firms using banks to finance investments (% of firms)
Delay in obtaining an electrical connection (days)
ISO certif ication ownership (% of firms)
Private sector investment
Invest. in infrastructure w/private participation ($ millions)
Private foreign direct investment, net (% of GDP)
Gross f ixed capital formation (% of GDP)
Gross f ixed private capital formation (% of GDP)
Finance and banking
Government cash surplus or deficit (% of GDP)
Government debt (% of GDP)
Deposit money banks’ assets (% of GDP) Total f inancial system deposits (% of GDP)
Bank capital to asset ratio (%)
Bank nonperforming loans to total gross loans ratio (%)
Domestic credit to the private sector (% of GDP)
Real interest rate (%)
Interest rate spread (percentage points)
Infrastructure
Paved roads (% of total roads)Electr ic power consumption (kWh per capita)
Power outages in a typical month (number)
Mobile cellular subscriptions (per 100 people)
Internet users (per 100 people)
110 2011 The Little Data Book on Private Sector Development
High income
Country data
High-incomegroup
2000 2009 2009
Israel
6.3 7.4 1,117
2.5 3.1 547
8.8 7.6 8.1
17,840 25,790 37,9904.6 3.6 2.0
.. .. 1.5
.. .. 25.0
.. .. 15.9
.. .. 73.5
1.1 3.3
4.1 3.9
37.1 34.7 23.6
37.4 32.2 23.9
.. 29
.. 34 18
.. 5 6
.. 91.0 37.9
.. 4.0 2.1
.. 31.7 38.6
.. 23.8 14.3.. 19.8
.. 4.5
.. ..
.. ..
.. ..
.. ..
.. ..
.. .. ..
6.5 2.0 2.0
20.4 16.7 18.0
.. .. ..
-1.9 -4.3 -7.7
.. .. 55.7
85.6 93.8 140.078.7 89.7 108.5
7.3 6.0 6.8
6.9 1.5 3.4
76.9 84.5 165.1
11.1 -1.4
4.2 2.6 3.8
100.0 100.0 93.46,323 7,054 9,518
.. ..
70.0 121.2 111.2
20.2 49.7 72.3
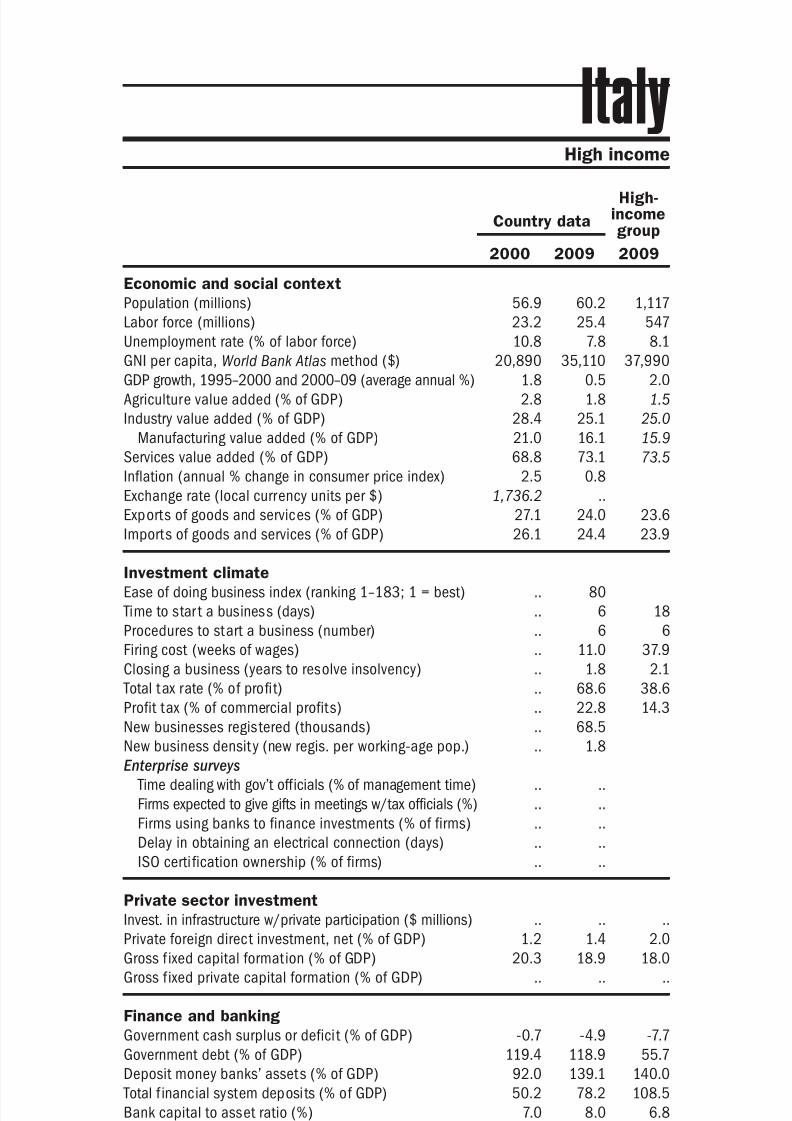
8/6/2019 The Little Data Book on Private Sector Development 2011
http://slidepdf.com/reader/full/the-little-data-book-on-private-sector-development-2011 119/246
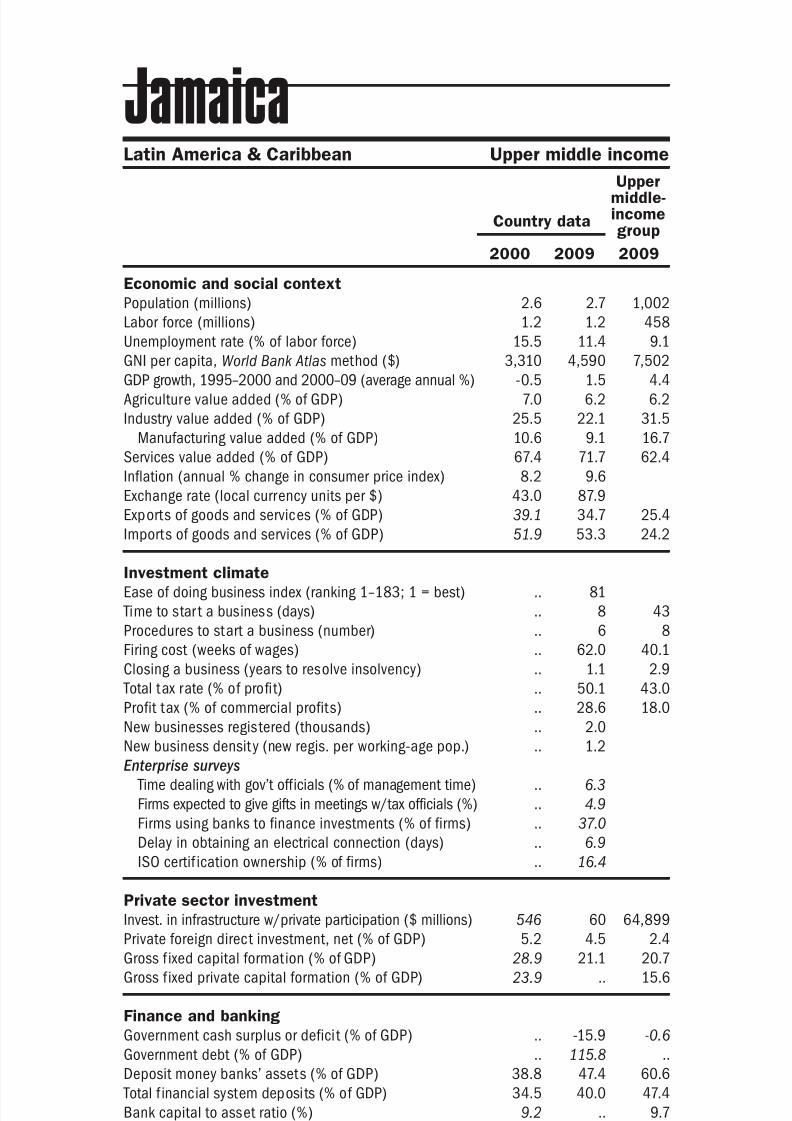
8/6/2019 The Little Data Book on Private Sector Development 2011
http://slidepdf.com/reader/full/the-little-data-book-on-private-sector-development-2011 120/246
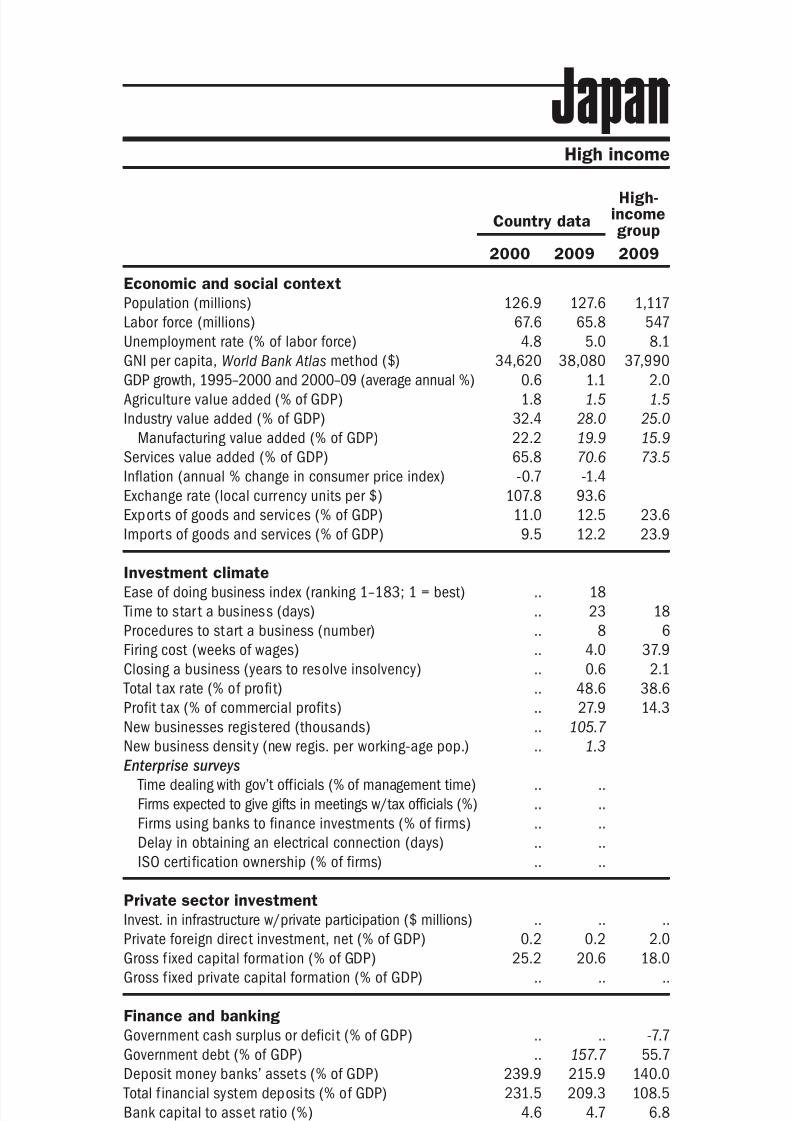
8/6/2019 The Little Data Book on Private Sector Development 2011
http://slidepdf.com/reader/full/the-little-data-book-on-private-sector-development-2011 121/246
Economic and social context
Population (millions)
Labor force (millions)
Unemployment rate (% of labor force)
GNI per capita, World Bank Atlas method ($)GDP growth, 1995–2000 and 2000–09 (average annual %)
Agriculture value added (% of GDP)
Industry value added (% of GDP)
Manufacturing value added (% of GDP)
Services value added (% of GDP)
Inflation (annual % change in consumer price index)
Exchange rate (local currency units per $)
Exports of goods and services (% of GDP)
Imports of goods and services (% of GDP) Investment climate
Ease of doing business index (ranking 1–183; 1 = best)
Time to star t a business (days)
Procedures to start a business (number)
Firing cost (weeks of wages)
Closing a business (years to resolve insolvency)
Total tax rate (% of profit)
Profit tax (% of commercial profits)New businesses registered (thousands)
New business density (new regis. per working-age pop.)
Enterprise surveys
Time dealing with gov’t officials (% of management time)
Firms expected to give gifts in meetings w/tax officials (%)
Firms using banks to finance investments (% of firms)
Delay in obtaining an electrical connection (days)
ISO certi fication ownership (% of firms)
Private sector investment
Invest. in infrastructure w/private participation ($ millions)
Private foreign direct investment, net (% of GDP)
Gross f ixed capital formation (% of GDP)
Gross f ixed private capital formation (% of GDP)
Finance and banking
Government cash surplus or deficit (% of GDP)
Government debt (% of GDP)
Deposit money banks’ assets (% of GDP) Total f inancial system deposits (% of GDP)
Bank capital to asset ratio (%)
Bank nonperforming loans to total gross loans ratio (%)
Domestic credit to the private sector (% of GDP)
Real interest rate (%)
Interest rate spread (percentage points)
Infrastructure
Paved roads (% of total roads)Electr ic power consumption (kWh per capita)
Power outages in a typical month (number)
Mobile cellular subscriptions (per 100 people)
Internet users (per 100 people)
113The Little Data Book on Private Sector Development 2011
Country data
High-incomegroup
2000 2009 2009
High income
Japan
126.9 127.6 1,117
67.6 65.8 547
4.8 5.0 8.1
34,620 38,080 37,9900.6 1.1 2.0
1.8 1.5 1.5
32.4 28.0 25.0
22.2 19.9 15.9
65.8 70.6 73.5
-0.7 -1.4
107.8 93.6
11.0 12.5 23.6
9.5 12.2 23.9
.. 18
.. 23 18
.. 8 6
.. 4.0 37.9
.. 0.6 2.1
.. 48.6 38.6
.. 27.9 14.3.. 105.7
.. 1.3
.. ..
.. ..
.. ..
.. ..
.. ..
.. .. ..
0.2 0.2 2.0
25.2 20.6 18.0
.. .. ..
.. .. -7.7
.. 157.7 55.7
239.9 215.9 140.0231.5 209.3 108.5
4.6 4.7 6.8
5.3 1.7 3.4
222.3 171.0 165.1
3.9 2.7
2.0 1.3 3.8
76.6 79.6 93.47,974 8,071 9,518
.. ..
52.6 90.1 111.2
30.0 77.7 72.3
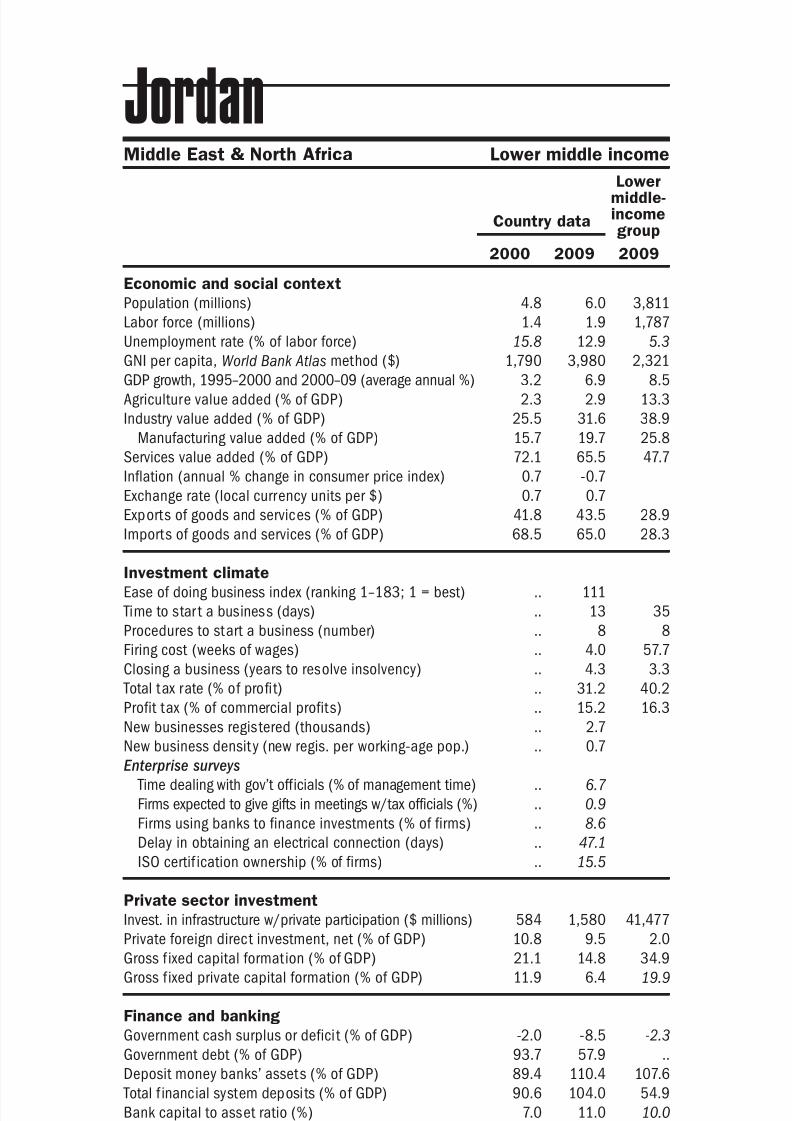
8/6/2019 The Little Data Book on Private Sector Development 2011
http://slidepdf.com/reader/full/the-little-data-book-on-private-sector-development-2011 122/246
Economic and social context
Population (millions)
Labor force (millions)
Unemployment rate (% of labor force)
GNI per capita, World Bank Atlas method ($)GDP growth, 1995–2000 and 2000–09 (average annual %)
Agriculture value added (% of GDP)
Industry value added (% of GDP)
Manufacturing value added (% of GDP)
Services value added (% of GDP)
Inflation (annual % change in consumer price index)
Exchange rate (local currency units per $)
Exports of goods and services (% of GDP)
Imports of goods and services (% of GDP) Investment climate
Ease of doing business index (ranking 1–183; 1 = best)
Time to star t a business (days)
Procedures to start a business (number)
Firing cost (weeks of wages)
Closing a business (years to resolve insolvency)
Total tax rate (% of profit)
Profit tax (% of commercial profits)New businesses registered (thousands)
New business density (new regis. per working-age pop.)
Enterprise surveys
Time dealing with gov’t officials (% of management time)
Firms expected to give gifts in meetings w/tax officials (%)
Firms using banks to finance investments (% of firms)
Delay in obtaining an electrical connection (days)
ISO certif ication ownership (% of firms)
Private sector investment
Invest. in infrastructure w/private participation ($ millions)
Private foreign direct investment, net (% of GDP)
Gross f ixed capital formation (% of GDP)
Gross f ixed private capital formation (% of GDP)
Finance and banking
Government cash surplus or deficit (% of GDP)
Government debt (% of GDP)
Deposit money banks’ assets (% of GDP) Total f inancial system deposits (% of GDP)
Bank capital to asset ratio (%)
Bank nonperforming loans to total gross loans ratio (%)
Domestic credit to the private sector (% of GDP)
Real interest rate (%)
Interest rate spread (percentage points)
Infrastructure
Paved roads (% of total roads)Electr ic power consumption (kWh per capita)
Power outages in a typical month (number)
Mobile cellular subscriptions (per 100 people)
Internet users (per 100 people)
114 2011 The Little Data Book on Private Sector Development
Middle East & North Africa Lower middle income
Country data
Lowermiddle-incomegroup
2000 2009 2009
Jordan
4.8 6.0 3,811
1.4 1.9 1,787
15.8 12.9 5.3
1,790 3,980 2,3213.2 6.9 8.5
2.3 2.9 13.3
25.5 31.6 38.9
15.7 19.7 25.8
72.1 65.5 47.7
0.7 -0.7
0.7 0.7
41.8 43.5 28.9
68.5 65.0 28.3
.. 111
.. 13 35
.. 8 8
.. 4.0 57.7
.. 4.3 3.3
.. 31.2 40.2
.. 15.2 16.3.. 2.7
.. 0.7
.. 6.7
.. 0.9
.. 8.6
.. 47.1
.. 15.5
584 1,580 41,477
10.8 9.5 2.0
21.1 14.8 34.9
11.9 6.4 19.9
-2.0 -8.5 -2.3
93.7 57.9 ..
89.4 110.4 107.690.6 104.0 54.9
7.0 11.0 10.0
18.4 6.7 5.1
72.1 71.7 92.9
12.2 1.1
4.8 4.3 7.3
100.0 100.0 36.31,377 2,087 1,318
.. 2.6
8.1 101.1 57.8
2.7 29.3 17.2
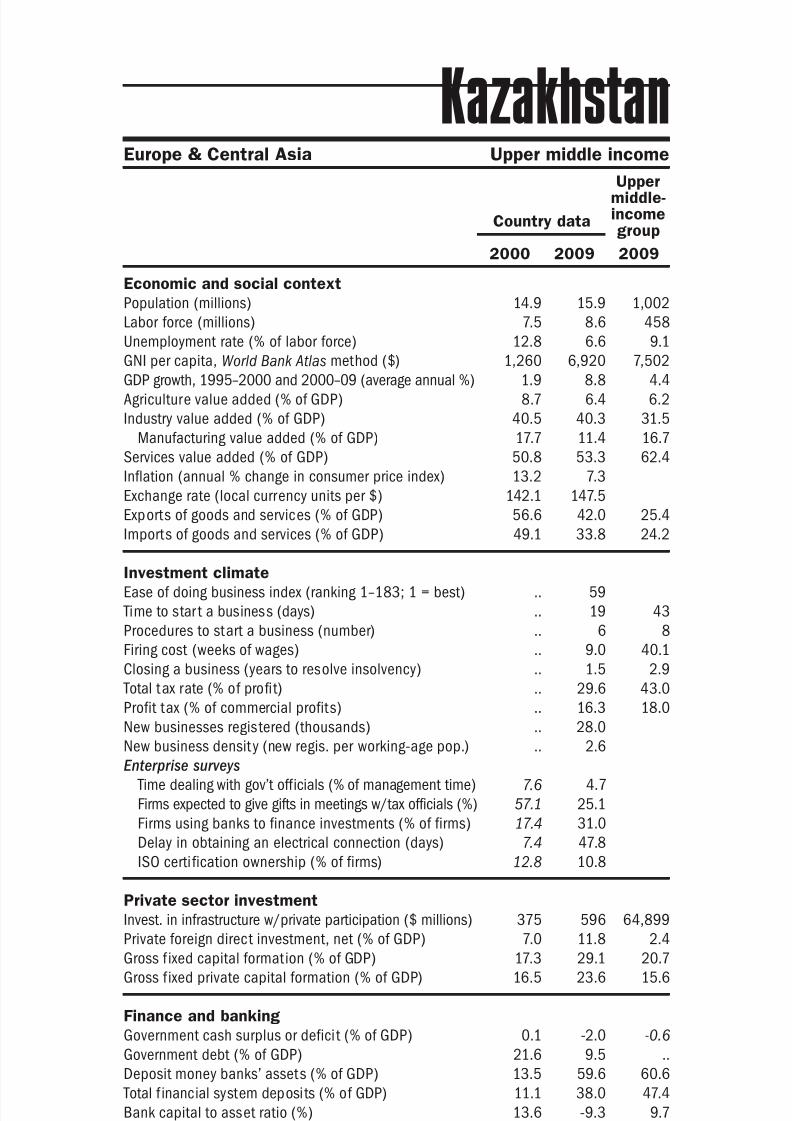
8/6/2019 The Little Data Book on Private Sector Development 2011
http://slidepdf.com/reader/full/the-little-data-book-on-private-sector-development-2011 123/246
Economic and social context
Population (millions)
Labor force (millions)
Unemployment rate (% of labor force)
GNI per capita, World Bank Atlas method ($)GDP growth, 1995–2000 and 2000–09 (average annual %)
Agriculture value added (% of GDP)
Industry value added (% of GDP)
Manufacturing value added (% of GDP)
Services value added (% of GDP)
Inflation (annual % change in consumer price index)
Exchange rate (local currency units per $)
Exports of goods and services (% of GDP)
Imports of goods and services (% of GDP) Investment climate
Ease of doing business index (ranking 1–183; 1 = best)
Time to star t a business (days)
Procedures to start a business (number)
Firing cost (weeks of wages)
Closing a business (years to resolve insolvency)
Total tax rate (% of profit)
Profit tax (% of commercial profits)New businesses registered (thousands)
New business density (new regis. per working-age pop.)
Enterprise surveys
Time dealing with gov’t officials (% of management time)
Firms expected to give gifts in meetings w/tax officials (%)
Firms using banks to finance investments (% of firms)
Delay in obtaining an electrical connection (days)
ISO certi fication ownership (% of firms)
Private sector investment
Invest. in infrastructure w/private participation ($ millions)
Private foreign direct investment, net (% of GDP)
Gross f ixed capital formation (% of GDP)
Gross f ixed private capital formation (% of GDP)
Finance and banking
Government cash surplus or deficit (% of GDP)
Government debt (% of GDP)
Deposit money banks’ assets (% of GDP) Total f inancial system deposits (% of GDP)
Bank capital to asset ratio (%)
Bank nonperforming loans to total gross loans ratio (%)
Domestic credit to the private sector (% of GDP)
Real interest rate (%)
Interest rate spread (percentage points)
Infrastructure
Paved roads (% of total roads)Electr ic power consumption (kWh per capita)
Power outages in a typical month (number)
Mobile cellular subscriptions (per 100 people)
Internet users (per 100 people)
115The Little Data Book on Private Sector Development 2011
Country data
Uppermiddle-incomegroup
2000 2009 2009
Europe & Central Asia Upper middle income
Kazakhstan
14.9 15.9 1,002
7.5 8.6 458
12.8 6.6 9.1
1,260 6,920 7,5021.9 8.8 4.4
8.7 6.4 6.2
40.5 40.3 31.5
17.7 11.4 16.7
50.8 53.3 62.4
13.2 7.3
142.1 147.5
56.6 42.0 25.4
49.1 33.8 24.2
.. 59
.. 19 43
.. 6 8
.. 9.0 40.1
.. 1.5 2.9
.. 29.6 43.0
.. 16.3 18.0.. 28.0
.. 2.6
7.6 4.7
57.1 25.1
17.4 31.0
7.4 47.8
12.8 10.8
375 596 64,899
7.0 11.8 2.4
17.3 29.1 20.7
16.5 23.6 15.6
0.1 -2.0 -0.6
21.6 9.5 ..
13.5 59.6 60.611.1 38.0 47.4
13.6 -9.3 9.7
.. 21.2 4.2
11.2 50.3 47.8
.. ..
.. .. 5.5
86.5 89.9 36.83,170 4,689 3,001
.. 2.8
1.3 94.4 100.6
0.7 33.4 34.6
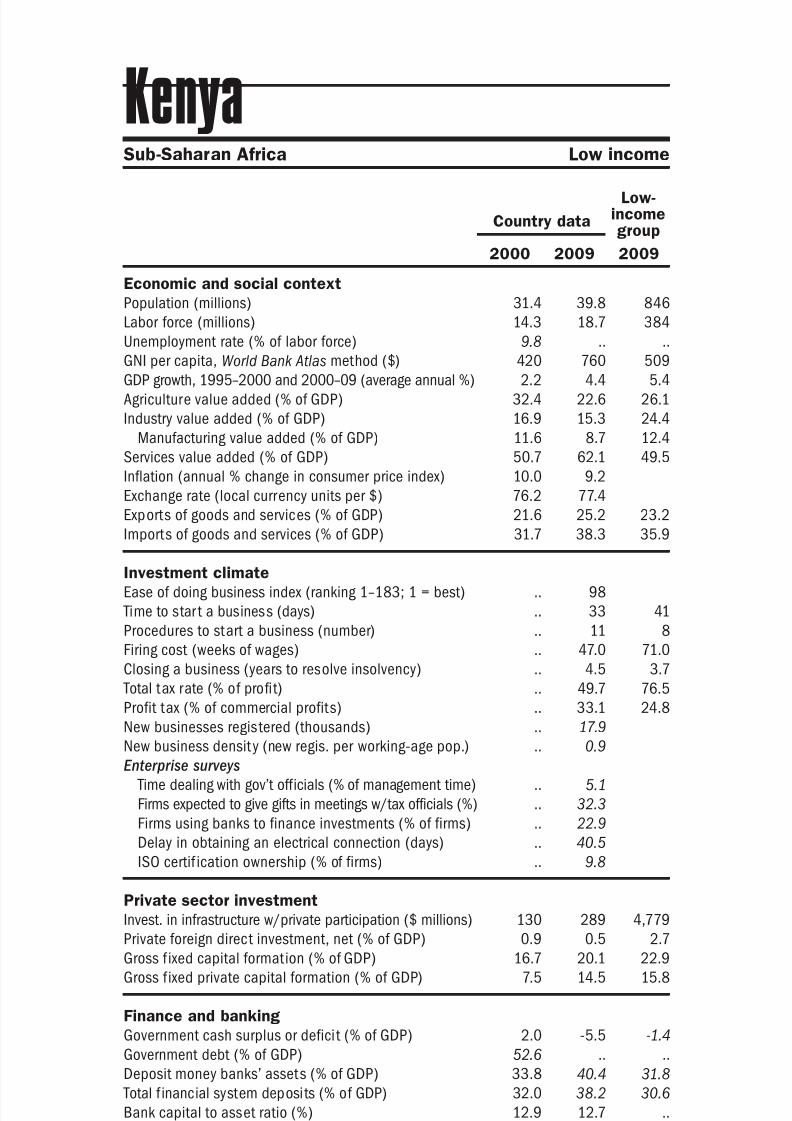
8/6/2019 The Little Data Book on Private Sector Development 2011
http://slidepdf.com/reader/full/the-little-data-book-on-private-sector-development-2011 124/246
Economic and social context
Population (millions)
Labor force (millions)
Unemployment rate (% of labor force)
GNI per capita, World Bank Atlas method ($)GDP growth, 1995–2000 and 2000–09 (average annual %)
Agriculture value added (% of GDP)
Industry value added (% of GDP)
Manufacturing value added (% of GDP)
Services value added (% of GDP)
Inflation (annual % change in consumer price index)
Exchange rate (local currency units per $)
Exports of goods and services (% of GDP)
Imports of goods and services (% of GDP) Investment climate
Ease of doing business index (ranking 1–183; 1 = best)
Time to star t a business (days)
Procedures to start a business (number)
Firing cost (weeks of wages)
Closing a business (years to resolve insolvency)
Total tax rate (% of profit)
Profit tax (% of commercial profits)New businesses registered (thousands)
New business density (new regis. per working-age pop.)
Enterprise surveys
Time dealing with gov’t officials (% of management time)
Firms expected to give gifts in meetings w/tax officials (%)
Firms using banks to finance investments (% of firms)
Delay in obtaining an electrical connection (days)
ISO certif ication ownership (% of firms)
Private sector investment
Invest. in infrastructure w/private participation ($ millions)
Private foreign direct investment, net (% of GDP)
Gross f ixed capital formation (% of GDP)
Gross f ixed private capital formation (% of GDP)
Finance and banking
Government cash surplus or deficit (% of GDP)
Government debt (% of GDP)
Deposit money banks’ assets (% of GDP) Total f inancial system deposits (% of GDP)
Bank capital to asset ratio (%)
Bank nonperforming loans to total gross loans ratio (%)
Domestic credit to the private sector (% of GDP)
Real interest rate (%)
Interest rate spread (percentage points)
Infrastructure
Paved roads (% of total roads)Electr ic power consumption (kWh per capita)
Power outages in a typical month (number)
Mobile cellular subscriptions (per 100 people)
Internet users (per 100 people)
116 2011 The Little Data Book on Private Sector Development
Sub-Saharan Africa Low income
Country data
Low-incomegroup
2000 2009 2009
Kenya
31.4 39.8 846
14.3 18.7 384
9.8 .. ..
420 760 5092.2 4.4 5.4
32.4 22.6 26.1
16.9 15.3 24.4
11.6 8.7 12.4
50.7 62.1 49.5
10.0 9.2
76.2 77.4
21.6 25.2 23.2
31.7 38.3 35.9
.. 98
.. 33 41
.. 11 8
.. 47.0 71.0
.. 4.5 3.7
.. 49.7 76.5
.. 33.1 24.8.. 17.9
.. 0.9
.. 5.1
.. 32.3
.. 22.9
.. 40.5
.. 9.8
130 289 4,779
0.9 0.5 2.7
16.7 20.1 22.9
7.5 14.5 15.8
2.0 -5.5 -1.4
52.6 .. ..
33.8 40.4 31.832.0 38.2 30.6
12.9 12.7 ..
33.3 7.9 ..
28.4 31.5 26.3
15.3 7.6
14.2 8.8 11.5
12.1 14.1 12.0109 155 231
.. 6.9
0.4 48.7 26.6
0.3 10.0 2.7
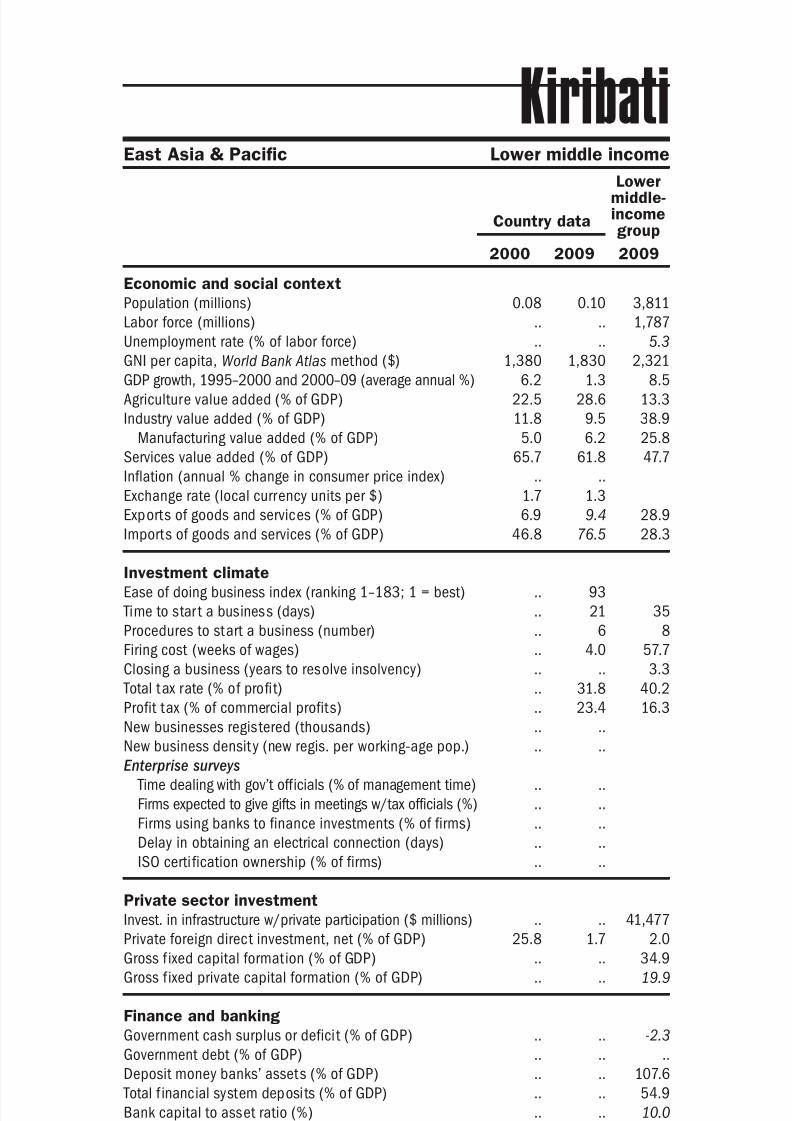
8/6/2019 The Little Data Book on Private Sector Development 2011
http://slidepdf.com/reader/full/the-little-data-book-on-private-sector-development-2011 125/246
Economic and social context
Population (millions)
Labor force (millions)
Unemployment rate (% of labor force)
GNI per capita, World Bank Atlas method ($)GDP growth, 1995–2000 and 2000–09 (average annual %)
Agriculture value added (% of GDP)
Industry value added (% of GDP)
Manufacturing value added (% of GDP)
Services value added (% of GDP)
Inflation (annual % change in consumer price index)
Exchange rate (local currency units per $)
Exports of goods and services (% of GDP)
Imports of goods and services (% of GDP) Investment climate
Ease of doing business index (ranking 1–183; 1 = best)
Time to star t a business (days)
Procedures to start a business (number)
Firing cost (weeks of wages)
Closing a business (years to resolve insolvency)
Total tax rate (% of profit)
Profit tax (% of commercial profits)New businesses registered (thousands)
New business density (new regis. per working-age pop.)
Enterprise surveys
Time dealing with gov’t officials (% of management time)
Firms expected to give gifts in meetings w/tax officials (%)
Firms using banks to finance investments (% of firms)
Delay in obtaining an electrical connection (days)
ISO certi fication ownership (% of firms)
Private sector investment
Invest. in infrastructure w/private participation ($ millions)
Private foreign direct investment, net (% of GDP)
Gross f ixed capital formation (% of GDP)
Gross f ixed private capital formation (% of GDP)
Finance and banking
Government cash surplus or deficit (% of GDP)
Government debt (% of GDP)
Deposit money banks’ assets (% of GDP) Total f inancial system deposits (% of GDP)
Bank capital to asset ratio (%)
Bank nonperforming loans to total gross loans ratio (%)
Domestic credit to the private sector (% of GDP)
Real interest rate (%)
Interest rate spread (percentage points)
Infrastructure
Paved roads (% of total roads)Electr ic power consumption (kWh per capita)
Power outages in a typical month (number)
Mobile cellular subscriptions (per 100 people)
Internet users (per 100 people)
117The Little Data Book on Private Sector Development 2011
Country data
Lowermiddle-incomegroup
2000 2009 2009
East Asia & Pacific Lower middle income
Kiribati
0.08 0.10 3,811
.. .. 1,787
.. .. 5.3
1,380 1,830 2,3216.2 1.3 8.5
22.5 28.6 13.3
11.8 9.5 38.9
5.0 6.2 25.8
65.7 61.8 47.7
.. ..
1.7 1.3
6.9 9.4 28.9
46.8 76.5 28.3
.. 93
.. 21 35
.. 6 8
.. 4.0 57.7
.. .. 3.3
.. 31.8 40.2
.. 23.4 16.3.. ..
.. ..
.. ..
.. ..
.. ..
.. ..
.. ..
.. .. 41,477
25.8 1.7 2.0
.. .. 34.9
.. .. 19.9
.. .. -2.3
.. .. ..
.. .. 107.6
.. .. 54.9
.. .. 10.0
.. .. 5.1
.. .. 92.9
.. ..
.. .. 7.3
.. .. 36.3
.. .. 1,318
.. ..
0.4 1.0 57.8
1.8 2.0 17.2
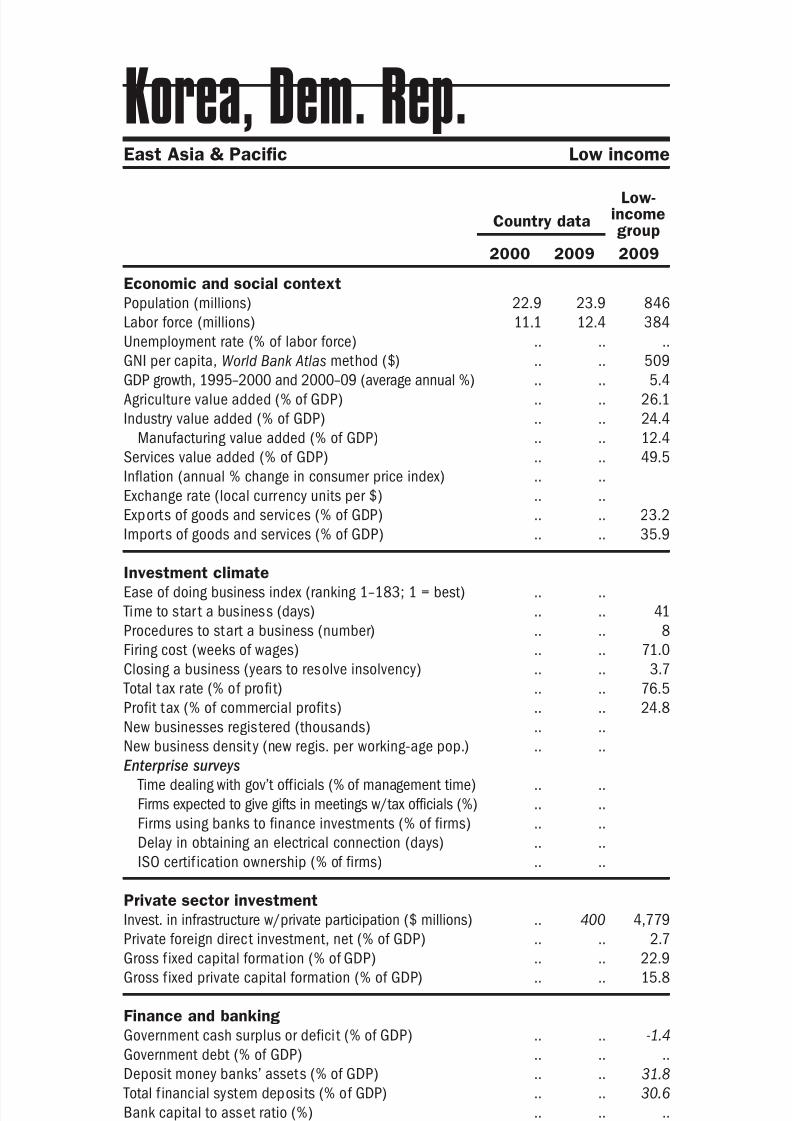
8/6/2019 The Little Data Book on Private Sector Development 2011
http://slidepdf.com/reader/full/the-little-data-book-on-private-sector-development-2011 126/246
Economic and social context
Population (millions)
Labor force (millions)
Unemployment rate (% of labor force)
GNI per capita, World Bank Atlas method ($)GDP growth, 1995–2000 and 2000–09 (average annual %)
Agriculture value added (% of GDP)
Industry value added (% of GDP)
Manufacturing value added (% of GDP)
Services value added (% of GDP)
Inflation (annual % change in consumer price index)
Exchange rate (local currency units per $)
Exports of goods and services (% of GDP)
Imports of goods and services (% of GDP) Investment climate
Ease of doing business index (ranking 1–183; 1 = best)
Time to star t a business (days)
Procedures to start a business (number)
Firing cost (weeks of wages)
Closing a business (years to resolve insolvency)
Total tax rate (% of profit)
Profit tax (% of commercial profits)New businesses registered (thousands)
New business density (new regis. per working-age pop.)
Enterprise surveys
Time dealing with gov’t officials (% of management time)
Firms expected to give gifts in meetings w/tax officials (%)
Firms using banks to finance investments (% of firms)
Delay in obtaining an electrical connection (days)
ISO certif ication ownership (% of firms)
Private sector investment
Invest. in infrastructure w/private participation ($ millions)
Private foreign direct investment, net (% of GDP)
Gross f ixed capital formation (% of GDP)
Gross f ixed private capital formation (% of GDP)
Finance and banking
Government cash surplus or deficit (% of GDP)
Government debt (% of GDP)
Deposit money banks’ assets (% of GDP) Total f inancial system deposits (% of GDP)
Bank capital to asset ratio (%)
Bank nonperforming loans to total gross loans ratio (%)
Domestic credit to the private sector (% of GDP)
Real interest rate (%)
Interest rate spread (percentage points)
Infrastructure
Paved roads (% of total roads)Electr ic power consumption (kWh per capita)
Power outages in a typical month (number)
Mobile cellular subscriptions (per 100 people)
Internet users (per 100 people)
118 2011 The Little Data Book on Private Sector Development
East Asia & Pacific Low income
Country data
Low-incomegroup
2000 2009 2009
Korea, Dem. Rep.
22.9 23.9 846
11.1 12.4 384
.. .. ..
.. .. 509
.. .. 5.4
.. .. 26.1
.. .. 24.4
.. .. 12.4
.. .. 49.5
.. ..
.. ..
.. .. 23.2
.. .. 35.9
.. ..
.. .. 41
.. .. 8
.. .. 71.0
.. .. 3.7
.. .. 76.5
.. .. 24.8.. ..
.. ..
.. ..
.. ..
.. ..
.. ..
.. ..
.. 400 4,779
.. .. 2.7
.. .. 22.9
.. .. 15.8
.. .. -1.4
.. .. ..
.. .. 31.8
.. .. 30.6
.. .. ..
.. .. ..
.. .. 26.3
.. ..
.. .. 11.5
6.4 2.8 12.0715 820 231
.. ..
0.0 0.3 26.6
0.0 0.0 2.7
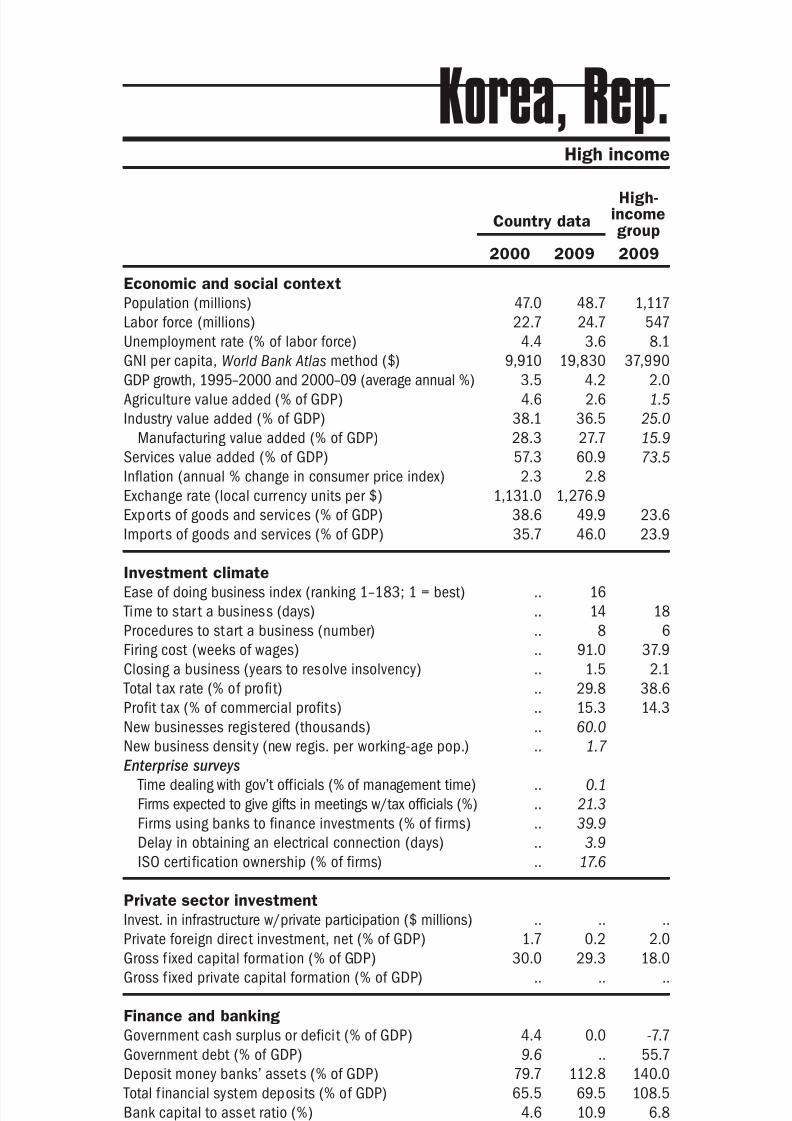
8/6/2019 The Little Data Book on Private Sector Development 2011
http://slidepdf.com/reader/full/the-little-data-book-on-private-sector-development-2011 127/246
Economic and social context
Population (millions)
Labor force (millions)
Unemployment rate (% of labor force)
GNI per capita, World Bank Atlas method ($)GDP growth, 1995–2000 and 2000–09 (average annual %)
Agriculture value added (% of GDP)
Industry value added (% of GDP)
Manufacturing value added (% of GDP)
Services value added (% of GDP)
Inflation (annual % change in consumer price index)
Exchange rate (local currency units per $)
Exports of goods and services (% of GDP)
Imports of goods and services (% of GDP) Investment climate
Ease of doing business index (ranking 1–183; 1 = best)
Time to star t a business (days)
Procedures to start a business (number)
Firing cost (weeks of wages)
Closing a business (years to resolve insolvency)
Total tax rate (% of profit)
Profit tax (% of commercial profits)New businesses registered (thousands)
New business density (new regis. per working-age pop.)
Enterprise surveys
Time dealing with gov’t officials (% of management time)
Firms expected to give gifts in meetings w/tax officials (%)
Firms using banks to finance investments (% of firms)
Delay in obtaining an electrical connection (days)
ISO certi fication ownership (% of firms)
Private sector investment
Invest. in infrastructure w/private participation ($ millions)
Private foreign direct investment, net (% of GDP)
Gross f ixed capital formation (% of GDP)
Gross f ixed private capital formation (% of GDP)
Finance and banking
Government cash surplus or deficit (% of GDP)
Government debt (% of GDP)
Deposit money banks’ assets (% of GDP) Total f inancial system deposits (% of GDP)
Bank capital to asset ratio (%)
Bank nonperforming loans to total gross loans ratio (%)
Domestic credit to the private sector (% of GDP)
Real interest rate (%)
Interest rate spread (percentage points)
Infrastructure
Paved roads (% of total roads)Electr ic power consumption (kWh per capita)
Power outages in a typical month (number)
Mobile cellular subscriptions (per 100 people)
Internet users (per 100 people)
119The Little Data Book on Private Sector Development 2011
Country data
High-incomegroup
2000 2009 2009
High income
Korea, Rep.
47.0 48.7 1,117
22.7 24.7 547
4.4 3.6 8.1
9,910 19,830 37,9903.5 4.2 2.0
4.6 2.6 1.5
38.1 36.5 25.0
28.3 27.7 15.9
57.3 60.9 73.5
2.3 2.8
1,131.0 1,276.9
38.6 49.9 23.6
35.7 46.0 23.9
.. 16
.. 14 18
.. 8 6
.. 91.0 37.9
.. 1.5 2.1
.. 29.8 38.6
.. 15.3 14.3.. 60.0
.. 1.7
.. 0.1
.. 21.3
.. 39.9
.. 3.9
.. 17.6
.. .. ..
1.7 0.2 2.0
30.0 29.3 18.0
.. .. ..
4.4 0.0 -7.7
9.6 .. 55.7
79.7 112.8 140.065.5 69.5 108.5
4.6 10.9 6.8
8.9 1.2 3.4
77.7 107.6 165.1
3.4 2.2
0.6 2.2 3.8
74.5 78.5 93.45,907 8,853 9,518
.. ..
57.0 98.4 111.2
40.5 80.9 72.3
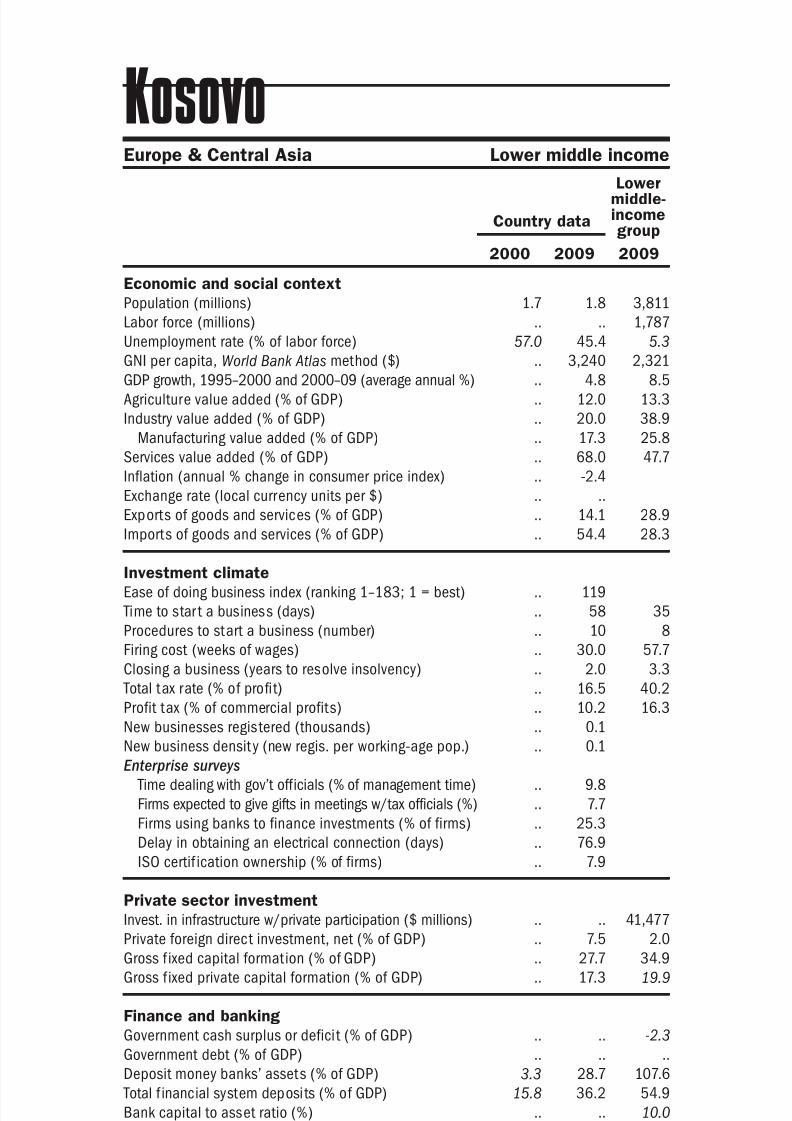
8/6/2019 The Little Data Book on Private Sector Development 2011
http://slidepdf.com/reader/full/the-little-data-book-on-private-sector-development-2011 128/246
Economic and social context
Population (millions)
Labor force (millions)
Unemployment rate (% of labor force)
GNI per capita, World Bank Atlas method ($)GDP growth, 1995–2000 and 2000–09 (average annual %)
Agriculture value added (% of GDP)
Industry value added (% of GDP)
Manufacturing value added (% of GDP)
Services value added (% of GDP)
Inflation (annual % change in consumer price index)
Exchange rate (local currency units per $)
Exports of goods and services (% of GDP)
Imports of goods and services (% of GDP) Investment climate
Ease of doing business index (ranking 1–183; 1 = best)
Time to star t a business (days)
Procedures to start a business (number)
Firing cost (weeks of wages)
Closing a business (years to resolve insolvency)
Total tax rate (% of profit)
Profit tax (% of commercial profits)New businesses registered (thousands)
New business density (new regis. per working-age pop.)
Enterprise surveys
Time dealing with gov’t officials (% of management time)
Firms expected to give gifts in meetings w/tax officials (%)
Firms using banks to finance investments (% of firms)
Delay in obtaining an electrical connection (days)
ISO certif ication ownership (% of firms)
Private sector investment
Invest. in infrastructure w/private participation ($ millions)
Private foreign direct investment, net (% of GDP)
Gross f ixed capital formation (% of GDP)
Gross f ixed private capital formation (% of GDP)
Finance and banking
Government cash surplus or deficit (% of GDP)
Government debt (% of GDP)
Deposit money banks’ assets (% of GDP) Total f inancial system deposits (% of GDP)
Bank capital to asset ratio (%)
Bank nonperforming loans to total gross loans ratio (%)
Domestic credit to the private sector (% of GDP)
Real interest rate (%)
Interest rate spread (percentage points)
Infrastructure
Paved roads (% of total roads)Electr ic power consumption (kWh per capita)
Power outages in a typical month (number)
Mobile cellular subscriptions (per 100 people)
Internet users (per 100 people)
120 2011 The Little Data Book on Private Sector Development
Country data
Lowermiddle-incomegroup
2000 2009 2009
Europe & Central Asia Lower middle income
Kosovo
1.7 1.8 3,811
.. .. 1,787
57.0 45.4 5.3
.. 3,240 2,321
.. 4.8 8.5
.. 12.0 13.3
.. 20.0 38.9
.. 17.3 25.8
.. 68.0 47.7
.. -2.4
.. ..
.. 14.1 28.9
.. 54.4 28.3
.. 119
.. 58 35
.. 10 8
.. 30.0 57.7
.. 2.0 3.3
.. 16.5 40.2
.. 10.2 16.3.. 0.1
.. 0.1
.. 9.8
.. 7.7
.. 25.3
.. 76.9
.. 7.9
.. .. 41,477
.. 7.5 2.0
.. 27.7 34.9
.. 17.3 19.9
.. .. -2.3
.. .. ..
3.3 28.7 107.615.8 36.2 54.9
.. .. 10.0
.. 4.4 5.1
0.9 36.1 92.9
.. 18.1
.. 10.1 7.3
.. .. 36.3
.. .. 1,318
.. 42.8
.. .. 57.8
.. .. 17.2

8/6/2019 The Little Data Book on Private Sector Development 2011
http://slidepdf.com/reader/full/the-little-data-book-on-private-sector-development-2011 129/246
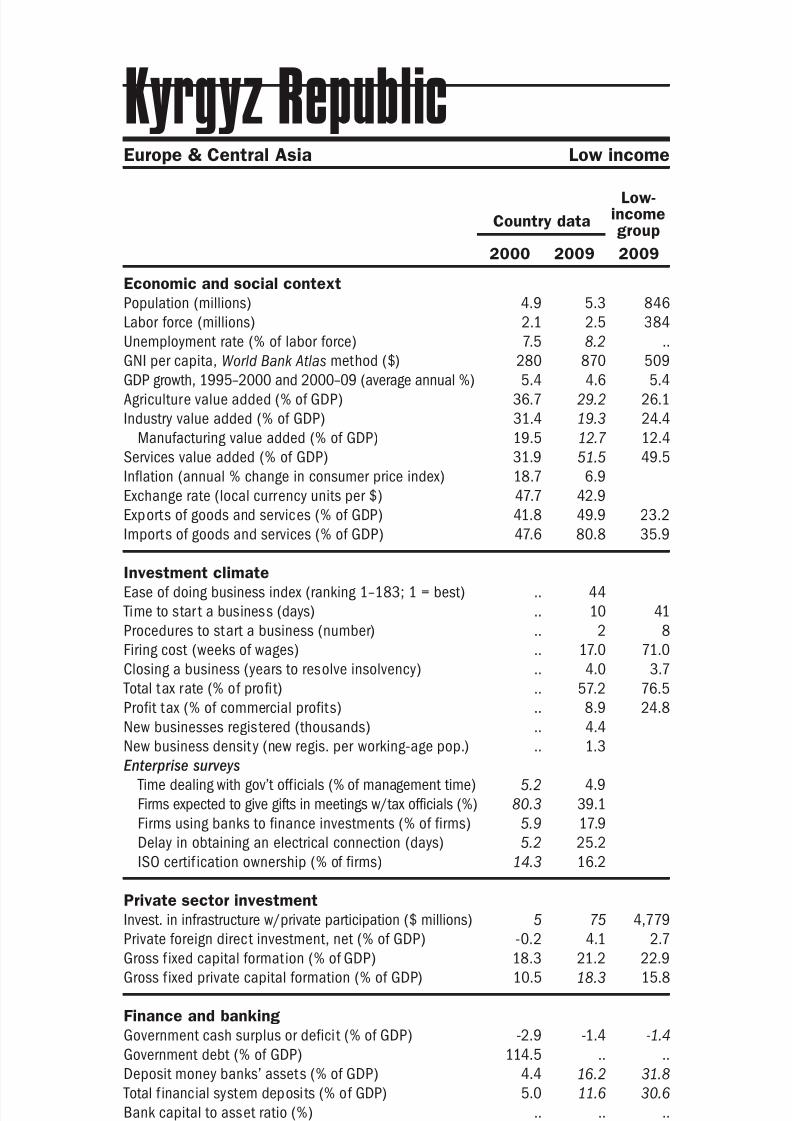
8/6/2019 The Little Data Book on Private Sector Development 2011
http://slidepdf.com/reader/full/the-little-data-book-on-private-sector-development-2011 130/246
Economic and social context
Population (millions)
Labor force (millions)
Unemployment rate (% of labor force)
GNI per capita, World Bank Atlas method ($)GDP growth, 1995–2000 and 2000–09 (average annual %)
Agriculture value added (% of GDP)
Industry value added (% of GDP)
Manufacturing value added (% of GDP)
Services value added (% of GDP)
Inflation (annual % change in consumer price index)
Exchange rate (local currency units per $)
Exports of goods and services (% of GDP)
Imports of goods and services (% of GDP) Investment climate
Ease of doing business index (ranking 1–183; 1 = best)
Time to star t a business (days)
Procedures to start a business (number)
Firing cost (weeks of wages)
Closing a business (years to resolve insolvency)
Total tax rate (% of profit)
Profit tax (% of commercial profits)New businesses registered (thousands)
New business density (new regis. per working-age pop.)
Enterprise surveys
Time dealing with gov’t officials (% of management time)
Firms expected to give gifts in meetings w/tax officials (%)
Firms using banks to finance investments (% of firms)
Delay in obtaining an electrical connection (days)
ISO certif ication ownership (% of firms)
Private sector investment
Invest. in infrastructure w/private participation ($ millions)
Private foreign direct investment, net (% of GDP)
Gross f ixed capital formation (% of GDP)
Gross f ixed private capital formation (% of GDP)
Finance and banking
Government cash surplus or deficit (% of GDP)
Government debt (% of GDP)
Deposit money banks’ assets (% of GDP) Total f inancial system deposits (% of GDP)
Bank capital to asset ratio (%)
Bank nonperforming loans to total gross loans ratio (%)
Domestic credit to the private sector (% of GDP)
Real interest rate (%)
Interest rate spread (percentage points)
Infrastructure
Paved roads (% of total roads)Electr ic power consumption (kWh per capita)
Power outages in a typical month (number)
Mobile cellular subscriptions (per 100 people)
Internet users (per 100 people)
122 2011 The Little Data Book on Private Sector Development
Kyrgyz Republic
Country data
Low-incomegroup
2000 2009 2009
Europe & Central Asia Low income
4.9 5.3 846
2.1 2.5 384
7.5 8.2 ..
280 870 5095.4 4.6 5.4
36.7 29.2 26.1
31.4 19.3 24.4
19.5 12.7 12.4
31.9 51.5 49.5
18.7 6.9
47.7 42.9
41.8 49.9 23.2
47.6 80.8 35.9
.. 44
.. 10 41
.. 2 8
.. 17.0 71.0
.. 4.0 3.7
.. 57.2 76.5
.. 8.9 24.8.. 4.4
.. 1.3
5.2 4.9
80.3 39.1
5.9 17.9
5.2 25.2
14.3 16.2
5 75 4,779
-0.2 4.1 2.7
18.3 21.2 22.9
10.5 18.3 15.8
-2.9 -1.4 -1.4
114.5 .. ..
4.4 16.2 31.85.0 11.6 30.6
.. .. ..
.. .. ..
4.2 15.1 26.3
19.5 20.5
33.5 19.2 11.5
91.1 .. 12.01,904 1,449 231
.. 5.7
0.2 84.3 26.6
1.0 41.2 2.7
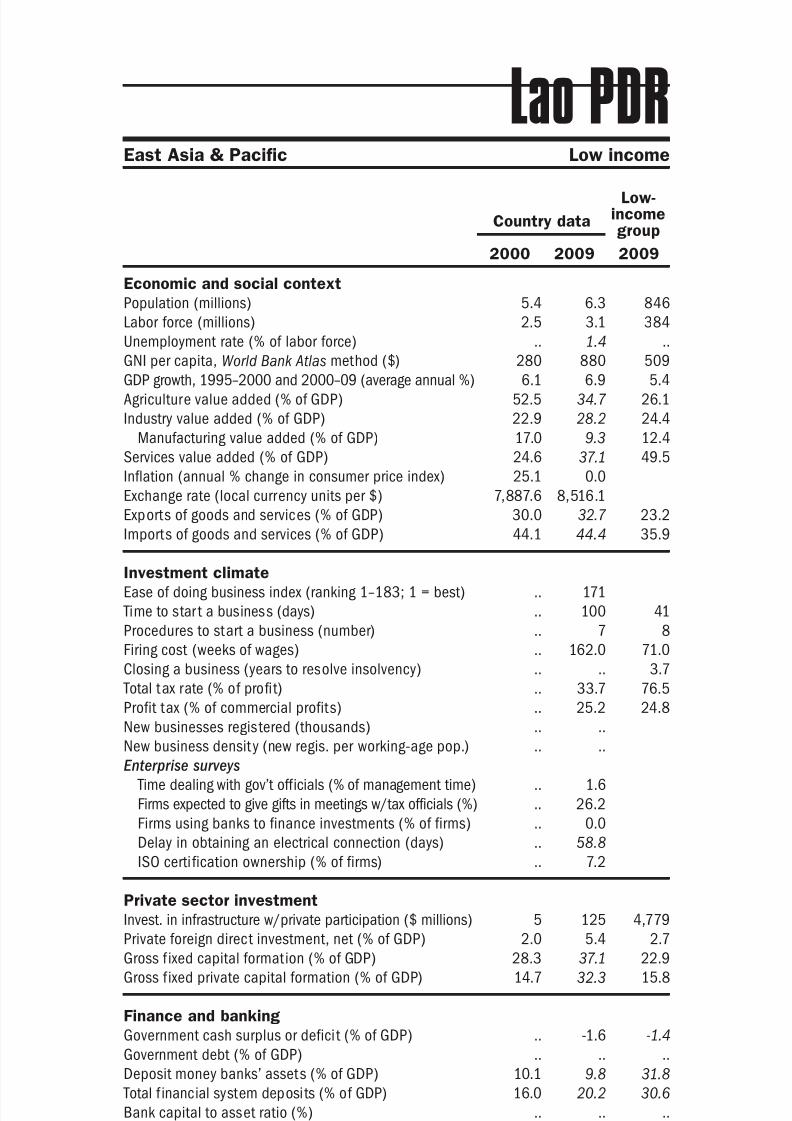
8/6/2019 The Little Data Book on Private Sector Development 2011
http://slidepdf.com/reader/full/the-little-data-book-on-private-sector-development-2011 131/246
Economic and social context
Population (millions)
Labor force (millions)
Unemployment rate (% of labor force)
GNI per capita, World Bank Atlas method ($)GDP growth, 1995–2000 and 2000–09 (average annual %)
Agriculture value added (% of GDP)
Industry value added (% of GDP)
Manufacturing value added (% of GDP)
Services value added (% of GDP)
Inflation (annual % change in consumer price index)
Exchange rate (local currency units per $)
Exports of goods and services (% of GDP)
Imports of goods and services (% of GDP) Investment climate
Ease of doing business index (ranking 1–183; 1 = best)
Time to star t a business (days)
Procedures to start a business (number)
Firing cost (weeks of wages)
Closing a business (years to resolve insolvency)
Total tax rate (% of profit)
Profit tax (% of commercial profits)New businesses registered (thousands)
New business density (new regis. per working-age pop.)
Enterprise surveys
Time dealing with gov’t officials (% of management time)
Firms expected to give gifts in meetings w/tax officials (%)
Firms using banks to finance investments (% of firms)
Delay in obtaining an electrical connection (days)
ISO certi fication ownership (% of firms)
Private sector investment
Invest. in infrastructure w/private participation ($ millions)
Private foreign direct investment, net (% of GDP)
Gross f ixed capital formation (% of GDP)
Gross f ixed private capital formation (% of GDP)
Finance and banking
Government cash surplus or deficit (% of GDP)
Government debt (% of GDP)
Deposit money banks’ assets (% of GDP) Total f inancial system deposits (% of GDP)
Bank capital to asset ratio (%)
Bank nonperforming loans to total gross loans ratio (%)
Domestic credit to the private sector (% of GDP)
Real interest rate (%)
Interest rate spread (percentage points)
Infrastructure
Paved roads (% of total roads)Electr ic power consumption (kWh per capita)
Power outages in a typical month (number)
Mobile cellular subscriptions (per 100 people)
Internet users (per 100 people)
123The Little Data Book on Private Sector Development 2011
Lao PDREast Asia & Pacific Low income
Country data
Low-incomegroup
2000 2009 2009
5.4 6.3 846
2.5 3.1 384
.. 1.4 ..
280 880 5096.1 6.9 5.4
52.5 34.7 26.1
22.9 28.2 24.4
17.0 9.3 12.4
24.6 37.1 49.5
25.1 0.0
7,887.6 8,516.1
30.0 32.7 23.2
44.1 44.4 35.9
.. 171
.. 100 41
.. 7 8
.. 162.0 71.0
.. .. 3.7
.. 33.7 76.5
.. 25.2 24.8.. ..
.. ..
.. 1.6
.. 26.2
.. 0.0
.. 58.8
.. 7.2
5 125 4,779
2.0 5.4 2.7
28.3 37.1 22.9
14.7 32.3 15.8
.. -1.6 -1.4
.. .. ..
10.1 9.8 31.816.0 20.2 30.6
.. .. ..
.. .. ..
8.9 9.5 26.3
5.5 14.4
20.0 19.3 11.5
14.1 13.5 12.0.. .. 231
.. 1.5
0.2 51.2 26.6
0.1 4.7 2.7
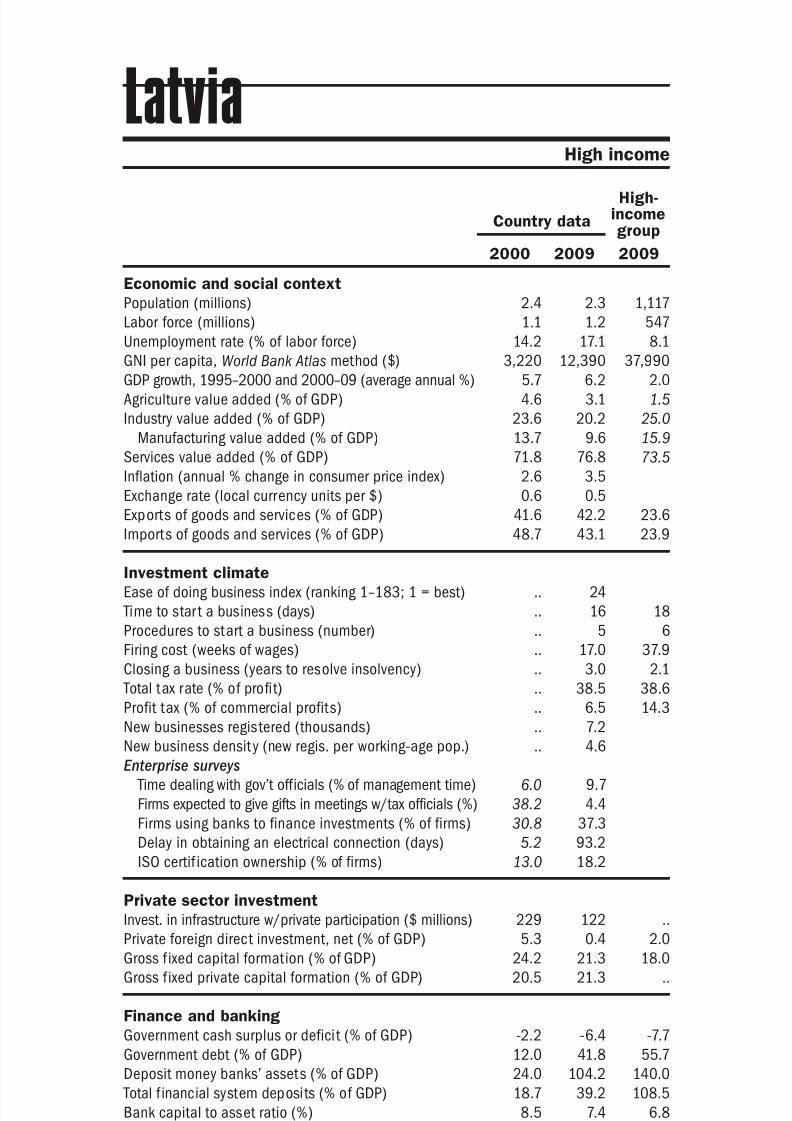
8/6/2019 The Little Data Book on Private Sector Development 2011
http://slidepdf.com/reader/full/the-little-data-book-on-private-sector-development-2011 132/246
Economic and social context
Population (millions)
Labor force (millions)
Unemployment rate (% of labor force)
GNI per capita, World Bank Atlas method ($)GDP growth, 1995–2000 and 2000–09 (average annual %)
Agriculture value added (% of GDP)
Industry value added (% of GDP)
Manufacturing value added (% of GDP)
Services value added (% of GDP)
Inflation (annual % change in consumer price index)
Exchange rate (local currency units per $)
Exports of goods and services (% of GDP)
Imports of goods and services (% of GDP) Investment climate
Ease of doing business index (ranking 1–183; 1 = best)
Time to star t a business (days)
Procedures to start a business (number)
Firing cost (weeks of wages)
Closing a business (years to resolve insolvency)
Total tax rate (% of profit)
Profit tax (% of commercial profits)New businesses registered (thousands)
New business density (new regis. per working-age pop.)
Enterprise surveys
Time dealing with gov’t officials (% of management time)
Firms expected to give gifts in meetings w/tax officials (%)
Firms using banks to finance investments (% of firms)
Delay in obtaining an electrical connection (days)
ISO certif ication ownership (% of firms)
Private sector investment
Invest. in infrastructure w/private participation ($ millions)
Private foreign direct investment, net (% of GDP)
Gross f ixed capital formation (% of GDP)
Gross f ixed private capital formation (% of GDP)
Finance and banking
Government cash surplus or deficit (% of GDP)
Government debt (% of GDP)
Deposit money banks’ assets (% of GDP) Total f inancial system deposits (% of GDP)
Bank capital to asset ratio (%)
Bank nonperforming loans to total gross loans ratio (%)
Domestic credit to the private sector (% of GDP)
Real interest rate (%)
Interest rate spread (percentage points)
Infrastructure
Paved roads (% of total roads)Electr ic power consumption (kWh per capita)
Power outages in a typical month (number)
Mobile cellular subscriptions (per 100 people)
Internet users (per 100 people)
124 2011 The Little Data Book on Private Sector Development
Latvia High income
Country data
High-incomegroup
2000 2009 2009
2.4 2.3 1,117
1.1 1.2 547
14.2 17.1 8.1
3,220 12,390 37,9905.7 6.2 2.0
4.6 3.1 1.5
23.6 20.2 25.0
13.7 9.6 15.9
71.8 76.8 73.5
2.6 3.5
0.6 0.5
41.6 42.2 23.6
48.7 43.1 23.9
.. 24
.. 16 18
.. 5 6
.. 17.0 37.9
.. 3.0 2.1
.. 38.5 38.6
.. 6.5 14.3.. 7.2
.. 4.6
6.0 9.7
38.2 4.4
30.8 37.3
5.2 93.2
13.0 18.2
229 122 ..
5.3 0.4 2.0
24.2 21.3 18.0
20.5 21.3 ..
-2.2 -6.4 -7.7
12.0 41.8 55.7
24.0 104.2 140.018.7 39.2 108.5
8.5 7.4 6.8
4.6 16.4 3.4
19.2 107.8 165.1
7.4 17.1
7.5 8.2 3.8
100.0 100.0 93.42,078 3,087 9,518
.. 0.7
16.9 99.5 111.2
6.3 66.7 72.3

8/6/2019 The Little Data Book on Private Sector Development 2011
http://slidepdf.com/reader/full/the-little-data-book-on-private-sector-development-2011 133/246
Economic and social context
Population (millions)
Labor force (millions)
Unemployment rate (% of labor force)
GNI per capita, World Bank Atlas method ($)GDP growth, 1995–2000 and 2000–09 (average annual %)
Agriculture value added (% of GDP)
Industry value added (% of GDP)
Manufacturing value added (% of GDP)
Services value added (% of GDP)
Inflation (annual % change in consumer price index)
Exchange rate (local currency units per $)
Exports of goods and services (% of GDP)
Imports of goods and services (% of GDP) Investment climate
Ease of doing business index (ranking 1–183; 1 = best)
Time to star t a business (days)
Procedures to start a business (number)
Firing cost (weeks of wages)
Closing a business (years to resolve insolvency)
Total tax rate (% of profit)
Profit tax (% of commercial profits)New businesses registered (thousands)
New business density (new regis. per working-age pop.)
Enterprise surveys
Time dealing with gov’t officials (% of management time)
Firms expected to give gifts in meetings w/tax officials (%)
Firms using banks to finance investments (% of firms)
Delay in obtaining an electrical connection (days)
ISO certi fication ownership (% of firms)
Private sector investment
Invest. in infrastructure w/private participation ($ millions)
Private foreign direct investment, net (% of GDP)
Gross f ixed capital formation (% of GDP)
Gross f ixed private capital formation (% of GDP)
Finance and banking
Government cash surplus or deficit (% of GDP)
Government debt (% of GDP)
Deposit money banks’ assets (% of GDP) Total f inancial system deposits (% of GDP)
Bank capital to asset ratio (%)
Bank nonperforming loans to total gross loans ratio (%)
Domestic credit to the private sector (% of GDP)
Real interest rate (%)
Interest rate spread (percentage points)
Infrastructure
Paved roads (% of total roads)Electr ic power consumption (kWh per capita)
Power outages in a typical month (number)
Mobile cellular subscriptions (per 100 people)
Internet users (per 100 people)
125The Little Data Book on Private Sector Development 2011
LebanonMiddle East & North Africa Upper middle income
Country data
Uppermiddle-incomegroup
2000 2009 2009
3.8 4.2 1,002
1.2 1.5 458
8.5 9.0 9.1
4,690 8,060 7,5021.2 4.6 4.4
7.1 5.3 6.2
22.8 16.5 31.5
13.0 8.8 16.7
70.1 78.2 62.4
.. 1.2
1,507.5 1,507.5
14.2 22.3 25.4
35.9 47.0 24.2
.. 113
.. 9 43
.. 5 8
.. 17.0 40.1
.. 4.0 2.9
.. 30.2 43.0
.. 6.1 18.0.. ..
.. ..
.. 8.9
.. 19.2
.. 23.8
.. 117.6
.. 17.9
196 3 64,899
7.0 13.9 2.4
21.0 29.2 20.7
16.6 27.6 15.6
-18.4 -8.3 -0.6
.. .. ..
174.9 152.7 60.6182.9 226.7 47.4
6.4 7.0 9.7
7.8 6.0 4.2
87.9 73.9 47.8
20.7 3.5
6.9 2.3 5.5
84.9 .. 36.82,081 2,267 3,001
.. 29.9
19.7 36.1 100.6
8.0 23.7 34.6
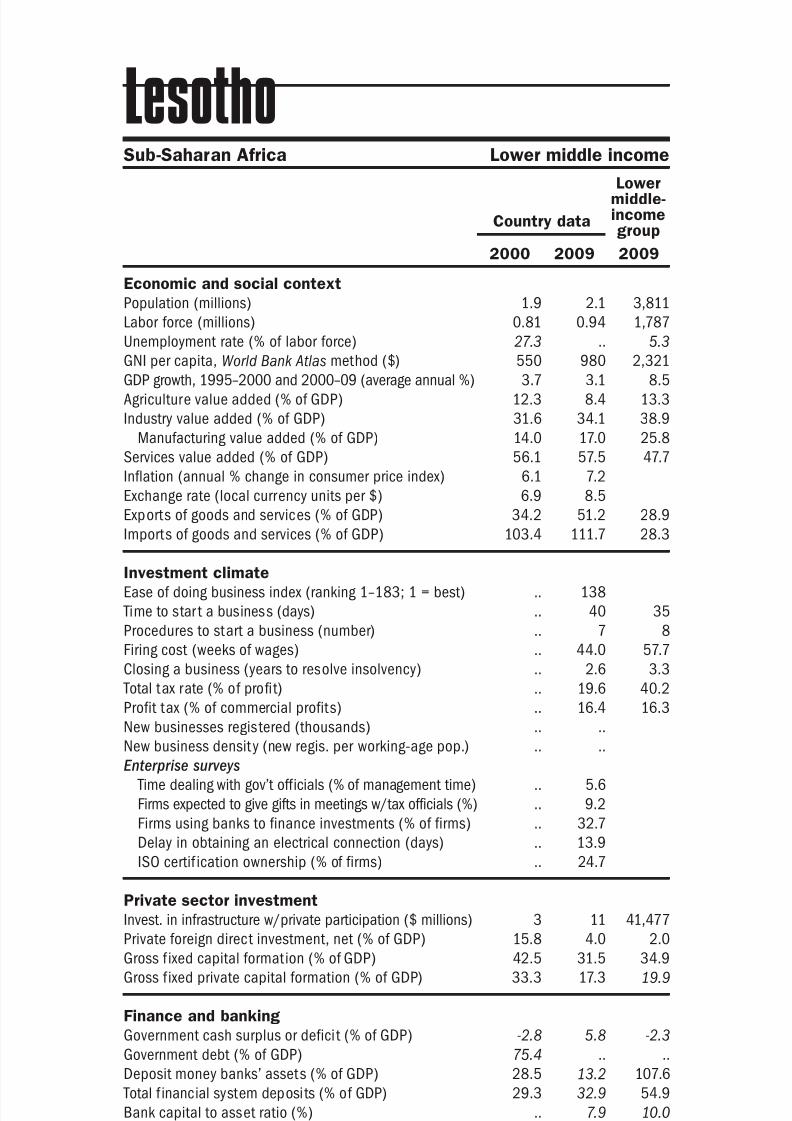
8/6/2019 The Little Data Book on Private Sector Development 2011
http://slidepdf.com/reader/full/the-little-data-book-on-private-sector-development-2011 134/246
Economic and social context
Population (millions)
Labor force (millions)
Unemployment rate (% of labor force)
GNI per capita, World Bank Atlas method ($)GDP growth, 1995–2000 and 2000–09 (average annual %)
Agriculture value added (% of GDP)
Industry value added (% of GDP)
Manufacturing value added (% of GDP)
Services value added (% of GDP)
Inflation (annual % change in consumer price index)
Exchange rate (local currency units per $)
Exports of goods and services (% of GDP)
Imports of goods and services (% of GDP) Investment climate
Ease of doing business index (ranking 1–183; 1 = best)
Time to star t a business (days)
Procedures to start a business (number)
Firing cost (weeks of wages)
Closing a business (years to resolve insolvency)
Total tax rate (% of profit)
Profit tax (% of commercial profits)New businesses registered (thousands)
New business density (new regis. per working-age pop.)
Enterprise surveys
Time dealing with gov’t officials (% of management time)
Firms expected to give gifts in meetings w/tax officials (%)
Firms using banks to finance investments (% of firms)
Delay in obtaining an electrical connection (days)
ISO certif ication ownership (% of firms)
Private sector investment
Invest. in infrastructure w/private participation ($ millions)
Private foreign direct investment, net (% of GDP)
Gross f ixed capital formation (% of GDP)
Gross f ixed private capital formation (% of GDP)
Finance and banking
Government cash surplus or deficit (% of GDP)
Government debt (% of GDP)
Deposit money banks’ assets (% of GDP) Total f inancial system deposits (% of GDP)
Bank capital to asset ratio (%)
Bank nonperforming loans to total gross loans ratio (%)
Domestic credit to the private sector (% of GDP)
Real interest rate (%)
Interest rate spread (percentage points)
Infrastructure
Paved roads (% of total roads)Electr ic power consumption (kWh per capita)
Power outages in a typical month (number)
Mobile cellular subscriptions (per 100 people)
Internet users (per 100 people)
126 2011 The Little Data Book on Private Sector Development
Lesotho
Country data
Lowermiddle-incomegroup
2000 2009 2009
Sub-Saharan Africa Lower middle income
1.9 2.1 3,811
0.81 0.94 1,787
27.3 .. 5.3
550 980 2,3213.7 3.1 8.5
12.3 8.4 13.3
31.6 34.1 38.9
14.0 17.0 25.8
56.1 57.5 47.7
6.1 7.2
6.9 8.5
34.2 51.2 28.9
103.4 111.7 28.3
.. 138
.. 40 35
.. 7 8
.. 44.0 57.7
.. 2.6 3.3
.. 19.6 40.2
.. 16.4 16.3.. ..
.. ..
.. 5.6
.. 9.2
.. 32.7
.. 13.9
.. 24.7
3 11 41,477
15.8 4.0 2.0
42.5 31.5 34.9
33.3 17.3 19.9
-2.8 5.8 -2.3
75.4 .. ..
28.5 13.2 107.629.3 32.9 54.9
.. 7.9 10.0
.. 4.0 5.1
16.4 13.5 92.9
14.4 9.2
12.2 8.2 7.3
18.3 .. 36.3.. .. 1,318
.. 6.8
1.1 32.0 57.8
0.2 3.7 17.2

8/6/2019 The Little Data Book on Private Sector Development 2011
http://slidepdf.com/reader/full/the-little-data-book-on-private-sector-development-2011 135/246
Economic and social context
Population (millions)
Labor force (millions)
Unemployment rate (% of labor force)
GNI per capita, World Bank Atlas method ($)GDP growth, 1995–2000 and 2000–09 (average annual %)
Agriculture value added (% of GDP)
Industry value added (% of GDP)
Manufacturing value added (% of GDP)
Services value added (% of GDP)
Inflation (annual % change in consumer price index)
Exchange rate (local currency units per $)
Exports of goods and services (% of GDP)
Imports of goods and services (% of GDP) Investment climate
Ease of doing business index (ranking 1–183; 1 = best)
Time to star t a business (days)
Procedures to start a business (number)
Firing cost (weeks of wages)
Closing a business (years to resolve insolvency)
Total tax rate (% of profit)
Profit tax (% of commercial profits)New businesses registered (thousands)
New business density (new regis. per working-age pop.)
Enterprise surveys
Time dealing with gov’t officials (% of management time)
Firms expected to give gifts in meetings w/tax officials (%)
Firms using banks to finance investments (% of firms)
Delay in obtaining an electrical connection (days)
ISO certi fication ownership (% of firms)
Private sector investment
Invest. in infrastructure w/private participation ($ millions)
Private foreign direct investment, net (% of GDP)
Gross f ixed capital formation (% of GDP)
Gross f ixed private capital formation (% of GDP)
Finance and banking
Government cash surplus or deficit (% of GDP)
Government debt (% of GDP)
Deposit money banks’ assets (% of GDP) Total f inancial system deposits (% of GDP)
Bank capital to asset ratio (%)
Bank nonperforming loans to total gross loans ratio (%)
Domestic credit to the private sector (% of GDP)
Real interest rate (%)
Interest rate spread (percentage points)
Infrastructure
Paved roads (% of total roads)Electr ic power consumption (kWh per capita)
Power outages in a typical month (number)
Mobile cellular subscriptions (per 100 people)
Internet users (per 100 people)
127The Little Data Book on Private Sector Development 2011
Sub-Saharan Africa Low income
Country data
Low-incomegroup
2000 2009 2009
Liberia
2.8 4.0 846
1.1 1.6 384
.. 5.6 ..
140 160 50938.9 0.0 5.4
72.0 61.3 26.1
11.6 16.8 24.4
9.5 12.7 12.4
16.4 21.9 49.5
.. ..
41.0 68.3
21.5 31.1 23.2
26.0 172.6 35.9
.. 155
.. 20 41
.. 5 8
.. 84.0 71.0
.. 3.0 3.7
.. 43.7 76.5
.. 0.0 24.8.. ..
.. ..
.. 7.5
.. 54.4
.. 10.1
.. ..
.. 2.4
.. 24 4,779
3.7 24.9 2.7
4.9 16.4 22.9
2.0 4.3 15.8
.. 0.0 -1.4
.. .. ..
.. .. 31.8
.. .. 30.6
.. .. ..
.. .. ..
3.1 16.1 26.3
22.1 6.3
14.3 10.1 11.5
6.2 .. 12.0.. .. 231
.. 5.4
0.1 21.3 26.6
0.0 0.5 2.7

8/6/2019 The Little Data Book on Private Sector Development 2011
http://slidepdf.com/reader/full/the-little-data-book-on-private-sector-development-2011 136/246
Economic and social context
Population (millions)
Labor force (millions)
Unemployment rate (% of labor force)
GNI per capita, World Bank Atlas method ($)GDP growth, 1995–2000 and 2000–09 (average annual %)
Agriculture value added (% of GDP)
Industry value added (% of GDP)
Manufacturing value added (% of GDP)
Services value added (% of GDP)
Inflation (annual % change in consumer price index)
Exchange rate (local currency units per $)
Exports of goods and services (% of GDP)
Imports of goods and services (% of GDP) Investment climate
Ease of doing business index (ranking 1–183; 1 = best)
Time to star t a business (days)
Procedures to start a business (number)
Firing cost (weeks of wages)
Closing a business (years to resolve insolvency)
Total tax rate (% of profit)
Profit tax (% of commercial profits)New businesses registered (thousands)
New business density (new regis. per working-age pop.)
Enterprise surveys
Time dealing with gov’t officials (% of management time)
Firms expected to give gifts in meetings w/tax officials (%)
Firms using banks to finance investments (% of firms)
Delay in obtaining an electrical connection (days)
ISO certif ication ownership (% of firms)
Private sector investment
Invest. in infrastructure w/private participation ($ millions)
Private foreign direct investment, net (% of GDP)
Gross f ixed capital formation (% of GDP)
Gross f ixed private capital formation (% of GDP)
Finance and banking
Government cash surplus or deficit (% of GDP)
Government debt (% of GDP)
Deposit money banks’ assets (% of GDP) Total f inancial system deposits (% of GDP)
Bank capital to asset ratio (%)
Bank nonperforming loans to total gross loans ratio (%)
Domestic credit to the private sector (% of GDP)
Real interest rate (%)
Interest rate spread (percentage points)
Infrastructure
Paved roads (% of total roads)Electr ic power consumption (kWh per capita)
Power outages in a typical month (number)
Mobile cellular subscriptions (per 100 people)
Internet users (per 100 people)
128 2011 The Little Data Book on Private Sector Development
Country data
Uppermiddle-incomegroup
2000 2009 2009
Middle East & North Africa Upper middle income
Libya
5.3 6.4 1,002
1.8 2.4 458
.. .. 9.1
4,610 12,020 7,502.. 5.4 4.4
5.2 1.9 6.2
66.1 78.2 31.5
3.1 4.5 16.7
28.7 19.9 62.4
-2.9 2.5
0.5 1.3
35.6 67.4 25.4
15.5 27.5 24.2
.. ..
.. .. 43
.. .. 8
.. .. 40.1
.. .. 2.9
.. .. 43.0
.. .. 18.0.. ..
.. ..
.. ..
.. ..
.. ..
.. ..
.. ..
.. .. 64,899
0.4 2.7 2.4
13.1 27.9 20.7
2.0 5.9 15.6
.. .. -0.6
.. .. ..
40.6 14.4 60.637.6 41.2 47.4
.. .. 9.7
.. .. 4.2
23.1 10.9 47.8
-9.6 57.8
4.0 3.5 5.5
57.2 .. 36.82,227 3,909 3,001
.. ..
0.7 77.9 100.6
0.2 5.5 34.6

8/6/2019 The Little Data Book on Private Sector Development 2011
http://slidepdf.com/reader/full/the-little-data-book-on-private-sector-development-2011 137/246
Economic and social context
Population (millions)
Labor force (millions)
Unemployment rate (% of labor force)
GNI per capita, World Bank Atlas method ($)GDP growth, 1995–2000 and 2000–09 (average annual %)
Agriculture value added (% of GDP)
Industry value added (% of GDP)
Manufacturing value added (% of GDP)
Services value added (% of GDP)
Inflation (annual % change in consumer price index)
Exchange rate (local currency units per $)
Exports of goods and services (% of GDP)
Imports of goods and services (% of GDP) Investment climate
Ease of doing business index (ranking 1–183; 1 = best)
Time to star t a business (days)
Procedures to start a business (number)
Firing cost (weeks of wages)
Closing a business (years to resolve insolvency)
Total tax rate (% of profit)
Profit tax (% of commercial profits)New businesses registered (thousands)
New business density (new regis. per working-age pop.)
Enterprise surveys
Time dealing with gov’t officials (% of management time)
Firms expected to give gifts in meetings w/tax officials (%)
Firms using banks to finance investments (% of firms)
Delay in obtaining an electrical connection (days)
ISO certi fication ownership (% of firms)
Private sector investment
Invest. in infrastructure w/private participation ($ millions)
Private foreign direct investment, net (% of GDP)
Gross f ixed capital formation (% of GDP)
Gross f ixed private capital formation (% of GDP)
Finance and banking
Government cash surplus or deficit (% of GDP)
Government debt (% of GDP)
Deposit money banks’ assets (% of GDP) Total f inancial system deposits (% of GDP)
Bank capital to asset ratio (%)
Bank nonperforming loans to total gross loans ratio (%)
Domestic credit to the private sector (% of GDP)
Real interest rate (%)
Interest rate spread (percentage points)
Infrastructure
Paved roads (% of total roads)Electr ic power consumption (kWh per capita)
Power outages in a typical month (number)
Mobile cellular subscriptions (per 100 people)
Internet users (per 100 people)
129The Little Data Book on Private Sector Development 2011
High income
Country data
High-incomegroup
2000 2009 2009
Liechtenstein
0.03 0.04 1,117
.. .. 547
.. .. 8.1
79,640 136,630 37,9907.5 2.5 2.0
.. .. 1.5
.. .. 25.0
.. .. 15.9
.. .. 73.5
.. ..
.. ..
.. .. 23.6
.. .. 23.9
.. ..
.. .. 18
.. .. 6
.. .. 37.9
.. .. 2.1
.. .. 38.6
.. .. 14.3.. 0.6
.. 25.1
.. ..
.. ..
.. ..
.. ..
.. ..
.. .. ..
.. .. 2.0
.. .. 18.0
.. .. ..
.. .. -7.7
.. .. 55.7
.. .. 140.0
.. .. 108.5
.. .. 6.8
.. .. 3.4
.. .. 165.1
.. ..
.. .. 3.8
.. .. 93.4
.. .. 9,518
.. ..
30.4 97.5 111.2
36.5 64.0 72.3
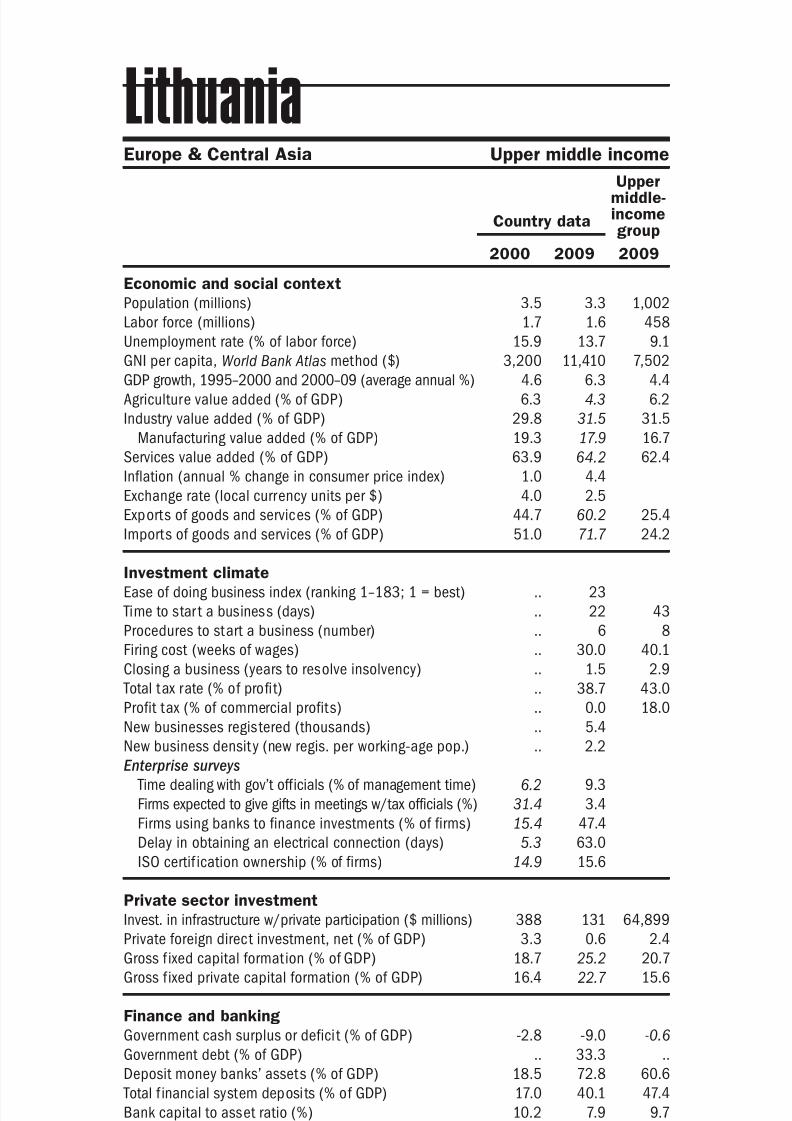
8/6/2019 The Little Data Book on Private Sector Development 2011
http://slidepdf.com/reader/full/the-little-data-book-on-private-sector-development-2011 138/246
Economic and social context
Population (millions)
Labor force (millions)
Unemployment rate (% of labor force)
GNI per capita, World Bank Atlas method ($)GDP growth, 1995–2000 and 2000–09 (average annual %)
Agriculture value added (% of GDP)
Industry value added (% of GDP)
Manufacturing value added (% of GDP)
Services value added (% of GDP)
Inflation (annual % change in consumer price index)
Exchange rate (local currency units per $)
Exports of goods and services (% of GDP)
Imports of goods and services (% of GDP) Investment climate
Ease of doing business index (ranking 1–183; 1 = best)
Time to star t a business (days)
Procedures to start a business (number)
Firing cost (weeks of wages)
Closing a business (years to resolve insolvency)
Total tax rate (% of profit)
Profit tax (% of commercial profits)New businesses registered (thousands)
New business density (new regis. per working-age pop.)
Enterprise surveys
Time dealing with gov’t officials (% of management time)
Firms expected to give gifts in meetings w/tax officials (%)
Firms using banks to finance investments (% of firms)
Delay in obtaining an electrical connection (days)
ISO certif ication ownership (% of firms)
Private sector investment
Invest. in infrastructure w/private participation ($ millions)
Private foreign direct investment, net (% of GDP)
Gross f ixed capital formation (% of GDP)
Gross f ixed private capital formation (% of GDP)
Finance and banking
Government cash surplus or deficit (% of GDP)
Government debt (% of GDP)
Deposit money banks’ assets (% of GDP) Total f inancial system deposits (% of GDP)
Bank capital to asset ratio (%)
Bank nonperforming loans to total gross loans ratio (%)
Domestic credit to the private sector (% of GDP)
Real interest rate (%)
Interest rate spread (percentage points)
Infrastructure
Paved roads (% of total roads)Electr ic power consumption (kWh per capita)
Power outages in a typical month (number)
Mobile cellular subscriptions (per 100 people)
Internet users (per 100 people)
130 2011 The Little Data Book on Private Sector Development
Europe & Central Asia Upper middle income
Country data
Uppermiddle-incomegroup
2000 2009 2009
Lithuania
3.5 3.3 1,002
1.7 1.6 458
15.9 13.7 9.1
3,200 11,410 7,5024.6 6.3 4.4
6.3 4.3 6.2
29.8 31.5 31.5
19.3 17.9 16.7
63.9 64.2 62.4
1.0 4.4
4.0 2.5
44.7 60.2 25.4
51.0 71.7 24.2
.. 23
.. 22 43
.. 6 8
.. 30.0 40.1
.. 1.5 2.9
.. 38.7 43.0
.. 0.0 18.0.. 5.4
.. 2.2
6.2 9.3
31.4 3.4
15.4 47.4
5.3 63.0
14.9 15.6
388 131 64,899
3.3 0.6 2.4
18.7 25.2 20.7
16.4 22.7 15.6
-2.8 -9.0 -0.6
.. 33.3 ..
18.5 72.8 60.617.0 40.1 47.4
10.2 7.9 9.7
11.3 19.3 4.2
13.2 70.9 47.8
11.1 10.8
8.3 3.6 5.5
.. 28.6 36.82,517 3,557 3,001
.. 1.1
15.0 148.6 100.6
6.4 58.8 34.6
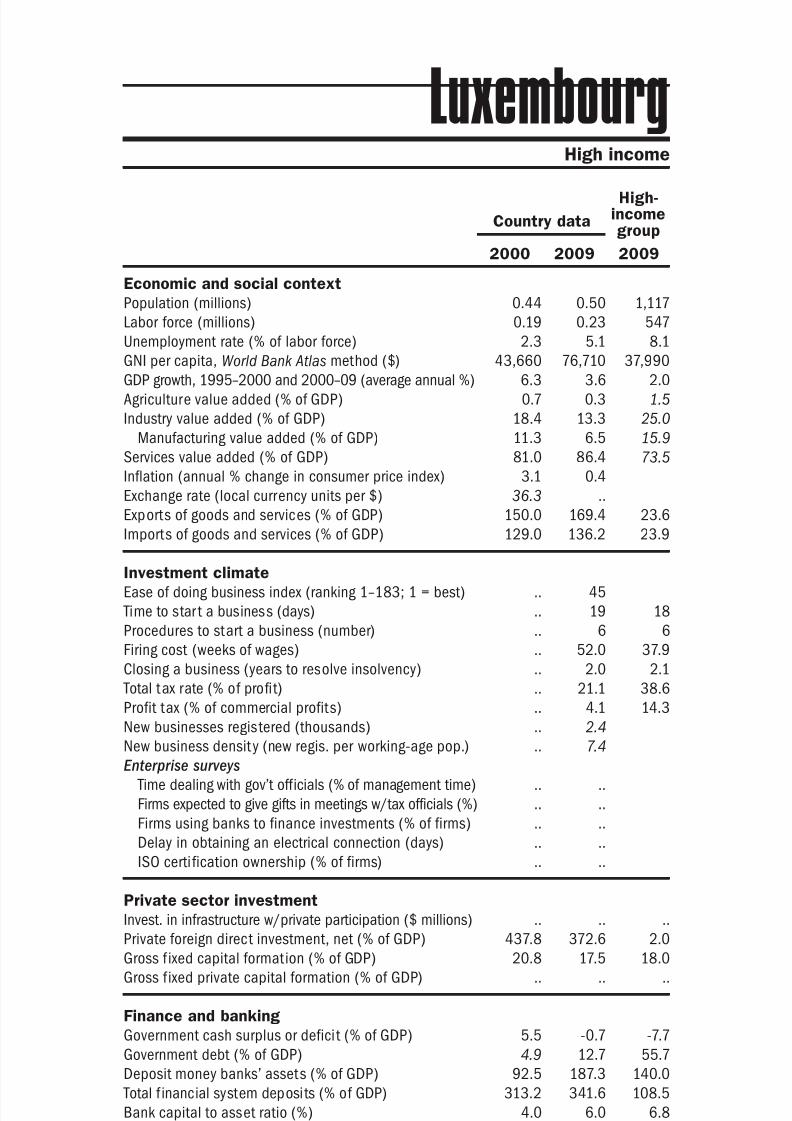
8/6/2019 The Little Data Book on Private Sector Development 2011
http://slidepdf.com/reader/full/the-little-data-book-on-private-sector-development-2011 139/246
Economic and social context
Population (millions)
Labor force (millions)
Unemployment rate (% of labor force)
GNI per capita, World Bank Atlas method ($)GDP growth, 1995–2000 and 2000–09 (average annual %)
Agriculture value added (% of GDP)
Industry value added (% of GDP)
Manufacturing value added (% of GDP)
Services value added (% of GDP)
Inflation (annual % change in consumer price index)
Exchange rate (local currency units per $)
Exports of goods and services (% of GDP)
Imports of goods and services (% of GDP) Investment climate
Ease of doing business index (ranking 1–183; 1 = best)
Time to star t a business (days)
Procedures to start a business (number)
Firing cost (weeks of wages)
Closing a business (years to resolve insolvency)
Total tax rate (% of profit)
Profit tax (% of commercial profits)New businesses registered (thousands)
New business density (new regis. per working-age pop.)
Enterprise surveys
Time dealing with gov’t officials (% of management time)
Firms expected to give gifts in meetings w/tax officials (%)
Firms using banks to finance investments (% of firms)
Delay in obtaining an electrical connection (days)
ISO certi fication ownership (% of firms)
Private sector investment
Invest. in infrastructure w/private participation ($ millions)
Private foreign direct investment, net (% of GDP)
Gross f ixed capital formation (% of GDP)
Gross f ixed private capital formation (% of GDP)
Finance and banking
Government cash surplus or deficit (% of GDP)
Government debt (% of GDP)
Deposit money banks’ assets (% of GDP) Total f inancial system deposits (% of GDP)
Bank capital to asset ratio (%)
Bank nonperforming loans to total gross loans ratio (%)
Domestic credit to the private sector (% of GDP)
Real interest rate (%)
Interest rate spread (percentage points)
Infrastructure
Paved roads (% of total roads)Electr ic power consumption (kWh per capita)
Power outages in a typical month (number)
Mobile cellular subscriptions (per 100 people)
Internet users (per 100 people)
131The Little Data Book on Private Sector Development 2011
Country data
High-incomegroup
2000 2009 2009
High income
Luxembourg
0.44 0.50 1,117
0.19 0.23 547
2.3 5.1 8.1
43,660 76,710 37,9906.3 3.6 2.0
0.7 0.3 1.5
18.4 13.3 25.0
11.3 6.5 15.9
81.0 86.4 73.5
3.1 0.4
36.3 ..
150.0 169.4 23.6
129.0 136.2 23.9
.. 45
.. 19 18
.. 6 6
.. 52.0 37.9
.. 2.0 2.1
.. 21.1 38.6
.. 4.1 14.3.. 2.4
.. 7.4
.. ..
.. ..
.. ..
.. ..
.. ..
.. .. ..
437.8 372.6 2.0
20.8 17.5 18.0
.. .. ..
5.5 -0.7 -7.7
4.9 12.7 55.7
92.5 187.3 140.0313.2 341.6 108.5
4.0 6.0 6.8
0.5 1.3 3.4
102.2 186.0 165.1
5.7 ..
2.0 .. 3.8
100.0 100.0 93.415,485 15,895 9,518
.. ..
69.5 144.4 111.2
22.9 85.3 72.3
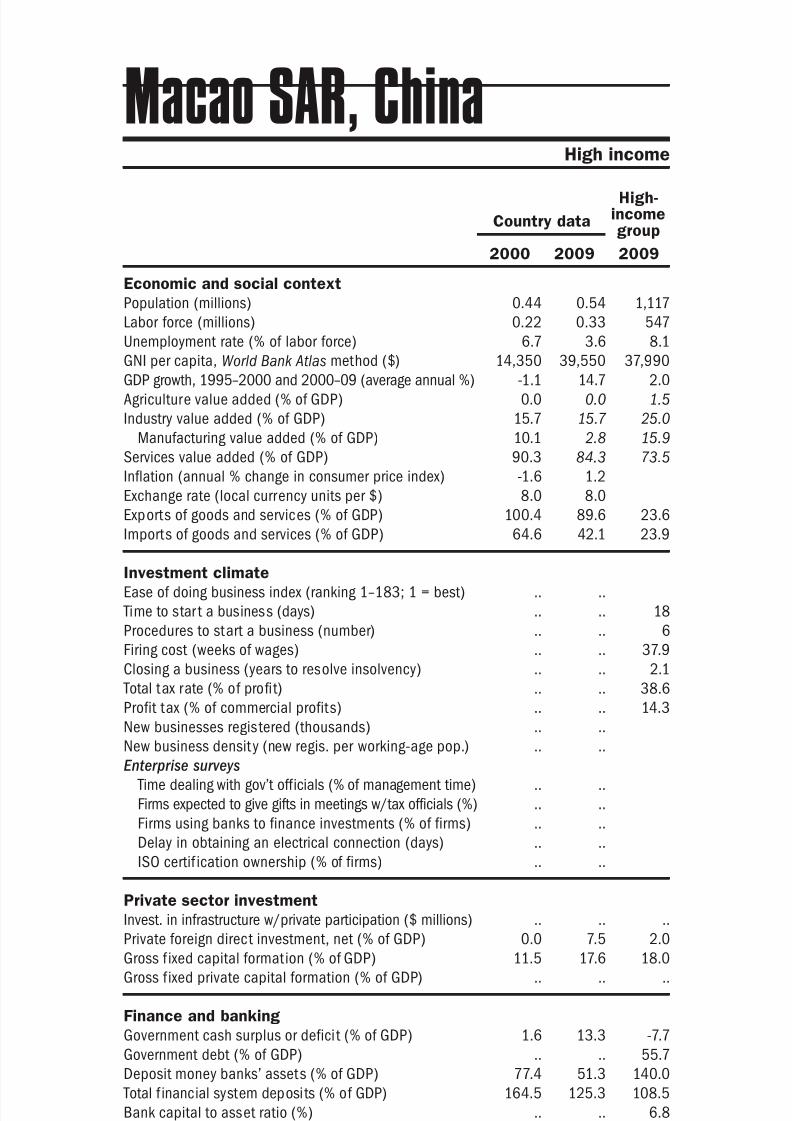
8/6/2019 The Little Data Book on Private Sector Development 2011
http://slidepdf.com/reader/full/the-little-data-book-on-private-sector-development-2011 140/246
Economic and social context
Population (millions)
Labor force (millions)
Unemployment rate (% of labor force)
GNI per capita, World Bank Atlas method ($)GDP growth, 1995–2000 and 2000–09 (average annual %)
Agriculture value added (% of GDP)
Industry value added (% of GDP)
Manufacturing value added (% of GDP)
Services value added (% of GDP)
Inflation (annual % change in consumer price index)
Exchange rate (local currency units per $)
Exports of goods and services (% of GDP)
Imports of goods and services (% of GDP) Investment climate
Ease of doing business index (ranking 1–183; 1 = best)
Time to star t a business (days)
Procedures to start a business (number)
Firing cost (weeks of wages)
Closing a business (years to resolve insolvency)
Total tax rate (% of profit)
Profit tax (% of commercial profits)New businesses registered (thousands)
New business density (new regis. per working-age pop.)
Enterprise surveys
Time dealing with gov’t officials (% of management time)
Firms expected to give gifts in meetings w/tax officials (%)
Firms using banks to finance investments (% of firms)
Delay in obtaining an electrical connection (days)
ISO certif ication ownership (% of firms)
Private sector investment
Invest. in infrastructure w/private participation ($ millions)
Private foreign direct investment, net (% of GDP)
Gross f ixed capital formation (% of GDP)
Gross f ixed private capital formation (% of GDP)
Finance and banking
Government cash surplus or deficit (% of GDP)
Government debt (% of GDP)
Deposit money banks’ assets (% of GDP) Total f inancial system deposits (% of GDP)
Bank capital to asset ratio (%)
Bank nonperforming loans to total gross loans ratio (%)
Domestic credit to the private sector (% of GDP)
Real interest rate (%)
Interest rate spread (percentage points)
Infrastructure
Paved roads (% of total roads)Electr ic power consumption (kWh per capita)
Power outages in a typical month (number)
Mobile cellular subscriptions (per 100 people)
Internet users (per 100 people)
132 2011 The Little Data Book on Private Sector Development
Country data
High-incomegroup
2000 2009 2009
High income
Macao SAR, China
0.44 0.54 1,117
0.22 0.33 547
6.7 3.6 8.1
14,350 39,550 37,990-1.1 14.7 2.0
0.0 0.0 1.5
15.7 15.7 25.0
10.1 2.8 15.9
90.3 84.3 73.5
-1.6 1.2
8.0 8.0
100.4 89.6 23.6
64.6 42.1 23.9
.. ..
.. .. 18
.. .. 6
.. .. 37.9
.. .. 2.1
.. .. 38.6
.. .. 14.3.. ..
.. ..
.. ..
.. ..
.. ..
.. ..
.. ..
.. .. ..
0.0 7.5 2.0
11.5 17.6 18.0
.. .. ..
1.6 13.3 -7.7
.. .. 55.7
77.4 51.3 140.0164.5 125.3 108.5
.. .. 6.8
.. .. 3.4
79.9 57.0 165.1
12.2 6.3
4.6 5.2 3.8
100.0 100.0 93.4.. .. 9,518
.. ..
32.0 192.8 111.2
13.6 52.2 72.3
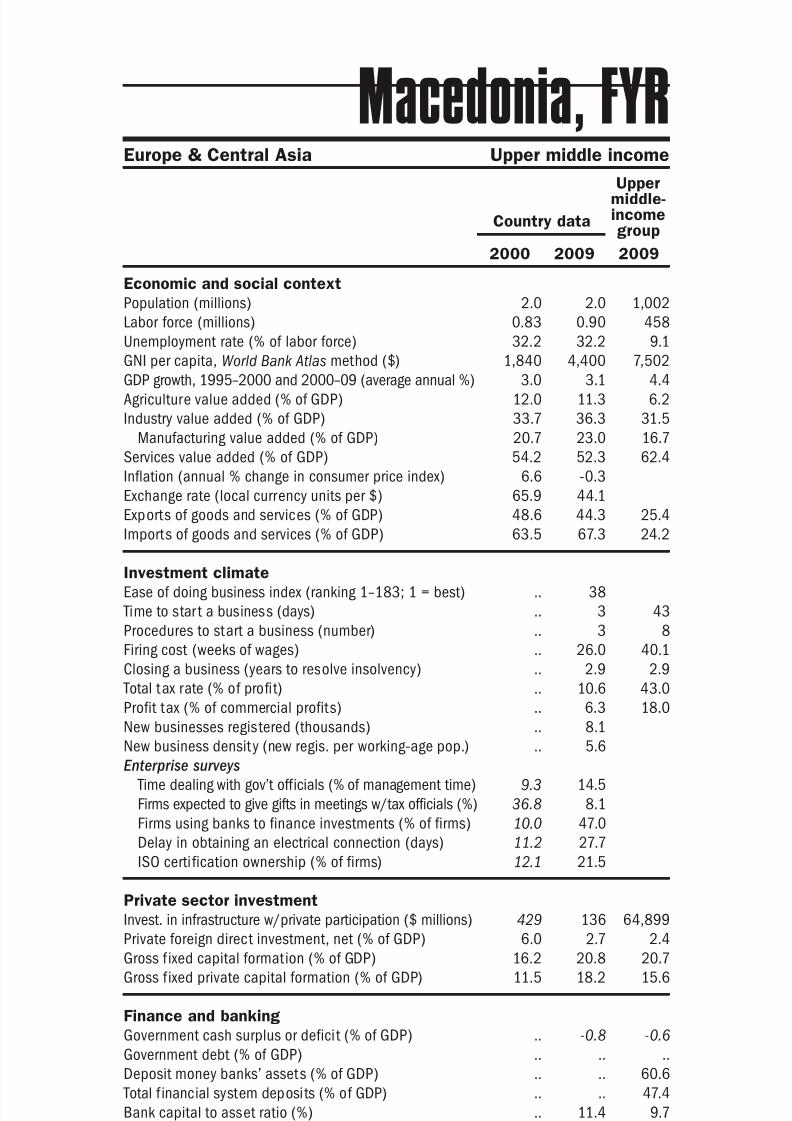
8/6/2019 The Little Data Book on Private Sector Development 2011
http://slidepdf.com/reader/full/the-little-data-book-on-private-sector-development-2011 141/246
Economic and social context
Population (millions)
Labor force (millions)
Unemployment rate (% of labor force)
GNI per capita, World Bank Atlas method ($)GDP growth, 1995–2000 and 2000–09 (average annual %)
Agriculture value added (% of GDP)
Industry value added (% of GDP)
Manufacturing value added (% of GDP)
Services value added (% of GDP)
Inflation (annual % change in consumer price index)
Exchange rate (local currency units per $)
Exports of goods and services (% of GDP)
Imports of goods and services (% of GDP) Investment climate
Ease of doing business index (ranking 1–183; 1 = best)
Time to star t a business (days)
Procedures to start a business (number)
Firing cost (weeks of wages)
Closing a business (years to resolve insolvency)
Total tax rate (% of profit)
Profit tax (% of commercial profits)New businesses registered (thousands)
New business density (new regis. per working-age pop.)
Enterprise surveys
Time dealing with gov’t officials (% of management time)
Firms expected to give gifts in meetings w/tax officials (%)
Firms using banks to finance investments (% of firms)
Delay in obtaining an electrical connection (days)
ISO certi fication ownership (% of firms)
Private sector investment
Invest. in infrastructure w/private participation ($ millions)
Private foreign direct investment, net (% of GDP)
Gross f ixed capital formation (% of GDP)
Gross f ixed private capital formation (% of GDP)
Finance and banking
Government cash surplus or deficit (% of GDP)
Government debt (% of GDP)
Deposit money banks’ assets (% of GDP) Total f inancial system deposits (% of GDP)
Bank capital to asset ratio (%)
Bank nonperforming loans to total gross loans ratio (%)
Domestic credit to the private sector (% of GDP)
Real interest rate (%)
Interest rate spread (percentage points)
Infrastructure
Paved roads (% of total roads)Electr ic power consumption (kWh per capita)
Power outages in a typical month (number)
Mobile cellular subscriptions (per 100 people)
Internet users (per 100 people)
133The Little Data Book on Private Sector Development 2011
Europe & Central Asia Upper middle income
Country data
Uppermiddle-incomegroup
2000 2009 2009
Macedonia, FYR
2.0 2.0 1,002
0.83 0.90 458
32.2 32.2 9.1
1,840 4,400 7,5023.0 3.1 4.4
12.0 11.3 6.2
33.7 36.3 31.5
20.7 23.0 16.7
54.2 52.3 62.4
6.6 -0.3
65.9 44.1
48.6 44.3 25.4
63.5 67.3 24.2
.. 38
.. 3 43
.. 3 8
.. 26.0 40.1
.. 2.9 2.9
.. 10.6 43.0
.. 6.3 18.0.. 8.1
.. 5.6
9.3 14.5
36.8 8.1
10.0 47.0
11.2 27.7
12.1 21.5
429 136 64,899
6.0 2.7 2.4
16.2 20.8 20.7
11.5 18.2 15.6
.. -0.8 -0.6
.. .. ..
.. .. 60.6
.. .. 47.4
.. 11.4 9.7
23.1 8.9 4.2
17.8 44.3 47.8
9.9 7.1
7.7 3.0 5.5
63.8 56.5 36.82,929 3,723 3,001
.. 2.2
5.8 95.1 100.6
2.5 51.8 34.6
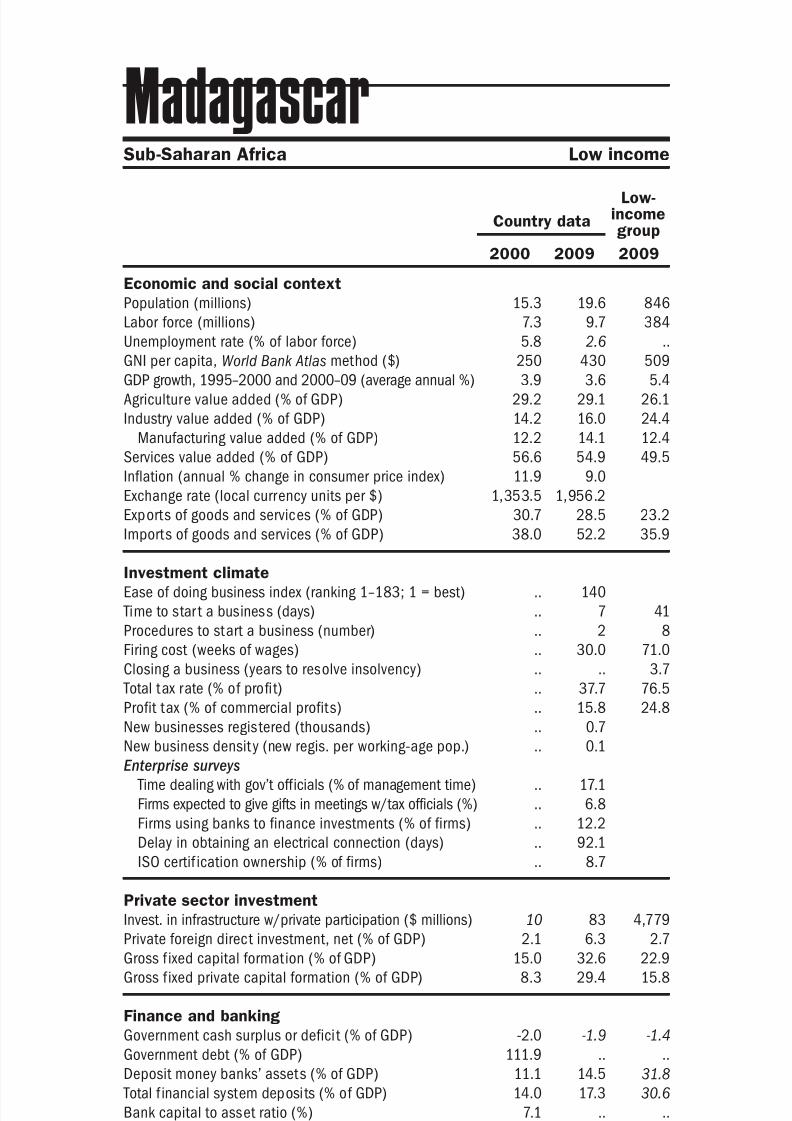
8/6/2019 The Little Data Book on Private Sector Development 2011
http://slidepdf.com/reader/full/the-little-data-book-on-private-sector-development-2011 142/246
Economic and social context
Population (millions)
Labor force (millions)
Unemployment rate (% of labor force)
GNI per capita, World Bank Atlas method ($)GDP growth, 1995–2000 and 2000–09 (average annual %)
Agriculture value added (% of GDP)
Industry value added (% of GDP)
Manufacturing value added (% of GDP)
Services value added (% of GDP)
Inflation (annual % change in consumer price index)
Exchange rate (local currency units per $)
Exports of goods and services (% of GDP)
Imports of goods and services (% of GDP) Investment climate
Ease of doing business index (ranking 1–183; 1 = best)
Time to star t a business (days)
Procedures to start a business (number)
Firing cost (weeks of wages)
Closing a business (years to resolve insolvency)
Total tax rate (% of profit)
Profit tax (% of commercial profits)New businesses registered (thousands)
New business density (new regis. per working-age pop.)
Enterprise surveys
Time dealing with gov’t officials (% of management time)
Firms expected to give gifts in meetings w/tax officials (%)
Firms using banks to finance investments (% of firms)
Delay in obtaining an electrical connection (days)
ISO certif ication ownership (% of firms)
Private sector investment
Invest. in infrastructure w/private participation ($ millions)
Private foreign direct investment, net (% of GDP)
Gross f ixed capital formation (% of GDP)
Gross f ixed private capital formation (% of GDP)
Finance and banking
Government cash surplus or deficit (% of GDP)
Government debt (% of GDP)
Deposit money banks’ assets (% of GDP) Total f inancial system deposits (% of GDP)
Bank capital to asset ratio (%)
Bank nonperforming loans to total gross loans ratio (%)
Domestic credit to the private sector (% of GDP)
Real interest rate (%)
Interest rate spread (percentage points)
Infrastructure
Paved roads (% of total roads)Electr ic power consumption (kWh per capita)
Power outages in a typical month (number)
Mobile cellular subscriptions (per 100 people)
Internet users (per 100 people)
134 2011 The Little Data Book on Private Sector Development
Country data
Low-incomegroup
2000 2009 2009
Sub-Saharan Africa Low income
Madagascar
15.3 19.6 846
7.3 9.7 384
5.8 2.6 ..
250 430 5093.9 3.6 5.4
29.2 29.1 26.1
14.2 16.0 24.4
12.2 14.1 12.4
56.6 54.9 49.5
11.9 9.0
1,353.5 1,956.2
30.7 28.5 23.2
38.0 52.2 35.9
.. 140
.. 7 41
.. 2 8
.. 30.0 71.0
.. .. 3.7
.. 37.7 76.5
.. 15.8 24.8.. 0.7
.. 0.1
.. 17.1
.. 6.8
.. 12.2
.. 92.1
.. 8.7
10 83 4,779
2.1 6.3 2.7
15.0 32.6 22.9
8.3 29.4 15.8
-2.0 -1.9 -1.4
111.9 .. ..
11.1 14.5 31.814.0 17.3 30.6
7.1 .. ..
8.6 .. ..
8.8 11.5 26.3
18.0 33.8
11.5 33.5 11.5
11.6 .. 12.0.. .. 231
.. 13.6
0.4 30.6 26.6
0.2 1.6 2.7

8/6/2019 The Little Data Book on Private Sector Development 2011
http://slidepdf.com/reader/full/the-little-data-book-on-private-sector-development-2011 143/246
Economic and social context
Population (millions)
Labor force (millions)
Unemployment rate (% of labor force)
GNI per capita, World Bank Atlas method ($)GDP growth, 1995–2000 and 2000–09 (average annual %)
Agriculture value added (% of GDP)
Industry value added (% of GDP)
Manufacturing value added (% of GDP)
Services value added (% of GDP)
Inflation (annual % change in consumer price index)
Exchange rate (local currency units per $)
Exports of goods and services (% of GDP)
Imports of goods and services (% of GDP) Investment climate
Ease of doing business index (ranking 1–183; 1 = best)
Time to star t a business (days)
Procedures to start a business (number)
Firing cost (weeks of wages)
Closing a business (years to resolve insolvency)
Total tax rate (% of profit)
Profit tax (% of commercial profits)New businesses registered (thousands)
New business density (new regis. per working-age pop.)
Enterprise surveys
Time dealing with gov’t officials (% of management time)
Firms expected to give gifts in meetings w/tax officials (%)
Firms using banks to finance investments (% of firms)
Delay in obtaining an electrical connection (days)
ISO certi fication ownership (% of firms)
Private sector investment
Invest. in infrastructure w/private participation ($ millions)
Private foreign direct investment, net (% of GDP)
Gross f ixed capital formation (% of GDP)
Gross f ixed private capital formation (% of GDP)
Finance and banking
Government cash surplus or deficit (% of GDP)
Government debt (% of GDP)
Deposit money banks’ assets (% of GDP) Total f inancial system deposits (% of GDP)
Bank capital to asset ratio (%)
Bank nonperforming loans to total gross loans ratio (%)
Domestic credit to the private sector (% of GDP)
Real interest rate (%)
Interest rate spread (percentage points)
Infrastructure
Paved roads (% of total roads)Electr ic power consumption (kWh per capita)
Power outages in a typical month (number)
Mobile cellular subscriptions (per 100 people)
Internet users (per 100 people)
135The Little Data Book on Private Sector Development 2011
Sub-Saharan Africa Low income
Country data
Low-incomegroup
2000 2009 2009
Malawi
11.8 15.3 846
5.0 6.3 384
.. 7.8 ..
150 290 5093.8 4.8 5.4
39.5 30.5 26.1
17.9 16.1 24.4
12.9 10.0 12.4
42.5 53.4 49.5
29.6 8.4
59.5 141.2
25.6 30.0 23.2
35.3 37.7 35.9
.. 133
.. 39 41
.. 10 8
.. 84.0 71.0
.. 2.6 3.7
.. 25.1 76.5
.. 23.3 24.8.. 0.6
.. 0.1
.. 3.5
.. 11.4
.. 20.6
.. 59.2
.. 17.9
5 73 4,779
1.5 1.3 2.7
12.3 21.8 22.9
2.3 14.9 15.8
.. .. -1.4
.. .. ..
9.1 9.7 31.817.8 15.0 30.6
.. .. ..
.. .. ..
9.1 14.2 26.3
17.3 15.6
19.9 21.8 11.5
.. 45.0 12.0
.. .. 231
.. 1.0
0.4 15.7 26.6
0.1 4.7 2.7

8/6/2019 The Little Data Book on Private Sector Development 2011
http://slidepdf.com/reader/full/the-little-data-book-on-private-sector-development-2011 144/246
Economic and social context
Population (millions)
Labor force (millions)
Unemployment rate (% of labor force)
GNI per capita, World Bank Atlas method ($)GDP growth, 1995–2000 and 2000–09 (average annual %)
Agriculture value added (% of GDP)
Industry value added (% of GDP)
Manufacturing value added (% of GDP)
Services value added (% of GDP)
Inflation (annual % change in consumer price index)
Exchange rate (local currency units per $)
Exports of goods and services (% of GDP)
Imports of goods and services (% of GDP) Investment climate
Ease of doing business index (ranking 1–183; 1 = best)
Time to star t a business (days)
Procedures to start a business (number)
Firing cost (weeks of wages)
Closing a business (years to resolve insolvency)
Total tax rate (% of profit)
Profit tax (% of commercial profits)New businesses registered (thousands)
New business density (new regis. per working-age pop.)
Enterprise surveys
Time dealing with gov’t officials (% of management time)
Firms expected to give gifts in meetings w/tax officials (%)
Firms using banks to finance investments (% of firms)
Delay in obtaining an electrical connection (days)
ISO certif ication ownership (% of firms)
Private sector investment
Invest. in infrastructure w/private participation ($ millions)
Private foreign direct investment, net (% of GDP)
Gross f ixed capital formation (% of GDP)
Gross f ixed private capital formation (% of GDP)
Finance and banking
Government cash surplus or deficit (% of GDP)
Government debt (% of GDP)
Deposit money banks’ assets (% of GDP) Total f inancial system deposits (% of GDP)
Bank capital to asset ratio (%)
Bank nonperforming loans to total gross loans ratio (%)
Domestic credit to the private sector (% of GDP)
Real interest rate (%)
Interest rate spread (percentage points)
Infrastructure
Paved roads (% of total roads)Electr ic power consumption (kWh per capita)
Power outages in a typical month (number)
Mobile cellular subscriptions (per 100 people)
Internet users (per 100 people)
136 2011 The Little Data Book on Private Sector Development
Country data
Uppermiddle-incomegroup
2000 2009 2009
East Asia & Pacific Upper middle income
Malaysia
23.3 27.5 1,002
9.7 12.0 458
3.0 3.7 9.1
3,450 7,350 7,5023.7 5.1 4.4
8.6 9.5 6.2
48.3 44.3 31.5
30.9 25.5 16.7
43.1 46.2 62.4
1.5 0.6
3.8 3.5
119.8 96.4 25.4
100.6 74.9 24.2
.. 21
.. 17 43
.. 9 8
.. 75.0 40.1
.. 2.3 2.9
.. 33.7 43.0
.. 16.7 18.0.. 41.6
.. 2.5
7.3 7.8
.. ..
48.6 48.6
.. 10.7
31.4 54.1
5,511 388 64,899
4.0 0.7 2.4
25.3 20.1 20.7
13.4 9.6 15.6
-4.1 -6.4 -0.6
43.0 53.3 ..
135.4 138.0 60.6112.9 134.7 47.4
8.5 9.0 9.7
15.4 3.7 4.2
135.0 117.1 47.8
-1.1 12.6
4.3 3.0 5.5
76.2 82.8 36.82,742 3,490 3,001
.. 0.8
22.0 110.6 100.6
21.4 57.6 34.6
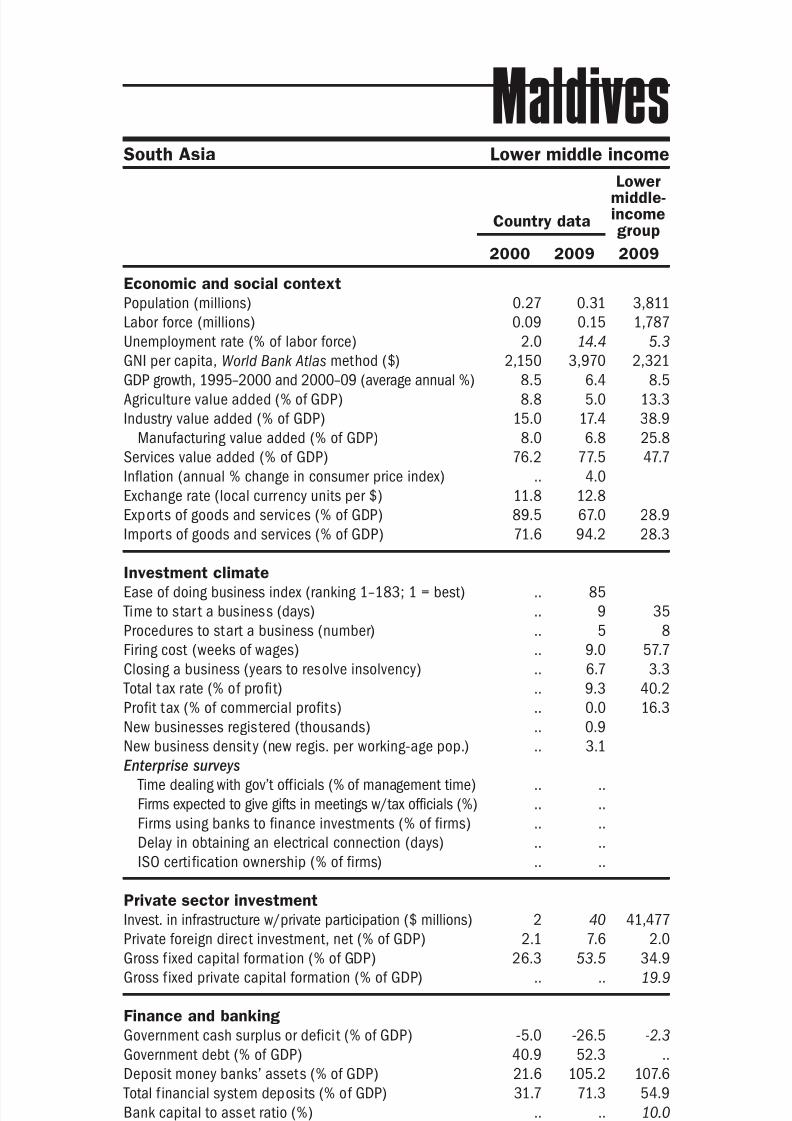
8/6/2019 The Little Data Book on Private Sector Development 2011
http://slidepdf.com/reader/full/the-little-data-book-on-private-sector-development-2011 145/246
Economic and social context
Population (millions)
Labor force (millions)
Unemployment rate (% of labor force)
GNI per capita, World Bank Atlas method ($)GDP growth, 1995–2000 and 2000–09 (average annual %)
Agriculture value added (% of GDP)
Industry value added (% of GDP)
Manufacturing value added (% of GDP)
Services value added (% of GDP)
Inflation (annual % change in consumer price index)
Exchange rate (local currency units per $)
Exports of goods and services (% of GDP)
Imports of goods and services (% of GDP) Investment climate
Ease of doing business index (ranking 1–183; 1 = best)
Time to star t a business (days)
Procedures to start a business (number)
Firing cost (weeks of wages)
Closing a business (years to resolve insolvency)
Total tax rate (% of profit)
Profit tax (% of commercial profits)New businesses registered (thousands)
New business density (new regis. per working-age pop.)
Enterprise surveys
Time dealing with gov’t officials (% of management time)
Firms expected to give gifts in meetings w/tax officials (%)
Firms using banks to finance investments (% of firms)
Delay in obtaining an electrical connection (days)
ISO certi fication ownership (% of firms)
Private sector investment
Invest. in infrastructure w/private participation ($ millions)
Private foreign direct investment, net (% of GDP)
Gross f ixed capital formation (% of GDP)
Gross f ixed private capital formation (% of GDP)
Finance and banking
Government cash surplus or deficit (% of GDP)
Government debt (% of GDP)
Deposit money banks’ assets (% of GDP) Total f inancial system deposits (% of GDP)
Bank capital to asset ratio (%)
Bank nonperforming loans to total gross loans ratio (%)
Domestic credit to the private sector (% of GDP)
Real interest rate (%)
Interest rate spread (percentage points)
Infrastructure
Paved roads (% of total roads)Electr ic power consumption (kWh per capita)
Power outages in a typical month (number)
Mobile cellular subscriptions (per 100 people)
Internet users (per 100 people)
137The Little Data Book on Private Sector Development 2011
South Asia Lower middle income
Country data
Lowermiddle-incomegroup
2000 2009 2009
Maldives
0.27 0.31 3,811
0.09 0.15 1,787
2.0 14.4 5.3
2,150 3,970 2,3218.5 6.4 8.5
8.8 5.0 13.3
15.0 17.4 38.9
8.0 6.8 25.8
76.2 77.5 47.7
.. 4.0
11.8 12.8
89.5 67.0 28.9
71.6 94.2 28.3
.. 85
.. 9 35
.. 5 8
.. 9.0 57.7
.. 6.7 3.3
.. 9.3 40.2
.. 0.0 16.3.. 0.9
.. 3.1
.. ..
.. ..
.. ..
.. ..
.. ..
2 40 41,477
2.1 7.6 2.0
26.3 53.5 34.9
.. .. 19.9
-5.0 -26.5 -2.3
40.9 52.3 ..
21.6 105.2 107.631.7 71.3 54.9
.. .. 10.0
.. .. 5.1
19.1 82.5 92.9
11.7 -6.2
6.1 6.5 7.3
.. 100.0 36.3
.. .. 1,318
.. ..
2.8 147.9 57.8
2.2 28.4 17.2
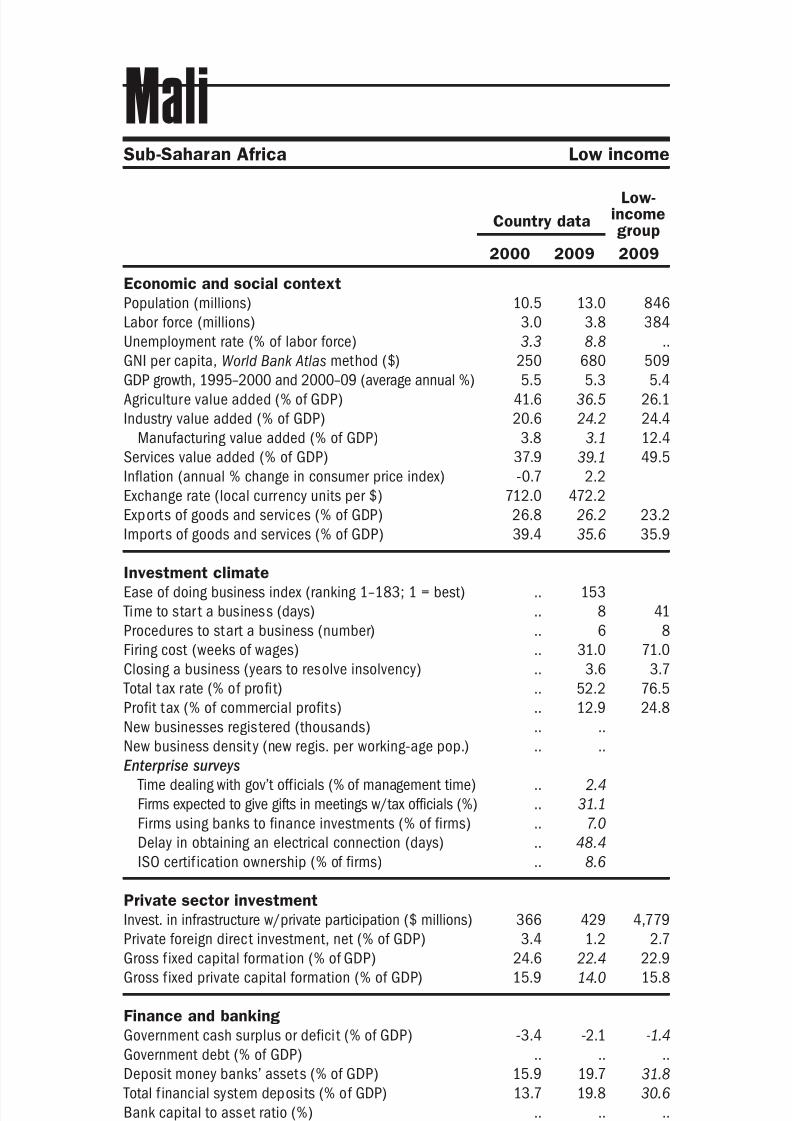
8/6/2019 The Little Data Book on Private Sector Development 2011
http://slidepdf.com/reader/full/the-little-data-book-on-private-sector-development-2011 146/246
Economic and social context
Population (millions)
Labor force (millions)
Unemployment rate (% of labor force)
GNI per capita, World Bank Atlas method ($)GDP growth, 1995–2000 and 2000–09 (average annual %)
Agriculture value added (% of GDP)
Industry value added (% of GDP)
Manufacturing value added (% of GDP)
Services value added (% of GDP)
Inflation (annual % change in consumer price index)
Exchange rate (local currency units per $)
Exports of goods and services (% of GDP)
Imports of goods and services (% of GDP) Investment climate
Ease of doing business index (ranking 1–183; 1 = best)
Time to star t a business (days)
Procedures to start a business (number)
Firing cost (weeks of wages)
Closing a business (years to resolve insolvency)
Total tax rate (% of profit)
Profit tax (% of commercial profits)New businesses registered (thousands)
New business density (new regis. per working-age pop.)
Enterprise surveys
Time dealing with gov’t officials (% of management time)
Firms expected to give gifts in meetings w/tax officials (%)
Firms using banks to finance investments (% of firms)
Delay in obtaining an electrical connection (days)
ISO certif ication ownership (% of firms)
Private sector investment
Invest. in infrastructure w/private participation ($ millions)
Private foreign direct investment, net (% of GDP)
Gross f ixed capital formation (% of GDP)
Gross f ixed private capital formation (% of GDP)
Finance and banking
Government cash surplus or deficit (% of GDP)
Government debt (% of GDP)
Deposit money banks’ assets (% of GDP) Total f inancial system deposits (% of GDP)
Bank capital to asset ratio (%)
Bank nonperforming loans to total gross loans ratio (%)
Domestic credit to the private sector (% of GDP)
Real interest rate (%)
Interest rate spread (percentage points)
Infrastructure
Paved roads (% of total roads)Electr ic power consumption (kWh per capita)
Power outages in a typical month (number)
Mobile cellular subscriptions (per 100 people)
Internet users (per 100 people)
138 2011 The Little Data Book on Private Sector Development
Sub-Saharan Africa Low income
Country data
Low-incomegroup
2000 2009 2009
Mali
10.5 13.0 846
3.0 3.8 384
3.3 8.8 ..
250 680 5095.5 5.3 5.4
41.6 36.5 26.1
20.6 24.2 24.4
3.8 3.1 12.4
37.9 39.1 49.5
-0.7 2.2
712.0 472.2
26.8 26.2 23.2
39.4 35.6 35.9
.. 153
.. 8 41
.. 6 8
.. 31.0 71.0
.. 3.6 3.7
.. 52.2 76.5
.. 12.9 24.8.. ..
.. ..
.. 2.4
.. 31.1
.. 7.0
.. 48.4
.. 8.6
366 429 4,779
3.4 1.2 2.7
24.6 22.4 22.9
15.9 14.0 15.8
-3.4 -2.1 -1.4
.. .. ..
15.9 19.7 31.813.7 19.8 30.6
.. .. ..
.. .. ..
16.6 17.4 26.3
.. ..
.. .. 11.5
12.1 19.0 12.0.. .. 231
.. 4.2
0.1 28.8 26.6
0.1 1.9 2.7
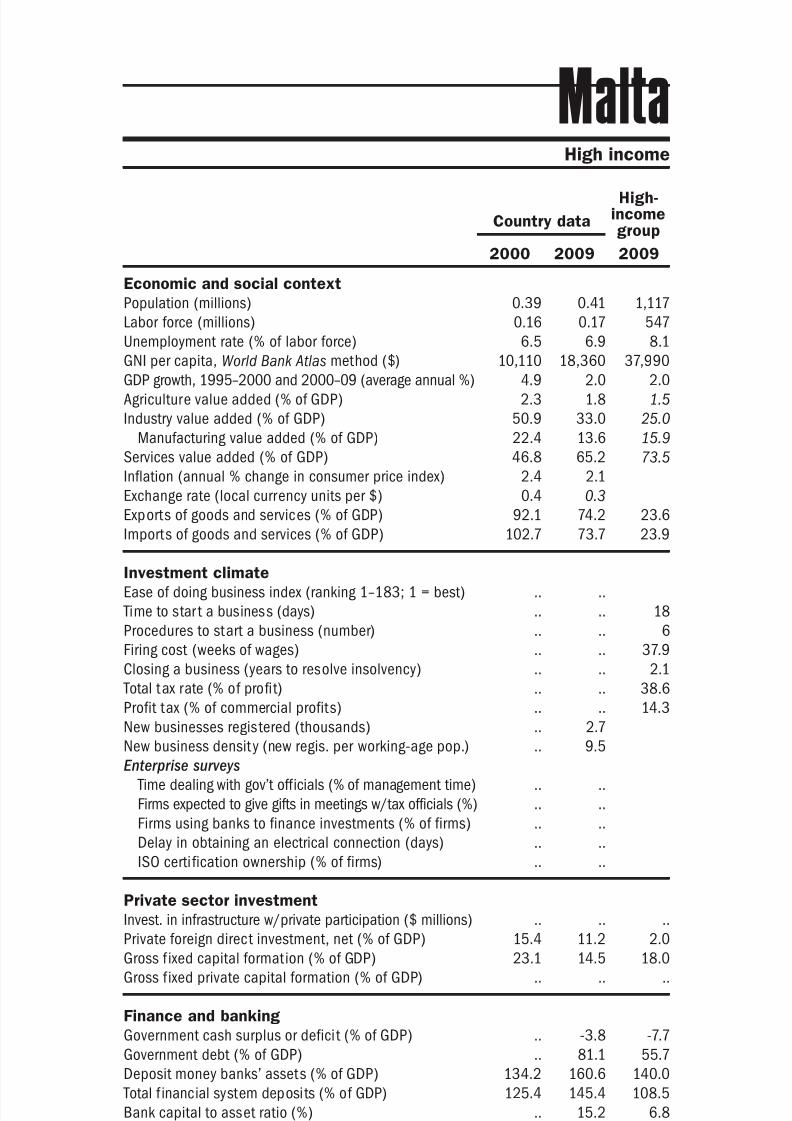
8/6/2019 The Little Data Book on Private Sector Development 2011
http://slidepdf.com/reader/full/the-little-data-book-on-private-sector-development-2011 147/246
Economic and social context
Population (millions)
Labor force (millions)
Unemployment rate (% of labor force)
GNI per capita, World Bank Atlas method ($)GDP growth, 1995–2000 and 2000–09 (average annual %)
Agriculture value added (% of GDP)
Industry value added (% of GDP)
Manufacturing value added (% of GDP)
Services value added (% of GDP)
Inflation (annual % change in consumer price index)
Exchange rate (local currency units per $)
Exports of goods and services (% of GDP)
Imports of goods and services (% of GDP) Investment climate
Ease of doing business index (ranking 1–183; 1 = best)
Time to star t a business (days)
Procedures to start a business (number)
Firing cost (weeks of wages)
Closing a business (years to resolve insolvency)
Total tax rate (% of profit)
Profit tax (% of commercial profits)New businesses registered (thousands)
New business density (new regis. per working-age pop.)
Enterprise surveys
Time dealing with gov’t officials (% of management time)
Firms expected to give gifts in meetings w/tax officials (%)
Firms using banks to finance investments (% of firms)
Delay in obtaining an electrical connection (days)
ISO certi fication ownership (% of firms)
Private sector investment
Invest. in infrastructure w/private participation ($ millions)
Private foreign direct investment, net (% of GDP)
Gross f ixed capital formation (% of GDP)
Gross f ixed private capital formation (% of GDP)
Finance and banking
Government cash surplus or deficit (% of GDP)
Government debt (% of GDP)
Deposit money banks’ assets (% of GDP) Total f inancial system deposits (% of GDP)
Bank capital to asset ratio (%)
Bank nonperforming loans to total gross loans ratio (%)
Domestic credit to the private sector (% of GDP)
Real interest rate (%)
Interest rate spread (percentage points)
Infrastructure
Paved roads (% of total roads)Electr ic power consumption (kWh per capita)
Power outages in a typical month (number)
Mobile cellular subscriptions (per 100 people)
Internet users (per 100 people)
139The Little Data Book on Private Sector Development 2011
Country data
High-incomegroup
2000 2009 2009
High income
Malta
0.39 0.41 1,117
0.16 0.17 547
6.5 6.9 8.1
10,110 18,360 37,9904.9 2.0 2.0
2.3 1.8 1.5
50.9 33.0 25.0
22.4 13.6 15.9
46.8 65.2 73.5
2.4 2.1
0.4 0.3
92.1 74.2 23.6
102.7 73.7 23.9
.. ..
.. .. 18
.. .. 6
.. .. 37.9
.. .. 2.1
.. .. 38.6
.. .. 14.3.. 2.7
.. 9.5
.. ..
.. ..
.. ..
.. ..
.. ..
.. .. ..
15.4 11.2 2.0
23.1 14.5 18.0
.. .. ..
.. -3.8 -7.7
.. 81.1 55.7
134.2 160.6 140.0125.4 145.4 108.5
.. 15.2 6.8
.. 2.4 3.4
106.8 135.5 165.1
3.0 2.1
2.4 2.6 3.8
88.0 87.5 93.44,313 4,806 9,518
.. ..
29.3 101.7 111.2
13.1 58.0 72.3

8/6/2019 The Little Data Book on Private Sector Development 2011
http://slidepdf.com/reader/full/the-little-data-book-on-private-sector-development-2011 148/246
Economic and social context
Population (millions)
Labor force (millions)
Unemployment rate (% of labor force)
GNI per capita, World Bank Atlas method ($)GDP growth, 1995–2000 and 2000–09 (average annual %)
Agriculture value added (% of GDP)
Industry value added (% of GDP)
Manufacturing value added (% of GDP)
Services value added (% of GDP)
Inflation (annual % change in consumer price index)
Exchange rate (local currency units per $)
Exports of goods and services (% of GDP)
Imports of goods and services (% of GDP) Investment climate
Ease of doing business index (ranking 1–183; 1 = best)
Time to star t a business (days)
Procedures to start a business (number)
Firing cost (weeks of wages)
Closing a business (years to resolve insolvency)
Total tax rate (% of profit)
Profit tax (% of commercial profits)New businesses registered (thousands)
New business density (new regis. per working-age pop.)
Enterprise surveys
Time dealing with gov’t officials (% of management time)
Firms expected to give gifts in meetings w/tax officials (%)
Firms using banks to finance investments (% of firms)
Delay in obtaining an electrical connection (days)
ISO certif ication ownership (% of firms)
Private sector investment
Invest. in infrastructure w/private participation ($ millions)
Private foreign direct investment, net (% of GDP)
Gross f ixed capital formation (% of GDP)
Gross f ixed private capital formation (% of GDP)
Finance and banking
Government cash surplus or deficit (% of GDP)
Government debt (% of GDP)
Deposit money banks’ assets (% of GDP) Total f inancial system deposits (% of GDP)
Bank capital to asset ratio (%)
Bank nonperforming loans to total gross loans ratio (%)
Domestic credit to the private sector (% of GDP)
Real interest rate (%)
Interest rate spread (percentage points)
Infrastructure
Paved roads (% of total roads)Electr ic power consumption (kWh per capita)
Power outages in a typical month (number)
Mobile cellular subscriptions (per 100 people)
Internet users (per 100 people)
140 2011 The Little Data Book on Private Sector Development
Country data
Lowermiddle-incomegroup
2000 2009 2009
East Asia & Pacific Lower middle income
Marshall Islands
0.05 0.06 3,811
.. .. 1,787
30.9 .. 5.3
2,420 3,060 2,321-3.7 2.2 8.5
9.4 .. 13.3
18.6 .. 38.9
3.7 .. 25.8
72.1 .. 47.7
.. ..
.. ..
.. .. 28.9
.. .. 28.3
.. 108
.. 17 35
.. 5 8
.. .. 57.7
.. 2.0 3.3
.. 64.9 40.2
.. 0.0 16.3.. ..
.. ..
.. ..
.. ..
.. ..
.. ..
.. ..
.. .. 41,477
.. .. 2.0
.. .. 34.9
.. .. 19.9
.. .. -2.3
.. .. ..
.. .. 107.6
.. .. 54.9
.. .. 10.0
.. .. 5.1
.. .. 92.9
.. ..
.. .. 7.3
.. .. 36.3
.. .. 1,318
.. ..
0.9 1.6 57.8
1.6 3.6 17.2
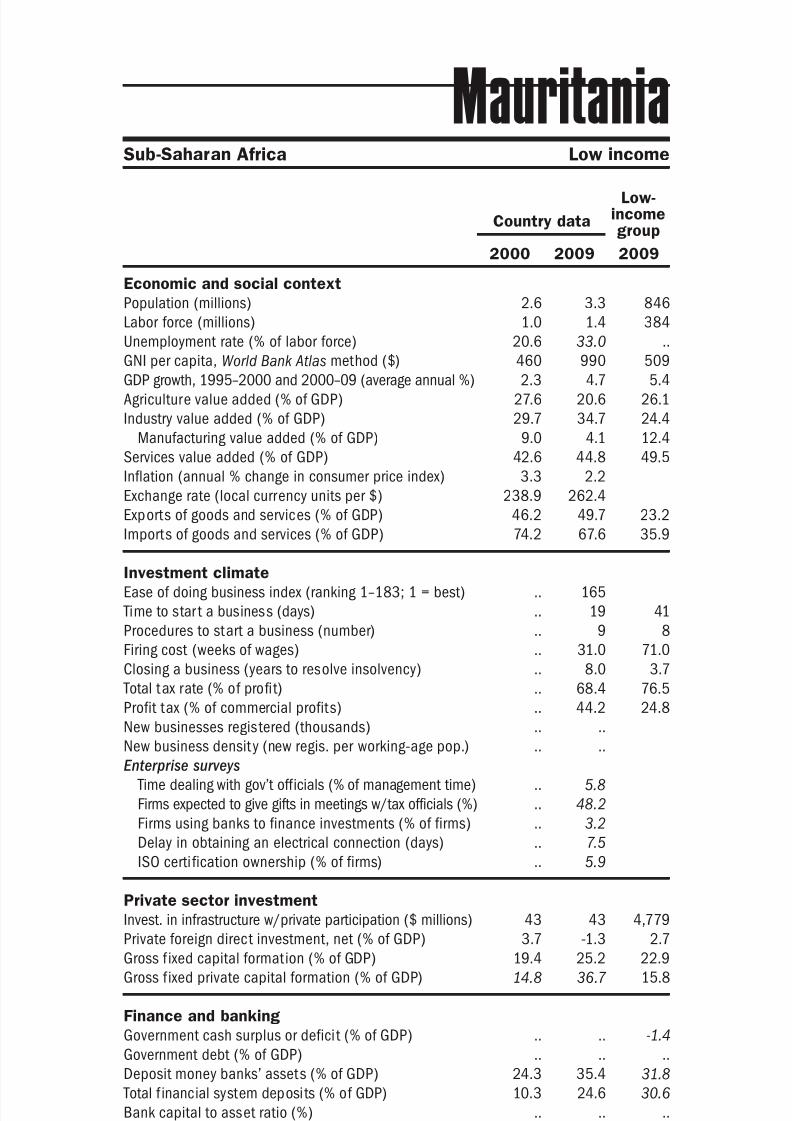
8/6/2019 The Little Data Book on Private Sector Development 2011
http://slidepdf.com/reader/full/the-little-data-book-on-private-sector-development-2011 149/246
Economic and social context
Population (millions)
Labor force (millions)
Unemployment rate (% of labor force)
GNI per capita, World Bank Atlas method ($)GDP growth, 1995–2000 and 2000–09 (average annual %)
Agriculture value added (% of GDP)
Industry value added (% of GDP)
Manufacturing value added (% of GDP)
Services value added (% of GDP)
Inflation (annual % change in consumer price index)
Exchange rate (local currency units per $)
Exports of goods and services (% of GDP)
Imports of goods and services (% of GDP) Investment climate
Ease of doing business index (ranking 1–183; 1 = best)
Time to star t a business (days)
Procedures to start a business (number)
Firing cost (weeks of wages)
Closing a business (years to resolve insolvency)
Total tax rate (% of profit)
Profit tax (% of commercial profits)New businesses registered (thousands)
New business density (new regis. per working-age pop.)
Enterprise surveys
Time dealing with gov’t officials (% of management time)
Firms expected to give gifts in meetings w/tax officials (%)
Firms using banks to finance investments (% of firms)
Delay in obtaining an electrical connection (days)
ISO certi fication ownership (% of firms)
Private sector investment
Invest. in infrastructure w/private participation ($ millions)
Private foreign direct investment, net (% of GDP)
Gross f ixed capital formation (% of GDP)
Gross f ixed private capital formation (% of GDP)
Finance and banking
Government cash surplus or deficit (% of GDP)
Government debt (% of GDP)
Deposit money banks’ assets (% of GDP) Total f inancial system deposits (% of GDP)
Bank capital to asset ratio (%)
Bank nonperforming loans to total gross loans ratio (%)
Domestic credit to the private sector (% of GDP)
Real interest rate (%)
Interest rate spread (percentage points)
Infrastructure
Paved roads (% of total roads)Electr ic power consumption (kWh per capita)
Power outages in a typical month (number)
Mobile cellular subscriptions (per 100 people)
Internet users (per 100 people)
141The Little Data Book on Private Sector Development 2011
Sub-Saharan Africa Low income
Country data
Low-incomegroup
2000 2009 2009
Mauritania
2.6 3.3 846
1.0 1.4 384
20.6 33.0 ..
460 990 5092.3 4.7 5.4
27.6 20.6 26.1
29.7 34.7 24.4
9.0 4.1 12.4
42.6 44.8 49.5
3.3 2.2
238.9 262.4
46.2 49.7 23.2
74.2 67.6 35.9
.. 165
.. 19 41
.. 9 8
.. 31.0 71.0
.. 8.0 3.7
.. 68.4 76.5
.. 44.2 24.8.. ..
.. ..
.. 5.8
.. 48.2
.. 3.2
.. 7.5
.. 5.9
43 43 4,779
3.7 -1.3 2.7
19.4 25.2 22.9
14.8 36.7 15.8
.. .. -1.4
.. .. ..
24.3 35.4 31.810.3 24.6 30.6
.. .. ..
.. .. ..
23.1 27.0 26.3
23.9 15.1
16.2 15.5 11.5
.. 26.8 12.0
.. .. 231
.. 3.7
0.6 66.3 26.6
0.2 2.3 2.7
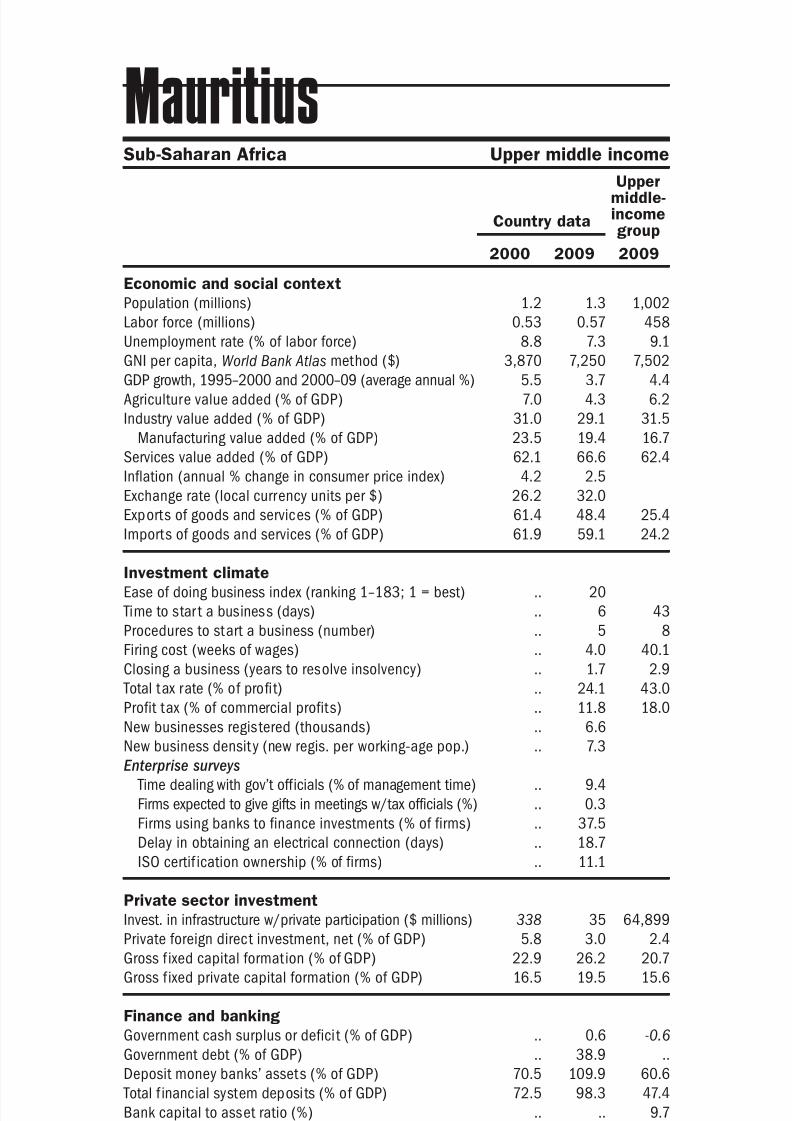
8/6/2019 The Little Data Book on Private Sector Development 2011
http://slidepdf.com/reader/full/the-little-data-book-on-private-sector-development-2011 150/246
Economic and social context
Population (millions)
Labor force (millions)
Unemployment rate (% of labor force)
GNI per capita, World Bank Atlas method ($)GDP growth, 1995–2000 and 2000–09 (average annual %)
Agriculture value added (% of GDP)
Industry value added (% of GDP)
Manufacturing value added (% of GDP)
Services value added (% of GDP)
Inflation (annual % change in consumer price index)
Exchange rate (local currency units per $)
Exports of goods and services (% of GDP)
Imports of goods and services (% of GDP) Investment climate
Ease of doing business index (ranking 1–183; 1 = best)
Time to star t a business (days)
Procedures to start a business (number)
Firing cost (weeks of wages)
Closing a business (years to resolve insolvency)
Total tax rate (% of profit)
Profit tax (% of commercial profits)New businesses registered (thousands)
New business density (new regis. per working-age pop.)
Enterprise surveys
Time dealing with gov’t officials (% of management time)
Firms expected to give gifts in meetings w/tax officials (%)
Firms using banks to finance investments (% of firms)
Delay in obtaining an electrical connection (days)
ISO certif ication ownership (% of firms)
Private sector investment
Invest. in infrastructure w/private participation ($ millions)
Private foreign direct investment, net (% of GDP)
Gross f ixed capital formation (% of GDP)
Gross f ixed private capital formation (% of GDP)
Finance and banking
Government cash surplus or deficit (% of GDP)
Government debt (% of GDP)
Deposit money banks’ assets (% of GDP) Total f inancial system deposits (% of GDP)
Bank capital to asset ratio (%)
Bank nonperforming loans to total gross loans ratio (%)
Domestic credit to the private sector (% of GDP)
Real interest rate (%)
Interest rate spread (percentage points)
Infrastructure
Paved roads (% of total roads)Electr ic power consumption (kWh per capita)
Power outages in a typical month (number)
Mobile cellular subscriptions (per 100 people)
Internet users (per 100 people)
142 2011 The Little Data Book on Private Sector Development
Country data
Uppermiddle-incomegroup
2000 2009 2009
Sub-Saharan Africa Upper middle income
Mauritius
1.2 1.3 1,002
0.53 0.57 458
8.8 7.3 9.1
3,870 7,250 7,5025.5 3.7 4.4
7.0 4.3 6.2
31.0 29.1 31.5
23.5 19.4 16.7
62.1 66.6 62.4
4.2 2.5
26.2 32.0
61.4 48.4 25.4
61.9 59.1 24.2
.. 20
.. 6 43
.. 5 8
.. 4.0 40.1
.. 1.7 2.9
.. 24.1 43.0
.. 11.8 18.0.. 6.6
.. 7.3
.. 9.4
.. 0.3
.. 37.5
.. 18.7
.. 11.1
338 35 64,899
5.8 3.0 2.4
22.9 26.2 20.7
16.5 19.5 15.6
.. 0.6 -0.6
.. 38.9 ..
70.5 109.9 60.672.5 98.3 47.4
.. .. 9.7
.. .. 4.2
57.5 85.1 47.8
18.3 17.5
11.2 10.8 5.5
97.0 98.0 36.8.. .. 3,001
.. 3.2
15.2 85.2 100.6
7.3 22.7 34.6
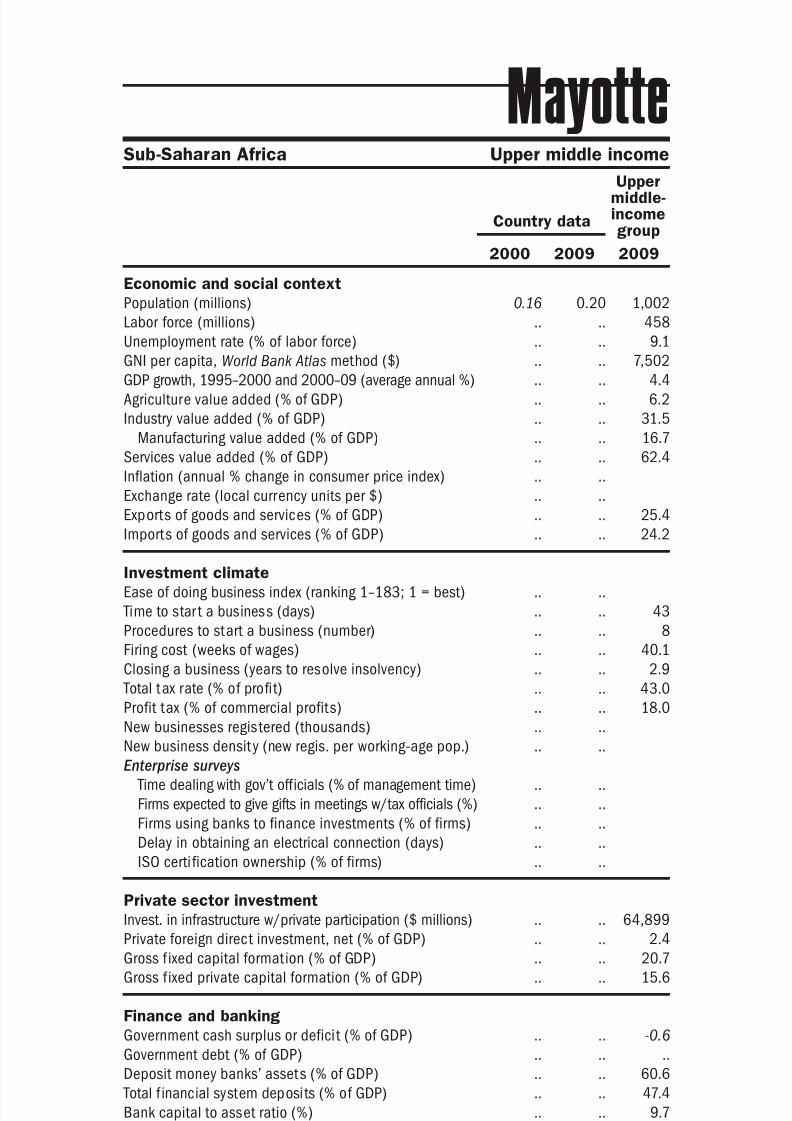
8/6/2019 The Little Data Book on Private Sector Development 2011
http://slidepdf.com/reader/full/the-little-data-book-on-private-sector-development-2011 151/246
Economic and social context
Population (millions)
Labor force (millions)
Unemployment rate (% of labor force)
GNI per capita, World Bank Atlas method ($)GDP growth, 1995–2000 and 2000–09 (average annual %)
Agriculture value added (% of GDP)
Industry value added (% of GDP)
Manufacturing value added (% of GDP)
Services value added (% of GDP)
Inflation (annual % change in consumer price index)
Exchange rate (local currency units per $)
Exports of goods and services (% of GDP)
Imports of goods and services (% of GDP) Investment climate
Ease of doing business index (ranking 1–183; 1 = best)
Time to star t a business (days)
Procedures to start a business (number)
Firing cost (weeks of wages)
Closing a business (years to resolve insolvency)
Total tax rate (% of profit)
Profit tax (% of commercial profits)New businesses registered (thousands)
New business density (new regis. per working-age pop.)
Enterprise surveys
Time dealing with gov’t officials (% of management time)
Firms expected to give gifts in meetings w/tax officials (%)
Firms using banks to finance investments (% of firms)
Delay in obtaining an electrical connection (days)
ISO certi fication ownership (% of firms)
Private sector investment
Invest. in infrastructure w/private participation ($ millions)
Private foreign direct investment, net (% of GDP)
Gross f ixed capital formation (% of GDP)
Gross f ixed private capital formation (% of GDP)
Finance and banking
Government cash surplus or deficit (% of GDP)
Government debt (% of GDP)
Deposit money banks’ assets (% of GDP) Total f inancial system deposits (% of GDP)
Bank capital to asset ratio (%)
Bank nonperforming loans to total gross loans ratio (%)
Domestic credit to the private sector (% of GDP)
Real interest rate (%)
Interest rate spread (percentage points)
Infrastructure
Paved roads (% of total roads)Electr ic power consumption (kWh per capita)
Power outages in a typical month (number)
Mobile cellular subscriptions (per 100 people)
Internet users (per 100 people)
143The Little Data Book on Private Sector Development 2011
Sub-Saharan Africa Upper middle income
Country data
Uppermiddle-incomegroup
2000 2009 2009
Mayotte
0.16 0.20 1,002
.. .. 458
.. .. 9.1
.. .. 7,502
.. .. 4.4
.. .. 6.2
.. .. 31.5
.. .. 16.7
.. .. 62.4
.. ..
.. ..
.. .. 25.4
.. .. 24.2
.. ..
.. .. 43
.. .. 8
.. .. 40.1
.. .. 2.9
.. .. 43.0
.. .. 18.0.. ..
.. ..
.. ..
.. ..
.. ..
.. ..
.. ..
.. .. 64,899
.. .. 2.4
.. .. 20.7
.. .. 15.6
.. .. -0.6
.. .. ..
.. .. 60.6
.. .. 47.4
.. .. 9.7
.. .. 4.2
.. .. 47.8
.. ..
.. .. 5.5
.. .. 36.8
.. .. 3,001
.. ..
12.7 28.0 100.6
.. .. 34.6
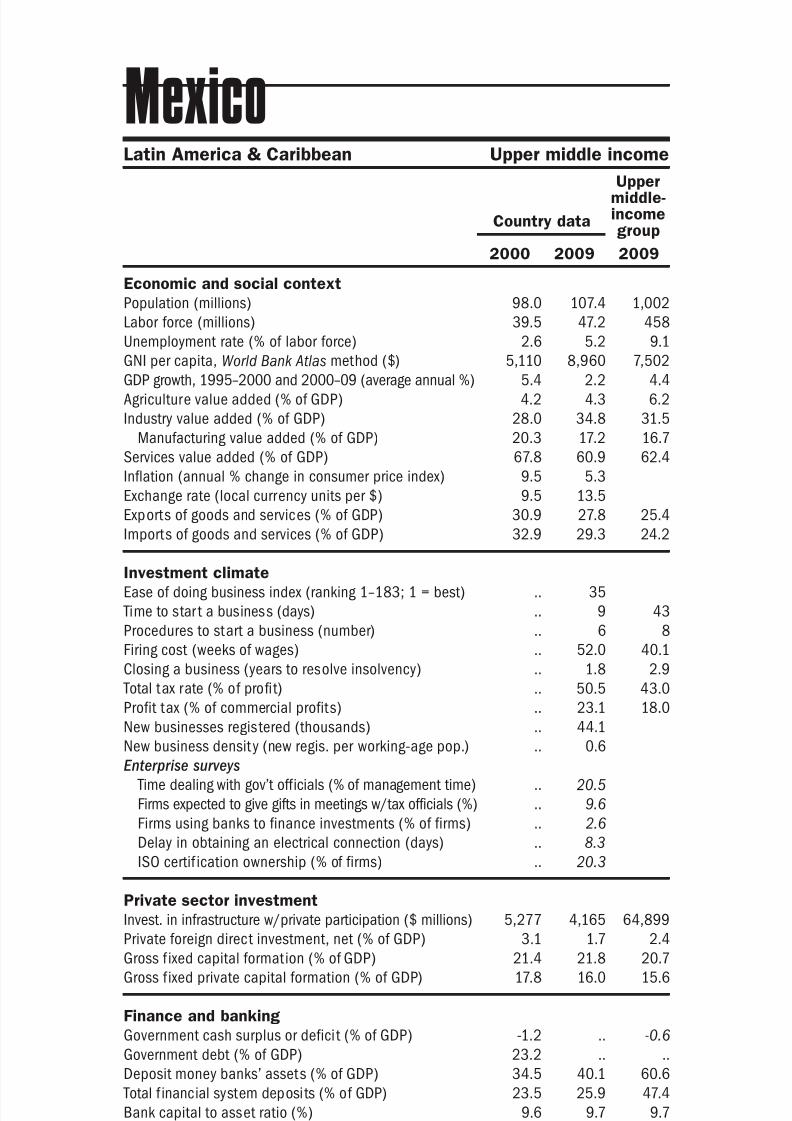
8/6/2019 The Little Data Book on Private Sector Development 2011
http://slidepdf.com/reader/full/the-little-data-book-on-private-sector-development-2011 152/246
Economic and social context
Population (millions)
Labor force (millions)
Unemployment rate (% of labor force)
GNI per capita, World Bank Atlas method ($)GDP growth, 1995–2000 and 2000–09 (average annual %)
Agriculture value added (% of GDP)
Industry value added (% of GDP)
Manufacturing value added (% of GDP)
Services value added (% of GDP)
Inflation (annual % change in consumer price index)
Exchange rate (local currency units per $)
Exports of goods and services (% of GDP)
Imports of goods and services (% of GDP) Investment climate
Ease of doing business index (ranking 1–183; 1 = best)
Time to star t a business (days)
Procedures to start a business (number)
Firing cost (weeks of wages)
Closing a business (years to resolve insolvency)
Total tax rate (% of profit)
Profit tax (% of commercial profits)New businesses registered (thousands)
New business density (new regis. per working-age pop.)
Enterprise surveys
Time dealing with gov’t officials (% of management time)
Firms expected to give gifts in meetings w/tax officials (%)
Firms using banks to finance investments (% of firms)
Delay in obtaining an electrical connection (days)
ISO certif ication ownership (% of firms)
Private sector investment
Invest. in infrastructure w/private participation ($ millions)
Private foreign direct investment, net (% of GDP)
Gross f ixed capital formation (% of GDP)
Gross f ixed private capital formation (% of GDP)
Finance and banking
Government cash surplus or deficit (% of GDP)
Government debt (% of GDP)
Deposit money banks’ assets (% of GDP) Total f inancial system deposits (% of GDP)
Bank capital to asset ratio (%)
Bank nonperforming loans to total gross loans ratio (%)
Domestic credit to the private sector (% of GDP)
Real interest rate (%)
Interest rate spread (percentage points)
Infrastructure
Paved roads (% of total roads)Electr ic power consumption (kWh per capita)
Power outages in a typical month (number)
Mobile cellular subscriptions (per 100 people)
Internet users (per 100 people)
144 2011 The Little Data Book on Private Sector Development
Country data
Uppermiddle-incomegroup
2000 2009 2009
Latin America & Caribbean Upper middle income
Mexico
98.0 107.4 1,002
39.5 47.2 458
2.6 5.2 9.1
5,110 8,960 7,5025.4 2.2 4.4
4.2 4.3 6.2
28.0 34.8 31.5
20.3 17.2 16.7
67.8 60.9 62.4
9.5 5.3
9.5 13.5
30.9 27.8 25.4
32.9 29.3 24.2
.. 35
.. 9 43
.. 6 8
.. 52.0 40.1
.. 1.8 2.9
.. 50.5 43.0
.. 23.1 18.0.. 44.1
.. 0.6
.. 20.5
.. 9.6
.. 2.6
.. 8.3
.. 20.3
5,277 4,165 64,899
3.1 1.7 2.4
21.4 21.8 20.7
17.8 16.0 15.6
-1.2 .. -0.6
23.2 .. ..
34.5 40.1 60.623.5 25.9 47.4
9.6 9.7 9.7
5.8 3.1 4.2
18.3 23.3 47.8
4.3 2.7
8.7 5.1 5.5
32.8 35.3 36.81,722 2,020 3,001
.. 2.4
14.4 77.8 100.6
5.2 26.5 34.6
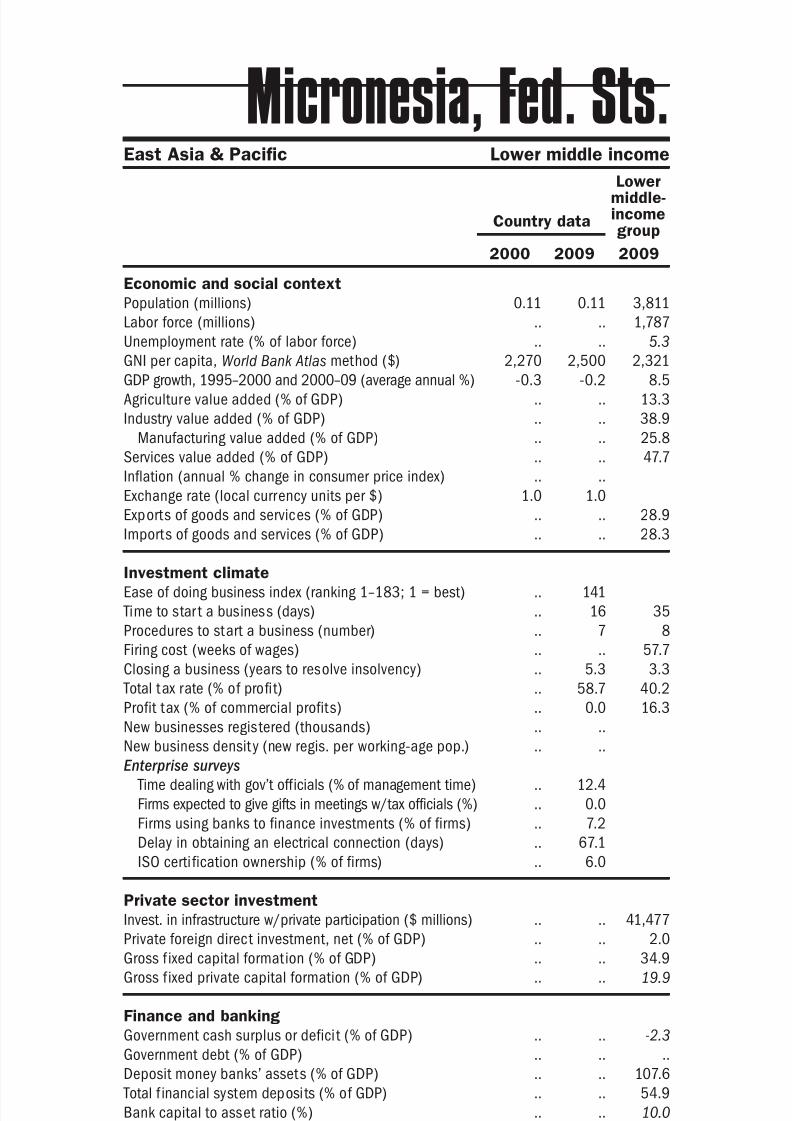
8/6/2019 The Little Data Book on Private Sector Development 2011
http://slidepdf.com/reader/full/the-little-data-book-on-private-sector-development-2011 153/246
Economic and social context
Population (millions)
Labor force (millions)
Unemployment rate (% of labor force)
GNI per capita, World Bank Atlas method ($)GDP growth, 1995–2000 and 2000–09 (average annual %)
Agriculture value added (% of GDP)
Industry value added (% of GDP)
Manufacturing value added (% of GDP)
Services value added (% of GDP)
Inflation (annual % change in consumer price index)
Exchange rate (local currency units per $)
Exports of goods and services (% of GDP)
Imports of goods and services (% of GDP) Investment climate
Ease of doing business index (ranking 1–183; 1 = best)
Time to star t a business (days)
Procedures to start a business (number)
Firing cost (weeks of wages)
Closing a business (years to resolve insolvency)
Total tax rate (% of profit)
Profit tax (% of commercial profits)New businesses registered (thousands)
New business density (new regis. per working-age pop.)
Enterprise surveys
Time dealing with gov’t officials (% of management time)
Firms expected to give gifts in meetings w/tax officials (%)
Firms using banks to finance investments (% of firms)
Delay in obtaining an electrical connection (days)
ISO certi fication ownership (% of firms)
Private sector investment
Invest. in infrastructure w/private participation ($ millions)
Private foreign direct investment, net (% of GDP)
Gross f ixed capital formation (% of GDP)
Gross f ixed private capital formation (% of GDP)
Finance and banking
Government cash surplus or deficit (% of GDP)
Government debt (% of GDP)
Deposit money banks’ assets (% of GDP) Total f inancial system deposits (% of GDP)
Bank capital to asset ratio (%)
Bank nonperforming loans to total gross loans ratio (%)
Domestic credit to the private sector (% of GDP)
Real interest rate (%)
Interest rate spread (percentage points)
Infrastructure
Paved roads (% of total roads)Electr ic power consumption (kWh per capita)
Power outages in a typical month (number)
Mobile cellular subscriptions (per 100 people)
Internet users (per 100 people)
145The Little Data Book on Private Sector Development 2011
East Asia & Pacific Lower middle income
Country data
Lowermiddle-incomegroup
2000 2009 2009
Micronesia, Fed. Sts.
0.11 0.11 3,811
.. .. 1,787
.. .. 5.3
2,270 2,500 2,321-0.3 -0.2 8.5
.. .. 13.3
.. .. 38.9
.. .. 25.8
.. .. 47.7
.. ..
1.0 1.0
.. .. 28.9
.. .. 28.3
.. 141
.. 16 35
.. 7 8
.. .. 57.7
.. 5.3 3.3
.. 58.7 40.2
.. 0.0 16.3.. ..
.. ..
.. 12.4
.. 0.0
.. 7.2
.. 67.1
.. 6.0
.. .. 41,477
.. .. 2.0
.. .. 34.9
.. .. 19.9
.. .. -2.3
.. .. ..
.. .. 107.6
.. .. 54.9
.. .. 10.0
.. .. 5.1
31.7 21.6 92.9
14.1 6.8
10.7 14.1 7.3
17.5 .. 36.3.. .. 1,318
.. 5.8
0.0 34.3 57.8
3.7 15.4 17.2
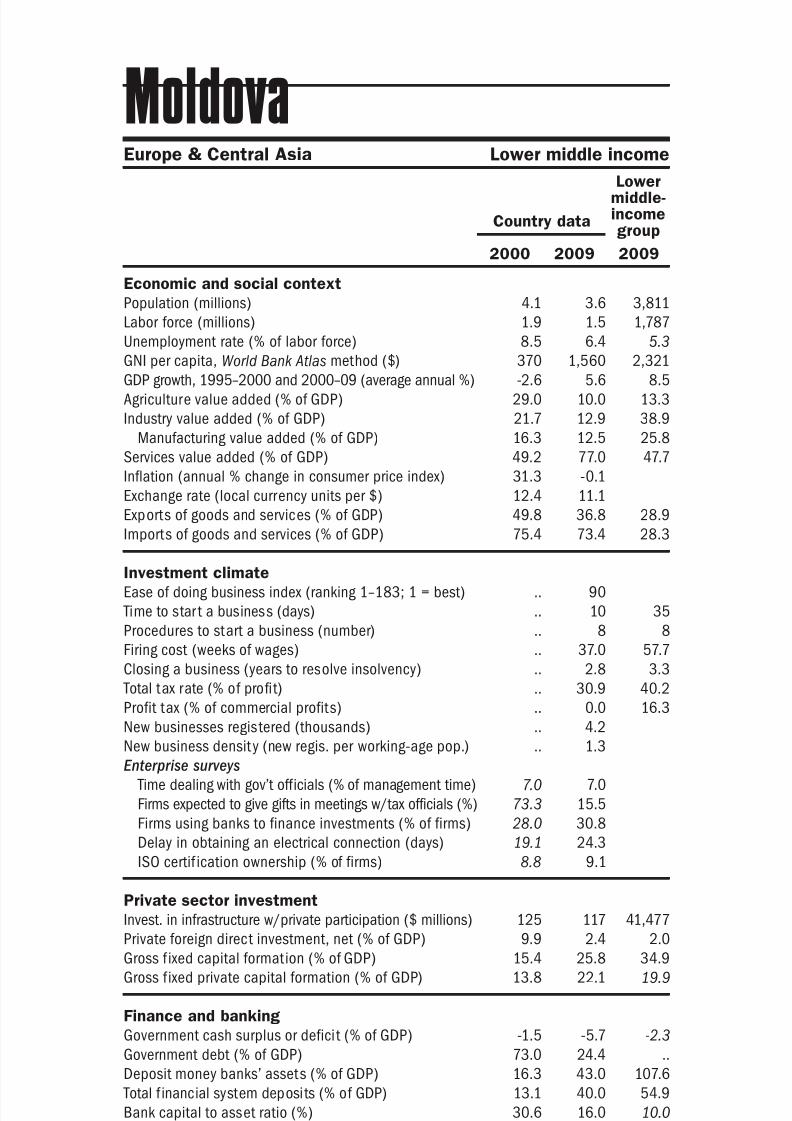
8/6/2019 The Little Data Book on Private Sector Development 2011
http://slidepdf.com/reader/full/the-little-data-book-on-private-sector-development-2011 154/246
Economic and social context
Population (millions)
Labor force (millions)
Unemployment rate (% of labor force)
GNI per capita, World Bank Atlas method ($)GDP growth, 1995–2000 and 2000–09 (average annual %)
Agriculture value added (% of GDP)
Industry value added (% of GDP)
Manufacturing value added (% of GDP)
Services value added (% of GDP)
Inflation (annual % change in consumer price index)
Exchange rate (local currency units per $)
Exports of goods and services (% of GDP)
Imports of goods and services (% of GDP) Investment climate
Ease of doing business index (ranking 1–183; 1 = best)
Time to star t a business (days)
Procedures to start a business (number)
Firing cost (weeks of wages)
Closing a business (years to resolve insolvency)
Total tax rate (% of profit)
Profit tax (% of commercial profits)New businesses registered (thousands)
New business density (new regis. per working-age pop.)
Enterprise surveys
Time dealing with gov’t officials (% of management time)
Firms expected to give gifts in meetings w/tax officials (%)
Firms using banks to finance investments (% of firms)
Delay in obtaining an electrical connection (days)
ISO certif ication ownership (% of firms)
Private sector investment
Invest. in infrastructure w/private participation ($ millions)
Private foreign direct investment, net (% of GDP)
Gross f ixed capital formation (% of GDP)
Gross f ixed private capital formation (% of GDP)
Finance and banking
Government cash surplus or deficit (% of GDP)
Government debt (% of GDP)
Deposit money banks’ assets (% of GDP) Total f inancial system deposits (% of GDP)
Bank capital to asset ratio (%)
Bank nonperforming loans to total gross loans ratio (%)
Domestic credit to the private sector (% of GDP)
Real interest rate (%)
Interest rate spread (percentage points)
Infrastructure
Paved roads (% of total roads)Electr ic power consumption (kWh per capita)
Power outages in a typical month (number)
Mobile cellular subscriptions (per 100 people)
Internet users (per 100 people)
146 2011 The Little Data Book on Private Sector Development
Country data
Lowermiddle-incomegroup
2000 2009 2009
Europe & Central Asia Lower middle income
Moldova
4.1 3.6 3,811
1.9 1.5 1,787
8.5 6.4 5.3
370 1,560 2,321-2.6 5.6 8.5
29.0 10.0 13.3
21.7 12.9 38.9
16.3 12.5 25.8
49.2 77.0 47.7
31.3 -0.1
12.4 11.1
49.8 36.8 28.9
75.4 73.4 28.3
.. 90
.. 10 35
.. 8 8
.. 37.0 57.7
.. 2.8 3.3
.. 30.9 40.2
.. 0.0 16.3.. 4.2
.. 1.3
7.0 7.0
73.3 15.5
28.0 30.8
19.1 24.3
8.8 9.1
125 117 41,477
9.9 2.4 2.0
15.4 25.8 34.9
13.8 22.1 19.9
-1.5 -5.7 -2.3
73.0 24.4 ..
16.3 43.0 107.613.1 40.0 54.9
30.6 16.0 10.0
20.6 16.3 5.1
12.7 36.2 92.9
5.1 18.1
8.9 5.6 7.3
86.1 85.8 36.3892 1,287 1,318
.. 1.7
3.4 77.3 57.8
1.3 35.9 17.2
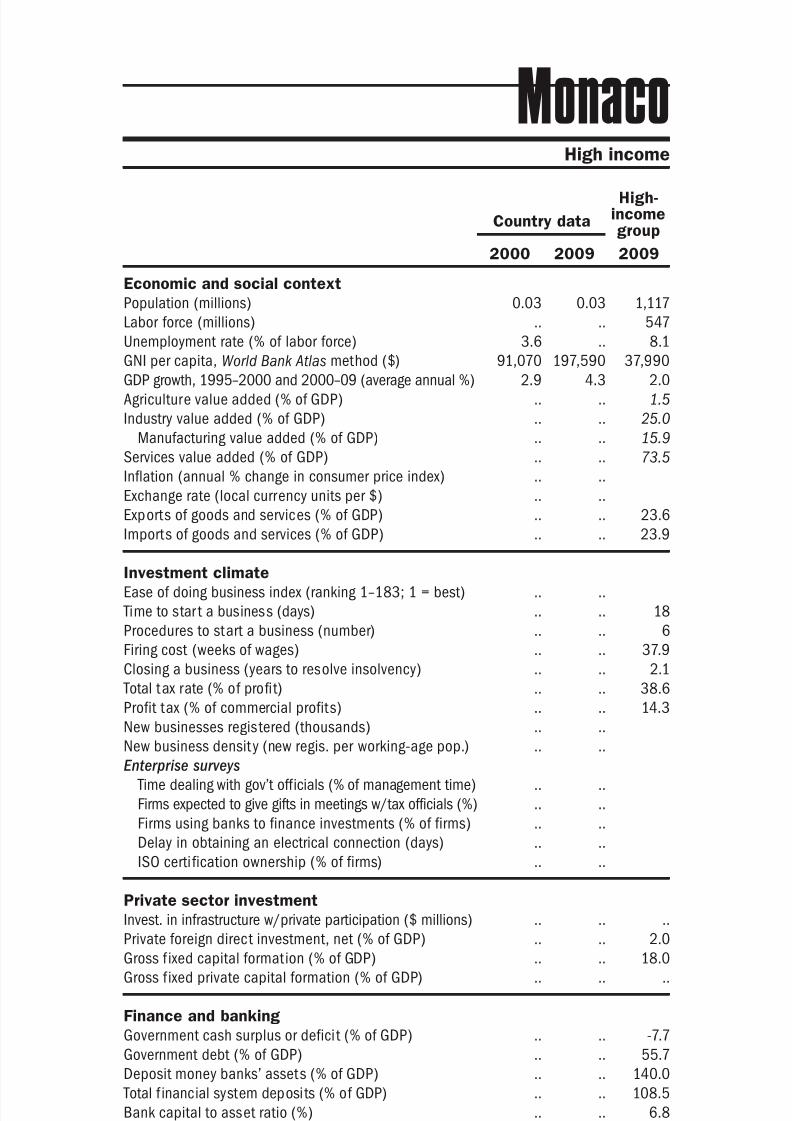
8/6/2019 The Little Data Book on Private Sector Development 2011
http://slidepdf.com/reader/full/the-little-data-book-on-private-sector-development-2011 155/246
Economic and social context
Population (millions)
Labor force (millions)
Unemployment rate (% of labor force)
GNI per capita, World Bank Atlas method ($)GDP growth, 1995–2000 and 2000–09 (average annual %)
Agriculture value added (% of GDP)
Industry value added (% of GDP)
Manufacturing value added (% of GDP)
Services value added (% of GDP)
Inflation (annual % change in consumer price index)
Exchange rate (local currency units per $)
Exports of goods and services (% of GDP)
Imports of goods and services (% of GDP) Investment climate
Ease of doing business index (ranking 1–183; 1 = best)
Time to star t a business (days)
Procedures to start a business (number)
Firing cost (weeks of wages)
Closing a business (years to resolve insolvency)
Total tax rate (% of profit)
Profit tax (% of commercial profits)New businesses registered (thousands)
New business density (new regis. per working-age pop.)
Enterprise surveys
Time dealing with gov’t officials (% of management time)
Firms expected to give gifts in meetings w/tax officials (%)
Firms using banks to finance investments (% of firms)
Delay in obtaining an electrical connection (days)
ISO certi fication ownership (% of firms)
Private sector investment
Invest. in infrastructure w/private participation ($ millions)
Private foreign direct investment, net (% of GDP)
Gross f ixed capital formation (% of GDP)
Gross f ixed private capital formation (% of GDP)
Finance and banking
Government cash surplus or deficit (% of GDP)
Government debt (% of GDP)
Deposit money banks’ assets (% of GDP) Total f inancial system deposits (% of GDP)
Bank capital to asset ratio (%)
Bank nonperforming loans to total gross loans ratio (%)
Domestic credit to the private sector (% of GDP)
Real interest rate (%)
Interest rate spread (percentage points)
Infrastructure
Paved roads (% of total roads)Electr ic power consumption (kWh per capita)
Power outages in a typical month (number)
Mobile cellular subscriptions (per 100 people)
Internet users (per 100 people)
147The Little Data Book on Private Sector Development 2011
High income
Country data
High-incomegroup
2000 2009 2009
Monaco
0.03 0.03 1,117
.. .. 547
3.6 .. 8.1
91,070 197,590 37,9902.9 4.3 2.0
.. .. 1.5
.. .. 25.0
.. .. 15.9
.. .. 73.5
.. ..
.. ..
.. .. 23.6
.. .. 23.9
.. ..
.. .. 18
.. .. 6
.. .. 37.9
.. .. 2.1
.. .. 38.6
.. .. 14.3.. ..
.. ..
.. ..
.. ..
.. ..
.. ..
.. ..
.. .. ..
.. .. 2.0
.. .. 18.0
.. .. ..
.. .. -7.7
.. .. 55.7
.. .. 140.0
.. .. 108.5
.. .. 6.8
.. .. 3.4
.. .. 165.1
.. ..
.. .. 3.8
100.0 100.0 93.4.. .. 9,518
.. ..
.. .. 111.2
.. .. 72.3
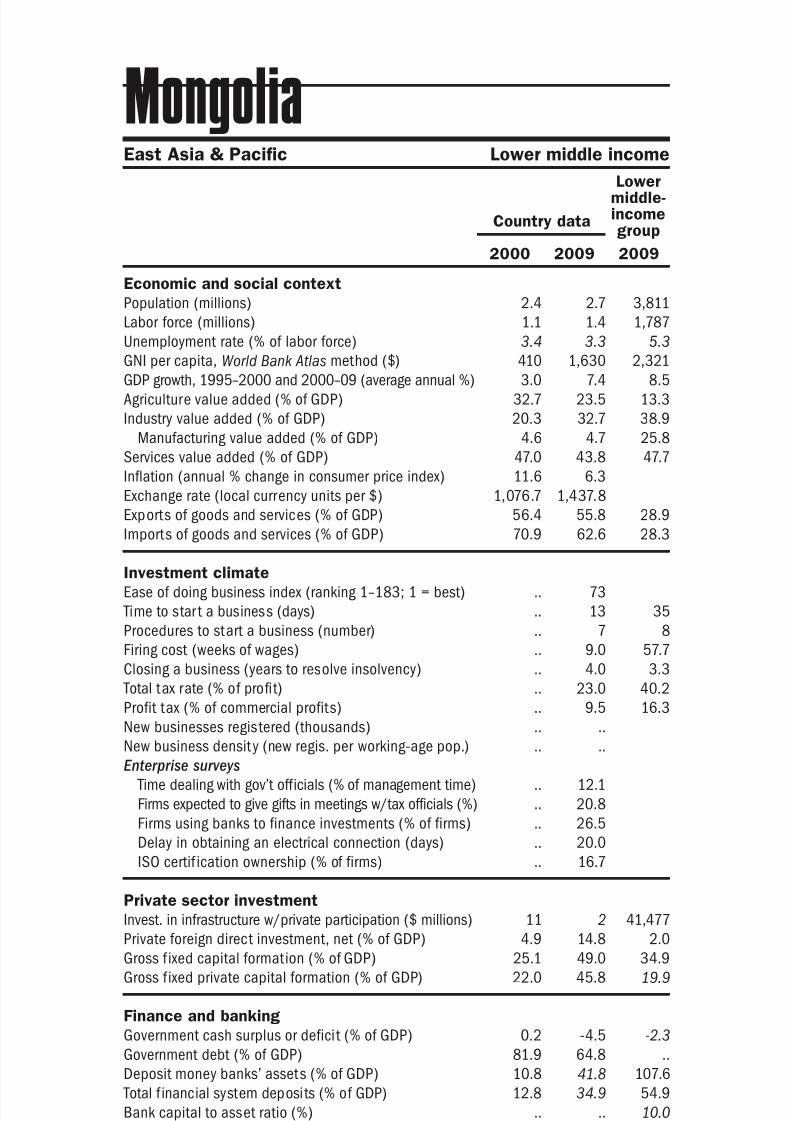
8/6/2019 The Little Data Book on Private Sector Development 2011
http://slidepdf.com/reader/full/the-little-data-book-on-private-sector-development-2011 156/246
Economic and social context
Population (millions)
Labor force (millions)
Unemployment rate (% of labor force)
GNI per capita, World Bank Atlas method ($)GDP growth, 1995–2000 and 2000–09 (average annual %)
Agriculture value added (% of GDP)
Industry value added (% of GDP)
Manufacturing value added (% of GDP)
Services value added (% of GDP)
Inflation (annual % change in consumer price index)
Exchange rate (local currency units per $)
Exports of goods and services (% of GDP)
Imports of goods and services (% of GDP) Investment climate
Ease of doing business index (ranking 1–183; 1 = best)
Time to star t a business (days)
Procedures to start a business (number)
Firing cost (weeks of wages)
Closing a business (years to resolve insolvency)
Total tax rate (% of profit)
Profit tax (% of commercial profits)New businesses registered (thousands)
New business density (new regis. per working-age pop.)
Enterprise surveys
Time dealing with gov’t officials (% of management time)
Firms expected to give gifts in meetings w/tax officials (%)
Firms using banks to finance investments (% of firms)
Delay in obtaining an electrical connection (days)
ISO certif ication ownership (% of firms)
Private sector investment
Invest. in infrastructure w/private participation ($ millions)
Private foreign direct investment, net (% of GDP)
Gross f ixed capital formation (% of GDP)
Gross f ixed private capital formation (% of GDP)
Finance and banking
Government cash surplus or deficit (% of GDP)
Government debt (% of GDP)
Deposit money banks’ assets (% of GDP) Total f inancial system deposits (% of GDP)
Bank capital to asset ratio (%)
Bank nonperforming loans to total gross loans ratio (%)
Domestic credit to the private sector (% of GDP)
Real interest rate (%)
Interest rate spread (percentage points)
Infrastructure
Paved roads (% of total roads)Electr ic power consumption (kWh per capita)
Power outages in a typical month (number)
Mobile cellular subscriptions (per 100 people)
Internet users (per 100 people)
148 2011 The Little Data Book on Private Sector Development
Country data
Lowermiddle-incomegroup
2000 2009 2009
East Asia & Pacific Lower middle income
Mongolia
2.4 2.7 3,811
1.1 1.4 1,787
3.4 3.3 5.3
410 1,630 2,3213.0 7.4 8.5
32.7 23.5 13.3
20.3 32.7 38.9
4.6 4.7 25.8
47.0 43.8 47.7
11.6 6.3
1,076.7 1,437.8
56.4 55.8 28.9
70.9 62.6 28.3
.. 73
.. 13 35
.. 7 8
.. 9.0 57.7
.. 4.0 3.3
.. 23.0 40.2
.. 9.5 16.3.. ..
.. ..
.. 12.1
.. 20.8
.. 26.5
.. 20.0
.. 16.7
11 2 41,477
4.9 14.8 2.0
25.1 49.0 34.9
22.0 45.8 19.9
0.2 -4.5 -2.3
81.9 64.8 ..
10.8 41.8 107.612.8 34.9 54.9
.. .. 10.0
.. .. 5.1
7.2 43.9 92.9
8.6 21.3
20.2 8.4 7.3
3.5 .. 36.31,080 1,473 1,318
.. 2.6
6.5 84.2 57.8
1.3 13.1 17.2
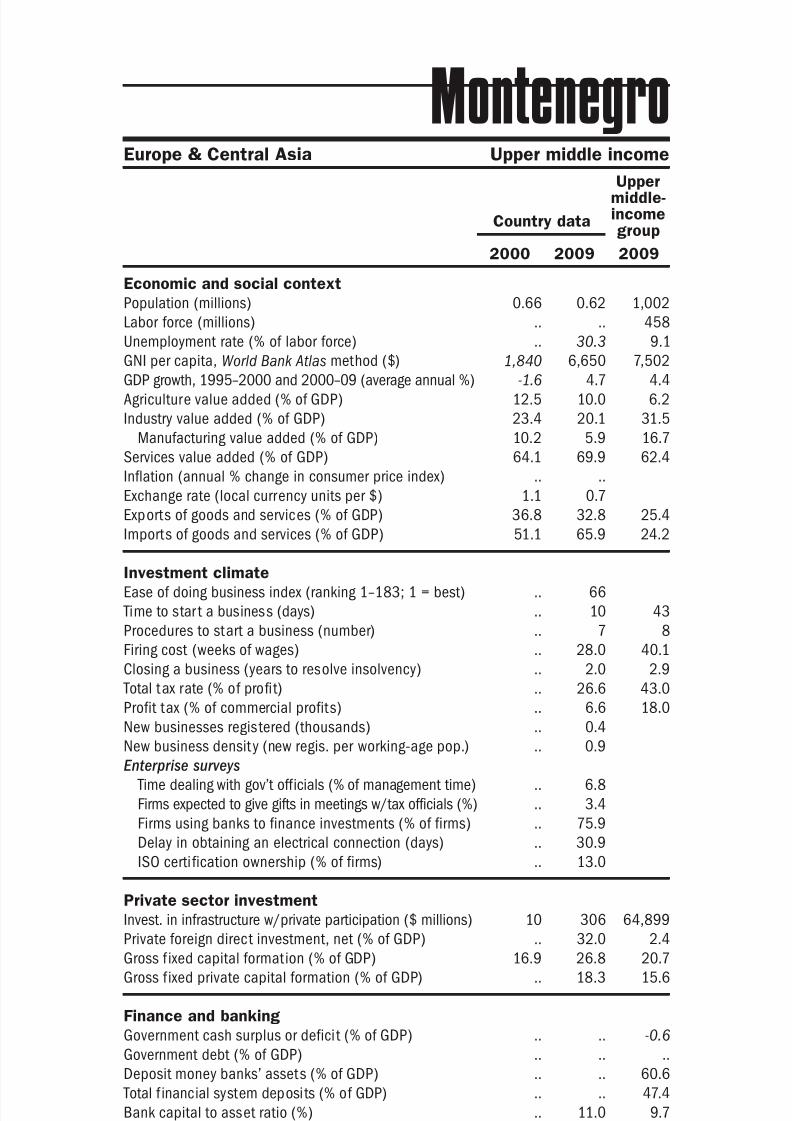
8/6/2019 The Little Data Book on Private Sector Development 2011
http://slidepdf.com/reader/full/the-little-data-book-on-private-sector-development-2011 157/246
Economic and social context
Population (millions)
Labor force (millions)
Unemployment rate (% of labor force)
GNI per capita, World Bank Atlas method ($)GDP growth, 1995–2000 and 2000–09 (average annual %)
Agriculture value added (% of GDP)
Industry value added (% of GDP)
Manufacturing value added (% of GDP)
Services value added (% of GDP)
Inflation (annual % change in consumer price index)
Exchange rate (local currency units per $)
Exports of goods and services (% of GDP)
Imports of goods and services (% of GDP) Investment climate
Ease of doing business index (ranking 1–183; 1 = best)
Time to star t a business (days)
Procedures to start a business (number)
Firing cost (weeks of wages)
Closing a business (years to resolve insolvency)
Total tax rate (% of profit)
Profit tax (% of commercial profits)New businesses registered (thousands)
New business density (new regis. per working-age pop.)
Enterprise surveys
Time dealing with gov’t officials (% of management time)
Firms expected to give gifts in meetings w/tax officials (%)
Firms using banks to finance investments (% of firms)
Delay in obtaining an electrical connection (days)
ISO certi fication ownership (% of firms)
Private sector investment
Invest. in infrastructure w/private participation ($ millions)
Private foreign direct investment, net (% of GDP)
Gross f ixed capital formation (% of GDP)
Gross f ixed private capital formation (% of GDP)
Finance and banking
Government cash surplus or deficit (% of GDP)
Government debt (% of GDP)
Deposit money banks’ assets (% of GDP) Total f inancial system deposits (% of GDP)
Bank capital to asset ratio (%)
Bank nonperforming loans to total gross loans ratio (%)
Domestic credit to the private sector (% of GDP)
Real interest rate (%)
Interest rate spread (percentage points)
Infrastructure
Paved roads (% of total roads)Electr ic power consumption (kWh per capita)
Power outages in a typical month (number)
Mobile cellular subscriptions (per 100 people)
Internet users (per 100 people)
149The Little Data Book on Private Sector Development 2011
Europe & Central Asia Upper middle income
Country data
Uppermiddle-incomegroup
2000 2009 2009
Montenegro
0.66 0.62 1,002
.. .. 458
.. 30.3 9.1
1,840 6,650 7,502-1.6 4.7 4.4
12.5 10.0 6.2
23.4 20.1 31.5
10.2 5.9 16.7
64.1 69.9 62.4
.. ..
1.1 0.7
36.8 32.8 25.4
51.1 65.9 24.2
.. 66
.. 10 43
.. 7 8
.. 28.0 40.1
.. 2.0 2.9
.. 26.6 43.0
.. 6.6 18.0.. 0.4
.. 0.9
.. 6.8
.. 3.4
.. 75.9
.. 30.9
.. 13.0
10 306 64,899
.. 32.0 2.4
16.9 26.8 20.7
.. 18.3 15.6
.. .. -0.6
.. .. ..
.. .. 60.6
.. .. 47.4
.. 11.0 9.7
.. 13.5 4.2
8.1 76.5 47.8
.. 6.7
.. 5.5 5.5
.. .. 36.8
.. .. 3,001
.. 7.0
.. 120.5 100.6
.. 44.9 34.6
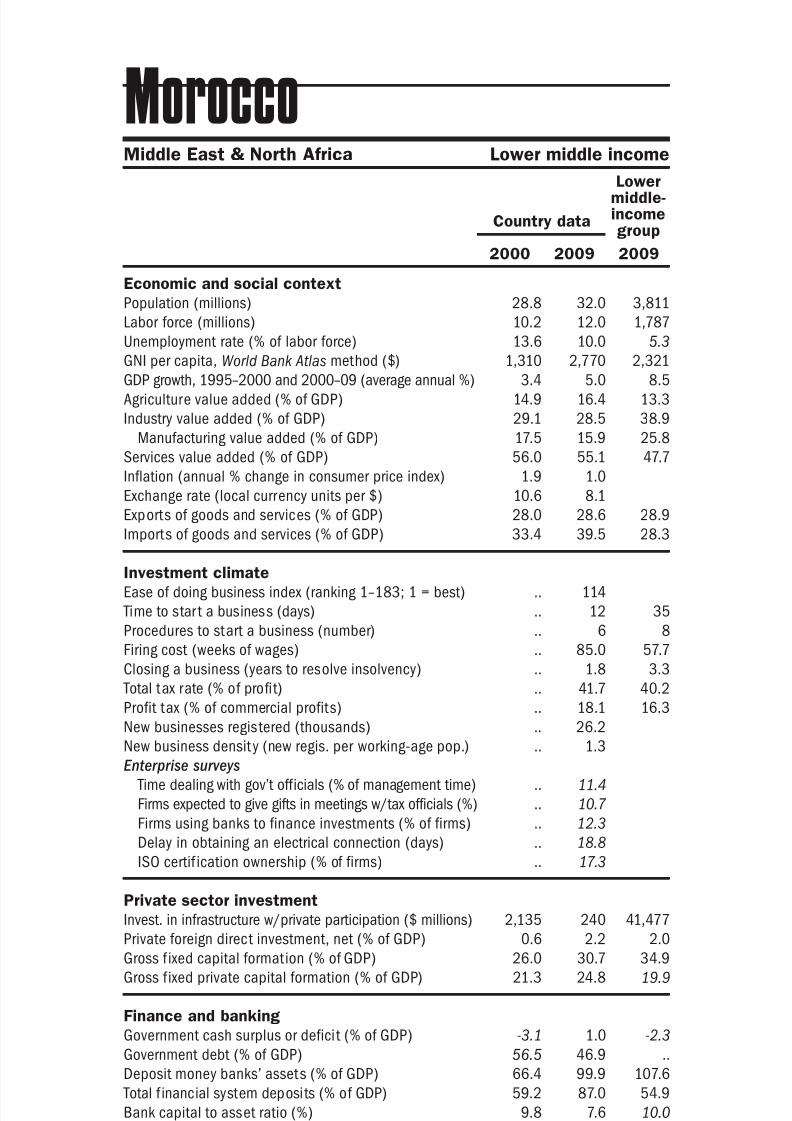
8/6/2019 The Little Data Book on Private Sector Development 2011
http://slidepdf.com/reader/full/the-little-data-book-on-private-sector-development-2011 158/246
Economic and social context
Population (millions)
Labor force (millions)
Unemployment rate (% of labor force)
GNI per capita, World Bank Atlas method ($)GDP growth, 1995–2000 and 2000–09 (average annual %)
Agriculture value added (% of GDP)
Industry value added (% of GDP)
Manufacturing value added (% of GDP)
Services value added (% of GDP)
Inflation (annual % change in consumer price index)
Exchange rate (local currency units per $)
Exports of goods and services (% of GDP)
Imports of goods and services (% of GDP) Investment climate
Ease of doing business index (ranking 1–183; 1 = best)
Time to star t a business (days)
Procedures to start a business (number)
Firing cost (weeks of wages)
Closing a business (years to resolve insolvency)
Total tax rate (% of profit)
Profit tax (% of commercial profits)New businesses registered (thousands)
New business density (new regis. per working-age pop.)
Enterprise surveys
Time dealing with gov’t officials (% of management time)
Firms expected to give gifts in meetings w/tax officials (%)
Firms using banks to finance investments (% of firms)
Delay in obtaining an electrical connection (days)
ISO certif ication ownership (% of firms)
Private sector investment
Invest. in infrastructure w/private participation ($ millions)
Private foreign direct investment, net (% of GDP)
Gross f ixed capital formation (% of GDP)
Gross f ixed private capital formation (% of GDP)
Finance and banking
Government cash surplus or deficit (% of GDP)
Government debt (% of GDP)
Deposit money banks’ assets (% of GDP) Total f inancial system deposits (% of GDP)
Bank capital to asset ratio (%)
Bank nonperforming loans to total gross loans ratio (%)
Domestic credit to the private sector (% of GDP)
Real interest rate (%)
Interest rate spread (percentage points)
Infrastructure
Paved roads (% of total roads)Electr ic power consumption (kWh per capita)
Power outages in a typical month (number)
Mobile cellular subscriptions (per 100 people)
Internet users (per 100 people)
150 2011 The Little Data Book on Private Sector Development
Country data
Lowermiddle-incomegroup
2000 2009 2009
Middle East & North Africa Lower middle income
Morocco
28.8 32.0 3,811
10.2 12.0 1,787
13.6 10.0 5.3
1,310 2,770 2,3213.4 5.0 8.5
14.9 16.4 13.3
29.1 28.5 38.9
17.5 15.9 25.8
56.0 55.1 47.7
1.9 1.0
10.6 8.1
28.0 28.6 28.9
33.4 39.5 28.3
.. 114
.. 12 35
.. 6 8
.. 85.0 57.7
.. 1.8 3.3
.. 41.7 40.2
.. 18.1 16.3.. 26.2
.. 1.3
.. 11.4
.. 10.7
.. 12.3
.. 18.8
.. 17.3
2,135 240 41,477
0.6 2.2 2.0
26.0 30.7 34.9
21.3 24.8 19.9
-3.1 1.0 -2.3
56.5 46.9 ..
66.4 99.9 107.659.2 87.0 54.9
9.8 7.6 10.0
17.5 5.5 5.1
51.0 64.4 92.9
14.0 9.9
8.2 8.0 7.3
56.4 67.8 36.3489 736 1,318
.. 2.5
8.1 79.1 57.8
0.7 32.2 17.2
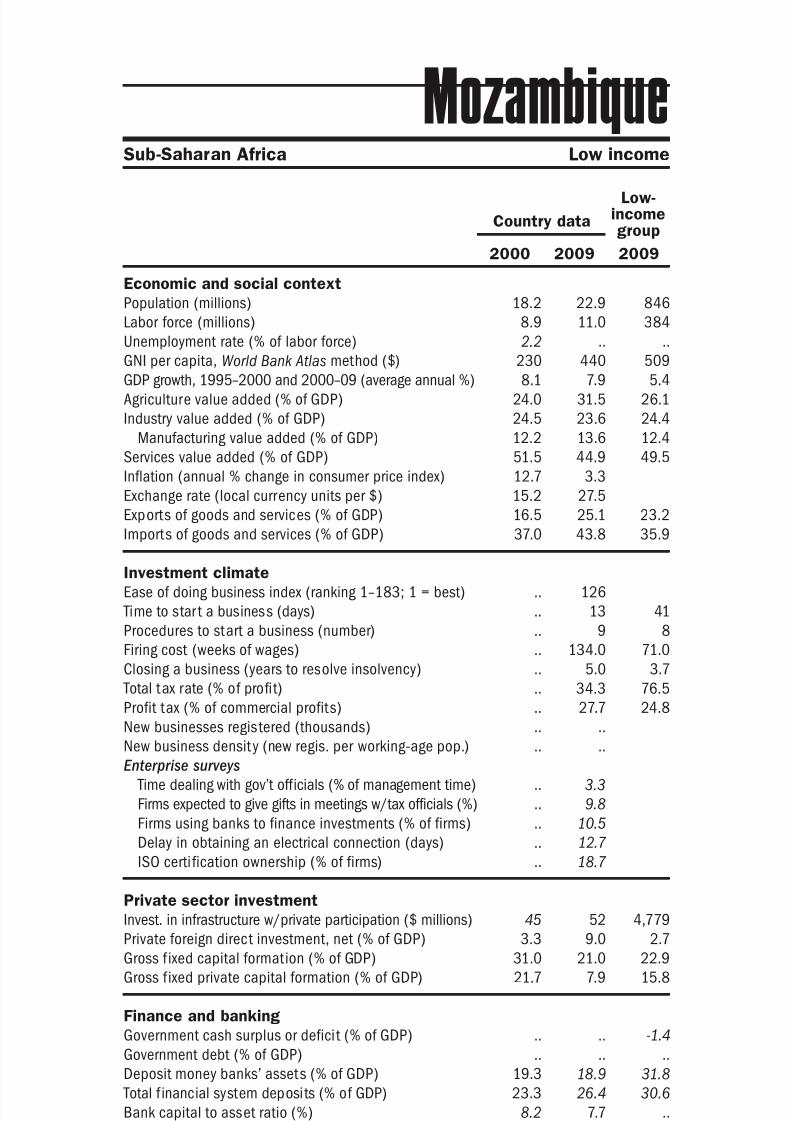
8/6/2019 The Little Data Book on Private Sector Development 2011
http://slidepdf.com/reader/full/the-little-data-book-on-private-sector-development-2011 159/246
Economic and social context
Population (millions)
Labor force (millions)
Unemployment rate (% of labor force)
GNI per capita, World Bank Atlas method ($)GDP growth, 1995–2000 and 2000–09 (average annual %)
Agriculture value added (% of GDP)
Industry value added (% of GDP)
Manufacturing value added (% of GDP)
Services value added (% of GDP)
Inflation (annual % change in consumer price index)
Exchange rate (local currency units per $)
Exports of goods and services (% of GDP)
Imports of goods and services (% of GDP) Investment climate
Ease of doing business index (ranking 1–183; 1 = best)
Time to star t a business (days)
Procedures to start a business (number)
Firing cost (weeks of wages)
Closing a business (years to resolve insolvency)
Total tax rate (% of profit)
Profit tax (% of commercial profits)New businesses registered (thousands)
New business density (new regis. per working-age pop.)
Enterprise surveys
Time dealing with gov’t officials (% of management time)
Firms expected to give gifts in meetings w/tax officials (%)
Firms using banks to finance investments (% of firms)
Delay in obtaining an electrical connection (days)
ISO certi fication ownership (% of firms)
Private sector investment
Invest. in infrastructure w/private participation ($ millions)
Private foreign direct investment, net (% of GDP)
Gross f ixed capital formation (% of GDP)
Gross f ixed private capital formation (% of GDP)
Finance and banking
Government cash surplus or deficit (% of GDP)
Government debt (% of GDP)
Deposit money banks’ assets (% of GDP) Total f inancial system deposits (% of GDP)
Bank capital to asset ratio (%)
Bank nonperforming loans to total gross loans ratio (%)
Domestic credit to the private sector (% of GDP)
Real interest rate (%)
Interest rate spread (percentage points)
Infrastructure
Paved roads (% of total roads)Electr ic power consumption (kWh per capita)
Power outages in a typical month (number)
Mobile cellular subscriptions (per 100 people)
Internet users (per 100 people)
151The Little Data Book on Private Sector Development 2011
Sub-Saharan Africa Low income
Country data
Low-incomegroup
2000 2009 2009
Mozambique
18.2 22.9 846
8.9 11.0 384
2.2 .. ..
230 440 5098.1 7.9 5.4
24.0 31.5 26.1
24.5 23.6 24.4
12.2 13.6 12.4
51.5 44.9 49.5
12.7 3.3
15.2 27.5
16.5 25.1 23.2
37.0 43.8 35.9
.. 126
.. 13 41
.. 9 8
.. 134.0 71.0
.. 5.0 3.7
.. 34.3 76.5
.. 27.7 24.8.. ..
.. ..
.. 3.3
.. 9.8
.. 10.5
.. 12.7
.. 18.7
45 52 4,779
3.3 9.0 2.7
31.0 21.0 22.9
21.7 7.9 15.8
.. .. -1.4
.. .. ..
19.3 18.9 31.823.3 26.4 30.6
8.2 7.7 ..
17.8 1.8 ..
16.7 25.1 26.3
6.3 12.0
9.3 6.2 11.5
18.7 20.8 12.0122 461 231
.. 3.0
0.3 26.1 26.6
0.1 2.7 2.7
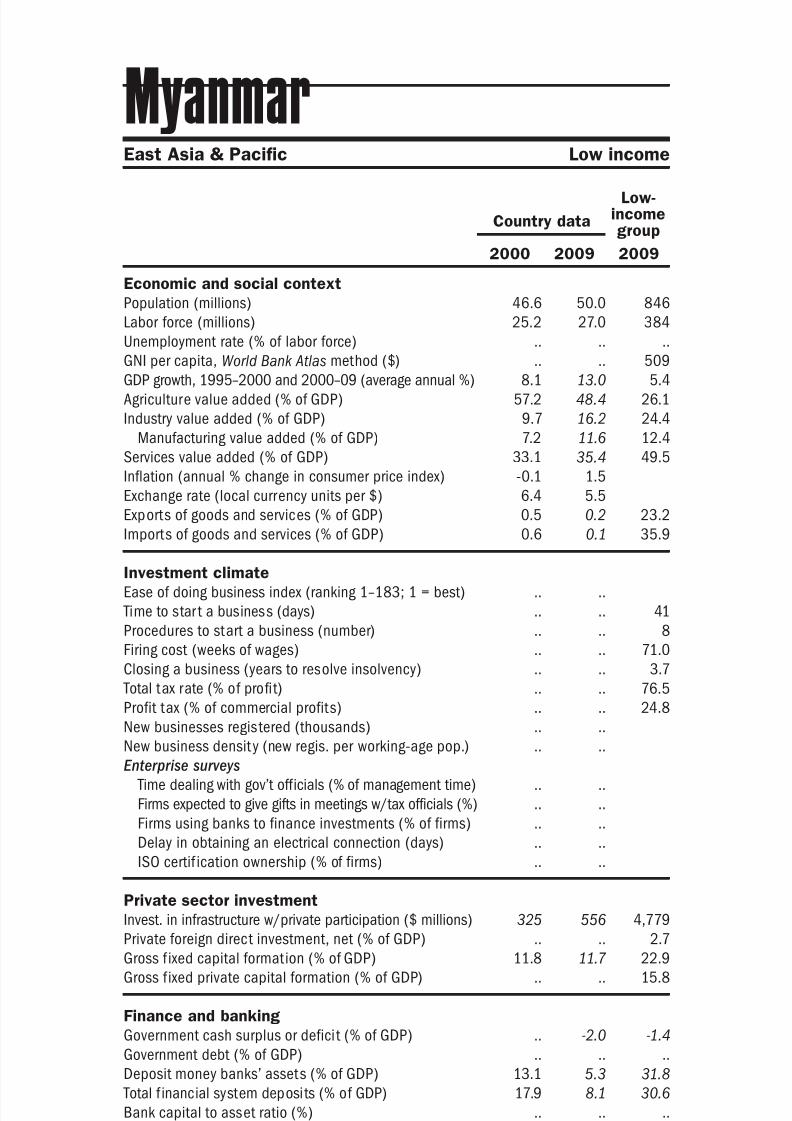
8/6/2019 The Little Data Book on Private Sector Development 2011
http://slidepdf.com/reader/full/the-little-data-book-on-private-sector-development-2011 160/246

8/6/2019 The Little Data Book on Private Sector Development 2011
http://slidepdf.com/reader/full/the-little-data-book-on-private-sector-development-2011 161/246
Economic and social context
Population (millions)
Labor force (millions)
Unemployment rate (% of labor force)
GNI per capita, World Bank Atlas method ($)GDP growth, 1995–2000 and 2000–09 (average annual %)
Agriculture value added (% of GDP)
Industry value added (% of GDP)
Manufacturing value added (% of GDP)
Services value added (% of GDP)
Inflation (annual % change in consumer price index)
Exchange rate (local currency units per $)
Exports of goods and services (% of GDP)
Imports of goods and services (% of GDP) Investment climate
Ease of doing business index (ranking 1–183; 1 = best)
Time to star t a business (days)
Procedures to start a business (number)
Firing cost (weeks of wages)
Closing a business (years to resolve insolvency)
Total tax rate (% of profit)
Profit tax (% of commercial profits)New businesses registered (thousands)
New business density (new regis. per working-age pop.)
Enterprise surveys
Time dealing with gov’t officials (% of management time)
Firms expected to give gifts in meetings w/tax officials (%)
Firms using banks to finance investments (% of firms)
Delay in obtaining an electrical connection (days)
ISO certi fication ownership (% of firms)
Private sector investment
Invest. in infrastructure w/private participation ($ millions)
Private foreign direct investment, net (% of GDP)
Gross f ixed capital formation (% of GDP)
Gross f ixed private capital formation (% of GDP)
Finance and banking
Government cash surplus or deficit (% of GDP)
Government debt (% of GDP)
Deposit money banks’ assets (% of GDP) Total f inancial system deposits (% of GDP)
Bank capital to asset ratio (%)
Bank nonperforming loans to total gross loans ratio (%)
Domestic credit to the private sector (% of GDP)
Real interest rate (%)
Interest rate spread (percentage points)
Infrastructure
Paved roads (% of total roads)Electr ic power consumption (kWh per capita)
Power outages in a typical month (number)
Mobile cellular subscriptions (per 100 people)
Internet users (per 100 people)
153The Little Data Book on Private Sector Development 2011
Sub-Saharan Africa Upper middle income
Country data
Uppermiddle-incomegroup
2000 2009 2009
Namibia
1.8 2.2 1,002
0.60 0.78 458
20.3 37.6 9.1
2,030 4,270 7,5023.5 5.3 4.4
11.8 9.4 6.2
28.0 32.7 31.5
12.8 14.7 16.7
60.2 58.0 62.4
.. 8.8
6.9 8.5
40.9 46.6 25.4
44.5 59.9 24.2
.. 69
.. 66 43
.. 10 8
.. 24.0 40.1
.. 1.5 2.9
.. 9.6 43.0
.. 4.0 18.0.. ..
.. ..
.. 2.9
.. 2.6
.. 8.1
.. 9.2
.. 17.6
10 9 64,899
3.0 5.3 2.4
16.6 24.7 20.7
11.1 15.6 15.6
-1.6 2.0 -0.6
.. .. ..
51.7 59.7 60.643.8 41.2 47.4
8.7 7.9 9.7
3.4 2.7 4.2
39.8 46.8 47.8
-9.0 4.4
7.9 4.9 5.5
13.6 .. 36.81,226 1,797 3,001
.. 1.6
4.5 56.1 100.6
1.6 5.9 34.6
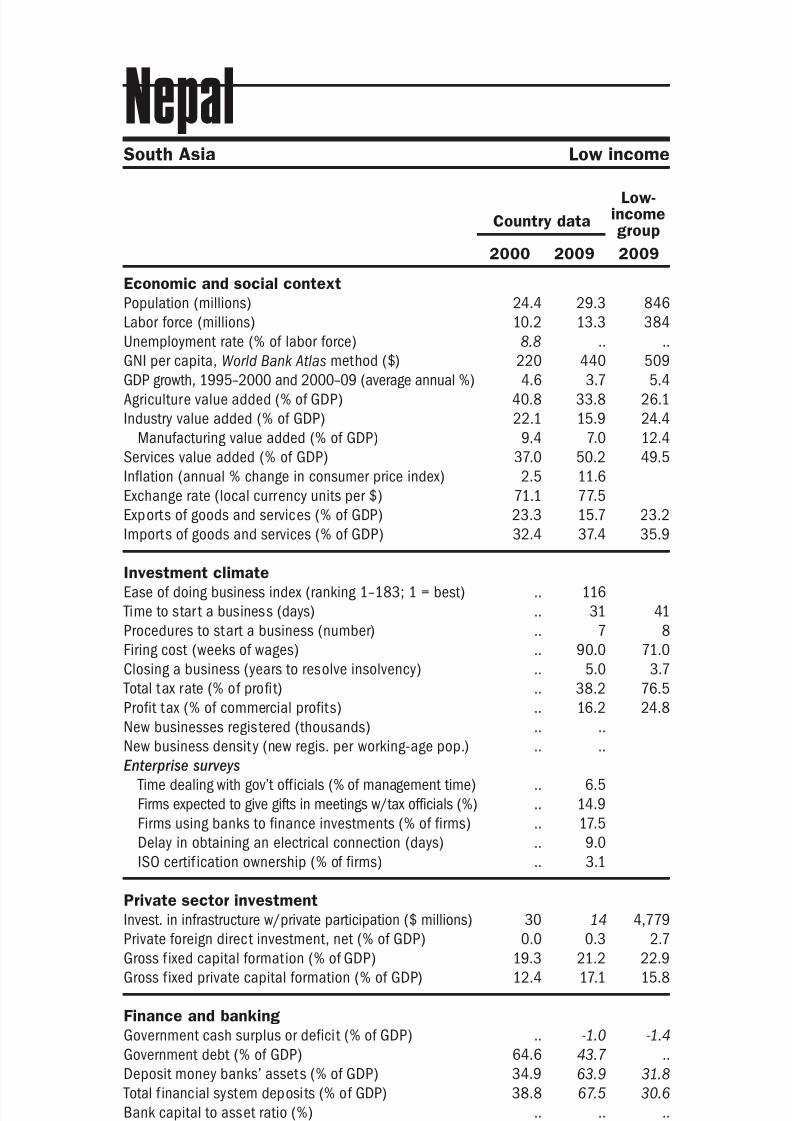
8/6/2019 The Little Data Book on Private Sector Development 2011
http://slidepdf.com/reader/full/the-little-data-book-on-private-sector-development-2011 162/246
Economic and social context
Population (millions)
Labor force (millions)
Unemployment rate (% of labor force)
GNI per capita, World Bank Atlas method ($)GDP growth, 1995–2000 and 2000–09 (average annual %)
Agriculture value added (% of GDP)
Industry value added (% of GDP)
Manufacturing value added (% of GDP)
Services value added (% of GDP)
Inflation (annual % change in consumer price index)
Exchange rate (local currency units per $)
Exports of goods and services (% of GDP)
Imports of goods and services (% of GDP) Investment climate
Ease of doing business index (ranking 1–183; 1 = best)
Time to star t a business (days)
Procedures to start a business (number)
Firing cost (weeks of wages)
Closing a business (years to resolve insolvency)
Total tax rate (% of profit)
Profit tax (% of commercial profits)New businesses registered (thousands)
New business density (new regis. per working-age pop.)
Enterprise surveys
Time dealing with gov’t officials (% of management time)
Firms expected to give gifts in meetings w/tax officials (%)
Firms using banks to finance investments (% of firms)
Delay in obtaining an electrical connection (days)
ISO certif ication ownership (% of firms)
Private sector investment
Invest. in infrastructure w/private participation ($ millions)
Private foreign direct investment, net (% of GDP)
Gross f ixed capital formation (% of GDP)
Gross f ixed private capital formation (% of GDP)
Finance and banking
Government cash surplus or deficit (% of GDP)
Government debt (% of GDP)
Deposit money banks’ assets (% of GDP) Total f inancial system deposits (% of GDP)
Bank capital to asset ratio (%)
Bank nonperforming loans to total gross loans ratio (%)
Domestic credit to the private sector (% of GDP)
Real interest rate (%)
Interest rate spread (percentage points)
Infrastructure
Paved roads (% of total roads)Electr ic power consumption (kWh per capita)
Power outages in a typical month (number)
Mobile cellular subscriptions (per 100 people)
Internet users (per 100 people)
154 2011 The Little Data Book on Private Sector Development
Country data
Low-incomegroup
2000 2009 2009
South Asia Low income
Nepal
24.4 29.3 846
10.2 13.3 384
8.8 .. ..
220 440 5094.6 3.7 5.4
40.8 33.8 26.1
22.1 15.9 24.4
9.4 7.0 12.4
37.0 50.2 49.5
2.5 11.6
71.1 77.5
23.3 15.7 23.2
32.4 37.4 35.9
.. 116
.. 31 41
.. 7 8
.. 90.0 71.0
.. 5.0 3.7
.. 38.2 76.5
.. 16.2 24.8.. ..
.. ..
.. 6.5
.. 14.9
.. 17.5
.. 9.0
.. 3.1
30 14 4,779
0.0 0.3 2.7
19.3 21.2 22.9
12.4 17.1 15.8
.. -1.0 -1.4
64.6 43.7 ..
34.9 63.9 31.838.8 67.5 30.6
.. .. ..
.. .. ..
30.7 59.4 26.3
4.8 -3.6
3.5 5.5 11.5
.. 55.9 12.058 89 231
.. 52.0
0.0 26.0 26.6
0.2 2.1 2.7
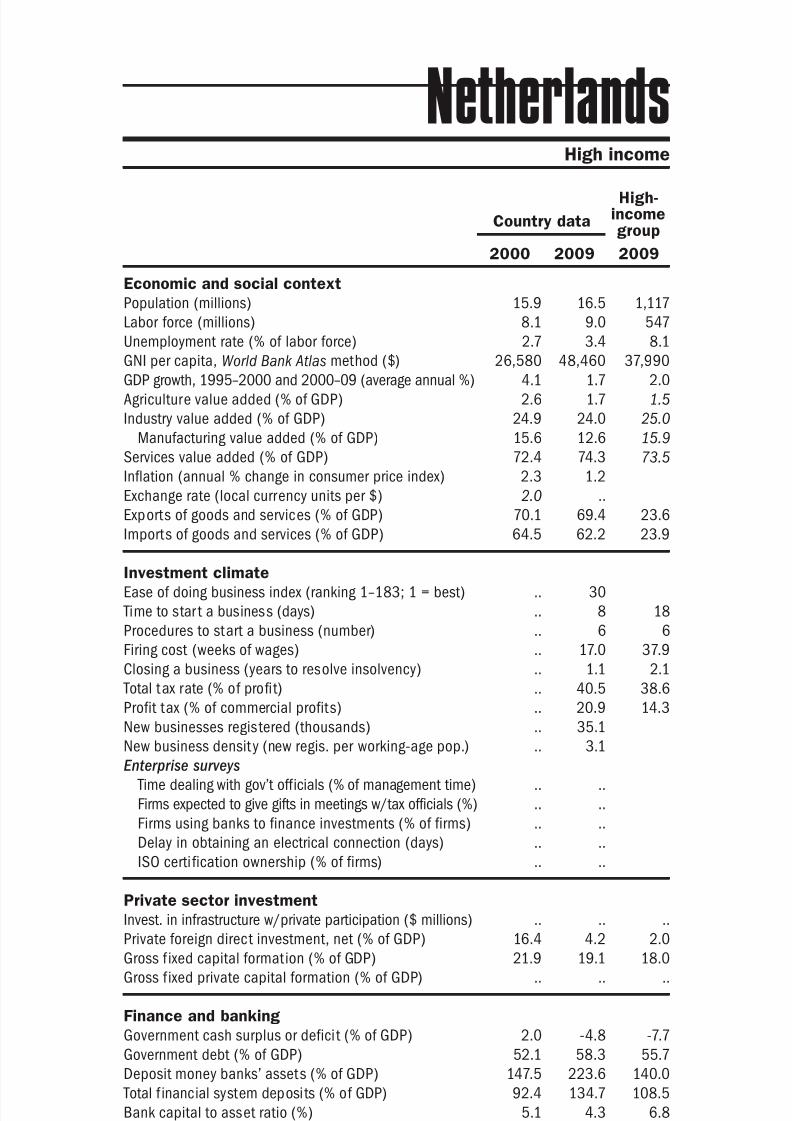
8/6/2019 The Little Data Book on Private Sector Development 2011
http://slidepdf.com/reader/full/the-little-data-book-on-private-sector-development-2011 163/246
Economic and social context
Population (millions)
Labor force (millions)
Unemployment rate (% of labor force)
GNI per capita, World Bank Atlas method ($)GDP growth, 1995–2000 and 2000–09 (average annual %)
Agriculture value added (% of GDP)
Industry value added (% of GDP)
Manufacturing value added (% of GDP)
Services value added (% of GDP)
Inflation (annual % change in consumer price index)
Exchange rate (local currency units per $)
Exports of goods and services (% of GDP)
Imports of goods and services (% of GDP) Investment climate
Ease of doing business index (ranking 1–183; 1 = best)
Time to star t a business (days)
Procedures to start a business (number)
Firing cost (weeks of wages)
Closing a business (years to resolve insolvency)
Total tax rate (% of profit)
Profit tax (% of commercial profits)New businesses registered (thousands)
New business density (new regis. per working-age pop.)
Enterprise surveys
Time dealing with gov’t officials (% of management time)
Firms expected to give gifts in meetings w/tax officials (%)
Firms using banks to finance investments (% of firms)
Delay in obtaining an electrical connection (days)
ISO certi fication ownership (% of firms)
Private sector investment
Invest. in infrastructure w/private participation ($ millions)
Private foreign direct investment, net (% of GDP)
Gross f ixed capital formation (% of GDP)
Gross f ixed private capital formation (% of GDP)
Finance and banking
Government cash surplus or deficit (% of GDP)
Government debt (% of GDP)
Deposit money banks’ assets (% of GDP) Total f inancial system deposits (% of GDP)
Bank capital to asset ratio (%)
Bank nonperforming loans to total gross loans ratio (%)
Domestic credit to the private sector (% of GDP)
Real interest rate (%)
Interest rate spread (percentage points)
Infrastructure
Paved roads (% of total roads)Electr ic power consumption (kWh per capita)
Power outages in a typical month (number)
Mobile cellular subscriptions (per 100 people)
Internet users (per 100 people)
155The Little Data Book on Private Sector Development 2011
High income
Country data
High-incomegroup
2000 2009 2009
Netherlands
15.9 16.5 1,117
8.1 9.0 547
2.7 3.4 8.1
26,580 48,460 37,9904.1 1.7 2.0
2.6 1.7 1.5
24.9 24.0 25.0
15.6 12.6 15.9
72.4 74.3 73.5
2.3 1.2
2.0 ..
70.1 69.4 23.6
64.5 62.2 23.9
.. 30
.. 8 18
.. 6 6
.. 17.0 37.9
.. 1.1 2.1
.. 40.5 38.6
.. 20.9 14.3.. 35.1
.. 3.1
.. ..
.. ..
.. ..
.. ..
.. ..
.. .. ..
16.4 4.2 2.0
21.9 19.1 18.0
.. .. ..
2.0 -4.8 -7.7
52.1 58.3 55.7
147.5 223.6 140.092.4 134.7 108.5
5.1 4.3 6.8
1.8 0.8 3.4
134.2 215.3 165.1
0.6 2.3
1.9 -0.6 3.8
90.0 .. 93.46,560 7,226 9,518
.. ..
67.5 128.1 111.2
44.0 90.0 72.3

8/6/2019 The Little Data Book on Private Sector Development 2011
http://slidepdf.com/reader/full/the-little-data-book-on-private-sector-development-2011 164/246
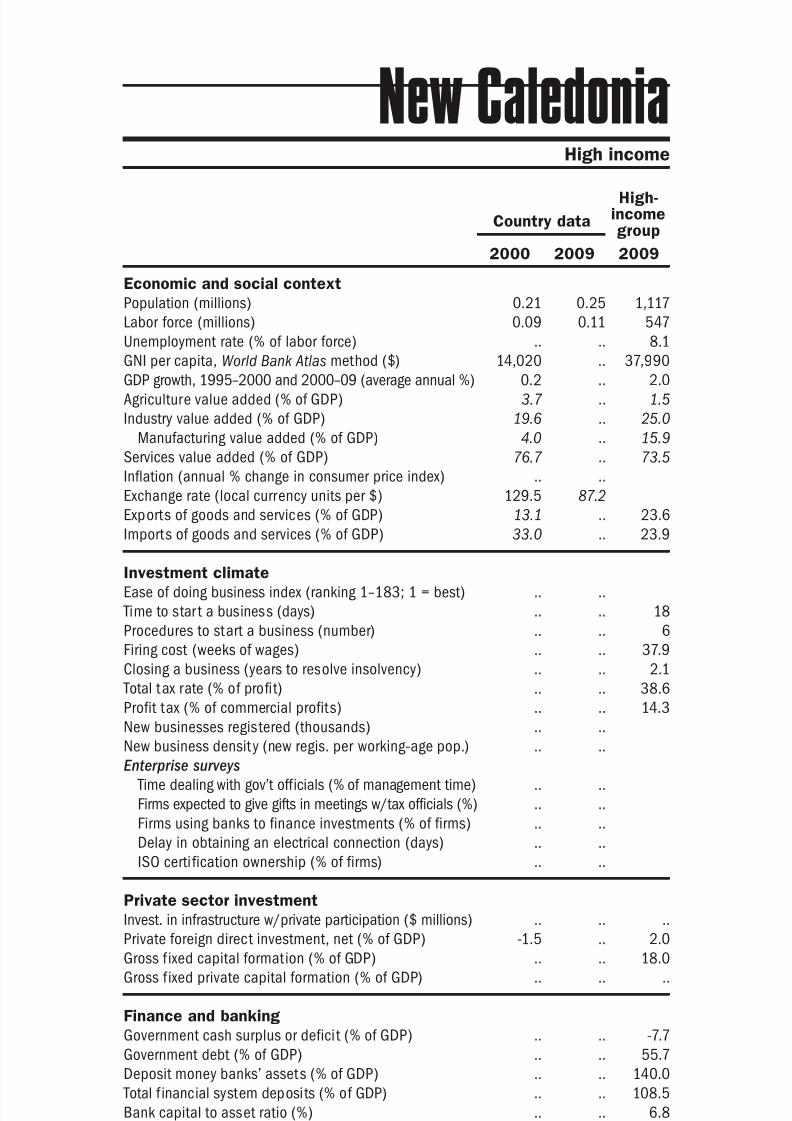
8/6/2019 The Little Data Book on Private Sector Development 2011
http://slidepdf.com/reader/full/the-little-data-book-on-private-sector-development-2011 165/246
Economic and social context
Population (millions)
Labor force (millions)
Unemployment rate (% of labor force)
GNI per capita, World Bank Atlas method ($)GDP growth, 1995–2000 and 2000–09 (average annual %)
Agriculture value added (% of GDP)
Industry value added (% of GDP)
Manufacturing value added (% of GDP)
Services value added (% of GDP)
Inflation (annual % change in consumer price index)
Exchange rate (local currency units per $)
Exports of goods and services (% of GDP)
Imports of goods and services (% of GDP) Investment climate
Ease of doing business index (ranking 1–183; 1 = best)
Time to star t a business (days)
Procedures to start a business (number)
Firing cost (weeks of wages)
Closing a business (years to resolve insolvency)
Total tax rate (% of profit)
Profit tax (% of commercial profits)New businesses registered (thousands)
New business density (new regis. per working-age pop.)
Enterprise surveys
Time dealing with gov’t officials (% of management time)
Firms expected to give gifts in meetings w/tax officials (%)
Firms using banks to finance investments (% of firms)
Delay in obtaining an electrical connection (days)
ISO certi fication ownership (% of firms)
Private sector investment
Invest. in infrastructure w/private participation ($ millions)
Private foreign direct investment, net (% of GDP)
Gross f ixed capital formation (% of GDP)
Gross f ixed private capital formation (% of GDP)
Finance and banking
Government cash surplus or deficit (% of GDP)
Government debt (% of GDP)
Deposit money banks’ assets (% of GDP) Total f inancial system deposits (% of GDP)
Bank capital to asset ratio (%)
Bank nonperforming loans to total gross loans ratio (%)
Domestic credit to the private sector (% of GDP)
Real interest rate (%)
Interest rate spread (percentage points)
Infrastructure
Paved roads (% of total roads)Electr ic power consumption (kWh per capita)
Power outages in a typical month (number)
Mobile cellular subscriptions (per 100 people)
Internet users (per 100 people)
157The Little Data Book on Private Sector Development 2011
High income
Country data
High-incomegroup
2000 2009 2009
New Caledonia
0.21 0.25 1,117
0.09 0.11 547
.. .. 8.1
14,020 .. 37,9900.2 .. 2.0
3.7 .. 1.5
19.6 .. 25.0
4.0 .. 15.9
76.7 .. 73.5
.. ..
129.5 87.2
13.1 .. 23.6
33.0 .. 23.9
.. ..
.. .. 18
.. .. 6
.. .. 37.9
.. .. 2.1
.. .. 38.6
.. .. 14.3.. ..
.. ..
.. ..
.. ..
.. ..
.. ..
.. ..
.. .. ..
-1.5 .. 2.0
.. .. 18.0
.. .. ..
.. .. -7.7
.. .. 55.7
.. .. 140.0
.. .. 108.5
.. .. 6.8
.. .. 3.4
.. .. 165.1
.. ..
.. .. 3.8
.. .. 93.4
.. .. 9,518
.. ..
23.4 83.1 111.2
14.1 34.0 72.3

8/6/2019 The Little Data Book on Private Sector Development 2011
http://slidepdf.com/reader/full/the-little-data-book-on-private-sector-development-2011 166/246
Economic and social context
Population (millions)
Labor force (millions)
Unemployment rate (% of labor force)
GNI per capita, World Bank Atlas method ($)GDP growth, 1995–2000 and 2000–09 (average annual %)
Agriculture value added (% of GDP)
Industry value added (% of GDP)
Manufacturing value added (% of GDP)
Services value added (% of GDP)
Inflation (annual % change in consumer price index)
Exchange rate (local currency units per $)
Exports of goods and services (% of GDP)
Imports of goods and services (% of GDP) Investment climate
Ease of doing business index (ranking 1–183; 1 = best)
Time to star t a business (days)
Procedures to start a business (number)
Firing cost (weeks of wages)
Closing a business (years to resolve insolvency)
Total tax rate (% of profit)
Profit tax (% of commercial profits)New businesses registered (thousands)
New business density (new regis. per working-age pop.)
Enterprise surveys
Time dealing with gov’t officials (% of management time)
Firms expected to give gifts in meetings w/tax officials (%)
Firms using banks to finance investments (% of firms)
Delay in obtaining an electrical connection (days)
ISO certif ication ownership (% of firms)
Private sector investment
Invest. in infrastructure w/private participation ($ millions)
Private foreign direct investment, net (% of GDP)
Gross f ixed capital formation (% of GDP)
Gross f ixed private capital formation (% of GDP)
Finance and banking
Government cash surplus or deficit (% of GDP)
Government debt (% of GDP)
Deposit money banks’ assets (% of GDP) Total f inancial system deposits (% of GDP)
Bank capital to asset ratio (%)
Bank nonperforming loans to total gross loans ratio (%)
Domestic credit to the private sector (% of GDP)
Real interest rate (%)
Interest rate spread (percentage points)
Infrastructure
Paved roads (% of total roads)Electr ic power consumption (kWh per capita)
Power outages in a typical month (number)
Mobile cellular subscriptions (per 100 people)
Internet users (per 100 people)
158 2011 The Little Data Book on Private Sector Development
Country data
High-incomegroup
2000 2009 2009
High income
New Zealand
3.9 4.3 1,117
1.9 2.4 547
6.2 6.1 8.1
13,620 28,810 37,9902.5 2.5 2.0
8.8 5.6 1.5
25.1 25.0 25.0
16.7 15.1 15.9
66.1 69.4 73.5
3.0 1.9
2.2 1.6
35.1 28.2 23.6
33.5 26.5 23.9
.. 3
.. 1 18
.. 1 6
.. .. 37.9
.. 1.3 2.1
.. 34.3 38.6
.. 30.4 14.3.. 47.9
.. 17.1
.. ..
.. ..
.. ..
.. ..
.. ..
.. .. ..
2.9 -1.0 2.0
20.1 19.4 18.0
.. .. ..
1.7 3.1 -7.7
33.5 37.9 55.7
116.1 154.4 140.078.7 91.0 108.5
.. .. 6.8
.. .. 3.4
110.4 147.0 165.1
5.9 8.6
2.9 6.3 3.8
62.8 65.9 93.49,413 9,492 9,518
.. ..
40.0 108.9 111.2
47.5 83.4 72.3

8/6/2019 The Little Data Book on Private Sector Development 2011
http://slidepdf.com/reader/full/the-little-data-book-on-private-sector-development-2011 167/246
Economic and social context
Population (millions)
Labor force (millions)
Unemployment rate (% of labor force)
GNI per capita, World Bank Atlas method ($)GDP growth, 1995–2000 and 2000–09 (average annual %)
Agriculture value added (% of GDP)
Industry value added (% of GDP)
Manufacturing value added (% of GDP)
Services value added (% of GDP)
Inflation (annual % change in consumer price index)
Exchange rate (local currency units per $)
Exports of goods and services (% of GDP)
Imports of goods and services (% of GDP) Investment climate
Ease of doing business index (ranking 1–183; 1 = best)
Time to star t a business (days)
Procedures to start a business (number)
Firing cost (weeks of wages)
Closing a business (years to resolve insolvency)
Total tax rate (% of profit)
Profit tax (% of commercial profits)New businesses registered (thousands)
New business density (new regis. per working-age pop.)
Enterprise surveys
Time dealing with gov’t officials (% of management time)
Firms expected to give gifts in meetings w/tax officials (%)
Firms using banks to finance investments (% of firms)
Delay in obtaining an electrical connection (days)
ISO certi fication ownership (% of firms)
Private sector investment
Invest. in infrastructure w/private participation ($ millions)
Private foreign direct investment, net (% of GDP)
Gross f ixed capital formation (% of GDP)
Gross f ixed private capital formation (% of GDP)
Finance and banking
Government cash surplus or deficit (% of GDP)
Government debt (% of GDP)
Deposit money banks’ assets (% of GDP) Total f inancial system deposits (% of GDP)
Bank capital to asset ratio (%)
Bank nonperforming loans to total gross loans ratio (%)
Domestic credit to the private sector (% of GDP)
Real interest rate (%)
Interest rate spread (percentage points)
Infrastructure
Paved roads (% of total roads)Electr ic power consumption (kWh per capita)
Power outages in a typical month (number)
Mobile cellular subscriptions (per 100 people)
Internet users (per 100 people)
159The Little Data Book on Private Sector Development 2011
Latin America & Caribbean Lower middle income
Country data
Lowermiddle-incomegroup
2000 2009 2009
Nicaragua
5.1 5.7 3,811
1.9 2.3 1,787
9.8 5.0 5.3
730 1,000 2,3215.0 3.3 8.5
20.9 19.0 13.3
28.2 29.6 38.9
17.0 20.0 25.8
50.9 51.4 47.7
7.1 3.7
12.7 20.3
23.9 35.1 28.9
51.1 61.2 28.3
.. 117
.. 39 35
.. 6 8
.. 22.0 57.7
.. 2.2 3.3
.. 63.2 40.2
.. 24.8 16.3.. ..
.. ..
.. 9.3
.. 2.6
.. 13.0
.. 62.7
.. 18.7
219 53 41,477
6.8 7.1 2.0
26.5 27.3 34.9
19.8 20.2 19.9
-3.6 -2.3 -2.3
.. .. ..
33.8 33.4 107.634.4 37.1 54.9
6.3 .. 10.0
5.2 .. 5.1
31.1 34.4 92.9
8.8 -2.0
7.3 8.0 7.3
11.1 12.0 36.3337 457 1,318
.. 12.5
1.8 55.8 57.8
1.0 3.5 17.2
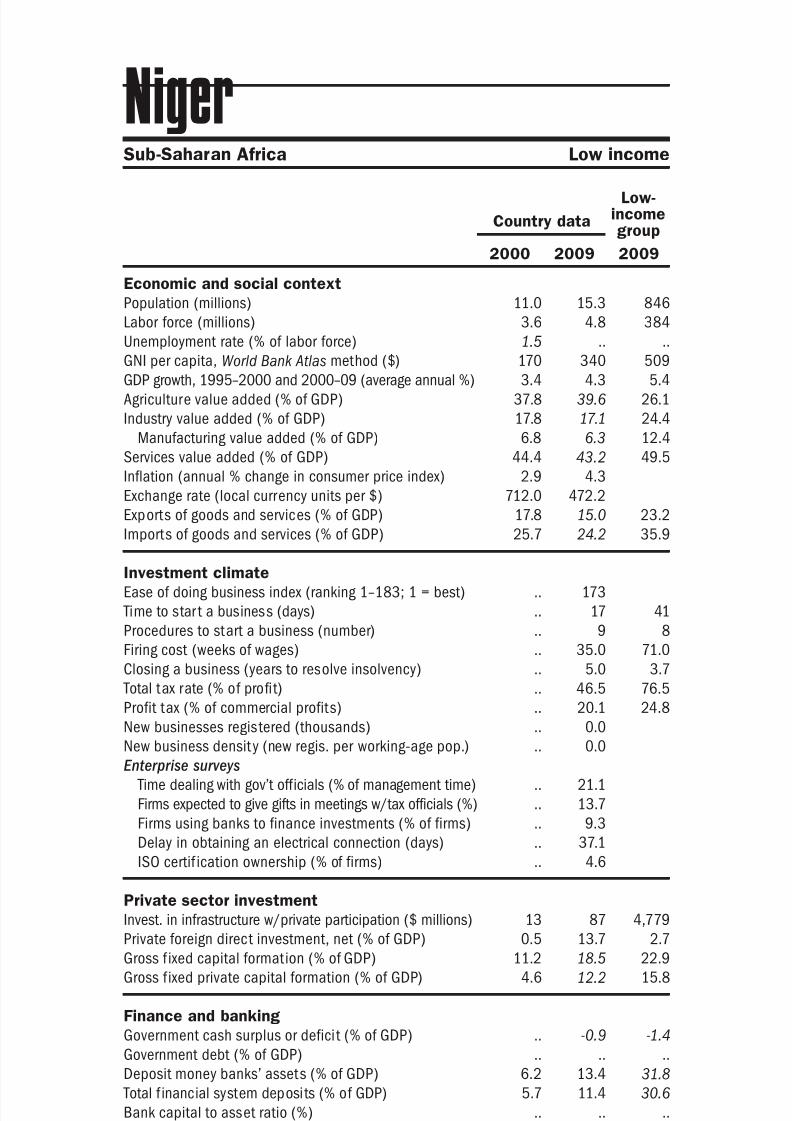
8/6/2019 The Little Data Book on Private Sector Development 2011
http://slidepdf.com/reader/full/the-little-data-book-on-private-sector-development-2011 168/246
Economic and social context
Population (millions)
Labor force (millions)
Unemployment rate (% of labor force)
GNI per capita, World Bank Atlas method ($)GDP growth, 1995–2000 and 2000–09 (average annual %)
Agriculture value added (% of GDP)
Industry value added (% of GDP)
Manufacturing value added (% of GDP)
Services value added (% of GDP)
Inflation (annual % change in consumer price index)
Exchange rate (local currency units per $)
Exports of goods and services (% of GDP)
Imports of goods and services (% of GDP) Investment climate
Ease of doing business index (ranking 1–183; 1 = best)
Time to star t a business (days)
Procedures to start a business (number)
Firing cost (weeks of wages)
Closing a business (years to resolve insolvency)
Total tax rate (% of profit)
Profit tax (% of commercial profits)New businesses registered (thousands)
New business density (new regis. per working-age pop.)
Enterprise surveys
Time dealing with gov’t officials (% of management time)
Firms expected to give gifts in meetings w/tax officials (%)
Firms using banks to finance investments (% of firms)
Delay in obtaining an electrical connection (days)
ISO certif ication ownership (% of firms)
Private sector investment
Invest. in infrastructure w/private participation ($ millions)
Private foreign direct investment, net (% of GDP)
Gross f ixed capital formation (% of GDP)
Gross f ixed private capital formation (% of GDP)
Finance and banking
Government cash surplus or deficit (% of GDP)
Government debt (% of GDP)
Deposit money banks’ assets (% of GDP) Total f inancial system deposits (% of GDP)
Bank capital to asset ratio (%)
Bank nonperforming loans to total gross loans ratio (%)
Domestic credit to the private sector (% of GDP)
Real interest rate (%)
Interest rate spread (percentage points)
Infrastructure
Paved roads (% of total roads)Electr ic power consumption (kWh per capita)
Power outages in a typical month (number)
Mobile cellular subscriptions (per 100 people)
Internet users (per 100 people)
160 2011 The Little Data Book on Private Sector Development
Country data
Low-incomegroup
2000 2009 2009
Sub-Saharan Africa Low income
Niger
11.0 15.3 846
3.6 4.8 384
1.5 .. ..
170 340 5093.4 4.3 5.4
37.8 39.6 26.1
17.8 17.1 24.4
6.8 6.3 12.4
44.4 43.2 49.5
2.9 4.3
712.0 472.2
17.8 15.0 23.2
25.7 24.2 35.9
.. 173
.. 17 41
.. 9 8
.. 35.0 71.0
.. 5.0 3.7
.. 46.5 76.5
.. 20.1 24.8.. 0.0
.. 0.0
.. 21.1
.. 13.7
.. 9.3
.. 37.1
.. 4.6
13 87 4,779
0.5 13.7 2.7
11.2 18.5 22.9
4.6 12.2 15.8
.. -0.9 -1.4
.. .. ..
6.2 13.4 31.85.7 11.4 30.6
.. .. ..
.. .. ..
4.8 12.2 26.3
.. ..
.. .. 11.5
25.7 20.7 12.0.. .. 231
.. 20.1
0.0 17.0 26.6
0.0 0.8 2.7

8/6/2019 The Little Data Book on Private Sector Development 2011
http://slidepdf.com/reader/full/the-little-data-book-on-private-sector-development-2011 169/246
Economic and social context
Population (millions)
Labor force (millions)
Unemployment rate (% of labor force)
GNI per capita, World Bank Atlas method ($)GDP growth, 1995–2000 and 2000–09 (average annual %)
Agriculture value added (% of GDP)
Industry value added (% of GDP)
Manufacturing value added (% of GDP)
Services value added (% of GDP)
Inflation (annual % change in consumer price index)
Exchange rate (local currency units per $)
Exports of goods and services (% of GDP)
Imports of goods and services (% of GDP) Investment climate
Ease of doing business index (ranking 1–183; 1 = best)
Time to star t a business (days)
Procedures to start a business (number)
Firing cost (weeks of wages)
Closing a business (years to resolve insolvency)
Total tax rate (% of profit)
Profit tax (% of commercial profits)New businesses registered (thousands)
New business density (new regis. per working-age pop.)
Enterprise surveys
Time dealing with gov’t officials (% of management time)
Firms expected to give gifts in meetings w/tax officials (%)
Firms using banks to finance investments (% of firms)
Delay in obtaining an electrical connection (days)
ISO certi fication ownership (% of firms)
Private sector investment
Invest. in infrastructure w/private participation ($ millions)
Private foreign direct investment, net (% of GDP)
Gross f ixed capital formation (% of GDP)
Gross f ixed private capital formation (% of GDP)
Finance and banking
Government cash surplus or deficit (% of GDP)
Government debt (% of GDP)
Deposit money banks’ assets (% of GDP) Total f inancial system deposits (% of GDP)
Bank capital to asset ratio (%)
Bank nonperforming loans to total gross loans ratio (%)
Domestic credit to the private sector (% of GDP)
Real interest rate (%)
Interest rate spread (percentage points)
Infrastructure
Paved roads (% of total roads)Electr ic power consumption (kWh per capita)
Power outages in a typical month (number)
Mobile cellular subscriptions (per 100 people)
Internet users (per 100 people)
161The Little Data Book on Private Sector Development 2011
Country data
Lowermiddle-incomegroup
2000 2009 2009
Sub-Saharan Africa Lower middle income
Nigeria
124.8 154.7 3,811
39.2 50.0 1,787
.. .. 5.3
270 1,190 2,3212.7 6.6 8.5
48.6 32.7 13.3
30.5 40.7 38.9
3.4 2.6 25.8
20.9 26.6 47.7
6.9 11.5
101.7 148.9
54.0 35.9 28.9
32.0 27.2 28.3
.. 137
.. 31 35
.. 8 8
.. 50.0 57.7
.. 2.0 3.3
.. 32.2 40.2
.. 21.8 16.3.. 65.1
.. 0.8
.. 6.1
.. 22.9
.. 2.7
.. 7.5
.. 8.5
76 3,057 41,477
2.5 3.3 2.0
.. .. 34.9
.. .. 19.9
.. -1.7 -2.3
.. 3.0 ..
17.7 45.2 107.614.9 33.7 54.9
7.4 18.4 10.0
22.6 6.6 5.1
12.5 37.6 92.9
-12.2 19.1
9.6 5.1 7.3
.. 15.0 36.373 126 1,318
.. 26.3
0.0 47.2 57.8
0.1 28.4 17.2

8/6/2019 The Little Data Book on Private Sector Development 2011
http://slidepdf.com/reader/full/the-little-data-book-on-private-sector-development-2011 170/246
Economic and social context
Population (millions)
Labor force (millions)
Unemployment rate (% of labor force)
GNI per capita, World Bank Atlas method ($)GDP growth, 1995–2000 and 2000–09 (average annual %)
Agriculture value added (% of GDP)
Industry value added (% of GDP)
Manufacturing value added (% of GDP)
Services value added (% of GDP)
Inflation (annual % change in consumer price index)
Exchange rate (local currency units per $)
Exports of goods and services (% of GDP)
Imports of goods and services (% of GDP) Investment climate
Ease of doing business index (ranking 1–183; 1 = best)
Time to star t a business (days)
Procedures to start a business (number)
Firing cost (weeks of wages)
Closing a business (years to resolve insolvency)
Total tax rate (% of profit)
Profit tax (% of commercial profits)New businesses registered (thousands)
New business density (new regis. per working-age pop.)
Enterprise surveys
Time dealing with gov’t officials (% of management time)
Firms expected to give gifts in meetings w/tax officials (%)
Firms using banks to finance investments (% of firms)
Delay in obtaining an electrical connection (days)
ISO certif ication ownership (% of firms)
Private sector investment
Invest. in infrastructure w/private participation ($ millions)
Private foreign direct investment, net (% of GDP)
Gross f ixed capital formation (% of GDP)
Gross f ixed private capital formation (% of GDP)
Finance and banking
Government cash surplus or deficit (% of GDP)
Government debt (% of GDP)
Deposit money banks’ assets (% of GDP) Total f inancial system deposits (% of GDP)
Bank capital to asset ratio (%)
Bank nonperforming loans to total gross loans ratio (%)
Domestic credit to the private sector (% of GDP)
Real interest rate (%)
Interest rate spread (percentage points)
Infrastructure
Paved roads (% of total roads)Electr ic power consumption (kWh per capita)
Power outages in a typical month (number)
Mobile cellular subscriptions (per 100 people)
Internet users (per 100 people)
162 2011 The Little Data Book on Private Sector Development
Country data
High-incomegroup
2000 2009 2009
High income
Northern Mariana Islands
0.07 0.09 1,117
.. .. 547
3.8 8.3 8.1
.. .. 37,990
.. .. 2.0
.. .. 1.5
.. .. 25.0
.. .. 15.9
.. .. 73.5
.. ..
.. ..
.. .. 23.6
.. .. 23.9
.. ..
.. .. 18
.. .. 6
.. .. 37.9
.. .. 2.1
.. .. 38.6
.. .. 14.3.. ..
.. ..
.. ..
.. ..
.. ..
.. ..
.. ..
.. .. ..
.. .. 2.0
.. .. 18.0
.. .. ..
.. .. -7.7
.. .. 55.7
.. .. 140.0
.. .. 108.5
.. .. 6.8
.. .. 3.4
.. .. 165.1
.. ..
.. .. 3.8
.. .. 93.4
.. .. 9,518
.. ..
4.3 26.2 111.2
.. .. 72.3

8/6/2019 The Little Data Book on Private Sector Development 2011
http://slidepdf.com/reader/full/the-little-data-book-on-private-sector-development-2011 171/246
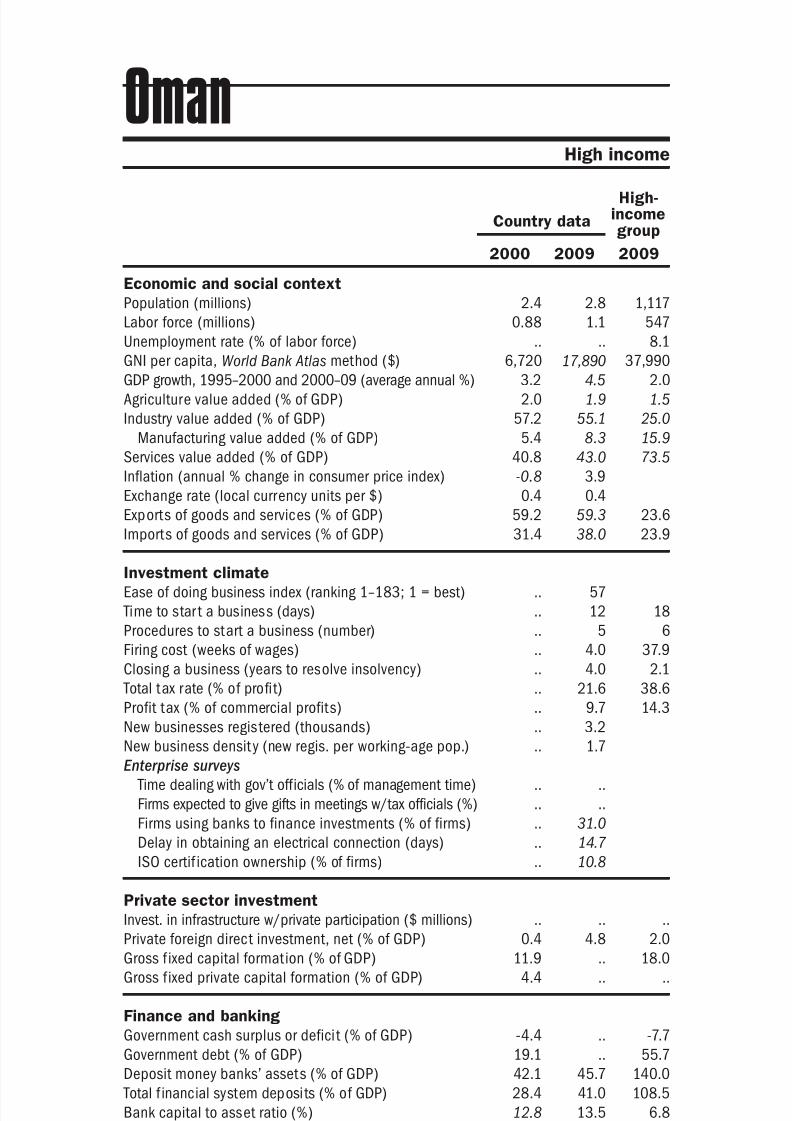
8/6/2019 The Little Data Book on Private Sector Development 2011
http://slidepdf.com/reader/full/the-little-data-book-on-private-sector-development-2011 172/246
Economic and social context
Population (millions)
Labor force (millions)
Unemployment rate (% of labor force)
GNI per capita, World Bank Atlas method ($)GDP growth, 1995–2000 and 2000–09 (average annual %)
Agriculture value added (% of GDP)
Industry value added (% of GDP)
Manufacturing value added (% of GDP)
Services value added (% of GDP)
Inflation (annual % change in consumer price index)
Exchange rate (local currency units per $)
Exports of goods and services (% of GDP)
Imports of goods and services (% of GDP) Investment climate
Ease of doing business index (ranking 1–183; 1 = best)
Time to star t a business (days)
Procedures to start a business (number)
Firing cost (weeks of wages)
Closing a business (years to resolve insolvency)
Total tax rate (% of profit)
Profit tax (% of commercial profits)New businesses registered (thousands)
New business density (new regis. per working-age pop.)
Enterprise surveys
Time dealing with gov’t officials (% of management time)
Firms expected to give gifts in meetings w/tax officials (%)
Firms using banks to finance investments (% of firms)
Delay in obtaining an electrical connection (days)
ISO certif ication ownership (% of firms)
Private sector investment
Invest. in infrastructure w/private participation ($ millions)
Private foreign direct investment, net (% of GDP)
Gross f ixed capital formation (% of GDP)
Gross f ixed private capital formation (% of GDP)
Finance and banking
Government cash surplus or deficit (% of GDP)
Government debt (% of GDP)
Deposit money banks’ assets (% of GDP) Total f inancial system deposits (% of GDP)
Bank capital to asset ratio (%)
Bank nonperforming loans to total gross loans ratio (%)
Domestic credit to the private sector (% of GDP)
Real interest rate (%)
Interest rate spread (percentage points)
Infrastructure
Paved roads (% of total roads)Electr ic power consumption (kWh per capita)
Power outages in a typical month (number)
Mobile cellular subscriptions (per 100 people)
Internet users (per 100 people)
164 2011 The Little Data Book on Private Sector Development
High income
Country data
High-incomegroup
2000 2009 2009
Oman
2.4 2.8 1,117
0.88 1.1 547
.. .. 8.1
6,720 17,890 37,9903.2 4.5 2.0
2.0 1.9 1.5
57.2 55.1 25.0
5.4 8.3 15.9
40.8 43.0 73.5
-0.8 3.9
0.4 0.4
59.2 59.3 23.6
31.4 38.0 23.9
.. 57
.. 12 18
.. 5 6
.. 4.0 37.9
.. 4.0 2.1
.. 21.6 38.6
.. 9.7 14.3.. 3.2
.. 1.7
.. ..
.. ..
.. 31.0
.. 14.7
.. 10.8
.. .. ..
0.4 4.8 2.0
11.9 .. 18.0
4.4 .. ..
-4.4 .. -7.7
19.1 .. 55.7
42.1 45.7 140.028.4 41.0 108.5
12.8 13.5 6.8
11.3 3.5 3.4
36.8 49.0 165.1
-8.3 -16.0
2.4 3.3 3.8
30.0 43.5 93.43,153 4,894 9,518
.. ..
6.7 139.5 111.2
3.5 43.5 72.3

8/6/2019 The Little Data Book on Private Sector Development 2011
http://slidepdf.com/reader/full/the-little-data-book-on-private-sector-development-2011 173/246
Economic and social context
Population (millions)
Labor force (millions)
Unemployment rate (% of labor force)
GNI per capita, World Bank Atlas method ($)GDP growth, 1995–2000 and 2000–09 (average annual %)
Agriculture value added (% of GDP)
Industry value added (% of GDP)
Manufacturing value added (% of GDP)
Services value added (% of GDP)
Inflation (annual % change in consumer price index)
Exchange rate (local currency units per $)
Exports of goods and services (% of GDP)
Imports of goods and services (% of GDP) Investment climate
Ease of doing business index (ranking 1–183; 1 = best)
Time to star t a business (days)
Procedures to start a business (number)
Firing cost (weeks of wages)
Closing a business (years to resolve insolvency)
Total tax rate (% of profit)
Profit tax (% of commercial profits)New businesses registered (thousands)
New business density (new regis. per working-age pop.)
Enterprise surveys
Time dealing with gov’t officials (% of management time)
Firms expected to give gifts in meetings w/tax officials (%)
Firms using banks to finance investments (% of firms)
Delay in obtaining an electrical connection (days)
ISO certi fication ownership (% of firms)
Private sector investment
Invest. in infrastructure w/private participation ($ millions)
Private foreign direct investment, net (% of GDP)
Gross f ixed capital formation (% of GDP)
Gross f ixed private capital formation (% of GDP)
Finance and banking
Government cash surplus or deficit (% of GDP)
Government debt (% of GDP)
Deposit money banks’ assets (% of GDP) Total f inancial system deposits (% of GDP)
Bank capital to asset ratio (%)
Bank nonperforming loans to total gross loans ratio (%)
Domestic credit to the private sector (% of GDP)
Real interest rate (%)
Interest rate spread (percentage points)
Infrastructure
Paved roads (% of total roads)Electr ic power consumption (kWh per capita)
Power outages in a typical month (number)
Mobile cellular subscriptions (per 100 people)
Internet users (per 100 people)
165The Little Data Book on Private Sector Development 2011
Country data
Lowermiddle-incomegroup
2000 2009 2009
South Asia Lower middle income
Pakistan
138.1 169.7 3,811
41.6 58.1 1,787
7.2 5.0 5.3
490 1,000 2,3213.0 5.2 8.5
25.9 21.6 13.3
23.3 24.3 38.9
14.7 17.1 25.8
50.7 54.2 47.7
4.4 13.6
53.6 81.7
13.4 12.8 28.9
14.7 20.4 28.3
.. 83
.. 21 35
.. 10 8
.. 90.0 57.7
.. 2.8 3.3
.. 31.6 40.2
.. 14.3 16.3.. 2.8
.. 0.0
8.7 2.2
.. 58.8
14.6 9.7
.. 106.3
17.0 9.6
77 2,732 41,477
0.4 1.5 2.0
15.9 17.4 34.9
10.3 12.7 19.9
-4.1 -4.8 -2.3
79.1 .. ..
32.0 38.4 107.627.7 31.6 54.9
4.9 10.1 10.0
19.5 12.2 5.1
22.3 23.5 92.9
.. -4.6
.. 5.9 7.3
56.0 65.4 36.3374 436 1,318
.. 34.1
0.2 60.7 57.8
1.4 12.0 17.2
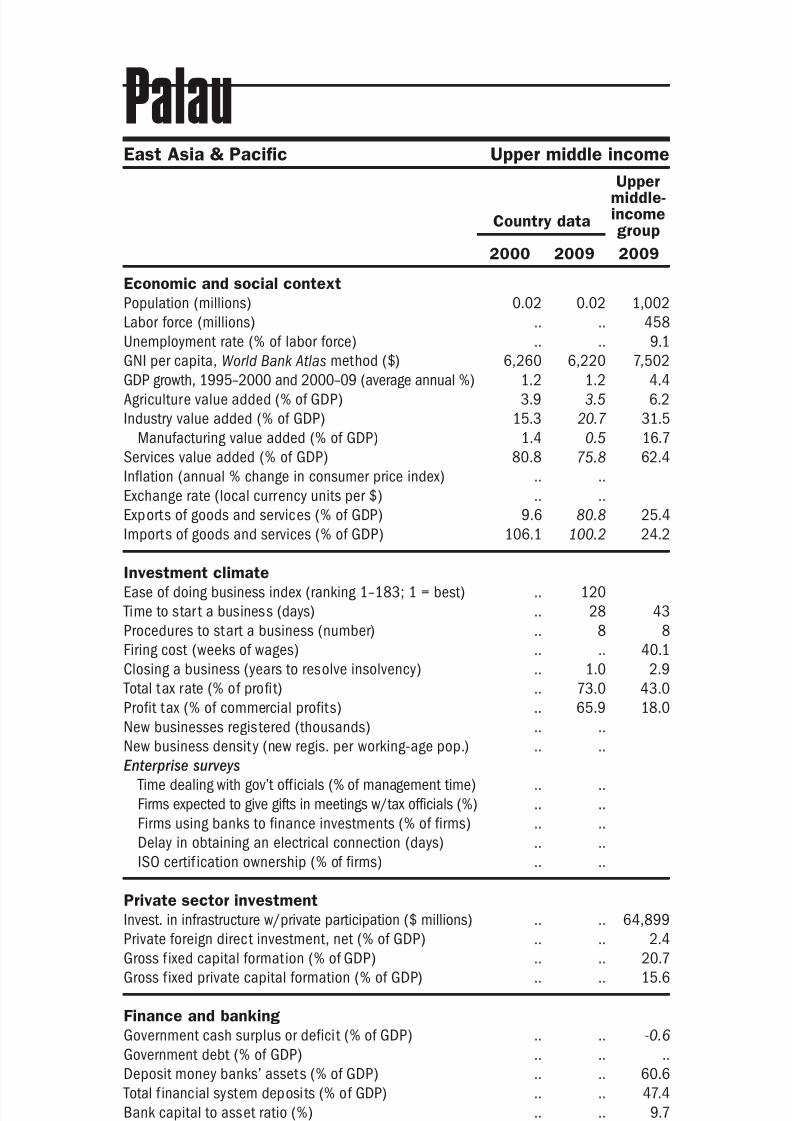
8/6/2019 The Little Data Book on Private Sector Development 2011
http://slidepdf.com/reader/full/the-little-data-book-on-private-sector-development-2011 174/246
Economic and social context
Population (millions)
Labor force (millions)
Unemployment rate (% of labor force)
GNI per capita, World Bank Atlas method ($)GDP growth, 1995–2000 and 2000–09 (average annual %)
Agriculture value added (% of GDP)
Industry value added (% of GDP)
Manufacturing value added (% of GDP)
Services value added (% of GDP)
Inflation (annual % change in consumer price index)
Exchange rate (local currency units per $)
Exports of goods and services (% of GDP)
Imports of goods and services (% of GDP) Investment climate
Ease of doing business index (ranking 1–183; 1 = best)
Time to star t a business (days)
Procedures to start a business (number)
Firing cost (weeks of wages)
Closing a business (years to resolve insolvency)
Total tax rate (% of profit)
Profit tax (% of commercial profits)New businesses registered (thousands)
New business density (new regis. per working-age pop.)
Enterprise surveys
Time dealing with gov’t officials (% of management time)
Firms expected to give gifts in meetings w/tax officials (%)
Firms using banks to finance investments (% of firms)
Delay in obtaining an electrical connection (days)
ISO certif ication ownership (% of firms)
Private sector investment
Invest. in infrastructure w/private participation ($ millions)
Private foreign direct investment, net (% of GDP)
Gross f ixed capital formation (% of GDP)
Gross f ixed private capital formation (% of GDP)
Finance and banking
Government cash surplus or deficit (% of GDP)
Government debt (% of GDP)
Deposit money banks’ assets (% of GDP) Total f inancial system deposits (% of GDP)
Bank capital to asset ratio (%)
Bank nonperforming loans to total gross loans ratio (%)
Domestic credit to the private sector (% of GDP)
Real interest rate (%)
Interest rate spread (percentage points)
Infrastructure
Paved roads (% of total roads)Electr ic power consumption (kWh per capita)
Power outages in a typical month (number)
Mobile cellular subscriptions (per 100 people)
Internet users (per 100 people)
166 2011 The Little Data Book on Private Sector Development
East Asia & Pacific Upper middle income
Country data
Uppermiddle-incomegroup
2000 2009 2009
Palau
0.02 0.02 1,002
.. .. 458
.. .. 9.1
6,260 6,220 7,5021.2 1.2 4.4
3.9 3.5 6.2
15.3 20.7 31.5
1.4 0.5 16.7
80.8 75.8 62.4
.. ..
.. ..
9.6 80.8 25.4
106.1 100.2 24.2
.. 120
.. 28 43
.. 8 8
.. .. 40.1
.. 1.0 2.9
.. 73.0 43.0
.. 65.9 18.0.. ..
.. ..
.. ..
.. ..
.. ..
.. ..
.. ..
.. .. 64,899
.. .. 2.4
.. .. 20.7
.. .. 15.6
.. .. -0.6
.. .. ..
.. .. 60.6
.. .. 47.4
.. .. 9.7
.. .. 4.2
.. .. 47.8
.. ..
.. .. 5.5
.. .. 36.8
.. .. 3,001
.. ..
12.3 64.5 100.6
20.0 27.3 34.6
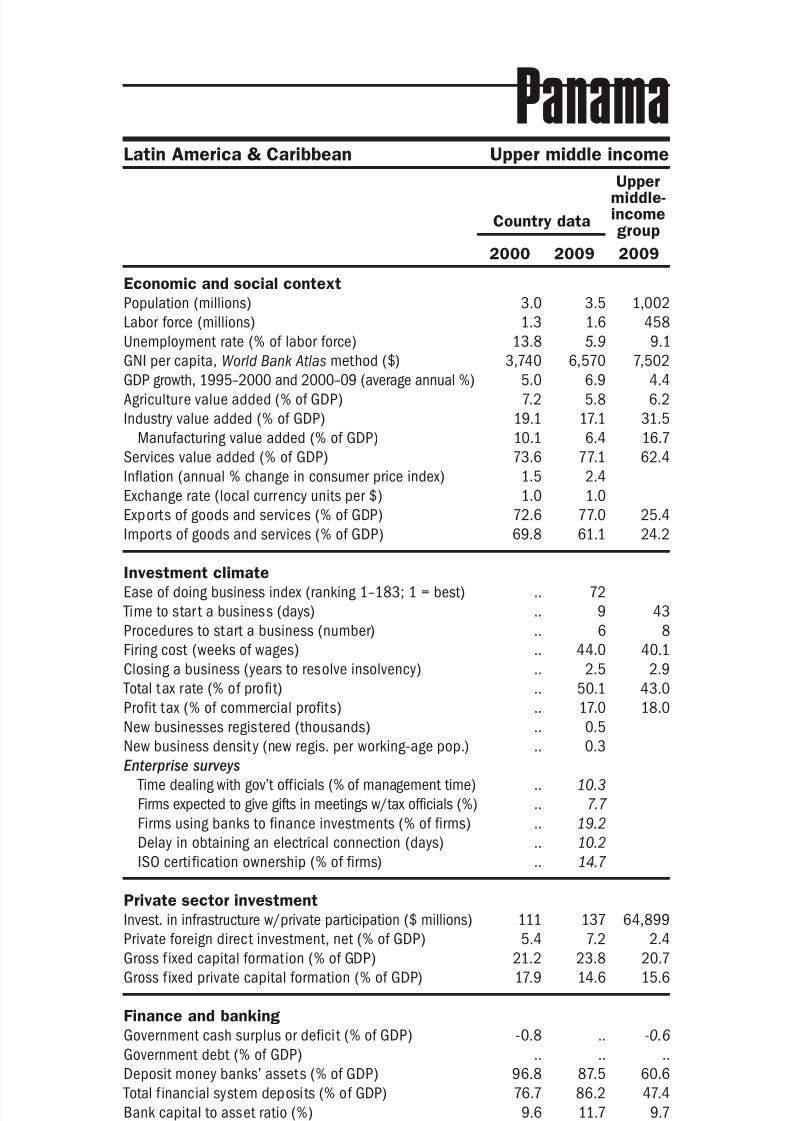
8/6/2019 The Little Data Book on Private Sector Development 2011
http://slidepdf.com/reader/full/the-little-data-book-on-private-sector-development-2011 175/246
Economic and social context
Population (millions)
Labor force (millions)
Unemployment rate (% of labor force)
GNI per capita, World Bank Atlas method ($)GDP growth, 1995–2000 and 2000–09 (average annual %)
Agriculture value added (% of GDP)
Industry value added (% of GDP)
Manufacturing value added (% of GDP)
Services value added (% of GDP)
Inflation (annual % change in consumer price index)
Exchange rate (local currency units per $)
Exports of goods and services (% of GDP)
Imports of goods and services (% of GDP) Investment climate
Ease of doing business index (ranking 1–183; 1 = best)
Time to star t a business (days)
Procedures to start a business (number)
Firing cost (weeks of wages)
Closing a business (years to resolve insolvency)
Total tax rate (% of profit)
Profit tax (% of commercial profits)New businesses registered (thousands)
New business density (new regis. per working-age pop.)
Enterprise surveys
Time dealing with gov’t officials (% of management time)
Firms expected to give gifts in meetings w/tax officials (%)
Firms using banks to finance investments (% of firms)
Delay in obtaining an electrical connection (days)
ISO certi fication ownership (% of firms)
Private sector investment
Invest. in infrastructure w/private participation ($ millions)
Private foreign direct investment, net (% of GDP)
Gross f ixed capital formation (% of GDP)
Gross f ixed private capital formation (% of GDP)
Finance and banking
Government cash surplus or deficit (% of GDP)
Government debt (% of GDP)
Deposit money banks’ assets (% of GDP) Total f inancial system deposits (% of GDP)
Bank capital to asset ratio (%)
Bank nonperforming loans to total gross loans ratio (%)
Domestic credit to the private sector (% of GDP)
Real interest rate (%)
Interest rate spread (percentage points)
Infrastructure
Paved roads (% of total roads)Electr ic power consumption (kWh per capita)
Power outages in a typical month (number)
Mobile cellular subscriptions (per 100 people)
Internet users (per 100 people)
167The Little Data Book on Private Sector Development 2011
Latin America & Caribbean Upper middle income
Country data
Uppermiddle-incomegroup
2000 2009 2009
Panama
3.0 3.5 1,002
1.3 1.6 458
13.8 5.9 9.1
3,740 6,570 7,5025.0 6.9 4.4
7.2 5.8 6.2
19.1 17.1 31.5
10.1 6.4 16.7
73.6 77.1 62.4
1.5 2.4
1.0 1.0
72.6 77.0 25.4
69.8 61.1 24.2
.. 72
.. 9 43
.. 6 8
.. 44.0 40.1
.. 2.5 2.9
.. 50.1 43.0
.. 17.0 18.0.. 0.5
.. 0.3
.. 10.3
.. 7.7
.. 19.2
.. 10.2
.. 14.7
111 137 64,899
5.4 7.2 2.4
21.2 23.8 20.7
17.9 14.6 15.6
-0.8 .. -0.6
.. .. ..
96.8 87.5 60.676.7 86.2 47.4
9.6 11.7 9.7
1.4 1.4 4.2
101.9 85.7 47.8
11.9 4.0
3.4 4.8 5.5
34.6 38.1 36.81,301 1,646 3,001
.. 4.2
13.9 164.4 100.6
6.6 27.8 34.6
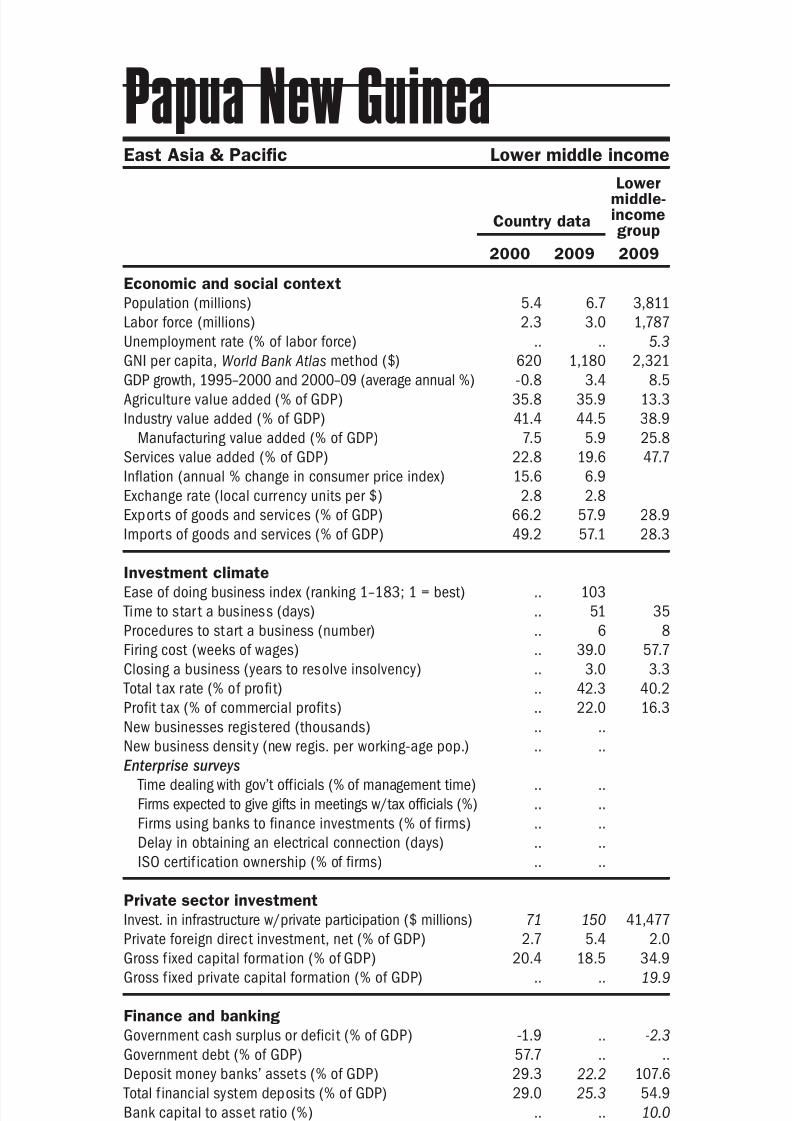
8/6/2019 The Little Data Book on Private Sector Development 2011
http://slidepdf.com/reader/full/the-little-data-book-on-private-sector-development-2011 176/246
Economic and social context
Population (millions)
Labor force (millions)
Unemployment rate (% of labor force)
GNI per capita, World Bank Atlas method ($)GDP growth, 1995–2000 and 2000–09 (average annual %)
Agriculture value added (% of GDP)
Industry value added (% of GDP)
Manufacturing value added (% of GDP)
Services value added (% of GDP)
Inflation (annual % change in consumer price index)
Exchange rate (local currency units per $)
Exports of goods and services (% of GDP)
Imports of goods and services (% of GDP) Investment climate
Ease of doing business index (ranking 1–183; 1 = best)
Time to star t a business (days)
Procedures to start a business (number)
Firing cost (weeks of wages)
Closing a business (years to resolve insolvency)
Total tax rate (% of profit)
Profit tax (% of commercial profits)New businesses registered (thousands)
New business density (new regis. per working-age pop.)
Enterprise surveys
Time dealing with gov’t officials (% of management time)
Firms expected to give gifts in meetings w/tax officials (%)
Firms using banks to finance investments (% of firms)
Delay in obtaining an electrical connection (days)
ISO certif ication ownership (% of firms)
Private sector investment
Invest. in infrastructure w/private participation ($ millions)
Private foreign direct investment, net (% of GDP)
Gross f ixed capital formation (% of GDP)
Gross f ixed private capital formation (% of GDP)
Finance and banking
Government cash surplus or deficit (% of GDP)
Government debt (% of GDP)
Deposit money banks’ assets (% of GDP) Total f inancial system deposits (% of GDP)
Bank capital to asset ratio (%)
Bank nonperforming loans to total gross loans ratio (%)
Domestic credit to the private sector (% of GDP)
Real interest rate (%)
Interest rate spread (percentage points)
Infrastructure
Paved roads (% of total roads)Electr ic power consumption (kWh per capita)
Power outages in a typical month (number)
Mobile cellular subscriptions (per 100 people)
Internet users (per 100 people)
168 2011 The Little Data Book on Private Sector Development
East Asia & Pacific Lower middle income
Papua New Guinea
Country data
Lowermiddle-incomegroup
2000 2009 2009
5.4 6.7 3,811
2.3 3.0 1,787
.. .. 5.3
620 1,180 2,321-0.8 3.4 8.5
35.8 35.9 13.3
41.4 44.5 38.9
7.5 5.9 25.8
22.8 19.6 47.7
15.6 6.9
2.8 2.8
66.2 57.9 28.9
49.2 57.1 28.3
.. 103
.. 51 35
.. 6 8
.. 39.0 57.7
.. 3.0 3.3
.. 42.3 40.2
.. 22.0 16.3.. ..
.. ..
.. ..
.. ..
.. ..
.. ..
.. ..
71 150 41,477
2.7 5.4 2.0
20.4 18.5 34.9
.. .. 19.9
-1.9 .. -2.3
57.7 .. ..
29.3 22.2 107.629.0 25.3 54.9
.. .. 10.0
.. .. 5.1
17.2 32.1 92.9
3.9 14.2
9.1 7.8 7.3
3.5 .. 36.3.. .. 1,318
.. ..
0.2 13.4 57.8
0.8 1.9 17.2

8/6/2019 The Little Data Book on Private Sector Development 2011
http://slidepdf.com/reader/full/the-little-data-book-on-private-sector-development-2011 177/246
Economic and social context
Population (millions)
Labor force (millions)
Unemployment rate (% of labor force)
GNI per capita, World Bank Atlas method ($)GDP growth, 1995–2000 and 2000–09 (average annual %)
Agriculture value added (% of GDP)
Industry value added (% of GDP)
Manufacturing value added (% of GDP)
Services value added (% of GDP)
Inflation (annual % change in consumer price index)
Exchange rate (local currency units per $)
Exports of goods and services (% of GDP)
Imports of goods and services (% of GDP) Investment climate
Ease of doing business index (ranking 1–183; 1 = best)
Time to star t a business (days)
Procedures to start a business (number)
Firing cost (weeks of wages)
Closing a business (years to resolve insolvency)
Total tax rate (% of profit)
Profit tax (% of commercial profits)New businesses registered (thousands)
New business density (new regis. per working-age pop.)
Enterprise surveys
Time dealing with gov’t officials (% of management time)
Firms expected to give gifts in meetings w/tax officials (%)
Firms using banks to finance investments (% of firms)
Delay in obtaining an electrical connection (days)
ISO certi fication ownership (% of firms)
Private sector investment
Invest. in infrastructure w/private participation ($ millions)
Private foreign direct investment, net (% of GDP)
Gross f ixed capital formation (% of GDP)
Gross f ixed private capital formation (% of GDP)
Finance and banking
Government cash surplus or deficit (% of GDP)
Government debt (% of GDP)
Deposit money banks’ assets (% of GDP) Total f inancial system deposits (% of GDP)
Bank capital to asset ratio (%)
Bank nonperforming loans to total gross loans ratio (%)
Domestic credit to the private sector (% of GDP)
Real interest rate (%)
Interest rate spread (percentage points)
Infrastructure
Paved roads (% of total roads)Electr ic power consumption (kWh per capita)
Power outages in a typical month (number)
Mobile cellular subscriptions (per 100 people)
Internet users (per 100 people)
169The Little Data Book on Private Sector Development 2011
Latin America & Caribbean Lower middle income
Country data
Lowermiddle-incomegroup
2000 2009 2009
Paraguay
5.4 6.3 3,811
2.3 3.0 1,787
7.6 5.6 5.3
1,350 2,250 2,3210.1 3.4 8.5
17.0 19.3 13.3
22.5 21.2 38.9
15.5 13.0 25.8
60.5 59.5 47.7
9.0 2.6
3,486.4 4,965.4
38.2 46.5 28.9
49.0 51.6 28.3
.. 106
.. 35 35
.. 7 8
.. 99.0 57.7
.. 3.9 3.3
.. 35.0 40.2
.. 9.6 16.3.. ..
.. ..
.. 7.9
.. 24.5
.. 8.2
.. 27.2
.. 7.1
30 93 41,477
1.5 1.4 2.0
17.5 15.2 34.9
.. 15.1 19.9
-3.9 0.1 -2.3
.. .. ..
28.6 27.3 107.622.2 25.3 54.9
12.4 8.7 10.0
12.3 1.6 5.1
29.8 29.1 92.9
13.1 28.4
11.1 26.8 7.3
50.8 .. 36.3880 1,002 1,318
.. 2.3
15.3 88.5 57.8
0.7 15.8 17.2

8/6/2019 The Little Data Book on Private Sector Development 2011
http://slidepdf.com/reader/full/the-little-data-book-on-private-sector-development-2011 178/246
Economic and social context
Population (millions)
Labor force (millions)
Unemployment rate (% of labor force)
GNI per capita, World Bank Atlas method ($)GDP growth, 1995–2000 and 2000–09 (average annual %)
Agriculture value added (% of GDP)
Industry value added (% of GDP)
Manufacturing value added (% of GDP)
Services value added (% of GDP)
Inflation (annual % change in consumer price index)
Exchange rate (local currency units per $)
Exports of goods and services (% of GDP)
Imports of goods and services (% of GDP) Investment climate
Ease of doing business index (ranking 1–183; 1 = best)
Time to star t a business (days)
Procedures to start a business (number)
Firing cost (weeks of wages)
Closing a business (years to resolve insolvency)
Total tax rate (% of profit)
Profit tax (% of commercial profits)New businesses registered (thousands)
New business density (new regis. per working-age pop.)
Enterprise surveys
Time dealing with gov’t officials (% of management time)
Firms expected to give gifts in meetings w/tax officials (%)
Firms using banks to finance investments (% of firms)
Delay in obtaining an electrical connection (days)
ISO certif ication ownership (% of firms)
Private sector investment
Invest. in infrastructure w/private participation ($ millions)
Private foreign direct investment, net (% of GDP)
Gross f ixed capital formation (% of GDP)
Gross f ixed private capital formation (% of GDP)
Finance and banking
Government cash surplus or deficit (% of GDP)
Government debt (% of GDP)
Deposit money banks’ assets (% of GDP) Total f inancial system deposits (% of GDP)
Bank capital to asset ratio (%)
Bank nonperforming loans to total gross loans ratio (%)
Domestic credit to the private sector (% of GDP)
Real interest rate (%)
Interest rate spread (percentage points)
Infrastructure
Paved roads (% of total roads)Electr ic power consumption (kWh per capita)
Power outages in a typical month (number)
Mobile cellular subscriptions (per 100 people)
Internet users (per 100 people)
170 2011 The Little Data Book on Private Sector Development
Country data
Uppermiddle-incomegroup
2000 2009 2009
Latin America & Caribbean Upper middle income
Peru
26.0 29.2 1,002
11.2 13.6 458
7.4 6.8 9.1
2,050 4,200 7,5022.4 6.0 4.4
8.5 7.3 6.2
29.9 34.1 31.5
15.8 14.0 16.7
61.6 58.6 62.4
3.8 2.9
3.5 3.0
16.0 23.6 25.4
18.2 19.7 24.2
.. 36
.. 27 43
.. 6 8
.. 17.0 40.1
.. 3.1 2.9
.. 40.2 43.0
.. 26.0 18.0.. 51.2
.. 2.7
.. 13.5
.. 1.6
26.3 30.9
.. 81.6
2.6 14.6
952 1,753 64,899
1.5 3.7 2.4
20.2 24.0 20.7
16.3 18.2 15.6
-2.1 -1.5 -0.6
.. 23.6 ..
28.5 26.5 60.625.8 29.0 47.4
9.1 9.9 9.7
9.0 2.7 4.2
26.0 24.1 47.8
25.4 17.5
20.2 18.2 5.5
13.4 13.9 36.8678 1,032 3,001
.. 0.9
4.9 84.7 100.6
3.1 27.7 34.6
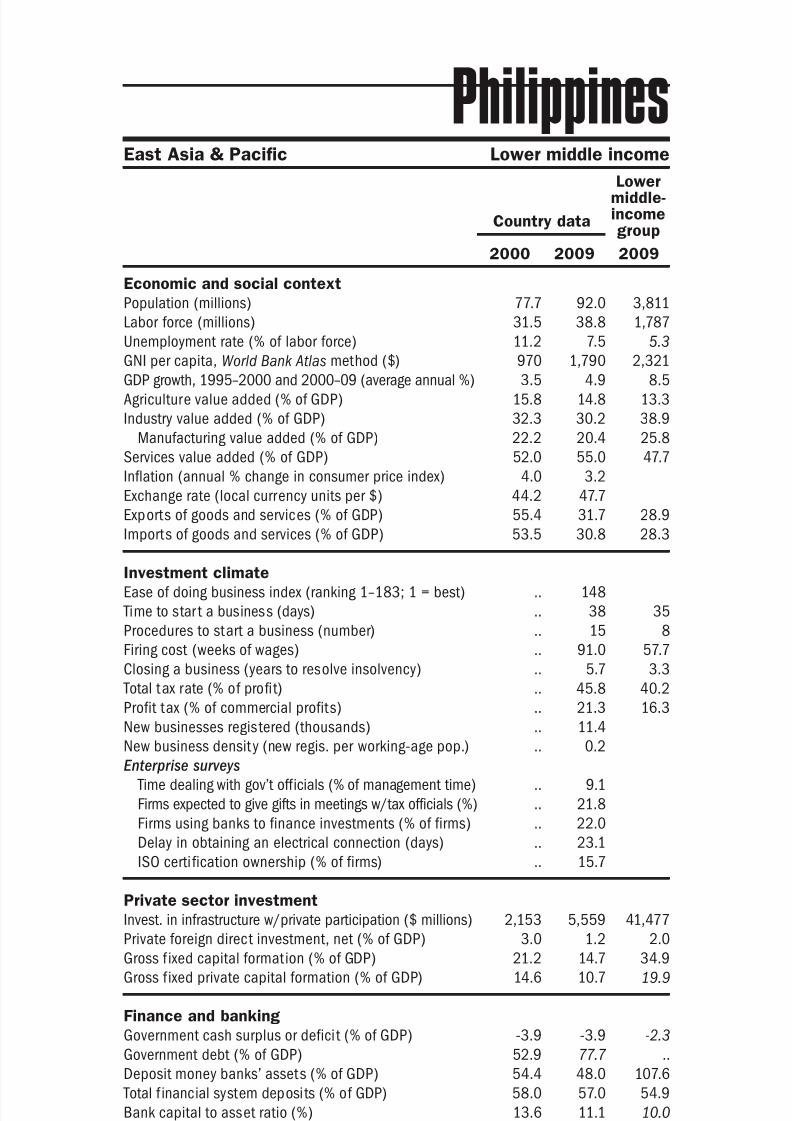
8/6/2019 The Little Data Book on Private Sector Development 2011
http://slidepdf.com/reader/full/the-little-data-book-on-private-sector-development-2011 179/246
Economic and social context
Population (millions)
Labor force (millions)
Unemployment rate (% of labor force)
GNI per capita, World Bank Atlas method ($)GDP growth, 1995–2000 and 2000–09 (average annual %)
Agriculture value added (% of GDP)
Industry value added (% of GDP)
Manufacturing value added (% of GDP)
Services value added (% of GDP)
Inflation (annual % change in consumer price index)
Exchange rate (local currency units per $)
Exports of goods and services (% of GDP)
Imports of goods and services (% of GDP) Investment climate
Ease of doing business index (ranking 1–183; 1 = best)
Time to star t a business (days)
Procedures to start a business (number)
Firing cost (weeks of wages)
Closing a business (years to resolve insolvency)
Total tax rate (% of profit)
Profit tax (% of commercial profits)New businesses registered (thousands)
New business density (new regis. per working-age pop.)
Enterprise surveys
Time dealing with gov’t officials (% of management time)
Firms expected to give gifts in meetings w/tax officials (%)
Firms using banks to finance investments (% of firms)
Delay in obtaining an electrical connection (days)
ISO certi fication ownership (% of firms)
Private sector investment
Invest. in infrastructure w/private participation ($ millions)
Private foreign direct investment, net (% of GDP)
Gross f ixed capital formation (% of GDP)
Gross f ixed private capital formation (% of GDP)
Finance and banking
Government cash surplus or deficit (% of GDP)
Government debt (% of GDP)
Deposit money banks’ assets (% of GDP) Total f inancial system deposits (% of GDP)
Bank capital to asset ratio (%)
Bank nonperforming loans to total gross loans ratio (%)
Domestic credit to the private sector (% of GDP)
Real interest rate (%)
Interest rate spread (percentage points)
Infrastructure
Paved roads (% of total roads)Electr ic power consumption (kWh per capita)
Power outages in a typical month (number)
Mobile cellular subscriptions (per 100 people)
Internet users (per 100 people)
171The Little Data Book on Private Sector Development 2011
East Asia & Pacific Lower middle income
Country data
Lowermiddle-incomegroup
2000 2009 2009
Philippines
77.7 92.0 3,811
31.5 38.8 1,787
11.2 7.5 5.3
970 1,790 2,3213.5 4.9 8.5
15.8 14.8 13.3
32.3 30.2 38.9
22.2 20.4 25.8
52.0 55.0 47.7
4.0 3.2
44.2 47.7
55.4 31.7 28.9
53.5 30.8 28.3
.. 148
.. 38 35
.. 15 8
.. 91.0 57.7
.. 5.7 3.3
.. 45.8 40.2
.. 21.3 16.3.. 11.4
.. 0.2
.. 9.1
.. 21.8
.. 22.0
.. 23.1
.. 15.7
2,153 5,559 41,477
3.0 1.2 2.0
21.2 14.7 34.9
14.6 10.7 19.9
-3.9 -3.9 -2.3
52.9 77.7 ..
54.4 48.0 107.658.0 57.0 54.9
13.6 11.1 10.0
24.0 4.1 5.1
39.2 30.3 92.9
4.3 5.9
2.6 5.8 7.3
20.0 9.9 36.3501 588 1,318
.. 1.0
8.3 81.0 57.8
2.0 6.5 17.2
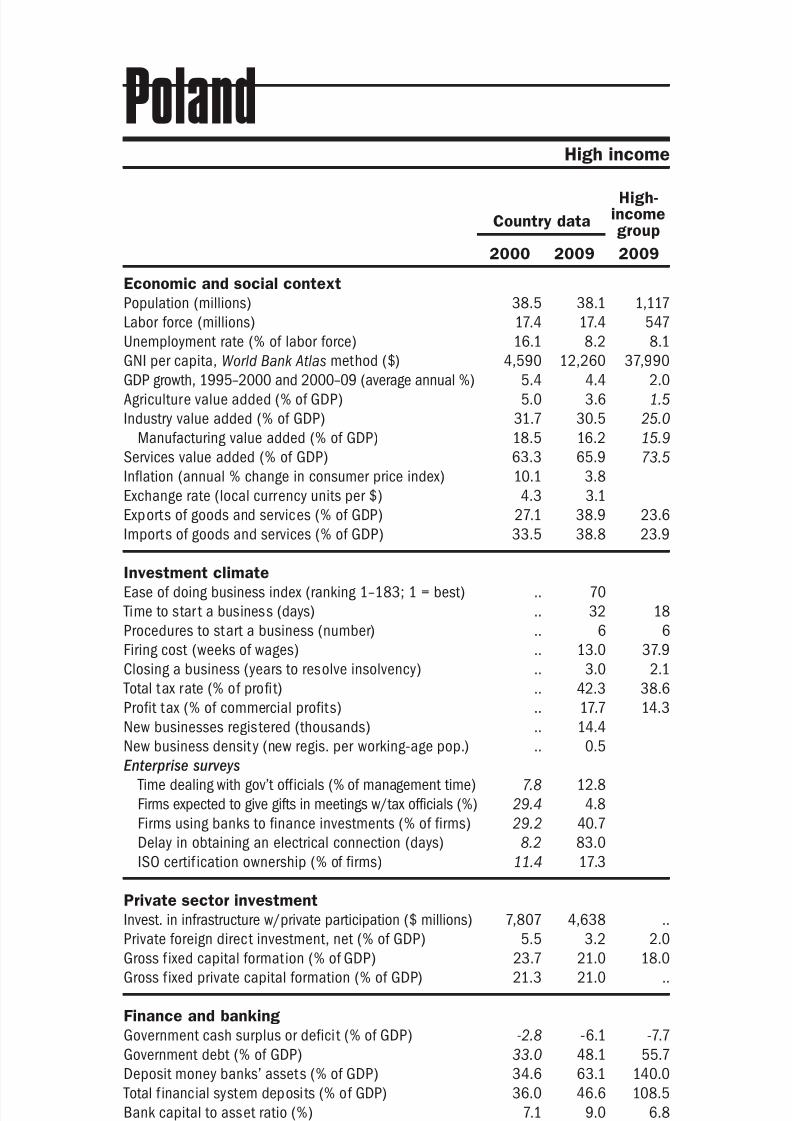
8/6/2019 The Little Data Book on Private Sector Development 2011
http://slidepdf.com/reader/full/the-little-data-book-on-private-sector-development-2011 180/246
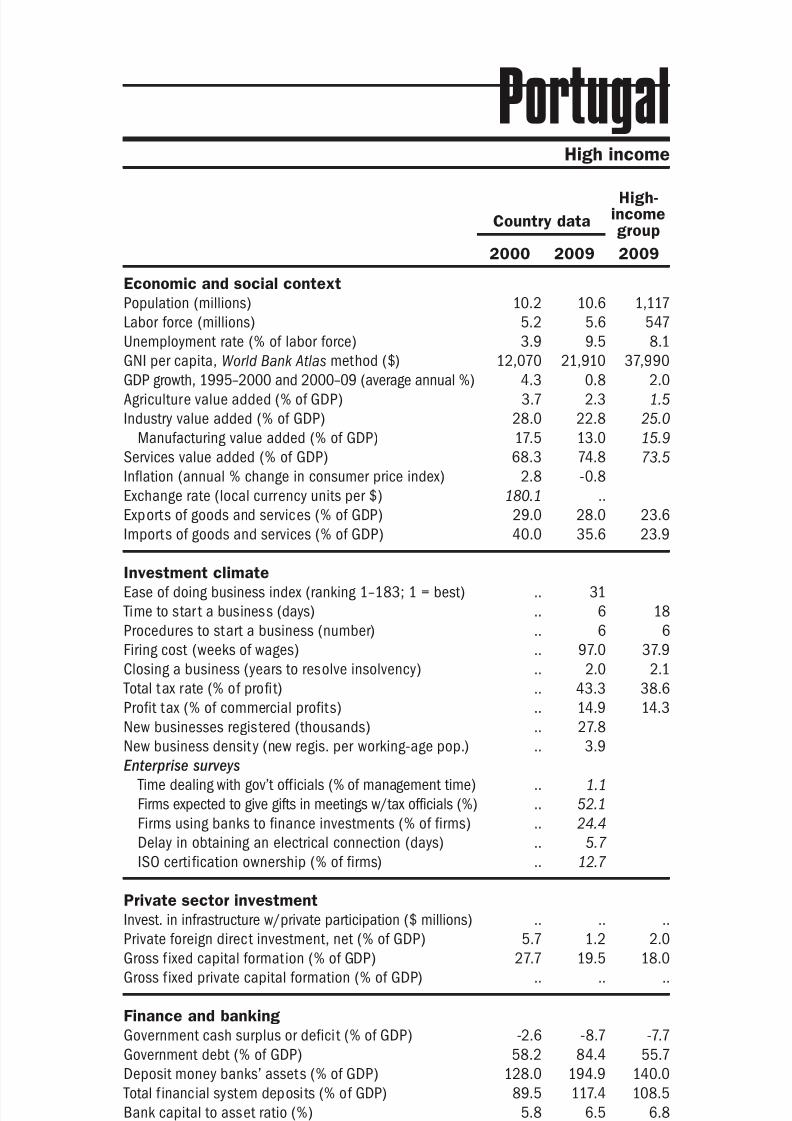
8/6/2019 The Little Data Book on Private Sector Development 2011
http://slidepdf.com/reader/full/the-little-data-book-on-private-sector-development-2011 181/246
Economic and social context
Population (millions)
Labor force (millions)
Unemployment rate (% of labor force)
GNI per capita, World Bank Atlas method ($)GDP growth, 1995–2000 and 2000–09 (average annual %)
Agriculture value added (% of GDP)
Industry value added (% of GDP)
Manufacturing value added (% of GDP)
Services value added (% of GDP)
Inflation (annual % change in consumer price index)
Exchange rate (local currency units per $)
Exports of goods and services (% of GDP)
Imports of goods and services (% of GDP) Investment climate
Ease of doing business index (ranking 1–183; 1 = best)
Time to star t a business (days)
Procedures to start a business (number)
Firing cost (weeks of wages)
Closing a business (years to resolve insolvency)
Total tax rate (% of profit)
Profit tax (% of commercial profits)New businesses registered (thousands)
New business density (new regis. per working-age pop.)
Enterprise surveys
Time dealing with gov’t officials (% of management time)
Firms expected to give gifts in meetings w/tax officials (%)
Firms using banks to finance investments (% of firms)
Delay in obtaining an electrical connection (days)
ISO certi fication ownership (% of firms)
Private sector investment
Invest. in infrastructure w/private participation ($ millions)
Private foreign direct investment, net (% of GDP)
Gross f ixed capital formation (% of GDP)
Gross f ixed private capital formation (% of GDP)
Finance and banking
Government cash surplus or deficit (% of GDP)
Government debt (% of GDP)
Deposit money banks’ assets (% of GDP) Total f inancial system deposits (% of GDP)
Bank capital to asset ratio (%)
Bank nonperforming loans to total gross loans ratio (%)
Domestic credit to the private sector (% of GDP)
Real interest rate (%)
Interest rate spread (percentage points)
Infrastructure
Paved roads (% of total roads)Electr ic power consumption (kWh per capita)
Power outages in a typical month (number)
Mobile cellular subscriptions (per 100 people)
Internet users (per 100 people)
173The Little Data Book on Private Sector Development 2011
High income
Country data
High-incomegroup
2000 2009 2009
Portugal
10.2 10.6 1,117
5.2 5.6 547
3.9 9.5 8.1
12,070 21,910 37,9904.3 0.8 2.0
3.7 2.3 1.5
28.0 22.8 25.0
17.5 13.0 15.9
68.3 74.8 73.5
2.8 -0.8
180.1 ..
29.0 28.0 23.6
40.0 35.6 23.9
.. 31
.. 6 18
.. 6 6
.. 97.0 37.9
.. 2.0 2.1
.. 43.3 38.6
.. 14.9 14.3.. 27.8
.. 3.9
.. 1.1
.. 52.1
.. 24.4
.. 5.7
.. 12.7
.. .. ..
5.7 1.2 2.0
27.7 19.5 18.0
.. .. ..
-2.6 -8.7 -7.7
58.2 84.4 55.7
128.0 194.9 140.089.5 117.4 108.5
5.8 6.5 6.8
2.2 3.2 3.4
126.6 187.8 165.1
1.8 ..
2.8 .. 3.8
86.0 86.0 93.44,014 4,822 9,518
.. ..
65.2 142.8 111.2
16.4 48.6 72.3
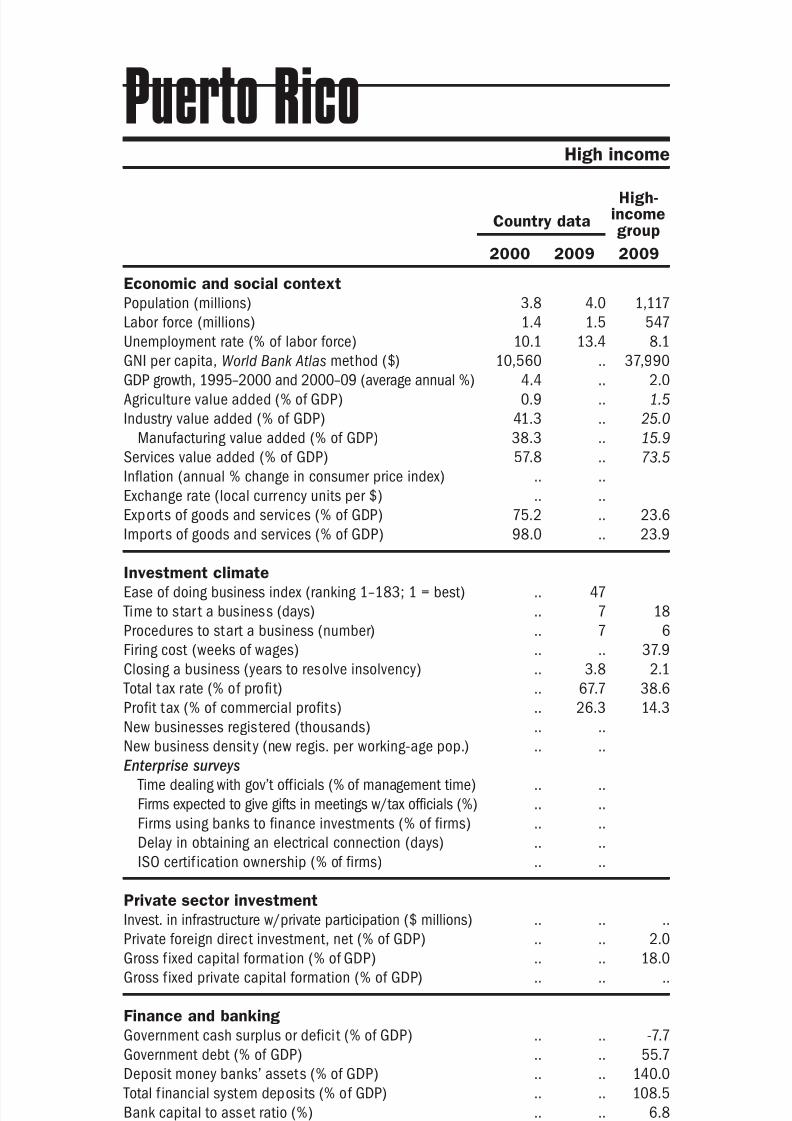
8/6/2019 The Little Data Book on Private Sector Development 2011
http://slidepdf.com/reader/full/the-little-data-book-on-private-sector-development-2011 182/246
Economic and social context
Population (millions)
Labor force (millions)
Unemployment rate (% of labor force)
GNI per capita, World Bank Atlas method ($)GDP growth, 1995–2000 and 2000–09 (average annual %)
Agriculture value added (% of GDP)
Industry value added (% of GDP)
Manufacturing value added (% of GDP)
Services value added (% of GDP)
Inflation (annual % change in consumer price index)
Exchange rate (local currency units per $)
Exports of goods and services (% of GDP)
Imports of goods and services (% of GDP) Investment climate
Ease of doing business index (ranking 1–183; 1 = best)
Time to star t a business (days)
Procedures to start a business (number)
Firing cost (weeks of wages)
Closing a business (years to resolve insolvency)
Total tax rate (% of profit)
Profit tax (% of commercial profits)New businesses registered (thousands)
New business density (new regis. per working-age pop.)
Enterprise surveys
Time dealing with gov’t officials (% of management time)
Firms expected to give gifts in meetings w/tax officials (%)
Firms using banks to finance investments (% of firms)
Delay in obtaining an electrical connection (days)
ISO certif ication ownership (% of firms)
Private sector investment
Invest. in infrastructure w/private participation ($ millions)
Private foreign direct investment, net (% of GDP)
Gross f ixed capital formation (% of GDP)
Gross f ixed private capital formation (% of GDP)
Finance and banking
Government cash surplus or deficit (% of GDP)
Government debt (% of GDP)
Deposit money banks’ assets (% of GDP) Total f inancial system deposits (% of GDP)
Bank capital to asset ratio (%)
Bank nonperforming loans to total gross loans ratio (%)
Domestic credit to the private sector (% of GDP)
Real interest rate (%)
Interest rate spread (percentage points)
Infrastructure
Paved roads (% of total roads)Electr ic power consumption (kWh per capita)
Power outages in a typical month (number)
Mobile cellular subscriptions (per 100 people)
Internet users (per 100 people)
174 2011 The Little Data Book on Private Sector Development
Country data
High-incomegroup
2000 2009 2009
High income
Puerto Rico
3.8 4.0 1,117
1.4 1.5 547
10.1 13.4 8.1
10,560 .. 37,9904.4 .. 2.0
0.9 .. 1.5
41.3 .. 25.0
38.3 .. 15.9
57.8 .. 73.5
.. ..
.. ..
75.2 .. 23.6
98.0 .. 23.9
.. 47
.. 7 18
.. 7 6
.. .. 37.9
.. 3.8 2.1
.. 67.7 38.6
.. 26.3 14.3.. ..
.. ..
.. ..
.. ..
.. ..
.. ..
.. ..
.. .. ..
.. .. 2.0
.. .. 18.0
.. .. ..
.. .. -7.7
.. .. 55.7
.. .. 140.0
.. .. 108.5
.. .. 6.8
.. .. 3.4
.. .. 165.1
.. ..
.. .. 3.8
94.0 95.0 93.4.. .. 9,518
.. ..
34.6 68.5 111.2
10.5 25.2 72.3
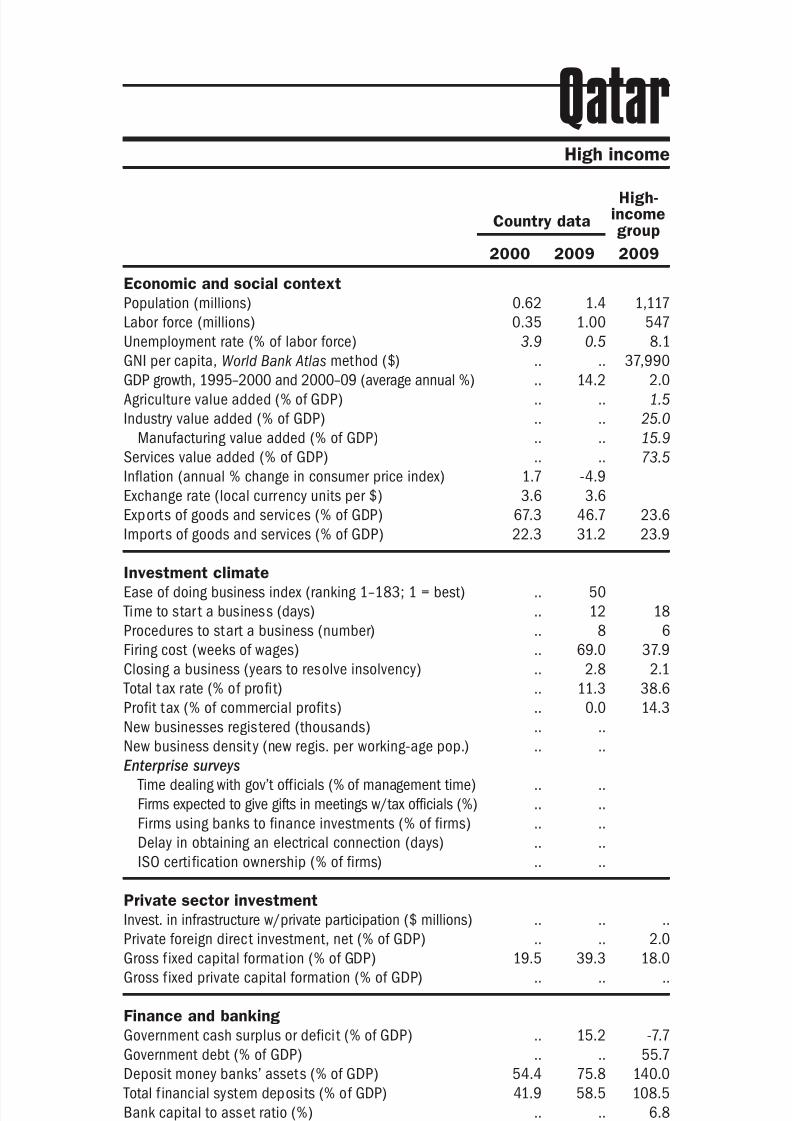
8/6/2019 The Little Data Book on Private Sector Development 2011
http://slidepdf.com/reader/full/the-little-data-book-on-private-sector-development-2011 183/246
Economic and social context
Population (millions)
Labor force (millions)
Unemployment rate (% of labor force)
GNI per capita, World Bank Atlas method ($)GDP growth, 1995–2000 and 2000–09 (average annual %)
Agriculture value added (% of GDP)
Industry value added (% of GDP)
Manufacturing value added (% of GDP)
Services value added (% of GDP)
Inflation (annual % change in consumer price index)
Exchange rate (local currency units per $)
Exports of goods and services (% of GDP)
Imports of goods and services (% of GDP) Investment climate
Ease of doing business index (ranking 1–183; 1 = best)
Time to star t a business (days)
Procedures to start a business (number)
Firing cost (weeks of wages)
Closing a business (years to resolve insolvency)
Total tax rate (% of profit)
Profit tax (% of commercial profits)New businesses registered (thousands)
New business density (new regis. per working-age pop.)
Enterprise surveys
Time dealing with gov’t officials (% of management time)
Firms expected to give gifts in meetings w/tax officials (%)
Firms using banks to finance investments (% of firms)
Delay in obtaining an electrical connection (days)
ISO certi fication ownership (% of firms)
Private sector investment
Invest. in infrastructure w/private participation ($ millions)
Private foreign direct investment, net (% of GDP)
Gross f ixed capital formation (% of GDP)
Gross f ixed private capital formation (% of GDP)
Finance and banking
Government cash surplus or deficit (% of GDP)
Government debt (% of GDP)
Deposit money banks’ assets (% of GDP) Total f inancial system deposits (% of GDP)
Bank capital to asset ratio (%)
Bank nonperforming loans to total gross loans ratio (%)
Domestic credit to the private sector (% of GDP)
Real interest rate (%)
Interest rate spread (percentage points)
Infrastructure
Paved roads (% of total roads)Electr ic power consumption (kWh per capita)
Power outages in a typical month (number)
Mobile cellular subscriptions (per 100 people)
Internet users (per 100 people)
175The Little Data Book on Private Sector Development 2011
High income
Country data
High-incomegroup
2000 2009 2009
Qatar
0.62 1.4 1,117
0.35 1.00 547
3.9 0.5 8.1
.. .. 37,990
.. 14.2 2.0
.. .. 1.5
.. .. 25.0
.. .. 15.9
.. .. 73.5
1.7 -4.9
3.6 3.6
67.3 46.7 23.6
22.3 31.2 23.9
.. 50
.. 12 18
.. 8 6
.. 69.0 37.9
.. 2.8 2.1
.. 11.3 38.6
.. 0.0 14.3.. ..
.. ..
.. ..
.. ..
.. ..
.. ..
.. ..
.. .. ..
.. .. 2.0
19.5 39.3 18.0
.. .. ..
.. 15.2 -7.7
.. .. 55.7
54.4 75.8 140.041.9 58.5 108.5
.. .. 6.8
.. .. 3.4
26.8 51.5 165.1
.. 31.0
.. 2.8 3.8
90.0 .. 93.413,782 15,682 9,518
.. ..
19.6 175.4 111.2
4.9 28.3 72.3

8/6/2019 The Little Data Book on Private Sector Development 2011
http://slidepdf.com/reader/full/the-little-data-book-on-private-sector-development-2011 184/246
Economic and social context
Population (millions)
Labor force (millions)
Unemployment rate (% of labor force)
GNI per capita, World Bank Atlas method ($)GDP growth, 1995–2000 and 2000–09 (average annual %)
Agriculture value added (% of GDP)
Industry value added (% of GDP)
Manufacturing value added (% of GDP)
Services value added (% of GDP)
Inflation (annual % change in consumer price index)
Exchange rate (local currency units per $)
Exports of goods and services (% of GDP)
Imports of goods and services (% of GDP) Investment climate
Ease of doing business index (ranking 1–183; 1 = best)
Time to star t a business (days)
Procedures to start a business (number)
Firing cost (weeks of wages)
Closing a business (years to resolve insolvency)
Total tax rate (% of profit)
Profit tax (% of commercial profits)New businesses registered (thousands)
New business density (new regis. per working-age pop.)
Enterprise surveys
Time dealing with gov’t officials (% of management time)
Firms expected to give gifts in meetings w/tax officials (%)
Firms using banks to finance investments (% of firms)
Delay in obtaining an electrical connection (days)
ISO certif ication ownership (% of firms)
Private sector investment
Invest. in infrastructure w/private participation ($ millions)
Private foreign direct investment, net (% of GDP)
Gross f ixed capital formation (% of GDP)
Gross f ixed private capital formation (% of GDP)
Finance and banking
Government cash surplus or deficit (% of GDP)
Government debt (% of GDP)
Deposit money banks’ assets (% of GDP) Total f inancial system deposits (% of GDP)
Bank capital to asset ratio (%)
Bank nonperforming loans to total gross loans ratio (%)
Domestic credit to the private sector (% of GDP)
Real interest rate (%)
Interest rate spread (percentage points)
Infrastructure
Paved roads (% of total roads)Electr ic power consumption (kWh per capita)
Power outages in a typical month (number)
Mobile cellular subscriptions (per 100 people)
Internet users (per 100 people)
176 2011 The Little Data Book on Private Sector Development
Country data
Uppermiddle-incomegroup
2000 2009 2009
Europe & Central Asia Upper middle income
Romania
22.4 21.5 1,002
11.8 9.5 458
7.0 6.9 9.1
1,690 8,330 7,502-2.1 5.6 4.4
12.5 7.2 6.2
36.4 26.0 31.5
14.5 21.5 16.7
51.1 66.9 62.4
45.7 5.6
2.2 3.0
32.7 33.3 25.4
37.9 40.2 24.2
.. 56
.. 10 43
.. 6 8
.. 8.0 40.1
.. 3.3 2.9
.. 44.9 43.0
.. 10.4 18.0.. 56.7
.. 3.7
8.6 9.2
35.2 12.1
19.8 37.3
20.1 42.0
21.7 26.1
901 3,037 64,899
2.8 3.9 2.4
18.9 30.3 20.7
.. 28.0 15.6
-2.0 -4.6 -0.6
.. .. ..
12.4 48.5 60.619.7 32.9 47.4
8.6 7.6 9.7
3.3 15.3 4.2
7.2 47.1 47.8
6.7 10.1
20.7 5.3 5.5
49.5 30.2 36.81,988 2,488 3,001
.. 3.0
11.1 118.1 100.6
3.6 36.2 34.6
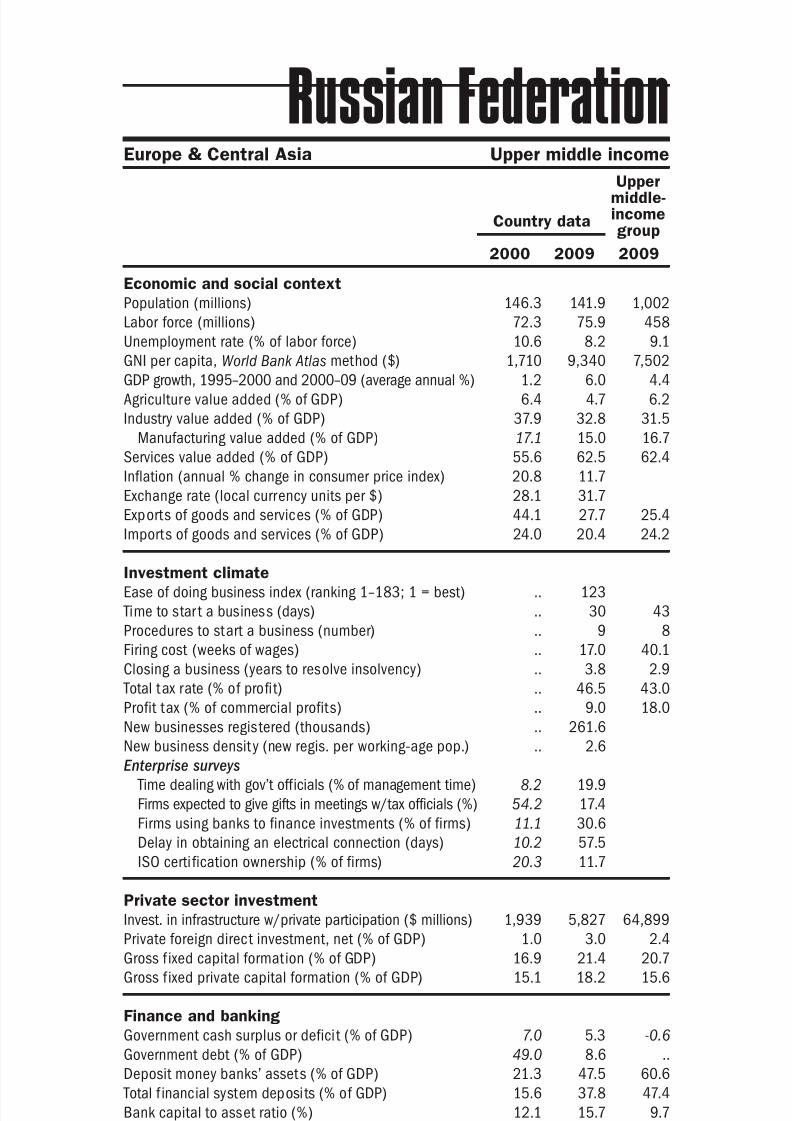
8/6/2019 The Little Data Book on Private Sector Development 2011
http://slidepdf.com/reader/full/the-little-data-book-on-private-sector-development-2011 185/246
Economic and social context
Population (millions)
Labor force (millions)
Unemployment rate (% of labor force)
GNI per capita, World Bank Atlas method ($)GDP growth, 1995–2000 and 2000–09 (average annual %)
Agriculture value added (% of GDP)
Industry value added (% of GDP)
Manufacturing value added (% of GDP)
Services value added (% of GDP)
Inflation (annual % change in consumer price index)
Exchange rate (local currency units per $)
Exports of goods and services (% of GDP)
Imports of goods and services (% of GDP) Investment climate
Ease of doing business index (ranking 1–183; 1 = best)
Time to star t a business (days)
Procedures to start a business (number)
Firing cost (weeks of wages)
Closing a business (years to resolve insolvency)
Total tax rate (% of profit)
Profit tax (% of commercial profits)New businesses registered (thousands)
New business density (new regis. per working-age pop.)
Enterprise surveys
Time dealing with gov’t officials (% of management time)
Firms expected to give gifts in meetings w/tax officials (%)
Firms using banks to finance investments (% of firms)
Delay in obtaining an electrical connection (days)
ISO certi fication ownership (% of firms)
Private sector investment
Invest. in infrastructure w/private participation ($ millions)
Private foreign direct investment, net (% of GDP)
Gross f ixed capital formation (% of GDP)
Gross f ixed private capital formation (% of GDP)
Finance and banking
Government cash surplus or deficit (% of GDP)
Government debt (% of GDP)
Deposit money banks’ assets (% of GDP) Total f inancial system deposits (% of GDP)
Bank capital to asset ratio (%)
Bank nonperforming loans to total gross loans ratio (%)
Domestic credit to the private sector (% of GDP)
Real interest rate (%)
Interest rate spread (percentage points)
Infrastructure
Paved roads (% of total roads)Electr ic power consumption (kWh per capita)
Power outages in a typical month (number)
Mobile cellular subscriptions (per 100 people)
Internet users (per 100 people)
177The Little Data Book on Private Sector Development 2011
Europe & Central Asia Upper middle income
Country data
Uppermiddle-incomegroup
2000 2009 2009
Russian Federation
146.3 141.9 1,002
72.3 75.9 458
10.6 8.2 9.1
1,710 9,340 7,5021.2 6.0 4.4
6.4 4.7 6.2
37.9 32.8 31.5
17.1 15.0 16.7
55.6 62.5 62.4
20.8 11.7
28.1 31.7
44.1 27.7 25.4
24.0 20.4 24.2
.. 123
.. 30 43
.. 9 8
.. 17.0 40.1
.. 3.8 2.9
.. 46.5 43.0
.. 9.0 18.0.. 261.6
.. 2.6
8.2 19.9
54.2 17.4
11.1 30.6
10.2 57.5
20.3 11.7
1,939 5,827 64,899
1.0 3.0 2.4
16.9 21.4 20.7
15.1 18.2 15.6
7.0 5.3 -0.6
49.0 8.6 ..
21.3 47.5 60.615.6 37.8 47.4
12.1 15.7 9.7
7.7 9.7 4.2
13.4 45.3 47.8
-9.6 12.5
17.9 6.7 5.5
67.4 80.1 36.85,209 6,435 3,001
.. 1.5
2.2 162.5 100.6
2.0 42.1 34.6
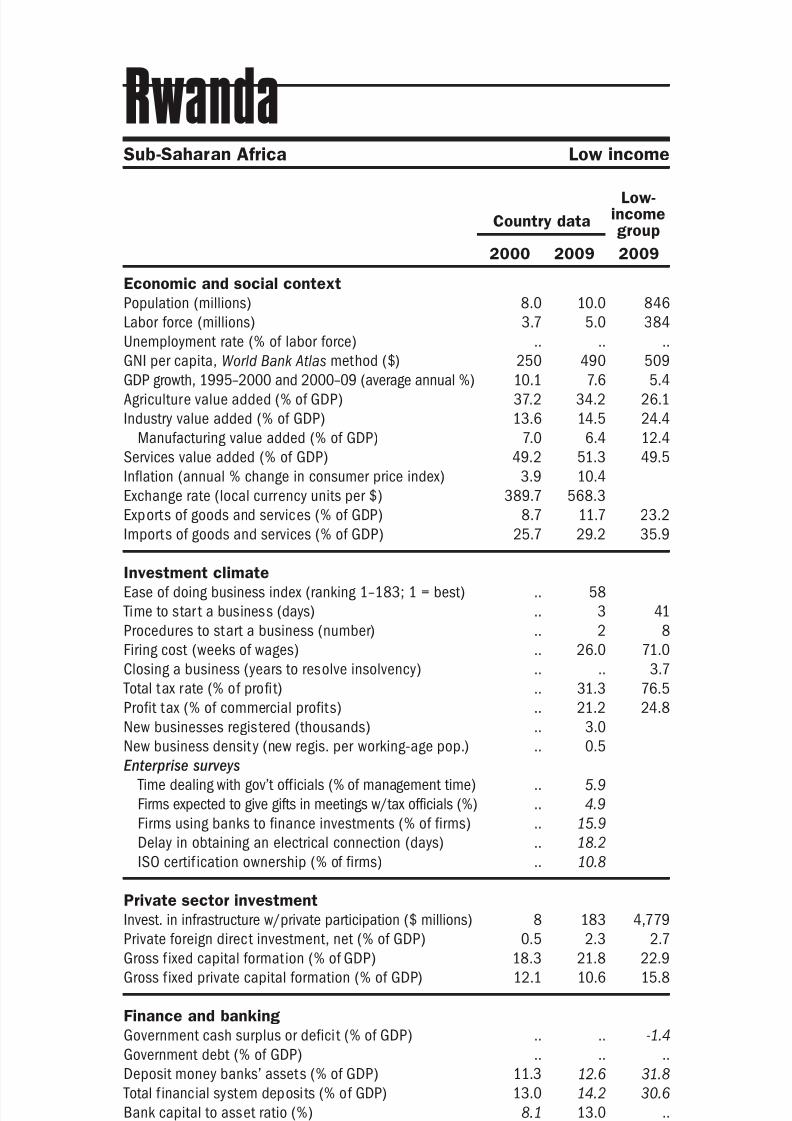
8/6/2019 The Little Data Book on Private Sector Development 2011
http://slidepdf.com/reader/full/the-little-data-book-on-private-sector-development-2011 186/246
Economic and social context
Population (millions)
Labor force (millions)
Unemployment rate (% of labor force)
GNI per capita, World Bank Atlas method ($)GDP growth, 1995–2000 and 2000–09 (average annual %)
Agriculture value added (% of GDP)
Industry value added (% of GDP)
Manufacturing value added (% of GDP)
Services value added (% of GDP)
Inflation (annual % change in consumer price index)
Exchange rate (local currency units per $)
Exports of goods and services (% of GDP)
Imports of goods and services (% of GDP) Investment climate
Ease of doing business index (ranking 1–183; 1 = best)
Time to star t a business (days)
Procedures to start a business (number)
Firing cost (weeks of wages)
Closing a business (years to resolve insolvency)
Total tax rate (% of profit)
Profit tax (% of commercial profits)New businesses registered (thousands)
New business density (new regis. per working-age pop.)
Enterprise surveys
Time dealing with gov’t officials (% of management time)
Firms expected to give gifts in meetings w/tax officials (%)
Firms using banks to finance investments (% of firms)
Delay in obtaining an electrical connection (days)
ISO certif ication ownership (% of firms)
Private sector investment
Invest. in infrastructure w/private participation ($ millions)
Private foreign direct investment, net (% of GDP)
Gross f ixed capital formation (% of GDP)
Gross f ixed private capital formation (% of GDP)
Finance and banking
Government cash surplus or deficit (% of GDP)
Government debt (% of GDP)
Deposit money banks’ assets (% of GDP) Total f inancial system deposits (% of GDP)
Bank capital to asset ratio (%)
Bank nonperforming loans to total gross loans ratio (%)
Domestic credit to the private sector (% of GDP)
Real interest rate (%)
Interest rate spread (percentage points)
Infrastructure
Paved roads (% of total roads)Electr ic power consumption (kWh per capita)
Power outages in a typical month (number)
Mobile cellular subscriptions (per 100 people)
Internet users (per 100 people)
178 2011 The Little Data Book on Private Sector Development
Country data
Low-incomegroup
2000 2009 2009
Sub-Saharan Africa Low income
Rwanda
8.0 10.0 846
3.7 5.0 384
.. .. ..
250 490 50910.1 7.6 5.4
37.2 34.2 26.1
13.6 14.5 24.4
7.0 6.4 12.4
49.2 51.3 49.5
3.9 10.4
389.7 568.3
8.7 11.7 23.2
25.7 29.2 35.9
.. 58
.. 3 41
.. 2 8
.. 26.0 71.0
.. .. 3.7
.. 31.3 76.5
.. 21.2 24.8.. 3.0
.. 0.5
.. 5.9
.. 4.9
.. 15.9
.. 18.2
.. 10.8
8 183 4,779
0.5 2.3 2.7
18.3 21.8 22.9
12.1 10.6 15.8
.. .. -1.4
.. .. ..
11.3 12.6 31.813.0 14.2 30.6
8.1 13.0 ..
57.0 13.1 ..
10.4 11.2 26.3
20.6 3.3
6.9 9.8 11.5
.. 19.0 12.0
.. .. 231
.. 13.6
0.5 24.3 26.6
0.1 4.5 2.7
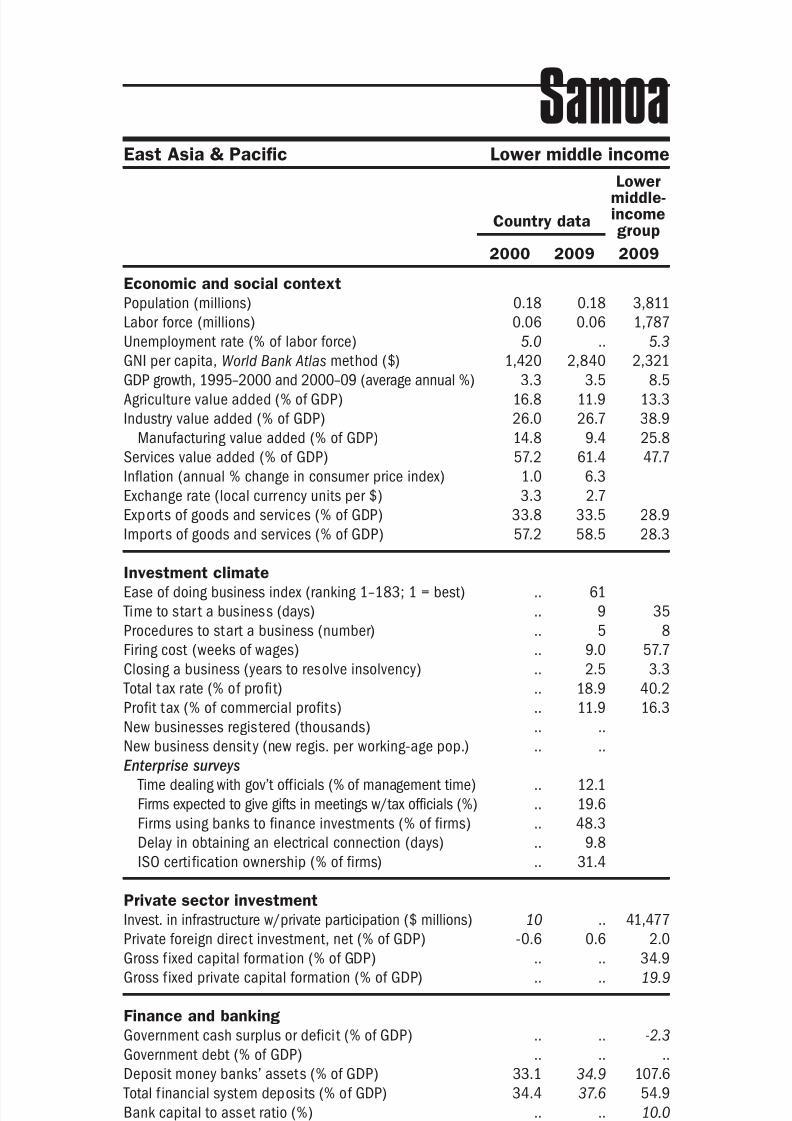
8/6/2019 The Little Data Book on Private Sector Development 2011
http://slidepdf.com/reader/full/the-little-data-book-on-private-sector-development-2011 187/246
Economic and social context
Population (millions)
Labor force (millions)
Unemployment rate (% of labor force)
GNI per capita, World Bank Atlas method ($)GDP growth, 1995–2000 and 2000–09 (average annual %)
Agriculture value added (% of GDP)
Industry value added (% of GDP)
Manufacturing value added (% of GDP)
Services value added (% of GDP)
Inflation (annual % change in consumer price index)
Exchange rate (local currency units per $)
Exports of goods and services (% of GDP)
Imports of goods and services (% of GDP) Investment climate
Ease of doing business index (ranking 1–183; 1 = best)
Time to star t a business (days)
Procedures to start a business (number)
Firing cost (weeks of wages)
Closing a business (years to resolve insolvency)
Total tax rate (% of profit)
Profit tax (% of commercial profits)New businesses registered (thousands)
New business density (new regis. per working-age pop.)
Enterprise surveys
Time dealing with gov’t officials (% of management time)
Firms expected to give gifts in meetings w/tax officials (%)
Firms using banks to finance investments (% of firms)
Delay in obtaining an electrical connection (days)
ISO certi fication ownership (% of firms)
Private sector investment
Invest. in infrastructure w/private participation ($ millions)
Private foreign direct investment, net (% of GDP)
Gross f ixed capital formation (% of GDP)
Gross f ixed private capital formation (% of GDP)
Finance and banking
Government cash surplus or deficit (% of GDP)
Government debt (% of GDP)
Deposit money banks’ assets (% of GDP) Total f inancial system deposits (% of GDP)
Bank capital to asset ratio (%)
Bank nonperforming loans to total gross loans ratio (%)
Domestic credit to the private sector (% of GDP)
Real interest rate (%)
Interest rate spread (percentage points)
Infrastructure
Paved roads (% of total roads)Electr ic power consumption (kWh per capita)
Power outages in a typical month (number)
Mobile cellular subscriptions (per 100 people)
Internet users (per 100 people)
179The Little Data Book on Private Sector Development 2011
East Asia & Pacific Lower middle income
Country data
Lowermiddle-incomegroup
2000 2009 2009
Samoa
0.18 0.18 3,811
0.06 0.06 1,787
5.0 .. 5.3
1,420 2,840 2,3213.3 3.5 8.5
16.8 11.9 13.3
26.0 26.7 38.9
14.8 9.4 25.8
57.2 61.4 47.7
1.0 6.3
3.3 2.7
33.8 33.5 28.9
57.2 58.5 28.3
.. 61
.. 9 35
.. 5 8
.. 9.0 57.7
.. 2.5 3.3
.. 18.9 40.2
.. 11.9 16.3.. ..
.. ..
.. 12.1
.. 19.6
.. 48.3
.. 9.8
.. 31.4
10 .. 41,477
-0.6 0.6 2.0
.. .. 34.9
.. .. 19.9
.. .. -2.3
.. .. ..
33.1 34.9 107.634.4 37.6 54.9
.. .. 10.0
.. .. 5.1
30.6 44.8 92.9
8.9 10.3
6.9 7.3 7.3
14.2 .. 36.3.. .. 1,318
.. 5.2
1.4 84.4 57.8
0.6 5.0 17.2
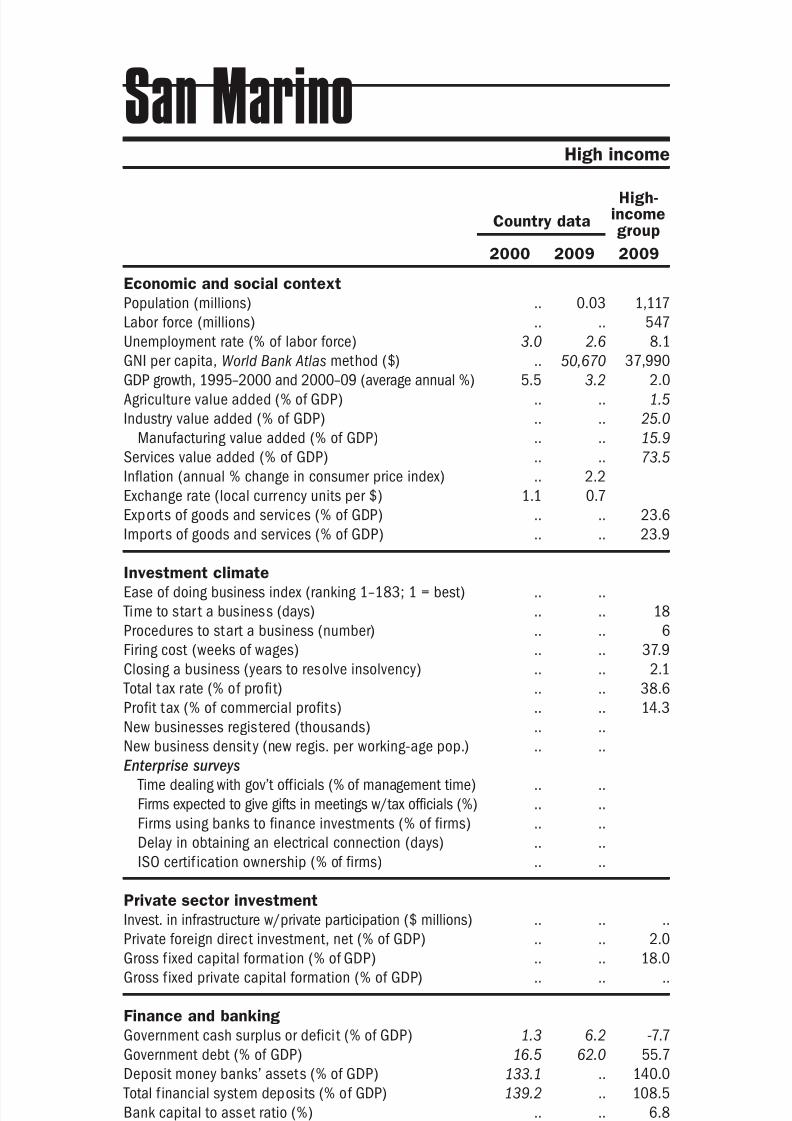
8/6/2019 The Little Data Book on Private Sector Development 2011
http://slidepdf.com/reader/full/the-little-data-book-on-private-sector-development-2011 188/246
Economic and social context
Population (millions)
Labor force (millions)
Unemployment rate (% of labor force)
GNI per capita, World Bank Atlas method ($)GDP growth, 1995–2000 and 2000–09 (average annual %)
Agriculture value added (% of GDP)
Industry value added (% of GDP)
Manufacturing value added (% of GDP)
Services value added (% of GDP)
Inflation (annual % change in consumer price index)
Exchange rate (local currency units per $)
Exports of goods and services (% of GDP)
Imports of goods and services (% of GDP) Investment climate
Ease of doing business index (ranking 1–183; 1 = best)
Time to star t a business (days)
Procedures to start a business (number)
Firing cost (weeks of wages)
Closing a business (years to resolve insolvency)
Total tax rate (% of profit)
Profit tax (% of commercial profits)New businesses registered (thousands)
New business density (new regis. per working-age pop.)
Enterprise surveys
Time dealing with gov’t officials (% of management time)
Firms expected to give gifts in meetings w/tax officials (%)
Firms using banks to finance investments (% of firms)
Delay in obtaining an electrical connection (days)
ISO certif ication ownership (% of firms)
Private sector investment
Invest. in infrastructure w/private participation ($ millions)
Private foreign direct investment, net (% of GDP)
Gross f ixed capital formation (% of GDP)
Gross f ixed private capital formation (% of GDP)
Finance and banking
Government cash surplus or deficit (% of GDP)
Government debt (% of GDP)
Deposit money banks’ assets (% of GDP) Total f inancial system deposits (% of GDP)
Bank capital to asset ratio (%)
Bank nonperforming loans to total gross loans ratio (%)
Domestic credit to the private sector (% of GDP)
Real interest rate (%)
Interest rate spread (percentage points)
Infrastructure
Paved roads (% of total roads)Electr ic power consumption (kWh per capita)
Power outages in a typical month (number)
Mobile cellular subscriptions (per 100 people)
Internet users (per 100 people)
180 2011 The Little Data Book on Private Sector Development
Country data
High-incomegroup
2000 2009 2009
High income
San Marino
.. 0.03 1,117
.. .. 547
3.0 2.6 8.1
.. 50,670 37,9905.5 3.2 2.0
.. .. 1.5
.. .. 25.0
.. .. 15.9
.. .. 73.5
.. 2.2
1.1 0.7
.. .. 23.6
.. .. 23.9
.. ..
.. .. 18
.. .. 6
.. .. 37.9
.. .. 2.1
.. .. 38.6
.. .. 14.3.. ..
.. ..
.. ..
.. ..
.. ..
.. ..
.. ..
.. .. ..
.. .. 2.0
.. .. 18.0
.. .. ..
1.3 6.2 -7.7
16.5 62.0 55.7
133.1 .. 140.0139.2 .. 108.5
.. .. 6.8
.. .. 3.4
.. .. 165.1
6.4 4.5
6.6 5.0 3.8
.. .. 93.4
.. .. 9,518
.. ..
.. 76.3 111.2
.. 54.1 72.3
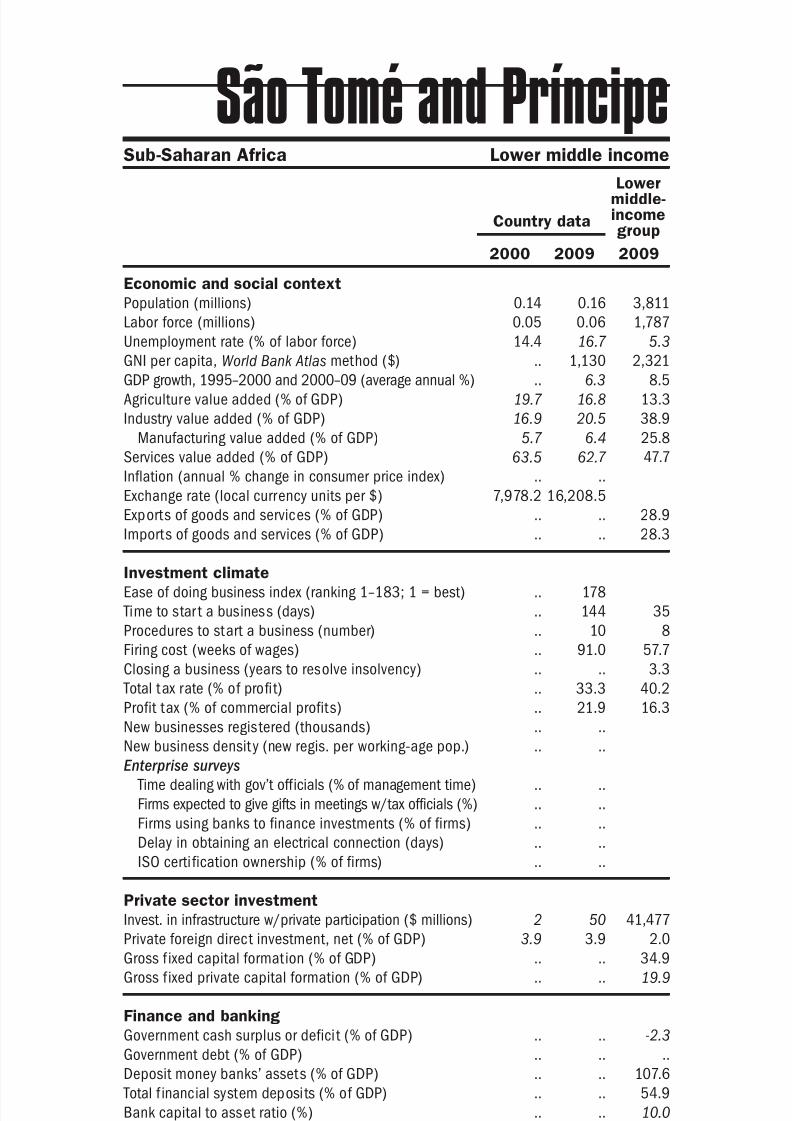
8/6/2019 The Little Data Book on Private Sector Development 2011
http://slidepdf.com/reader/full/the-little-data-book-on-private-sector-development-2011 189/246
Economic and social context
Population (millions)
Labor force (millions)
Unemployment rate (% of labor force)
GNI per capita, World Bank Atlas method ($)GDP growth, 1995–2000 and 2000–09 (average annual %)
Agriculture value added (% of GDP)
Industry value added (% of GDP)
Manufacturing value added (% of GDP)
Services value added (% of GDP)
Inflation (annual % change in consumer price index)
Exchange rate (local currency units per $)
Exports of goods and services (% of GDP)
Imports of goods and services (% of GDP) Investment climate
Ease of doing business index (ranking 1–183; 1 = best)
Time to star t a business (days)
Procedures to start a business (number)
Firing cost (weeks of wages)
Closing a business (years to resolve insolvency)
Total tax rate (% of profit)
Profit tax (% of commercial profits)New businesses registered (thousands)
New business density (new regis. per working-age pop.)
Enterprise surveys
Time dealing with gov’t officials (% of management time)
Firms expected to give gifts in meetings w/tax officials (%)
Firms using banks to finance investments (% of firms)
Delay in obtaining an electrical connection (days)
ISO certi fication ownership (% of firms)
Private sector investment
Invest. in infrastructure w/private participation ($ millions)
Private foreign direct investment, net (% of GDP)
Gross f ixed capital formation (% of GDP)
Gross f ixed private capital formation (% of GDP)
Finance and banking
Government cash surplus or deficit (% of GDP)
Government debt (% of GDP)
Deposit money banks’ assets (% of GDP) Total f inancial system deposits (% of GDP)
Bank capital to asset ratio (%)
Bank nonperforming loans to total gross loans ratio (%)
Domestic credit to the private sector (% of GDP)
Real interest rate (%)
Interest rate spread (percentage points)
Infrastructure
Paved roads (% of total roads)Electr ic power consumption (kWh per capita)
Power outages in a typical month (number)
Mobile cellular subscriptions (per 100 people)
Internet users (per 100 people)
181The Little Data Book on Private Sector Development 2011
Sub-Saharan Africa Lower middle income
Country data
Lowermiddle-incomegroup
2000 2009 2009
São Tomé and Príncipe
0.14 0.16 3,811
0.05 0.06 1,787
14.4 16.7 5.3
.. 1,130 2,321
.. 6.3 8.5
19.7 16.8 13.3
16.9 20.5 38.9
5.7 6.4 25.8
63.5 62.7 47.7
.. ..
7,978.2 16,208.5
.. .. 28.9
.. .. 28.3
.. 178
.. 144 35
.. 10 8
.. 91.0 57.7
.. .. 3.3
.. 33.3 40.2
.. 21.9 16.3.. ..
.. ..
.. ..
.. ..
.. ..
.. ..
.. ..
2 50 41,477
3.9 3.9 2.0
.. .. 34.9
.. .. 19.9
.. .. -2.3
.. .. ..
.. .. 107.6
.. .. 54.9
.. .. 10.0
.. .. 5.1
4.3 34.6 92.9
25.7 14.6
18.7 19.7 7.3
68.1 .. 36.3.. .. 1,318
.. ..
0.0 39.3 57.8
4.6 16.4 17.2
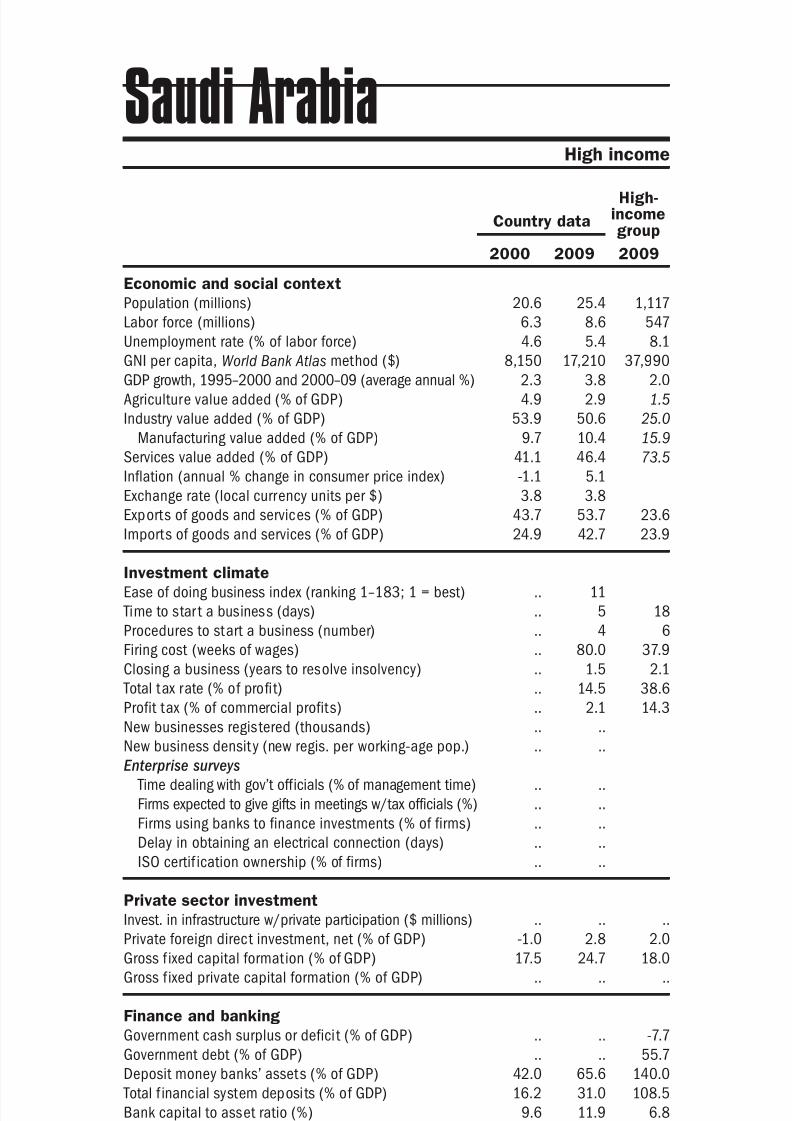
8/6/2019 The Little Data Book on Private Sector Development 2011
http://slidepdf.com/reader/full/the-little-data-book-on-private-sector-development-2011 190/246

8/6/2019 The Little Data Book on Private Sector Development 2011
http://slidepdf.com/reader/full/the-little-data-book-on-private-sector-development-2011 191/246
Economic and social context
Population (millions)
Labor force (millions)
Unemployment rate (% of labor force)
GNI per capita, World Bank Atlas method ($)GDP growth, 1995–2000 and 2000–09 (average annual %)
Agriculture value added (% of GDP)
Industry value added (% of GDP)
Manufacturing value added (% of GDP)
Services value added (% of GDP)
Inflation (annual % change in consumer price index)
Exchange rate (local currency units per $)
Exports of goods and services (% of GDP)
Imports of goods and services (% of GDP) Investment climate
Ease of doing business index (ranking 1–183; 1 = best)
Time to star t a business (days)
Procedures to start a business (number)
Firing cost (weeks of wages)
Closing a business (years to resolve insolvency)
Total tax rate (% of profit)
Profit tax (% of commercial profits)New businesses registered (thousands)
New business density (new regis. per working-age pop.)
Enterprise surveys
Time dealing with gov’t officials (% of management time)
Firms expected to give gifts in meetings w/tax officials (%)
Firms using banks to finance investments (% of firms)
Delay in obtaining an electrical connection (days)
ISO certi fication ownership (% of firms)
Private sector investment
Invest. in infrastructure w/private participation ($ millions)
Private foreign direct investment, net (% of GDP)
Gross f ixed capital formation (% of GDP)
Gross f ixed private capital formation (% of GDP)
Finance and banking
Government cash surplus or deficit (% of GDP)
Government debt (% of GDP)
Deposit money banks’ assets (% of GDP) Total f inancial system deposits (% of GDP)
Bank capital to asset ratio (%)
Bank nonperforming loans to total gross loans ratio (%)
Domestic credit to the private sector (% of GDP)
Real interest rate (%)
Interest rate spread (percentage points)
Infrastructure
Paved roads (% of total roads)Electr ic power consumption (kWh per capita)
Power outages in a typical month (number)
Mobile cellular subscriptions (per 100 people)
Internet users (per 100 people)
183The Little Data Book on Private Sector Development 2011
Sub-Saharan Africa Lower middle income
Country data
Lowermiddle-incomegroup
2000 2009 2009
Senegal
9.9 12.5 3,811
4.1 5.4 1,787
.. 10.0 5.3
510 1,040 2,3214.4 4.3 8.5
19.1 16.6 13.3
23.2 21.7 38.9
14.7 12.7 25.8
57.6 61.7 47.7
0.7 -1.1
712.0 472.2
27.9 24.0 28.9
37.2 44.0 28.3
.. 152
.. 8 35
.. 4 8
.. 38.0 57.7
.. 3.0 3.3
.. 46.0 40.2
.. 14.8 16.3.. 1.6
.. 0.2
.. 2.9
.. 18.7
.. 19.8
.. 9.4
.. 6.1
79 520 41,477
1.3 1.6 2.0
22.4 27.9 34.9
17.9 17.8 19.9
-0.9 .. -2.3
73.7 .. ..
21.4 29.1 107.618.4 28.6 54.9
9.9 9.3 10.0
18.1 18.7 5.1
18.7 24.7 92.9
.. ..
.. .. 7.3
29.3 29.3 36.3101 158 1,318
.. 11.8
2.5 55.1 57.8
0.4 7.4 17.2
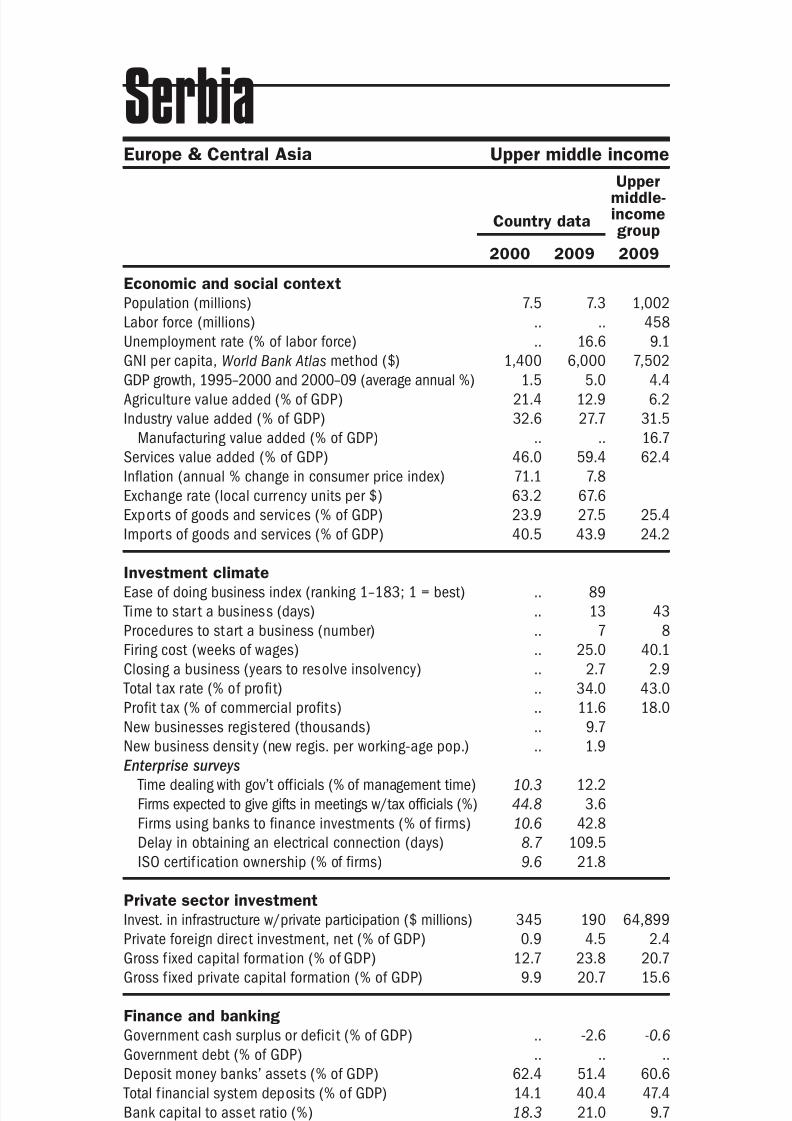
8/6/2019 The Little Data Book on Private Sector Development 2011
http://slidepdf.com/reader/full/the-little-data-book-on-private-sector-development-2011 192/246
Economic and social context
Population (millions)
Labor force (millions)
Unemployment rate (% of labor force)
GNI per capita, World Bank Atlas method ($)GDP growth, 1995–2000 and 2000–09 (average annual %)
Agriculture value added (% of GDP)
Industry value added (% of GDP)
Manufacturing value added (% of GDP)
Services value added (% of GDP)
Inflation (annual % change in consumer price index)
Exchange rate (local currency units per $)
Exports of goods and services (% of GDP)
Imports of goods and services (% of GDP) Investment climate
Ease of doing business index (ranking 1–183; 1 = best)
Time to star t a business (days)
Procedures to start a business (number)
Firing cost (weeks of wages)
Closing a business (years to resolve insolvency)
Total tax rate (% of profit)
Profit tax (% of commercial profits)New businesses registered (thousands)
New business density (new regis. per working-age pop.)
Enterprise surveys
Time dealing with gov’t officials (% of management time)
Firms expected to give gifts in meetings w/tax officials (%)
Firms using banks to finance investments (% of firms)
Delay in obtaining an electrical connection (days)
ISO certif ication ownership (% of firms)
Private sector investment
Invest. in infrastructure w/private participation ($ millions)
Private foreign direct investment, net (% of GDP)
Gross f ixed capital formation (% of GDP)
Gross f ixed private capital formation (% of GDP)
Finance and banking
Government cash surplus or deficit (% of GDP)
Government debt (% of GDP)
Deposit money banks’ assets (% of GDP) Total f inancial system deposits (% of GDP)
Bank capital to asset ratio (%)
Bank nonperforming loans to total gross loans ratio (%)
Domestic credit to the private sector (% of GDP)
Real interest rate (%)
Interest rate spread (percentage points)
Infrastructure
Paved roads (% of total roads)Electr ic power consumption (kWh per capita)
Power outages in a typical month (number)
Mobile cellular subscriptions (per 100 people)
Internet users (per 100 people)
184 2011 The Little Data Book on Private Sector Development
Country data
Uppermiddle-incomegroup
2000 2009 2009
Europe & Central Asia Upper middle income
Serbia
7.5 7.3 1,002
.. .. 458
.. 16.6 9.1
1,400 6,000 7,5021.5 5.0 4.4
21.4 12.9 6.2
32.6 27.7 31.5
.. .. 16.7
46.0 59.4 62.4
71.1 7.8
63.2 67.6
23.9 27.5 25.4
40.5 43.9 24.2
.. 89
.. 13 43
.. 7 8
.. 25.0 40.1
.. 2.7 2.9
.. 34.0 43.0
.. 11.6 18.0.. 9.7
.. 1.9
10.3 12.2
44.8 3.6
10.6 42.8
8.7 109.5
9.6 21.8
345 190 64,899
0.9 4.5 2.4
12.7 23.8 20.7
9.9 20.7 15.6
.. -2.6 -0.6
.. .. ..
62.4 51.4 60.614.1 40.4 47.4
18.3 21.0 9.7
21.6 15.5 4.2
49.1 42.2 47.8
-40.1 1.6
-72.4 0.0 5.5
62.7 47.7 36.84,199 4,284 3,001
.. 1.1
.. 135.4 100.6
.. 56.1 34.6

8/6/2019 The Little Data Book on Private Sector Development 2011
http://slidepdf.com/reader/full/the-little-data-book-on-private-sector-development-2011 193/246
Economic and social context
Population (millions)
Labor force (millions)
Unemployment rate (% of labor force)
GNI per capita, World Bank Atlas method ($)GDP growth, 1995–2000 and 2000–09 (average annual %)
Agriculture value added (% of GDP)
Industry value added (% of GDP)
Manufacturing value added (% of GDP)
Services value added (% of GDP)
Inflation (annual % change in consumer price index)
Exchange rate (local currency units per $)
Exports of goods and services (% of GDP)
Imports of goods and services (% of GDP) Investment climate
Ease of doing business index (ranking 1–183; 1 = best)
Time to star t a business (days)
Procedures to start a business (number)
Firing cost (weeks of wages)
Closing a business (years to resolve insolvency)
Total tax rate (% of profit)
Profit tax (% of commercial profits)New businesses registered (thousands)
New business density (new regis. per working-age pop.)
Enterprise surveys
Time dealing with gov’t officials (% of management time)
Firms expected to give gifts in meetings w/tax officials (%)
Firms using banks to finance investments (% of firms)
Delay in obtaining an electrical connection (days)
ISO certi fication ownership (% of firms)
Private sector investment
Invest. in infrastructure w/private participation ($ millions)
Private foreign direct investment, net (% of GDP)
Gross f ixed capital formation (% of GDP)
Gross f ixed private capital formation (% of GDP)
Finance and banking
Government cash surplus or deficit (% of GDP)
Government debt (% of GDP)
Deposit money banks’ assets (% of GDP) Total f inancial system deposits (% of GDP)
Bank capital to asset ratio (%)
Bank nonperforming loans to total gross loans ratio (%)
Domestic credit to the private sector (% of GDP)
Real interest rate (%)
Interest rate spread (percentage points)
Infrastructure
Paved roads (% of total roads)Electr ic power consumption (kWh per capita)
Power outages in a typical month (number)
Mobile cellular subscriptions (per 100 people)
Internet users (per 100 people)
185The Little Data Book on Private Sector Development 2011
Sub-Saharan Africa Upper middle income
Country data
Uppermiddle-incomegroup
2000 2009 2009
Seychelles
0.08 0.09 1,002
.. .. 458
9.8 5.5 9.1
7,420 8,480 7,5026.6 1.7 4.4
3.0 2.0 6.2
29.0 19.7 31.5
19.2 11.8 16.7
68.0 78.3 62.4
6.3 31.8
5.7 13.6
78.2 119.3 25.4
81.4 127.6 24.2
.. 95
.. 39 43
.. 10 8
.. 39.0 40.1
.. .. 2.9
.. 44.1 43.0
.. 20.8 18.0.. ..
.. ..
.. ..
.. ..
.. ..
.. ..
.. ..
7 15 64,899
4.0 32.5 2.4
25.2 24.2 20.7
13.8 20.9 15.6
-13.9 4.3 -0.6
.. .. ..
96.5 103.1 60.683.8 105.9 47.4
.. .. 9.7
.. .. 4.2
22.3 25.1 47.8
9.4 -10.3
6.0 5.6 5.5
84.5 96.5 36.8.. .. 3,001
.. ..
32.0 104.9 100.6
7.4 38.6 34.6
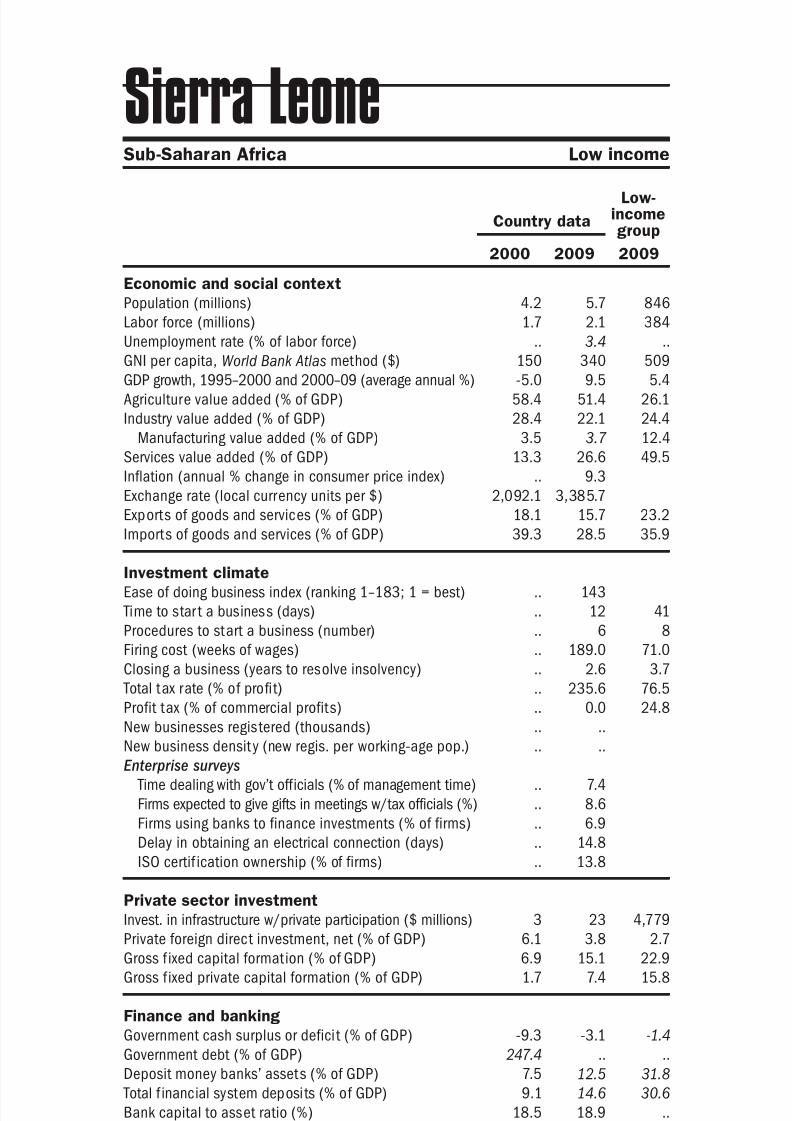
8/6/2019 The Little Data Book on Private Sector Development 2011
http://slidepdf.com/reader/full/the-little-data-book-on-private-sector-development-2011 194/246
Economic and social context
Population (millions)
Labor force (millions)
Unemployment rate (% of labor force)
GNI per capita, World Bank Atlas method ($)GDP growth, 1995–2000 and 2000–09 (average annual %)
Agriculture value added (% of GDP)
Industry value added (% of GDP)
Manufacturing value added (% of GDP)
Services value added (% of GDP)
Inflation (annual % change in consumer price index)
Exchange rate (local currency units per $)
Exports of goods and services (% of GDP)
Imports of goods and services (% of GDP) Investment climate
Ease of doing business index (ranking 1–183; 1 = best)
Time to star t a business (days)
Procedures to start a business (number)
Firing cost (weeks of wages)
Closing a business (years to resolve insolvency)
Total tax rate (% of profit)
Profit tax (% of commercial profits)New businesses registered (thousands)
New business density (new regis. per working-age pop.)
Enterprise surveys
Time dealing with gov’t officials (% of management time)
Firms expected to give gifts in meetings w/tax officials (%)
Firms using banks to finance investments (% of firms)
Delay in obtaining an electrical connection (days)
ISO certif ication ownership (% of firms)
Private sector investment
Invest. in infrastructure w/private participation ($ millions)
Private foreign direct investment, net (% of GDP)
Gross f ixed capital formation (% of GDP)
Gross f ixed private capital formation (% of GDP)
Finance and banking
Government cash surplus or deficit (% of GDP)
Government debt (% of GDP)
Deposit money banks’ assets (% of GDP) Total f inancial system deposits (% of GDP)
Bank capital to asset ratio (%)
Bank nonperforming loans to total gross loans ratio (%)
Domestic credit to the private sector (% of GDP)
Real interest rate (%)
Interest rate spread (percentage points)
Infrastructure
Paved roads (% of total roads)Electr ic power consumption (kWh per capita)
Power outages in a typical month (number)
Mobile cellular subscriptions (per 100 people)
Internet users (per 100 people)
186 2011 The Little Data Book on Private Sector Development
Country data
Low-incomegroup
2000 2009 2009
Sub-Saharan Africa Low income
Sierra Leone
4.2 5.7 846
1.7 2.1 384
.. 3.4 ..
150 340 509-5.0 9.5 5.4
58.4 51.4 26.1
28.4 22.1 24.4
3.5 3.7 12.4
13.3 26.6 49.5
.. 9.3
2,092.1 3,385.7
18.1 15.7 23.2
39.3 28.5 35.9
.. 143
.. 12 41
.. 6 8
.. 189.0 71.0
.. 2.6 3.7
.. 235.6 76.5
.. 0.0 24.8.. ..
.. ..
.. 7.4
.. 8.6
.. 6.9
.. 14.8
.. 13.8
3 23 4,779
6.1 3.8 2.7
6.9 15.1 22.9
1.7 7.4 15.8
-9.3 -3.1 -1.4
247.4 .. ..
7.5 12.5 31.89.1 14.6 30.6
18.5 18.9 ..
37.9 16.5 ..
2.1 9.3 26.3
19.0 12.0
17.0 14.8 11.5
7.9 .. 12.0.. .. 231
.. 15.9
0.3 20.4 26.6
0.1 0.3 2.7
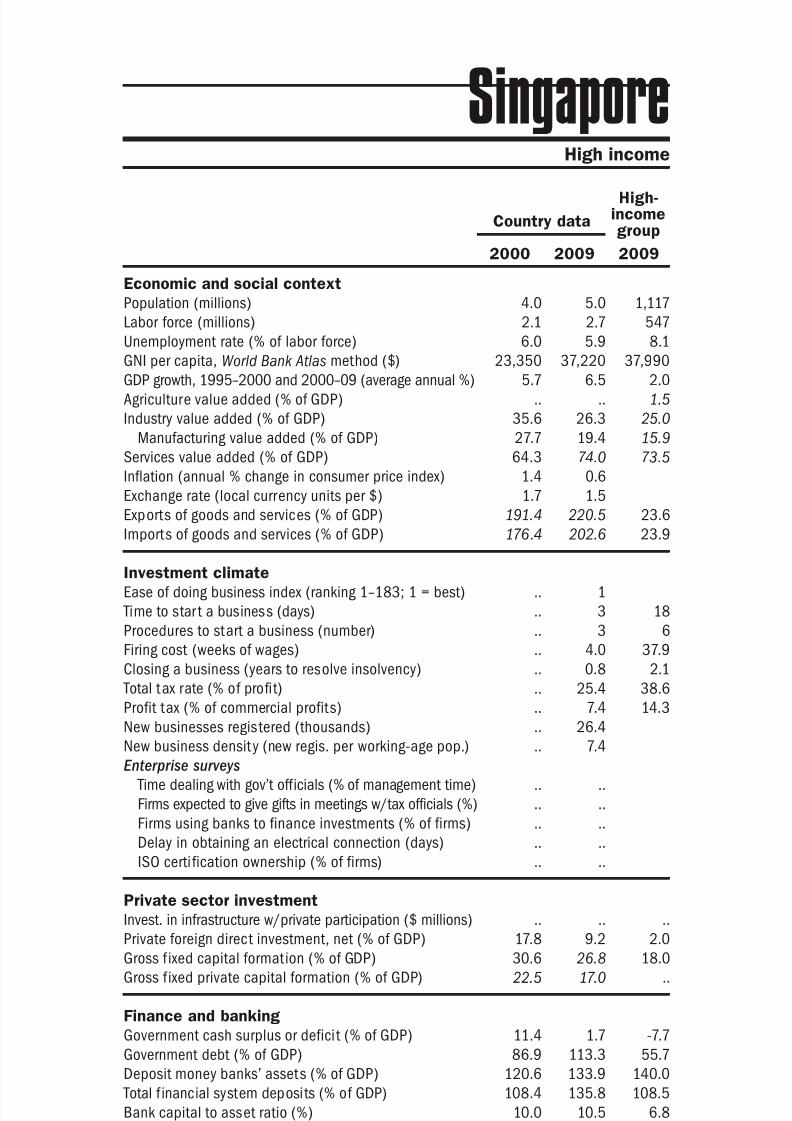
8/6/2019 The Little Data Book on Private Sector Development 2011
http://slidepdf.com/reader/full/the-little-data-book-on-private-sector-development-2011 195/246
Economic and social context
Population (millions)
Labor force (millions)
Unemployment rate (% of labor force)
GNI per capita, World Bank Atlas method ($)GDP growth, 1995–2000 and 2000–09 (average annual %)
Agriculture value added (% of GDP)
Industry value added (% of GDP)
Manufacturing value added (% of GDP)
Services value added (% of GDP)
Inflation (annual % change in consumer price index)
Exchange rate (local currency units per $)
Exports of goods and services (% of GDP)
Imports of goods and services (% of GDP) Investment climate
Ease of doing business index (ranking 1–183; 1 = best)
Time to star t a business (days)
Procedures to start a business (number)
Firing cost (weeks of wages)
Closing a business (years to resolve insolvency)
Total tax rate (% of profit)
Profit tax (% of commercial profits)New businesses registered (thousands)
New business density (new regis. per working-age pop.)
Enterprise surveys
Time dealing with gov’t officials (% of management time)
Firms expected to give gifts in meetings w/tax officials (%)
Firms using banks to finance investments (% of firms)
Delay in obtaining an electrical connection (days)
ISO certi fication ownership (% of firms)
Private sector investment
Invest. in infrastructure w/private participation ($ millions)
Private foreign direct investment, net (% of GDP)
Gross f ixed capital formation (% of GDP)
Gross f ixed private capital formation (% of GDP)
Finance and banking
Government cash surplus or deficit (% of GDP)
Government debt (% of GDP)
Deposit money banks’ assets (% of GDP) Total f inancial system deposits (% of GDP)
Bank capital to asset ratio (%)
Bank nonperforming loans to total gross loans ratio (%)
Domestic credit to the private sector (% of GDP)
Real interest rate (%)
Interest rate spread (percentage points)
Infrastructure
Paved roads (% of total roads)Electr ic power consumption (kWh per capita)
Power outages in a typical month (number)
Mobile cellular subscriptions (per 100 people)
Internet users (per 100 people)
187The Little Data Book on Private Sector Development 2011
High income
Country data
High-incomegroup
2000 2009 2009
Singapore
4.0 5.0 1,117
2.1 2.7 547
6.0 5.9 8.1
23,350 37,220 37,9905.7 6.5 2.0
.. .. 1.5
35.6 26.3 25.0
27.7 19.4 15.9
64.3 74.0 73.5
1.4 0.6
1.7 1.5
191.4 220.5 23.6
176.4 202.6 23.9
.. 1
.. 3 18
.. 3 6
.. 4.0 37.9
.. 0.8 2.1
.. 25.4 38.6
.. 7.4 14.3.. 26.4
.. 7.4
.. ..
.. ..
.. ..
.. ..
.. ..
.. .. ..
17.8 9.2 2.0
30.6 26.8 18.0
22.5 17.0 ..
11.4 1.7 -7.7
86.9 113.3 55.7
120.6 133.9 140.0108.4 135.8 108.5
10.0 10.5 6.8
3.4 2.3 3.4
99.5 103.2 165.1
2.0 7.4
4.1 5.1 3.8
100.0 100.0 93.47,575 8,185 9,518
.. ..
68.2 133.4 111.2
32.3 73.3 72.3
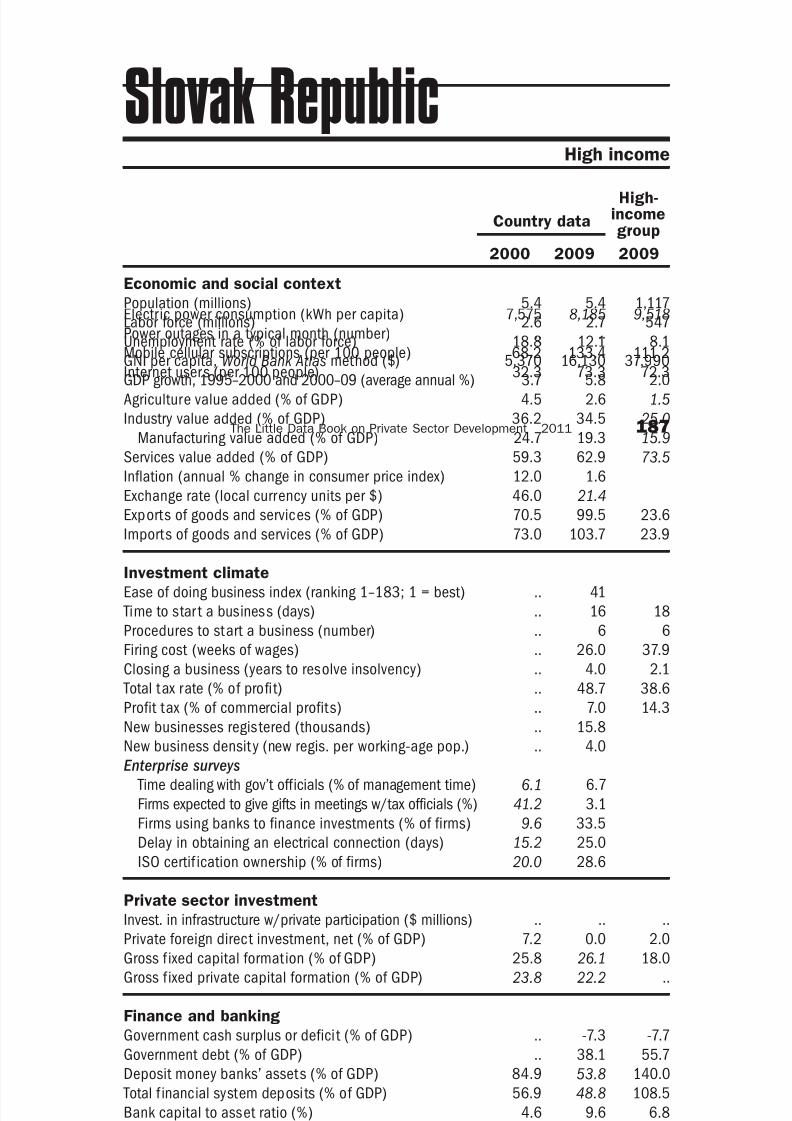
8/6/2019 The Little Data Book on Private Sector Development 2011
http://slidepdf.com/reader/full/the-little-data-book-on-private-sector-development-2011 196/246
Economic and social context
Population (millions)
Labor force (millions)
Unemployment rate (% of labor force)
GNI per capita, World Bank Atlas method ($)GDP growth, 1995–2000 and 2000–09 (average annual %)
Agriculture value added (% of GDP)
Industry value added (% of GDP)
Manufacturing value added (% of GDP)
Services value added (% of GDP)
Inflation (annual % change in consumer price index)
Exchange rate (local currency units per $)
Exports of goods and services (% of GDP)
Imports of goods and services (% of GDP) Investment climate
Ease of doing business index (ranking 1–183; 1 = best)
Time to star t a business (days)
Procedures to start a business (number)
Firing cost (weeks of wages)
Closing a business (years to resolve insolvency)
Total tax rate (% of profit)
Profit tax (% of commercial profits)New businesses registered (thousands)
New business density (new regis. per working-age pop.)
Enterprise surveys
Time dealing with gov’t officials (% of management time)
Firms expected to give gifts in meetings w/tax officials (%)
Firms using banks to finance investments (% of firms)
Delay in obtaining an electrical connection (days)
ISO certif ication ownership (% of firms)
Private sector investment
Invest. in infrastructure w/private participation ($ millions)
Private foreign direct investment, net (% of GDP)
Gross f ixed capital formation (% of GDP)
Gross f ixed private capital formation (% of GDP)
Finance and banking
Government cash surplus or deficit (% of GDP)
Government debt (% of GDP)
Deposit money banks’ assets (% of GDP) Total f inancial system deposits (% of GDP)
Bank capital to asset ratio (%)
Bank nonperforming loans to total gross loans ratio (%)
Domestic credit to the private sector (% of GDP)
Real interest rate (%)
Interest rate spread (percentage points)
Infrastructure
Paved roads (% of total roads)Electr ic power consumption (kWh per capita)
Power outages in a typical month (number)
Mobile cellular subscriptions (per 100 people)
Internet users (per 100 people)
188 2011 The Little Data Book on Private Sector Development
Country data
High-incomegroup
2000 2009 2009
High income
Slovak Republic
5.4 5.4 1,117
2.6 2.7 547
18.8 12.1 8.1
5,370 16,130 37,9903.7 5.8 2.0
4.5 2.6 1.5
36.2 34.5 25.0
24.7 19.3 15.9
59.3 62.9 73.5
12.0 1.6
46.0 21.4
70.5 99.5 23.6
73.0 103.7 23.9
.. 41
.. 16 18
.. 6 6
.. 26.0 37.9
.. 4.0 2.1
.. 48.7 38.6
.. 7.0 14.3.. 15.8
.. 4.0
6.1 6.7
41.2 3.1
9.6 33.5
15.2 25.0
20.0 28.6
.. .. ..
7.2 0.0 2.0
25.8 26.1 18.0
23.8 22.2 ..
.. -7.3 -7.7
.. 38.1 55.7
84.9 53.8 140.056.9 48.8 108.5
4.6 9.6 6.8
13.7 5.3 3.4
51.1 44.7 165.1
5.0 2.8
6.4 4.3 3.8
87.0 87.0 93.44,956 5,268 9,518
.. 1.2
23.1 101.5 111.2
9.4 75.0 72.3

8/6/2019 The Little Data Book on Private Sector Development 2011
http://slidepdf.com/reader/full/the-little-data-book-on-private-sector-development-2011 197/246
Economic and social context
Population (millions)
Labor force (millions)
Unemployment rate (% of labor force)
GNI per capita, World Bank Atlas method ($)GDP growth, 1995–2000 and 2000–09 (average annual %)
Agriculture value added (% of GDP)
Industry value added (% of GDP)
Manufacturing value added (% of GDP)
Services value added (% of GDP)
Inflation (annual % change in consumer price index)
Exchange rate (local currency units per $)
Exports of goods and services (% of GDP)
Imports of goods and services (% of GDP) Investment climate
Ease of doing business index (ranking 1–183; 1 = best)
Time to star t a business (days)
Procedures to start a business (number)
Firing cost (weeks of wages)
Closing a business (years to resolve insolvency)
Total tax rate (% of profit)
Profit tax (% of commercial profits)New businesses registered (thousands)
New business density (new regis. per working-age pop.)
Enterprise surveys
Time dealing with gov’t officials (% of management time)
Firms expected to give gifts in meetings w/tax officials (%)
Firms using banks to finance investments (% of firms)
Delay in obtaining an electrical connection (days)
ISO certi fication ownership (% of firms)
Private sector investment
Invest. in infrastructure w/private participation ($ millions)
Private foreign direct investment, net (% of GDP)
Gross f ixed capital formation (% of GDP)
Gross f ixed private capital formation (% of GDP)
Finance and banking
Government cash surplus or deficit (% of GDP)
Government debt (% of GDP)
Deposit money banks’ assets (% of GDP) Total f inancial system deposits (% of GDP)
Bank capital to asset ratio (%)
Bank nonperforming loans to total gross loans ratio (%)
Domestic credit to the private sector (% of GDP)
Real interest rate (%)
Interest rate spread (percentage points)
Infrastructure
Paved roads (% of total roads)Electr ic power consumption (kWh per capita)
Power outages in a typical month (number)
Mobile cellular subscriptions (per 100 people)
Internet users (per 100 people)
189The Little Data Book on Private Sector Development 2011
High income
Country data
High-incomegroup
2000 2009 2009
Slovenia
2.0 2.0 1,117
0.96 1.0 547
7.2 5.9 8.1
11,090 23,520 37,9904.4 3.8 2.0
3.3 2.4 1.5
35.8 33.9 25.0
25.8 22.1 15.9
60.9 63.8 73.5
8.9 0.9
222.7 191.0
53.9 58.9 23.6
57.4 57.4 23.9
.. 42
.. 6 18
.. 2 6
.. 37.0 37.9
.. 2.0 2.1
.. 35.4 38.6
.. 14.8 14.3.. 5.8
.. 4.2
4.4 7.3
14.7 0.0
12.7 52.2
6.4 60.8
32.0 28.0
.. .. ..
0.7 -1.2 2.0
26.1 24.0 18.0
57.3 59.1 ..
-1.1 -5.5 -7.7
22.2 .. 55.7
46.7 93.6 140.044.9 55.8 108.5
10.1 8.3 6.8
6.5 2.3 3.4
35.9 94.0 165.1
9.9 4.0
5.7 4.5 3.8
100.0 100.0 93.45,778 6,920 9,518
.. 2.7
61.1 102.8 111.2
15.1 63.6 72.3
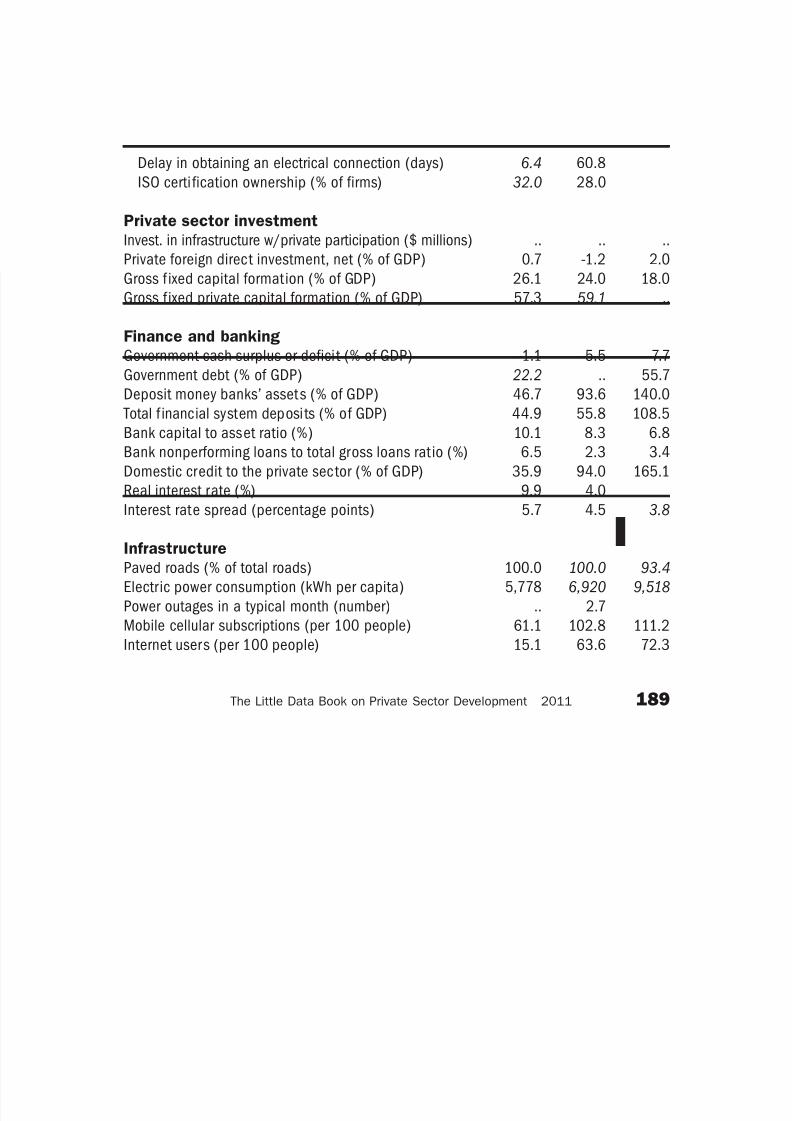
8/6/2019 The Little Data Book on Private Sector Development 2011
http://slidepdf.com/reader/full/the-little-data-book-on-private-sector-development-2011 198/246
Economic and social context
Population (millions)
Labor force (millions)
Unemployment rate (% of labor force)
GNI per capita, World Bank Atlas method ($)GDP growth, 1995–2000 and 2000–09 (average annual %)
Agriculture value added (% of GDP)
Industry value added (% of GDP)
Manufacturing value added (% of GDP)
Services value added (% of GDP)
Inflation (annual % change in consumer price index)
Exchange rate (local currency units per $)
Exports of goods and services (% of GDP)
Imports of goods and services (% of GDP) Investment climate
Ease of doing business index (ranking 1–183; 1 = best)
Time to star t a business (days)
Procedures to start a business (number)
Firing cost (weeks of wages)
Closing a business (years to resolve insolvency)
Total tax rate (% of profit)
Profit tax (% of commercial profits)New businesses registered (thousands)
New business density (new regis. per working-age pop.)
Enterprise surveys
Time dealing with gov’t officials (% of management time)
Firms expected to give gifts in meetings w/tax officials (%)
Firms using banks to finance investments (% of firms)
Delay in obtaining an electrical connection (days)
ISO certif ication ownership (% of firms)
Private sector investment
Invest. in infrastructure w/private participation ($ millions)
Private foreign direct investment, net (% of GDP)
Gross f ixed capital formation (% of GDP)
Gross f ixed private capital formation (% of GDP)
Finance and banking
Government cash surplus or deficit (% of GDP)
Government debt (% of GDP)
Deposit money banks’ assets (% of GDP) Total f inancial system deposits (% of GDP)
Bank capital to asset ratio (%)
Bank nonperforming loans to total gross loans ratio (%)
Domestic credit to the private sector (% of GDP)
Real interest rate (%)
Interest rate spread (percentage points)
Infrastructure
Paved roads (% of total roads)Electr ic power consumption (kWh per capita)
Power outages in a typical month (number)
Mobile cellular subscriptions (per 100 people)
Internet users (per 100 people)
190 2011 The Little Data Book on Private Sector Development
Country data
Low-incomegroup
2000 2009 2009
East Asia & Pacific Low income
Solomon Islands
0.42 0.52 846
0.09 0.12 384
31.9 .. ..
1,000 910 509-1.9 4.5 5.4
34.7 38.9 26.1
12.7 6.1 24.4
8.0 3.8 12.4
52.6 55.0 49.5
7.9 7.1
5.1 8.1
24.1 33.5 23.2
38.6 46.9 35.9
.. 96
.. 57 41
.. 7 8
.. 44.0 71.0
.. 1.0 3.7
.. 36.4 76.5
.. 25.8 24.8.. ..
.. ..
.. ..
.. ..
.. ..
.. ..
.. ..
.. 5 4,779
3.0 17.9 2.7
6.1 13.4 22.9
.. .. 15.8
.. .. -1.4
.. .. ..
23.3 .. 31.824.0 .. 30.6
.. .. ..
.. .. ..
16.0 28.3 26.3
3.5 6.6
11.6 11.1 11.5
2.4 .. 12.0.. .. 231
.. ..
0.3 5.7 26.6
0.5 1.9 2.7
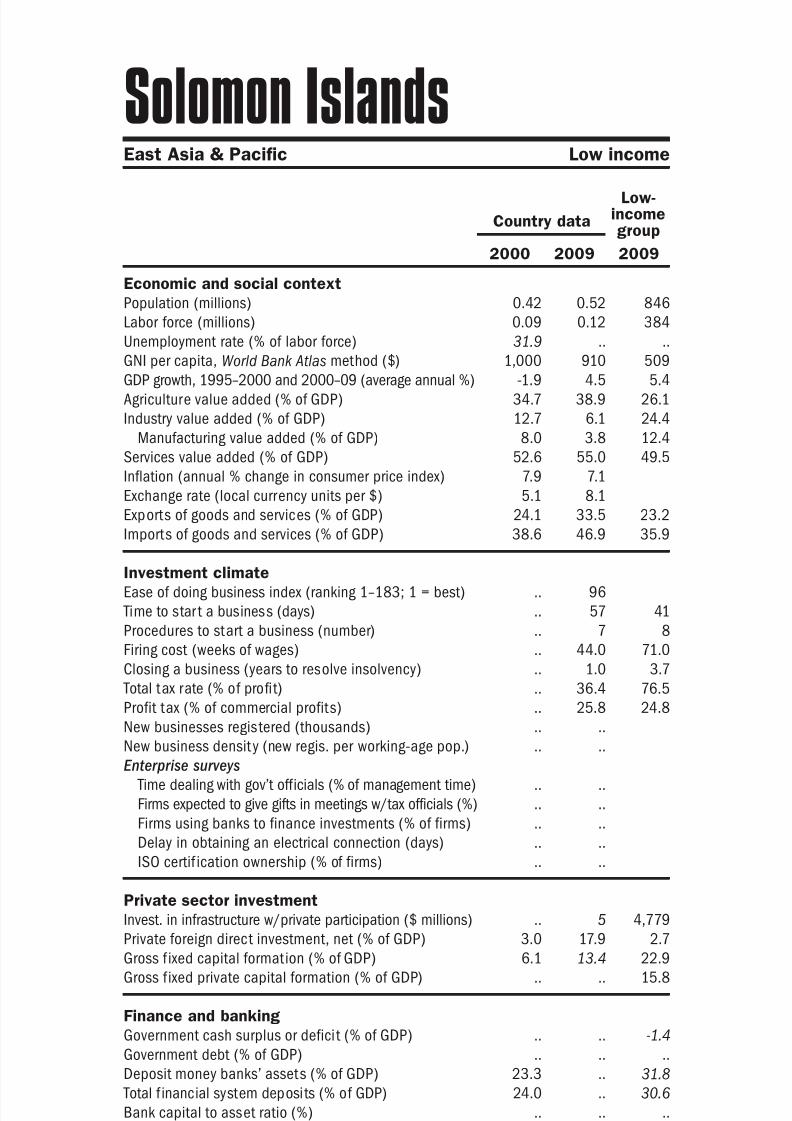
8/6/2019 The Little Data Book on Private Sector Development 2011
http://slidepdf.com/reader/full/the-little-data-book-on-private-sector-development-2011 199/246
Economic and social context
Population (millions)
Labor force (millions)
Unemployment rate (% of labor force)
GNI per capita, World Bank Atlas method ($)GDP growth, 1995–2000 and 2000–09 (average annual %)
Agriculture value added (% of GDP)
Industry value added (% of GDP)
Manufacturing value added (% of GDP)
Services value added (% of GDP)
Inflation (annual % change in consumer price index)
Exchange rate (local currency units per $)
Exports of goods and services (% of GDP)
Imports of goods and services (% of GDP) Investment climate
Ease of doing business index (ranking 1–183; 1 = best)
Time to star t a business (days)
Procedures to start a business (number)
Firing cost (weeks of wages)
Closing a business (years to resolve insolvency)
Total tax rate (% of profit)
Profit tax (% of commercial profits)New businesses registered (thousands)
New business density (new regis. per working-age pop.)
Enterprise surveys
Time dealing with gov’t officials (% of management time)
Firms expected to give gifts in meetings w/tax officials (%)
Firms using banks to finance investments (% of firms)
Delay in obtaining an electrical connection (days)
ISO certi fication ownership (% of firms)
Private sector investment
Invest. in infrastructure w/private participation ($ millions)
Private foreign direct investment, net (% of GDP)
Gross f ixed capital formation (% of GDP)
Gross f ixed private capital formation (% of GDP)
Finance and banking
Government cash surplus or deficit (% of GDP)
Government debt (% of GDP)
Deposit money banks’ assets (% of GDP) Total f inancial system deposits (% of GDP)
Bank capital to asset ratio (%)
Bank nonperforming loans to total gross loans ratio (%)
Domestic credit to the private sector (% of GDP)
Real interest rate (%)
Interest rate spread (percentage points)
Infrastructure
Paved roads (% of total roads)Electr ic power consumption (kWh per capita)
Power outages in a typical month (number)
Mobile cellular subscriptions (per 100 people)
Internet users (per 100 people)
191The Little Data Book on Private Sector Development 2011
Sub-Saharan Africa Low income
Country data
Low-incomegroup
2000 2009 2009
Somalia
7.4 9.1 846
2.9 3.5 384
.. .. ..
.. .. 509
.. .. 5.4
.. .. 26.1
.. .. 24.4
.. .. 12.4
.. .. 49.5
.. ..
.. ..
.. .. 23.2
.. .. 35.9
.. ..
.. .. 41
.. .. 8
.. .. 71.0
.. .. 3.7
.. .. 76.5
.. .. 24.8.. ..
.. ..
.. ..
.. ..
.. ..
.. ..
.. ..
1 1 4,779
.. .. 2.7
.. .. 22.9
.. .. 15.8
.. .. -1.4
.. .. ..
.. .. 31.8
.. .. 30.6
.. .. ..
.. .. ..
.. .. 26.3
.. ..
.. .. 11.5
11.8 .. 12.0.. .. 231
.. ..
1.1 7.0 26.6
0.2 1.2 2.7
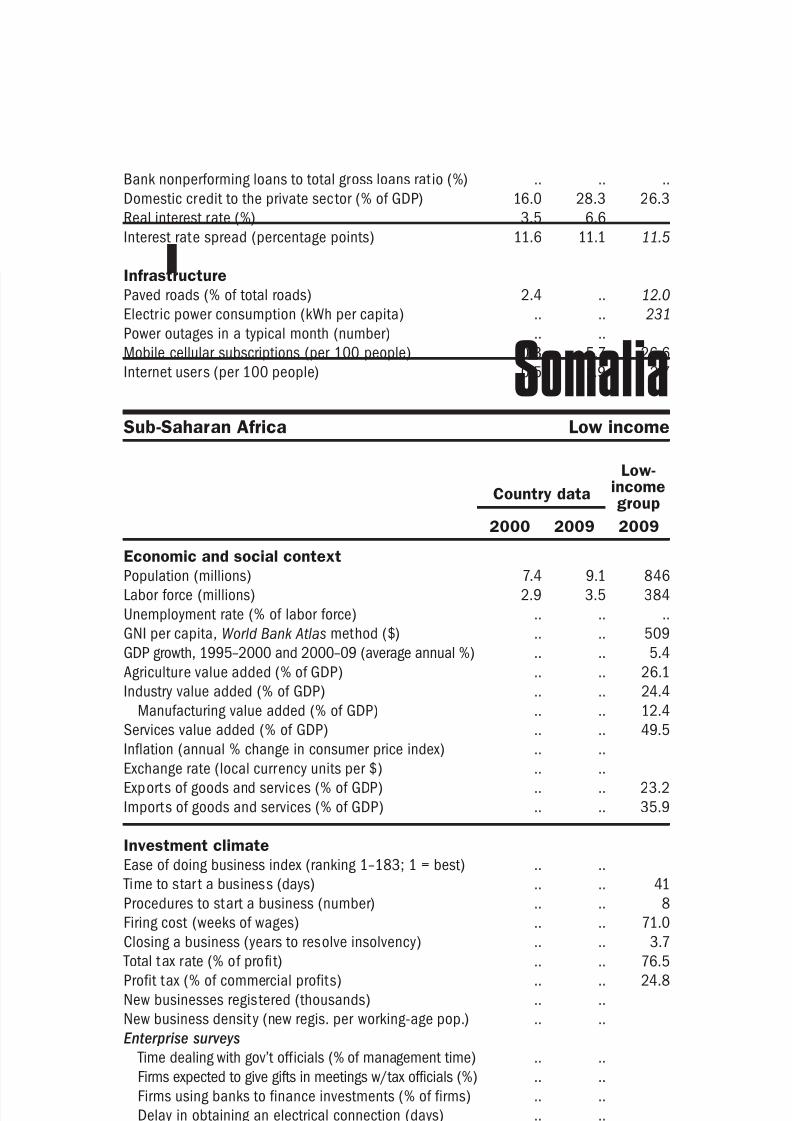
8/6/2019 The Little Data Book on Private Sector Development 2011
http://slidepdf.com/reader/full/the-little-data-book-on-private-sector-development-2011 200/246
Economic and social context
Population (millions)
Labor force (millions)
Unemployment rate (% of labor force)
GNI per capita, World Bank Atlas method ($)GDP growth, 1995–2000 and 2000–09 (average annual %)
Agriculture value added (% of GDP)
Industry value added (% of GDP)
Manufacturing value added (% of GDP)
Services value added (% of GDP)
Inflation (annual % change in consumer price index)
Exchange rate (local currency units per $)
Exports of goods and services (% of GDP)
Imports of goods and services (% of GDP) Investment climate
Ease of doing business index (ranking 1–183; 1 = best)
Time to star t a business (days)
Procedures to start a business (number)
Firing cost (weeks of wages)
Closing a business (years to resolve insolvency)
Total tax rate (% of profit)
Profit tax (% of commercial profits)New businesses registered (thousands)
New business density (new regis. per working-age pop.)
Enterprise surveys
Time dealing with gov’t officials (% of management time)
Firms expected to give gifts in meetings w/tax officials (%)
Firms using banks to finance investments (% of firms)
Delay in obtaining an electrical connection (days)
ISO certif ication ownership (% of firms)
Private sector investment
Invest. in infrastructure w/private participation ($ millions)
Private foreign direct investment, net (% of GDP)
Gross f ixed capital formation (% of GDP)
Gross f ixed private capital formation (% of GDP)
Finance and banking
Government cash surplus or deficit (% of GDP)
Government debt (% of GDP)
Deposit money banks’ assets (% of GDP) Total f inancial system deposits (% of GDP)
Bank capital to asset ratio (%)
Bank nonperforming loans to total gross loans ratio (%)
Domestic credit to the private sector (% of GDP)
Real interest rate (%)
Interest rate spread (percentage points)
Infrastructure
Paved roads (% of total roads)Electr ic power consumption (kWh per capita)
Power outages in a typical month (number)
Mobile cellular subscriptions (per 100 people)
Internet users (per 100 people)
192 2011 The Little Data Book on Private Sector Development
Country data
Uppermiddle-incomegroup
2000 2009 2009
Sub-Saharan Africa Upper middle income
South Africa
44.0 49.3 1,002
15.3 18.8 458
26.7 23.8 9.1
3,050 5,760 7,5022.5 4.1 4.4
3.3 3.0 6.2
31.8 31.1 31.5
19.0 15.1 16.7
64.9 65.8 62.4
5.3 7.1
6.9 8.5
27.9 27.3 25.4
24.9 28.1 24.2
.. 34
.. 22 43
.. 6 8
.. 24.0 40.1
.. 2.0 2.9
.. 30.5 43.0
.. 24.4 18.0.. 24.7
.. 0.8
.. 6.0
.. 3.1
.. 34.8
.. 15.8
.. 26.4
1,891 2,387 64,899
0.7 1.9 2.4
15.1 22.6 20.7
12.4 13.4 15.6
-2.0 -4.9 -0.6
45.3 .. ..
74.9 92.4 60.651.5 63.2 47.4
8.7 6.7 9.7
3.1 5.9 4.2
133.7 147.1 47.8
5.2 4.1
5.3 3.2 5.5
20.3 .. 36.84,417 4,759 3,001
.. 2.1
19.0 94.2 100.6
5.5 9.0 34.6
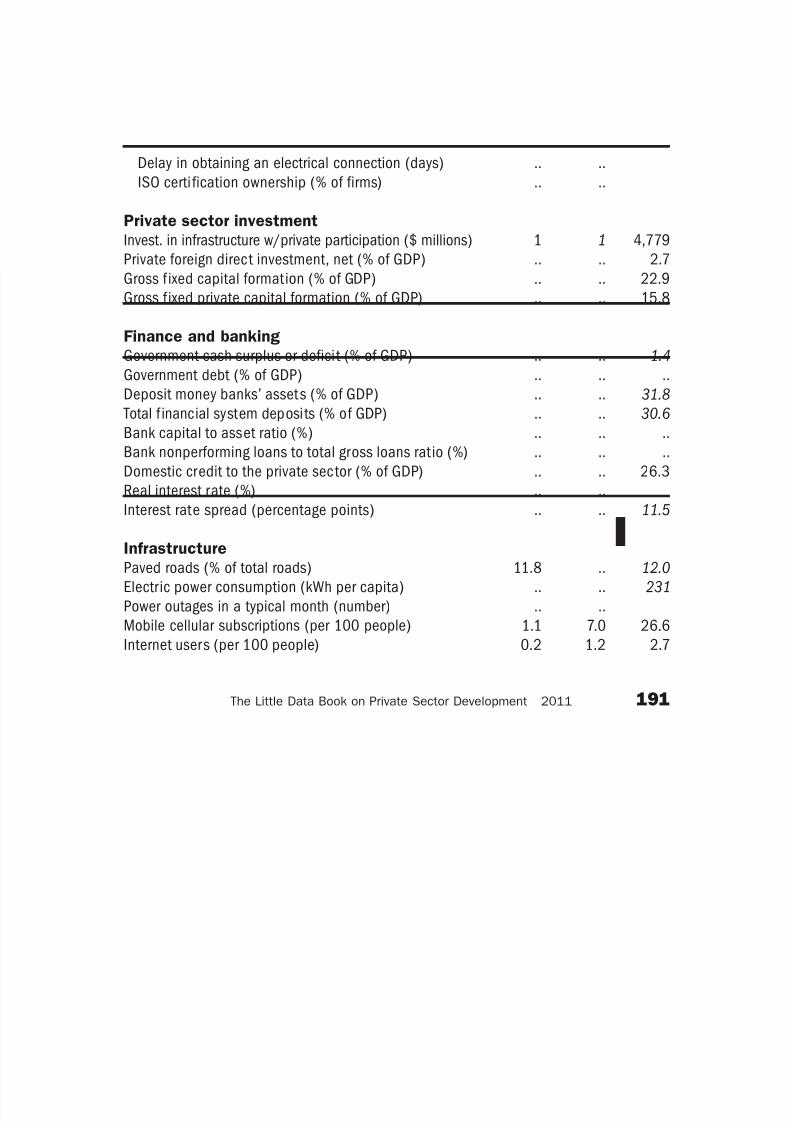
8/6/2019 The Little Data Book on Private Sector Development 2011
http://slidepdf.com/reader/full/the-little-data-book-on-private-sector-development-2011 201/246
Economic and social context
Population (millions)
Labor force (millions)
Unemployment rate (% of labor force)
GNI per capita, World Bank Atlas method ($)GDP growth, 1995–2000 and 2000–09 (average annual %)
Agriculture value added (% of GDP)
Industry value added (% of GDP)
Manufacturing value added (% of GDP)
Services value added (% of GDP)
Inflation (annual % change in consumer price index)
Exchange rate (local currency units per $)
Exports of goods and services (% of GDP)
Imports of goods and services (% of GDP) Investment climate
Ease of doing business index (ranking 1–183; 1 = best)
Time to star t a business (days)
Procedures to start a business (number)
Firing cost (weeks of wages)
Closing a business (years to resolve insolvency)
Total tax rate (% of profit)
Profit tax (% of commercial profits)New businesses registered (thousands)
New business density (new regis. per working-age pop.)
Enterprise surveys
Time dealing with gov’t officials (% of management time)
Firms expected to give gifts in meetings w/tax officials (%)
Firms using banks to finance investments (% of firms)
Delay in obtaining an electrical connection (days)
ISO certi fication ownership (% of firms)
Private sector investment
Invest. in infrastructure w/private participation ($ millions)
Private foreign direct investment, net (% of GDP)
Gross f ixed capital formation (% of GDP)
Gross f ixed private capital formation (% of GDP)
Finance and banking
Government cash surplus or deficit (% of GDP)
Government debt (% of GDP)
Deposit money banks’ assets (% of GDP) Total f inancial system deposits (% of GDP)
Bank capital to asset ratio (%)
Bank nonperforming loans to total gross loans ratio (%)
Domestic credit to the private sector (% of GDP)
Real interest rate (%)
Interest rate spread (percentage points)
Infrastructure
Paved roads (% of total roads)Electr ic power consumption (kWh per capita)
Power outages in a typical month (number)
Mobile cellular subscriptions (per 100 people)
Internet users (per 100 people)
193The Little Data Book on Private Sector Development 2011
High income
Country data
High-incomegroup
2000 2009 2009
Spain
40.3 46.0 1,117
18.0 22.9 547
13.9 18.0 8.1
15,420 32,120 37,9904.2 2.8 2.0
4.4 2.7 1.5
29.2 26.2 25.0
18.6 12.7 15.9
66.4 71.2 73.5
3.4 -0.4
149.4 ..
29.0 23.4 23.6
32.2 25.6 23.9
.. 49
.. 47 18
.. 10 6
.. 56.0 37.9
.. 1.0 2.1
.. 56.5 38.6
.. 20.9 14.3.. 79.8
.. 2.9
.. 0.8
.. 14.3
.. 32.6
.. 9.3
.. 21.3
.. .. ..
6.7 0.4 2.0
25.8 24.1 18.0
.. .. ..
-0.5 -8.6 -7.7
58.9 46.5 55.7
116.5 226.9 140.078.8 156.5 108.5
8.5 6.8 6.8
1.2 5.1 3.4
97.7 211.5 165.1
1.7 ..
2.2 .. 3.8
99.0 99.0 93.45,207 6,315 9,518
.. ..
60.3 111.0 111.2
13.6 61.2 72.3
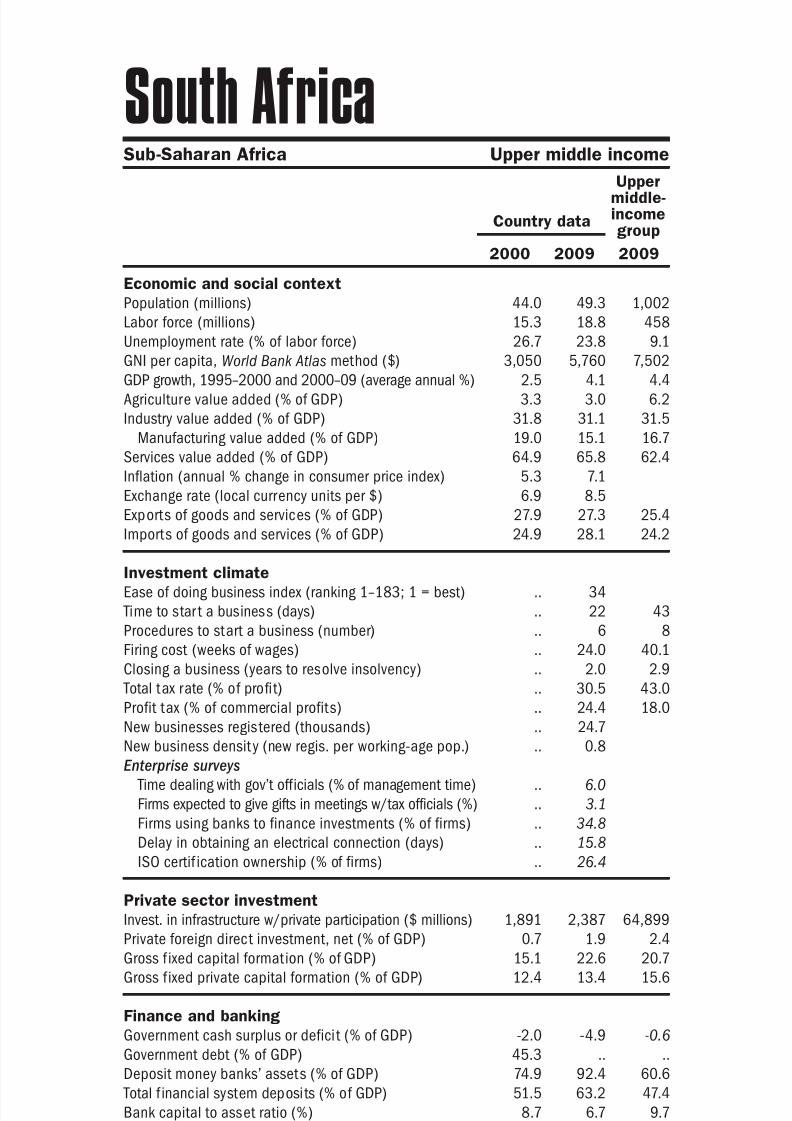
8/6/2019 The Little Data Book on Private Sector Development 2011
http://slidepdf.com/reader/full/the-little-data-book-on-private-sector-development-2011 202/246
Economic and social context
Population (millions)
Labor force (millions)
Unemployment rate (% of labor force)
GNI per capita, World Bank Atlas method ($)GDP growth, 1995–2000 and 2000–09 (average annual %)
Agriculture value added (% of GDP)
Industry value added (% of GDP)
Manufacturing value added (% of GDP)
Services value added (% of GDP)
Inflation (annual % change in consumer price index)
Exchange rate (local currency units per $)
Exports of goods and services (% of GDP)
Imports of goods and services (% of GDP) Investment climate
Ease of doing business index (ranking 1–183; 1 = best)
Time to star t a business (days)
Procedures to start a business (number)
Firing cost (weeks of wages)
Closing a business (years to resolve insolvency)
Total tax rate (% of profit)
Profit tax (% of commercial profits)New businesses registered (thousands)
New business density (new regis. per working-age pop.)
Enterprise surveys
Time dealing with gov’t officials (% of management time)
Firms expected to give gifts in meetings w/tax officials (%)
Firms using banks to finance investments (% of firms)
Delay in obtaining an electrical connection (days)
ISO certif ication ownership (% of firms)
Private sector investment
Invest. in infrastructure w/private participation ($ millions)
Private foreign direct investment, net (% of GDP)
Gross f ixed capital formation (% of GDP)
Gross f ixed private capital formation (% of GDP)
Finance and banking
Government cash surplus or deficit (% of GDP)
Government debt (% of GDP)
Deposit money banks’ assets (% of GDP) Total f inancial system deposits (% of GDP)
Bank capital to asset ratio (%)
Bank nonperforming loans to total gross loans ratio (%)
Domestic credit to the private sector (% of GDP)
Real interest rate (%)
Interest rate spread (percentage points)
Infrastructure
Paved roads (% of total roads)Electr ic power consumption (kWh per capita)
Power outages in a typical month (number)
Mobile cellular subscriptions (per 100 people)
Internet users (per 100 people)
194 2011 The Little Data Book on Private Sector Development
Country data
Lowermiddle-incomegroup
2000 2009 2009
South Asia Lower middle income
Sri Lanka
18.7 20.3 3,811
7.8 8.3 1,787
7.7 7.6 5.3
880 1,990 2,3215.1 5.5 8.5
19.9 12.6 13.3
27.3 29.7 38.9
16.8 18.1 25.8
52.8 57.7 47.7
6.2 3.5
77.0 114.9
39.0 21.4 28.9
49.6 27.9 28.3
.. 102
.. 35 35
.. 4 8
.. 217.0 57.7
.. 1.7 3.3
.. 64.7 40.2
.. 27.4 16.3.. 4.2
.. 0.3
.. 3.5
.. 2.7
.. 26.2
.. 83.4
.. ..
160 421 41,477
1.1 1.0 2.0
28.0 23.8 34.9
24.8 17.4 19.9
-8.4 -6.6 -2.3
96.9 85.0 ..
34.3 36.2 107.633.5 33.7 54.9
4.4 .. 10.0
15.3 .. 5.1
28.8 24.8 92.9
8.3 9.5
7.0 5.1 7.3
85.8 81.0 36.3296 409 1,318
.. ..
2.3 69.4 57.8
0.6 8.7 17.2
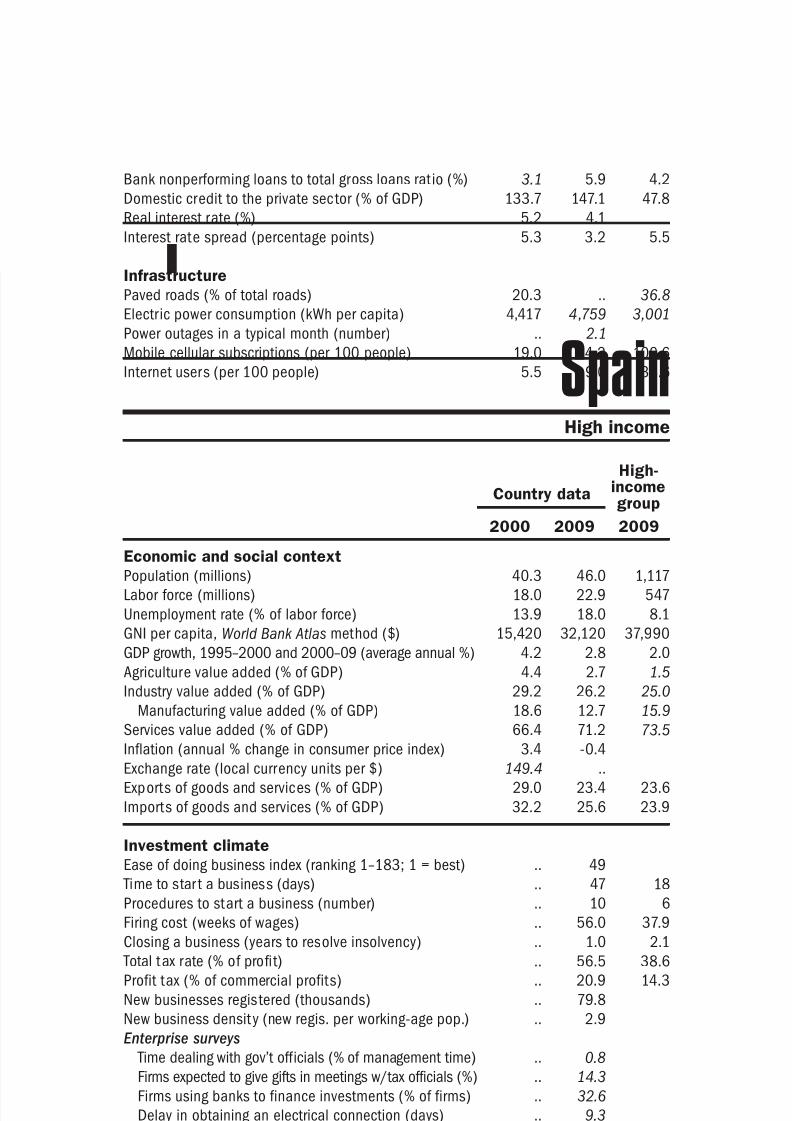
8/6/2019 The Little Data Book on Private Sector Development 2011
http://slidepdf.com/reader/full/the-little-data-book-on-private-sector-development-2011 203/246
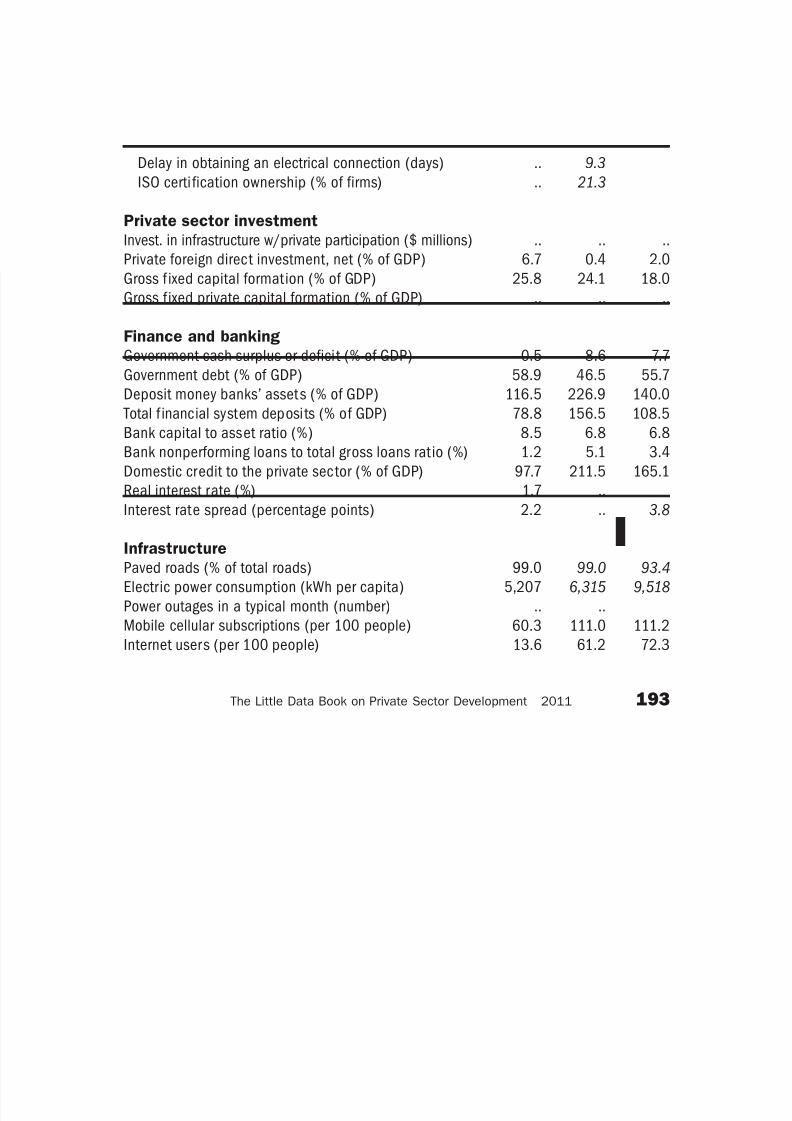
8/6/2019 The Little Data Book on Private Sector Development 2011
http://slidepdf.com/reader/full/the-little-data-book-on-private-sector-development-2011 204/246
Economic and social context
Population (millions)
Labor force (millions)
Unemployment rate (% of labor force)
GNI per capita, World Bank Atlas method ($)GDP growth, 1995–2000 and 2000–09 (average annual %)
Agriculture value added (% of GDP)
Industry value added (% of GDP)
Manufacturing value added (% of GDP)
Services value added (% of GDP)
Inflation (annual % change in consumer price index)
Exchange rate (local currency units per $)
Exports of goods and services (% of GDP)
Imports of goods and services (% of GDP) Investment climate
Ease of doing business index (ranking 1–183; 1 = best)
Time to star t a business (days)
Procedures to start a business (number)
Firing cost (weeks of wages)
Closing a business (years to resolve insolvency)
Total tax rate (% of profit)
Profit tax (% of commercial profits)New businesses registered (thousands)
New business density (new regis. per working-age pop.)
Enterprise surveys
Time dealing with gov’t officials (% of management time)
Firms expected to give gifts in meetings w/tax officials (%)
Firms using banks to finance investments (% of firms)
Delay in obtaining an electrical connection (days)
ISO certif ication ownership (% of firms)
Private sector investment
Invest. in infrastructure w/private participation ($ millions)
Private foreign direct investment, net (% of GDP)
Gross f ixed capital formation (% of GDP)
Gross f ixed private capital formation (% of GDP)
Finance and banking
Government cash surplus or deficit (% of GDP)
Government debt (% of GDP)
Deposit money banks’ assets (% of GDP) Total f inancial system deposits (% of GDP)
Bank capital to asset ratio (%)
Bank nonperforming loans to total gross loans ratio (%)
Domestic credit to the private sector (% of GDP)
Real interest rate (%)
Interest rate spread (percentage points)
Infrastructure
Paved roads (% of total roads)Electr ic power consumption (kWh per capita)
Power outages in a typical month (number)
Mobile cellular subscriptions (per 100 people)
Internet users (per 100 people)
196 2011 The Little Data Book on Private Sector Development
Country data
Uppermiddle-incomegroup
2000 2009 2009
Latin America & Caribbean Upper middle income
St. Lucia
0.16 0.17 1,002
0.06 0.08 458
16.5 21.0 9.1
4,130 5,190 7,5023.0 2.7 4.4
7.1 4.9 6.2
19.0 18.2 31.5
5.1 6.4 16.7
74.0 76.9 62.4
3.7 1.0
2.7 2.7
53.3 49.0 25.4
63.0 69.3 24.2
.. 53
.. 14 43
.. 5 8
.. 56.0 40.1
.. 2.0 2.9
.. 34.0 43.0
.. 25.4 18.0.. ..
.. ..
.. ..
.. ..
.. ..
.. ..
.. ..
15 11 64,899
7.6 16.5 2.4
25.7 23.7 20.7
16.5 18.3 15.6
.. .. -0.6
.. .. ..
87.9 143.7 60.673.5 107.0 47.4
.. .. 9.7
.. .. 4.2
77.6 138.6 47.8
10.7 10.9
8.3 7.3 5.5
.. .. 36.8
.. .. 3,001
.. ..
1.6 102.3 100.6
5.1 83.0 34.6
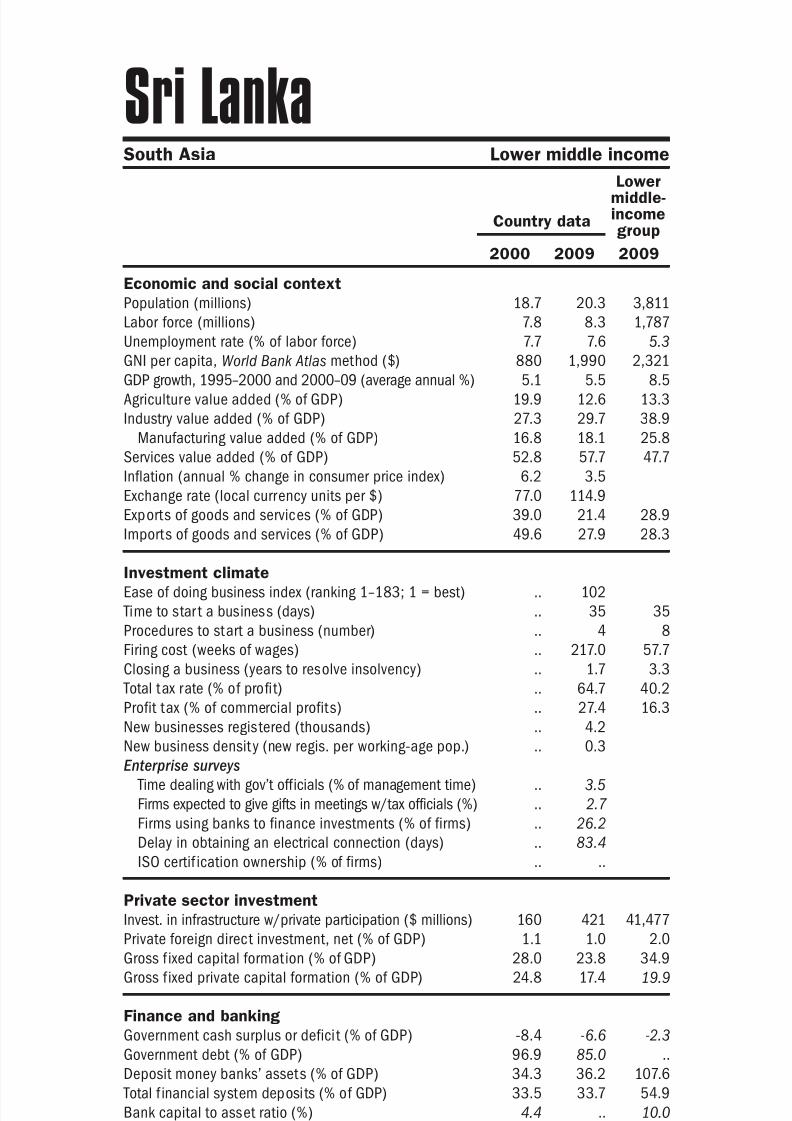
8/6/2019 The Little Data Book on Private Sector Development 2011
http://slidepdf.com/reader/full/the-little-data-book-on-private-sector-development-2011 205/246
Economic and social context
Population (millions)
Labor force (millions)
Unemployment rate (% of labor force)
GNI per capita, World Bank Atlas method ($)GDP growth, 1995–2000 and 2000–09 (average annual %)
Agriculture value added (% of GDP)
Industry value added (% of GDP)
Manufacturing value added (% of GDP)
Services value added (% of GDP)
Inflation (annual % change in consumer price index)
Exchange rate (local currency units per $)
Exports of goods and services (% of GDP)
Imports of goods and services (% of GDP) Investment climate
Ease of doing business index (ranking 1–183; 1 = best)
Time to star t a business (days)
Procedures to start a business (number)
Firing cost (weeks of wages)
Closing a business (years to resolve insolvency)
Total tax rate (% of profit)
Profit tax (% of commercial profits)New businesses registered (thousands)
New business density (new regis. per working-age pop.)
Enterprise surveys
Time dealing with gov’t officials (% of management time)
Firms expected to give gifts in meetings w/tax officials (%)
Firms using banks to finance investments (% of firms)
Delay in obtaining an electrical connection (days)
ISO certi fication ownership (% of firms)
Private sector investment
Invest. in infrastructure w/private participation ($ millions)
Private foreign direct investment, net (% of GDP)
Gross f ixed capital formation (% of GDP)
Gross f ixed private capital formation (% of GDP)
Finance and banking
Government cash surplus or deficit (% of GDP)
Government debt (% of GDP)
Deposit money banks’ assets (% of GDP) Total f inancial system deposits (% of GDP)
Bank capital to asset ratio (%)
Bank nonperforming loans to total gross loans ratio (%)
Domestic credit to the private sector (% of GDP)
Real interest rate (%)
Interest rate spread (percentage points)
Infrastructure
Paved roads (% of total roads)Electr ic power consumption (kWh per capita)
Power outages in a typical month (number)
Mobile cellular subscriptions (per 100 people)
Internet users (per 100 people)
197The Little Data Book on Private Sector Development 2011
Latin America & Caribbean Upper middle income
Country data
Uppermiddle-incomegroup
2000 2009 2009
St. Vincent & Grenadines
0.11 0.11 1,002
0.05 0.05 458
.. .. 9.1
2,920 5,130 7,5025.7 4.5 4.4
10.8 7.5 6.2
24.0 24.5 31.5
6.0 4.1 16.7
65.2 68.0 62.4
1.4 -1.6
2.7 2.7
52.9 33.8 25.4
59.1 71.7 24.2
.. 75
.. 10 43
.. 7 8
.. 54.0 40.1
.. .. 2.9
.. 38.7 43.0
.. 30.2 18.0.. ..
.. ..
.. ..
.. ..
.. ..
.. ..
.. ..
.. 35 64,899
11.1 18.9 2.4
27.0 34.8 20.7
20.0 .. 15.6
.. .. -0.6
.. .. ..
79.7 73.5 60.687.2 71.9 47.4
.. .. 9.7
.. .. 4.2
64.7 59.5 47.8
11.1 6.0
6.9 6.2 5.5
68.0 70.0 36.8.. .. 3,001
.. ..
2.2 110.9 100.6
3.2 69.6 34.6
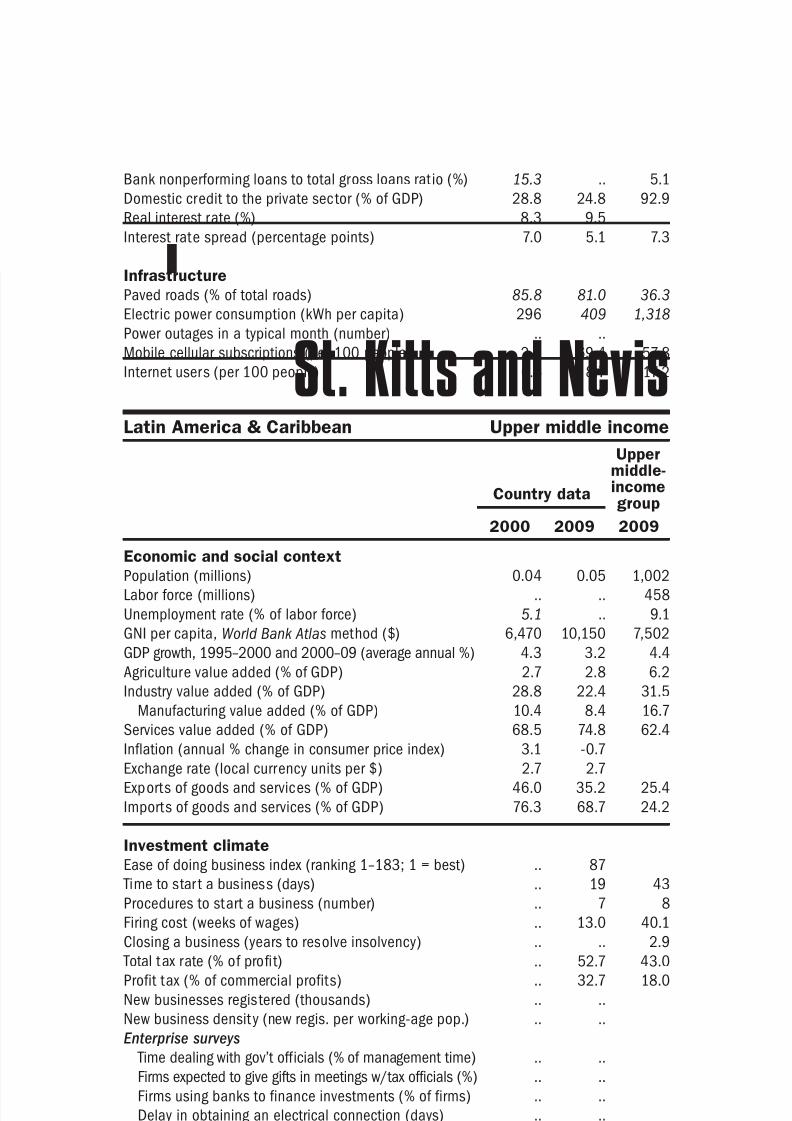
8/6/2019 The Little Data Book on Private Sector Development 2011
http://slidepdf.com/reader/full/the-little-data-book-on-private-sector-development-2011 206/246
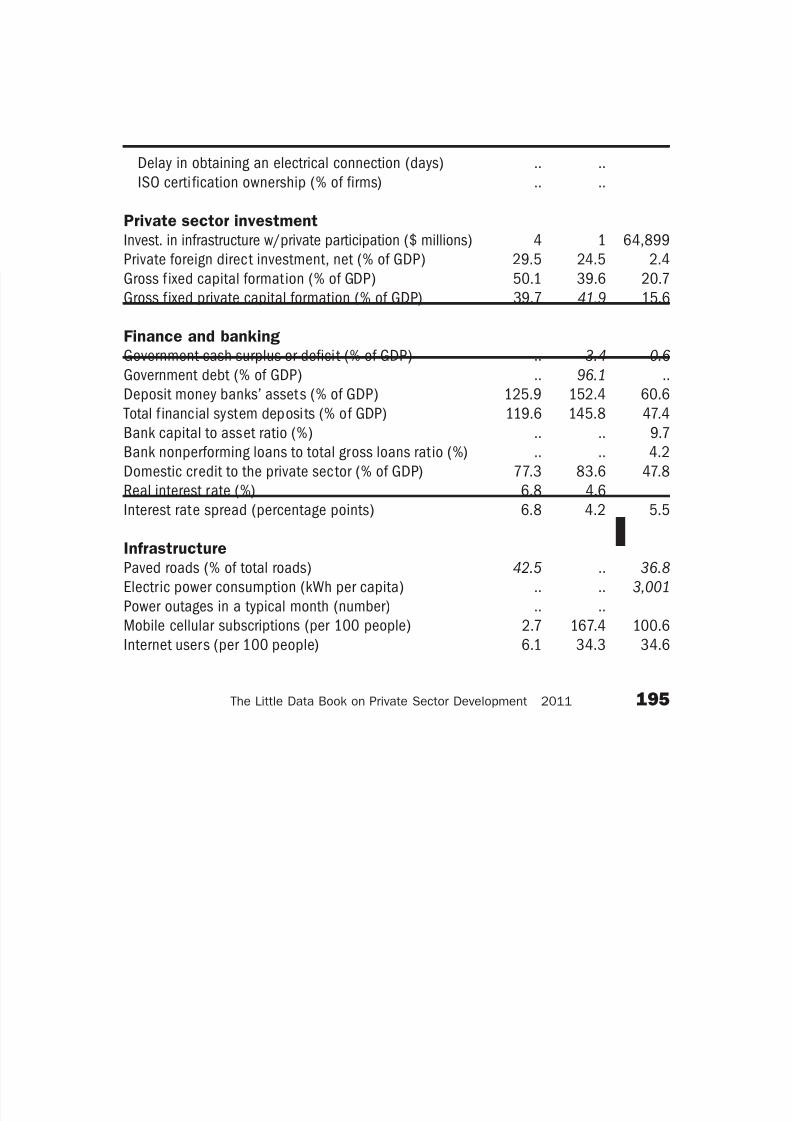
8/6/2019 The Little Data Book on Private Sector Development 2011
http://slidepdf.com/reader/full/the-little-data-book-on-private-sector-development-2011 207/246
Economic and social context
Population (millions)
Labor force (millions)
Unemployment rate (% of labor force)
GNI per capita, World Bank Atlas method ($)GDP growth, 1995–2000 and 2000–09 (average annual %)
Agriculture value added (% of GDP)
Industry value added (% of GDP)
Manufacturing value added (% of GDP)
Services value added (% of GDP)
Inflation (annual % change in consumer price index)
Exchange rate (local currency units per $)
Exports of goods and services (% of GDP)
Imports of goods and services (% of GDP) Investment climate
Ease of doing business index (ranking 1–183; 1 = best)
Time to star t a business (days)
Procedures to start a business (number)
Firing cost (weeks of wages)
Closing a business (years to resolve insolvency)
Total tax rate (% of profit)
Profit tax (% of commercial profits)New businesses registered (thousands)
New business density (new regis. per working-age pop.)
Enterprise surveys
Time dealing with gov’t officials (% of management time)
Firms expected to give gifts in meetings w/tax officials (%)
Firms using banks to finance investments (% of firms)
Delay in obtaining an electrical connection (days)
ISO certi fication ownership (% of firms)
Private sector investment
Invest. in infrastructure w/private participation ($ millions)
Private foreign direct investment, net (% of GDP)
Gross f ixed capital formation (% of GDP)
Gross f ixed private capital formation (% of GDP)
Finance and banking
Government cash surplus or deficit (% of GDP)
Government debt (% of GDP)
Deposit money banks’ assets (% of GDP) Total f inancial system deposits (% of GDP)
Bank capital to asset ratio (%)
Bank nonperforming loans to total gross loans ratio (%)
Domestic credit to the private sector (% of GDP)
Real interest rate (%)
Interest rate spread (percentage points)
Infrastructure
Paved roads (% of total roads)Electr ic power consumption (kWh per capita)
Power outages in a typical month (number)
Mobile cellular subscriptions (per 100 people)
Internet users (per 100 people)
199The Little Data Book on Private Sector Development 2011
Latin America & Caribbean Upper middle income
Country data
Uppermiddle-incomegroup
2000 2009 2009
Suriname
0.47 0.52 1,002
0.16 0.19 458
13.8 9.5 9.1
1,930 4,760 7,5021.7 5.4 4.4
11.2 4.7 6.2
25.2 40.2 31.5
9.0 20.7 16.7
63.7 55.1 62.4
59.4 -0.1
1.3 2.7
19.7 30.7 25.4
33.2 45.6 24.2
.. 161
.. 694 43
.. 13 8
.. 26.0 40.1
.. 5.0 2.9
.. 27.9 43.0
.. 27.9 18.0.. 0.1
.. 0.4
.. ..
.. ..
.. ..
.. ..
.. ..
.. 60 64,899
-16.6 -7.7 2.4
12.4 25.1 20.7
9.8 19.8 15.6
.. .. -0.6
.. .. ..
12.6 29.6 60.621.7 47.7 47.4
.. .. 9.7
.. .. 4.2
8.4 27.8 47.8
-16.7 -5.7
13.5 5.3 5.5
26.0 26.3 36.8.. .. 3,001
.. ..
8.8 147.0 100.6
2.5 31.4 34.6
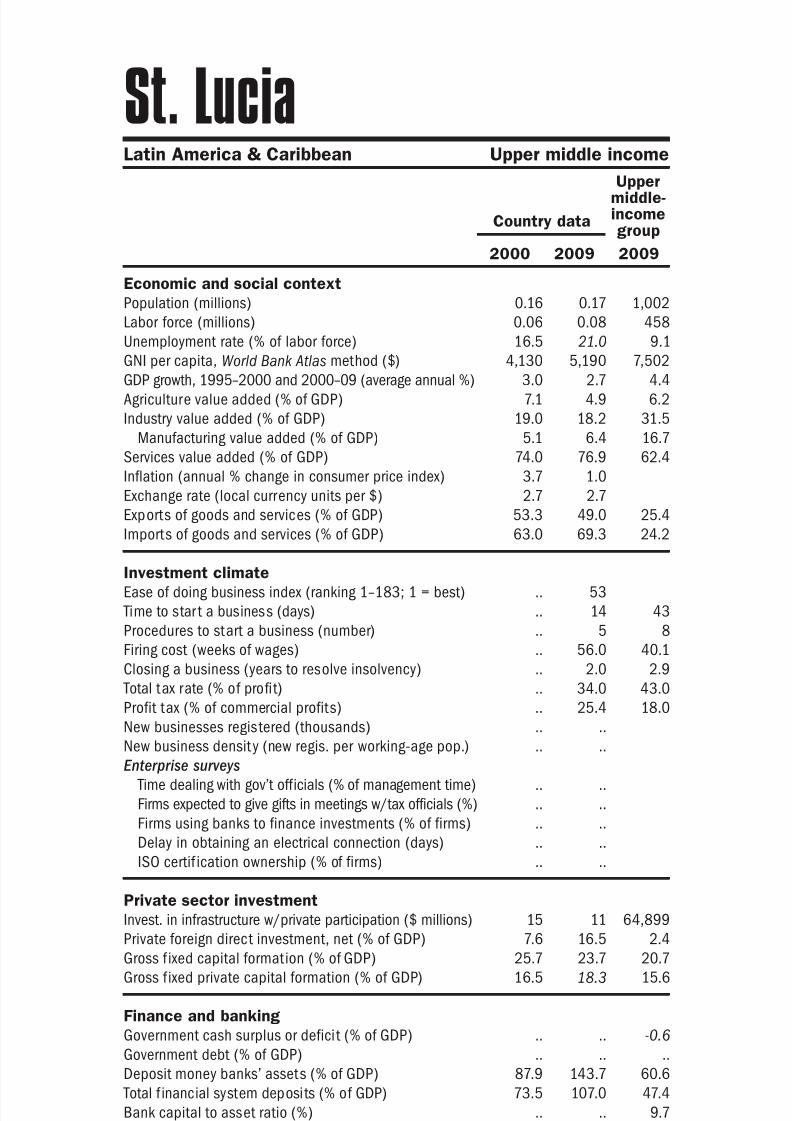
8/6/2019 The Little Data Book on Private Sector Development 2011
http://slidepdf.com/reader/full/the-little-data-book-on-private-sector-development-2011 208/246
Economic and social context
Population (millions)
Labor force (millions)
Unemployment rate (% of labor force)
GNI per capita, World Bank Atlas method ($)GDP growth, 1995–2000 and 2000–09 (average annual %)
Agriculture value added (% of GDP)
Industry value added (% of GDP)
Manufacturing value added (% of GDP)
Services value added (% of GDP)
Inflation (annual % change in consumer price index)
Exchange rate (local currency units per $)
Exports of goods and services (% of GDP)
Imports of goods and services (% of GDP) Investment climate
Ease of doing business index (ranking 1–183; 1 = best)
Time to star t a business (days)
Procedures to start a business (number)
Firing cost (weeks of wages)
Closing a business (years to resolve insolvency)
Total tax rate (% of profit)
Profit tax (% of commercial profits)New businesses registered (thousands)
New business density (new regis. per working-age pop.)
Enterprise surveys
Time dealing with gov’t officials (% of management time)
Firms expected to give gifts in meetings w/tax officials (%)
Firms using banks to finance investments (% of firms)
Delay in obtaining an electrical connection (days)
ISO certif ication ownership (% of firms)
Private sector investment
Invest. in infrastructure w/private participation ($ millions)
Private foreign direct investment, net (% of GDP)
Gross f ixed capital formation (% of GDP)
Gross f ixed private capital formation (% of GDP)
Finance and banking
Government cash surplus or deficit (% of GDP)
Government debt (% of GDP)
Deposit money banks’ assets (% of GDP) Total f inancial system deposits (% of GDP)
Bank capital to asset ratio (%)
Bank nonperforming loans to total gross loans ratio (%)
Domestic credit to the private sector (% of GDP)
Real interest rate (%)
Interest rate spread (percentage points)
Infrastructure
Paved roads (% of total roads)Electr ic power consumption (kWh per capita)
Power outages in a typical month (number)
Mobile cellular subscriptions (per 100 people)
Internet users (per 100 people)
200 2011 The Little Data Book on Private Sector Development
Country data
Lowermiddle-incomegroup
2000 2009 2009
Sub-Saharan Africa Lower middle income
Swaziland
1.1 1.2 3,811
0.37 0.46 1,787
22.5 .. 5.3
1,550 2,470 2,3214.3 2.6 8.5
12.5 7.3 13.3
45.0 49.4 38.9
39.5 44.4 25.8
42.6 43.3 47.7
12.2 7.3
6.9 8.5
76.1 59.8 28.9
90.1 76.5 28.3
.. 118
.. 56 35
.. 12 8
.. 53.0 57.7
.. 2.0 3.3
.. 36.8 40.2
.. 28.1 16.3.. ..
.. ..
.. 4.4
.. 3.3
.. 7.7
.. 16.9
.. 22.1
5 25 41,477
6.1 2.2 2.0
17.4 16.9 34.9
11.5 3.0 19.9
-0.8 -2.9 -2.3
26.8 .. ..
13.0 23.8 107.617.7 27.6 54.9
.. 16.9 10.0
.. 8.1 5.1
12.8 25.0 92.9
13.8 5.6
7.5 6.0 7.3
30.0 .. 36.3.. .. 1,318
.. 2.5
3.1 55.4 57.8
0.9 7.6 17.2

8/6/2019 The Little Data Book on Private Sector Development 2011
http://slidepdf.com/reader/full/the-little-data-book-on-private-sector-development-2011 209/246
Economic and social context
Population (millions)
Labor force (millions)
Unemployment rate (% of labor force)
GNI per capita, World Bank Atlas method ($)GDP growth, 1995–2000 and 2000–09 (average annual %)
Agriculture value added (% of GDP)
Industry value added (% of GDP)
Manufacturing value added (% of GDP)
Services value added (% of GDP)
Inflation (annual % change in consumer price index)
Exchange rate (local currency units per $)
Exports of goods and services (% of GDP)
Imports of goods and services (% of GDP) Investment climate
Ease of doing business index (ranking 1–183; 1 = best)
Time to star t a business (days)
Procedures to start a business (number)
Firing cost (weeks of wages)
Closing a business (years to resolve insolvency)
Total tax rate (% of profit)
Profit tax (% of commercial profits)New businesses registered (thousands)
New business density (new regis. per working-age pop.)
Enterprise surveys
Time dealing with gov’t officials (% of management time)
Firms expected to give gifts in meetings w/tax officials (%)
Firms using banks to finance investments (% of firms)
Delay in obtaining an electrical connection (days)
ISO certi fication ownership (% of firms)
Private sector investment
Invest. in infrastructure w/private participation ($ millions)
Private foreign direct investment, net (% of GDP)
Gross f ixed capital formation (% of GDP)
Gross f ixed private capital formation (% of GDP)
Finance and banking
Government cash surplus or deficit (% of GDP)
Government debt (% of GDP)
Deposit money banks’ assets (% of GDP) Total f inancial system deposits (% of GDP)
Bank capital to asset ratio (%)
Bank nonperforming loans to total gross loans ratio (%)
Domestic credit to the private sector (% of GDP)
Real interest rate (%)
Interest rate spread (percentage points)
Infrastructure
Paved roads (% of total roads)Electr ic power consumption (kWh per capita)
Power outages in a typical month (number)
Mobile cellular subscriptions (per 100 people)
Internet users (per 100 people)
201The Little Data Book on Private Sector Development 2011
High income
Country data
High-incomegroup
2000 2009 2009
Sweden
8.9 9.3 1,117
4.5 5.0 547
5.8 8.3 8.1
29,500 48,840 37,9903.6 2.4 2.0
2.1 1.7 1.5
28.8 25.1 25.0
22.0 16.1 15.9
69.1 73.1 73.5
1.0 -0.3
9.2 7.7
46.5 48.5 23.6
40.2 41.6 23.9
.. 14
.. 15 18
.. 3 6
.. 26.0 37.9
.. 2.0 2.1
.. 54.6 38.6
.. 16.4 14.3.. 24.2
.. 4.1
.. ..
.. ..
.. ..
.. ..
.. ..
.. .. ..
8.9 2.8 2.0
18.0 17.9 18.0
.. .. ..
.. .. -7.7
68.2 44.0 55.7
49.2 147.9 140.041.6 58.3 108.5
6.5 5.0 6.8
1.6 2.0 3.4
42.3 139.3 165.1
4.3 2.4
3.7 2.5 3.8
.. 23.6 93.415,687 14,869 9,518
.. ..
71.8 122.8 111.2
45.6 90.3 72.3
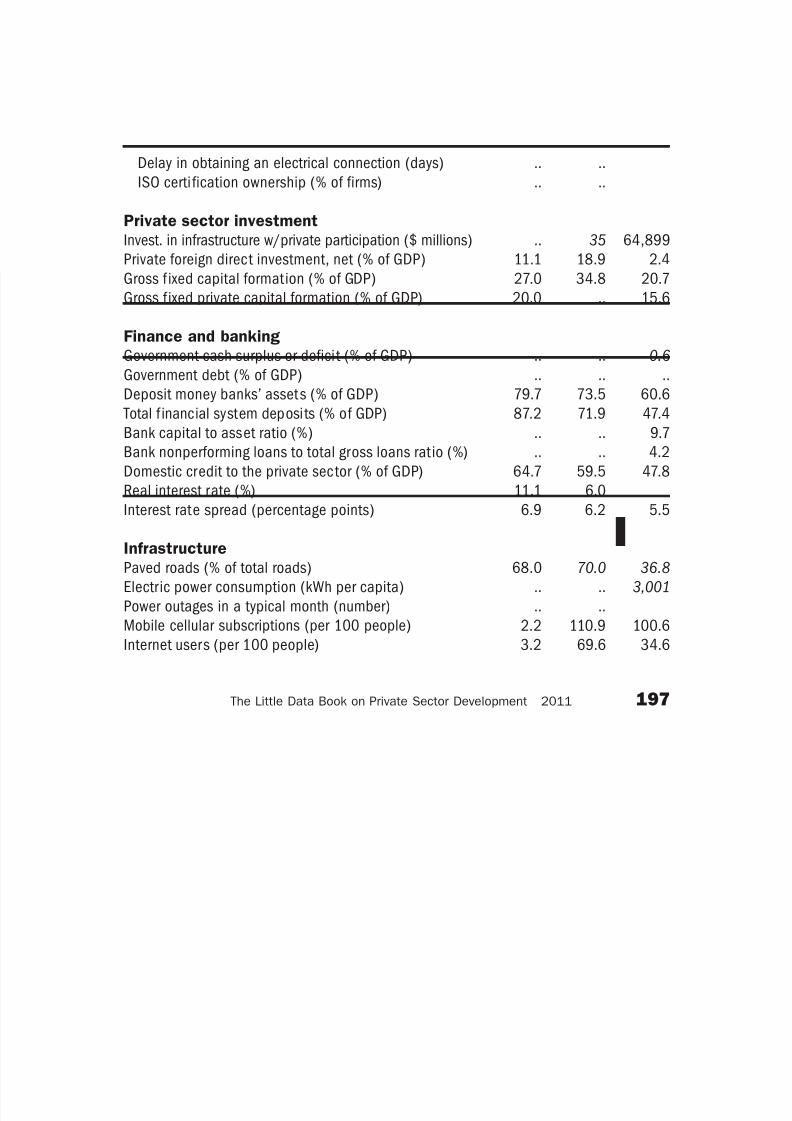
8/6/2019 The Little Data Book on Private Sector Development 2011
http://slidepdf.com/reader/full/the-little-data-book-on-private-sector-development-2011 210/246
Economic and social context
Population (millions)
Labor force (millions)
Unemployment rate (% of labor force)
GNI per capita, World Bank Atlas method ($)GDP growth, 1995–2000 and 2000–09 (average annual %)
Agriculture value added (% of GDP)
Industry value added (% of GDP)
Manufacturing value added (% of GDP)
Services value added (% of GDP)
Inflation (annual % change in consumer price index)
Exchange rate (local currency units per $)
Exports of goods and services (% of GDP)
Imports of goods and services (% of GDP) Investment climate
Ease of doing business index (ranking 1–183; 1 = best)
Time to star t a business (days)
Procedures to start a business (number)
Firing cost (weeks of wages)
Closing a business (years to resolve insolvency)
Total tax rate (% of profit)
Profit tax (% of commercial profits)New businesses registered (thousands)
New business density (new regis. per working-age pop.)
Enterprise surveys
Time dealing with gov’t officials (% of management time)
Firms expected to give gifts in meetings w/tax officials (%)
Firms using banks to finance investments (% of firms)
Delay in obtaining an electrical connection (days)
ISO certif ication ownership (% of firms)
Private sector investment
Invest. in infrastructure w/private participation ($ millions)
Private foreign direct investment, net (% of GDP)
Gross f ixed capital formation (% of GDP)
Gross f ixed private capital formation (% of GDP)
Finance and banking
Government cash surplus or deficit (% of GDP)
Government debt (% of GDP)
Deposit money banks’ assets (% of GDP) Total f inancial system deposits (% of GDP)
Bank capital to asset ratio (%)
Bank nonperforming loans to total gross loans ratio (%)
Domestic credit to the private sector (% of GDP)
Real interest rate (%)
Interest rate spread (percentage points)
Infrastructure
Paved roads (% of total roads)Electr ic power consumption (kWh per capita)
Power outages in a typical month (number)
Mobile cellular subscriptions (per 100 people)
Internet users (per 100 people)
202 2011 The Little Data Book on Private Sector Development
Country data
High-incomegroup
2000 2009 2009
High income
Switzerland
7.2 7.7 1,117
4.0 4.4 547
2.7 4.1 8.1
40,280 65,430 37,9902.1 1.9 2.0
1.6 1.2 1.5
27.3 26.8 25.0
19.0 19.0 15.9
71.1 72.0 73.5
1.5 -0.5
1.7 1.1
46.5 51.7 23.6
40.7 40.7 23.9
.. 27
.. 20 18
.. 6 6
.. 13.0 37.9
.. 3.0 2.1
.. 30.1 38.6
.. 8.9 14.3.. 25.3
.. 4.9
.. ..
.. ..
.. ..
.. ..
.. ..
.. .. ..
7.9 5.6 2.0
22.7 20.2 18.0
.. .. ..
2.2 1.3 -7.7
25.6 28.9 55.7
172.5 188.8 140.0116.6 145.7 108.5
6.0 5.5 6.8
4.1 0.4 3.4
158.5 174.8 165.1
3.1 2.5
1.3 2.7 3.8
.. 100.0 93.47,847 8,307 9,518
.. ..
64.6 119.7 111.2
47.9 70.9 72.3
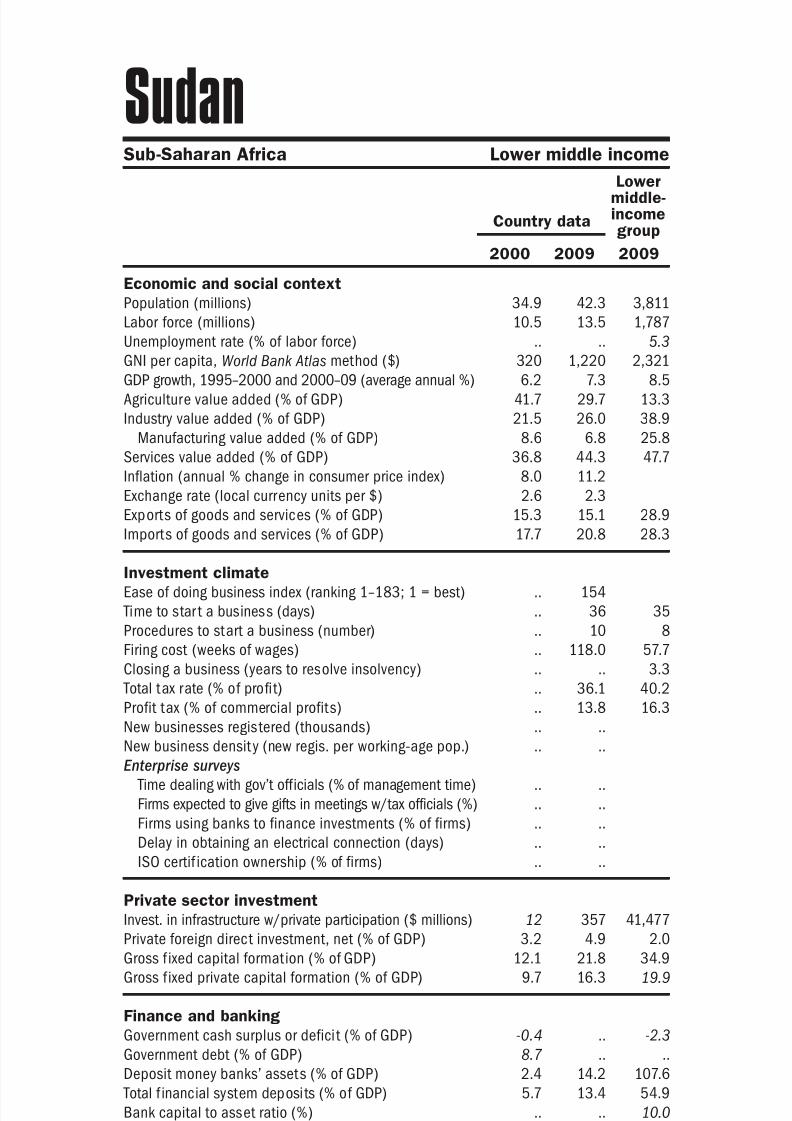
8/6/2019 The Little Data Book on Private Sector Development 2011
http://slidepdf.com/reader/full/the-little-data-book-on-private-sector-development-2011 211/246
Economic and social context
Population (millions)
Labor force (millions)
Unemployment rate (% of labor force)
GNI per capita, World Bank Atlas method ($)GDP growth, 1995–2000 and 2000–09 (average annual %)
Agriculture value added (% of GDP)
Industry value added (% of GDP)
Manufacturing value added (% of GDP)
Services value added (% of GDP)
Inflation (annual % change in consumer price index)
Exchange rate (local currency units per $)
Exports of goods and services (% of GDP)
Imports of goods and services (% of GDP) Investment climate
Ease of doing business index (ranking 1–183; 1 = best)
Time to star t a business (days)
Procedures to start a business (number)
Firing cost (weeks of wages)
Closing a business (years to resolve insolvency)
Total tax rate (% of profit)
Profit tax (% of commercial profits)New businesses registered (thousands)
New business density (new regis. per working-age pop.)
Enterprise surveys
Time dealing with gov’t officials (% of management time)
Firms expected to give gifts in meetings w/tax officials (%)
Firms using banks to finance investments (% of firms)
Delay in obtaining an electrical connection (days)
ISO certi fication ownership (% of firms)
Private sector investment
Invest. in infrastructure w/private participation ($ millions)
Private foreign direct investment, net (% of GDP)
Gross f ixed capital formation (% of GDP)
Gross f ixed private capital formation (% of GDP)
Finance and banking
Government cash surplus or deficit (% of GDP)
Government debt (% of GDP)
Deposit money banks’ assets (% of GDP) Total f inancial system deposits (% of GDP)
Bank capital to asset ratio (%)
Bank nonperforming loans to total gross loans ratio (%)
Domestic credit to the private sector (% of GDP)
Real interest rate (%)
Interest rate spread (percentage points)
Infrastructure
Paved roads (% of total roads)Electr ic power consumption (kWh per capita)
Power outages in a typical month (number)
Mobile cellular subscriptions (per 100 people)
Internet users (per 100 people)
203The Little Data Book on Private Sector Development 2011
Middle East & North Africa Lower middle income
Country data
Lowermiddle-incomegroup
2000 2009 2009
Syrian Arab Republic
16.5 21.1 3,811
4.9 6.9 1,787
2.3 8.4 5.3
960 2,410 2,3212.2 4.4 8.5
23.8 21.0 13.3
37.9 33.7 38.9
6.5 13.4 25.8
38.3 45.3 47.7
-3.8 2.9
11.2 11.2
35.4 33.9 28.9
28.6 35.7 28.3
.. 144
.. 13 35
.. 7 8
.. 80.0 57.7
.. 4.1 3.3
.. 42.9 40.2
.. 23.2 16.3.. ..
.. ..
.. 12.2
.. 61.0
.. 20.7
.. 118.4
.. 7.4
161 153 41,477
1.4 2.7 2.0
17.3 19.5 34.9
6.3 10.4 19.9
.. .. -2.3
.. .. ..
36.9 42.8 107.638.3 51.4 54.9
.. .. 10.0
.. .. 5.1
8.3 20.3 92.9
-0.6 19.0
5.0 3.7 7.3
.. 91.0 36.31,058 1,521 1,318
.. 16.1
0.2 46.0 57.8
0.2 18.7 17.2
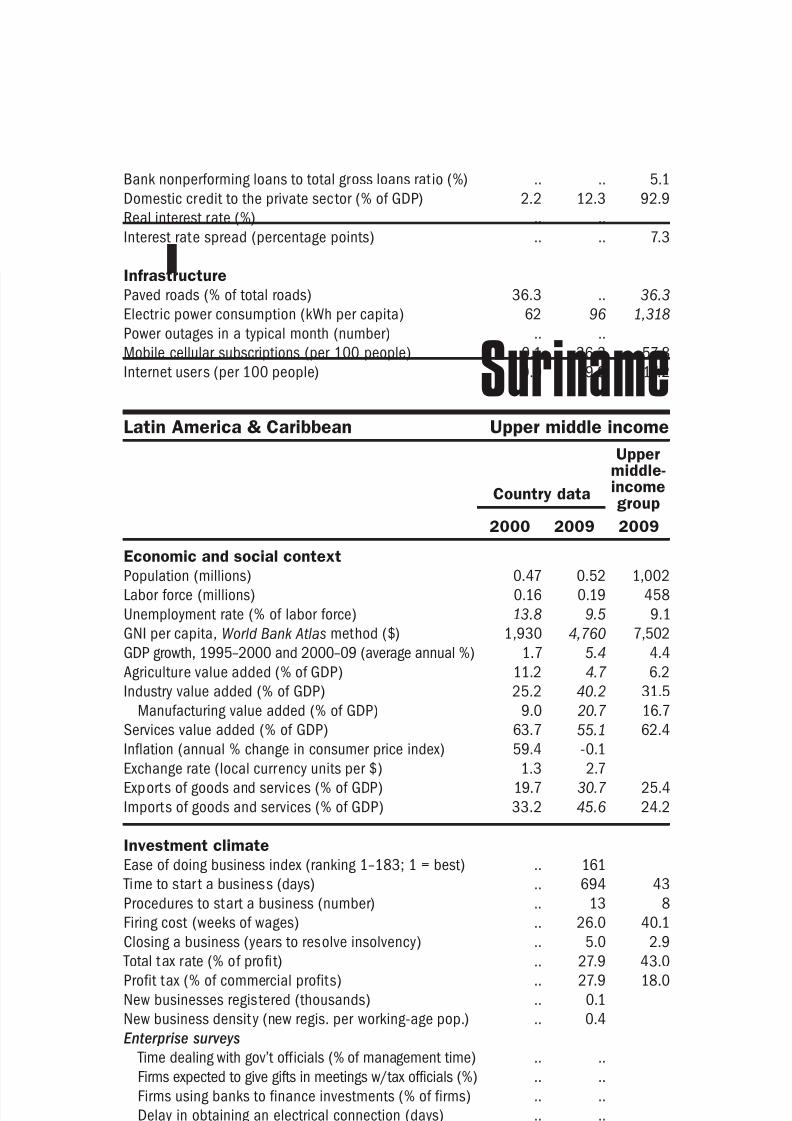
8/6/2019 The Little Data Book on Private Sector Development 2011
http://slidepdf.com/reader/full/the-little-data-book-on-private-sector-development-2011 212/246
Economic and social context
Population (millions)
Labor force (millions)
Unemployment rate (% of labor force)
GNI per capita, World Bank Atlas method ($)GDP growth, 1995–2000 and 2000–09 (average annual %)
Agriculture value added (% of GDP)
Industry value added (% of GDP)
Manufacturing value added (% of GDP)
Services value added (% of GDP)
Inflation (annual % change in consumer price index)
Exchange rate (local currency units per $)
Exports of goods and services (% of GDP)
Imports of goods and services (% of GDP) Investment climate
Ease of doing business index (ranking 1–183; 1 = best)
Time to star t a business (days)
Procedures to start a business (number)
Firing cost (weeks of wages)
Closing a business (years to resolve insolvency)
Total tax rate (% of profit)
Profit tax (% of commercial profits)New businesses registered (thousands)
New business density (new regis. per working-age pop.)
Enterprise surveys
Time dealing with gov’t officials (% of management time)
Firms expected to give gifts in meetings w/tax officials (%)
Firms using banks to finance investments (% of firms)
Delay in obtaining an electrical connection (days)
ISO certif ication ownership (% of firms)
Private sector investment
Invest. in infrastructure w/private participation ($ millions)
Private foreign direct investment, net (% of GDP)
Gross f ixed capital formation (% of GDP)
Gross f ixed private capital formation (% of GDP)
Finance and banking
Government cash surplus or deficit (% of GDP)
Government debt (% of GDP)
Deposit money banks’ assets (% of GDP) Total f inancial system deposits (% of GDP)
Bank capital to asset ratio (%)
Bank nonperforming loans to total gross loans ratio (%)
Domestic credit to the private sector (% of GDP)
Real interest rate (%)
Interest rate spread (percentage points)
Infrastructure
Paved roads (% of total roads)Electr ic power consumption (kWh per capita)
Power outages in a typical month (number)
Mobile cellular subscriptions (per 100 people)
Internet users (per 100 people)
204 2011 The Little Data Book on Private Sector Development
Europe & Central Asia Low income
Country data
Low-incomegroup
2000 2009 2009
Tajikistan
6.2 7.0 846
2.0 2.9 384
.. .. ..
170 700 5091.1 8.2 5.4
27.4 22.4 26.1
38.9 23.7 24.4
33.7 10.8 12.4
33.7 53.9 49.5
38.6 6.4
2.1 4.1
98.8 13.4 23.2
100.9 56.3 35.9
.. 139
.. 27 41
.. 8 8
.. 30.0 71.0
.. 1.7 3.7
.. 86.0 76.5
.. 17.7 24.8.. 2.2
.. 0.5
6.1 11.7
87.2 33.0
3.9 21.4
11.9 28.3
8.6 16.7
9 46 4,779
2.7 0.3 2.7
7.4 17.2 22.9
0.7 4.0 15.8
-0.8 -6.6 -1.4
114.1 .. ..
13.6 0.8 31.83.2 9.2 30.6
.. .. ..
.. .. ..
13.8 29.0 26.3
2.4 8.5
24.3 17.1 11.5
.. .. 12.02,177 2,072 231
.. 6.3
0.0 70.5 26.6
0.0 10.1 2.7
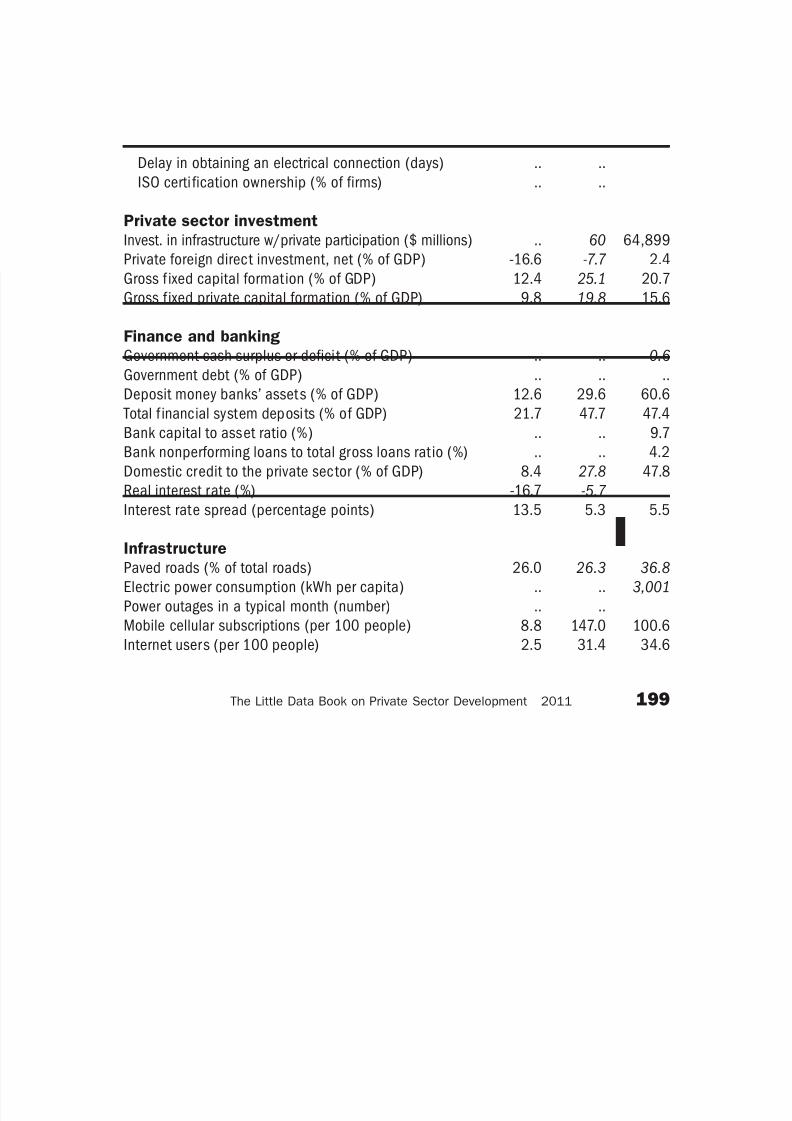
8/6/2019 The Little Data Book on Private Sector Development 2011
http://slidepdf.com/reader/full/the-little-data-book-on-private-sector-development-2011 213/246
Economic and social context
Population (millions)
Labor force (millions)
Unemployment rate (% of labor force)
GNI per capita, World Bank Atlas method ($)GDP growth, 1995–2000 and 2000–09 (average annual %)
Agriculture value added (% of GDP)
Industry value added (% of GDP)
Manufacturing value added (% of GDP)
Services value added (% of GDP)
Inflation (annual % change in consumer price index)
Exchange rate (local currency units per $)
Exports of goods and services (% of GDP)
Imports of goods and services (% of GDP) Investment climate
Ease of doing business index (ranking 1–183; 1 = best)
Time to star t a business (days)
Procedures to start a business (number)
Firing cost (weeks of wages)
Closing a business (years to resolve insolvency)
Total tax rate (% of profit)
Profit tax (% of commercial profits)New businesses registered (thousands)
New business density (new regis. per working-age pop.)
Enterprise surveys
Time dealing with gov’t officials (% of management time)
Firms expected to give gifts in meetings w/tax officials (%)
Firms using banks to finance investments (% of firms)
Delay in obtaining an electrical connection (days)
ISO certi fication ownership (% of firms)
Private sector investment
Invest. in infrastructure w/private participation ($ millions)
Private foreign direct investment, net (% of GDP)
Gross f ixed capital formation (% of GDP)
Gross f ixed private capital formation (% of GDP)
Finance and banking
Government cash surplus or deficit (% of GDP)
Government debt (% of GDP)
Deposit money banks’ assets (% of GDP) Total f inancial system deposits (% of GDP)
Bank capital to asset ratio (%)
Bank nonperforming loans to total gross loans ratio (%)
Domestic credit to the private sector (% of GDP)
Real interest rate (%)
Interest rate spread (percentage points)
Infrastructure
Paved roads (% of total roads)Electr ic power consumption (kWh per capita)
Power outages in a typical month (number)
Mobile cellular subscriptions (per 100 people)
Internet users (per 100 people)
205The Little Data Book on Private Sector Development 2011
Country data
Low-incomegroup
2000 2009 2009
Sub-Saharan Africa Low income
Tanzania
34.1 43.7 846
16.8 21.4 384
5.1 4.3 ..
300 500 5094.2 7.1 5.4
33.5 28.8 26.1
19.2 24.3 24.4
9.4 9.5 12.4
47.3 46.9 49.5
5.9 12.1
800.4 1,320.3
13.4 23.2 23.2
20.1 35.2 35.9
.. 128
.. 29 41
.. 12 8
.. 18.0 71.0
.. 3.0 3.7
.. 45.2 76.5
.. 19.9 24.8.. ..
.. ..
.. 4.0
.. 14.7
.. 6.8
.. 44.3
.. 14.7
61 522 4,779
4.5 1.9 2.7
16.4 29.3 22.9
12.4 20.5 15.8
.. .. -1.4
.. .. ..
.. .. 31.8
.. .. 30.6
.. .. ..
.. .. ..
4.1 15.3 26.3
13.0 7.1
14.2 7.1 11.5
.. 7.4 12.058 84 231
.. 12.0
0.3 39.9 26.6
0.1 1.5 2.7
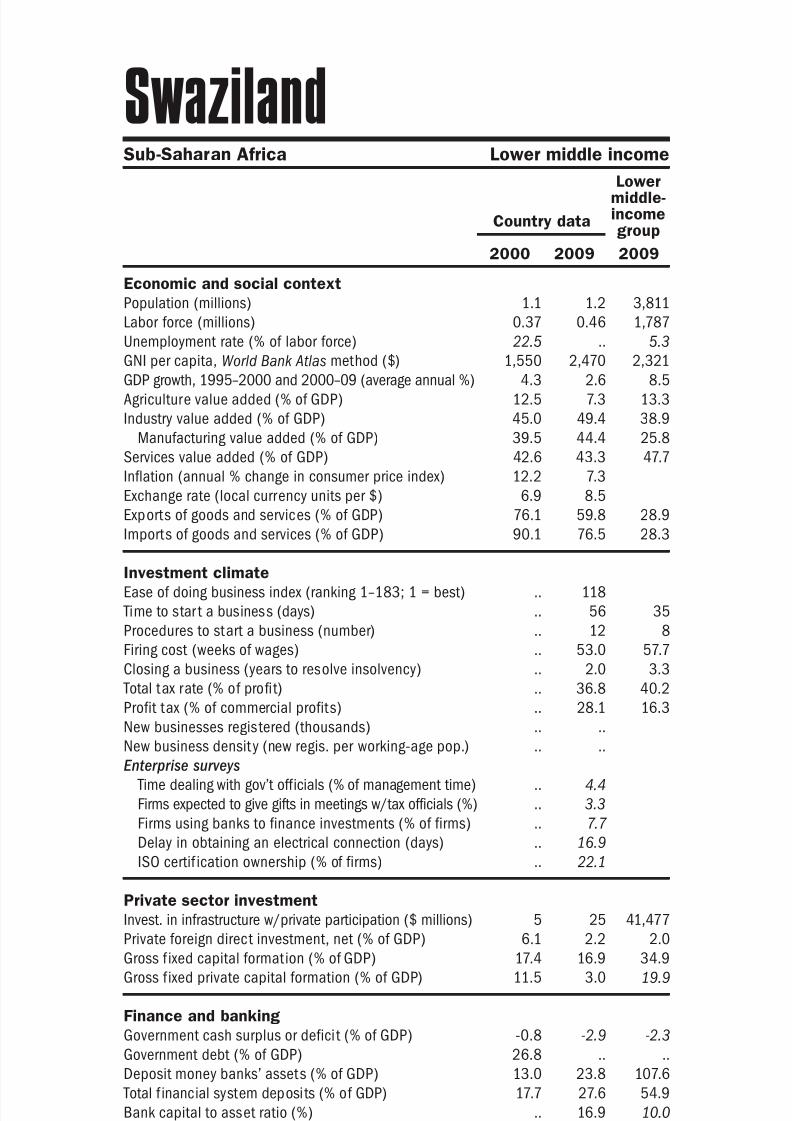
8/6/2019 The Little Data Book on Private Sector Development 2011
http://slidepdf.com/reader/full/the-little-data-book-on-private-sector-development-2011 214/246
Economic and social context
Population (millions)
Labor force (millions)
Unemployment rate (% of labor force)
GNI per capita, World Bank Atlas method ($)GDP growth, 1995–2000 and 2000–09 (average annual %)
Agriculture value added (% of GDP)
Industry value added (% of GDP)
Manufacturing value added (% of GDP)
Services value added (% of GDP)
Inflation (annual % change in consumer price index)
Exchange rate (local currency units per $)
Exports of goods and services (% of GDP)
Imports of goods and services (% of GDP) Investment climate
Ease of doing business index (ranking 1–183; 1 = best)
Time to star t a business (days)
Procedures to start a business (number)
Firing cost (weeks of wages)
Closing a business (years to resolve insolvency)
Total tax rate (% of profit)
Profit tax (% of commercial profits)New businesses registered (thousands)
New business density (new regis. per working-age pop.)
Enterprise surveys
Time dealing with gov’t officials (% of management time)
Firms expected to give gifts in meetings w/tax officials (%)
Firms using banks to finance investments (% of firms)
Delay in obtaining an electrical connection (days)
ISO certif ication ownership (% of firms)
Private sector investment
Invest. in infrastructure w/private participation ($ millions)
Private foreign direct investment, net (% of GDP)
Gross f ixed capital formation (% of GDP)
Gross f ixed private capital formation (% of GDP)
Finance and banking
Government cash surplus or deficit (% of GDP)
Government debt (% of GDP)
Deposit money banks’ assets (% of GDP) Total f inancial system deposits (% of GDP)
Bank capital to asset ratio (%)
Bank nonperforming loans to total gross loans ratio (%)
Domestic credit to the private sector (% of GDP)
Real interest rate (%)
Interest rate spread (percentage points)
Infrastructure
Paved roads (% of total roads)Electr ic power consumption (kWh per capita)
Power outages in a typical month (number)
Mobile cellular subscriptions (per 100 people)
Internet users (per 100 people)
206 2011 The Little Data Book on Private Sector Development
Country data
Lowermiddle-incomegroup
2000 2009 2009
East Asia & Pacific Lower middle income
Thailand
62.3 67.8 3,811
34.3 38.7 1,787
2.4 1.2 5.3
1,960 3,760 2,321-0.7 4.6 8.5
9.0 11.6 13.3
42.0 43.3 38.9
33.6 34.1 25.8
49.0 45.1 47.7
1.6 -0.8
40.1 34.3
66.8 68.4 28.9
58.1 57.8 28.3
.. 19
.. 32 35
.. 7 8
.. 54.0 57.7
.. 2.7 3.3
.. 37.4 40.2
.. 28.9 16.3.. 27.5
.. 0.6
.. 0.4
.. ..
.. 74.4
.. 27.9
.. 39.0
1,377 539 41,477
2.7 1.9 2.0
22.0 24.4 34.9
13.8 17.9 19.9
.. -3.0 -2.3
.. 28.6 ..
124.1 109.3 107.6106.6 100.1 54.9
7.5 9.8 10.0
17.7 5.3 5.1
108.3 116.3 92.9
6.4 3.9
4.5 4.9 7.3
98.5 .. 36.31,462 2,079 1,318
.. 1.3
4.9 122.6 57.8
3.7 25.8 17.2

8/6/2019 The Little Data Book on Private Sector Development 2011
http://slidepdf.com/reader/full/the-little-data-book-on-private-sector-development-2011 215/246
Economic and social context
Population (millions)
Labor force (millions)
Unemployment rate (% of labor force)
GNI per capita, World Bank Atlas method ($)GDP growth, 1995–2000 and 2000–09 (average annual %)
Agriculture value added (% of GDP)
Industry value added (% of GDP)
Manufacturing value added (% of GDP)
Services value added (% of GDP)
Inflation (annual % change in consumer price index)
Exchange rate (local currency units per $)
Exports of goods and services (% of GDP)
Imports of goods and services (% of GDP) Investment climate
Ease of doing business index (ranking 1–183; 1 = best)
Time to star t a business (days)
Procedures to start a business (number)
Firing cost (weeks of wages)
Closing a business (years to resolve insolvency)
Total tax rate (% of profit)
Profit tax (% of commercial profits)New businesses registered (thousands)
New business density (new regis. per working-age pop.)
Enterprise surveys
Time dealing with gov’t officials (% of management time)
Firms expected to give gifts in meetings w/tax officials (%)
Firms using banks to finance investments (% of firms)
Delay in obtaining an electrical connection (days)
ISO certi fication ownership (% of firms)
Private sector investment
Invest. in infrastructure w/private participation ($ millions)
Private foreign direct investment, net (% of GDP)
Gross f ixed capital formation (% of GDP)
Gross f ixed private capital formation (% of GDP)
Finance and banking
Government cash surplus or deficit (% of GDP)
Government debt (% of GDP)
Deposit money banks’ assets (% of GDP) Total f inancial system deposits (% of GDP)
Bank capital to asset ratio (%)
Bank nonperforming loans to total gross loans ratio (%)
Domestic credit to the private sector (% of GDP)
Real interest rate (%)
Interest rate spread (percentage points)
Infrastructure
Paved roads (% of total roads)Electr ic power consumption (kWh per capita)
Power outages in a typical month (number)
Mobile cellular subscriptions (per 100 people)
Internet users (per 100 people)
207The Little Data Book on Private Sector Development 2011
East Asia & Pacific Lower middle income
Country data
Lowermiddle-incomegroup
2000 2009 2009
Timor-Leste
0.82 1.1 3,811
0.28 0.44 1,787
.. .. 5.3
330 2,460 2,321.. 2.4 8.5
25.8 .. 13.3
18.5 .. 38.9
2.8 .. 25.8
55.7 .. 47.7
.. 0.7
.. ..
.. .. 28.9
.. .. 28.3
.. 174
.. 83 35
.. 10 8
.. 17.0 57.7
.. .. 3.3
.. 0.2 40.2
.. 0.0 16.3.. ..
.. ..
.. 4.1
.. 2.6
.. 1.6
.. 9.1
.. 2.2
.. .. 41,477
.. .. 2.0
21.8 .. 34.9
7.7 .. 19.9
.. .. -2.3
.. .. ..
.. .. 107.6
.. .. 54.9
.. .. 10.0
.. .. 5.1
2.2 18.6 92.9
.. 1.1
.. 10.3 7.3
.. .. 36.3
.. .. 1,318
.. 7.7
.. .. 57.8
.. .. 17.2
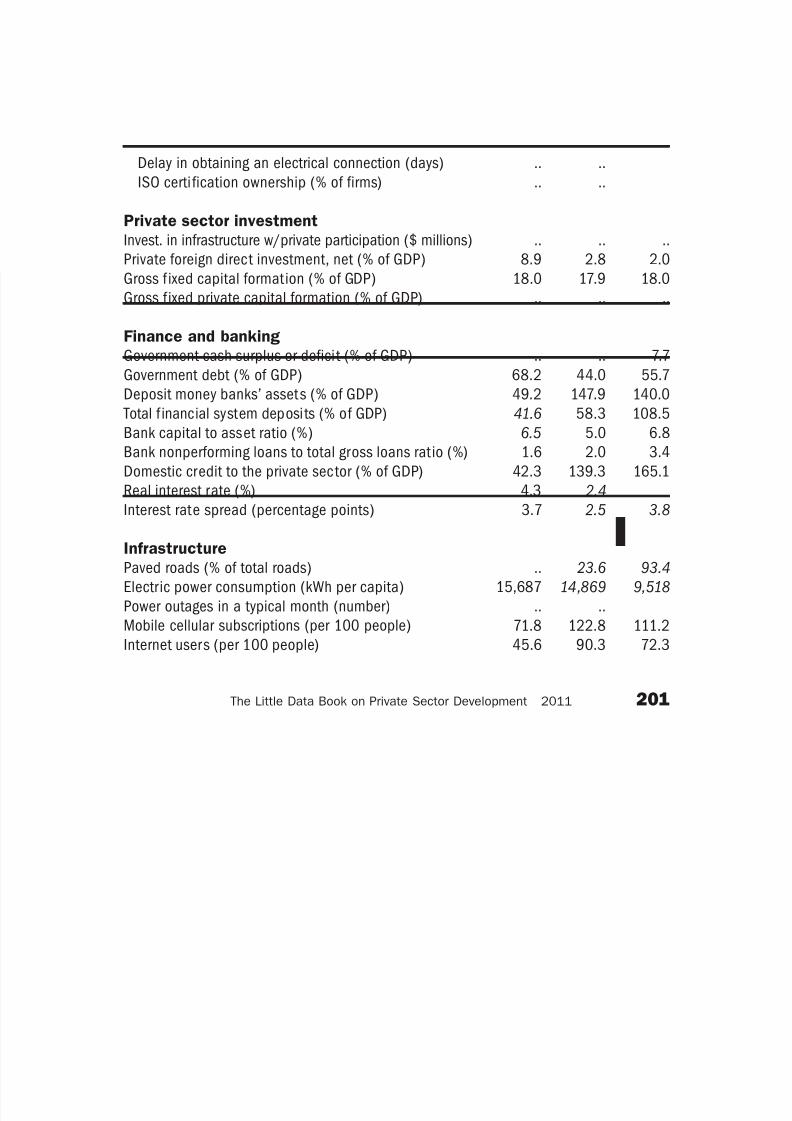
8/6/2019 The Little Data Book on Private Sector Development 2011
http://slidepdf.com/reader/full/the-little-data-book-on-private-sector-development-2011 216/246
Economic and social context
Population (millions)
Labor force (millions)
Unemployment rate (% of labor force)
GNI per capita, World Bank Atlas method ($)GDP growth, 1995–2000 and 2000–09 (average annual %)
Agriculture value added (% of GDP)
Industry value added (% of GDP)
Manufacturing value added (% of GDP)
Services value added (% of GDP)
Inflation (annual % change in consumer price index)
Exchange rate (local currency units per $)
Exports of goods and services (% of GDP)
Imports of goods and services (% of GDP) Investment climate
Ease of doing business index (ranking 1–183; 1 = best)
Time to star t a business (days)
Procedures to start a business (number)
Firing cost (weeks of wages)
Closing a business (years to resolve insolvency)
Total tax rate (% of profit)
Profit tax (% of commercial profits)New businesses registered (thousands)
New business density (new regis. per working-age pop.)
Enterprise surveys
Time dealing with gov’t officials (% of management time)
Firms expected to give gifts in meetings w/tax officials (%)
Firms using banks to finance investments (% of firms)
Delay in obtaining an electrical connection (days)
ISO certif ication ownership (% of firms)
Private sector investment
Invest. in infrastructure w/private participation ($ millions)
Private foreign direct investment, net (% of GDP)
Gross f ixed capital formation (% of GDP)
Gross f ixed private capital formation (% of GDP)
Finance and banking
Government cash surplus or deficit (% of GDP)
Government debt (% of GDP)
Deposit money banks’ assets (% of GDP) Total f inancial system deposits (% of GDP)
Bank capital to asset ratio (%)
Bank nonperforming loans to total gross loans ratio (%)
Domestic credit to the private sector (% of GDP)
Real interest rate (%)
Interest rate spread (percentage points)
Infrastructure
Paved roads (% of total roads)Electr ic power consumption (kWh per capita)
Power outages in a typical month (number)
Mobile cellular subscriptions (per 100 people)
Internet users (per 100 people)
208 2011 The Little Data Book on Private Sector Development
Country data
Low-incomegroup
2000 2009 2009
Sub-Saharan Africa Low income
Togo
5.2 6.6 846
2.2 3.0 384
.. .. ..
280 440 5094.2 2.5 5.4
34.2 43.7 26.1
17.8 24.0 24.4
8.4 10.1 12.4
47.9 32.4 49.5
1.9 2.0
712.0 472.2
30.7 41.9 23.2
50.7 62.5 35.9
.. 160
.. 75 41
.. 7 8
.. 36.0 71.0
.. 3.0 3.7
.. 50.8 76.5
.. 8.8 24.8.. 0.1
.. 0.0
.. 2.7
.. 16.4
.. 16.9
.. 53.9
.. 6.6
68 44 4,779
3.2 1.8 2.7
17.8 22.3 22.9
14.8 19.5 15.8
.. -0.6 -1.4
.. .. ..
16.7 24.6 31.815.6 25.7 30.6
.. .. ..
.. .. ..
15.6 21.9 26.3
.. ..
.. .. 11.5
31.6 21.0 12.089 99 231
.. 11.1
1.0 33.0 26.6
1.9 5.4 2.7
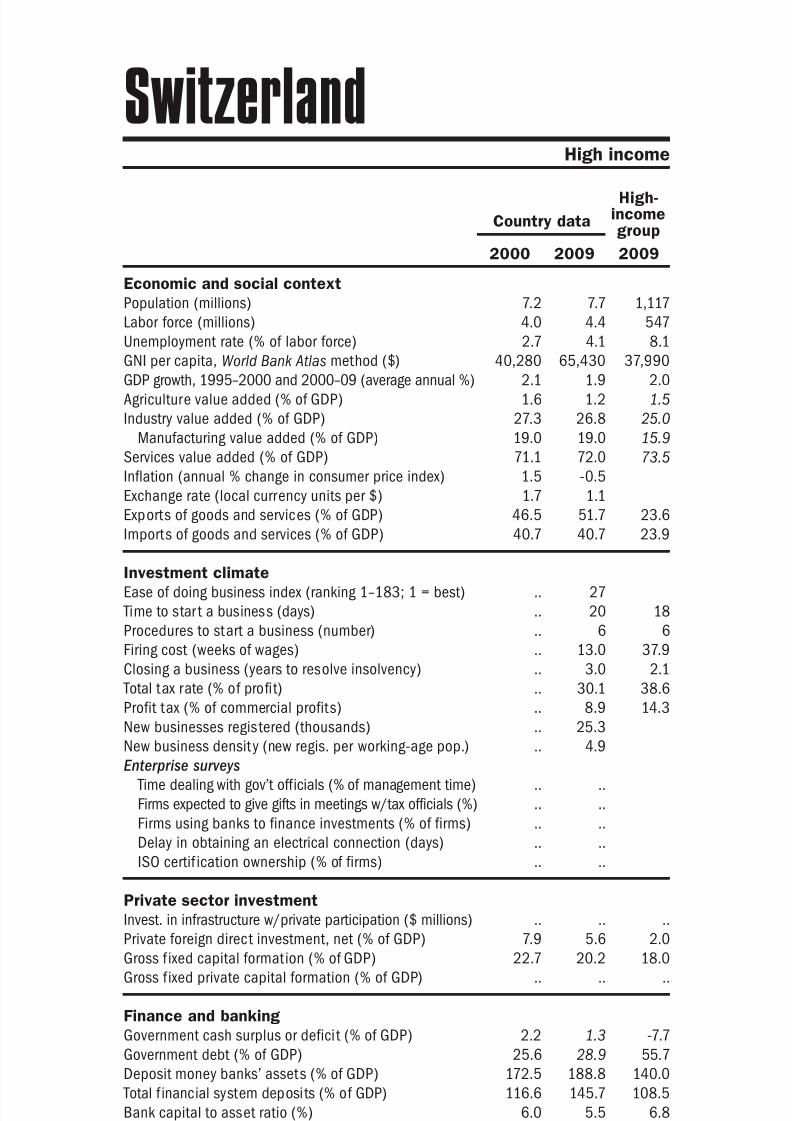
8/6/2019 The Little Data Book on Private Sector Development 2011
http://slidepdf.com/reader/full/the-little-data-book-on-private-sector-development-2011 217/246
Economic and social context
Population (millions)
Labor force (millions)
Unemployment rate (% of labor force)
GNI per capita, World Bank Atlas method ($)GDP growth, 1995–2000 and 2000–09 (average annual %)
Agriculture value added (% of GDP)
Industry value added (% of GDP)
Manufacturing value added (% of GDP)
Services value added (% of GDP)
Inflation (annual % change in consumer price index)
Exchange rate (local currency units per $)
Exports of goods and services (% of GDP)
Imports of goods and services (% of GDP) Investment climate
Ease of doing business index (ranking 1–183; 1 = best)
Time to star t a business (days)
Procedures to start a business (number)
Firing cost (weeks of wages)
Closing a business (years to resolve insolvency)
Total tax rate (% of profit)
Profit tax (% of commercial profits)New businesses registered (thousands)
New business density (new regis. per working-age pop.)
Enterprise surveys
Time dealing with gov’t officials (% of management time)
Firms expected to give gifts in meetings w/tax officials (%)
Firms using banks to finance investments (% of firms)
Delay in obtaining an electrical connection (days)
ISO certi fication ownership (% of firms)
Private sector investment
Invest. in infrastructure w/private participation ($ millions)
Private foreign direct investment, net (% of GDP)
Gross f ixed capital formation (% of GDP)
Gross f ixed private capital formation (% of GDP)
Finance and banking
Government cash surplus or deficit (% of GDP)
Government debt (% of GDP)
Deposit money banks’ assets (% of GDP) Total f inancial system deposits (% of GDP)
Bank capital to asset ratio (%)
Bank nonperforming loans to total gross loans ratio (%)
Domestic credit to the private sector (% of GDP)
Real interest rate (%)
Interest rate spread (percentage points)
Infrastructure
Paved roads (% of total roads)Electr ic power consumption (kWh per capita)
Power outages in a typical month (number)
Mobile cellular subscriptions (per 100 people)
Internet users (per 100 people)
209The Little Data Book on Private Sector Development 2011
East Asia & Pacific Lower middle income
Country data
Lowermiddle-incomegroup
2000 2009 2009
Tonga
0.10 0.10 3,811
0.04 0.04 1,787
.. 1.1 5.3
2,020 3,260 2,3212.0 1.0 8.5
22.8 19.6 13.3
21.3 18.5 38.9
10.5 8.1 25.8
55.9 61.9 47.7
6.3 1.4
1.8 2.0
15.4 13.2 28.9
46.9 58.5 28.3
.. 71
.. 25 35
.. 4 8
.. .. 57.7
.. 2.7 3.3
.. 25.5 40.2
.. 24.3 16.3.. ..
.. ..
.. 6.6
.. 1.4
.. 33.9
.. 8.3
.. 7.8
7 10 41,477
2.5 4.7 2.0
21.1 26.0 34.9
.. .. 19.9
.. .. -2.3
.. .. ..
58.2 52.2 107.643.8 49.4 54.9
.. .. 10.0
.. .. 5.1
41.0 48.2 92.9
7.8 13.8
6.0 7.2 7.3
27.0 .. 36.3.. .. 1,318
.. 2.1
0.2 51.0 57.8
2.4 8.1 17.2
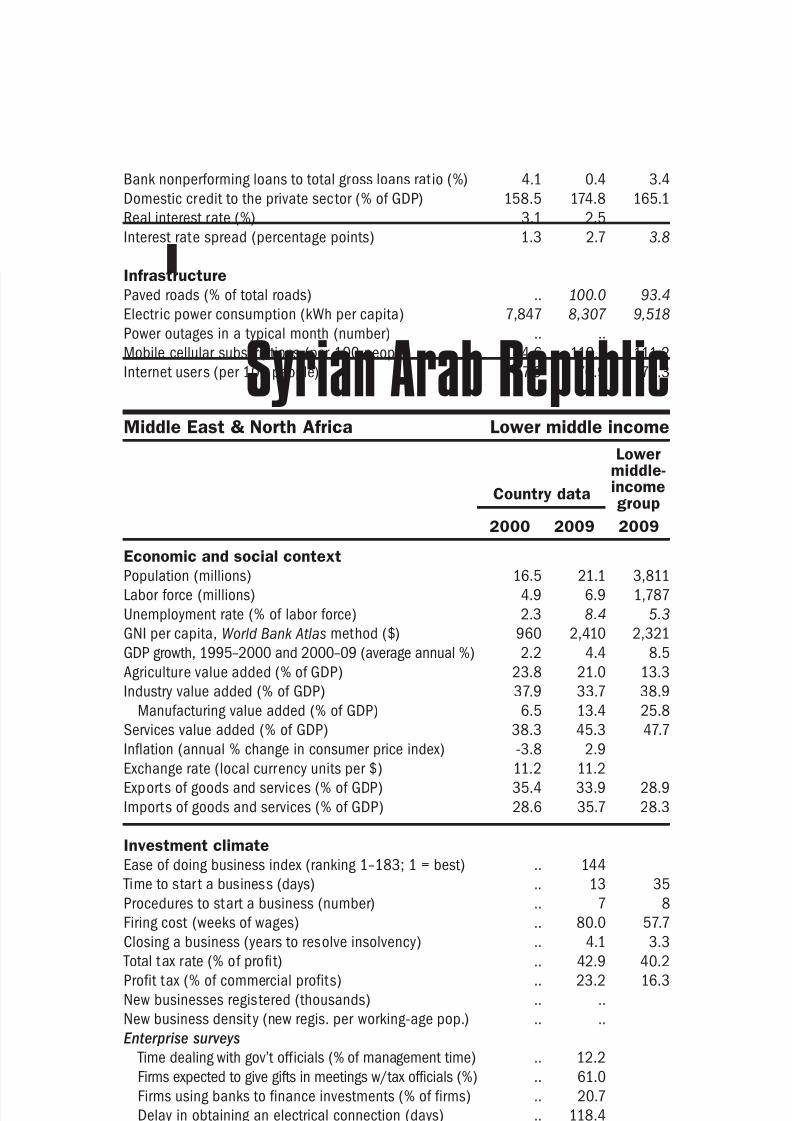
8/6/2019 The Little Data Book on Private Sector Development 2011
http://slidepdf.com/reader/full/the-little-data-book-on-private-sector-development-2011 218/246
Economic and social context
Population (millions)
Labor force (millions)
Unemployment rate (% of labor force)
GNI per capita, World Bank Atlas method ($)GDP growth, 1995–2000 and 2000–09 (average annual %)
Agriculture value added (% of GDP)
Industry value added (% of GDP)
Manufacturing value added (% of GDP)
Services value added (% of GDP)
Inflation (annual % change in consumer price index)
Exchange rate (local currency units per $)
Exports of goods and services (% of GDP)
Imports of goods and services (% of GDP) Investment climate
Ease of doing business index (ranking 1–183; 1 = best)
Time to star t a business (days)
Procedures to start a business (number)
Firing cost (weeks of wages)
Closing a business (years to resolve insolvency)
Total tax rate (% of profit)
Profit tax (% of commercial profits)New businesses registered (thousands)
New business density (new regis. per working-age pop.)
Enterprise surveys
Time dealing with gov’t officials (% of management time)
Firms expected to give gifts in meetings w/tax officials (%)
Firms using banks to finance investments (% of firms)
Delay in obtaining an electrical connection (days)
ISO certif ication ownership (% of firms)
Private sector investment
Invest. in infrastructure w/private participation ($ millions)
Private foreign direct investment, net (% of GDP)
Gross f ixed capital formation (% of GDP)
Gross f ixed private capital formation (% of GDP)
Finance and banking
Government cash surplus or deficit (% of GDP)
Government debt (% of GDP)
Deposit money banks’ assets (% of GDP) Total f inancial system deposits (% of GDP)
Bank capital to asset ratio (%)
Bank nonperforming loans to total gross loans ratio (%)
Domestic credit to the private sector (% of GDP)
Real interest rate (%)
Interest rate spread (percentage points)
Infrastructure
Paved roads (% of total roads)Electr ic power consumption (kWh per capita)
Power outages in a typical month (number)
Mobile cellular subscriptions (per 100 people)
Internet users (per 100 people)
210 2011 The Little Data Book on Private Sector Development
Country data
High-incomegroup
2000 2009 2009
High income
Trinidad and Tobago
1.3 1.3 1,117
0.59 0.70 547
12.1 5.3 8.1
5,190 16,700 37,9905.0 7.4 2.0
1.4 0.4 1.5
49.5 52.5 25.0
7.3 6.3 15.9
49.1 47.1 73.5
3.6 7.0
6.3 6.3
59.1 68.4 23.6
45.5 39.4 23.9
.. 97
.. 43 18
.. 9 6
.. 67.0 37.9
.. .. 2.1
.. 33.1 38.6
.. 21.6 14.3.. ..
.. ..
.. ..
.. ..
.. ..
.. ..
.. ..
.. .. ..
8.3 3.3 2.0
20.0 25.3 18.0
14.3 19.4 ..
2.0 2.3 -7.7
.. 14.1 55.7
37.2 34.3 140.051.3 40.9 108.5
.. .. 6.8
.. .. 3.4
43.5 31.5 165.1
3.2 32.8
8.3 8.5 3.8
51.1 .. 93.43,907 5,789 9,518
.. ..
12.5 147.2 111.2
7.7 36.2 72.3
8/6/2019 The Little Data Book on Private Sector Development 2011
http://slidepdf.com/reader/full/the-little-data-book-on-private-sector-development-2011 219/246
Economic and social context
Population (millions)
Labor force (millions)
Unemployment rate (% of labor force)
GNI per capita, World Bank Atlas method ($)GDP growth, 1995–2000 and 2000–09 (average annual %)
Agriculture value added (% of GDP)
Industry value added (% of GDP)
Manufacturing value added (% of GDP)
Services value added (% of GDP)
Inflation (annual % change in consumer price index)
Exchange rate (local currency units per $)
Exports of goods and services (% of GDP)
Imports of goods and services (% of GDP) Investment climate
Ease of doing business index (ranking 1–183; 1 = best)
Time to star t a business (days)
Procedures to start a business (number)
Firing cost (weeks of wages)
Closing a business (years to resolve insolvency)
Total tax rate (% of profit)
Profit tax (% of commercial profits)New businesses registered (thousands)
New business density (new regis. per working-age pop.)
Enterprise surveys
Time dealing with gov’t officials (% of management time)
Firms expected to give gifts in meetings w/tax officials (%)
Firms using banks to finance investments (% of firms)
Delay in obtaining an electrical connection (days)
ISO certi fication ownership (% of firms)
Private sector investment
Invest. in infrastructure w/private participation ($ millions)
Private foreign direct investment, net (% of GDP)
Gross f ixed capital formation (% of GDP)
Gross f ixed private capital formation (% of GDP)
Finance and banking
Government cash surplus or deficit (% of GDP)
Government debt (% of GDP)
Deposit money banks’ assets (% of GDP) Total f inancial system deposits (% of GDP)
Bank capital to asset ratio (%)
Bank nonperforming loans to total gross loans ratio (%)
Domestic credit to the private sector (% of GDP)
Real interest rate (%)
Interest rate spread (percentage points)
Infrastructure
Paved roads (% of total roads)Electr ic power consumption (kWh per capita)
Power outages in a typical month (number)
Mobile cellular subscriptions (per 100 people)
Internet users (per 100 people)
211The Little Data Book on Private Sector Development 2011
Middle East & North Africa Lower middle income
Country data
Lowermiddle-incomegroup
2000 2009 2009
Tunisia
9.6 10.4 3,811
3.2 3.8 1,787
15.7 14.2 5.3
2,090 3,720 2,3215.5 4.9 8.5
12.3 7.8 13.3
28.6 30.0 38.9
18.2 16.5 25.8
59.1 62.3 47.7
3.0 3.8
1.4 1.4
44.5 52.0 28.9
48.2 55.3 28.3
.. 55
.. 11 35
.. 10 8
.. 17.0 57.7
.. 1.3 3.3
.. 62.8 40.2
.. 15.0 16.3.. 9.1
.. 1.2
.. ..
.. ..
.. ..
.. ..
.. ..
261 287 41,477
3.9 4.0 2.0
26.0 25.9 34.9
13.7 23.2 19.9
-2.7 -1.7 -2.3
62.6 47.1 ..
64.8 70.6 107.648.1 58.6 54.9
7.5 .. 10.0
21.6 13.2 5.1
66.3 68.4 92.9
.. ..
.. .. 7.3
68.4 75.2 36.3991 1,298 1,318
.. ..
1.2 93.5 57.8
2.7 33.5 17.2
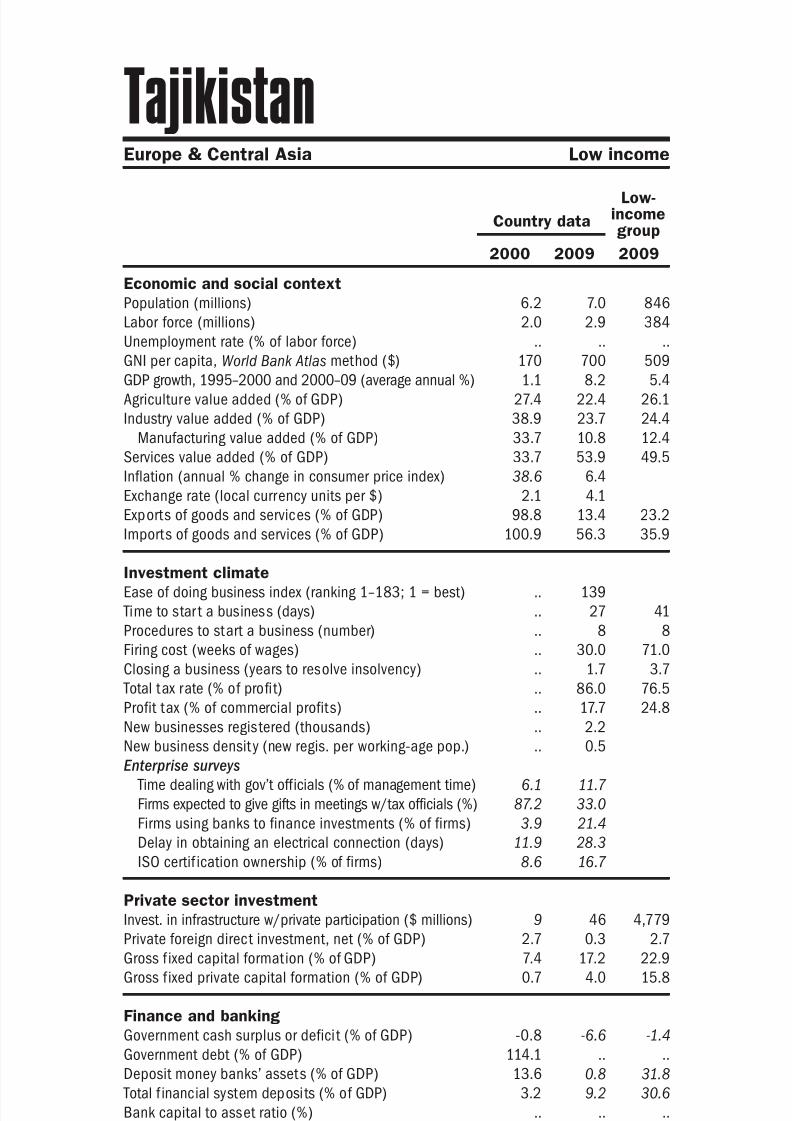
8/6/2019 The Little Data Book on Private Sector Development 2011
http://slidepdf.com/reader/full/the-little-data-book-on-private-sector-development-2011 220/246
Economic and social context
Population (millions)
Labor force (millions)
Unemployment rate (% of labor force)
GNI per capita, World Bank Atlas method ($)GDP growth, 1995–2000 and 2000–09 (average annual %)
Agriculture value added (% of GDP)
Industry value added (% of GDP)
Manufacturing value added (% of GDP)
Services value added (% of GDP)
Inflation (annual % change in consumer price index)
Exchange rate (local currency units per $)
Exports of goods and services (% of GDP)
Imports of goods and services (% of GDP) Investment climate
Ease of doing business index (ranking 1–183; 1 = best)
Time to star t a business (days)
Procedures to start a business (number)
Firing cost (weeks of wages)
Closing a business (years to resolve insolvency)
Total tax rate (% of profit)
Profit tax (% of commercial profits)New businesses registered (thousands)
New business density (new regis. per working-age pop.)
Enterprise surveys
Time dealing with gov’t officials (% of management time)
Firms expected to give gifts in meetings w/tax officials (%)
Firms using banks to finance investments (% of firms)
Delay in obtaining an electrical connection (days)
ISO certif ication ownership (% of firms)
Private sector investment
Invest. in infrastructure w/private participation ($ millions)
Private foreign direct investment, net (% of GDP)
Gross f ixed capital formation (% of GDP)
Gross f ixed private capital formation (% of GDP)
Finance and banking
Government cash surplus or deficit (% of GDP)
Government debt (% of GDP)
Deposit money banks’ assets (% of GDP) Total f inancial system deposits (% of GDP)
Bank capital to asset ratio (%)
Bank nonperforming loans to total gross loans ratio (%)
Domestic credit to the private sector (% of GDP)
Real interest rate (%)
Interest rate spread (percentage points)
Infrastructure
Paved roads (% of total roads)Electr ic power consumption (kWh per capita)
Power outages in a typical month (number)
Mobile cellular subscriptions (per 100 people)
Internet users (per 100 people)
212 2011 The Little Data Book on Private Sector Development
Country data
Uppermiddle-incomegroup
2000 2009 2009
Europe & Central Asia Upper middle income
Turkey
66.5 74.8 1,002
23.1 25.6 458
6.5 14.0 9.1
3,990 8,720 7,5023.5 4.9 4.4
11.3 9.3 6.2
31.5 25.8 31.5
22.5 17.1 16.7
57.2 64.9 62.4
54.9 6.3
0.6 1.5
20.1 23.2 25.4
23.1 24.4 24.2
.. 65
.. 6 43
.. 6 8
.. 95.0 40.1
.. 3.3 2.9
.. 44.5 43.0
.. 17.0 18.0.. 44.5
.. 0.9
3.5 27.1
49.4 4.0
13.3 51.9
2.7 7.4
8.7 30.0
8,215 8,223 64,899
0.4 1.4 2.4
20.4 16.9 20.7
15.7 13.2 15.6
.. -5.5 -0.6
.. 51.4 ..
39.9 64.3 60.632.7 51.0 47.4
6.1 13.3 9.7
9.2 5.6 4.2
17.8 36.5 47.8
.. ..
.. .. 5.5
34.0 .. 36.81,573 2,308 3,001
.. 4.1
24.3 83.9 100.6
3.8 35.3 34.6
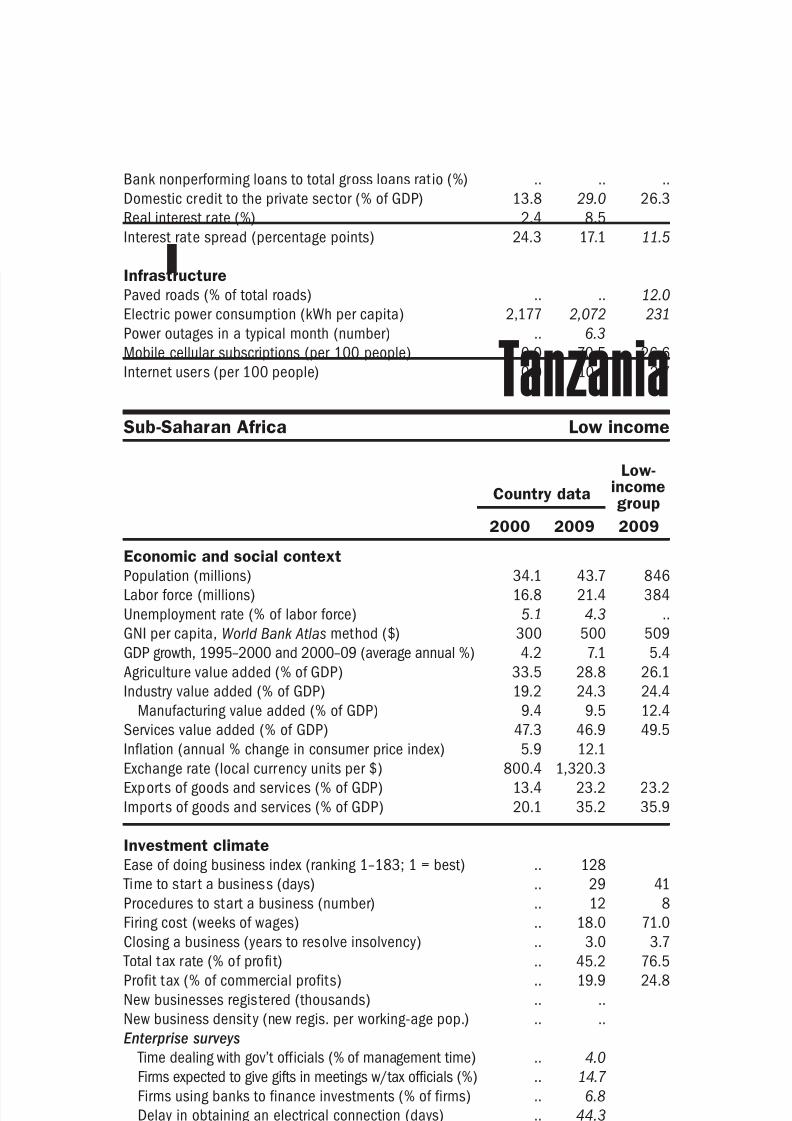
8/6/2019 The Little Data Book on Private Sector Development 2011
http://slidepdf.com/reader/full/the-little-data-book-on-private-sector-development-2011 221/246
Economic and social context
Population (millions)
Labor force (millions)
Unemployment rate (% of labor force)
GNI per capita, World Bank Atlas method ($)GDP growth, 1995–2000 and 2000–09 (average annual %)
Agriculture value added (% of GDP)
Industry value added (% of GDP)
Manufacturing value added (% of GDP)
Services value added (% of GDP)
Inflation (annual % change in consumer price index)
Exchange rate (local currency units per $)
Exports of goods and services (% of GDP)
Imports of goods and services (% of GDP) Investment climate
Ease of doing business index (ranking 1–183; 1 = best)
Time to star t a business (days)
Procedures to start a business (number)
Firing cost (weeks of wages)
Closing a business (years to resolve insolvency)
Total tax rate (% of profit)
Profit tax (% of commercial profits)New businesses registered (thousands)
New business density (new regis. per working-age pop.)
Enterprise surveys
Time dealing with gov’t officials (% of management time)
Firms expected to give gifts in meetings w/tax officials (%)
Firms using banks to finance investments (% of firms)
Delay in obtaining an electrical connection (days)
ISO certi fication ownership (% of firms)
Private sector investment
Invest. in infrastructure w/private participation ($ millions)
Private foreign direct investment, net (% of GDP)
Gross f ixed capital formation (% of GDP)
Gross f ixed private capital formation (% of GDP)
Finance and banking
Government cash surplus or deficit (% of GDP)
Government debt (% of GDP)
Deposit money banks’ assets (% of GDP) Total f inancial system deposits (% of GDP)
Bank capital to asset ratio (%)
Bank nonperforming loans to total gross loans ratio (%)
Domestic credit to the private sector (% of GDP)
Real interest rate (%)
Interest rate spread (percentage points)
Infrastructure
Paved roads (% of total roads)Electr ic power consumption (kWh per capita)
Power outages in a typical month (number)
Mobile cellular subscriptions (per 100 people)
Internet users (per 100 people)
213The Little Data Book on Private Sector Development 2011
Europe & Central Asia Lower middle income
Country data
Lowermiddle-incomegroup
2000 2009 2009
Turkmenistan
4.5 5.1 3,811
1.8 2.4 1,787
.. .. 5.3
650 3,420 2,3213.9 13.9 8.5
24.4 12.3 13.3
44.4 53.5 38.9
10.6 46.6 25.8
31.2 34.2 47.7
.. ..
5,200.0 ..
95.5 75.6 28.9
80.9 45.8 28.3
.. ..
.. .. 35
.. .. 8
.. .. 57.7
.. .. 3.3
.. .. 40.2
.. .. 16.3.. ..
.. ..
.. ..
.. ..
.. ..
.. ..
.. ..
20 52 41,477
4.5 6.8 2.0
34.7 11.4 34.9
.. 10.4 19.9
.. .. -2.3
.. .. ..
.. .. 107.6
.. .. 54.9
.. .. 10.0
.. .. 5.1
2.0 .. 92.9
.. ..
.. .. 7.3
81.2 .. 36.31,698 2,273 1,318
.. ..
0.2 29.4 57.8
0.1 1.6 17.2
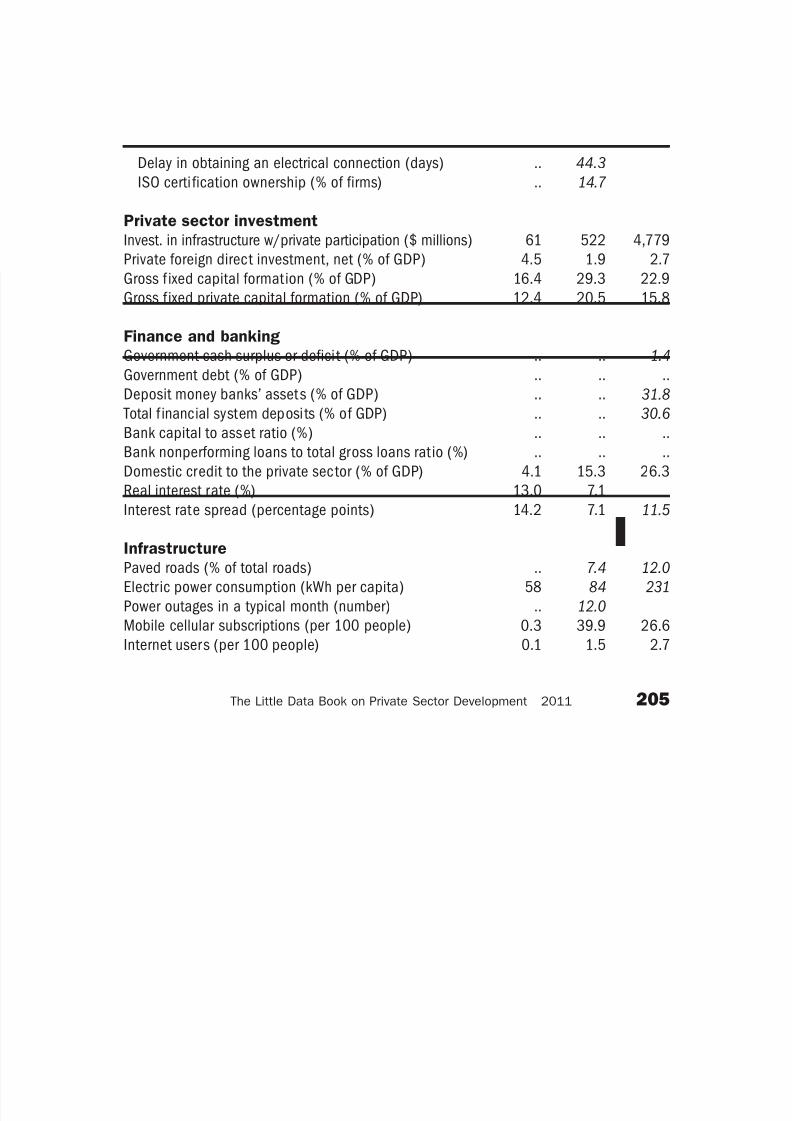
8/6/2019 The Little Data Book on Private Sector Development 2011
http://slidepdf.com/reader/full/the-little-data-book-on-private-sector-development-2011 222/246
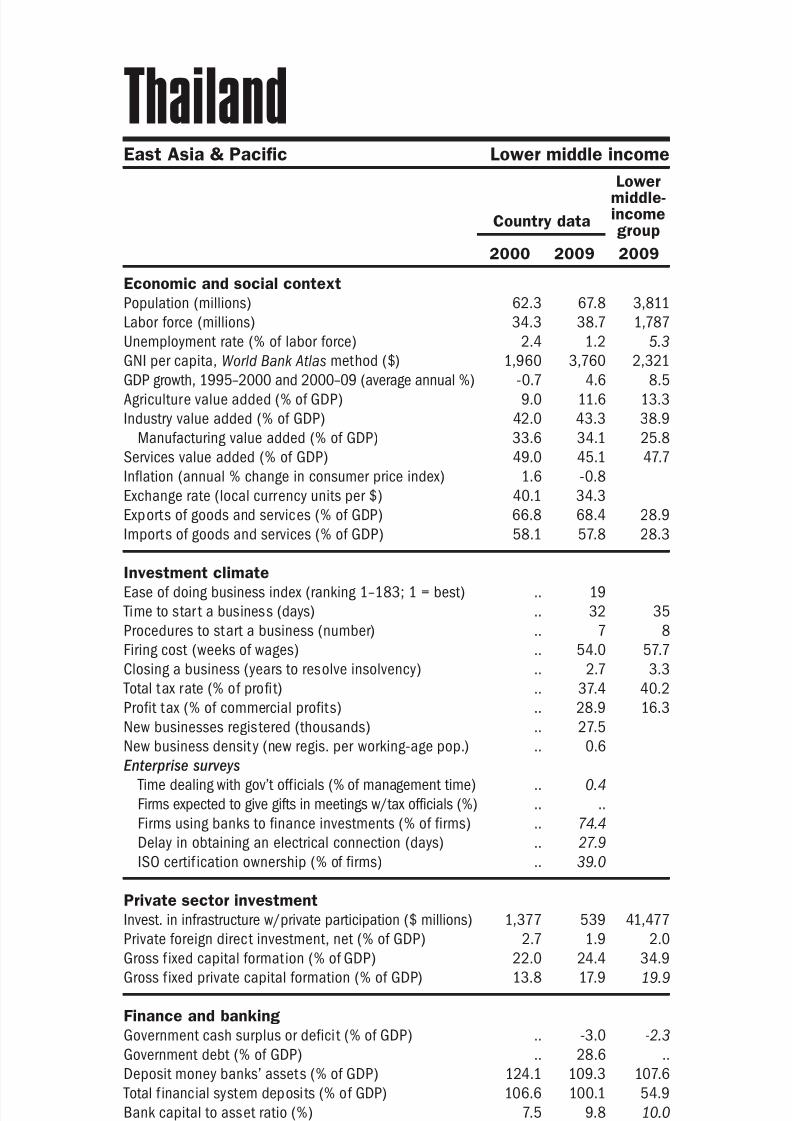
8/6/2019 The Little Data Book on Private Sector Development 2011
http://slidepdf.com/reader/full/the-little-data-book-on-private-sector-development-2011 223/246
Economic and social context
Population (millions)
Labor force (millions)
Unemployment rate (% of labor force)
GNI per capita, World Bank Atlas method ($)GDP growth, 1995–2000 and 2000–09 (average annual %)
Agriculture value added (% of GDP)
Industry value added (% of GDP)
Manufacturing value added (% of GDP)
Services value added (% of GDP)
Inflation (annual % change in consumer price index)
Exchange rate (local currency units per $)
Exports of goods and services (% of GDP)
Imports of goods and services (% of GDP) Investment climate
Ease of doing business index (ranking 1–183; 1 = best)
Time to star t a business (days)
Procedures to start a business (number)
Firing cost (weeks of wages)
Closing a business (years to resolve insolvency)
Total tax rate (% of profit)
Profit tax (% of commercial profits)New businesses registered (thousands)
New business density (new regis. per working-age pop.)
Enterprise surveys
Time dealing with gov’t officials (% of management time)
Firms expected to give gifts in meetings w/tax officials (%)
Firms using banks to finance investments (% of firms)
Delay in obtaining an electrical connection (days)
ISO certi fication ownership (% of firms)
Private sector investment
Invest. in infrastructure w/private participation ($ millions)
Private foreign direct investment, net (% of GDP)
Gross f ixed capital formation (% of GDP)
Gross f ixed private capital formation (% of GDP)
Finance and banking
Government cash surplus or deficit (% of GDP)
Government debt (% of GDP)
Deposit money banks’ assets (% of GDP) Total f inancial system deposits (% of GDP)
Bank capital to asset ratio (%)
Bank nonperforming loans to total gross loans ratio (%)
Domestic credit to the private sector (% of GDP)
Real interest rate (%)
Interest rate spread (percentage points)
Infrastructure
Paved roads (% of total roads)Electr ic power consumption (kWh per capita)
Power outages in a typical month (number)
Mobile cellular subscriptions (per 100 people)
Internet users (per 100 people)
215The Little Data Book on Private Sector Development 2011
.. 0.01 3,811
.. .. 1,787
6.5 16.3 5.3
.. .. 2,321
.. .. 8.5
.. .. 13.3
.. .. 38.9
.. .. 25.8
.. .. 47.7
.. ..
.. ..
.. .. 28.9
.. .. 28.3
.. ..
.. .. 35
.. .. 8
.. .. 57.7
.. .. 3.3
.. .. 40.2
.. .. 16.3.. ..
.. ..
.. ..
.. ..
.. ..
.. ..
.. ..
.. .. 41,477
.. .. 2.0
.. .. 34.9
.. .. 19.9
.. .. -2.3
.. .. ..
.. .. 107.6
.. .. 54.9
.. .. 10.0
.. .. 5.1
.. .. 92.9
.. ..
.. .. 7.3
.. .. 36.3
.. .. 1,318
.. ..
.. 12.5 57.8
.. 23.9 17.2
East Asia & Pacific Lower middle income
Country data
Lowermiddle-incomegroup
2000 2009 2009
Tuvalu
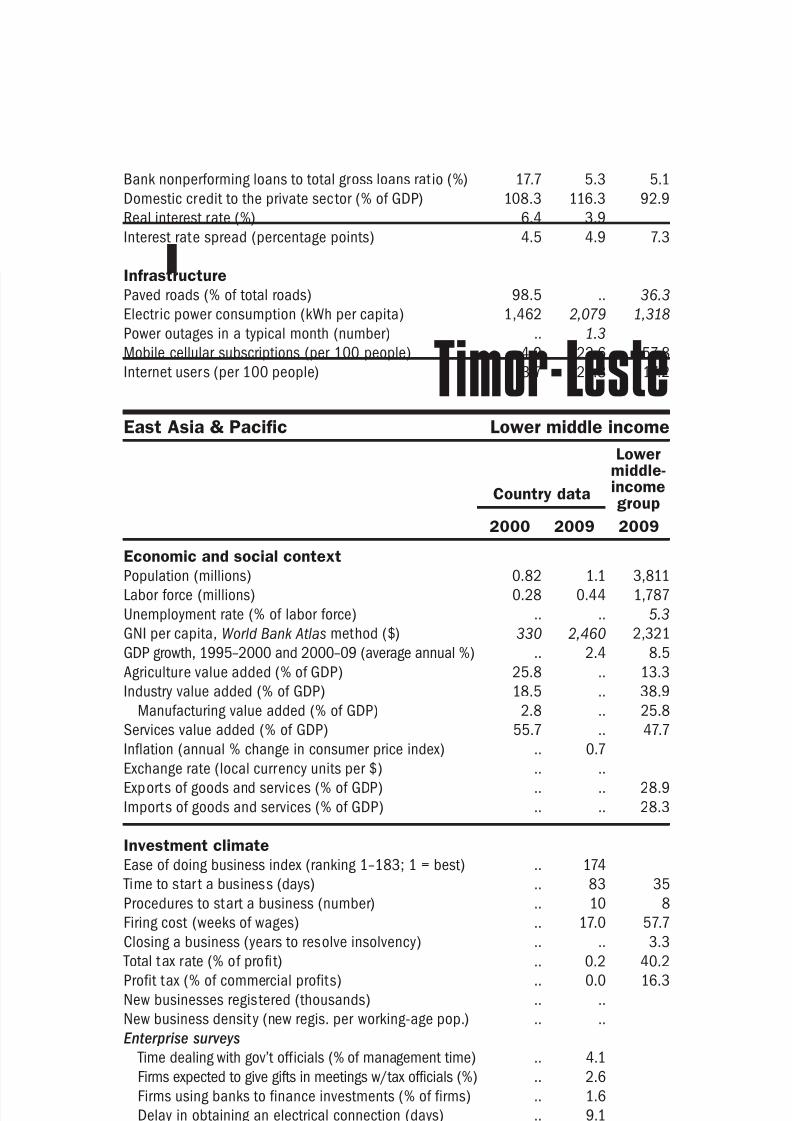
8/6/2019 The Little Data Book on Private Sector Development 2011
http://slidepdf.com/reader/full/the-little-data-book-on-private-sector-development-2011 224/246
Economic and social context
Population (millions)
Labor force (millions)
Unemployment rate (% of labor force)
GNI per capita, World Bank Atlas method ($)GDP growth, 1995–2000 and 2000–09 (average annual %)
Agriculture value added (% of GDP)
Industry value added (% of GDP)
Manufacturing value added (% of GDP)
Services value added (% of GDP)
Inflation (annual % change in consumer price index)
Exchange rate (local currency units per $)
Exports of goods and services (% of GDP)
Imports of goods and services (% of GDP) Investment climate
Ease of doing business index (ranking 1–183; 1 = best)
Time to star t a business (days)
Procedures to start a business (number)
Firing cost (weeks of wages)
Closing a business (years to resolve insolvency)
Total tax rate (% of profit)
Profit tax (% of commercial profits)New businesses registered (thousands)
New business density (new regis. per working-age pop.)
Enterprise surveys
Time dealing with gov’t officials (% of management time)
Firms expected to give gifts in meetings w/tax officials (%)
Firms using banks to finance investments (% of firms)
Delay in obtaining an electrical connection (days)
ISO certif ication ownership (% of firms)
Private sector investment
Invest. in infrastructure w/private participation ($ millions)
Private foreign direct investment, net (% of GDP)
Gross f ixed capital formation (% of GDP)
Gross f ixed private capital formation (% of GDP)
Finance and banking
Government cash surplus or deficit (% of GDP)
Government debt (% of GDP)
Deposit money banks’ assets (% of GDP) Total f inancial system deposits (% of GDP)
Bank capital to asset ratio (%)
Bank nonperforming loans to total gross loans ratio (%)
Domestic credit to the private sector (% of GDP)
Real interest rate (%)
Interest rate spread (percentage points)
Infrastructure
Paved roads (% of total roads)Electr ic power consumption (kWh per capita)
Power outages in a typical month (number)
Mobile cellular subscriptions (per 100 people)
Internet users (per 100 people)
216 2011 The Little Data Book on Private Sector Development
Country data
Low-incomegroup
2000 2009 2009
Sub-Saharan Africa Low income
Uganda
24.4 32.7 846
10.5 14.1 384
.. 3.2 ..
270 460 5097.4 7.8 5.4
29.4 24.7 26.1
22.9 25.8 24.4
7.6 8.0 12.4
47.7 49.5 49.5
3.4 13.4
1,644.5 2,030.3
10.7 23.4 23.2
22.1 34.6 35.9
.. 122
.. 25 41
.. 18 8
.. 13.0 71.0
.. 2.2 3.7
.. 35.7 76.5
.. 23.3 24.8.. 11.2
.. 0.7
.. 5.2
.. 14.5
.. 7.7
.. 33.0
.. 15.5
57 310 4,779
2.6 3.8 2.7
19.2 23.5 22.9
13.2 17.5 15.8
-1.9 -0.9 -1.4
42.9 32.7 ..
11.1 16.8 31.812.1 16.0 30.6
9.8 13.4 ..
9.8 4.2 ..
6.2 13.1 26.3
10.6 3.8
13.1 11.2 11.5
.. 23.0 12.0
.. .. 231
.. 11.0
0.5 28.7 26.6
0.2 9.8 2.7
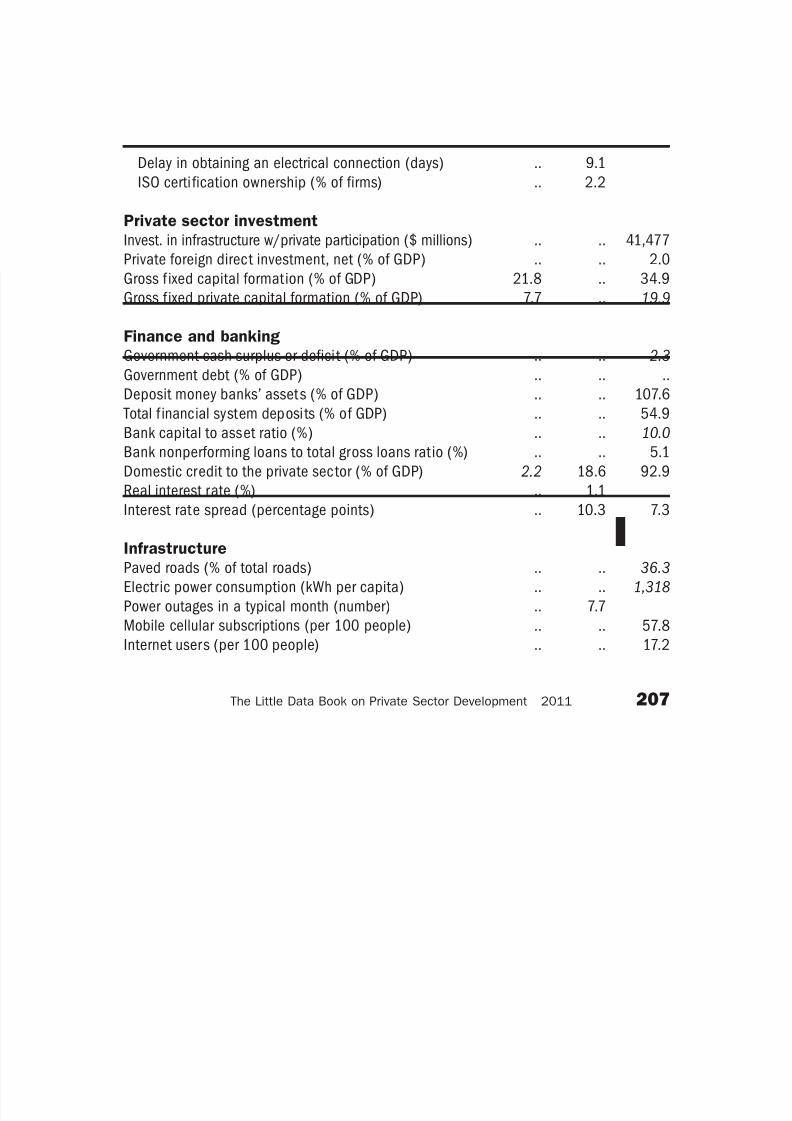
8/6/2019 The Little Data Book on Private Sector Development 2011
http://slidepdf.com/reader/full/the-little-data-book-on-private-sector-development-2011 225/246
Economic and social context
Population (millions)
Labor force (millions)
Unemployment rate (% of labor force)
GNI per capita, World Bank Atlas method ($)GDP growth, 1995–2000 and 2000–09 (average annual %)
Agriculture value added (% of GDP)
Industry value added (% of GDP)
Manufacturing value added (% of GDP)
Services value added (% of GDP)
Inflation (annual % change in consumer price index)
Exchange rate (local currency units per $)
Exports of goods and services (% of GDP)
Imports of goods and services (% of GDP) Investment climate
Ease of doing business index (ranking 1–183; 1 = best)
Time to star t a business (days)
Procedures to start a business (number)
Firing cost (weeks of wages)
Closing a business (years to resolve insolvency)
Total tax rate (% of profit)
Profit tax (% of commercial profits)New businesses registered (thousands)
New business density (new regis. per working-age pop.)
Enterprise surveys
Time dealing with gov’t officials (% of management time)
Firms expected to give gifts in meetings w/tax officials (%)
Firms using banks to finance investments (% of firms)
Delay in obtaining an electrical connection (days)
ISO certi fication ownership (% of firms)
Private sector investment
Invest. in infrastructure w/private participation ($ millions)
Private foreign direct investment, net (% of GDP)
Gross f ixed capital formation (% of GDP)
Gross f ixed private capital formation (% of GDP)
Finance and banking
Government cash surplus or deficit (% of GDP)
Government debt (% of GDP)
Deposit money banks’ assets (% of GDP) Total f inancial system deposits (% of GDP)
Bank capital to asset ratio (%)
Bank nonperforming loans to total gross loans ratio (%)
Domestic credit to the private sector (% of GDP)
Real interest rate (%)
Interest rate spread (percentage points)
Infrastructure
Paved roads (% of total roads)Electr ic power consumption (kWh per capita)
Power outages in a typical month (number)
Mobile cellular subscriptions (per 100 people)
Internet users (per 100 people)
217The Little Data Book on Private Sector Development 2011
Europe & Central Asia Lower middle income
Country data
Lowermiddle-incomegroup
2000 2009 2009
Ukraine
49.2 46.0 3,811
23.4 23.0 1,787
11.6 8.8 5.3
700 2,800 2,321-1.9 5.6 8.5
17.1 8.2 13.3
36.3 29.4 38.9
19.2 18.2 25.8
46.6 62.4 47.7
28.2 15.9
5.4 7.8
62.4 46.3 28.9
57.4 48.0 28.3
.. 145
.. 27 35
.. 10 8
.. 13.0 57.7
.. 2.9 3.3
.. 55.5 40.2
.. 10.4 16.3.. 19.3
.. 0.6
10.2 11.3
58.9 28.3
8.1 32.1
26.2 47.9
14.5 13.0
206 1,118 41,477
1.9 4.2 2.0
19.7 18.0 34.9
17.3 16.8 19.9
-0.6 -5.6 -2.3
45.3 .. ..
12.7 82.3 107.611.0 35.7 54.9
16.2 13.1 10.0
29.6 40.2 5.1
11.2 73.3 92.9
15.0 6.6
27.8 7.1 7.3
96.7 97.8 36.32,778 3,534 1,318
.. 2.1
1.7 120.3 57.8
0.7 33.3 17.2
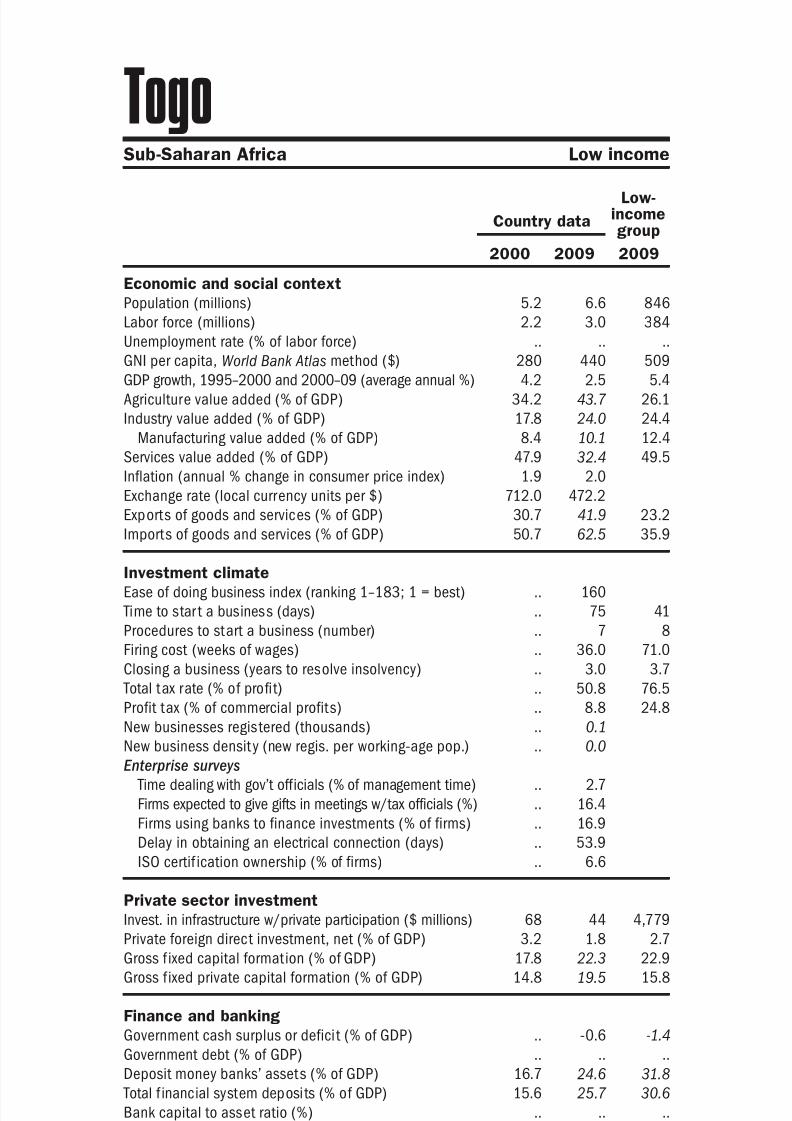
8/6/2019 The Little Data Book on Private Sector Development 2011
http://slidepdf.com/reader/full/the-little-data-book-on-private-sector-development-2011 226/246
Economic and social context
Population (millions)
Labor force (millions)
Unemployment rate (% of labor force)
GNI per capita, World Bank Atlas method ($)GDP growth, 1995–2000 and 2000–09 (average annual %)
Agriculture value added (% of GDP)
Industry value added (% of GDP)
Manufacturing value added (% of GDP)
Services value added (% of GDP)
Inflation (annual % change in consumer price index)
Exchange rate (local currency units per $)
Exports of goods and services (% of GDP)
Imports of goods and services (% of GDP) Investment climate
Ease of doing business index (ranking 1–183; 1 = best)
Time to star t a business (days)
Procedures to start a business (number)
Firing cost (weeks of wages)
Closing a business (years to resolve insolvency)
Total tax rate (% of profit)
Profit tax (% of commercial profits)New businesses registered (thousands)
New business density (new regis. per working-age pop.)
Enterprise surveys
Time dealing with gov’t officials (% of management time)
Firms expected to give gifts in meetings w/tax officials (%)
Firms using banks to finance investments (% of firms)
Delay in obtaining an electrical connection (days)
ISO certif ication ownership (% of firms)
Private sector investment
Invest. in infrastructure w/private participation ($ millions)
Private foreign direct investment, net (% of GDP)
Gross f ixed capital formation (% of GDP)
Gross f ixed private capital formation (% of GDP)
Finance and banking
Government cash surplus or deficit (% of GDP)
Government debt (% of GDP)
Deposit money banks’ assets (% of GDP) Total f inancial system deposits (% of GDP)
Bank capital to asset ratio (%)
Bank nonperforming loans to total gross loans ratio (%)
Domestic credit to the private sector (% of GDP)
Real interest rate (%)
Interest rate spread (percentage points)
Infrastructure
Paved roads (% of total roads)Electr ic power consumption (kWh per capita)
Power outages in a typical month (number)
Mobile cellular subscriptions (per 100 people)
Internet users (per 100 people)
218 2011 The Little Data Book on Private Sector Development
Country data
High-incomegroup
2000 2009 2009
High income
United Arab Emirates
3.2 4.6 1,117
1.9 2.9 547
2.3 4.0 8.1
19,330 26,370 37,9905.1 7.0 2.0
3.5 1.8 1.5
55.7 60.6 25.0
13.5 12.4 15.9
40.8 37.6 73.5
.. ..
3.7 3.7
73.3 87.1 23.6
55.3 63.8 23.9
.. 40
.. 15 18
.. 8 6
.. 84.0 37.9
.. 5.1 2.1
.. 14.1 38.6
.. 0.0 14.3.. ..
.. ..
.. ..
.. ..
.. ..
.. ..
.. ..
.. .. ..
.. .. 2.0
22.1 19.5 18.0
9.5 10.3 ..
0.1 .. -7.7
.. .. 55.7
51.1 82.2 140.045.1 74.0 108.5
12.9 16.0 6.8
12.7 4.8 3.4
46.2 93.0 165.1
-9.9 ..
3.5 .. 3.8
100.0 .. 93.411,919 16,891 9,518
.. ..
44.1 232.1 111.2
23.6 82.2 72.3
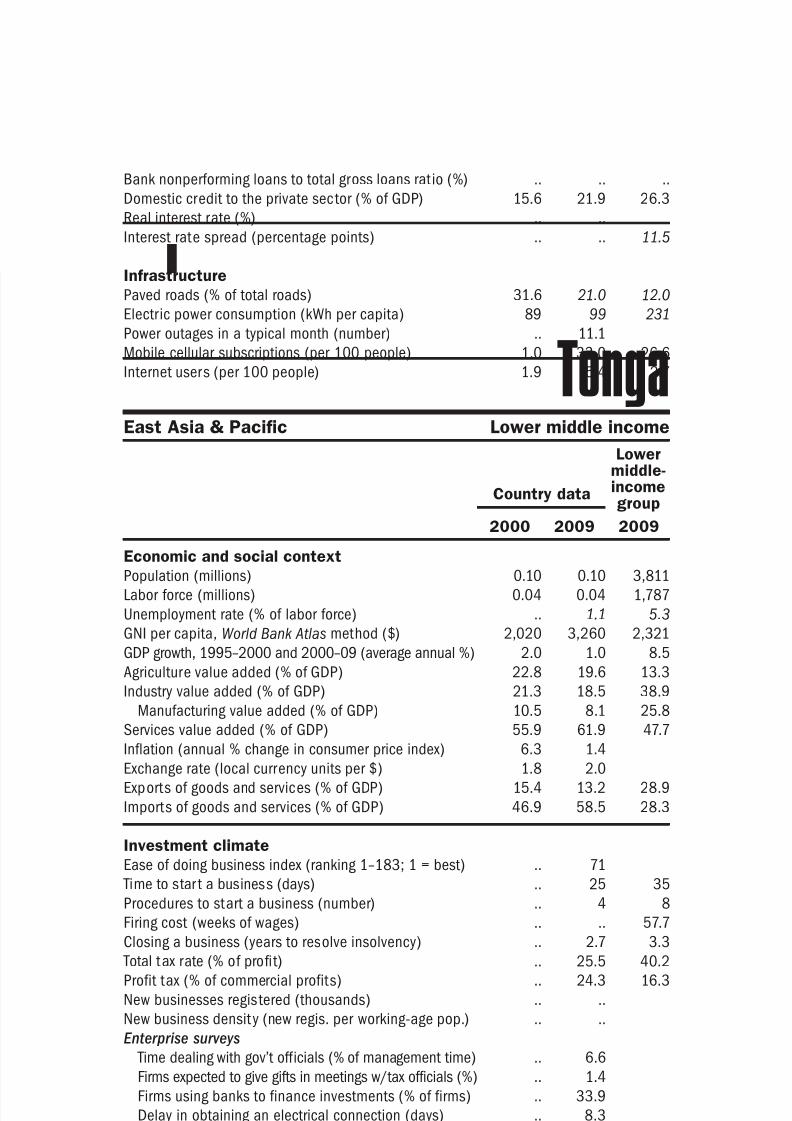
8/6/2019 The Little Data Book on Private Sector Development 2011
http://slidepdf.com/reader/full/the-little-data-book-on-private-sector-development-2011 227/246
Economic and social context
Population (millions)
Labor force (millions)
Unemployment rate (% of labor force)
GNI per capita, World Bank Atlas method ($)GDP growth, 1995–2000 and 2000–09 (average annual %)
Agriculture value added (% of GDP)
Industry value added (% of GDP)
Manufacturing value added (% of GDP)
Services value added (% of GDP)
Inflation (annual % change in consumer price index)
Exchange rate (local currency units per $)
Exports of goods and services (% of GDP)
Imports of goods and services (% of GDP) Investment climate
Ease of doing business index (ranking 1–183; 1 = best)
Time to star t a business (days)
Procedures to start a business (number)
Firing cost (weeks of wages)
Closing a business (years to resolve insolvency)
Total tax rate (% of profit)
Profit tax (% of commercial profits)New businesses registered (thousands)
New business density (new regis. per working-age pop.)
Enterprise surveys
Time dealing with gov’t officials (% of management time)
Firms expected to give gifts in meetings w/tax officials (%)
Firms using banks to finance investments (% of firms)
Delay in obtaining an electrical connection (days)
ISO certi fication ownership (% of firms)
Private sector investment
Invest. in infrastructure w/private participation ($ millions)
Private foreign direct investment, net (% of GDP)
Gross f ixed capital formation (% of GDP)
Gross f ixed private capital formation (% of GDP)
Finance and banking
Government cash surplus or deficit (% of GDP)
Government debt (% of GDP)
Deposit money banks’ assets (% of GDP) Total f inancial system deposits (% of GDP)
Bank capital to asset ratio (%)
Bank nonperforming loans to total gross loans ratio (%)
Domestic credit to the private sector (% of GDP)
Real interest rate (%)
Interest rate spread (percentage points)
Infrastructure
Paved roads (% of total roads)Electr ic power consumption (kWh per capita)
Power outages in a typical month (number)
Mobile cellular subscriptions (per 100 people)
Internet users (per 100 people)
219The Little Data Book on Private Sector Development 2011
High income
Country data
High-incomegroup
2000 2009 2009
United Kingdom
58.9 61.8 1,117
29.3 31.8 547
5.5 7.7 8.1
25,910 41,370 37,9903.4 2.0 2.0
1.0 0.7 1.5
27.3 21.0 25.0
17.4 11.1 15.9
71.7 78.2 73.5
2.9 -0.6
0.7 0.6
27.6 27.7 23.6
29.5 30.0 23.9
.. 4
.. 13 18
.. 6 6
.. 22.0 37.9
.. 1.0 2.1
.. 37.3 38.6
.. 23.1 14.3.. 330.1
.. 8.0
.. ..
.. ..
.. ..
.. ..
.. ..
.. .. ..
8.3 3.4 2.0
17.1 14.6 18.0
.. .. ..
1.6 -10.9 -7.7
47.5 73.2 55.7
128.4 213.1 140.0.. .. 108.5
6.5 5.4 6.8
2.5 3.5 3.4
129.3 213.5 165.1
4.7 -0.7
2.7 .. 3.8
100.0 100.0 93.46,115 6,061 9,518
.. ..
73.8 130.0 111.2
26.8 83.2 72.3
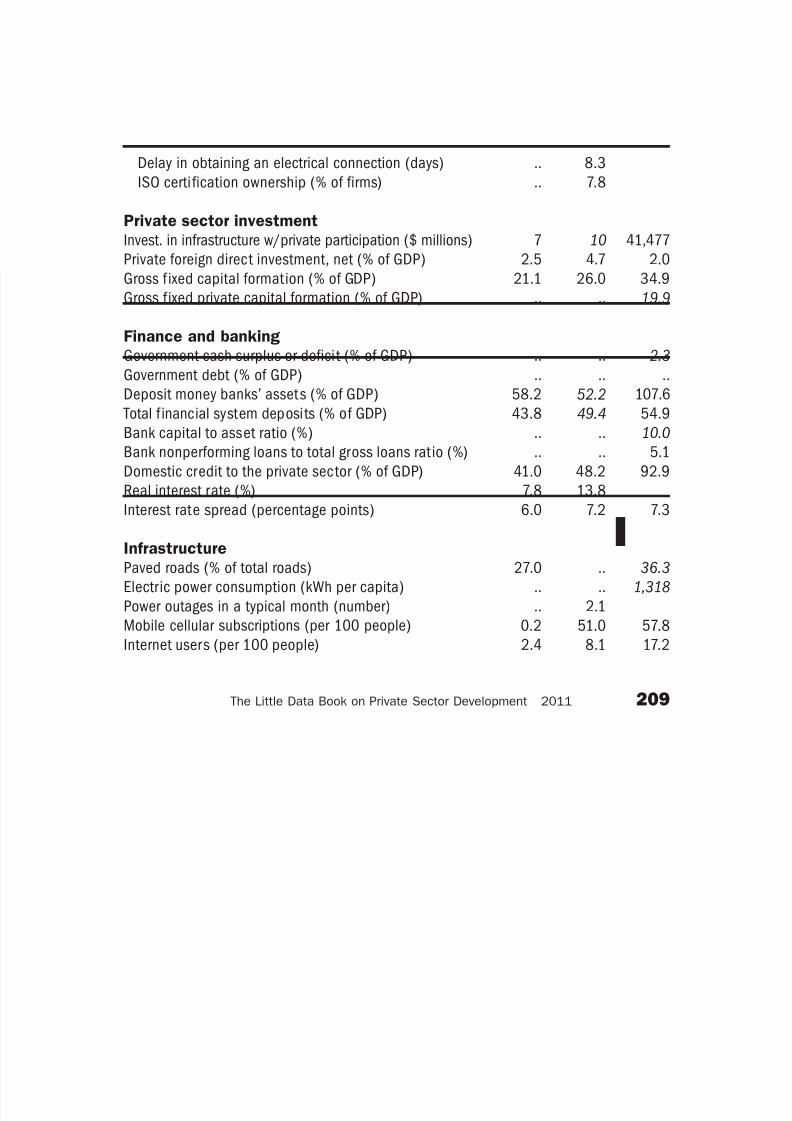
8/6/2019 The Little Data Book on Private Sector Development 2011
http://slidepdf.com/reader/full/the-little-data-book-on-private-sector-development-2011 228/246
Economic and social context
Population (millions)
Labor force (millions)
Unemployment rate (% of labor force)
GNI per capita, World Bank Atlas method ($)GDP growth, 1995–2000 and 2000–09 (average annual %)
Agriculture value added (% of GDP)
Industry value added (% of GDP)
Manufacturing value added (% of GDP)
Services value added (% of GDP)
Inflation (annual % change in consumer price index)
Exchange rate (local currency units per $)
Exports of goods and services (% of GDP)
Imports of goods and services (% of GDP) Investment climate
Ease of doing business index (ranking 1–183; 1 = best)
Time to star t a business (days)
Procedures to start a business (number)
Firing cost (weeks of wages)
Closing a business (years to resolve insolvency)
Total tax rate (% of profit)
Profit tax (% of commercial profits)New businesses registered (thousands)
New business density (new regis. per working-age pop.)
Enterprise surveys
Time dealing with gov’t officials (% of management time)
Firms expected to give gifts in meetings w/tax officials (%)
Firms using banks to finance investments (% of firms)
Delay in obtaining an electrical connection (days)
ISO certif ication ownership (% of firms)
Private sector investment
Invest. in infrastructure w/private participation ($ millions)
Private foreign direct investment, net (% of GDP)
Gross f ixed capital formation (% of GDP)
Gross f ixed private capital formation (% of GDP)
Finance and banking
Government cash surplus or deficit (% of GDP)
Government debt (% of GDP)
Deposit money banks’ assets (% of GDP) Total f inancial system deposits (% of GDP)
Bank capital to asset ratio (%)
Bank nonperforming loans to total gross loans ratio (%)
Domestic credit to the private sector (% of GDP)
Real interest rate (%)
Interest rate spread (percentage points)
Infrastructure
Paved roads (% of total roads)Electr ic power consumption (kWh per capita)
Power outages in a typical month (number)
Mobile cellular subscriptions (per 100 people)
Internet users (per 100 people)
220 2011 The Little Data Book on Private Sector Development
Country data
High-incomegroup
2000 2009 2009
High income
United States
282.2 307.0 1,117
147.9 159.0 547
4.0 9.3 8.1
34,890 46,360 37,9904.4 2.0 2.0
1.2 1.2 1.5
23.4 21.3 25.0
16.7 13.4 15.9
75.4 77.5 73.5
3.4 -0.4
1.0 1.0
11.0 11.2 23.6
14.9 13.9 23.9
.. 5
.. 6 18
.. 6 6
.. .. 37.9
.. 1.5 2.1
.. 46.8 38.6
.. 27.6 14.3.. ..
.. ..
.. ..
.. ..
.. ..
.. ..
.. ..
.. .. ..
3.2 1.0 2.0
20.0 15.1 18.0
.. .. ..
0.5 -10.4 -7.7
32.4 67.1 55.7
57.0 96.5 140.065.1 81.2 108.5
8.5 11.0 6.8
1.1 5.4 3.4
168.4 202.9 165.1
6.9 2.3
.. .. 3.8
.. 67.4 93.413,671 13,654 9,518
.. ..
38.8 97.2 111.2
43.9 78.1 72.3
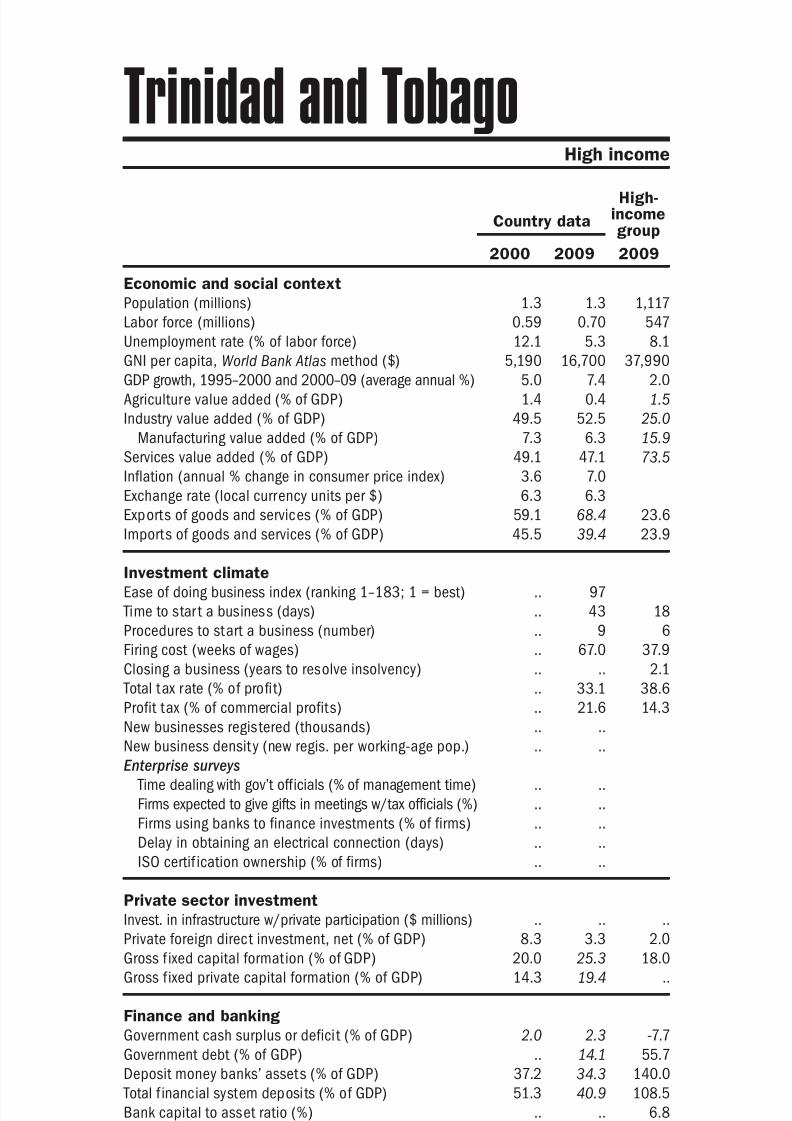
8/6/2019 The Little Data Book on Private Sector Development 2011
http://slidepdf.com/reader/full/the-little-data-book-on-private-sector-development-2011 229/246
Economic and social context
Population (millions)
Labor force (millions)
Unemployment rate (% of labor force)
GNI per capita, World Bank Atlas method ($)GDP growth, 1995–2000 and 2000–09 (average annual %)
Agriculture value added (% of GDP)
Industry value added (% of GDP)
Manufacturing value added (% of GDP)
Services value added (% of GDP)
Inflation (annual % change in consumer price index)
Exchange rate (local currency units per $)
Exports of goods and services (% of GDP)
Imports of goods and services (% of GDP) Investment climate
Ease of doing business index (ranking 1–183; 1 = best)
Time to star t a business (days)
Procedures to start a business (number)
Firing cost (weeks of wages)
Closing a business (years to resolve insolvency)
Total tax rate (% of profit)
Profit tax (% of commercial profits)New businesses registered (thousands)
New business density (new regis. per working-age pop.)
Enterprise surveys
Time dealing with gov’t officials (% of management time)
Firms expected to give gifts in meetings w/tax officials (%)
Firms using banks to finance investments (% of firms)
Delay in obtaining an electrical connection (days)
ISO certi fication ownership (% of firms)
Private sector investment
Invest. in infrastructure w/private participation ($ millions)
Private foreign direct investment, net (% of GDP)
Gross f ixed capital formation (% of GDP)
Gross f ixed private capital formation (% of GDP)
Finance and banking
Government cash surplus or deficit (% of GDP)
Government debt (% of GDP)
Deposit money banks’ assets (% of GDP) Total f inancial system deposits (% of GDP)
Bank capital to asset ratio (%)
Bank nonperforming loans to total gross loans ratio (%)
Domestic credit to the private sector (% of GDP)
Real interest rate (%)
Interest rate spread (percentage points)
Infrastructure
Paved roads (% of total roads)Electr ic power consumption (kWh per capita)
Power outages in a typical month (number)
Mobile cellular subscriptions (per 100 people)
Internet users (per 100 people)
221The Little Data Book on Private Sector Development 2011
Latin America & Caribbean Upper middle income
Country data
Uppermiddle-incomegroup
2000 2009 2009
Uruguay
3.3 3.3 1,002
1.5 1.7 458
13.6 7.3 9.1
7,100 9,010 7,5023.1 3.4 4.4
7.0 9.8 6.2
24.5 25.8 31.5
14.1 15.8 16.7
68.5 64.4 62.4
4.8 7.1
12.1 22.6
16.7 26.5 25.4
20.0 25.5 24.2
.. 124
.. 65 43
.. 11 8
.. 31.0 40.1
.. 2.1 2.9
.. 42.0 43.0
.. 23.6 18.0.. 4.7
.. 2.1
.. 7.0
.. 0.6
.. 6.9
.. 38.6
.. 6.8
681 45 64,899
1.2 4.0 2.4
14.3 19.1 20.7
10.7 13.6 15.6
-3.0 -1.5 -0.6
40.6 49.5 ..
55.6 24.1 60.646.1 35.6 47.4
7.2 8.9 9.7
12.4 1.0 4.2
45.1 20.6 47.8
41.1 8.9
27.8 10.9 5.5
.. .. 36.81,990 2,393 3,001
.. 0.3
12.4 113.7 100.6
10.6 55.5 34.6
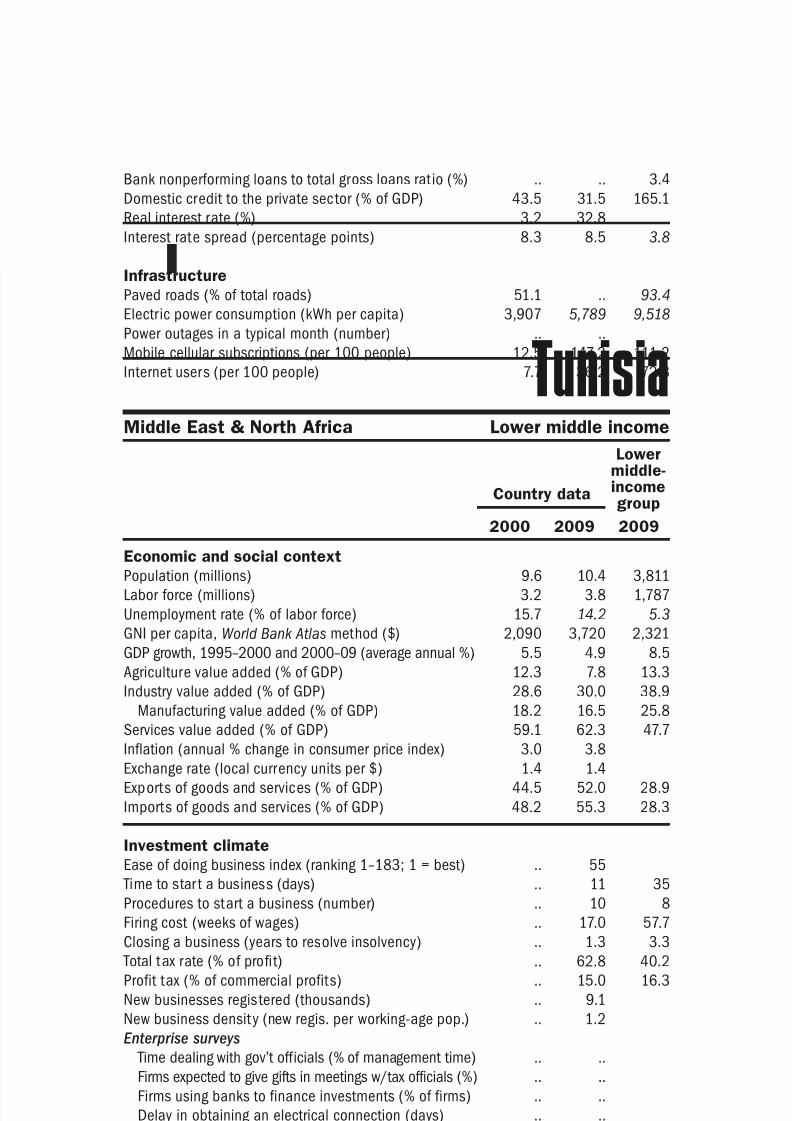
8/6/2019 The Little Data Book on Private Sector Development 2011
http://slidepdf.com/reader/full/the-little-data-book-on-private-sector-development-2011 230/246
Economic and social context
Population (millions)
Labor force (millions)
Unemployment rate (% of labor force)
GNI per capita, World Bank Atlas method ($)GDP growth, 1995–2000 and 2000–09 (average annual %)
Agriculture value added (% of GDP)
Industry value added (% of GDP)
Manufacturing value added (% of GDP)
Services value added (% of GDP)
Inflation (annual % change in consumer price index)
Exchange rate (local currency units per $)
Exports of goods and services (% of GDP)
Imports of goods and services (% of GDP) Investment climate
Ease of doing business index (ranking 1–183; 1 = best)
Time to star t a business (days)
Procedures to start a business (number)
Firing cost (weeks of wages)
Closing a business (years to resolve insolvency)
Total tax rate (% of profit)
Profit tax (% of commercial profits)New businesses registered (thousands)
New business density (new regis. per working-age pop.)
Enterprise surveys
Time dealing with gov’t officials (% of management time)
Firms expected to give gifts in meetings w/tax officials (%)
Firms using banks to finance investments (% of firms)
Delay in obtaining an electrical connection (days)
ISO certif ication ownership (% of firms)
Private sector investment
Invest. in infrastructure w/private participation ($ millions)
Private foreign direct investment, net (% of GDP)
Gross f ixed capital formation (% of GDP)
Gross f ixed private capital formation (% of GDP)
Finance and banking
Government cash surplus or deficit (% of GDP)
Government debt (% of GDP)
Deposit money banks’ assets (% of GDP) Total f inancial system deposits (% of GDP)
Bank capital to asset ratio (%)
Bank nonperforming loans to total gross loans ratio (%)
Domestic credit to the private sector (% of GDP)
Real interest rate (%)
Interest rate spread (percentage points)
Infrastructure
Paved roads (% of total roads)Electr ic power consumption (kWh per capita)
Power outages in a typical month (number)
Mobile cellular subscriptions (per 100 people)
Internet users (per 100 people)
222 2011 The Little Data Book on Private Sector Development
Country data
Lowermiddle-incomegroup
2000 2009 2009
Europe & Central Asia Lower middle income
Uzbekistan
24.7 27.8 3,811
9.1 12.7 1,787
.. .. 5.3
630 1,100 2,3214.1 6.9 8.5
34.4 19.5 13.3
23.1 33.2 38.9
9.4 13.3 25.8
42.5 47.3 47.7
.. ..
236.6 ..
24.6 36.4 28.9
21.5 36.4 28.3
.. 150
.. 15 35
.. 7 8
.. 22.0 57.7
.. 4.0 3.3
.. 95.6 40.2
.. 1.6 16.3.. 14.4
.. 0.8
5.3 11.1
52.7 52.4
1.3 8.2
7.6 28.0
14.8 1.3
26 167 41,477
0.5 2.3 2.0
24.0 26.1 34.9
15.5 23.0 19.9
.. .. -2.3
.. .. ..
.. .. 107.6
.. .. 54.9
.. .. 10.0
.. .. 5.1
.. .. 92.9
.. ..
.. .. 7.3
87.3 .. 36.31,780 1,646 1,318
.. 6.1
0.2 59.1 57.8
0.5 16.9 17.2
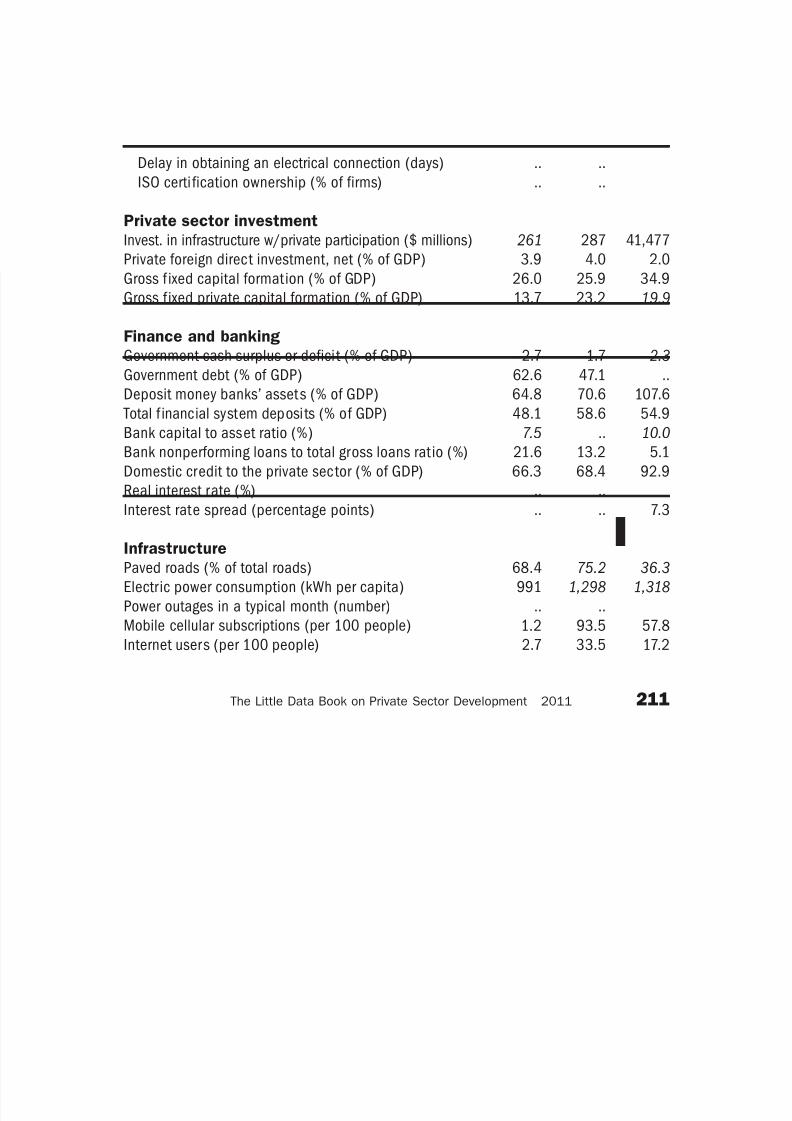
8/6/2019 The Little Data Book on Private Sector Development 2011
http://slidepdf.com/reader/full/the-little-data-book-on-private-sector-development-2011 231/246
Economic and social context
Population (millions)
Labor force (millions)
Unemployment rate (% of labor force)
GNI per capita, World Bank Atlas method ($)GDP growth, 1995–2000 and 2000–09 (average annual %)
Agriculture value added (% of GDP)
Industry value added (% of GDP)
Manufacturing value added (% of GDP)
Services value added (% of GDP)
Inflation (annual % change in consumer price index)
Exchange rate (local currency units per $)
Exports of goods and services (% of GDP)
Imports of goods and services (% of GDP) Investment climate
Ease of doing business index (ranking 1–183; 1 = best)
Time to star t a business (days)
Procedures to start a business (number)
Firing cost (weeks of wages)
Closing a business (years to resolve insolvency)
Total tax rate (% of profit)
Profit tax (% of commercial profits)New businesses registered (thousands)
New business density (new regis. per working-age pop.)
Enterprise surveys
Time dealing with gov’t officials (% of management time)
Firms expected to give gifts in meetings w/tax officials (%)
Firms using banks to finance investments (% of firms)
Delay in obtaining an electrical connection (days)
ISO certi fication ownership (% of firms)
Private sector investment
Invest. in infrastructure w/private participation ($ millions)
Private foreign direct investment, net (% of GDP)
Gross f ixed capital formation (% of GDP)
Gross f ixed private capital formation (% of GDP)
Finance and banking
Government cash surplus or deficit (% of GDP)
Government debt (% of GDP)
Deposit money banks’ assets (% of GDP) Total f inancial system deposits (% of GDP)
Bank capital to asset ratio (%)
Bank nonperforming loans to total gross loans ratio (%)
Domestic credit to the private sector (% of GDP)
Real interest rate (%)
Interest rate spread (percentage points)
Infrastructure
Paved roads (% of total roads)Electr ic power consumption (kWh per capita)
Power outages in a typical month (number)
Mobile cellular subscriptions (per 100 people)
Internet users (per 100 people)
223The Little Data Book on Private Sector Development 2011
East Asia & Pacific Lower middle income
Country data
Lowermiddle-incomegroup
2000 2009 2009
Vanuatu
0.19 0.24 3,811
0.09 0.12 1,787
.. .. 5.3
1,440 2,620 2,3213.5 4.0 8.5
25.3 21.6 13.3
12.3 10.1 38.9
5.0 4.4 25.8
62.4 68.3 47.7
2.5 4.3
137.6 106.7
38.0 42.6 28.9
46.5 55.4 28.3
.. 60
.. 39 35
.. 8 8
.. 56.0 57.7
.. 2.6 3.3
.. 8.4 40.2
.. 0.0 16.3.. 0.3
.. 2.2
.. 7.9
.. 4.6
.. 41.4
.. 15.3
.. 27.0
6 35 41,477
7.2 5.3 2.0
18.6 22.6 34.9
.. .. 19.9
-0.7 .. -2.3
26.4 .. ..
38.8 52.4 107.694.3 109.9 54.9
.. .. 10.0
.. .. 5.1
30.6 60.4 92.9
7.5 1.3
8.6 4.3 7.3
23.9 .. 36.3.. .. 1,318
.. 2.3
0.2 52.7 57.8
2.1 7.1 17.2
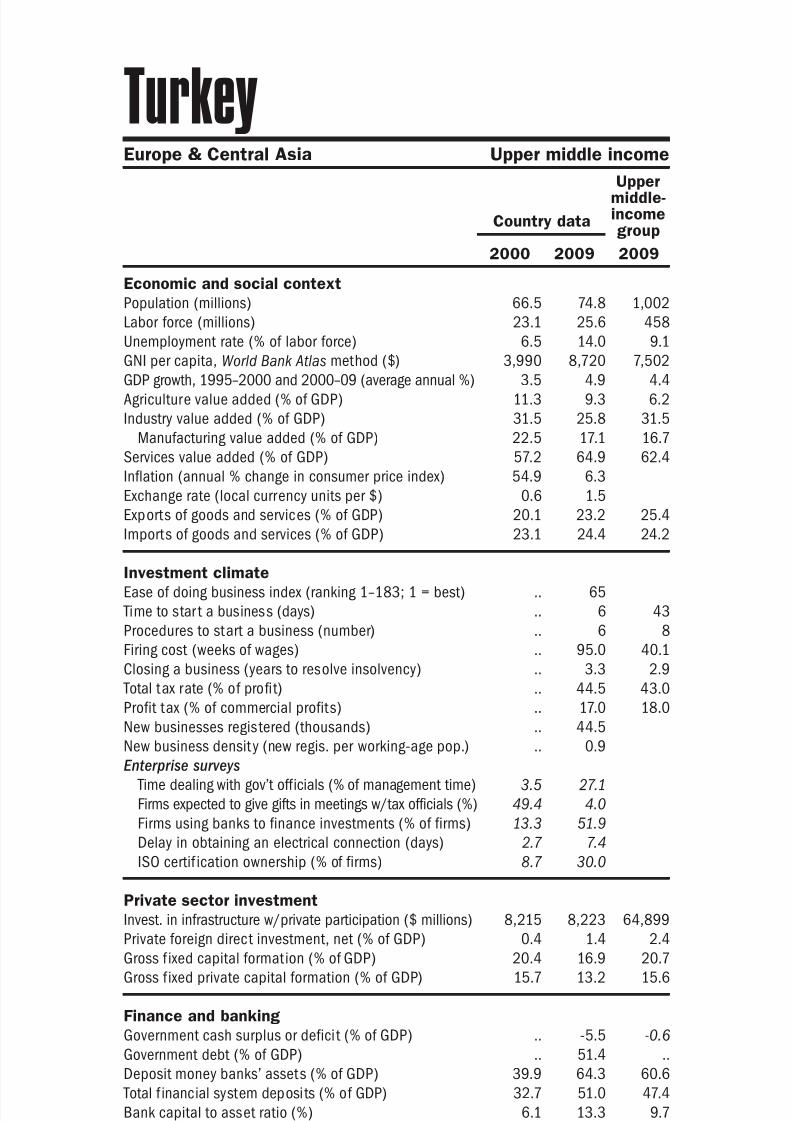
8/6/2019 The Little Data Book on Private Sector Development 2011
http://slidepdf.com/reader/full/the-little-data-book-on-private-sector-development-2011 232/246
Economic and social context
Population (millions)
Labor force (millions)
Unemployment rate (% of labor force)
GNI per capita, World Bank Atlas method ($)GDP growth, 1995–2000 and 2000–09 (average annual %)
Agriculture value added (% of GDP)
Industry value added (% of GDP)
Manufacturing value added (% of GDP)
Services value added (% of GDP)
Inflation (annual % change in consumer price index)
Exchange rate (local currency units per $)
Exports of goods and services (% of GDP)
Imports of goods and services (% of GDP) Investment climate
Ease of doing business index (ranking 1–183; 1 = best)
Time to star t a business (days)
Procedures to start a business (number)
Firing cost (weeks of wages)
Closing a business (years to resolve insolvency)
Total tax rate (% of profit)
Profit tax (% of commercial profits)New businesses registered (thousands)
New business density (new regis. per working-age pop.)
Enterprise surveys
Time dealing with gov’t officials (% of management time)
Firms expected to give gifts in meetings w/tax officials (%)
Firms using banks to finance investments (% of firms)
Delay in obtaining an electrical connection (days)
ISO certif ication ownership (% of firms)
Private sector investment
Invest. in infrastructure w/private participation ($ millions)
Private foreign direct investment, net (% of GDP)
Gross f ixed capital formation (% of GDP)
Gross f ixed private capital formation (% of GDP)
Finance and banking
Government cash surplus or deficit (% of GDP)
Government debt (% of GDP)
Deposit money banks’ assets (% of GDP) Total f inancial system deposits (% of GDP)
Bank capital to asset ratio (%)
Bank nonperforming loans to total gross loans ratio (%)
Domestic credit to the private sector (% of GDP)
Real interest rate (%)
Interest rate spread (percentage points)
Infrastructure
Paved roads (% of total roads)Electr ic power consumption (kWh per capita)
Power outages in a typical month (number)
Mobile cellular subscriptions (per 100 people)
Internet users (per 100 people)
224 2011 The Little Data Book on Private Sector Development
Latin America & Caribbean Upper middle income
Country data
Uppermiddle-incomegroup
2000 2009 2009
Venezuela, RB
24.3 28.4 1,002
10.1 13.1 458
13.2 7.6 9.1
4,100 10,090 7,5020.6 4.9 4.4
4.2 4.0 6.2
49.7 57.8 31.5
19.8 16.4 16.7
46.1 38.2 62.4
16.2 28.6
0.7 2.1
29.7 18.3 25.4
18.1 20.5 24.2
.. 172
.. 141 43
.. 17 8
.. ..a 40.1
.. 4.0 2.9
.. 52.6 43.0
.. 10.0 18.0.. ..
.. ..
.. 33.6
.. 2.6
.. 35.7
.. 25.4
.. 12.5
774 546 64,899
4.0 -1.0 2.4
21.0 22.1 20.7
.. 9.6 15.6
-1.2 2.2 -0.6
.. .. ..
13.8 28.2 60.616.6 30.9 47.4
13.0 9.4 9.7
6.6 3.0 4.2
12.5 21.7 47.8
-3.3 10.6
8.9 3.5 5.5
33.6 .. 36.82,655 3,074 3,001
.. 2.4
22.4 99.1 100.6
3.4 31.2 34.6
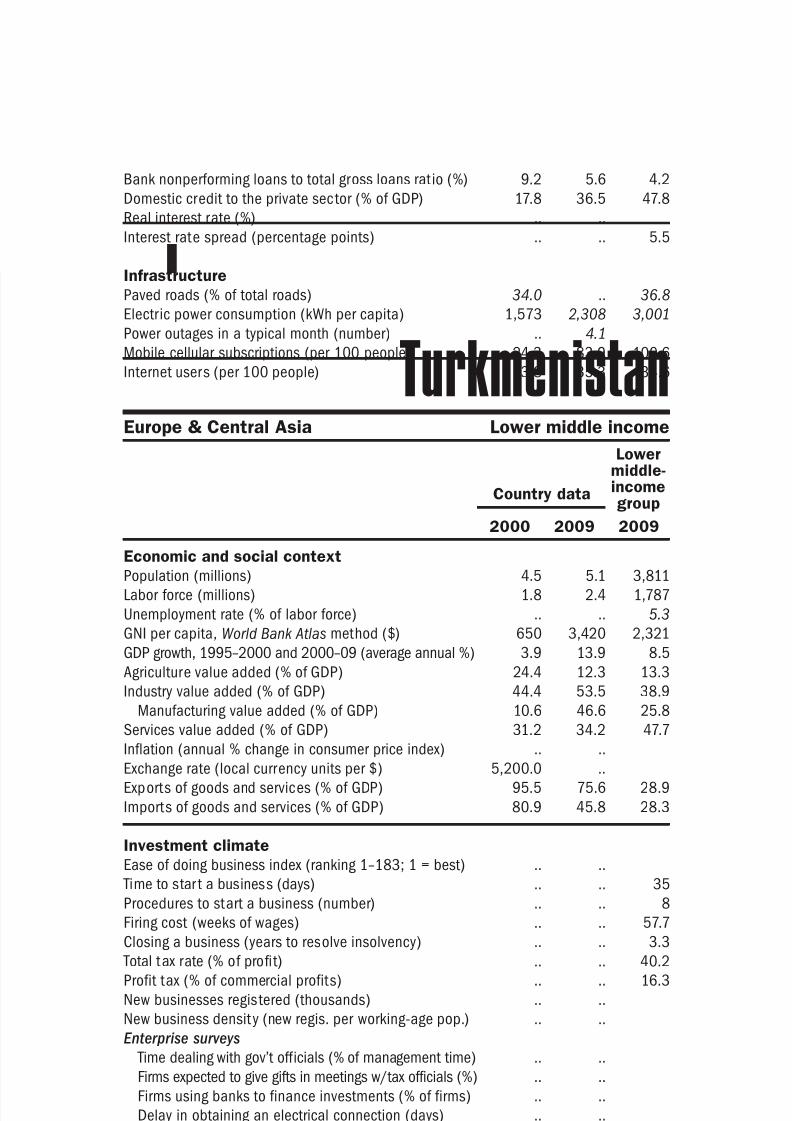
8/6/2019 The Little Data Book on Private Sector Development 2011
http://slidepdf.com/reader/full/the-little-data-book-on-private-sector-development-2011 233/246
Economic and social context
Population (millions)
Labor force (millions)
Unemployment rate (% of labor force)
GNI per capita, World Bank Atlas method ($)GDP growth, 1995–2000 and 2000–09 (average annual %)
Agriculture value added (% of GDP)
Industry value added (% of GDP)
Manufacturing value added (% of GDP)
Services value added (% of GDP)
Inflation (annual % change in consumer price index)
Exchange rate (local currency units per $)
Exports of goods and services (% of GDP)
Imports of goods and services (% of GDP) Investment climate
Ease of doing business index (ranking 1–183; 1 = best)
Time to star t a business (days)
Procedures to start a business (number)
Firing cost (weeks of wages)
Closing a business (years to resolve insolvency)
Total tax rate (% of profit)
Profit tax (% of commercial profits)New businesses registered (thousands)
New business density (new regis. per working-age pop.)
Enterprise surveys
Time dealing with gov’t officials (% of management time)
Firms expected to give gifts in meetings w/tax officials (%)
Firms using banks to finance investments (% of firms)
Delay in obtaining an electrical connection (days)
ISO certi fication ownership (% of firms)
Private sector investment
Invest. in infrastructure w/private participation ($ millions)
Private foreign direct investment, net (% of GDP)
Gross f ixed capital formation (% of GDP)
Gross f ixed private capital formation (% of GDP)
Finance and banking
Government cash surplus or deficit (% of GDP)
Government debt (% of GDP)
Deposit money banks’ assets (% of GDP) Total f inancial system deposits (% of GDP)
Bank capital to asset ratio (%)
Bank nonperforming loans to total gross loans ratio (%)
Domestic credit to the private sector (% of GDP)
Real interest rate (%)
Interest rate spread (percentage points)
Infrastructure
Paved roads (% of total roads)Electr ic power consumption (kWh per capita)
Power outages in a typical month (number)
Mobile cellular subscriptions (per 100 people)
Internet users (per 100 people)
225The Little Data Book on Private Sector Development 2011
East Asia & Pacific Lower middle income
Vietnam
Country data
Lowermiddle-incomegroup
2000 2009 2009
77.6 87.3 3,811
37.9 46.6 1,787
2.3 2.4 5.3
390 1,000 2,3216.7 7.6 8.5
24.5 20.9 13.3
36.7 40.2 38.9
18.6 20.1 25.8
38.7 38.8 47.7
-1.7 7.1
14,167.8 17,065.1
55.0 68.3 28.9
57.5 78.7 28.3
.. 78
.. 44 35
.. 9 8
.. 87.0 57.7
.. 5.0 3.3
.. 33.1 40.2
.. 12.5 16.3.. ..
.. ..
.. 4.9
.. 33.7
.. 21.5
.. 29.6
.. 16.7
150 477 41,477
4.2 7.8 2.0
27.6 34.5 34.9
.. .. 19.9
.. .. -2.3
.. .. ..
37.1 122.2 107.68.8 16.4 54.9
.. .. 10.0
.. .. 5.1
35.3 112.7 92.9
6.9 3.8
6.9 3.1 7.3
25.1 47.6 36.3295 799 1,318
.. 2.0
1.0 101.5 57.8
0.3 27.5 17.2
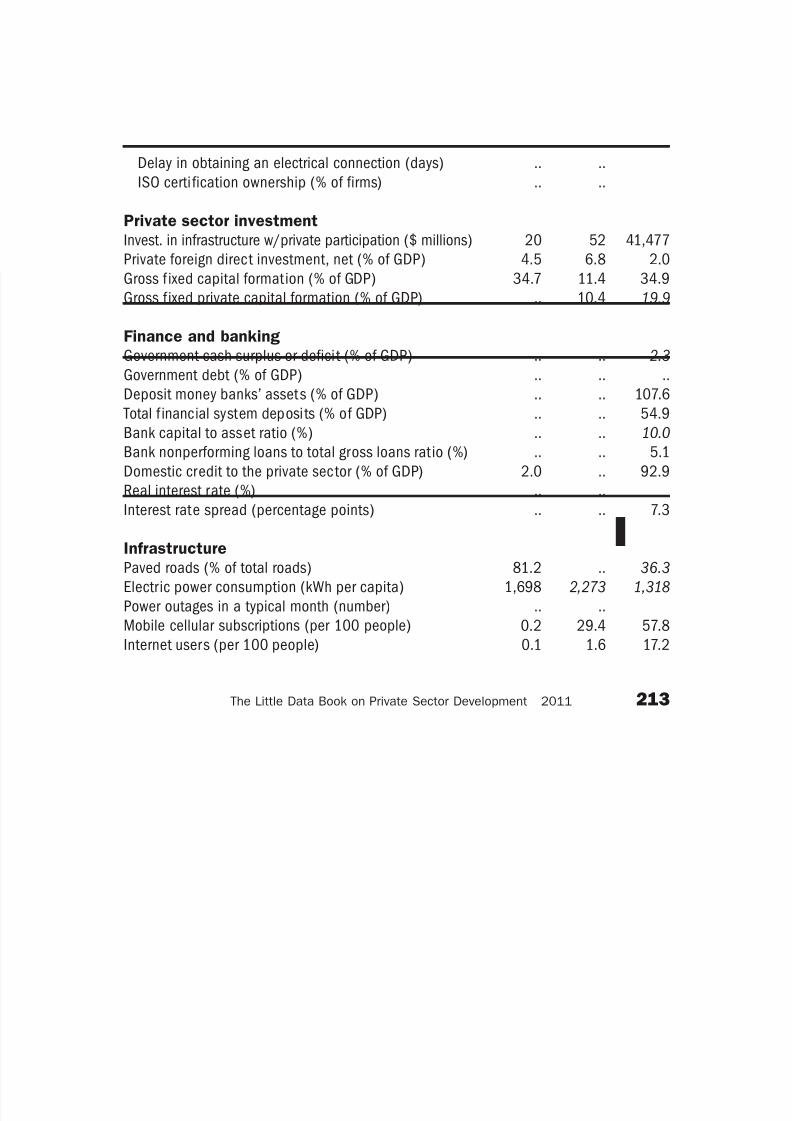
8/6/2019 The Little Data Book on Private Sector Development 2011
http://slidepdf.com/reader/full/the-little-data-book-on-private-sector-development-2011 234/246
Economic and social context
Population (millions)
Labor force (millions)
Unemployment rate (% of labor force)
GNI per capita, World Bank Atlas method ($)GDP growth, 1995–2000 and 2000–09 (average annual %)
Agriculture value added (% of GDP)
Industry value added (% of GDP)
Manufacturing value added (% of GDP)
Services value added (% of GDP)
Inflation (annual % change in consumer price index)
Exchange rate (local currency units per $)
Exports of goods and services (% of GDP)
Imports of goods and services (% of GDP) Investment climate
Ease of doing business index (ranking 1–183; 1 = best)
Time to star t a business (days)
Procedures to start a business (number)
Firing cost (weeks of wages)
Closing a business (years to resolve insolvency)
Total tax rate (% of profit)
Profit tax (% of commercial profits)New businesses registered (thousands)
New business density (new regis. per working-age pop.)
Enterprise surveys
Time dealing with gov’t officials (% of management time)
Firms expected to give gifts in meetings w/tax officials (%)
Firms using banks to finance investments (% of firms)
Delay in obtaining an electrical connection (days)
ISO certif ication ownership (% of firms)
Private sector investment
Invest. in infrastructure w/private participation ($ millions)
Private foreign direct investment, net (% of GDP)
Gross f ixed capital formation (% of GDP)
Gross f ixed private capital formation (% of GDP)
Finance and banking
Government cash surplus or deficit (% of GDP)
Government debt (% of GDP)
Deposit money banks’ assets (% of GDP) Total f inancial system deposits (% of GDP)
Bank capital to asset ratio (%)
Bank nonperforming loans to total gross loans ratio (%)
Domestic credit to the private sector (% of GDP)
Real interest rate (%)
Interest rate spread (percentage points)
Infrastructure
Paved roads (% of total roads)Electr ic power consumption (kWh per capita)
Power outages in a typical month (number)
Mobile cellular subscriptions (per 100 people)
Internet users (per 100 people)
226 2011 The Little Data Book on Private Sector Development
Country data
High-incomegroup
2000 2009 2009
High income
Virgin Islands (U.S.)
0.11 0.11 1,117
0.05 0.05 547
.. .. 8.1
.. .. 37,990
.. .. 2.0
.. .. 1.5
.. .. 25.0
.. .. 15.9
.. .. 73.5
.. ..
1.0 1.0
.. .. 23.6
.. .. 23.9
.. ..
.. .. 18
.. .. 6
.. .. 37.9
.. .. 2.1
.. .. 38.6
.. .. 14.3.. ..
.. ..
.. ..
.. ..
.. ..
.. ..
.. ..
.. .. ..
.. .. 2.0
.. .. 18.0
.. .. ..
.. .. -7.7
.. .. 55.7
.. .. 140.0
.. .. 108.5
.. .. 6.8
.. .. 3.4
.. .. 165.1
.. ..
.. .. 3.8
.. .. 93.4
.. .. 9,518
.. ..
32.2 73.3 111.2
13.8 27.3 72.3
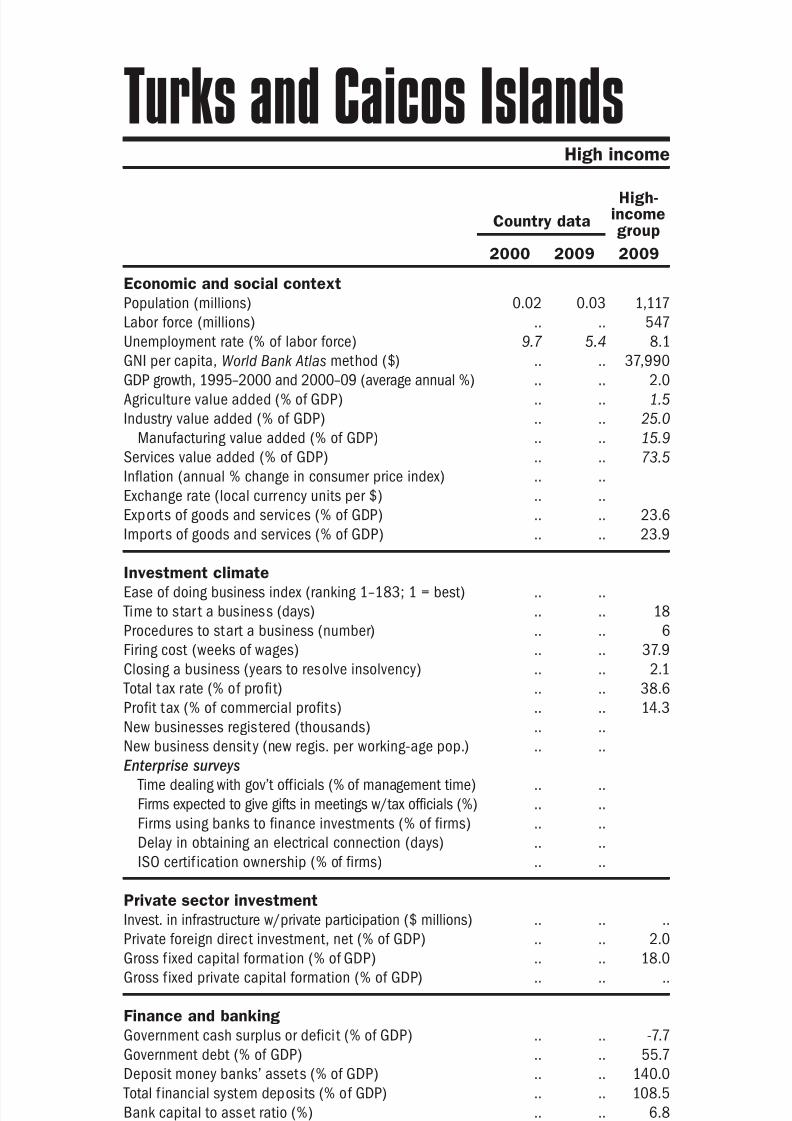
8/6/2019 The Little Data Book on Private Sector Development 2011
http://slidepdf.com/reader/full/the-little-data-book-on-private-sector-development-2011 235/246
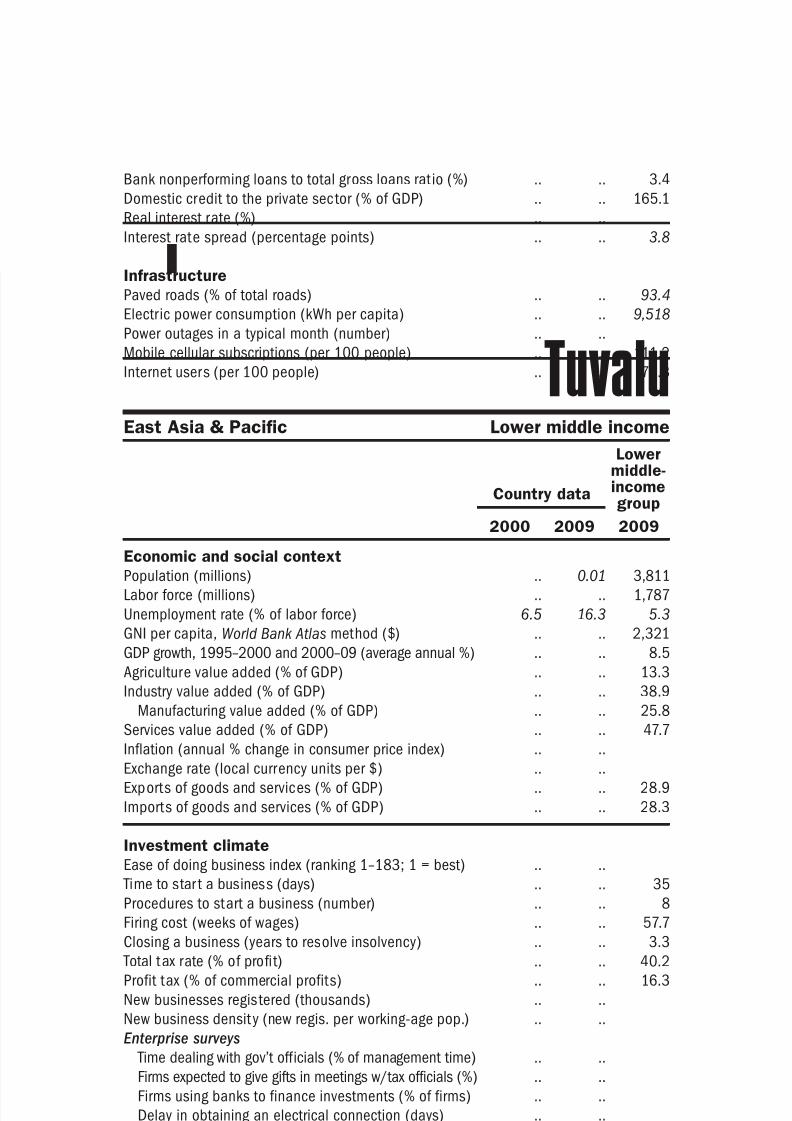
8/6/2019 The Little Data Book on Private Sector Development 2011
http://slidepdf.com/reader/full/the-little-data-book-on-private-sector-development-2011 236/246
Economic and social context
Population (millions)
Labor force (millions)
Unemployment rate (% of labor force)
GNI per capita, World Bank Atlas method ($)GDP growth, 1995–2000 and 2000–09 (average annual %)
Agriculture value added (% of GDP)
Industry value added (% of GDP)
Manufacturing value added (% of GDP)
Services value added (% of GDP)
Inflation (annual % change in consumer price index)
Exchange rate (local currency units per $)
Exports of goods and services (% of GDP)
Imports of goods and services (% of GDP) Investment climate
Ease of doing business index (ranking 1–183; 1 = best)
Time to star t a business (days)
Procedures to start a business (number)
Firing cost (weeks of wages)
Closing a business (years to resolve insolvency)
Total tax rate (% of profit)
Profit tax (% of commercial profits)New businesses registered (thousands)
New business density (new regis. per working-age pop.)
Enterprise surveys
Time dealing with gov’t officials (% of management time)
Firms expected to give gifts in meetings w/tax officials (%)
Firms using banks to finance investments (% of firms)
Delay in obtaining an electrical connection (days)
ISO certif ication ownership (% of firms)
Private sector investment
Invest. in infrastructure w/private participation ($ millions)
Private foreign direct investment, net (% of GDP)
Gross f ixed capital formation (% of GDP)
Gross f ixed private capital formation (% of GDP)
Finance and banking
Government cash surplus or deficit (% of GDP)
Government debt (% of GDP)
Deposit money banks’ assets (% of GDP) Total f inancial system deposits (% of GDP)
Bank capital to asset ratio (%)
Bank nonperforming loans to total gross loans ratio (%)
Domestic credit to the private sector (% of GDP)
Real interest rate (%)
Interest rate spread (percentage points)
Infrastructure
Paved roads (% of total roads)Electr ic power consumption (kWh per capita)
Power outages in a typical month (number)
Mobile cellular subscriptions (per 100 people)
Internet users (per 100 people)
228 2011 The Little Data Book on Private Sector Development
Country data
Lowermiddle-incomegroup
2000 2009 2009
Middle East & North Africa Lower middle income
Yemen, Rep.
18.2 23.6 3,811
4.3 6.2 1,787
11.5 15.0 5.3
400 1,060 2,3215.6 3.9 8.5
10.3 14.3 13.3
46.5 40.3 38.9
5.2 4.7 25.8
43.2 45.4 47.7
4.6 3.7
161.7 202.8
42.3 38.0 28.9
36.6 41.4 28.3
.. 105
.. 12 35
.. 6 8
.. 17.0 57.7
.. 3.0 3.3
.. 47.8 40.2
.. 35.1 16.3.. ..
.. ..
.. 11.8
.. 66.7
.. 4.2
.. 68.2
.. 4.4
20 50 41,477
0.1 0.5 2.0
18.6 23.1 34.9
13.2 13.4 19.9
-2.3 .. -2.3
.. .. ..
7.9 15.5 107.613.9 21.1 54.9
.. .. 10.0
.. .. 5.1
5.0 7.4 92.9
-4.9 23.1
5.5 7.3 7.3
.. 8.7 36.3136 220 1,318
.. 54.4
0.2 16.3 57.8
0.1 1.8 17.2

8/6/2019 The Little Data Book on Private Sector Development 2011
http://slidepdf.com/reader/full/the-little-data-book-on-private-sector-development-2011 237/246
Economic and social context
Population (millions)
Labor force (millions)
Unemployment rate (% of labor force)
GNI per capita, World Bank Atlas method ($)GDP growth, 1995–2000 and 2000–09 (average annual %)
Agriculture value added (% of GDP)
Industry value added (% of GDP)
Manufacturing value added (% of GDP)
Services value added (% of GDP)
Inflation (annual % change in consumer price index)
Exchange rate (local currency units per $)
Exports of goods and services (% of GDP)
Imports of goods and services (% of GDP) Investment climate
Ease of doing business index (ranking 1–183; 1 = best)
Time to star t a business (days)
Procedures to start a business (number)
Firing cost (weeks of wages)
Closing a business (years to resolve insolvency)
Total tax rate (% of profit)
Profit tax (% of commercial profits)New businesses registered (thousands)
New business density (new regis. per working-age pop.)
Enterprise surveys
Time dealing with gov’t officials (% of management time)
Firms expected to give gifts in meetings w/tax officials (%)
Firms using banks to finance investments (% of firms)
Delay in obtaining an electrical connection (days)
ISO certi fication ownership (% of firms)
Private sector investment
Invest. in infrastructure w/private participation ($ millions)
Private foreign direct investment, net (% of GDP)
Gross f ixed capital formation (% of GDP)
Gross f ixed private capital formation (% of GDP)
Finance and banking
Government cash surplus or deficit (% of GDP)
Government debt (% of GDP)
Deposit money banks’ assets (% of GDP) Total f inancial system deposits (% of GDP)
Bank capital to asset ratio (%)
Bank nonperforming loans to total gross loans ratio (%)
Domestic credit to the private sector (% of GDP)
Real interest rate (%)
Interest rate spread (percentage points)
Infrastructure
Paved roads (% of total roads)Electr ic power consumption (kWh per capita)
Power outages in a typical month (number)
Mobile cellular subscriptions (per 100 people)
Internet users (per 100 people)
229The Little Data Book on Private Sector Development 2011
ZambiaSub-Saharan Africa Low income
Country data
Low-incomegroup
2000 2009 2009
10.5 12.9 846
4.0 4.8 384
12.9 .. ..
300 960 5092.2 5.4 5.4
22.3 21.6 26.1
25.3 34.1 24.4
11.4 9.6 12.4
52.4 44.3 49.5
26.0 13.4
3,110.8 5,046.1
27.1 35.6 23.2
41.5 32.2 35.9
.. 76
.. 18 41
.. 6 8
.. 178.0 71.0
.. 2.7 3.7
.. 16.1 76.5
.. 1.7 24.8.. 5.5
.. 0.9
13.0 4.6
.. 4.9
25.4 10.2
142.4 97.0
5.8 17.2
27 114 4,779
3.8 5.5 2.7
16.0 22.1 22.9
6.0 17.8 15.8
1.8 -0.8 -1.4
176.2 .. ..
14.5 16.8 31.821.0 19.0 30.6
.. .. ..
23.6 .. ..
8.6 12.0 26.3
6.7 8.3
18.6 15.0 11.5
22.0 .. 12.0595 602 231
.. 3.6
0.9 34.1 26.6
0.2 6.3 2.7
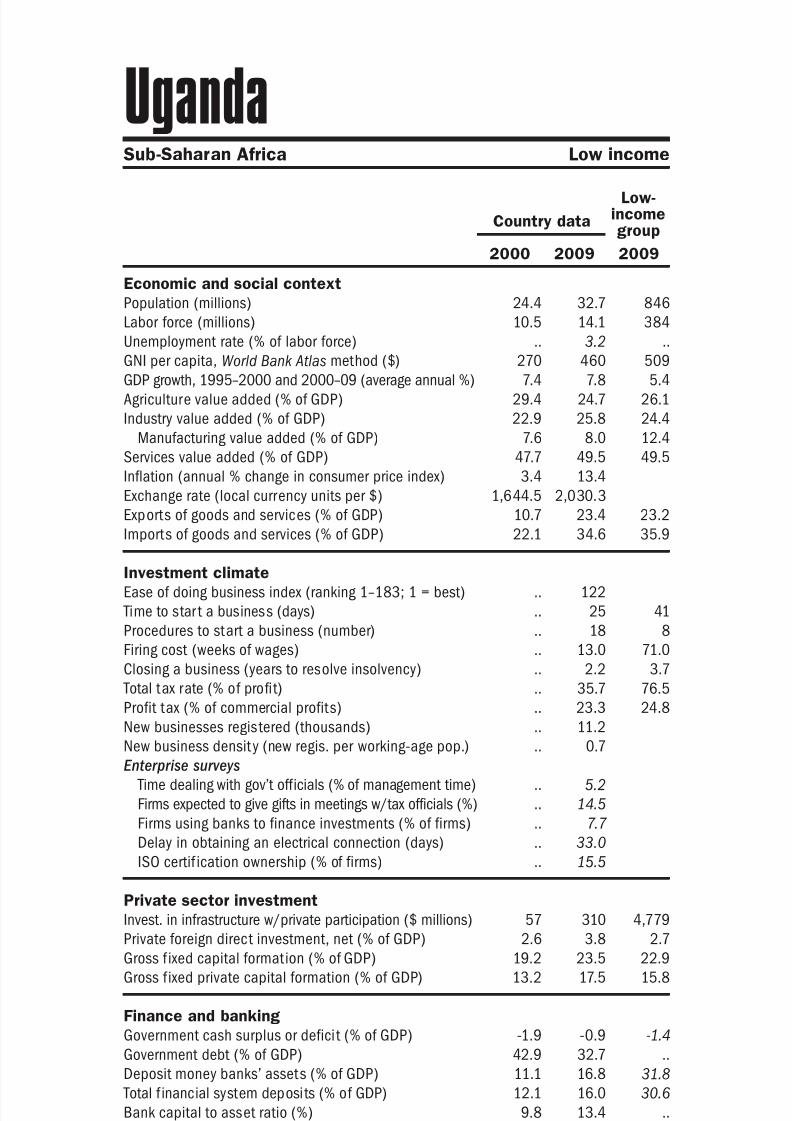
8/6/2019 The Little Data Book on Private Sector Development 2011
http://slidepdf.com/reader/full/the-little-data-book-on-private-sector-development-2011 238/246
Economic and social context
Population (millions)
Labor force (millions)
Unemployment rate (% of labor force)
GNI per capita, World Bank Atlas method ($)GDP growth, 1995–2000 and 2000–09 (average annual %)
Agriculture value added (% of GDP)
Industry value added (% of GDP)
Manufacturing value added (% of GDP)
Services value added (% of GDP)
Inflation (annual % change in consumer price index)
Exchange rate (local currency units per $)
Exports of goods and services (% of GDP)
Imports of goods and services (% of GDP) Investment climate
Ease of doing business index (ranking 1–183; 1 = best)
Time to star t a business (days)
Procedures to start a business (number)
Firing cost (weeks of wages)
Closing a business (years to resolve insolvency)
Total tax rate (% of profit)
Profit tax (% of commercial profits)New businesses registered (thousands)
New business density (new regis. per working-age pop.)
Enterprise surveys
Time dealing with gov’t officials (% of management time)
Firms expected to give gifts in meetings w/tax officials (%)
Firms using banks to finance investments (% of firms)
Delay in obtaining an electrical connection (days)
ISO certif ication ownership (% of firms)
Private sector investment
Invest. in infrastructure w/private participation ($ millions)
Private foreign direct investment, net (% of GDP)
Gross f ixed capital formation (% of GDP)
Gross f ixed private capital formation (% of GDP)
Finance and banking
Government cash surplus or deficit (% of GDP)
Government debt (% of GDP)
Deposit money banks’ assets (% of GDP) Total f inancial system deposits (% of GDP)
Bank capital to asset ratio (%)
Bank nonperforming loans to total gross loans ratio (%)
Domestic credit to the private sector (% of GDP)
Real interest rate (%)
Interest rate spread (percentage points)
Infrastructure
Paved roads (% of total roads)Electr ic power consumption (kWh per capita)
Power outages in a typical month (number)
Mobile cellular subscriptions (per 100 people)
Internet users (per 100 people)
230 2011 The Little Data Book on Private Sector Development
Country data
Low-incomegroup
2000 2009 2009
Sub-Saharan Africa Low income
Zimbabwe
12.5 12.5 846
5.1 5.0 384
6.0 4.2 ..
480 360 5091.5 -7.5 5.4
18.5 17.9 26.1
25.0 29.0 24.4
15.8 17.0 12.4
56.5 53.0 49.5
55.9 24,411.0
0.0 ..
38.6 36.3 23.2
36.4 65.4 35.9
.. 157
.. 90 41
.. 9 8
.. 446.0 71.0
.. 3.3 3.7
.. 40.3 76.5
.. 24.0 24.8.. ..
.. ..
.. ..
.. ..
.. ..
.. ..
.. ..
8 200 4,779
0.4 1.1 2.7
11.8 2.5 22.9
11.1 1.7 15.8
-5.2 .. -1.4
57.4 .. ..
30.7 28.4 31.834.3 42.1 30.6
9.4 .. ..
19.6 .. ..
27.5 46.5 26.3
67.8 578.2
18.0 457.5 11.5
19.0 .. 12.0856 1,022 231
.. ..
2.1 23.9 26.6
0.4 11.4 2.7
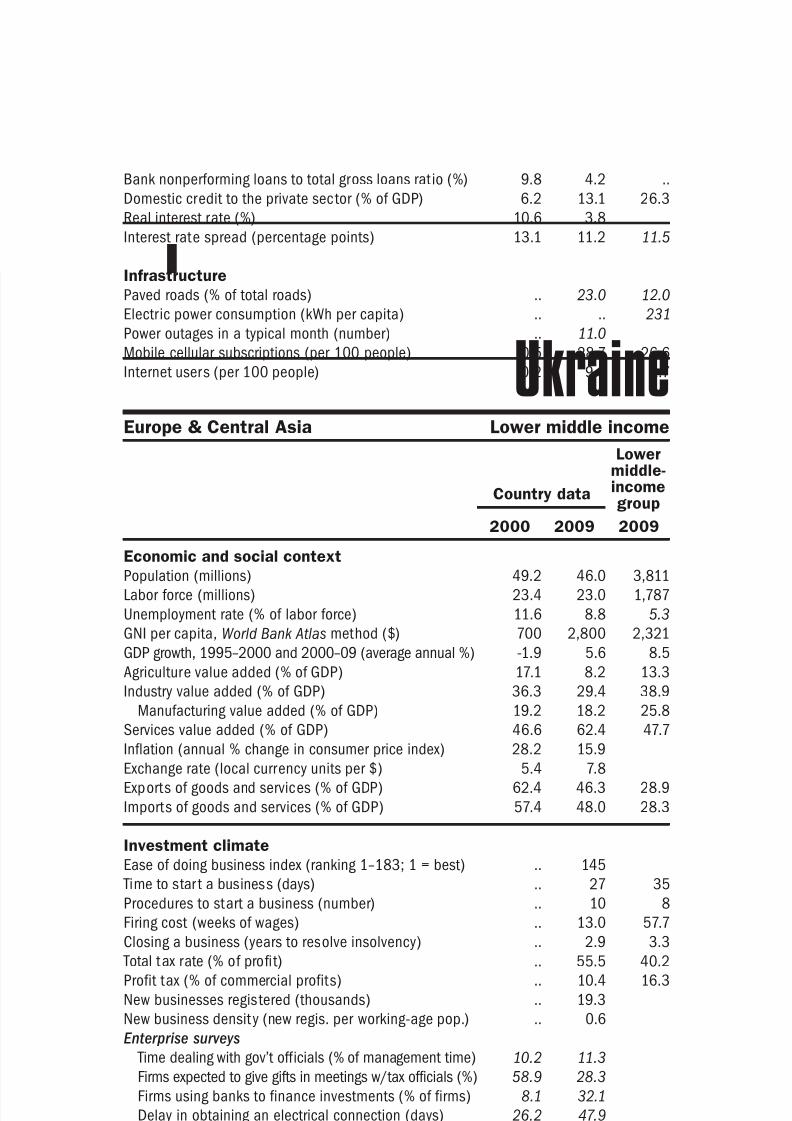
8/6/2019 The Little Data Book on Private Sector Development 2011
http://slidepdf.com/reader/full/the-little-data-book-on-private-sector-development-2011 239/246
231The Little Data Book on Private Sector Development 2011
Agriculture value added is the net output of agriculture (International
Standard Industrial Classification divisions 1–5, including forestry and fish-
ing) after totaling outputs and subtracting intermediate inputs. (World Bank
and Organisation for Economic Co-operation and Development)
Bank capital to asset ratio is the ratio of bank capital and reserves to total
assets. Capital and reserves include funds contributed by owners, retained
earnings, general and special reserves, provisions, and valuation adjust-
ments. Capital includes tier 1 capital (paid-up shares and common stock),
which is a common feature in all countries’ banking systems, and total
regulatory capital, which includes several specified types of subordinated
debt instruments that need not be repaid if the funds are required to maintain
minimum capital levels (these comprise tier 2 and tier 3 capital). Total assets
include all nonfinancial and financial assets. (International Monetary Fund)
Bank nonperforming loans to total gross loans ratio is the value of non-
performing loans divided by the total value of the loan portfolio (including
nonperforming loans before the deduction of specific loan loss provisions).
The loan amount recorded as nonperforming should be the gross value of the
loan as recorded on the balance sheet, not just the amount that is overdue.
(International Monetary Fund)
Closing a business is the number of years from the time of filing for insolvency
in court until resolution of distressed assets. Data listed for 2009 are for
June 2010. (World Bank)
Delay in obtaining an electrical connection is the average wait, in days, to
obtain an electrical connection from the day an establishment applies for it
to the day it receives the service. (World Bank)
Deposit money banks’ assets are claims on the domestic real nonfinancial
sector by deposit money banks. (International Monetary Fund)
Domestic credit to the private sector is financial resources provided to the
private sector—such as through loans, purchases of nonequity securities,
and trade credits and other accounts receivable—that establish a claim
for repayment. For some countries these claims include credit to public
enterprises. (International Monetary Fund, World Bank, and Organisation
for Economic Co-operation and Development)
Ease of doing business index ranks economies from 1 to 183, with 1 being
the best. A high ranking means that a country’s regulatory environment is
conducive to business operation. The index ranks the simple average of a
country’s percentile rankings on 10 topics covered in Doing Business 2011.
Glossary

8/6/2019 The Little Data Book on Private Sector Development 2011
http://slidepdf.com/reader/full/the-little-data-book-on-private-sector-development-2011 240/246
232 2011 The Little Data Book on Private Sector Development
The ranking on each topic is the simple average of the percentile rankings on
its component indicators. Data listed for 2009 are for June 2010. (World Bank)
Electric power consumption is the production of power plants and combined
heat and power plants minus transmission, distribution, and transformation
losses and own use by heat and power plants. (International Energy Agency)
Exchange rate is the exchange rate determined by national authorities or the
rate determined in the legally sanctioned exchange market. It is calculated
in local currency units relative to the U.S. dollar as an annual average based
on monthly averages. (International Monetary Fund)
Exports of goods and services are the value of all goods and other market
services provided to the rest of the world. They include the value of mer-
chandise, freight, insurance, transport, travel, royalties, license fees, and
other services, such as communication, construction, financial, information,
business, personal, and government services. They exclude compensation of
employees and investment income (formerly called factor services) as well as
transfer payments. (World Bank and Organisation for Economic Co-operation
and Development)
Firing cost is the cost of advance notice requirements, severance payments,
and penalties due when terminating a redundant worker, expressed in weekly
wages. One month is recorded as 4 1/3 weeks. Data listed for 2009 are
for June 2010. (World Bank)
Firms expected to give gifts in meetings with tax officials are the percentage
of firms that report that a gift or informal payment is expected or requested
during a meeting with tax officials. (World Bank)
Firms using banks to finance investments are the percentage of firms using
banks to finance purchases of fixed assets. (World Bank)
GDP growth is the annual percentage growth rate of gross domestic product
(GDP) at market prices based on constant local currency. Aggregates are
based on constant 2000 U.S. dollars. GDP is the sum of gross value added
by all resident producers in the economy plus any product taxes and minus
any subsidies not included in the value of the products. It is calculated
without deducting for depreciation of fabricated assets or for depletion and
degradation of natural resources. (World Bank and Organisation for Economic
Co-operation and Development)
GNI per capita, World Bank Atlas method, is gross national income (GNI)
converted to U.S. dollars using the World Bank Atlas method, divided by the
midyear population. GNI is the sum of value added by all resident producers
Glossary
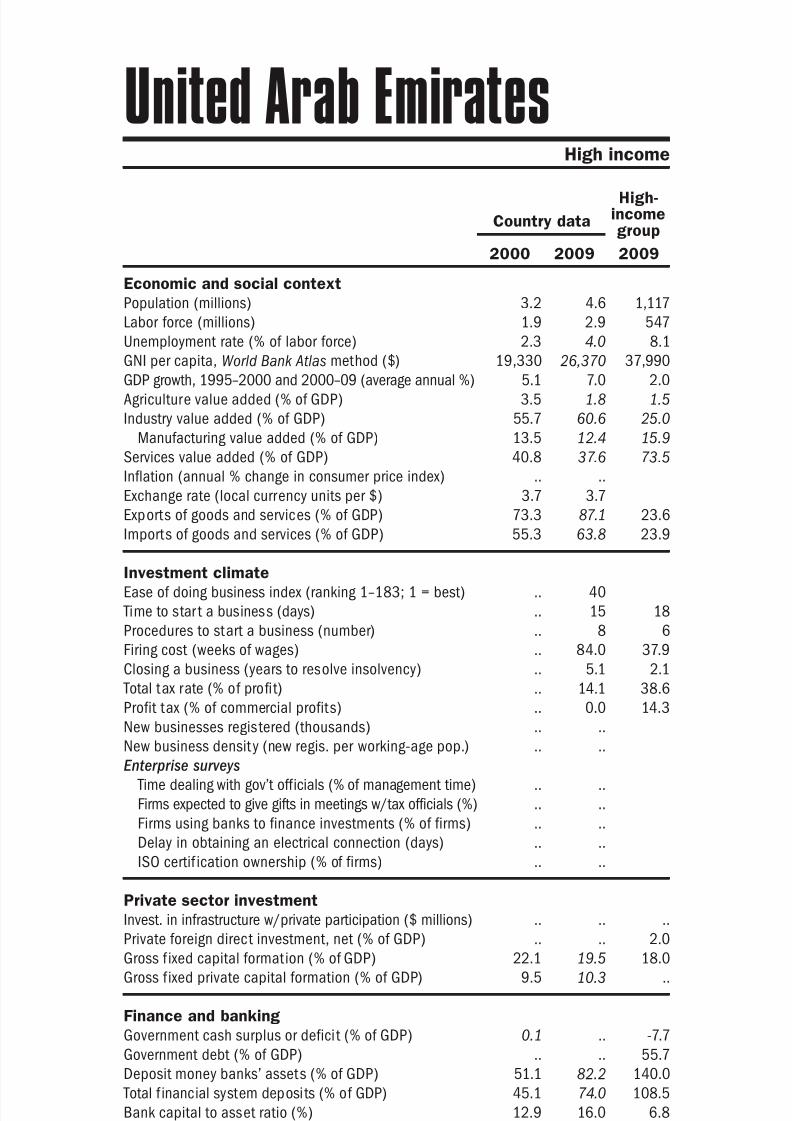
8/6/2019 The Little Data Book on Private Sector Development 2011
http://slidepdf.com/reader/full/the-little-data-book-on-private-sector-development-2011 241/246
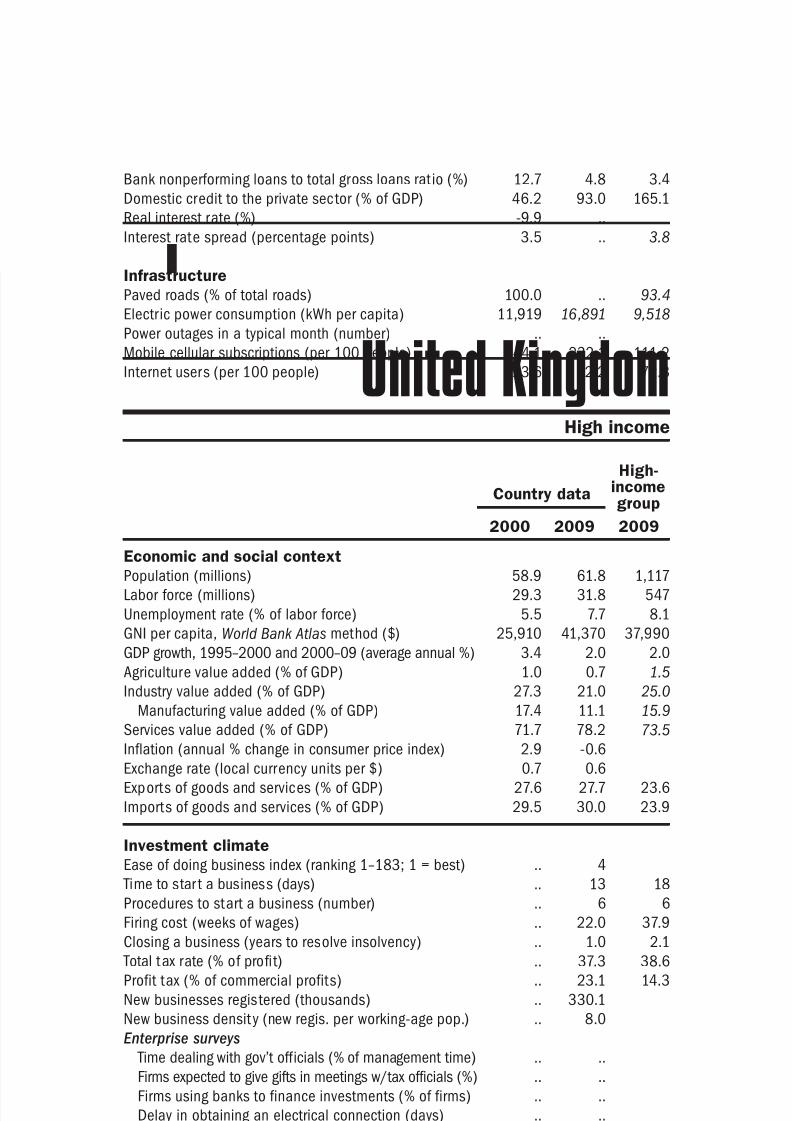
8/6/2019 The Little Data Book on Private Sector Development 2011
http://slidepdf.com/reader/full/the-little-data-book-on-private-sector-development-2011 242/246
234 2011 The Little Data Book on Private Sector Development
transfer payments. (World Bank and Organisation for Economic Co-operation
and Development)
Industry value added is the net output of industry (International Standard
Industrial Classification divisions 10–45, including mining, manufacturing,
construction, electricity, water, and gas) after totaling outputs and sub-
tracting intermediate inputs. (World Bank and Organisation for Economic
Co-operation and Development)
Inflation is the annual percentage change in the cost to the average consumer
of acquiring a basket of goods and services that may be fixed or changed at
specified intervals, such as yearly. The Laspeyres formula is generally used.
(International Monetary Fund)
Interest rate spread is the interest rate charged by banks on loans to prime
customers minus the interest rate paid by commercial or similar banks for
demand, time, or savings deposits. (International Monetary Fund)
Internet users are people with access to the worldwide network. (International
Telecommunication Union)
Investment in infrastructure with private participation is the value of infra-
structure projects in telecommunications, energy (electricity and natural gas
transmission and distribution), transport, and water and sanitation that have
reached financial closure and directly or indirectly serve the public, includ-
ing operation and management contracts with major capital expenditure,
greenfield projects (in which a private entity or public-private joint venture
builds and operates a new facility), and divestitures. Incinerators, movable
assets, standalone solid waste projects, and small projects such as windmills
are excluded. (World Bank)
ISO certification ownership is the percentage of firms that have earned
a quality certification recognized by the International Organization for
Standardization (ISO). (World Bank)
Labor force is all people who supply labor for the production of goods and
services during a specified period, according to the International Labour
Organization definition of the economically active population. It includes
both the employed and the unemployed. While national practices vary in
the treatment of such groups as the armed forces and seasonal or part-
time workers, in general the labor force includes the armed forces, the
unemployed, and first-time job-seekers and excludes homemakers and other
unpaid caregivers and workers in the informal sector. (International Labour
Organization and World Bank)
Glossary
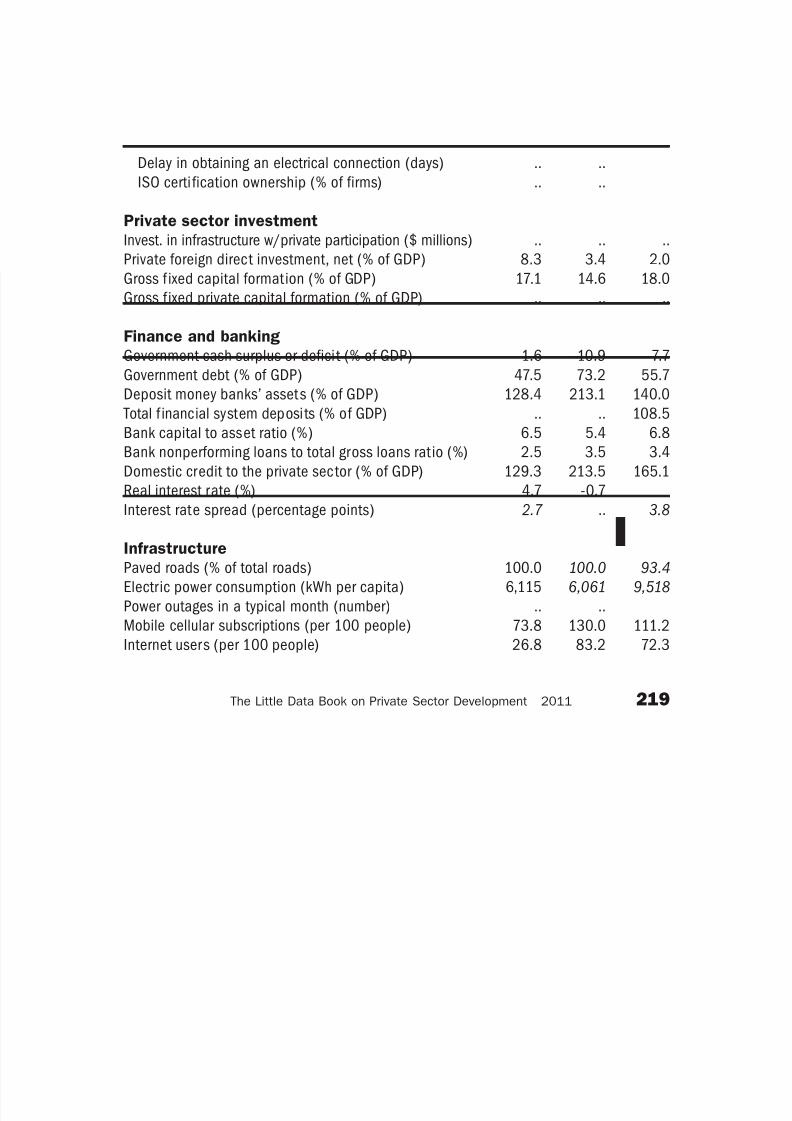
8/6/2019 The Little Data Book on Private Sector Development 2011
http://slidepdf.com/reader/full/the-little-data-book-on-private-sector-development-2011 243/246
235The Little Data Book on Private Sector Development 2011
Manufacturing value added is the net output of industries belonging to
International Standard Industrial Classification divisions 15–37 after totaling
outputs and subtracting intermediate inputs. (World Bank and Organisation
for Economic Co-operation and Development)
Mobile cellular subscriptions are the number of subscriptions—including
postpaid and prepaid subscriptions—to a public mobile telephone service
using cellular technology that provides access to the public switched telephone
network. It is calculated per 100 people. (International Telecommunication
Union)
New business density is the number of newly registered limited liability
corporations per 1,000 people ages 15-64. (World Bank)
Paved roads are roads surfaced with concrete, cobblestones, or crushed
stone (macadam) and hydrocarbon binder or bituminized agents. (International
Road Federation)
Population is based on the de facto definition of population, which counts
all residents regardless of legal status or citizenship—except for refugees
not permanently settled in the country of asylum, who are generally con-
sidered part of the population of their country of origin. Data are midyear
estimates. (World Bank)
Power outages in a typical month are the average number of power outages
that establishments experience in a typical month. (World Bank)
Private foreign direct investment, net, is net inflows of private investment to
acquire a lasting management interest (10 percent or more of voting stock)
in an enterprise operating in an economy other than that of the investor. It is
the sum of equity capital, reinvestment of earnings, other long-term capital,
and short-term capital, as shown in the balance of payments. (International
Monetary Fund, World Bank, and Organisation for Economic Co-operation
and Development)
Procedures to start a business are the number of procedures required to
start a business, including interactions to obtain necessary permits and
licenses and to complete all inscriptions, verifications, and notifications to
start operations. Data are for businesses with specific characteristics of
ownership, size, and type of production. Data listed for 2009 are for June
2010. (World Bank)
Profit tax is the amount of taxes on profits paid by the business. For further
details on the method, see the World Bank’s Doing Business 2011. Data
listed for 2009 are for June 2010. (World Bank)
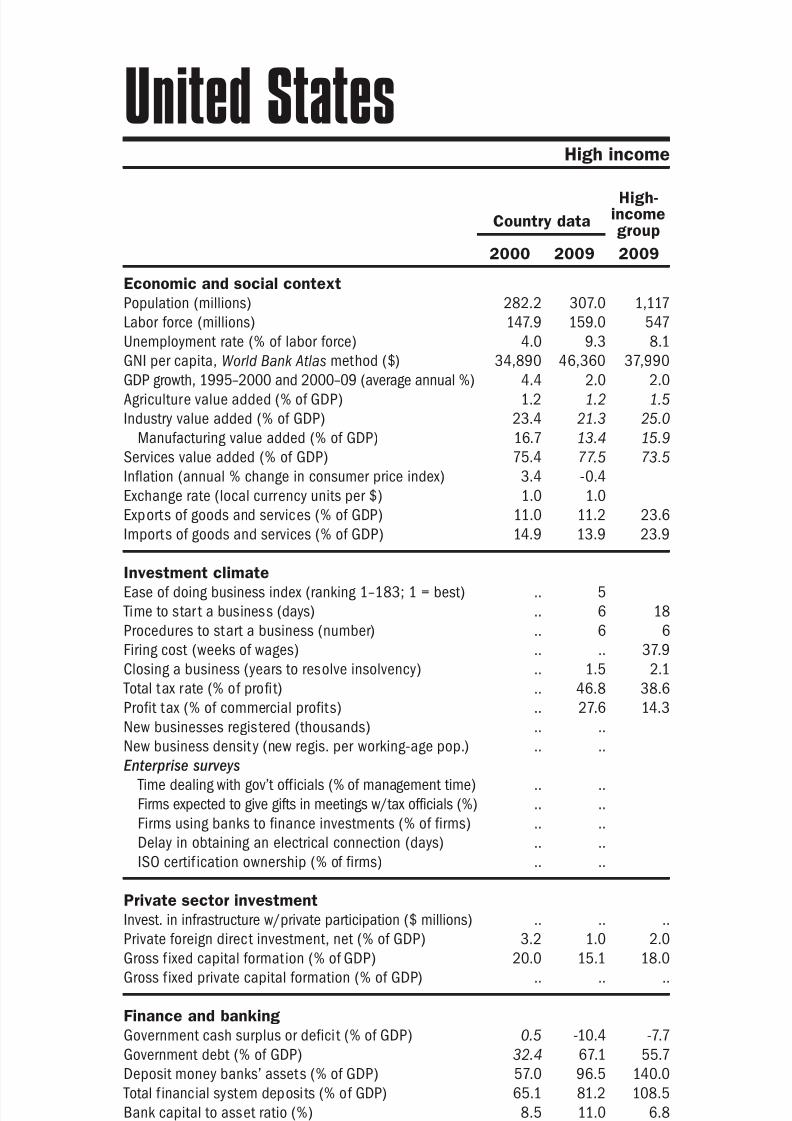
8/6/2019 The Little Data Book on Private Sector Development 2011
http://slidepdf.com/reader/full/the-little-data-book-on-private-sector-development-2011 244/246
236 2011 The Little Data Book on Private Sector Development
Real interest rate is the lending interest rate adjusted for inflation as mea-
sured by the GDP deflator. (International Monetary Fund and World Bank)
Services value added is the net output of services (International Standard
Industrial Classification divisions 50–99) after totaling outputs and sub-
tracting intermediate inputs. (World Bank and Organisation for Economic
Co-operation and Development)
Time dealing with government officials is the percentage of management time
in a given week spent on requirements imposed by government regulations
(taxes, customs, labor regulations, licensing, and registration). (World Bank)
Time to start a business is the number of calendar days needed to complete
the required procedures for legally operating a business. If a procedure can
be expedited at additional cost, the fastest procedure, independent of cost,
is chosen. Data listed for 2009 are for June 2010. (World Bank)
Total financial system deposits are the demand, time, and saving depos-
its in deposit money banks and other financial institutions. (International
Monetary Fund)
Total tax rate is the total amount of taxes payable by a business (except for
labor taxes) after accounting for deductions and exemptions as a percentage
of profit. For further details on the method used for assessing the total tax
payable, see the World Bank’s Doing Business 2011. Data listed for 2009
are for June 2010. (World Bank)
Unemployment rate is the share of the labor force without work but available
for and seeking employment. Definitions of labor force and unemployment
differ by country. (International Labour Organization)
Glossary

8/6/2019 The Little Data Book on Private Sector Development 2011
http://slidepdf.com/reader/full/the-little-data-book-on-private-sector-development-2011 245/246
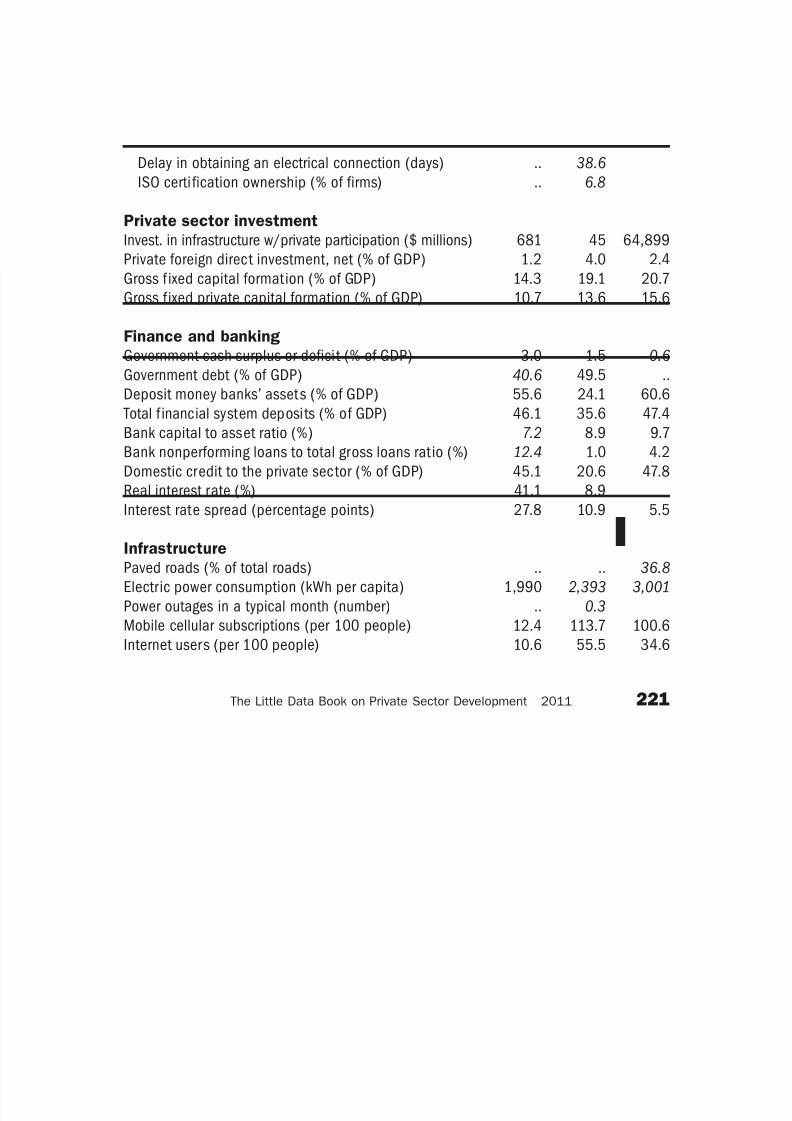
8/6/2019 The Little Data Book on Private Sector Development 2011
http://slidepdf.com/reader/full/the-little-data-book-on-private-sector-development-2011 246/246
1818 H Street N.W.
Washington D C 20433 USA