the large tsunami of 26 december 2004: field observations
TRANSCRIPT

Earth Planets Space, 58, 233–241, 2006
The large tsunami of 26 December 2004: Field observations and eyewitnessesaccounts from Sri Lanka, Maldives Is. and Thailand
Gerassimos A. Papadopoulos1, Riccardo Caputo2, Brian McAdoo3,4, Spyros Pavlides5, Vassilios Karastathis1,Anna Fokaefs1, Katerina Orfanogiannaki1, and Sotiris Valkaniotis5
1Institute of Geodynamics, National Observatory of Athens, 11810 Athens, Greece2Deptartment of Structural Geology, University of Basilicata, Macchia Romana Campus—85100 Potenza, Italy
3Institute of Geology, ETH Zentrum, Sonneggstrasse 5CH8092 Zurich, Switzerland4Department of Geology and Geography, Vassar College, Box 735, Poughkeepsie, NY 12604, USA
5Department of Geology, Aristotelian University of Thessaloniki, 54006 Thessaloniki, Greece
(Received July 15, 2005; Revised December 28, 2005; Accepted January 17, 2006; Online published February 17, 2006)
Post-event field surveys were conducted and measurements were taken in Sri Lanka and Maldives abouttwo weeks after the catastrophic Indian Ocean tsunami of 26 December 2004. The measurements taken werecross-checked after interviewing with local people. In the southwest, south and east coastal zones of Sri Lankamaximum water levels ranging from h = 3 m to h = 11 m a.m.s.l. were estimated. The highest values observedwere in the south of the island: Galle h ∼ 10 m, Hambantota h ∼ 11 m. Maximum inundation of d ∼ 2 kmwas observed in Hambantota. The heavy destruction and thousands of victims caused in coastal communities,buildings and infrastructure, like railways and bridges, is attributed not only to physical parameters, like thestrength of the tsunami hydrodynamic flow, coastal geomorphology and the wave erosional action in soil, but alsoto anthropogenic factors including the increased vulnerability of the non-RC buildings and the high populationdensity. Local people usually described the tsunami as a series of three main waves. The leading wave phase wasonly a silent sea level rise of h ≤ 1.5 m and d ≤ 150 m, while the second wave was the strongest one. The firsttwo waves occurred between 09:00 and 09:30 local time, depending on the locality. It is well documented thatnear Galle, southern part, the strong wave arrived at 09:25:30. In the west coast the third wave was a late arrivalwhich possibly represents reflection phases. In Maldives, three waves were also reported to arrive between 09:00and 09:30 local time. Maximum water level was only h ∼ 3 m in Laamu Atoll, which is interpreted by the waveamplitude damping by the coral reef to the east of the island complex as well as to that the tsunami did not arrivedat high tide time. Damage was observed in several islands of Maldives but this was minimal as compared to theheavy destruction observed in Sri Lanka. About 25 Greek eyewitnesses, who happened to experience the tsunamiattack in Padong and Blue Lagoon Port of Phuket island as well as in Maya Bay, Phi-Phi islands, Thailand, wereinterviewed on the basis of a standard questionnaire. The first sea motion was a retreat of at least 100 m. Then,two main waves arrived, the first being the strong one occurring at about 09:55–10:05 local time, with h ∼ 6 min Padong causing significant destruction and human victims. The collected information clearly indicates that thetsunami propagated as the leading crest wave to the west side, e.g. in Sri Lanka and Maldives, and as the leadingtrough wave to the east, e.g. in Thailand.Key words: Sumatra earthquake, Indian Ocean tsunami, field observations, eyewitness accounts, Sri Lanka,Maldives Is., Thailand.
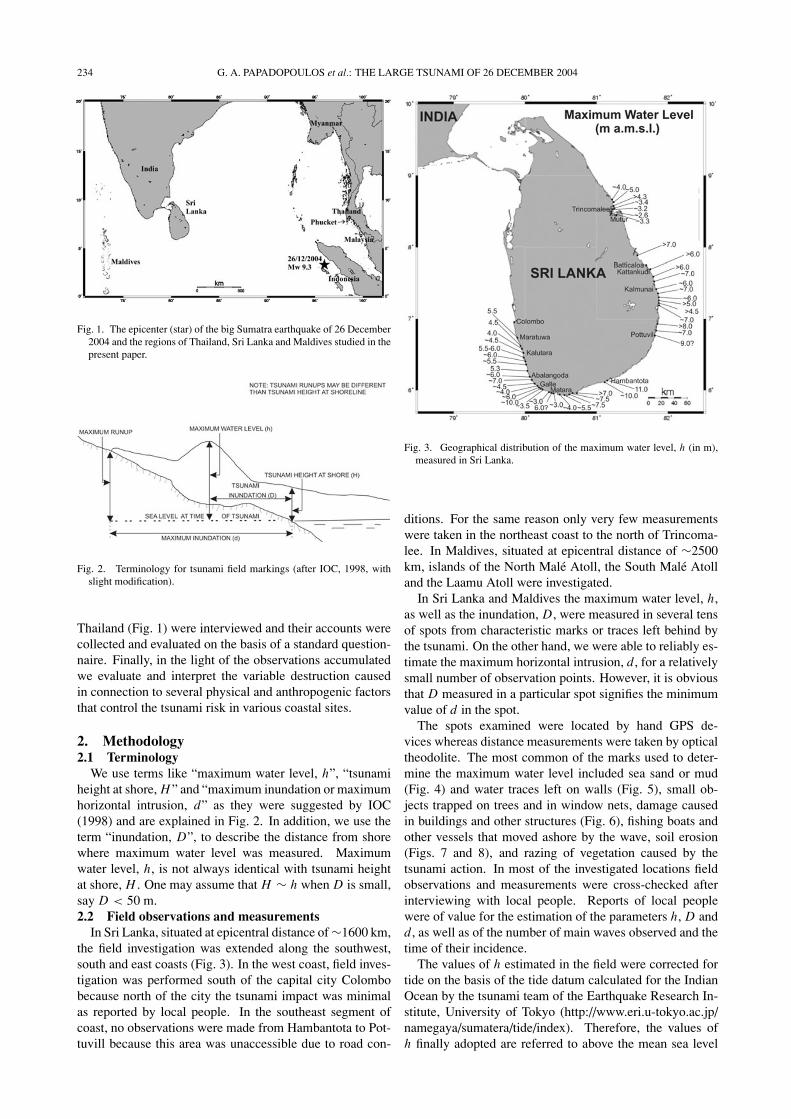
1. IntroductionThe big earthquake (Mw 9.3) of 26 December 2004,
00:58:53 UTC (07:59 local time at the epicenter), whichruptured large part of the Indonesian and Andaman-Nicobarisland arcs (Fig. 1), generated a large tsunami that spreadout all over the Indian Ocean causing heavy destructionand more than 200,000 victims in hundreds of local com-munities in 11 countries. The collection of tsunami re-lated observations in post-event field-surveys is of great im-portance for understanding not only the vulnerability pa-rameters that favoured such a massive catastrophe but alsothe physical properties of the tsunamigenic source and the
Copyright c© The Society of Geomagnetism and Earth, Planetary and Space Sci-ences (SGEPSS); The Seismological Society of Japan; The Volcanological Societyof Japan; The Geodetic Society of Japan; The Japanese Society for Planetary Sci-ences; TERRAPUB.
tsunami waves. Because of the extremely large area af-fected by the tsunami, post-event field-surveys were orga-nized by many scientific groups from different parts of theworld (Papadopoulos and Satake, 2005).
In this paper, which is a full version of preliminaryconference presentation (Papadopoulos et al., 2005), wepresent a set of observations made and measurements takenduring tsunami post-event field-surveys as well as a collec-tion of eyewitnesses accounts. Post-event field surveys wereconducted in Sri Lanka from 8 to 14 January 2005 and inMaldives islands (Fig. 1) from 14 to 16 January 2005. Atthe same time tens of local people were interviewed and in-formation about the physical features and the impact of thetsunami was collected. In addition to this, during January2005 Greek eyewitnesses who happened to experience per-sonally the tsunami attack in Phuket and Phi-Phi islands of
233
234 G. A. PAPADOPOULOS et al.: THE LARGE TSUNAMI OF 26 DECEMBER 2004
Fig. 1. The epicenter (star) of the big Sumatra earthquake of 26 December2004 and the regions of Thailand, Sri Lanka and Maldives studied in thepresent paper.
Fig. 2. Terminology for tsunami field markings (after IOC, 1998, withslight modification).
Thailand (Fig. 1) were interviewed and their accounts werecollected and evaluated on the basis of a standard question-naire. Finally, in the light of the observations accumulatedwe evaluate and interpret the variable destruction causedin connection to several physical and anthropogenic factorsthat control the tsunami risk in various coastal sites.
2. Methodology2.1 Terminology
We use terms like “maximum water level, h”, “tsunamiheight at shore, H” and “maximum inundation or maximumhorizontal intrusion, d” as they were suggested by IOC(1998) and are explained in Fig. 2. In addition, we use theterm “inundation, D”, to describe the distance from shorewhere maximum water level was measured. Maximumwater level, h, is not always identical with tsunami heightat shore, H . One may assume that H ∼ h when D is small,say D < 50 m.2.2 Field observations and measurements
In Sri Lanka, situated at epicentral distance of ∼1600 km,the field investigation was extended along the southwest,south and east coasts (Fig. 3). In the west coast, field inves-tigation was performed south of the capital city Colombobecause north of the city the tsunami impact was minimalas reported by local people. In the southeast segment ofcoast, no observations were made from Hambantota to Pot-tuvill because this area was unaccessible due to road con-
Fig. 3. Geographical distribution of the maximum water level, h (in m),measured in Sri Lanka.
ditions. For the same reason only very few measurementswere taken in the northeast coast to the north of Trincoma-lee. In Maldives, situated at epicentral distance of ∼2500km, islands of the North Male Atoll, the South Male Atolland the Laamu Atoll were investigated.
In Sri Lanka and Maldives the maximum water level, h,as well as the inundation, D, were measured in several tensof spots from characteristic marks or traces left behind bythe tsunami. On the other hand, we were able to reliably es-timate the maximum horizontal intrusion, d, for a relativelysmall number of observation points. However, it is obviousthat D measured in a particular spot signifies the minimumvalue of d in the spot.
The spots examined were located by hand GPS de-vices whereas distance measurements were taken by opticaltheodolite. The most common of the marks used to deter-mine the maximum water level included sea sand or mud(Fig. 4) and water traces left on walls (Fig. 5), small ob-jects trapped on trees and in window nets, damage causedin buildings and other structures (Fig. 6), fishing boats andother vessels that moved ashore by the wave, soil erosion(Figs. 7 and 8), and razing of vegetation caused by thetsunami action. In most of the investigated locations fieldobservations and measurements were cross-checked afterinterviewing with local people. Reports of local peoplewere of value for the estimation of the parameters h, D andd , as well as of the number of main waves observed and thetime of their incidence.
The values of h estimated in the field were corrected fortide on the basis of the tide datum calculated for the IndianOcean by the tsunami team of the Earthquake Research In-stitute, University of Tokyo (http://www.eri.u-tokyo.ac.jp/namegaya/sumatera/tide/index). Therefore, the values ofh finally adopted are referred to above the mean sea level

G. A. PAPADOPOULOS et al.: THE LARGE TSUNAMI OF 26 DECEMBER 2004 235
Fig. 4. Characteristic indoor sea sand mark left behind by the tsunamiin the coastal zone of downtown Hambantota, south Sri Lanka. This isone of the locations where the maximum water level of h ∼ 11 m wasmeasured.
Fig. 5. Two-storey RC house that resisted very well the tsunami attack atdistance of ∼80 m from the shoreline of Paralyia, southwest Sri Lanka.Only little damage was caused in doors and windows. Water mark wasleft on wall.
(a.m.s.l.) at the time of tsunami occurrence. Time is re-ported in UTC unless otherwise indicated.2.3 Eyewitnesses accounts
Tsunami eyewitnesses were approached in Sri Lanka andMaldives Is. during the post-event field investigations. Inaddition, eyewitnesses accounts were collected in Greeceby interviewing with Greek individuals who experiencedthe tsunami in the Phucket and Phi-Phi islands of Thailand,located at epicentral distance of ∼600 km (Fig. 1). Theeyewitnesses were requested to respond to a standard ques-tionnaire shown in Appendix. In Sri Lanka, at all the obser-vation points where we performed field measurements, eye-witnesses accounts were collected with the help of our localdriver who is fluent in both Sinhala and Tamil languages as
Fig. 6. Non-RC brick-work house completely demolished by the tsunamiin Paralyia, southwest Sri Lanka. In the left-hand side the RC house(Fig. 5) makes strong contrast.
Fig. 7. The soil erosional action of the tsunami caused the sea-facing sideof the non-RC building to collapse (∼120 m from beach, near Karativu,east Sri Lanka).
Fig. 8. Complete failure of railway due to lateral spreading and collapseof its embankment caused by the soil erosional action of the tsunami(Abalangoda, southwest Sri Lanka). The tsunami wave moved from theright-hand side to the left-hand side of the picture.
well as in English. In Maldives, the communication wasmade in English. In Sri Lanka and Maldives the pattern ofthe above mentioned questionnaire was followed.
The method for interviewing with eyewitnesses either inthe field or in Greece was based on two basic principles.First, every eyewitness was approached independently from

236 G. A. PAPADOPOULOS et al.: THE LARGE TSUNAMI OF 26 DECEMBER 2004
Table 1. Summary of field observations made and measurements taken in Sri Lanka. Key: h=maximum water level, D=effective inundation.
Latitude Longitude
c/n Location degr. min. degr. min. h (m) D (m)
a.m.s.l.
1 Maratuwa 6 44.875 79 53.387 5.5 70
2 Wadduwa Resort 6 40.675 79 55.245 4.5 120
3 Kalutara North 6 36.36 79 56.953 4 80
4 Katukurunda (Kalutara S.) 6 33.933 79 57.071 ca. 4.5 120
5 Paiyagala 6 31.903 79 58.651 5.5–6.0
6 Berawala 6 29.178 79 59.003 ca. 6.0
7 Bentota North 6 25.448 79 59.721 5.5 130
8 Balapitiya beach 6 16.422 80 2.149 5.3 50
9 Abalangoda 6 14.742 80 2.818 ca. 6.0
10 Seenigama 6 12.034 80 3.852 ca. 7.0
11 Rathgama/ Dodanduwa 6 5.15 80 8.763 4.5 50
12 Galle north 6 2.853 80 11.312 4
13 Galle Center 6 1.512 80 12.975 6 50
14 Galle Fort 6 2.179 80 13.342 ca. 10 0
15 Punawatunna 6 1.557 80 14.745 ca. 3.5
16 Jayaduwa/ Habaraduwa 5 59.63 80 18.51 ca. 3.0
17 Koggala 5 59.045 80 19.942 6.0 500
18 Ahangama 5 58.417 80 21.643 ca. 3.0 50
19 Weligama/ Kamburugamu 5 58.346 80 25.881 ca. 4.0
20 5 56.467 80 29.652 ca. 5.5
21 Matara/Gandara 5 55.888 80 34.98 ca. 7.5
22 Eva Hotel ca. 7.5
23 Tangalle >7.0
24 Hambantota 6 7.081 81 5.853 ca. 10
25 Hambantota 6 7.49 81 7.577 ca. 11
26 Pottuvil 6 52.522 81 50.658 9.0 150
27 Pottuvil 6 52.45 81 50.636 7 230
28 Komari 6 58.57 81 51.818 >8.0
29 Akkaraipattu 7 12.569 81 51.59 >4.5 200
30 Sinnamuhattuvaram 7 10.389 81 51.595 ca. 7.0 120
31 Addacachchena 7 14.999 81 51.818 >5.0 100
32 Oluvil 7 17.336 81 51.965 6 100
33 Karativu 7 23.048 81 50.853 ca 7.0
34 Kalmunai 6 35
35 Kaluwanchikudi 7 31.253 81 48.335 7 100
36 Cheddipalayam 7 35.019 81 47.4 >6.0
37 Kallady 7 43.429 81 42.853 >6.0
38 Kalkudah 7 55.138 81 33.963 >7.0 500
39 China Bay 8 34.299 81 11.531 3.2 10
40 China Bay Ferry 8 30.747 81 11.472 ca. 3.3
41 Trincomalee 8 34.565 81 14.207 ca. 3.4 30
42 Uppuveli 8 36.954 81 13.133 >4.3
43 Irrakkakandi 8 43.517 81 10.616 ca. 4.0 100
44 Nilaveli 8 40.597 81 12.189 ca. 5.0
others with the aim to avoid confusion and personal influ-ences. However, in Sri Lanka local circumstances were notalways favourable to follow this practice given that often wewere approached by tens of local people who were ready totalk about their personal tsunami history. Second, a system-atic effort was made to cross-check several pieces of infor-mation with as many individuals as possible.
3. Observations and Measurements3.1 Sri Lanka
The observations made and measurements taken duringthe field investigations are summarized in Table 1. In Sri
Lanka, maximum water level was estimated to range from2.6 m to 11 m (Fig. 3). The highest values measured areconcentrated in the south part of the island from Ambalan-goda in southwest to Pottuvill in southeast and particularlyin Hambantota (h = 11 m) and near Galle (h ∼ 10 m)(Fig. 3). Values of h ranging from 4.5 m to 9 m were mea-sured in the east cost from Pottuvill to around Batticaloa.Sets of relatively low values were observed in the northeastpart around Trincomalee (h ranges from 2.6 to 5.0 m) andin the west coast from Moratuwa to Ambalangoda (h rangesfrom 4.0 m to 5.0 m). The inundation, D, ranged from about50 m to 500 m, while maximum inundation, d, is equal to at

G. A. PAPADOPOULOS et al.: THE LARGE TSUNAMI OF 26 DECEMBER 2004 237
Fig. 9. Geographical distribution of the times of the major tsunami wavearrival in Sri Lanka according to eyewitnesses accounts.
least D. An extreme case of d was observed in Hambantotawhere inundation of the order of 2 km was estimated.
Eyewitness accounts are divergent as for the number ofwaves observed. This number ranges between one and threedepending on the observation time and place as well as oneach observer’s personal judgment. However, most of theeyewitnesses described the tsunami flooding as a series ofthree main waves. The first wave was described only asa silent sea level rise with maximum water level not ex-ceeding 1.5 m and inundation of no more than d ∼ 150m. However, the second wave as a rule was described asthe most powerful and destructive one, while the size of thethird wave was likely intermediate as compared to the smalland large sizes of the first and the second waves, respec-tively. Accoording to eyewitnesses, after the occurrence ofthe leading wave phase and before the arrival of the secondstrong wave a significant sea retreat was observed. As anexample, in Hambantota local people estimated the sea re-treat to be of the order of 500 m. Sea retreat usually was de-scribed to occur after the second wave and before the thirdone.
Several inhabitants reported that the inter-arrival times ofthe three waves ranged between 5 and 15 min. However,most people were confused because the leading wave phasepassed unnoticed while the second wave caused them to runto higher ground so that the arrival time of the third waveagain escaped their notice. The arrival times reported forthe most powerful wave are illustrated in Fig. 9. In someinstances the confusion mentioned above is obvious. Tocalibrate against confusion we used a picture published on13 January 2005 by the newspaper “Gulf Today” showing apublic clock in a village near Galle that stopped at 09:25:30local time (03:25:30 UTC) because of the tsunami attack.We assume that the clock stand was attacked by the second
Fig. 10. The soil erosional action along with the force of the hydrody-namic flow of the tsunami caused collapse of one side of bridge (NorthKalutara, southwest Sri Lanka).
wave arrival.After this calibration, we assume that in the east coast
the strong wave arrived between 03:00 and 03:15. Some re-ports about late arrivals (∼03:30) possibly describe the thirdwave. In the southern zone of the island the reported arrivalof the second wave ranges between 03:15 and 03:30 whichis consistent with the calibrated time. In the southwest sidebetween Moratuwa and near to the north of Ambalangodathe confusion becomes more strong. Arrivals on 03:35 or03:45 very possibly correspond to the second strong wave.However, delayed wave phases ranging between 04:00 and05:42 may describe the third wave reported. Liu et al.(2005) suggested that the late wave phases may be reflectionfrom the coast of India or from Maldives. An alternative isthat they may represent late wave phases generated duringthe refraction of the leading waves around the southern tipof Sri Lanka.
The tsunami wave caused destruction of buildings and in-frastructure, like railways and bridges, and substantial lossof life. A total death toll of at least 20,000 has been esti-mated for all of Sri Lanka. The tsunami caused destructiondirectly by the action of its hydrodynamic flow and indi-rectly by extensive soil erosion. The most critical parame-ter of the hydrodynamic flow has been the value of h, thatis of the maximum water level. In fact, the most exten-sive disaster was noted in the south part of the island (e.g.Galle, Hambantota) where the maximum values of h weremeasured. In Hambantota alone, at least 2,000 people died.Destruction was also caused in other coastal zones with sig-nificant values of h, as in the southwest (e.g. Kalutara, Para-lyia), southeast (Pottuvil) and east (Batticaloa, Trincomalle)sides of the island. However, the disaster is attributed notonly to the significant wave heights but also to the increasedvulnerability of the coastal communities. The high popula-tion density along with the lack of tsunami awareness pre-vailing in most coastal communities of Sri Lanka increaseddrastically their vulnerability to the tsunami attack. In ad-dition, non reinforced-concrete (nRC) rural buildings, likebrick-works, proved extremely vulnerable to the tsunamiforce. On the contrary, RC structures suffered much less.

238 G. A. PAPADOPOULOS et al.: THE LARGE TSUNAMI OF 26 DECEMBER 2004
Fig. 11. Geographical distribution of the maximum water level, h (in m),measured in Laamu Atoll, Maldives.
Figures 5 and 6 show a characteristic example of one nRCand one RC building situated at exactly the same spot of ob-servation at a distance of about 80 m from the shoreline ofParalyia, southwest Sri Lanka: the nRC building was com-pletely demolished by the tsunami, while the RC one re-sisted very well and only minor damage was noted on it.
Inundation d is very sensitive to natural or artificialcoastal geomorphology parameters and this proved to be ofcritical importance for the variable extent of disaster causedeven in locations situated very close to each other. As anexample, in Galle, south Sri Lanka, the 6 m-high wall ofthe 17th century Portuguese-Dutch fort protected part of thecity. However, the part of the city which is not protected bythis wall was seriously damaged. In other locations, the ex-istence of sand dunes along the coastal zones contributedto the significant decrease of inundation d with respect tothe values of d observed in nearby locations unprotected bysand dunes. For example, in particular spots of observationsin Bentota sand dunes were removed by local residents andthis resulted to the increase of both inundation and destruc-tion.
The tsunami erosional action in soil was a factor of de-struction in buildings and infrastructure. Buildings witheroded foundations typically tilted, and because of this weredamaged or even were collapsed (Fig. 7). Along railwayserosion caused the embankement either to collapse or tospread laterally (Fig. 8). Because of this the railway systemalong the coastal zones hit by the tsunami was destroyedin many localities. Tens of bridges were also destroyed be-cause either of the hydrodynamic force of the wave or itserosional action at the base of the bridge or both (Fig. 10).3.2 Maldives Is.
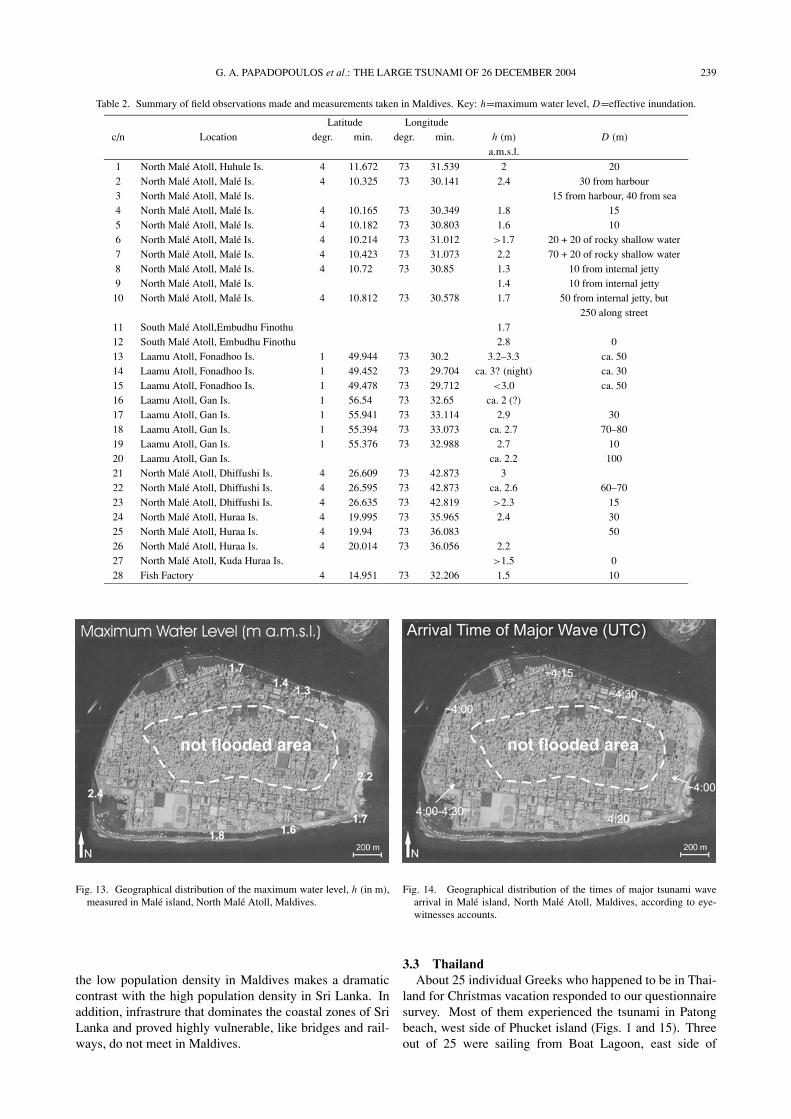
In Maldives post-event field investigation was conductedon North Male Atoll, South Male Atoll and Laamu (Had-dummati) Atoll (Table 2). The maximum water level wasestimated to range from 1.4 m to 3.3 m a.m.s.l. (Figs. 11 and
Fig. 12. Geographical distribution of the maximum water level, h (in m),measured in North Male Atoll, Maldives.
12). The highest values of 3.2 to 3.3 m were measured inthe ocean side of Fonadhoo islet of Laamu Atoll In this arearural buildings were heavily damaged; 22 persons died andanother three are missing. However, in the atoll side max-imum water level did not exceeded 2 m. The inundation,D, usually ranged from about 10 m to 100 m. However,on North and South Male Atolls, h ranged from 1.3 to 2.5m (Fig. 13), while inundation occurred up to d ∼ 300 m.As in Sri Lanka, most of the eyewitnesses reported that thetsunami wave consisted of three main tidal phases. The firstwas a slight sea rise and reported to occur in the time rangefrom 04:00 to 04:20 (09:00 to 09:20 local) depending onthe observation time and point and the observer’s personaljudgment. The second wave was the most powerful and re-portedly arrived in the time range from 04:25 to 04:30. Theexample of wave arrival reported in Male island is shown inFig. 14. Local people agreed on that the sea became calmbetween 05:30 and 06:00.
In Maldives only about 80 people died, which is quitedifferent from what happened in Sri Lanka. Two critical pa-rameters that may explain the drastic decrease in the impactof the tsunami wave in Maldives are the reduced strength ofhydrodynamic flow and the reduced vulnerability of localcommunities. In Maldives the maximum water level wasno more than about 3 m which implies strength of hydro-dynamic flow much less with respect to that which acted inSri Lanka. The relatively low water level is interpreted tohave been caused by the wave amplitude damping causedby the coral reef situated to the east of the island complexand because the tsunami did not arrive at high tide. Anotherexplanation is that the tsunami might be amplified by the seabottom topography near Sri Lanka, while that was not am-plified near the Maldives because of the steep coast outsidethe atoll. As for the vulnerability of the coastal communitiesone may expect that it would be high in Maldives due to thenearly flat ground elevation. However, this is not the caseand vulnerabiltiy is drastically reduced in Maldives. In fact,
G. A. PAPADOPOULOS et al.: THE LARGE TSUNAMI OF 26 DECEMBER 2004 239
Table 2. Summary of field observations made and measurements taken in Maldives. Key: h=maximum water level, D=effective inundation.
Latitude Longitudec/n Location degr. min. degr. min. h (m) D (m)
a.m.s.l.
1 North Male Atoll, Huhule Is. 4 11.672 73 31.539 2 202 North Male Atoll, Male Is. 4 10.325 73 30.141 2.4 30 from harbour3 North Male Atoll, Male Is. 15 from harbour, 40 from sea4 North Male Atoll, Male Is. 4 10.165 73 30.349 1.8 155 North Male Atoll, Male Is. 4 10.182 73 30.803 1.6 106 North Male Atoll, Male Is. 4 10.214 73 31.012 >1.7 20 + 20 of rocky shallow water7 North Male Atoll, Male Is. 4 10.423 73 31.073 2.2 70 + 20 of rocky shallow water8 North Male Atoll, Male Is. 4 10.72 73 30.85 1.3 10 from internal jetty9 North Male Atoll, Male Is. 1.4 10 from internal jetty
10 North Male Atoll, Male Is. 4 10.812 73 30.578 1.7 50 from internal jetty, but250 along street
11 South Male Atoll,Embudhu Finothu 1.712 South Male Atoll, Embudhu Finothu 2.8 013 Laamu Atoll, Fonadhoo Is. 1 49.944 73 30.2 3.2–3.3 ca. 5014 Laamu Atoll, Fonadhoo Is. 1 49.452 73 29.704 ca. 3? (night) ca. 3015 Laamu Atoll, Fonadhoo Is. 1 49.478 73 29.712 <3.0 ca. 5016 Laamu Atoll, Gan Is. 1 56.54 73 32.65 ca. 2 (?)17 Laamu Atoll, Gan Is. 1 55.941 73 33.114 2.9 3018 Laamu Atoll, Gan Is. 1 55.394 73 33.073 ca. 2.7 70–8019 Laamu Atoll, Gan Is. 1 55.376 73 32.988 2.7 1020 Laamu Atoll, Gan Is. ca. 2.2 10021 North Male Atoll, Dhiffushi Is. 4 26.609 73 42.873 322 North Male Atoll, Dhiffushi Is. 4 26.595 73 42.873 ca. 2.6 60–7023 North Male Atoll, Dhiffushi Is. 4 26.635 73 42.819 >2.3 1524 North Male Atoll, Huraa Is. 4 19.995 73 35.965 2.4 3025 North Male Atoll, Huraa Is. 4 19.94 73 36.083 5026 North Male Atoll, Huraa Is. 4 20.014 73 36.056 2.227 North Male Atoll, Kuda Huraa Is. >1.5 028 Fish Factory 4 14.951 73 32.206 1.5 10
Fig. 13. Geographical distribution of the maximum water level, h (in m),measured in Male island, North Male Atoll, Maldives.
the low population density in Maldives makes a dramaticcontrast with the high population density in Sri Lanka. Inaddition, infrastrure that dominates the coastal zones of SriLanka and proved highly vulnerable, like bridges and rail-ways, do not meet in Maldives.
Fig. 14. Geographical distribution of the times of major tsunami wavearrival in Male island, North Male Atoll, Maldives, according to eye-witnesses accounts.
3.3 ThailandAbout 25 individual Greeks who happened to be in Thai-
land for Christmas vacation responded to our questionnairesurvey. Most of them experienced the tsunami in Patongbeach, west side of Phucket island (Figs. 1 and 15). Threeout of 25 were sailing from Boat Lagoon, east side of

240 G. A. PAPADOPOULOS et al.: THE LARGE TSUNAMI OF 26 DECEMBER 2004
Fig. 15. Geography of the Thailand locations surveyed on the basis ofeyewitnesses accounts.
Fig. 16. Inundation, d, in Padong beach, Phucket island, Thailand,according to eyewitnesses accounts.
Phucket, to Maya Bay, Phi-Phi island (Fig. 15), and wereable to describe what they observed in these places.
In Patong beach, most people observed at least twowaves. It is likely that the leading wave described in bothSri Lanka and Maldives was not observed in Patong beach.What people said is that the first sea motion was a retreatof more than 100 m. A few minutes later the strong wavearrived. Then, after another 5 or 10 min. one more wave at-tacked but less violently than the first one. Nearly all theinterviewed persons reported that the tsunami inundationin the Patong beach varied from 150 m to at least 750 m(Fig. 16). One eyewitness reported inundation of only 20m. As for the arrival time of the strong wave the eyewit-nesses do not agree. However, most reports concentratedaround 02:55 to 03:05 (09:55 to 10:05 local) which seemsto be a reliable description (Fig. 17).
The tsunami caused several human victims and heavydamage in the coastal zone of Patong beach. Cars driftedaway, crashed onto each other or collided with buildings.Wooden structures were destroyed, whereas masonry build-ings were heavily damaged. In Boat Lagoon, the strongwave arrived around 03:10 and caused serious damage inthe coastal zone where the local marina failed.
In Maya Bay, eyewitnesses reported that at around 02:55the sea retreated for about 200 m. A few minutes later a
Fig. 17. Time windows (vertical bars) of reported tsunami occurrencein Padong beach, Phucket island, Thailand, according to eyewitnessesaccounts.
strong wave arrived that inundated for about 200 to 300 me-ters. All bungalows and other small wooden houses wereswept away and some human victims were noted. Eyewit-nesses sailing from Boat Lagoon to Maya Bay on a 3,000kg speed boat reported that around 03:15 strong turbulencehit the boat “along with strong strikes coming from all di-rections” and because of this sailing became extremely dan-gerous for several minutes.
4. Concluding RemarksIn Sri Lanka, maximum water level, h, was estimated
to range from 2.6 m to 11 m. The highest values weremeasured in Hambantota (h = 11 m) and near Galle (h ∼10 m) in the south part of the island. Values of h rangingfrom 4.5 m to 9 m were measured in the east coast fromPottuvill to around Batticaloa. Relatively low values wereobserved in northeast around Trincomalee (h = 2.6 to 5.0m) and in the west coast from Moratuwa to Ambalangoda(h = 4.0 to 5.0 m). The inundation, D, ranged from about50 m to 500 m, while maximum inundation, d , is equal to atleast D. An extreme case of d was observed in Hambantota(d ∼ 2 km). It seems that the tsunami flooding consistedof three main waves. The first was only a silent tide ofh ≤ 1.5 m and inundation of no more than d ∼ 100m. The second wave was described as the most powerfuland destructive one, while the size of the third wave waslikely intermediate. After the occurrence of the leadingwave phase and before the arrival of the second strong wavea significant sea retreat was observed, like in Hambantotawhere local people estimated the sea retreat to be of theorder of 500 m. Sea retreat usually was also described tooccur after the second wave and before the third one.
In the east coast it seems that the strong wave arrived be-tween 03:00 and 03:15. Some reports about late arrivals(∼03:30) possibly describe the third wave. In the southernzone of the island the reported arrival of the second waveranges between 03:15 and 03:30 but it is well documentedthat near Galle, southern part, the strong wave arrived at03:25:30. In the southwest side between Moratuwa andnear to the north of Ambalangoda, delayed, possibly reflec-tion wave phases arrived between 04:00 and 05:42.
The tsunami wave caused heavy destruction in the popu-lation, the built environment and the infrastructure, like the

G. A. PAPADOPOULOS et al.: THE LARGE TSUNAMI OF 26 DECEMBER 2004 241
railway system and bridges. A total death toll of at least20,000 was estimated in the entire Sri Lanka. The tsunamicaused heavy destruction directly by the action of its hy-drodynamic flow and indirectly by the extensive soil ero-sion. The heaviest disaster was noted in the south part ofthe island where the maximum values of h were measured,like in Galle and Hambantota. Therefore, h has been themost critical parameter of the hydrodynamic flow. Only inHambantota (h = 11 m) about 2,000 victims were counted.Heavy destruction was also caused in other coastal zoneswith significant values of h, like in the southwest (e.g. Ka-lutara, Paralyia), southeast (Pottuvil) and east (Batticaloa,Trincomalle) sides of the island. The tsunami erosional ac-tion in soil caused destruction in buildings and infrastruc-ture. Other physical factors that contributed to the disas-ter include the effective or the maximum inundation of thewave and coastal geomorphology.
Anthropogenic factors contributed greatly to the disas-trous effects of the tsunami. In fact, nRC buildings provedextremely vulnerable to the tsunami attack. On the contrary,RC structures suffered much less. The high population den-sity along with the lack of tsunami awareness prevailing inmost coastal communities of Sri Lanka increased drasticallytheir vulnerability to the tsunami attack. In some instances,the artificial lowering or removal of sand dunes increasedlocally the community exposure to tsunami risk.
In Maldives, the North Male Atoll, the South Male Atolland the Laamu Atoll were investigated. The maximumwater level ranged between 1.4 m and 3.3 m a.m.s.l. Thehighest values of 3.2 to 3.3 m were measured in the oceanside of Fonadhoo islet of Laamu Atoll where rural buildingswere heavily damaged; 22 persons died and another threeare missing. In the atoll side, however, maximum waterlevel did not exceeded 2 m. The effective inundation, D,usually ranged from about 10 m to 100 m. It seems that thetsunami wave consisted by three main tidal phases. The firstwas a slight sea rise occurring in the time range from 03:00to 03:20. The second wave was the most powerful andreportedly arrived in the time range from 03:25 to 03:30.The sea became calm between 05:30 and 06:00.
The total number of victims caused by the tsunami isabout 80 which makes an extremely different picture withrespect to what happened in Sri Lanka. Two are the criticalparameters that may explain the drastic difference in the im-pact of the tsunami wave: relatively low water level (h ≤ 3m) and decreased vulnerability of the coastal communities.The relatively low water level is interpreted by the waveamplitude damping caused by the coral reef situated to theeast of the island complex as well as to that the tsunami didnot arrived at high tide time. According to Fujima et al.(2005), particularly in Male the seawall protected the cityfrom worst tsunami impact.
In Thailand, in Patong beach, west side of Phucket island,in the Boat Lagoon Port, east side of Puchet, and in MayaBay, Phi-Phi islands, eyewitnesses reported that the strongwave arrival occurred between 02:55 to 03:10. In Patong,the first sea motion was a retreat of more than 100 m. A fewminutes later the strong wave arrived. Then, after another 5or 10 min. one more wave attacked but less violently thanthe first one. The tsunami inundation in the Patong beach
varied from 150 m to at least 750 m. The tsunami causedseveral human victims and heavy damage in the coastalzone of Patong beach. In the Boat Lagoon Port the wavecaused serious damage in the coastal zone. In Maya Bay,Phi-Phi islands, the first motion was a sea retreat for about200 m that occurred around 02:55. A few minutes laterthe strong wave arrived causing few human victims anddestruction to bungalows and wooden houses. The collectedinformation clearly indicates that the tsunami propagated asthe leading crest wave to the west side, e.g. in Sri Lanka andMaldives, and as the leading trough wave to the east, e.g. inThailand.
Acknowledgments. The post-tsunami field survey was finan-cially supported by the EU research project LEWIS (ENG1-CT-2001-00055), the Institute of Geology, ETH, Zurich, and the news-paper “Eleftherotypia”, Athens. We are thankful to Andrew Mooreand to one anonymous reviewer for their valuable suggestions inorder to improve the manuscript. Thanks are extended to Mr.Naushad, our unwearied car driver, who helped us a lot not onlyin driving but also in communicating with local people. We alsothank Mr. Filios Stagos, correspondant in Sri Lanka of the Greekpublic TV channel NET, for the valuable information and advisehe passed to us during the preparation of our field survey.
Appendix.Questionnaire used to collect information from local people in Sri Lankaand Maldives as well as from Greek eyewitnesses in Thailand.
Personal Name Sex/age: Occupation TelephoneData M (F)/ /fax/e-mail
Earthquake Time: Place Indoor: Outdoor:Info (a) hh:mm Yes or No Yes or No
Earthquake Indoor (Yes): Description of OtherInfo (b) type of perceptibility Comments
building/Floor:Earthquake Outdoor (Yes): Description of Other
Info (c) perceptibility CommentsTsunami Time: hh:mm Place Initial sea Description aboutInfo (a) movement/ tsunami effects
Inundation (d) /Max. water level
Tsunami Number of Wave inter- Biggest wave Which wave causedInfo (b) waves observed arrival times observed Max. inundation
ReferencesFujima, K., T. Tomita, K. Honda, Y. Shigihara, H. Nobuoka, M. Hanzawa,
H. Fujii, H. Ohtani, S. Orishimo, M. Tatsumi, and S. Koshimura, Prelim-inary report on the survey results of 26/12/2004 Indian Ocean Tsunamiin the Maldives, 99 pp., April 2005.
Intergovernmental Oceanographic Commission (IOC), Post-tsunami sur-vey field guide, First Edition, Manuals and Guides, 37, UNESCO, 23pp. + 2 annexes, 1998.
Liu, P. L.-F, P. Lynett, H. Fernando, B. E. Jaffe, H. Fritz, B. Higman, R.Morton, J. Goff, and C. Synolakis, Observations by the internationaltsunami survey team in Sri Lanka, Science, 308, 1595, 2005.
Papadopoulos, G. A. and K. Satake (Eds.), Proceedings of the 22nd IUGGTsunami Symposium, Chania, Crete Is., 27–29 June, 2005, 330 pp.,2005.
Papadopoulos, G. A., R. Caputo, B. McAdoo, S. Pavlides, V. Karastathis,A. Fokaefs, and S. Valkaniotis, The Indian catastrophic tsunami of 26December 2004: Field observations and eyewitnesses accounts from SriLanka, Maldives islands and Thailand, European Geosciences UnionGeneral Assembly, Vienna, Austria, 24–29 April 2005.
G. A. Papadopoulos (e-mail: [email protected]), R. Caputo, B.McAdoo, S. Pavlides, V. Karastathis, A. Fokaefs, K. Orfanogiannaki, andS. Valkaniotis