the key findings and way ahead
TRANSCRIPT

Fertilizer‐ Sector Performance
Centre for Science and Environment

Sector performance• Sector Score Card
3 Leaves Award
42% score
• Second industrial sector to achieve 3 Leaves Award after ( )Cement (>40% score)
• Automobile, Paper & Chlor‐alkali – 2 Leaves Award (<35% score)
• Thermal power & Iron & Steel ‐ 1 Leaf Award (<25% score)

Sector performanceCategories Weightage
assignedAverage sector score (in per cent)
Product stewardship; Environment, 17.0 52Product stewardship; Environment, Health & Safety (EHS) & Social responsibility
17.0
Energy & GHG 30.0 43Water use 15 0 40Water use 15.0 40Pollution control 20.0 41Stakeholder’s perception 10.0 32Transparency 8.0 35O ll S 00 42Overall Score 100 42
• Rated on 54 indicators
• The sector had an average performance in all important categories like• The sector had an average performance in all important categories like energy and GHG emissions, water use, pollution control and policy
• The sector had a below average performance in transparency and stakeholder perceptionstakeholder perception
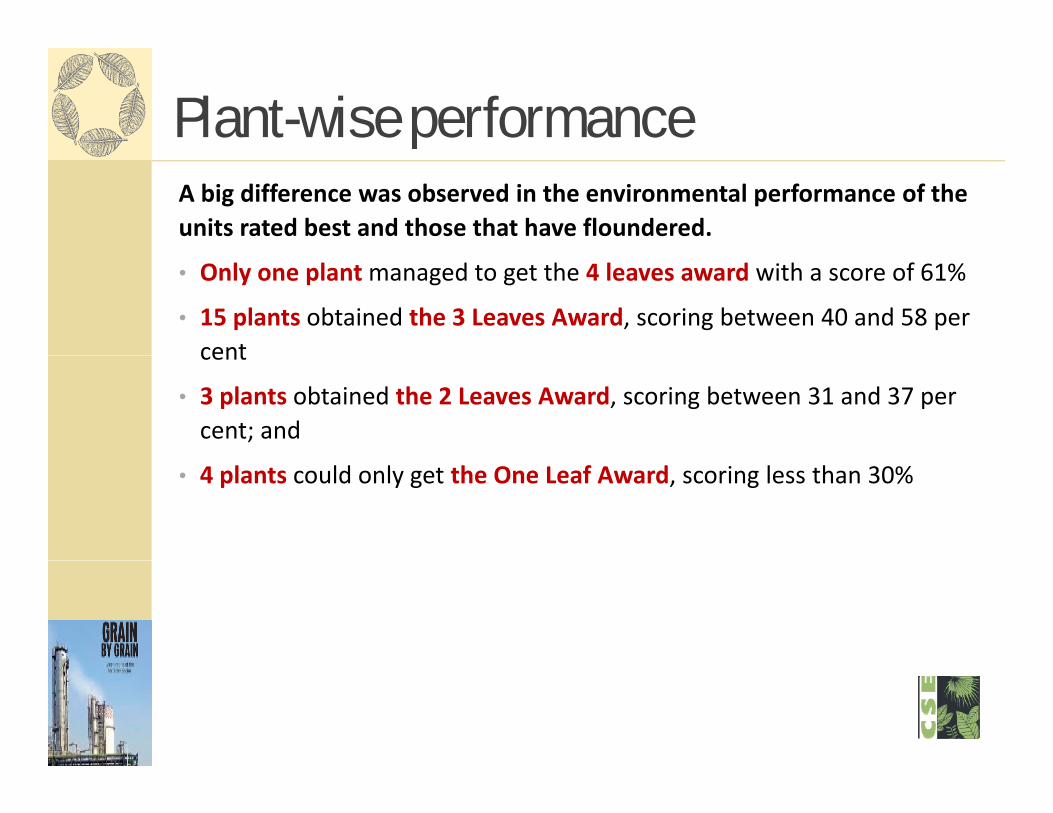
Plant-wise performanceA big difference was observed in the environmental performance of the units rated best and those that have floundered.
• Only one plant managed to get the 4 leaves award with a score of 61%
• 15 plants obtained the 3 Leaves Award, scoring between 40 and 58 per centcent
• 3 plants obtained the 2 Leaves Award, scoring between 31 and 37 per cent; and
• 4 plants could only get the One Leaf Award, scoring less than 30%

Key findings
Centre for Science and Environment

Energy Efficiency
9.57 9.57 9.579 5
10gy
NH 3)
8
8.97
8.5
9
9.5
pecific ene
rgn (Gcal/M
T N
7
7.5
8
I di ( ) U it d St t S th Chi A i
Average sp
consum
ption
India (avg.) United States South America
China Asia (excluding China & India)
c
• Indian plants are one of the most energy‐efficient in the world.
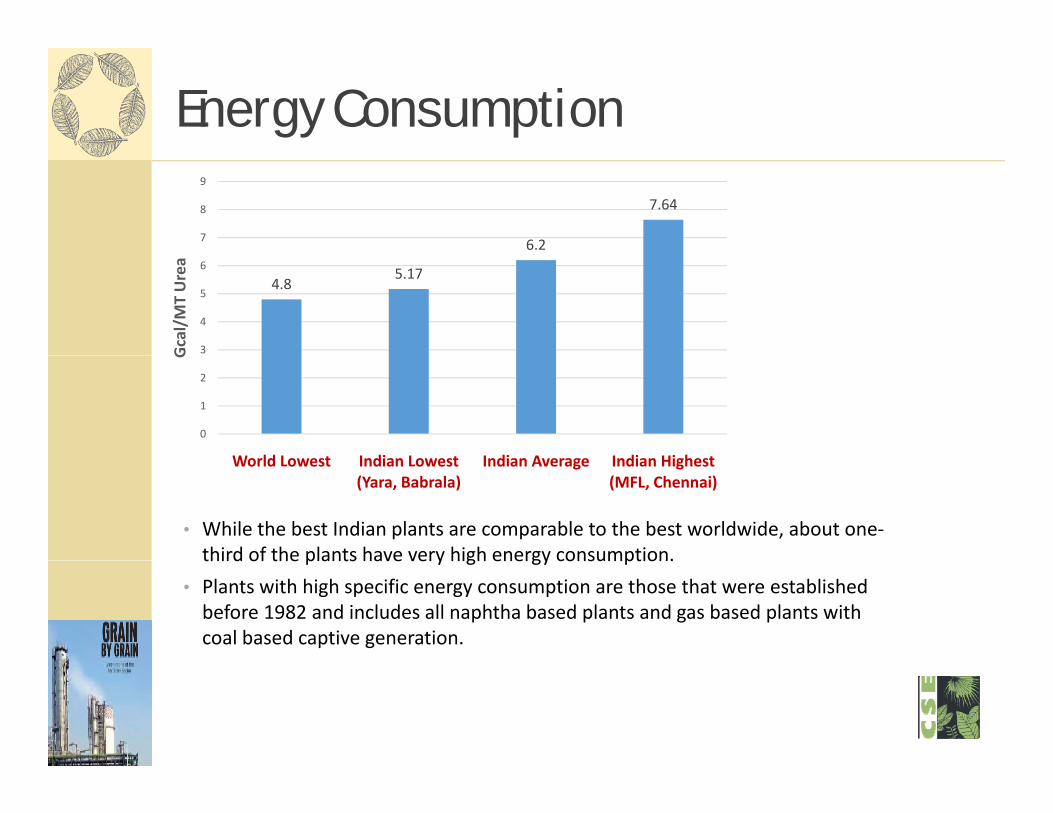
Energy Consumption
6.2
7.64
7
8
9
4.85.17
3
4
5
6
Gcal/MT Urea
0
1
2
W ld L t I di L t I di A I di Hi h t
G
• While the best Indian plants are comparable to the best worldwide, about one‐third of the plants have very high energy consumption.
World Lowest Indian Lowest (Yara, Babrala)
Indian Average Indian Highest (MFL, Chennai)
third of the plants have very high energy consumption.• Plants with high specific energy consumption are those that were established before 1982 and includes all naphtha based plants and gas based plants with coal based captive generation.
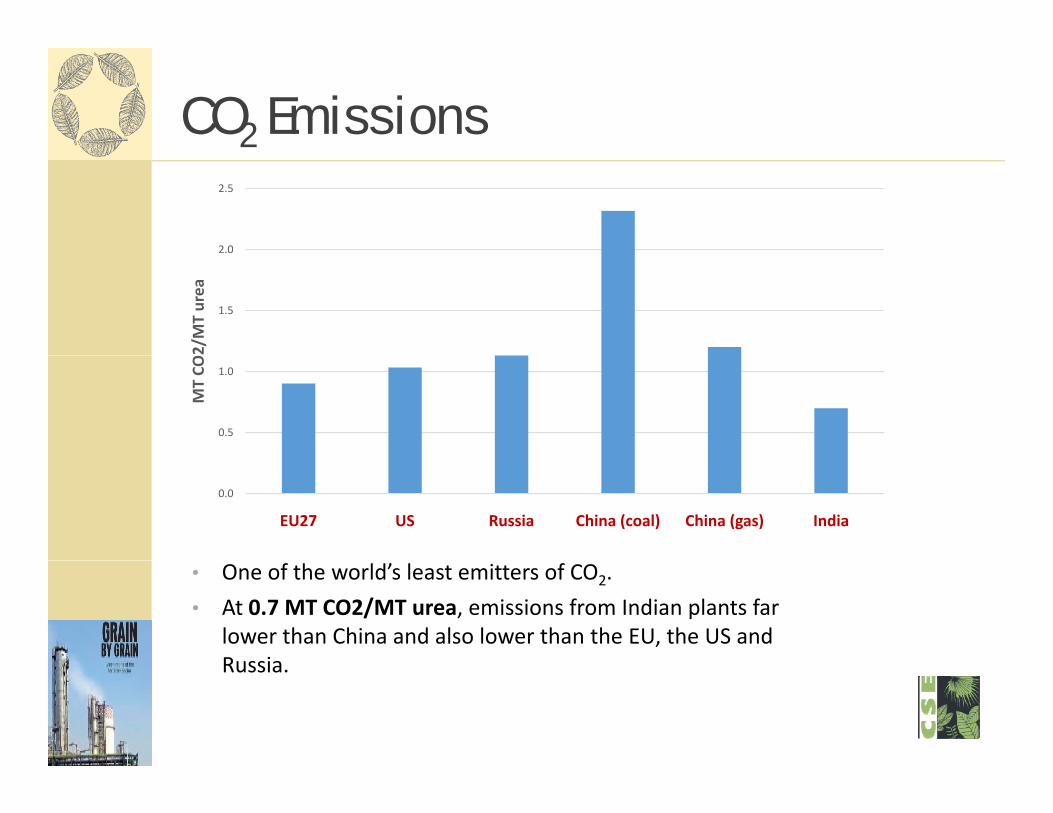
CO2 Emissions
2.0
2.5
1.5
2.0
2/MT urea
0.5
1.0
MT CO
0.0
EU27 US Russia China (coal) China (gas) India
• One of the world’s least emitters of CO2. • At 0.7 MT CO2/MT urea, emissions from Indian plants far
lower than China and also lower than the EU, the US and RussiaRussia.
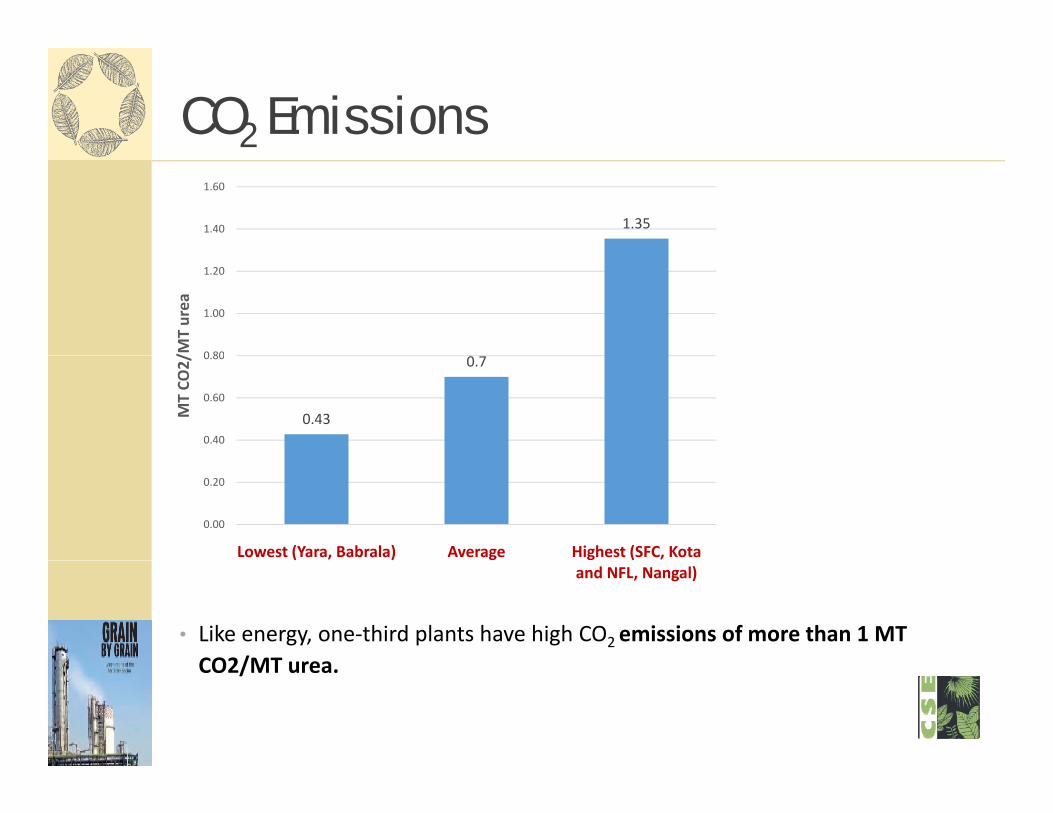
CO2 Emissions
1.351.40
1.60
0 80
1.00
1.20
/MT urea
0.43
0.7
0.40
0.60
0.80
MT CO
2/
0.00
0.20
Lowest (Yara, Babrala) Average Highest (SFC, Kota
• Like energy, one‐third plants have high CO2 emissions of more than 1 MT CO2/MT urea
and NFL, Nangal)
CO2/MT urea.
Water - A key issue• Water scarcity is strongly affecting the sector. Of the 23 plants, 35 per cent are located in over‐exploited, critical or semi‐critical areas.
• There have been instances of plants having to temporarily shutThere have been instances of plants having to temporarily shut down due to water shortage.
• The use of groundwater has led to protests from local communities.

Water Sourcing• The sector’s relatively high
dependence on groundwater is a cause for concernis a cause for concern.
• Four were completely reliant on groundwater. Of these two plants werethese, two plants were located in critical or semi‐critical groundwater zones.
• A further two plants were partially dependent on groundwater.
• Five of the six groundwater dependent plants are located in Uttar Pradesh.

Specific Water Consumption
• Specific water consumption of many plants way higher than sectoral best.
• Worst performing plant consumed nearly 3 times as much water as the best.
• The most efficient consumer was KRIBHCO, Hazira, while the most inefficient was NFL, Panipat.
• Inefficient practices, conventional treatment technologies and wet ash handling are the main reasons behind high water consumption.

Water pollution
• Groundwater pollution emerged as a key area of concern.
• Groundwater samples were collected around 18 plants sites• Groundwater samples were collected around 18 plants sites. Of these samples, around 15 plants (83%) did not comply with the BIS standard for drinking water. Ammoniacal nitrogen concentration was above the permissible limits.
• Final effluent used mainly for horticultural purposes/green belt development by majority of plants because they havebelt development by majority of plants, because they have been asked to be ‘Zero discharge plant’.
• Several complaints from local communities regarding theSeveral complaints from local communities regarding the deterioration of groundwater and surface water quality near plants

Water pollution
• Of the effluent samples collected at 14 plants, 9 (57%) did not meet the standards for Total Kjeldahl Nitrogen or j gCyanide.
• Many plants (around 10‐11) issued directions/show cause notices during GRP study period with respect to effluent discharge / effluent dilution / non‐installation of CEQMS
The sector has underinvested in effluent treatment• The sector has underinvested in effluent treatment technologies.
• Many plants raised the issue of the poor financial health forMany plants raised the issue of the poor financial health for not investing in advanced technologies.

Air pollution
• Air pollution is more of an issue for only naphtha based plants or those with fuel‐oil or coal based captive power plants.
• Plants have managed to control odour
• However, Urea emissions from the prilling tower can be reduced by adopting advanced technologies.

Solid and Hazardous Waste
• Spent catalyst management and handling in most urea plants is found to be satisfactory.
• Plants are transparent about the waste recyclers to whom they sell the hazardous waste that they generate
• Ash pond maintenance (in plants using coal as fuel) was a key issue at most plants. At some plants, ponds are not properly lined and no dust suppression measures have been adopted.been adopted.

Environmental, Health and Safety Management
• Plants performed well in Environment Management Systems. But Occupational Health and Safety is a concern
• Fatal accidents (5‐6 fatalities) during GRP study duration.
• Poor preparedness on offsite disaster management plans.
• Plants are old and not adequate investments is being done in OHS.
• Some plants were found to be doing noteworthy work in terms of social responsibility. But most had poor investments in CSR.

The Way AheadThe Way Ahead
Centre for Science and Environment
Energy Efficiency
There is significant scope of improving energy efficiency in:
N hth b d l t–Naphtha based plant–Gas based plant using coal based power Efficient Heat recovery systems in plants consuming high energy–Efficient Heat recovery systems in plants consuming high energy
Centre for Science and Environment

Reduce Water footprint
• Significant scope to reduce water footprint.
SWC b d d t l th 4 5 3/t- SWC can be reduced to less than 4.5 m3/tonne.
- Plants should strive to achieve zero liquid discharge by adopting advanced tertiary treatment technologies; or p g y g ;recycling and reuse to the maximum extent possible, but not in horticulture or agriculture without proper assessment
Pl t h ld l th ti f t h h dli d- Plants should replace the practice of wet ash handling and shift to dry ash handling
- Curtailing use of groundwater in the sectorCurtailing use of groundwater in the sector
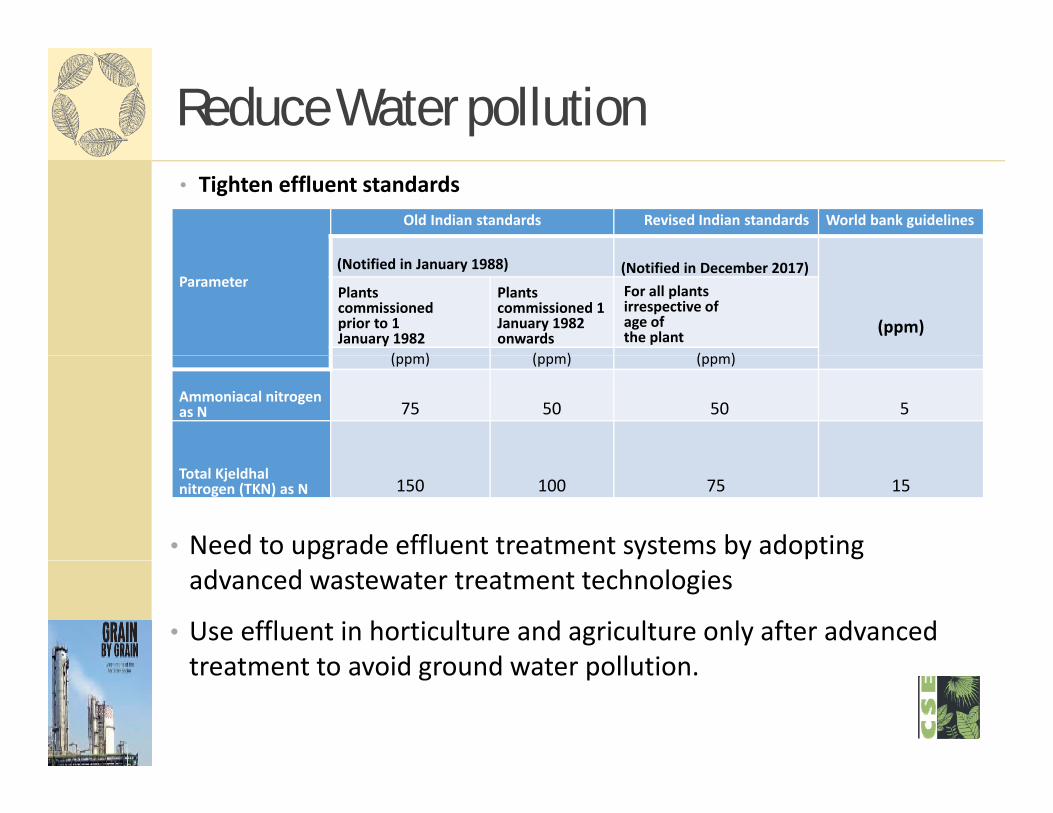
Reduce Water pollution• Tighten effluent standards
Old Indian standards World bank guidelinesRevised Indian standards
Parameter (Notified in December 2017)
(ppm)
Plants commissioned prior to 1 January 1982
Plants commissioned 1 January 1982 onwards
( ) ( ) ( )
For all plants irrespective of age of the plant
(Notified in January 1988)
(ppm) (ppm) (ppm)
Ammoniacal nitrogen as N 75 50 50 5
• Need to upgrade effluent treatment systems by adopting
Total Kjeldhal nitrogen (TKN) as N 150 100 75 15
advanced wastewater treatment technologies
• Use effluent in horticulture and agriculture only after advanced treatment to avoid ground water pollutiontreatment to avoid ground water pollution.

Reduce Emissions• Urea dust and ammonia emissions (from prill towers and purge gases) need to be controlled by installing suitable pollution control technologiestechnologies.
• Tighten emission standards
Pollutant Indian standard World Bank Guidelines
PM as urea dust 150 (pre 1982 vintage units)
50(pre‐1982 vintage units)
50(post‐1982 vintage units)
NH3 (prilling or granulation)
No standards 50

Safety
• Growing concern for safety as most operating plants have become quite old.
• There is a need of independent safety assessment of old plants if government wants them continue to operate for self‐sufficiencyself sufficiency
• Plant needs to improve their onsite emergency preparedness plan.

Long term Challenges
Life‐cycle Assessment of Urea: Use‐phase environmental impacts are far higher than production‐phase.
• Climate Change• Ozone layer depletion
g p p
y p• Nitrogen Cycle disruption & pollution

Climate Change & Ozone depletion
• Nitrous oxide (N2O) emitted from the agricultural fields is a potent Greenhouse Gas (GHG) & Ozone Depleting S b (ODS)Substance (ODS).
• It’s GHG potential 300 times that of carbon dioxide & its ODP potential is 0.017 (similar to many HCFC refrigerants)
• N2O is now the the largest ozone‐depleting substance emitted through human activities.
• It is also fast rising contributor to global climate change. • 26 per cent emissions from the Indian agriculture sector consisted of nitrous oxide.
• Urea produces the highest lifecycle GHG emissions per p g y ptonne of nitrogen.
• Nitrous oxide emissions increase exponentially with urea overuse.
25

Nitrogen Cycle
• Humans are disrupting the nitrogen cycle by altering the amount of nitrogen that is stored in the biosphere.
• Only 30‐35 per cent of the nitrogen that is applied through fertilizers is taken up by the plants in the form of nitrates.
• Remaining seeps into the surrounding environment causing surface and g p g ggroundwater pollution as well as a cascade of environmental and health impacts.
• While the desirable ratio of N‐P‐K application is 4:2:1, the ratio in PunjabWhile the desirable ratio of N P K application is 4:2:1, the ratio in Punjab stands at 31.4:8:1 and the ratios are also skewed in favour of nitrogen in most other states and regions.
• It is estimated that India loses nitrogen worth US $10 billion per year asIt is estimated that India loses nitrogen worth US $10 billion per year as fertilizer value, while the costs of nitrogen pollution on health ecosystems and climate are calculated to be US$ 75 billion per year.

Long term challenges
• How to reduce fossil‐fuel dependence for producing Nitrogenous fertilizer?
• How do we enhance nitrogen‐use efficiency in agriculture and reduce consumption of Nitrogenous fertilizer?Nitrogenous fertilizer?• PM Modi’s challenge of cutting urea consumption by half by 2022.
Nitrogenous fertiliser without fossil fuel?
• Ammonia production needs Hydrogen and Nitrogen.
• Electrolysis was a common means of producing hydrogen
• Fertilizer Corporation of India’s Nangal plant employed electrolysis to produce hydrogen until it switched to hydrocarbons (then LSHS and fuel oil) in the 1970s due to shortage of power in the Bhakra grid.
Whil h f h d d d f l i i ( i l l• While the current cost of hydrogen produced from electricity (particularly renewables) is very high, it is expected to fall with the reducing cost of renewables.
• Many companies offering modern electrolysis‐based hydrogen productionMany companies offering modern electrolysis based hydrogen production technology
• Hydrogen may also be produced from biomass including crop residues, municipal solid waste, animal waste through multiple processes including gasification and pyrolysis, and then used in ammonia synthesis.
• Carbon di‐oxide recovery from flue gas is already well established in the sector.
• Old technology is going to be the modern technology in the 21st Century.
Innovation in products• Improve nitrogen use efficiency
• Precision Fertilizer application
• Fertigation (Fertilizer+ improved Irrigation)
• Products for slow or controlled‐release fertilizer urea in soil (ex.: urease and nitrification inhibitor chemicals being mandated in Europe)g p )
• Investment in research comparing the efficacy and emissions of different nitrogenous fertiliser for different crops.
• Suitable policies to promote bio fertilizers and city compost to reduce• Suitable policies to promote bio‐fertilizers and city compost to reduce urea consumption.

Research & Development
• Indian fertilizer companies spend a miniscule amount of their revenue on research and development.

Decontrol the sector• Bring competitiveness• To bring the innovations in production and products.g p p• To reduce subsidy burden.• To promote balanced fertilizer use and improve soil h lthhealth.

Halving Urea Consumption?
• Take Nitrogenous Fertiliser into Nutrient based subsidy scheme
• Improve nitrogen‐use efficiency to 60% by product modification and cropping management
• Direct Benefit transfer to farmers• Gradually decontrol the Nitrogenous Fertiliser prices to allow competition and innovationprices to allow competition and innovation