the journal of the - ifcc.org · in this issue critical issues and new trends on stat tests in...
TRANSCRIPT
The Journal of the International Federation of Clinical Chemistry and Laboratory Medicine
Communications and Publications Division (CPD) of the IFCCEditor-in-chief: Prof. János Kappelmayer, MD, PhDFaculty of Medicine, University of Debrecen, Hungarye-mail: [email protected]
ISSN 1650-3414 Volume 30 Number 1February 2019
In this issue
Call for manuscript submissions on “Flow cytometry”Katherina Psarra 4
Call for manuscript submissions on “Improving the preanalytical phase in laboratory medicine”Gabriel Lima-Oliveira 5
The irreplaceable value of laboratory diagnostics: four recent tests that have revolutionized clinical practiceGiuseppe Lippi 7
Factors affecting turnaround time in the clinical laboratory of the Kathmandu University Hospital, NepalRajendra Dev Bhatt, Chandani Shrestha, Prabodh Risal 14
Hemolysis interference studies: the particular case of sodium ionJosé Antonio Delgado, Daniel Morell-Garcia, Josep Miquel Bauça 25
Prevalence of anemia and associated factors in hospitalized children attending the University of Gondar Hospital, Northwest EthiopiaBamlaku Enawgaw, Yaregal Workineh, Sisay Tadesse, Eyuel Mekuria, Ayenew Addisu, Meaza Genetu 35
Waist circumference cutoff point determination for defining metabolic syndrome in type 2 diabetes mellitus in EthiopiaShewit Hailemariam, Tadele Melak, Molla Abebe 48
In this issue
Critical issues and new trends on stat tests in clinical laboratoryAriadna Arbiol-Roca, Dolors Dot-Bach 59
Diamond Blackfan Anemia: genetics, pathogenesis, diagnosis and treatmentGetabalew Engidaye, Mulugeta Melku, Bamlaku Enawgaw 67
Gaucher disease: an underdiagnosed pathology in the Eastern Moroccan populationOuardia Bouayadi, Amina Lyagoubi, Adnane Aarab, Somiya Lamrabat, Abdelilah Berhili, Mohammed Bensalah, Rachid Seddik 82
A rare case of non-secretory multiple myeloma: a case report and literature reviewMohammed Bensalah, Somiya Lamrabat, Amina Lyagoubi, Adnane Aarab, Ouardia Bouayadi, Rachid Seddik 88
Increased bleeding risk in a patient with oral anticoagulant therapy and concomitant herbal intake – a case reportPaul Gressenberger, Peter Rief, Philipp Jud, Katharina Gütl, Viktoria Muster, Leyla Ghanim, Marianne Brodmann, Thomas Gary 95
Unusually low serum alkaline phosphatase activity in a patient with acute on chronic liver failure and hemolysisParul Arora, Shekhar Singh Jadaun, Prasenjit Das, Shalimar, Sudip K. Datta 99
eJIFCC2019Vol30No1pp004-004Page 4
This is a Platinum Open Access Journal distributed under the terms of the Creative Commons Attribution Non-Commercial License which permits unrestricted non-commercial use, distribution, and reproduction in any medium, provided the original work is properly cited.
Call for manuscript submissions for a thematic eJIFCC issue on “Flow cytometry”Guest Editor for the “Flow cytometry” issue: Katherina Psarra
Multiparameter Flow Cytometry (FCM) is a recent technology of very high performance developed for a vast variety of diagnostic applications.
Is there really a limit of future cytometry? Will the evolution and transformations arrive at a limit or will they go on and on? Will the effort be the one that really matters? We hope to of-fer you some insight into this bright future with an eJIFCC issue dedicated to cytometry.
We invite you to submit a paper on “Flow cytometry” to be published in this thematic issue.
That way the message will be carried on to fellow laboratorians about the importance, the magic and the charm of this evolving technology.
Submitted papers will be reviewed according to the regular procedure of the eJIFCC.
Important deadlines
• Deadline for submission of the tentative title (to the Guest Editor): April 1st, 2019
• Deadline for submission of the manuscript: May 31st, 2019
Type of articles
• Original Papers
• Critical Reviews
• Case studies
Manuscripts to be submitted by e-mail to:
• the Editor-in-Chief: [email protected]
• with a copy to the Guest Editor: [email protected]
Guest Editor
Katherina Psarra Immunology – Histocompatibility Department Evangelismos Hospital Athens, Greece
eJIFCC2019Vol30No1pp005-006Page 5
This is a Platinum Open Access Journal distributed under the terms of the Creative Commons Attribution Non-Commercial License which permits unrestricted non-commercial use, distribution, and reproduction in any medium, provided the original work is properly cited.
Call for manuscript submissions for a thematic eJIFCC issue on “Improving the preanalytical phase in laboratory medicine”Guest Editor for the “Pre-analytical phase” issue: Gabriel Lima-Oliveira
The pre-analytical phase encompasses all the procedures before the start of laboratory test-ing. This phase of the testing process is respon-sible for a great deal, possibly the majority of the laboratory errors.
Diagnosis, management, treatment of patients and ultimately patient safety itself can be com-promised by:
• patient preparation;
• patient posture;
• phlebotomy quality;
• kind/type of evacuated tube used to draw blood samples;
• sample centrifugation;
• sample transportation;
• sample contamination;
• time to analyze;
• sample storage;
• and more…
We aim to prepare a special thematic issue of the eJIFCC, entitled “Improving the preanalytical phase in laboratory medicine”, to be published in November 2019, to inform the laboratory
professionals and to seek to guarantee patient safety.
The electronic Journal of the IFCC (eJIFCC) is a platinum open-access journal, i.e. there is no charge to read, or to submit to this journal. Our numerous high-quality articles, debates, reviews, case studies and editorials are ad-dressed to clinical laboratorians. We aim to assist the development of the field of clinical chemistry and laboratory medicine worldwide. Manuscripts are fully peer reviewed and im-mediately free to access and download from www.ifcc.org.
Submitted manuscripts shall be reviewed nor-mally, according to the regular procedures of the eJIFCC.
As Guest Editor, I would like to invite research-ers from a wide range of disciplines to contrib-ute to papers on recent and innovative research on Pre analytical phase.
Important deadlines
• Deadline for submission of the tentative title (to the Guest Editor): May 1, 2019
• Deadline for submission of the manuscript: July 31, 2019

eJIFCC2019Vol30No1pp005-006Page 6
Gabriel Lima-OliveiraCall for manuscripts submission on “Improving the preanalytical phase in laboratory medicine”
Types of articles
• Original Papers
• Critical Reviews
• Case studies
Manuscripts to be submitted by e-mail to:
• the Editor-in-Chief: [email protected]
• with copy to the Guest Editor: [email protected]
Guest Editor
Gabriel Lima-Oliveira, Ph.D. Researcher, University of Verona, Italy Chair, COLABIOCLI WG-PRE-LATAM Expert/Consultant, EFLM WG-PRE
eJIFCC2019Vol30No1pp007-013Page 7
This is a Platinum Open Access Journal distributed under the terms of the Creative Commons Attribution Non-Commercial License which permits unrestricted non-commercial use, distribution, and reproduction in any medium, provided the original work is properly cited.
The irreplaceable value of laboratory diagnostics: four recent tests that have revolutionized clinical practiceGiuseppe LippiSection of Clinical Biochemistry, University of Verona, Italy
A R T I C L E I N F O A B S T R A C T
There is a common perception that laboratory medi-cine may be occasionally perceived as neglected dis-cipline by clinicians, and that laboratory tests may be considered ordinary commodities. Although there is still debate on the real contribution of diagnostic testing in care pathways, many clinical diagnoses cannot be made without laboratory data. In support of evidence-based added value of laboratory diag-nostics, this article aims to discuss the over-reaching contribution of some recent tests to the clinical deci-sion making, and the unquestionable role they have played in revolutionizing clinical practice. These para-digmatic tests include highly-sensitive cardiac tropo-nin immunoassays for diagnosing non-ST elevation myocardial infarction, hemoglobin A1c for diagnosis and therapeutic management of diabetes, procalci-tonin for diagnosing severe bacterial infections and improving antibiotic stewardship, along with natri-uretic peptides for early diagnosing and managing heart failure. It is advisable that altogether these paradigms will help reaffirming the vital role of labo-ratory medicine in modern healthcare.
Corresponding author:Giuseppe LippiSection of Clinical Biochemistry University Hospital of VeronaPiazzale LA Scuro37134 Verona ItalyE-mail: [email protected]
Key words:laboratory testing, diagnosis,clinical practice
eJIFCC2019Vol30No1pp007-013Page 8
Giuseppe LippiThe irreplaceable value of laboratory diagnostics
INTRODUCTION
Laboratory medicine is conventionally defined as a science devoted to generate clinically use-ful information by analyzing the concentration, composition and/or structure of analytes in bio-logical fluids [1]. Throughout the relatively long history of this discipline as we currently know it, and which probably commenced around the 19th century [2], laboratory diagnostics is now providing an almost invaluable contribution to the clinical decision making. Although there is still an open debate on the real influence of diagnostic testing in care pathways, as mir-rored by fierce controversies on the reiterated assumption that clinical laboratory intervenes in 70% of clinical decisions [3], it is now incon-testable that many clinical diagnoses cannot be made without laboratory data. In support of the evidence-based added value of labora-tory diagnostics, this article aims to discuss the over-reaching contribution of some recent tests to the clinical decision making, and the unques-tionable role they have played in profoundly revolutionizing clinical practice.
CARDIAC TROPONINS
Cardiac troponins are essential components of the muscle contractile apparatus, includ-ing myocardial tissue. In myocardial cells, two unique and exclusive isoforms of cardiac tro-ponin I (cTnT) and cardiac troponin T (cTnT) are present, so that their immunochemical measure-ment allows to accurately establishing whether or not the heart tissue has been injured, even in the absence of open signs and symptoms of heart damage [4]. Unlike former methods, the recent development of fourth-generation highly-sensitive immunoassays has enabled measuring physiological concentrations of both cTnI and cTnT, and to more accurately redefine the diagnostic thresholds for identifying myo-cardial injury, thus including acute myocardial
infarction. According to recent guidelines and recommendations, when the clinical presen-tation is suggestive for myocardial ischemia, a dynamic elevation of cardiac troponins in the absence of any other objective finding (e.g., normal electrocardiogram) is regarded as diag-nostic of non-ST elevation myocardial infarction (NSTEMI) [5,6]. The first breakthrough occurred after introducing high-sensitivity immunoassays in routine clinical practice has been a substan-tial decrease in the number of diagnoses of un-stable angina, in favor of an increment of those of NSTEMI, thus leading the way to hypothesize that a requiem should be prepared for unstable angina [7]. On the other hand, the improved ac-curacy of these last generation, high-sensitivity cardiac troponin immunoassays has contrib-uted to amplify the rate of patients diagnosed with NSTEMI (i.e., by 20-30%) [5,6], who would have been earlier discharged with inaccurate diagnosis and without appropriate medical or pharmacological treatment. Is there any doubt left that high-sensitivity cardiac troponin immu-noassays have revolutionized the diagnostics of myocardial infarction and improved the man-aged care of this condition? Certainly not.
HEMOGLOBIN A1c
Hemoglobin A1c, also known as glycated hemo-globin, results from the nonenzymatic binding of hexose to the N-terminal amino acid of the he-moglobin molecule A1, which is contained into the erythrocytes. Its concentration is hence di-rectly proportional to the average blood glucose level over the preceding 8-12 weeks [8]. Owing to this important biological information, hemo-globin A1c has been for long used for monitor-ing glucose control in diabetic patients. A major breakthrough has however occurred, when the American Diabetes Association (AHA) has pub-lished updated recommendations for classifi-cation and diagnosis of diabetes [9], according to which diabetes can now be diagnosed also

eJIFCC2019Vol30No1pp007-013Page 9
Giuseppe LippiThe irreplaceable value of laboratory diagnostics
in the presence of a hemoglobin A1c value >48 mmol/mol (i.e., >6.5%) measured with an as-say certified by the National Glycohemoglobin Standardization Program (NGSP) and standard-ized to the Diabetes Control and Complications Trial (DCCT) assay. The routine assessment of hemoglobin A1c has hence enabled overcoming many of the well-known drawbacks of plasma glucose measurement (either fasting, random or during an oral glucose tolerance test), which essentially include the relative instability of glucose concentration in uncentrifuged blood samples, the high intra-individual variation of blood glucose, as well as biological (i.e., acute stress, drugs) and analytical interference [10]. Moreover, the measurement of hemoglobin A1c will now enable garnering a dual clinical in-formation, since it not only allows to diagnos-ing diabetes, but will contextually provide im-portant clinical information on medium-term glycaemic control. Recent evidence supports the conclusion that the measurement of fasting plasma glucose may underestimate the real bur-den of diabetes compared to hemoglobin A1c assessment, leaving this condition undiagnosed (and hence untreated) in up to one-third of pre-diabetic or diabetic patients [11,12]. Due to the clinical, social and economic burden caused by a delayed diagnosis of diabetes, it seems rea-sonable to conclude that routine assessment of hemoglobin A1c has the potential to generate a highly favorable impact on both diagnosis and management of diabetes.
PROCALCITONIN
The greatest drawback in sepsis diagnostics is that the current scoring systems based on inte-gration of clinical and laboratory data, namely the host systemic inflammatory response syn-drome criteria (SIRS), the Sequential [Sepsis-related] Organ Failure Assessment (SOFA) and the quick SOFA (qSOFA) scores, have limited diagnostic efficiency, because they have been
mostly validated for predicting prognosis and death [13]. Therefore, their use for identifying sepsis would not permit an early diagnosis, and could even leave some patients underdiagnosed/untreated.
Procalcitonin is the 141 amino acids precursor of calcitonin, the leading hormone involved in calcium homeostasis [14]. In physiological con-ditions, procalcitonin is produced by thyroid C cells and then converted in the mature form calcitonin into the circulation. In patients with severe infections, the synthesis of procalcitonin occurs also in many extra-thyroid tissues (i.e., liver, kidneys, lungs, pancreas), thus boosting an increase of its circulating concentration over the physiological reference range (i.e., <0.05 ng/mL) [15]. This peculiar biological behavior is now exploited for diagnosing severe infections, especially sepsis.
The number of studies and meta-analyses which have analyzed the diagnostic performance of procalcitonin for both diagnosing and managing sepsis has exponentially increased over the past decade. According to a recent meta-analysis published by Tan et al [16], procalcitonin dis-plays 85% diagnostic accuracy (with 0.80 sensi-tivity and 0.77 specificity) for diagnosing sepsis, which appears sensibly higher than that of C reactive protein (e.g., 73%, with 0.80 sensitiv-ity and 0.61 specificity). Even more importantly, in another recent meta-analysis published by Meier et al [17], procalcitonin-guided antibiotic management was found to be effective to signif-icantly shorten the duration of antibiotic thera-py (mean variation, -2.86 days), thus represent-ing a valuable step forward toward reducing the worldwide burden of antibiotic resistance [18]. It is also worthwhile mentioning here that procalcitonin-guided antibiotic management seems also associated with substantial econom-ic savings, as recently highlighted by Schuetz et al [19]. It is hence reasonable to conclude that the use of this simple and rapid test holds great
eJIFCC2019Vol30No1pp007-013Page 10
Giuseppe LippiThe irreplaceable value of laboratory diagnostics
promise to consistently improve clinical out-comes (i.e., earlier diagnosis), reduce the risk of antibiotic resistance (i.e., tailored therapy, shortened administration), but may also gener-ate favorable revenues on healthcare budgets.
NATRIURETIC PEPTIDES
Natriuretic peptides are a family of protein hormones exerting a vast array of metabolic functions, including natriuresis, diuresis, vaso-dilation and improved insulin sensitivity [20]. Among the four members of this family, b-type natriuretic peptide (BNP) and the N-terminal fragment of pro-BNP (NT-proBNP) are produced in the left ventricular myocardium in response to myocyte distension due to pressure overload or volume expansion [21]. This important bio-logical property has catalyzed the measurement of both BNP and NT-proBNP in the diagnostics of heart failure. In the 2016 guidelines of the European Society of Cardiology (ESC) [22], the measurement of BNP or NT-proBNP has been included among the essential diagnostic tests in heart failure, alone or in combination with echocardiography. The reason underlying this assumption is that increased values of these peptides will help accelerating the diagnosis, identifying patients needing additional cardiac testing or accurately and safely ruling out heart failure in those with non-diagnostic values. Notably, in the meta-analysis of Roberts et al [23], both BNP and NT-proBNP displayed excel-lent performance for diagnosing acute heart failure (0.95-0.99 sensitivity and 0.94-0.98 neg-ative predictive value, respectively). In another recent meta-analysis published by Pufulete et al [24], BNP-guided therapy was found to be effective in reducing by nearly 20% the number of further readmissions for heart failure. Even more importantly, in heart failure patients aged <75 years, BNP-guided therapy was also associated with 24% higher median survival and 13% quality-adjusted life-years gain [25].
Finally, stronger evidence was also found that BNP-guided care may be a cost-effective option to clinically-guided care in patients with heart failure and impaired ejection fraction [26]. It is hence undeniable that BNP-driven care has the great potential to improve the diagnosis of heart failure, lower the risk of developing left ventricular systolic dysfunction and ameliorate the quality of life of heart failure patients.
CONCLUSIONS
There is a common perception that laboratory medicine may be occasionally perceived as a neglected discipline by clinicians [27]. The valid-ity of this assumption is reflected by the many publications in which a deep knowledge of the real significance of laboratory tests is lacking, so that diagnostic testing is finally considered an ordinary commodity.
For example, in a recent article published in JAMA Internal Medicine, Morgan et al concluded that high-sensitivity troponin testing often yields a high number of false-positive results in pa-tients with suspected myocardial infarction [28]. In another recent article published in the British Medical Journal, O’Sullivan et al hypothesized that many of the vitamin D tests ordered in the UK are unnecessary screening, and this conclu-sion was supported by the evidence that test prescriptions have increased by over 50% be-tween 2000/1 and 2015/16 in that country [29].
These assumptions symbolize a limited apprecia-tion of the actual significance and implication of laboratory tests. Regarding cardiac troponins, an increased value is indeed an essential criterion for diagnosing myocardial injury, although a con-centration above the diagnostic threshold does not disclose the type of underlying cardiac dam-age. Therefore, cardiac troponin testing can be ordered for many important reasons other than for diagnosing myocardial infarction, such as in patients with myocarditis, cardiac contusion,
eJIFCC2019Vol30No1pp007-013Page 11
Giuseppe LippiThe irreplaceable value of laboratory diagnostics
cardiotoxicity. It is disappointing to infer that the clinical use of cardiac troponins remains still uncertain nearly 20 years after the publication of the first universal definition of myocardial in-farction [6].
As regards vitamin D, the increased number of requests shall be interpreted according to the temporal trend of vitamin D deficiency. A recent study, analyzing the trends in diagnosing vitamin D deficiency in the UK, has concluded that this condition has increased by over 15-fold between 2008-2014, as consequence of many environ-mental factors [30]. Since vitamin D deficiency not only is a major contributor of skeletal health (by lowering the risk of osteoporosis and frac-tures), but also seems to play an essential role in decreasing the risk of many human patholo-gies (e.g., cancer, cardiovascular disease, auto-immune and infectious diseases, and so forth) [31], an increasing number of prescriptions is not certainly unexpected or unreasonable, and cannot be straightforwardly associated with inappropriateness.
This paradigmatic examples underscore the fact that clinical reasoning is unavoidable for accu-rate interpretation of laboratory test results, and that a deep knowledge of the real significance of
each laboratory test is essential for preventing a deplorable underestimation of the added value of in vitro diagnostic testing.
In conclusion, although it is predictable that the extent to which laboratory testing informs the clinical decision making will remain controver-sial [3], it cannot be denied that the contribu-tion of laboratory medicine in modern health-care remains pivotal, since it helps predicting susceptibility to disease, making accurate diag-noses, prognosticating and monitoring diseases [32], and will become even more important in the future for the ongoing diffusion of disrup-tive technologies (i.e., genomics, proteomics, theranostics) and personalized (precision) med-icine [33].
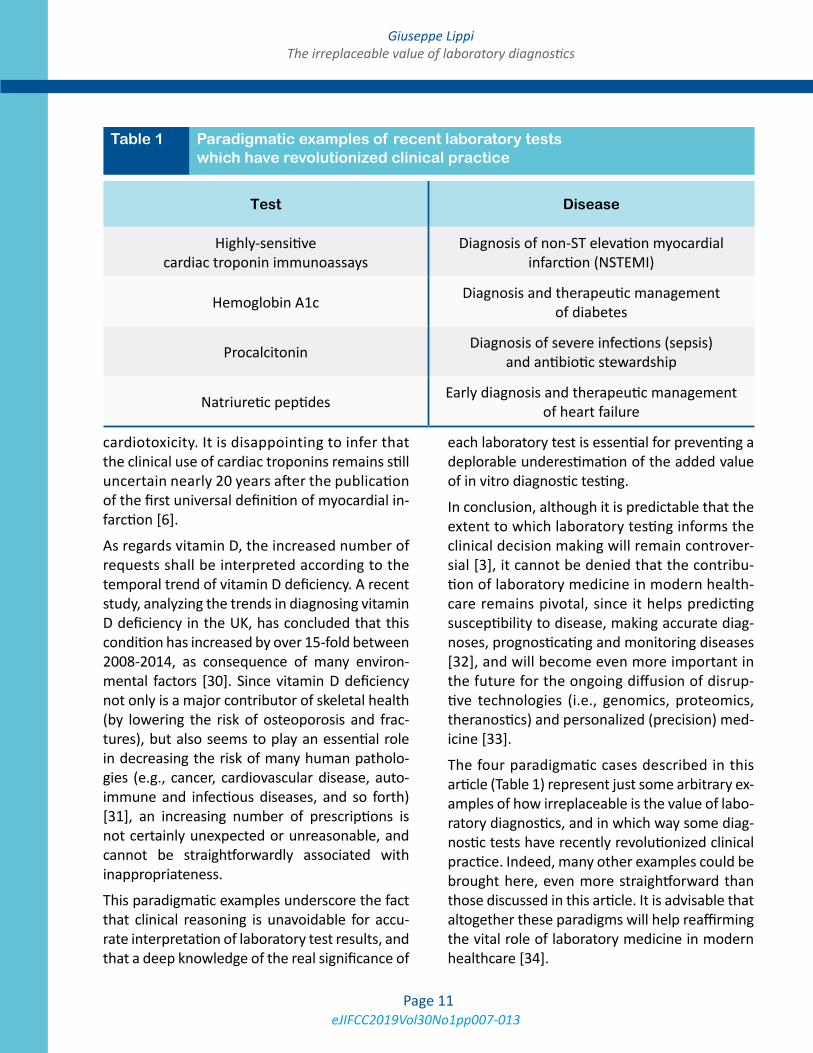
The four paradigmatic cases described in this article (Table 1) represent just some arbitrary ex-amples of how irreplaceable is the value of labo-ratory diagnostics, and in which way some diag-nostic tests have recently revolutionized clinical practice. Indeed, many other examples could be brought here, even more straightforward than those discussed in this article. It is advisable that altogether these paradigms will help reaffirming the vital role of laboratory medicine in modern healthcare [34].
Test Disease
Highly-sensitive cardiac troponin immunoassays
Diagnosis of non-ST elevation myocardial infarction (NSTEMI)
Hemoglobin A1c Diagnosis and therapeutic management of diabetes
Procalcitonin Diagnosis of severe infections (sepsis) and antibiotic stewardship
Natriuretic peptides Early diagnosis and therapeutic management of heart failure
Table 1 Paradigmatic examples of recent laboratory tests which have revolutionized clinical practice
eJIFCC2019Vol30No1pp007-013Page 12
Giuseppe LippiThe irreplaceable value of laboratory diagnostics
REFERENCES
1. Plebani M, Lippi G (2017) Uncertainty, quality, safety and accreditation in laboratory medicine. J Lab Precis Med 2:80.
2. Burke MD (2000) Laboratory medicine in the 21st Cen-tury. Am J Clin Pathol 114:841-846.
3. Hallworth MJ (2018) That ‘70%’ claim again …. Ann Clin Biochem 55:517-518.
4. Korley FK, Jaffe AS (2016) High Sensitivity Cardiac Tro-ponin Assays - How to Implement them Successfully. EJIF-CC 2016;27:217-223.
5. Roffi M, Patrono C, Collet JP, et al (2016) 2015 ESC Guidelines for the management of acute coronary syn-dromes in patients presenting without persistent ST-seg-ment elevation: Task Force for the Management of Acute Coronary Syndromes in Patients Presenting without Per-sistent ST-Segment Elevation of the European Society of Cardiology (ESC). Eur Heart J 37:267-315.
6. Thygesen K, Alpert JS, Jaffe AS, (2018) Fourth Universal Definition of Myocardial Infarction (2018). J Am Coll Car-diol 72:2231-2264.
7. Braunwald E, Morrow DA (2013) Unstable angina: is it time for a requiem? Circulation 127:2452-2457.
8. Sacks DB (2012) Measurement of hemoglobin A(1c): a new twist on the path to harmony. Diabetes Care 35:2674-2680.
9. American Diabetes Association (2018) Classification and Diagnosis of Diabetes: Standards of Medical Care in Diabetes-2018. Diabetes Care 41(Supplement 1):S13-S27.
10. Lippi G, Targher G (2010) Glycated hemoglobin (HbA1c): old dogmas, a new perspective? Clin Chem Lab Med 48:609-614.
11. Okosun IS, Davis-Smith M, Paul Seale J et al (2012) Applicability of a combination of hemoglobin A(1c) and fasting plasma glucose in population-based prediabetes screening. J Diabetes 4:407-416.
12. Ho-Pham LT, Nguyen UDT, Tran TX, et al (2017) Dis-cordance in the diagnosis of diabetes: Comparison be-tween HbA1c and fasting plasma glucose. PLoS One 12:e0182192.
13. Lippi G, Montagnana M, Balboni F, et al (2017) Acad-emy of Emergency Medicine and Care-Society of Clinical Biochemistry and Clinical Molecular Biology consensus recommendations for clinical use of sepsis biomarkers in the emergency department. Emerg Care J 13:6877.
14. Lippi G, Cervellin G (2018) Procalcitonin for diagnos-ing and monitoring bacterial infections: for or against? Clin Chem Lab Med 56:1193-1195.
15. Morgenthaler NG, Struck J, Chancerelle Y, et al (2003) Production of procalcitonin (PCT) in non-thyroidal tissue after LPS injection. Horm Metab Res 35:290-295.
16. Tan M, Lu Y, Jiang H, et al (2018) The diagnostic accu-racy of procalcitonin and C-reactive protein for sepsis: A systematic review and meta-analysis. J Cell Biochem 2018 Nov 11. doi: 10.1002/jcb.27870. [Epub ahead of print].
17. Meier MA, Branche A, Neeser OL, et al (2018) Procal-citonin-guided antibiotic treatment in patients with posi-tive blood cultures: A patient-level meta-analysis of ran-domized trials. Clin Infect Dis. 2018 Oct 25. doi: 10.1093/cid/ciy917. [Epub ahead of print].
18. Zaman SB, Hussain MA, Nye R, et al (2017) A Review on Antibiotic Resistance: Alarm Bells are Ringing. Cureus 9:e1403.
19. Schuetz P, Balk R, Briel M, et al (2015) Economic eval-uation of procalcitonin-guided antibiotic therapy in acute respiratory infections: a US health system perspective. Clin Chem Lab Med 53:583-592.
20. Gupta DK, Wang TJ (2015) Natriuretic Peptides and Cardiometabolic Health. Circ J 79:1647-1655.
21. Maalouf R, Bailey S (2016) A review on B-type natri-uretic peptide monitoring: assays and biosensors. Heart Fail Rev 21:567-578.
22. Ponikowski P, Voors AA, Anker SD, et al (2016) 2016 ESC Guidelines for the diagnosis and treatment of acute and chronic heart failure: The Task Force for the diagnosis and treatment of acute and chronic heart failure of the European Society of Cardiology (ESC). Developed with the special contribution of the Heart Failure Association (HFA) of the ESC. Eur J Heart Fail 18:891-975.
23. Roberts E, Ludman AJ, Dworzynski K, et al (2015) The diagnostic accuracy of the natriuretic peptides in heart failure: systematic review and diagnostic meta-analysis in the acute care setting. BMJ 350:h910.
24. Pufulete M, Maishman R, Dabner L, et al (2018) B-type natriuretic peptide-guided therapy for heart failure (HF): a systematic review and meta-analysis of individual participant data (IPD) and aggregate data. Syst Rev 7:112.
25. Pufulete M, Maishman R, Dabner L, et al (2017) Effec-tiveness and cost-effectiveness of serum B-type natriuret-ic peptide testing and monitoring in patients with heart failure in primary and secondary care: an evidence syn-thesis, cohort study and cost-effectiveness model. Health Technol Assess 21:1-150.
26. Mohiuddin S, Reeves B, Pufulete M, et al (2016) Mod-el-based cost-effectiveness analysis of B-type natriuretic peptide-guided care in patients with heart failure. BMJ Open 6:e014010.

eJIFCC2019Vol30No1pp007-013Page 13
Giuseppe LippiThe irreplaceable value of laboratory diagnostics
27. Plebani M (2018) Quality and future of clinical labo-ratories: the Vico’s whole cyclical theory of the recurring cycles. Clin Chem Lab Med 56:901-908.
28. Morgan DJ, Dhruva SS, Coon ER, et al (2018) 2018 Up-date on Medical Overuse. JAMA Intern Med. 2018 Dec 3. doi: 10.1001/jamainternmed.2018.5748. [Epub ahead of print].
29. O’Sullivan JW, Stevens S, Hobbs FDR, et al (2018) Temporal trends in use of tests in UK primary care, 2000-15: retrospective analysis of 250 million tests. BMJ 363:k4666.
30. Basatemur E, Horsfall L, Marston L, et al (2017) Trends in the Diagnosis of Vitamin D Deficiency. Pediatrics. 2017 Mar;139(3). pii: e20162748. doi: 10.1542/peds.2016-2748. Epub 2017 Feb 3.
31. Wacker M, Holick MF (2013) Vitamin D - effects on skel-etal and extraskeletal health and the need for supplemen-tation. Nutrients 5:111-148.
32. Plebani M, Laposata M, Lippi G (2019) A manifesto for the future of laboratory medicine professionals. Clin Chim Acta 489:49-52.
33. Lippi G, Bassi A, Bovo C (2016) The future of labora-tory medicine in the era of precision medicine. J Lab Pre-cis Med 1:7
34. Lippi G, Plebani M (2018) Cost, profitability and value of laboratory diagnostics: in God we trust, all others bring data. J Lab Med. 2018 Dec 20. Doi: 10.1515/labmed-2018-0151 [Epub ahead of print].
eJIFCC2019Vol30No1pp014-024Page 14
This is a Platinum Open Access Journal distributed under the terms of the Creative Commons Attribution Non-Commercial License which permits unrestricted non-commercial use, distribution, and reproduction in any medium, provided the original work is properly cited.
Factors affecting turnaround time in the clinical laboratory of the Kathmandu University Hospital, NepalRajendra Dev Bhatt1, Chandani Shrestha2, Prabodh Risal3
1 Department of Clinical Biochemistry Laboratory, Dhulikhel Hospital, Nepal2 Kathmandu University School of Science, Nepal3 Department of Biochemistry, School of Medical Sciences, Kathmandu University, Nepal
A R T I C L E I N F O A B S T R A C T
Background
The turnaround time (TAT) as defined by most of the laboratories is the time interval between the specimens received in the laboratory to the time of reports dispatched with verification. Nearly 80% of hospital-attached clinical laboratories receive com-plaints about delayed TAT. Reporting in time is a cru-cial indicator of quality services along with accurate, precise and reliable reports, thus each clinical labo-ratory should identify affecting factors to eliminate them for the enhancement of quality services.
Methodology
Dhulikhel Hospital-Kathmandu University Hospital is a tertiary care hospital, where this observational descriptive study was conducted in 2017. Requested tests received on database in the Department of Clinical Biochemistry Laboratory along with test req-uisition form (TRF) were carefully screened for any possible error. When analysis of individual patient’s tests was completed, results of individual parame-ters were entered in the database manually. TAT was
Corresponding author:Rajendra Dev BhattDepartment of Clinical BiochemistryDhulikhel Hospital Kathmandu University HospitalDhulikhel NepalE-mail: [email protected]
Key words:turnaround time (TAT), quality service, total testing process (TTP)
Competing interests:Authors declared that they had no conflicts of interest.
eJIFCC2019Vol30No1pp014-024Page 15
Rajendra Dev Bhatt, Chandani Shrestha, Prabodh RisalFactors affecting turnaround time in the clinical laboratory of the Kathmandu University Hospital
calculated as a time period between specimens received to analysis completed. Once test anal-ysis has completed it was immediately followed by verification.
Results
A total of 36,108 patients’ reports generated from the Department of Clinical Biochemistry Laboratory during study period were analyzed. Nearly 36% of reports exceeded the predefined TAT in case of stat tests, while around 7% of re-ports were out of predefined TAT in case of rou-tine tests. Among prolonged TAT, around 75% of reports were delayed due to various extra ana-lytical reasons and approximately 48% of total delayed reports were found only due to error by cash unit.
Conclusion
The major reasons of delayed laboratory reports were due to time consumed to fix the pre-an-alytical errors created by other departments rather than laboratory itself. Cash unit alone has the highest degree of error in total testing process and it is the most significant factor for prolonged TAT. However reasons for prolonged TAT may vary with hospital to hospital depend-ing upon different factors.
INTRODUCTION
Most of the medical decisions are made on the basis of laboratory findings 1. So, clinical labora-tory findings must be accurate and well-timed. Waiting for laboratory reports for long time is often disappointing for patients and clini-cians too. Hence, it is better for each labora-tory to have its own turnaround time (TAT) 2-5. Accuracy, reproducibility and punctuality have their own grounds in the field of clinical labo-ratory science 6,7. However, in general clinical
laboratories focus on accuracy and reliability of the test reports and pay less attention to the prompt release of laboratory reports 8. Early diagnosis and appropriate treatment of the patients is an outcome of the calculated accu-racy and well-timed execution of the work 9, 10. Analysis of the test report in time can also be an important factor for the patients to cut out their expenses by shortening the time of their hospital stay 9, 10.
The total/therapeutic TAT is the time “from vein to brain”, it is the interval between the test re-quest and the therapeutic decision, while the laboratory TAT starts when the sample arrives at the laboratory and ends when the report is released after the validation of the results 11, 12. However, many laboratories confine their defi-nition of TAT to intra-laboratory due to limita-tions in control of extra laboratory factors 13.
TAT varies from laboratory to laboratory and also depends on the varying explanation of the labo-ratories and the clinicians 11, 14. Furthermore, TAT can also be categorized on the basis of test types and patient’s priority (outpatients, inpatients, emergency) 11. Total Testing Process (TTP) in clin-ical laboratory, as described by Lundberg, has nine steps namely, ordering, collection, identi-fication, transportation, preparation, analysis, reporting, interpretation and action 15.
A study done by the College of American Pathologists, CAP Q-Probes, in 1998, found that, 41% of the laboratories defined emergen-cy TAT as the interval between sample arrival and result reporting, 27% defined it as the time from test ordering to reporting of the results and 18% defined it as the interval between sample collection and result reporting 16.
TAT is a measure of punctuality and is often re-garded as one of the determinants of laboratory efficiency 9. Humans, being impatient by nature, need everything to be done rapidly including the clinical laboratory reports. Thus, they prefer

eJIFCC2019Vol30No1pp014-024Page 16
Rajendra Dev Bhatt, Chandani Shrestha, Prabodh RisalFactors affecting turnaround time in the clinical laboratory of the Kathmandu University Hospital
the hospitals that guarantee fast service and do not make them wait for long hours for their test reports and proper diagnosis, treatment and management of their problems. These facts thus prove TAT crucial for both, medical as well as commercial point of view 6.
Total laboratory testing process is divided into three phases, namely; pre-analytical, analytical and post-analytical, and TAT depends on these three phases 17. The pre-analytical phase re-fers to the time period between requisition of test to the sample being reached to the hands of professionals and prepared for analysis. The analytical phase is the period of measure-ment; this is the interval between the begin-ning of the measurement (actual testing) and the confirmation of the test results. The post-analytical period indicates the time from result verification or printing to the time when the physician actually observes the results 18, 19, 20.
Among these three phases, pre-analytical and post-analytical phases contribute to nearly 96% of the TAT 9 and factors may vary depending upon the infrastructures of the institution, de-gree of automation, and experience and attri-bution of the employee 21, 22. Dhulikhel Hospital-Kathmandu University Hospital (DH-KUH) has predefined TAT of one hour for tests requested from emergency department and intensive care unit (ICU) while two and half hour for tests re-quested from outpatient departments and in-door depart ments.
METHODOLOGY
Study design
This is a cross-sectional, descriptive and ob-servational study based on the data obtained from the Department of Clinical Biochemistry Laboratory of Dhulikhel Hospital-Kathmandu University Hospital. Obtained data were closely analyzed to observe current TAT and factors af-fecting prolonged TAT. All the samples along with
their Test Requisition Form (TRF) available at Department of Clinical Biochemistry Laboratory of Dhulikhel Hospital in six months’ time from March to August 2017 were analyzed.
Selection criteria
Inclusion criteria
All the criteria matched specimens and TRF re-ceived at the Department of Clinical Biochemistry Laboratory of Dhulikhel Hospital-Kathmandu University Hospital were analyzed.
Exclusion criteria
a. Specimens for fasting and postprandial blood glucose measurement. (As there is no system to record time of postprandial sample reception)
b. Sudden addition or cancellation of the tests via telephone by clinician.
c. Test for Sex Hormone Binding Globulin, Vitamin B12, Folic acid and Anti Cyclic Citrullinated Peptide. (These tests are per-formed twice a week only)
d. Test for hemoglobin or serum protein Electrophoresis. (Performed weekly only)
Data collection and TAT calculation
The time of sample arrival and time of analysis completed were recorded in Excel tables and the differences were calculated. Simultaneously, if any obstacle was found in TTP, it was mentioned in TRF and was noted in the spread sheet.
Procedure
In the specimen collection unit, collection time was mentioned in TRF and collected samples and TRFs were transported to the Department of Clinical Biochemistry Laboratory by trained staff. The TRFs and samples were then received by technician in the Department of Clinical Biochemistry Laboratory and verified according
eJIFCC2019Vol30No1pp014-024Page 17
Rajendra Dev Bhatt, Chandani Shrestha, Prabodh RisalFactors affecting turnaround time in the clinical laboratory of the Kathmandu University Hospital
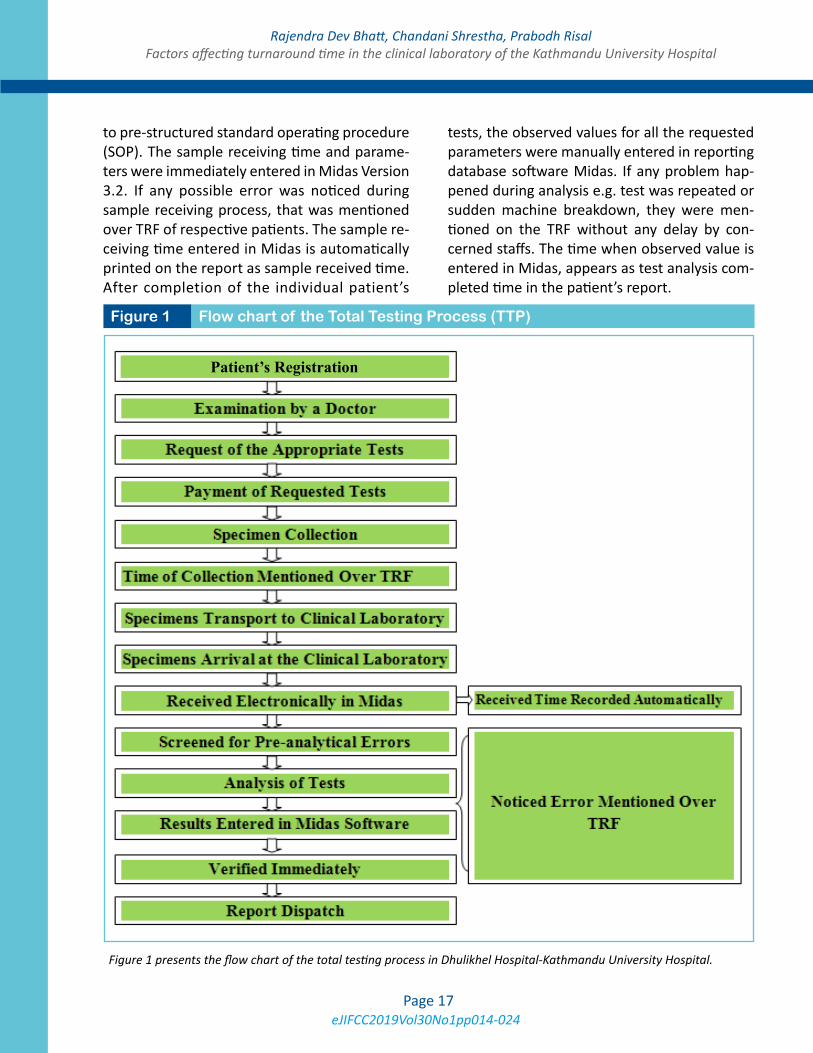
to pre-structured standard operating procedure (SOP). The sample receiving time and parame-ters were immediately entered in Midas Version 3.2. If any possible error was noticed during sample receiving process, that was mentioned over TRF of respective patients. The sample re-ceiving time entered in Midas is automatically printed on the report as sample received time. After completion of the individual patient’s
tests, the observed values for all the requested parameters were manually entered in reporting database software Midas. If any problem hap-pened during analysis e.g. test was repeated or sudden machine breakdown, they were men-tioned on the TRF without any delay by con-cerned staffs. The time when observed value is entered in Midas, appears as test analysis com-pleted time in the patient’s report.
Figure 1 Flow chart of the Total Testing Process (TTP)
Figure 1 presents the flow chart of the total testing process in Dhulikhel Hospital-Kathmandu University Hospital.
Patient’s Registration
eJIFCC2019Vol30No1pp014-024Page 18
Rajendra Dev Bhatt, Chandani Shrestha, Prabodh RisalFactors affecting turnaround time in the clinical laboratory of the Kathmandu University Hospital
Any factors that were encountered during the whole process, from receiving the samples to releasing the reports, might be responsible for prolonged TAT. They were mentioned on the TRF by concerned staff and were closely monitored by the author and research assistant. Every day all the criteria matching reports generated from the Department of Clinical Biochemistry Laboratory were analyzed for current TAT, to-gether with the reasons of prolonged TAT men-tioned on the TRFs. TTP was performed, as shown in Figure 1.
Ethical considerations
The research proposal was submitted to the Institutional Review Committee (IRC) of the Kathmandu University School of Medical Sciences, and data collection was started after getting ethical clearance.
RESULTS
This study was conducted in the year 2017 by analyzing a total of 36108 samples along with their TRF. Out of those, only 24644 samples were fit for the actual study. 11464 (31.74%) samples with TRF were not suitable because those requested tests had less than 20 minutes TAT which is practically not possible. This had happened because technical staff of clinical lab-oratory did not follow the standard operating procedure of TTP. Especially, in the late evening and night, technical staffs had done analysis of tests without receiving sample electronically in Midas, instead the samples were electronically entered only after completion of analysis or in between of analysis. So, the observed TAT was very short which is not possible in real situation (Table 1).
When 24644 patients’ reports were analyzed for TAT and affecting factors, 2434 (9.8%) of them had prolonged TAT in comparison to predefined TAT. But only 2010 patients out of 24644 were
found to have reasons documented on TRF for stretched TAT. When specific reasons for pro-longed TAT were analyzed in 2010 patient’s reports, 973 (48.4%) patients’ reports were de-layed due to problem created in cash unit either incomplete payment or payment not according to test requested in TRF.
Nearly half of the total affected TAT was ob-served due to problem in cash unit and un-fortunately patients from all the departments had to pay before test proceeds. Department of Clinical Biochemistry Laboratory reporting database is designed in such way that report cannot be generated unless a proper payment is made therefore the cash unit is the most im-portant factor for prolonged TAT in Dhulikhel Hospital.
Repetition of tests is another leading factor of prolonged TAT in the Department of Clinical Biochemistry Laboratory of DH-KUH which is 494 (24.5%) out of 2010 patients. 313 (15.5%) patients did not get their reports on predefined time due to sample related factors. Visually de-tected hemolyzed specimens were absolutely rejected which resulted in delayed reports of 210 patients. It contributed delay of 10.44% patients’ report. Furthermore, lingering of laboratory reports were due to poor invento-ry, failure of analyzers either due to irregular maintenance or lack of properly functioning analyzers were noticeable factors responsible for delay in 230 (11.4%) patients’ reports.
Table 2 clearly illustrates the number of samples from different departments in a particular time frame and their mean TAT. The frequency of long TAT is quite different among samples from ER/ICU and OPD/Indoors. Frequency of abnormal TAT for samples received from ER/ICU is five times higher than samples received from OPD and other indoor departments.
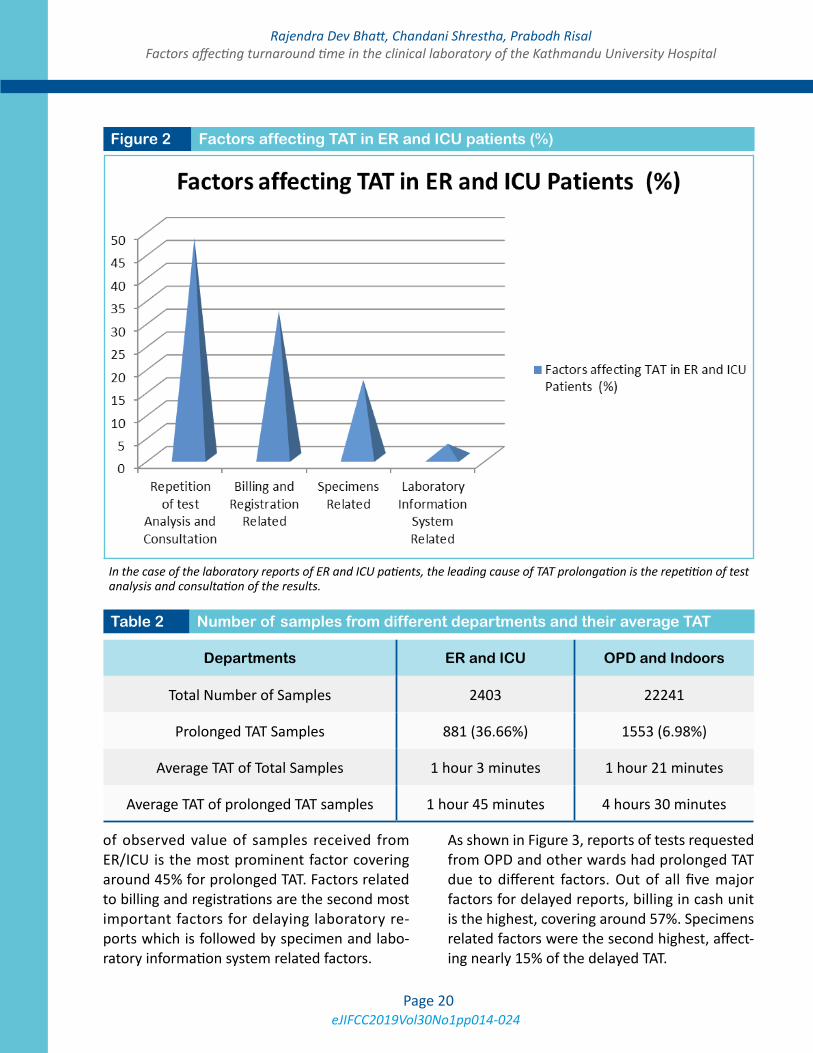
Bar graph in Figure 2 reflects that repetition of test analysis for reconfirmation and consultation

eJIFCC2019Vol30No1pp014-024Page 19
Rajendra Dev Bhatt, Chandani Shrestha, Prabodh RisalFactors affecting turnaround time in the clinical laboratory of the Kathmandu University Hospital
Factors Specific reason NumberFrequency
(%)
Payment for Tests in Cash Unit
Payment Missing (Incomplete payment) 542 26.96
Wrong payment (Not according to tests prescribed) 297 14.77
Wrong registration (Paid in another patients account) 127 6.31
Excess payment (Mostly double payment) 07 0.34
Tests Repetition Critical value reconfirmation and consultation 494 24.57
Specimen related
Hemolyzed 210 10.44
Insufficient 40 1.99
Not Received 17 0.84
Unlabelled 15 0.74
Unsuitable Specimen/test 10 0.49
Marked Lipemic 08 0.39
Mislabelled 07 0.34
Clotted 06 0.29
Reagents related Out of Stock/Not Provided/Supplied 101 5.02
Expired 20 0.99
Machine BreakdownRandom Breakdown 66 3.28
Preventive Maintenance Schedule 23 1.14
Reporting Software Breakdown Reporting System (Midas) Down 20 0.99
Total - 2010 -
Table 1 Specific reasons and their frequencies for prolonged TAT
eJIFCC2019Vol30No1pp014-024Page 20
Rajendra Dev Bhatt, Chandani Shrestha, Prabodh RisalFactors affecting turnaround time in the clinical laboratory of the Kathmandu University Hospital
of observed value of samples received from ER/ICU is the most prominent factor covering around 45% for prolonged TAT. Factors related to billing and registrations are the second most important factors for delaying laboratory re-ports which is followed by specimen and labo-ratory information system related factors.
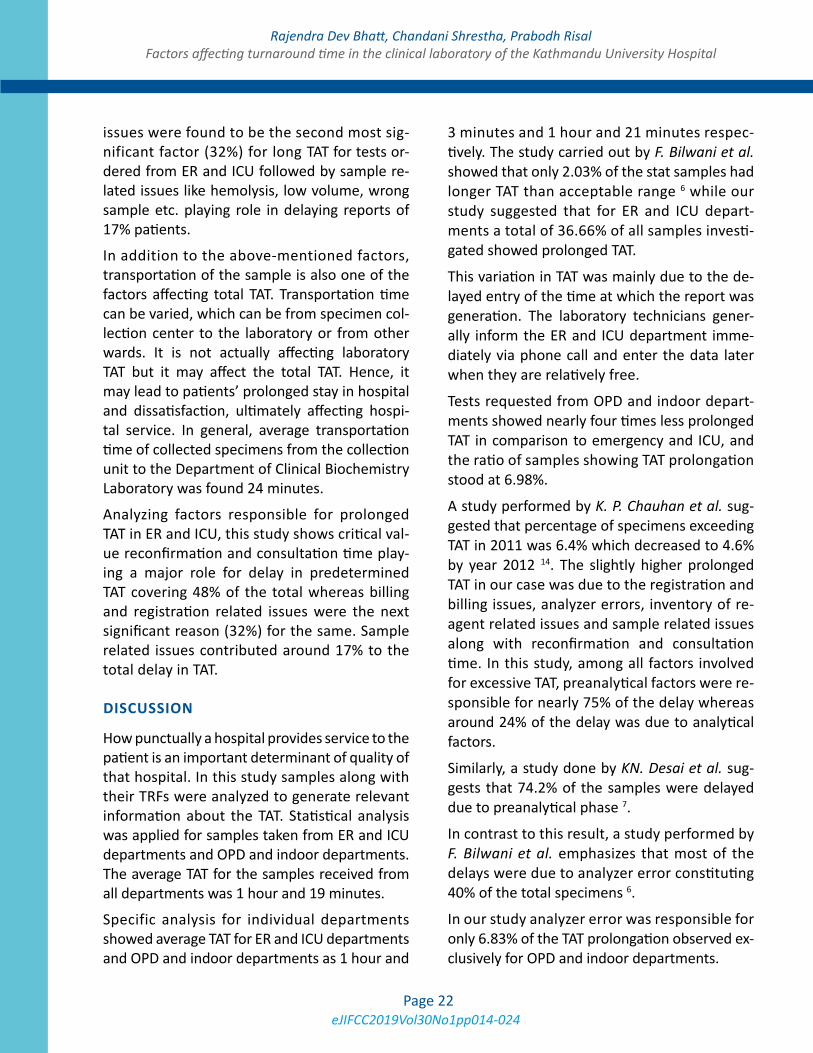
As shown in Figure 3, reports of tests requested from OPD and other wards had prolonged TAT due to different factors. Out of all five major factors for delayed reports, billing in cash unit is the highest, covering around 57%. Specimens related factors were the second highest, affect-ing nearly 15% of the delayed TAT.
Figure 2 Factors affecting TAT in ER and ICU patients (%)
In the case of the laboratory reports of ER and ICU patients, the leading cause of TAT prolongation is the repetition of test analysis and consultation of the results.
Departments ER and ICU OPD and Indoors
Total Number of Samples 2403 22241
Prolonged TAT Samples 881 (36.66%) 1553 (6.98%)
Average TAT of Total Samples 1 hour 3 minutes 1 hour 21 minutes
Average TAT of prolonged TAT samples 1 hour 45 minutes 4 hours 30 minutes
Table 2 Number of samples from different departments and their average TAT

eJIFCC2019Vol30No1pp014-024Page 21
Rajendra Dev Bhatt, Chandani Shrestha, Prabodh RisalFactors affecting turnaround time in the clinical laboratory of the Kathmandu University Hospital
When affecting factors for prolonged TAT were analyzed for individual departments, they var-ied according to types of services they provide. Such as the nature of service provided in emer-gency room (ER) and intensive care unit (ICU), where prompt action is needed and of course the laboratory reports must be delivered in time and must have less TAT than other departments
like general wards and outpatients departments (OPD).
As shown in bar graph, 48% of reports requested from ER or ICU were delayed due to time wasted in reconfirmation of obtained critical values of test. Mostly reconfirmation was done by repeat-ing the tests or informing laboratory consultant before releasing such reports. Payment related
Figure 3 Factors affecting TAT in case of OPD and indoor patients
In case of the laboratory reports of OPD and indoor patients, the TAT prolongation is mainly billing and registration related.
Repetition of Test
analy
sis an
d consu
ltation
eJIFCC2019Vol30No1pp014-024Page 22
Rajendra Dev Bhatt, Chandani Shrestha, Prabodh RisalFactors affecting turnaround time in the clinical laboratory of the Kathmandu University Hospital
issues were found to be the second most sig-nificant factor (32%) for long TAT for tests or-dered from ER and ICU followed by sample re-lated issues like hemolysis, low volume, wrong sample etc. playing role in delaying reports of 17% patients.
In addition to the above-mentioned factors, transportation of the sample is also one of the factors affecting total TAT. Transportation time can be varied, which can be from specimen col-lection center to the laboratory or from other wards. It is not actually affecting laboratory TAT but it may affect the total TAT. Hence, it may lead to patients’ prolonged stay in hospital and dissatisfaction, ultimately affecting hospi-tal service. In general, average transportation time of collected specimens from the collection unit to the Department of Clinical Biochemistry Laboratory was found 24 minutes.
Analyzing factors responsible for prolonged TAT in ER and ICU, this study shows critical val-ue reconfirmation and consultation time play-ing a major role for delay in predetermined TAT covering 48% of the total whereas billing and registration related issues were the next significant reason (32%) for the same. Sample related issues contributed around 17% to the total delay in TAT.
DISCUSSION
How punctually a hospital provides service to the patient is an important determinant of quality of that hospital. In this study samples along with their TRFs were analyzed to generate relevant information about the TAT. Statistical analysis was applied for samples taken from ER and ICU departments and OPD and indoor departments. The average TAT for the samples received from all departments was 1 hour and 19 minutes.
Specific analysis for individual departments showed average TAT for ER and ICU departments and OPD and indoor departments as 1 hour and
3 minutes and 1 hour and 21 minutes respec-tively. The study carried out by F. Bilwani et al. showed that only 2.03% of the stat samples had longer TAT than acceptable range 6 while our study suggested that for ER and ICU depart-ments a total of 36.66% of all samples investi-gated showed prolonged TAT.
This variation in TAT was mainly due to the de-layed entry of the time at which the report was generation. The laboratory technicians gener-ally inform the ER and ICU department imme-diately via phone call and enter the data later when they are relatively free.
Tests requested from OPD and indoor depart-ments showed nearly four times less prolonged TAT in comparison to emergency and ICU, and the ratio of samples showing TAT prolongation stood at 6.98%.
A study performed by K. P. Chauhan et al. sug-gested that percentage of specimens exceeding TAT in 2011 was 6.4% which decreased to 4.6% by year 2012 14. The slightly higher prolonged TAT in our case was due to the registration and billing issues, analyzer errors, inventory of re-agent related issues and sample related issues along with reconfirmation and consultation time. In this study, among all factors involved for excessive TAT, preanalytical factors were re-sponsible for nearly 75% of the delay whereas around 24% of the delay was due to analytical factors.
Similarly, a study done by KN. Desai et al. sug-gests that 74.2% of the samples were delayed due to preanalytical phase 7.
In contrast to this result, a study performed by F. Bilwani et al. emphasizes that most of the delays were due to analyzer error constituting 40% of the total specimens 6.
In our study analyzer error was responsible for only 6.83% of the TAT prolongation observed ex-clusively for OPD and indoor departments.
eJIFCC2019Vol30No1pp014-024Page 23
Rajendra Dev Bhatt, Chandani Shrestha, Prabodh RisalFactors affecting turnaround time in the clinical laboratory of the Kathmandu University Hospital
CONCLUSION
Achievement of quality service is not simply pos-sible in hospital attached laboratories without finding the factors for prolonged TAT and im-mediate improvement of that area by hospital management. However, factors affecting TAT in clinical laboratories may vary from institute to institute depending upon institutional infrastruc-ture, their own setup, policy, system and attri-butes of employees working in different depart-ments of the hospital. In case of the Department of Clinical Biochemistry Laboratory of Dhulikhel Hospital-Kathmandu University Hospital, the ma-jor reasons for delay in laboratory reports were due to the time burnt out to fix the preanalytical errors created by other departments and cash unit alone was the major factor with highest de-gree of error in total testing process.
Acknowledgements
We would like to express our sincere thanks to Mr. Prabin Gyawali, who had the courage to pio-neer predefined TAT in the Department of Clinical Biochemistry Laboratory of Dhulikhel Hospital and most probably for first time in Nepal as well. We are also thankful to all staff of Dhulikhel Hospital, especially of the Department of Clinical Biochemistry Laboratory and IT Department.
REFERENCES
1. Plebani M. Errors in clinical laboratories or errors in lab-oratory medicine? Clin Chem Lab Med. 2006;44(6):750-9.
2. Antal-Szalmas P, Ivady G, Molnar A, Hevessy Z, Kissne Szi-raki V, V Olah A, et al. [“Turnaround time”: a new parameter for the characterization of the overall efficacy of laboratory diagnostic processes]. Orv Hetil. 2007;148(28):1317-27.
3. Carraro P, Plebani M. Process control reduces the labo-ratory turnaround time. Clin Chem Lab Med. 2002;40(4): 421-2.
4. Froom P, Barak M. Auto-validation of complete blood counts in an outpatient’s regional laboratory. Clin Chem Lab Med. 2015;53(2):275-9.
5. Manor PG. Turnaround times in the laboratory: a re-view of the literature. Clin Lab Sci . 1999;12(2):85-9.
6. Bilwani F, Siddiqui I, Vaqar S. Determination of delay in turn around time (TAT) of stat tests and its causes: an AKUH experience. J Pak Med Assoc. 2003;53(2):65-7.
7. Desai KN, Shah M, Patel K, , Ranapurwala M, Chaudhari S, Shah M. Determination of Turn Around Time (TAT) in NABL (National Accredited Board of Laboratory) accred-ited hematology and clinical pathological laboratory. Int J Adv Res (Indore). 2013;1(6):192-96.
8. Kappelmayer J, Toth J. Clinical laboratories - produc-tion factories or specialized diagnostic centers. eJIFCC. 2016;27(2):156-65.
9. Angeletti S, De Cesaris M, Hart JG, Urbano M, Vitali MA, Fragliasso F, et al. Laboratory automation and intra-laboratory turnaround time: experience at the univer-sity hospital campus bio-medico of Rome. J Lab Autom. 2015;20(6):652-8.
10. Holland LL, Smith LL, Blick KE. Reducing laboratory turnaround time outliers can reduce emergency depart-ment patient length of stay: an 11-hospital study. Am J Clin Pathol. 2005;124(5):672-4.
11. Hawkins RC. Laboratory turnaround time. Clin bio-chem Rev. 2007;28(4):179-94.
12. Kost GJ. Guidelines for point-of-care testing. Improv-ing patient outcomes. Am J Clin Pathol. 1995;104(4 Suppl 1):S111-27.
13. Saxena S, Wong ET. Does the emergency department need a dedicated stat laboratory? Continuous quality im-provement as a management tool for the clinical labora-tory. Am J Clin Pathol. 1993;100(6):606-10.
14. Chauhan KP, Trivedi AP, Patel D, Gami B, Haridas N. Monitoring and root cause analysis of clinical biochemis-try turn around time at an academic hospital. Indian J Clin Biochem. 2014;29(4):505-9.
15. Lundberg GD. Acting on significant laboratory results. JAMA. 1981;245(17):1762-3.
16. Steindel SJ, Howanitz PJ. Physician satisfaction and emergency department laboratory test turnaround time. Arch Pathol Lab Med. 2001;125(7):863-71.
17. Kilgore ML, Steindel SJ, Smith JA. Evaluating stat testing options in an academic health center: therapeutic turn-around time and staff satisfaction. Clin Chem. 1998;44(8 Pt 1):1597-603.
eJIFCC2019Vol30No1pp014-024Page 24
Rajendra Dev Bhatt, Chandani Shrestha, Prabodh RisalFactors affecting turnaround time in the clinical laboratory of the Kathmandu University Hospital
18. Steindel SJ, Jones BA. Routine outpatient laboratory test turnaround times and practice patterns. Arch Pathol Lab Med. 2002;126(1):11-8.
19. Chung HJ, Lee W, Chun S, Park HI, Min WK. Analysis of turnaround time by subdividing three phases for outpatient chemistry specimens. Ann Clin Lab Sci. 2009;39(2):144-9.
20. Valenstein P. Laboratory turnaround time. Am J Clin Pathol. 1996;105(6):676-88.
21. Roy AD, Kapil J. An evaluation of turn around times (tat) in the clinical pathology laboratory of a referral hos-pital and root cause analysis of delay in despatch of re-ports. Int J Sci Res. 2014;3(8):350-359.
22. Imoh LC, Mutale M, Parker CT, Erasmus RT, Zemlin AE. Laboratory-based clinical audit as a tool for continual im-provement: an example from CSF chemistry turnaround time audit in a South-African teaching hospital. Biochem Med. 2016;26(2):194-201.
eJIFCC2019Vol30No1pp025-034Page 25
This is a Platinum Open Access Journal distributed under the terms of the Creative Commons Attribution Non-Commercial License which permits unrestricted non-commercial use, distribution, and reproduction in any medium, provided the original work is properly cited.
Hemolysis interference studies: the particular case of sodium ionJosé Antonio Delgado1, Daniel Morell-Garcia1,2, Josep Miquel Bauça1,2
1 Department of Laboratory Medicine, Hospital Universitari Son Espases, Palma, Balearic Islands, Spain2 Institució d’Investigació Sanitària de les Illes Balears (IdISBa), Spain
A R T I C L E I N F O A B S T R A C T
Background
Despite many studies assessing hemolysis interfer-ence in almost every clinically relevant magnitude, sodium has poorly been assessed. Our aim was to evaluate hemolysis interference on plasma sodium, using different strategies of hemolysis preparation, at different baseline sodium ion concentrations and bias specifications.
Methods
Two different strategies were used for the prepara-tion of hemolysis from lithium heparin blood sam-ples. Repeatibility was calculated at two levels for each strategy and interferograms were outlined for both approaches at sodium concentrations between 130-145 mmol/L. Results were interpreted according to different specifications: reference change value, RiLiBÄK, Westgard’s database, RCPA-QAP and CLIA.
Results
The coefficients of variation of the hemolyzed samples using the first strategy were lower than for the sec-ond strategy (0.23-0.78% vs 0.57-48.6%, for 0.2 g/dL
Corresponding author:Josep Miquel BauçaHospital Universitari Son EspasesCtra. de Valldemossa, 7907010 Palma, Mallorca SpainPhone: +34 871205876E-mail: [email protected]
Key words:hyponatremia, hemolysate, interference, interferogram
Competing interests:All authors declare no conflicts of interest.
eJIFCC2019Vol30No1pp025-034Page 26
José Antonio Delgado, Daniel Morell-Garcia, Josep Miquel BauçaHemolysis interference studies: the particular case of sodium ion
free Hb and 0.28-0.44% vs 0.40-135.1%, for 0.9 g/dL free Hb). Statistically significant differ-ences were seen when comparing the slopes of the pairs of interferograms at each sodium con-centration obtained by both strategies (p<0.001 for 130 mmol/L; p=0.068 for 135 mmol/L; p=0.002 for 140 mmol/L and p=0.001 for 145 mmol/L). Hemolysis cut-off values were gener-ally independent of the sodium concentration.
Conclusions
Reproducibility of hemolysate preparation is pro-cedure-dependent. A greater standardization is needed for the preparation of a true hemolysate to better quantify the degree of interference of clinically relevant analytes, especially those with higher complexity such as sodium. We found a concentration-independent cut-off value for the hemolysis index that allows the establishment of a single and robust value in every laboratory, according to their quality specifications.
INTRODUCTION
In the preanalytical phase, the in vitro lysis of red blood cells (hemolysis), which implies a re-lease of hemoglobin and other intraerythrocyte elements, is the main cause of interference and rejection in the biochemical analytical methods worldwide (1–3). In vitro hemolysis depends mainly on blood sample drawing techniques and subsequent treatment (agitation, trans-portation, storage), whereas in vivo hemoly-sis may have at least 50 causes (4,5), including Gram-positive bacteria, parasites, toxins or au-toimmune disorders. Genetic disorders such as sickle-cell disease or glucose-6-phosphate dehy-drogenase deficiency may also lead to hemolytic crises with high free hemoglobin levels in blood. There are two central mechanisms of interfer-ence by hemolysis in clinically relevant tests:
spectral (especially in spectroscopic methods, due to an overlapping of absorption spectra) and chemical (due to a release of components from red blood cells which alter the in vivo concentra-tion of the analyte) (6). Other hemolysis-derived interfering mechanisms may be due to other causes (e.g. magnesium in the measurement of total calcium concentration, or adenylate kinase in the measurement of creatine kinase activity).
A great number of studies have assessed the ef-fect of hemolysis on almost every clinically rel-evant analyte. Towards a minimization of vari-ability and a higher reproducibility, guidelines have been published both for the performance of such studies and for the in vitro simulation of hemolysis and the handling and processing of such blood specimens (7–10). The quantifica-tion of the degree of hemolysis is also funda-mental for the proper management of samples and test results (11,12).
In spite of their almost universal applicability for biomarkers in laboratory medicine, there are a few exceptions still needing a thorough exami-nation, and the paradigm of such exceptions is sodium ion. As previously reported, in vitro hemolysis is known to negatively interfere with sodium due to a diluting effect (13,14), as the intracellular concentration of sodium is signifi-cantly lower than the concentration in serum or plasma. The degree of hemolysis in a sample is frequently assessed by measuring the free he-moglobin in serum or plasma.
The preparation of a true hemolysate is crucial for the performance of studies assessing hemo-lysis interference. This term refers to the ab-sence of unhemolyzed red blood cells or other intact cells after the preparation of hemolysate. One of the procedures most commonly was first described by Meites (15), and includes a water-dilution step before freezing and thawing an anticoagulated blood sample. Other useful
eJIFCC2019Vol30No1pp025-034Page 27
José Antonio Delgado, Daniel Morell-Garcia, Josep Miquel BauçaHemolysis interference studies: the particular case of sodium ion
strategies in literature include microwave radia-tion, ultrasounds or mechanic lysis (16).
Nevertheless, the preparation of valid hemoly-sate for the study of sodium in serum or plas-ma should not have a water-addition step, as it would decrease the concentration of the ion in the solution, hence altering the (direct) rela-tionship with the hemolysis index. According to literature, intraerythrocyte sodium concentra-tion is 10-15 mmol/L (17,18), whereas sodium concentration in distilled water is negligible. As a result, the water-dilution step in the prepara-tion of a hemolysate would alter the relationship between hemoglobin (hemolysis index) and so-dium, as well as with any other intraerythrocyte biomolecule. If including this step, the greater water volume added for the preparation of the hemolysate, the greater interference observed (negatively). The equilibration with distilled wa-ter would impede the detection of the strictly negative effect of hemolysis.
Our aim was to comprehensively assess the magnitude of hemolysis interference of plasma sodium, using different strategies of hemoly-sate preparation, different baseline sodium ion concentrations and different bias specifications in their interpretation.
METHODS
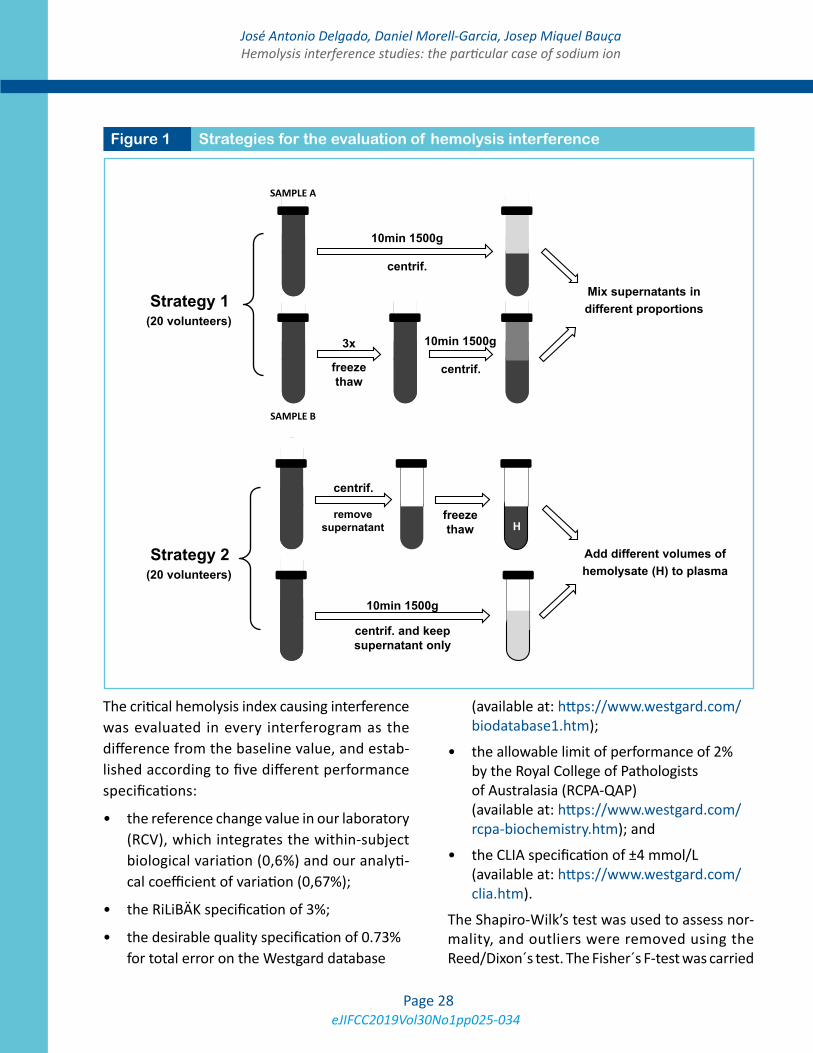
Two different study procedures were suggested in this study to parallelly assess and quantify the magnitude of interference of hemolysis on plasma sodium (Figure 1).
A total of 40 volunteers were recruited for the performance of this study: 20 for the first ap-proach, and 20 for the second.
The first approach consisted in blood extraction into two simultaneous 3.5-mL lithium heparin tubes without gel from each volunteer (ref. 368884, BD Vacutainer). One of them was di-rectly centrifuged (10min 1500g; Sample A)
while the other was previously frozen-thawed 3 times to induce hemolysis and subsequently centrifuged (Sample B). Both plasma samples A+B were mixed in different proportions, start-ing from [1000 µL A + 0 µL B] to [1000 µL A + 200 µL B] (greater proportions of B yielded excessive hemolysis, not quantifiable by the analyzer). Sodium ion was measured by indirect potenti-ometry, whereas hemolysis index was analyzed by dichromatic spectrophotometry at different wavelengths and calculated using an algorithm (Architect c16000 platform, Abbott Diagnostics, USA). Sodium in sample A (pure) was taken as reference. The experiment was performed at four concentrations of sodium: approximately 130, 135, 140 and 145 mmol/L. None of the samples was seen to by hyperlipidemic.
The second approach consisted in the simula-tion of hemolysis by removing the supernatant and the buffy coat of a plasma heparin tube, freezing-thawing it 3 times and further centri-fuging it (10min 1500g). No addition of distilled water or washing step was carried out. Pools of lithium heparin plasma were prepared at differ-ent sodium concentrations (approximately 130, 135, 140 and 145 mmol/L) using plasma from 5 different participants for each, and aliquoted into 1-mL tubes. Increasing volumes of the he-molyzed supernatant (5, 10, 20, 25, 30, 35 and 40 µL) were added to each aliquot, which were further centrifuged to remove possible intact red blood cells.
Repeatibility of both strategies was assessed by measuring 10 times the hemolysis index at 5-minute intervals in 10 samples, at two differ-ent hemolysis indices (approx. 0.2 and 0.9 g/dL) for each strategy in different days, and calculat-ing the coefficients of variation.
Interferograms were outlined for both approach-es and different initial sodium concentrations, according to guidelines (7).
eJIFCC2019Vol30No1pp025-034Page 28
José Antonio Delgado, Daniel Morell-Garcia, Josep Miquel BauçaHemolysis interference studies: the particular case of sodium ion
The critical hemolysis index causing interference was evaluated in every interferogram as the difference from the baseline value, and estab-lished according to five different performance specifications:
• the reference change value in our laboratory (RCV), which integrates the within-subject biological variation (0,6%) and our analyti-cal coefficient of variation (0,67%);
• the RiLiBÄK specification of 3%;
• the desirable quality specification of 0.73% for total error on the Westgard database
(available at: https://www.westgard.com/bio data base1.htm);
• the allowable limit of performance of 2% by the Royal College of Pathologists of Australasia (RCPA-QAP) (available at: https://www.westgard.com/rcpa-bio chemistry.htm); and
• the CLIA specification of ±4 mmol/L (available at: https://www.westgard.com/clia.htm).
The Shapiro-Wilk’s test was used to assess nor-mality, and outliers were removed using the Reed/Dixon´s test. The Fisher´s F-test was carried
Figure 1 Strategies for the evaluation of hemolysis interference
Strategy 1
SAMPLE A
SAMPLE B
freeze thaw
centrif.
centrif.
3x
Mix supernatants in different proportions
Strategy 2
centrif.
freeze thaw
centrif. and keep supernatant only
remove supernatant
Add different volumes of hemolysate (H) to plasma
H
10min 1500g
10min 1500g
10min 1500g
(20 volunteers)
(20 volunteers)
eJIFCC2019Vol30No1pp025-034Page 29
José Antonio Delgado, Daniel Morell-Garcia, Josep Miquel BauçaHemolysis interference studies: the particular case of sodium ion
out to compare variances and the Student’s t-test was used in order to compare the slopes and in-tercepts of both hemolysis-preparing strategies at each sodium concentration. Statistical signifi-cance was set at 5%. The software SPSS v.20 was used for all statistical analyses.
RESULTS
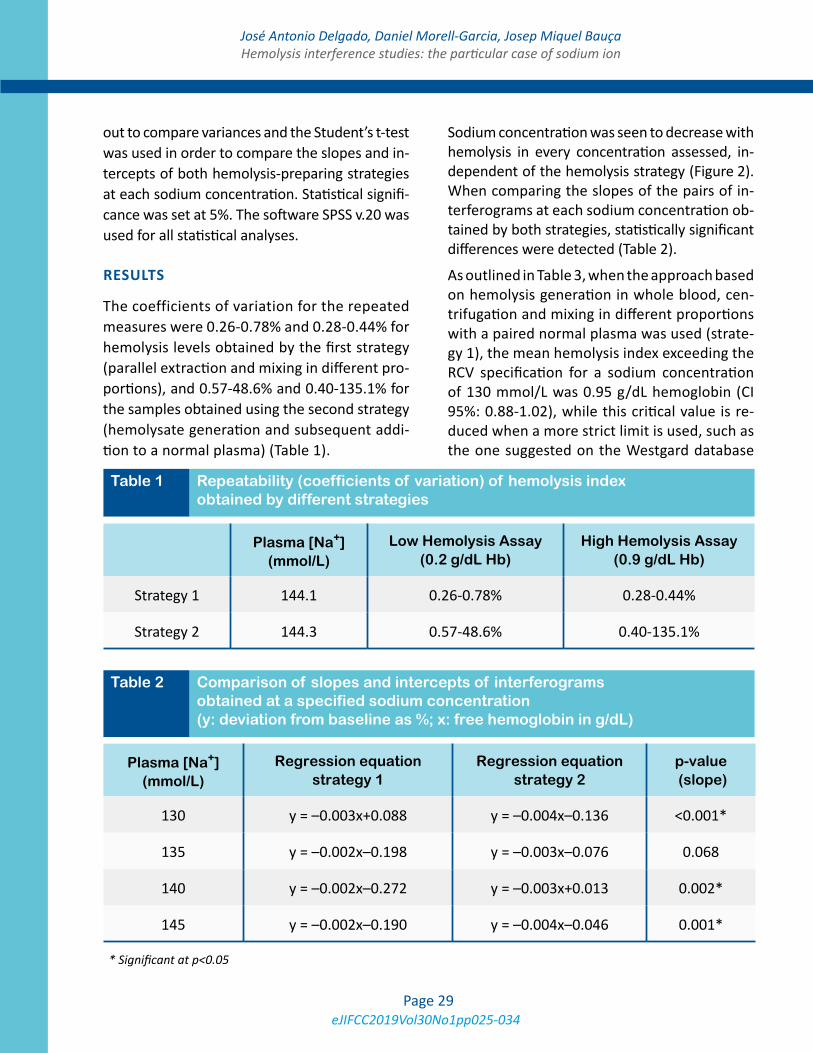
The coefficients of variation for the repeated measures were 0.26-0.78% and 0.28-0.44% for hemolysis levels obtained by the first strategy (parallel extraction and mixing in different pro-portions), and 0.57-48.6% and 0.40-135.1% for the samples obtained using the second strategy (hemolysate generation and subsequent addi-tion to a normal plasma) (Table 1).
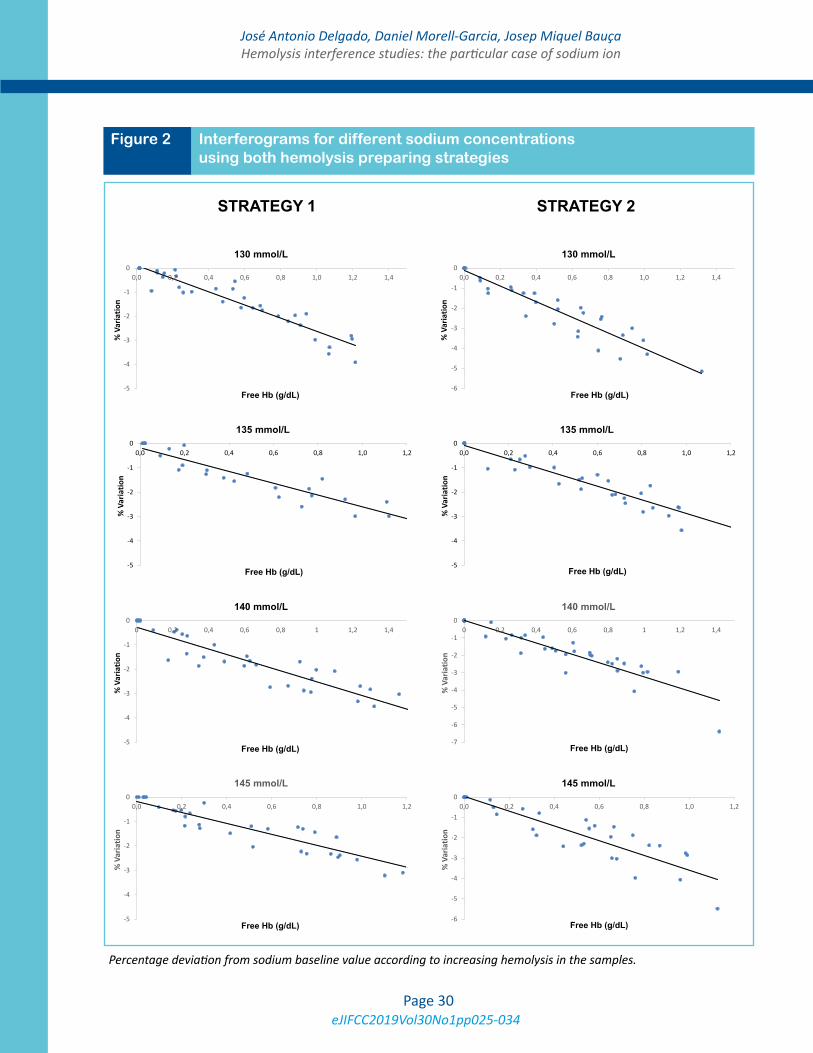
Sodium concentration was seen to decrease with hemolysis in every concentration assessed, in-dependent of the hemolysis strategy (Figure 2). When comparing the slopes of the pairs of in-terferograms at each sodium concentration ob-tained by both strategies, statistically significant differences were detected (Table 2).
As outlined in Table 3, when the approach based on hemolysis generation in whole blood, cen-trifugation and mixing in different proportions with a paired normal plasma was used (strate-gy 1), the mean hemolysis index exceeding the RCV specification for a sodium concentration of 130 mmol/L was 0.95 g/dL hemoglobin (CI 95%: 0.88-1.02), while this critical value is re-duced when a more strict limit is used, such as the one suggested on the Westgard database
Plasma [Na+] (mmol/L)
Low Hemolysis Assay (0.2 g/dL Hb)
High Hemolysis Assay (0.9 g/dL Hb)
Strategy 1 144.1 0.26-0.78% 0.28-0.44%
Strategy 2 144.3 0.57-48.6% 0.40-135.1%
Table 1 Repeatability (coefficients of variation) of hemolysis index obtained by different strategies
Table 2 Comparison of slopes and intercepts of interferograms obtained at a specified sodium concentration (y: deviation from baseline as %; x: free hemoglobin in g/dL)
* Significant at p<0.05
Plasma [Na+] (mmol/L)
Regression equation strategy 1
Regression equation strategy 2
p-value (slope)
130 y = –0.003x+0.088 y = –0.004x–0.136 <0.001*
135 y = –0.002x–0.198 y = –0.003x–0.076 0.068
140 y = –0.002x–0.272 y = –0.003x+0.013 0.002*
145 y = –0.002x–0.190 y = –0.004x–0.046 0.001*
eJIFCC2019Vol30No1pp025-034Page 30
José Antonio Delgado, Daniel Morell-Garcia, Josep Miquel BauçaHemolysis interference studies: the particular case of sodium ion
Figure 2 Interferograms for different sodium concentrations using both hemolysis preparing strategies
-6
-5
-4
-3
-2
-1
00,0 0,2 0,4 0,6 0,8 1,0 1,2 1,4
% V
aria
tion
Free Hb (g/dL)
130 mmol/L
-5
-4
-3
-2
-1
00,0 0,2 0,4 0,6 0,8 1,0 1,2 1,4
% V
aria
tion
Free Hb (g/dL)
130 mmol/L
-5
-4
-3
-2
-1
00,0 0,2 0,4 0,6 0,8 1,0 1,2
% V
aria
tion
Free Hb (g/dL)
135 mmol/L
-5
-4
-3
-2
-1
00,0 0,2 0,4 0,6 0,8 1,0 1,2
% V
aria
tion
Free Hb (g/dL)
135 mmol/L
-7
-6
-5
-4
-3
-2
-1
00 0,2 0,4 0,6 0,8 1 1,2 1,4
% V
aria
tion
Free Hb (g/dL)
140 mmol/L
-5
-4
-3
-2
-1
00 0,2 0,4 0,6 0,8 1 1,2 1,4
% V
aria
tion
Free Hb (g/dL)
140 mmol/L
-5
-4
-3
-2
-1
00,0 0,2 0,4 0,6 0,8 1,0 1,2
% V
aria
tion
Free Hb (g/dL)
145 mmol/L
-6
-5
-4
-3
-2
-1
00,0 0,2 0,4 0,6 0,8 1,0 1,2
% V
aria
tion
Free Hb (g/dL)
145 mmol/L
STRATEGY 1 STRATEGY 2
Percentage deviation from sodium baseline value according to increasing hemolysis in the samples.
eJIFCC2019Vol30No1pp025-034Page 31
José Antonio Delgado, Daniel Morell-Garcia, Josep Miquel BauçaHemolysis interference studies: the particular case of sodium ion
Free hemoglobin (g/dL)
[Na+]130mmol/L
[Na+]135mmol/L
[Na+]140mmol/L
[Na+]145mmol/L
CI for samples used in Strategy 1 (130.7-133.0) (136.2-137.7) (140.3-142.7) (145.6-148.5)
CI for samples used in Strategy 2 (131.7-133.1) (135.7-137.7) (139.3-142.5) (145.8-147.0)
RCV
(2.5%)
Strategy 1 0.95 (0.88-1.02)
0.96 (0.88-1.04)
0.99 (0.90-1.08)
1.04 (0.95-1.13)
Strategy 2 0.61 (0.56-0.67)
0.86 (0.80-0.92)
0.77 (0.70-0.84)
0.70 (0.62-0.78)
RiLiBÄK
(3%)
Strategy 1 1.13 (1.05-1.22)
1.17 (1.07-1.26)
0.93 (0.84-1.01)
0.84 (0.74-0.94)
Strategy 2 0.74 (0.68-0.80)
1.04 (0.97-1.12)
0.93 (0.84-1.01)
0.84 (0.74-0.94)
Westgard (0.73%)
Strategy 1 0.30 (0.38-0.49)
0.22 (0.30-0.45)
0.20 (0.27-0.46)
0.24 (0.33-0.48)
Strategy 2 0.15 (0.18-0.32)
0.23 (0.31-0.42)
0.23 (0.26-0.42)
0.21 (0.23-0.40)
RCPA-QAP
(2%)
Strategy 1 0.88 (0.81-0.94)
0.84 (0.77-0.90)
0.81 (0.74-0.88)
0.86 (0.78-0.93)
Strategy 2 0.56 (0.51-0.61)
0.76 (0.70-0.81)
0.65 (0.59-0.71)
0.59 (0.52-0.66)
CLIA (±4mmol/L)
Strategy 1 1.17 (1.08-1.26)
1.17 (1.08-1.26)
1.17 (1.06-1.27)
1.17 (1.06-1.28)
Strategy 2 1.17 (1.08-1.26)
1.17 (1.08-1.26)
1.17 (1.06-1.27)
1.17 (1.06-1.28)
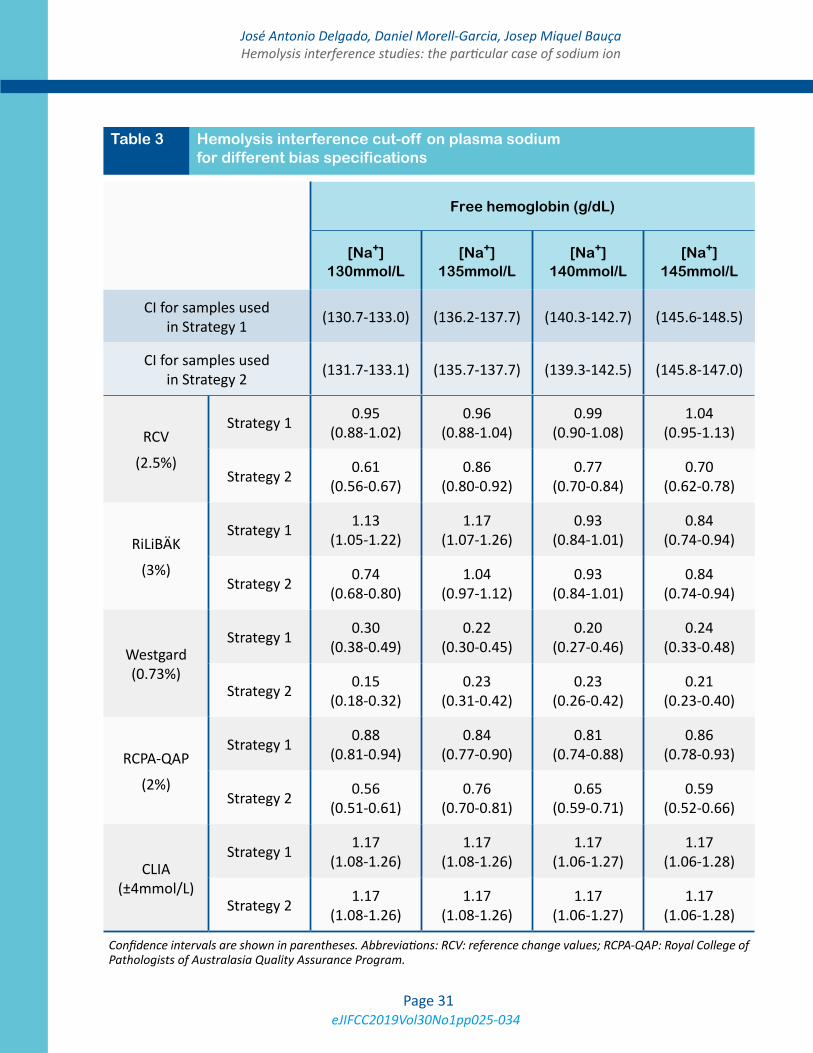
Table 3 Hemolysis interference cut-off on plasma sodium for different bias specifications
Confidence intervals are shown in parentheses. Abbreviations: RCV: reference change values; RCPA-QAP: Royal College of Pathologists of Australasia Quality Assurance Program.
eJIFCC2019Vol30No1pp025-034Page 32
José Antonio Delgado, Daniel Morell-Garcia, Josep Miquel BauçaHemolysis interference studies: the particular case of sodium ion
for desirable quality specifications for total error (0.30 mg/dL hemoglobin). When the approach based on the preparation of hemolysate and small-volume addition into normal samples was followed (strategy 2), lower hemolysis cut-off values were obtained at most concentrations. At a sodium concentration of 130 mmol/L, a hemolysis of 0.61 g/dL Hb was shown to inter-fere when the RCV specification was used, while small amounts as 0.15 g/dL Hb were seen to in-terfere when the Westgard’s specification was followed.
There is no fixed tendency in the hemolysis cut-off at different sodium concentrations. Hemolysis cut-off values are generally independent of the baseline sodium concentration.
DISCUSSION
There is currently an objective and evident im-provement in patient safety thanks to the au-tomatization in the measurement of hemolysis index in the clinical laboratories, which replaces behind the visual inspection for the decision upon their adequacy (19). The optimal hemoly-sis index cut-off value for each clinically relevant test is method- and instrument-dependent, and always subject to the previously defined quality specifications in every specific laboratory (5). In hemolysis interference studies, the procedure for the preparation of hemolysate is of utmost importance (20).
Hemolysis-preparing strategies
In our study, two different strategies were used to assess hemolysis interference at different plasma sodium concentrations. The first strategy, based on a parallel blood drawing, freeze-thawing one whole-blood sample, centrifuging and mixing in different proportions with non-hemolyzed plas-ma, showed a better repeatability than the sec-ond strategy, based on hemolysate generation and subsequent addition to a normal plasma.
This better repeatability yields a greater repro-ducibility and robustness of the first strategy.
Hemolysis index cut-off establishment
Many studies may be found in literature assess-ing hemolysis interference for chemistry ana-lytes, although sodium ion is only assessed in very few of them.
Steen and colleagues (21) assayed two different sodium concentrations (127 and 140mmol/L), using an hemolysate prepared by osmotic dis-ruption with distilled water, and could not de-tect any significant difference in the values, thus interpreting an absence of interference. As stated, the inclusion of a water-dilution step in the preparation of the hemolysate could most probably add a bias in the results.
Another approach by Lippi et al (22) followed a freeze-thaw procedure for hemolysis prepara-tion and, with a critical difference set at ±0.3%, found that even small amounts of hemolysis (0.016 g/dL of hemoglobin) could interfere in the measurement of sodium (seen at [Na+] = 140.1±1.5mmol/L).
Another study by Saldaña and collaborators (23) introduced a washing step with NaCl in the preparation of the hemolysate. After cor-recting for the dilution, an hemoglobin con-centration of 0.21 g/dL was shown to induce interference.
A third study evaluated one single sodium con-centration (146 mmol/L) and found a deviation of 2% from baseline when hemolysis was 0.66 g/dL. Greater concentrations of free hemoglo-bin were not assessed (24).
In our study, given the interval of sodium concen-trations, we found a concentration-independent cut-off value for the hemolysis index, at different bias specifications. This allows the establishment of a single cut-off value for hemolysis in every lab-oratory, according to their quality specifications.
eJIFCC2019Vol30No1pp025-034Page 33
José Antonio Delgado, Daniel Morell-Garcia, Josep Miquel BauçaHemolysis interference studies: the particular case of sodium ion
Apparent hyponatremia
There are varied and important clinical impli-cations derived from a falsely reduced plasma sodium result due to hemolyzed samples, which is the main cause of preanalytical rejec-tion of samples (14,25). In addition, there is no consensus whether sample transportation to the laboratory may influence the degree of in vitro hemolysis, whether by pneumatic tube or not (26–28).
Hyponatremia, defined as a sodium concentra-tion <135 mmol/L, is reported to have an inci-dence between 4-19% of outpatients, being also associated with a mortality increase (29). After the diagnosis of a in vivo hyponatremia, a comprehensive differential diagnostic study is essential to determine the exact etiology, in-cluding volemia, sodium clearance and serum osmolality, among other biochemical tests (30). The treatment of hyponatremia needs to be di-rected to correct the etiologic cause and restore blood sodium levels with a rate 6-12 mmol/L in the first 24 hours, as a greater rate would trig-ger an osmotic demyelination (31). Therefore, robust and reliable sodium results by the labo-ratory are crucial not only for the diagnosis of electrolyte imbalance disorders, but also for the decision of treatment strategies and follow-up.
The wide range seen in previous bibliography for the establishment of a hemolysis cut-off for sodium interference highlights the challenging aspect of this cation. Our study is the first to comprehensively assess the impact of hemoly-sis on plasma sodium, including two strategies for sample preparation, several sodium concen-trations (130 to 145 mmol/L), and interpreting such results according to different deviation specifications. The inclusion of different speci-fications in the establishment of a cut-off value makes our approach of greater applicability for laboratories worldwide. The main limitations of our study relate to the use of a single analytical
platform, given that hemolysis index is mea-sured by different spectroscopic methods and mathematical algorithms among clinical labora-tories, as well as the low number of samples in-cluded, although in line with previous literature.
CONCLUSIONS
Our study brings to light the importance of the proper preparation of hemolyzed samples for the interference quantification in such a partic-ular case as sodium ion. The negative effect by dilution seen in this case makes the protocols including water-dilution steps unsuitable for so-dium ion studies, and other more appropriate strategies need to be followed. The establish-ment of a valid and concentration-independent hemolysis cut-off value will lead to more reli-able laboratory results for sodium ion results.
REFERENCES
1. Howanitz PJ, Lehman CM, Jones BA, Meier FA, Horow-itz H. Clinical laboratory quality practices when hemolysis occurs. Arch Pathol Lab Med. 2015;139:901–6.
2. Llopis MA, Bauça JM, Barba N, Álvarez V, Ventura M, Ibarz M, et al. Spanish Preanalytical Quality Monitoring Program (SEQC), an overview of 12 years’ experience. Clin Chem Lab Med. 2017;55(4).
3. Lippi G, Blanckaert N, Bonini P, Green S, Kitchen S, Palicka V, et al. Haemolysis: an overview of the leading cause of unsuitable specimens in clinical laboratories. Clin Chem Lab Med. 2008;46(6):764–72.
4. Carraro P, Servidio G, Plebani M. Hemolyzed speci-mens: a reason for rejection or a clinical challenge? Clin Chem. 2000;46:306–7.
5. Fernandez P, Llopis MA, Perich C, Alsina MJ, Alva-rez V, Biosca C. Harmonization in hemolysis detection and prevention. A working group of the Catalonian Health Institute (ICS) experience. Clin Chem Lab Med. 2014;52(11):1557–68.
6. Heireman L, Van Geel P, Musger L, Heylen E, Uytten-broeck W, Mahieu B. Causes, consequences and manage-ment of sample hemolysis in the clinical laboratory. Clin Biochem. 2017;50(8):1317–22.
7. CLSI EP07 Interference Testing in Clinical Chemistry: Approved Guideline. Clinical Laboratory Standards Insti-tute - Third Edition. 2018.
eJIFCC2019Vol30No1pp025-034Page 34
José Antonio Delgado, Daniel Morell-Garcia, Josep Miquel BauçaHemolysis interference studies: the particular case of sodium ion
8. CLSI C56-A Hemolysis, Icterus, and Lipemia/Turbidity Indices as Indicators of Interference in Clinical Laboratory Analysis; Approved Guideline - 2012.
9. CLSI GP44-A4 Procedures for the Handling and Process-ing of Blood Specimens for Common Laboratory Tests; Ap-proved Guideline - Fourth Edition.
10. Martínez RML, Bonnin RR, Otero MJA, Canalias Re-verter F, Cano Corres R, Esteve Poblador S, et al. Proce-dure for the study of exogenous interferences in the mea-surement of biological quantities. Technical document. Rev Lab Clin. 2018;11(3):147–52.
11. Luksic A, Nikolac Gabaj N, Miler M, Dukic L, Bakliza A, Simundic A. Visual assessment of hemolysis affects pa-tient safety. Clin Chem Lab Med. 2018;56(4):574–81.
12. Lippi G, Cadamuro J, von Meyer A, Simundic AM. Practical recommendations for managing hemolyzed samples in clinical chemistry testing. Clin Chem Lab Med. 2018;56(5):718–27.
13. Dimeski G. Interference Testing. Clin Biochem Rev. 2008;29(August):43–8.
14. Lippi G, Fontana R, Avanzini P, Sandei F, Ippolito L. In-fluence of spurious hemolysis on blood gas analysis. Clin Chem Lab Med. 2013;51(8):1651–4.
15. Meites S. Reproducibly Simulating Hemolysis, for Eval-uating Its Interference with Chemical Methods Screening for Cystic Fibrosis by Specific Ion Electrode. Clin Chem. 1973;19(11):1319.
16. Lepock JR, Frey HE, Bayne H, Markus J. Relationship of hyperthermia-induced hemolysis of human erythrocytes to the thermal denaturation of membrane proteins. Bio-chim Biophys Acta. 1989;980:191–201.
17. Boulanger Y, Vinay P, Desroches M. Measurement of a wide range of intracellular sodium concentrations in erythrocytes by 23Na Nuclear Magnetic Resonance. Bio-phys J. 1985;47(April):553–61.
18. Pan X, Liu ZQ, Jin YH. General Level and Distribution of the Intra- and Extra - erythrocytes Sodium Concentra-tion in a Population and their Relationship with Blood Pressure. Acta Acad Med Wuhan. 1984;4(3):175–9.
19. Lippi G. Systematic assessment of the hemolysis in-dex: pros and cons. Adv Clin Chem. 2015;71:157–70.
20. Gómez Rioja R, Alsina Kirschner MJ, Álvarez Funes V, Barba Meseguer N, Cortés Rius M. Hemólisis en las muestras para diagnóstico. Rev Lab Clin. 2009;2(4):185–95.
21. Steen G, Vermeer HJ, Naus JM, Goevaerts B, Pauline T, Schoenmakers CHH. Multicenter evaluation of the inter-ference of hemoglobin , bilirubin and lipids on Synchron LX-20 assays. 2006;44(4):413–9.
22. Lippi G, Salvagno GL, Brocco G, Guidi GC. Influence of hemolysis on routine clinical chemistry testing. Clin Chem Lab Med. 2006;44(3):311–6.
23. Saldaña ÍM. Hemolysis interference in the determina-tion of 25 biochemical constituents using ADVIA 1800 au-toanalyzer. An Fac Med. 2015;76(4):377–84.
24. Sonntag O. Haemolysis as an Interference Fac-tor in Clinical Chemistry. J Clin Chem Clin Biochem. 1986;24:127–39.
25. Llopis MA, Trujillo G, Llovet MI, Tarrés E, Ibarz M, Biosca C, et al. Quality indicators and specifications for key analytical-extranalytical processes in the clinical lab-oratory. Five years’ experience using the Six Sigma con-cept. Clin Chem Lab Med. 2011;49(3):463–70.
26. Petit M, Mine L, Pascreau T, Brouzes C, Majoux S, Bor-gel D. Preanalytical influence of pneumatic tube delivery system on results of routine biochemistry and haematol-ogy analysis. Ann Biol Clin. 2017;75(6):703–12.
27. Kapoula G V, Kontou PI, Bagos PG. The impact of pneumatic tube system on routine laboratory param-eters : a systematic review and meta-analysis. Clin Chem Lab Med. 2017;55(12):1834–44.
28. Sodi R, Darn SM, Stott A. Pneumatic tube system in-duced haemolysis: assessing sample type susceptibility to haemolysis. Ann Clin Biochem. 2004;41:237–41.
29. Hoorn EJ, Zietse R. Hyponatremia and mortal-ity: moving beyond associations. Am J Kidney Dis. 2013;62(1):139–49.
30. Verbalis JG, Goldsmith SR, Greenberg A, Korzelius C, Schrier RW, Sterns RH, et al. Diagnosis, evaluation, and treatment of hyponatremia: expert panel recommenda-tions. Am J Med. 2013;126(10 suppl 1):S1–42.
31. Braun MM, Barstow CH, Pyzocha NJ. Diagnosis and management of sodium disorders: hyponatremia and hypernatremia. Am Fam Physician. 2015;91(5):299–307.
eJIFCC2019Vol30No1pp035-047Page 35
This is a Platinum Open Access Journal distributed under the terms of the Creative Commons Attribution Non-Commercial License which permits unrestricted non-commercial use, distribution, and reproduction in any medium, provided the original work is properly cited.
Prevalence of anemia and associated factors among hospitalized children attending the University of Gondar Hospital, Northwest EthiopiaBamlaku Enawgaw1, Yaregal Workineh2, Sisay Tadesse2, Eyuel Mekuria2, Ayenew Addisu3, Meaza Genetu4
1 Department of Hematology and Immunohematology, School of Biomedical and Laboratory Sciences, College of Medicine and Health Sciences, University of Gondar, Ethiopia2 Department of Medical Laboratory Sciences, School of Biomedical and Laboratory Sciences, College of Medicine and Health Sciences, University of Gondar, Ethiopia3 Department of Medical Parasitology, School of Biomedical and Laboratory Sciences, College of Medicine and Health Sciences, University of Gondar, Ethiopia4 Department of Immunology and Molecular Biology, School of Biomedical and Laboratory Sciences, College of Medicine and Health Sciences, University of Gondar, Ethiopia
A R T I C L E I N F O A B S T R A C T
Background
Anemia in children continues to be a major public health challenge in most developing countries, par-ticularly in Africa.
In the early stages of life, it leads to severe negative consequences on the cognitive functions as well as growth and development of the children, which may persist even after treatment.
Objective
The main aim of this study was to assess the preva-lence and associated factors of anemia among hos-pitalized children attending at university of Gondar comprehensive and specialized referral hospital, Northwest Ethiopia.
Corresponding author:Meaza GenetuP.O. Box 196 Department of Immunology and Molecular BiologySchool of Biomedical and Laboratory SciencesCollege of Medicine and Health SciencesUniversity of GondarEthiopiaE-mail: [email protected]
Key words:anemia, hospitalized children, associated factors, Gondar, Northwest Ethiopia
eJIFCC2019Vol30No1pp035-047Page 36
Bamlaku Enawgaw, Yaregal Workineh, Sisay Tadesse, Eyuel Mekuria, Ayenew Addisu, Meaza GenetuPrevalence of anemia and associated factors in hospitalized children from Gondar, Northwest Ethiopia
Method
A cross sectional study was conducted on 384 hospitalized children, between February and June, 2018. Data of socio demographic charac-teristics and clinical conditions of the study indi-viduals were collected using questionnaire after taking appropriate written informed consent and assent. Then 3 mL of blood was collected for complete blood count analysis and also stool examination was done for intestinal parasites. Data were coded, cleared and entered into SPSS version 20 for analysis.
Bivariate and multivariate logistic regression models were used to identify associated factors of anemia. P-value ≤ 0.05 was considered as sta-tistically significant.
Result
The overall magnitude of anemia among hos-pitalized children was 58.6%; of them 56.4% were males. Of anemic children, 28% had mild, 51.1% moderate and 20.9% severe anemia. The magnitude of anemia among children aged 6-59 months, 5-11 years and 12-14 years were 54.1%, 58.9% and 67.5%, respectively.
In this study, anemia was positively associated with parasitic infection (AOR= 2.541; 95% CI: 1.363, 4.737), not eating meat and animal prod-ucts (AOR = 1.615; 95% CI: 1.014, 2.574).
Conclusion
Anemia among hospitalized children in this study was found to be a severe public health problem. It was strongly associated with intesti-nal parasitic infection and not eating meat and animal products.
Focused polices and strategies should be de-signed to reduce anemia among hospitalized children in Ethiopia.
BACKGROUND
Anemia is one of the major public health con-cerns that cause significant morbidity and mor-tality in children worldwide (1). It is one of the most prevalent public health problems in the world, affecting both affluent and poor coun-tries with major consequences of human health as well as social and economic developments (1,2). Even its prevalence has shown decrement across the regions; still it remains a serious pub-lic health problem around the globe (3).
Although anemia occurs at all stages of human life cycle, its prevalence is higher especially in younger preschool aged children due to in-creased demand of iron for fast growth (4).
It adversely affects the cognitive and physical development of children which in turn results in a significant impairment of work capacity and school educational performance (3, 5-7).
The magnitude of anemia in children substan-tially varies across the world’s regions, whereby the global prevalence is estimated to be 42.6%, and its magnitude in Africa, South East Asia, America and European regions is 62.3%, 53.8%, 23.3% and 22.9%, respectively. Globally, on av-erage, around 9.6 million children are severely anemic (1).
Anemia with prevalence of ≥ 40%, 20-39.9%, 5-19.9% and <5% in the community is catego-rized as severe, moderate, mild and no public health problem, respectively (8).
The 2008 WHO report also has revealed that more than half (56.3%) of the world’s preschool aged children reside in developing countries where anemia is a severe public health problem including sub-Saharan Africa with a prevalence of 40% and above (7, 9, 10).
Similarly, the 2015 WHO report, from the global anemia prevalence in 2011 showed that the highest figure (42.6%) was in children com-pared to other age groups around the globe
eJIFCC2019Vol30No1pp035-047Page 37
Bamlaku Enawgaw, Yaregal Workineh, Sisay Tadesse, Eyuel Mekuria, Ayenew Addisu, Meaza GenetuPrevalence of anemia and associated factors in hospitalized children from Gondar, Northwest Ethiopia
and its prevalence in Africa and Ethiopia was 62.3% and 50%, respectively (1).
Anemia is associated with socioeconomic, bio-logical, environmental and nutritional factors. Nutritional deficiencies (iron deficiency, vitamin B12 and folate deficiency), lack of awareness among the mothers about the problem togeth-er with their low educational status, unhealthy food habits and parasitic infestations were con-sidered the main factors associated with ane-mia among children (1, 3, 4, 7, 11-13).
The prevalence of anemia among hospitalized children in different parts of the world has been studied; 33.2% in Lebanon (14), 61.6% in Turkey (15), 56.3% in Uganda (16), 83.2% in Southern Tanzania (17), and 77.2 % in Mwanza, Tanzania (13). However, in our country Ethiopia, there is lack of information about the prevalence and risk factors of anemia among hospitalized children.
Most studies in Ethiopia focus on the preva-lence of anemia under age five and for school aged children (18-20). Therefore, this study was aimed to determine the prevalence and associated factors of anemia among hospital-ized children attending university of Gondar referral and comprehensive hospital, Gondar, Northwest Ethiopia. Identifying risk factors and determining the magnitude of anemia have paramount importance to reform the regional and national public policy for ensuring sustain-able improvement.
METHODS
Study setting and population
A cross sectional study was done among 384 hospitalized children aged 6 months to 14 years at university of Gondar comprehensive and spe-cialized referral hospital, between February and June, 2018. Gondar is located at a distance of 737 km from the country’s capital, Addis Ababa–in
the North Gondar zone of the Amhara regional state, in North-Western Ethiopia. The city‘s lat-itude and longitude coordinates are 12°03′61″ N and 37°02′81″ E, respectively; and it is located at elevation of 2,133 m above sea level. Children with chronic kidney disease, active bleeding, HIV/AIDS, those who have undergone surgery in the previous one month and who had chronic illness were excluded from the study.
Data collection procedures
Upon obtaining a signed consent form and ad-ditional assent from children aged 7 years and above, the children who fulfilled the inclusion criteria were enrolled into the study. A pre-test-ed and standardized questionnaire was used to collect social demographics and social eco-nomic history. The caretaker/ family’s level of income was assessed by asking the caretaker how much they earned per month including donation or handout from other persons or or-ganizations. Other clinical data of hospitalized children were also collected by nurses working in pediatric ward.
Laboratory analysis
Hematology analysis
About 3mL of venous blood was collected from each subject for the analysis of hematological parameters; hemoglobin (Hgb), hematocrit (%), mean cell volume (MCV), mean cell hemoglo-bin (MCH), mean cell hemoglobin concentra-tion (MCHC), red blood cell count (RBC) and red cell distribution width (RDW) were determined using Cell-Dyn1800 automated blood analyzer.
Stool examinations
For intestinal parasite examination, stool sam-ples were collected and both wet mount and concentration technique were employed by an experienced laboratory technologist.
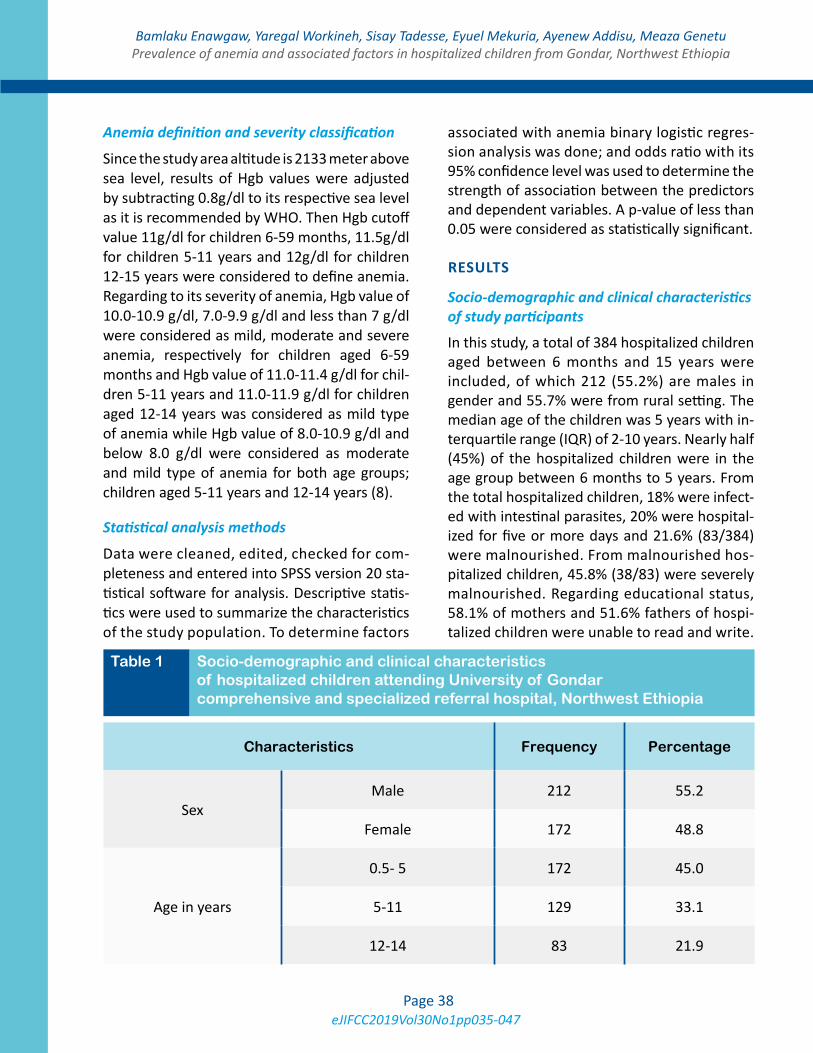
eJIFCC2019Vol30No1pp035-047Page 38
Bamlaku Enawgaw, Yaregal Workineh, Sisay Tadesse, Eyuel Mekuria, Ayenew Addisu, Meaza GenetuPrevalence of anemia and associated factors in hospitalized children from Gondar, Northwest Ethiopia
Anemia definition and severity classification
Since the study area altitude is 2133 meter above sea level, results of Hgb values were adjusted by subtracting 0.8g/dl to its respective sea level as it is recommended by WHO. Then Hgb cutoff value 11g/dl for children 6-59 months, 11.5g/dl for children 5-11 years and 12g/dl for children 12-15 years were considered to define anemia. Regarding to its severity of anemia, Hgb value of 10.0-10.9 g/dl, 7.0-9.9 g/dl and less than 7 g/dl were considered as mild, moderate and severe anemia, respectively for children aged 6-59 months and Hgb value of 11.0-11.4 g/dl for chil-dren 5-11 years and 11.0-11.9 g/dl for children aged 12-14 years was considered as mild type of anemia while Hgb value of 8.0-10.9 g/dl and below 8.0 g/dl were considered as moderate and mild type of anemia for both age groups; children aged 5-11 years and 12-14 years (8).
Statistical analysis methods
Data were cleaned, edited, checked for com-pleteness and entered into SPSS version 20 sta-tistical software for analysis. Descriptive statis-tics were used to summarize the characteristics of the study population. To determine factors
associated with anemia binary logistic regres-sion analysis was done; and odds ratio with its 95% confidence level was used to determine the strength of association between the predictors and dependent variables. A p-value of less than 0.05 were considered as statistically significant.
RESULTS
Socio-demographic and clinical characteristics of study participants
In this study, a total of 384 hospitalized children aged between 6 months and 15 years were included, of which 212 (55.2%) are males in gender and 55.7% were from rural setting. The median age of the children was 5 years with in-terquartile range (IQR) of 2-10 years. Nearly half (45%) of the hospitalized children were in the age group between 6 months to 5 years. From the total hospitalized children, 18% were infect-ed with intestinal parasites, 20% were hospital-ized for five or more days and 21.6% (83/384) were malnourished. From malnourished hos-pitalized children, 45.8% (38/83) were severely malnourished. Regarding educational status, 58.1% of mothers and 51.6% fathers of hospi-talized children were unable to read and write.
Table 1 Socio-demographic and clinical characteristics of hospitalized children attending University of Gondar comprehensive and specialized referral hospital, Northwest Ethiopia
Characteristics Frequency Percentage
SexMale 212 55.2
Female 172 48.8
Age in years
0.5- 5 172 45.0
5-11 129 33.1
12-14 83 21.9
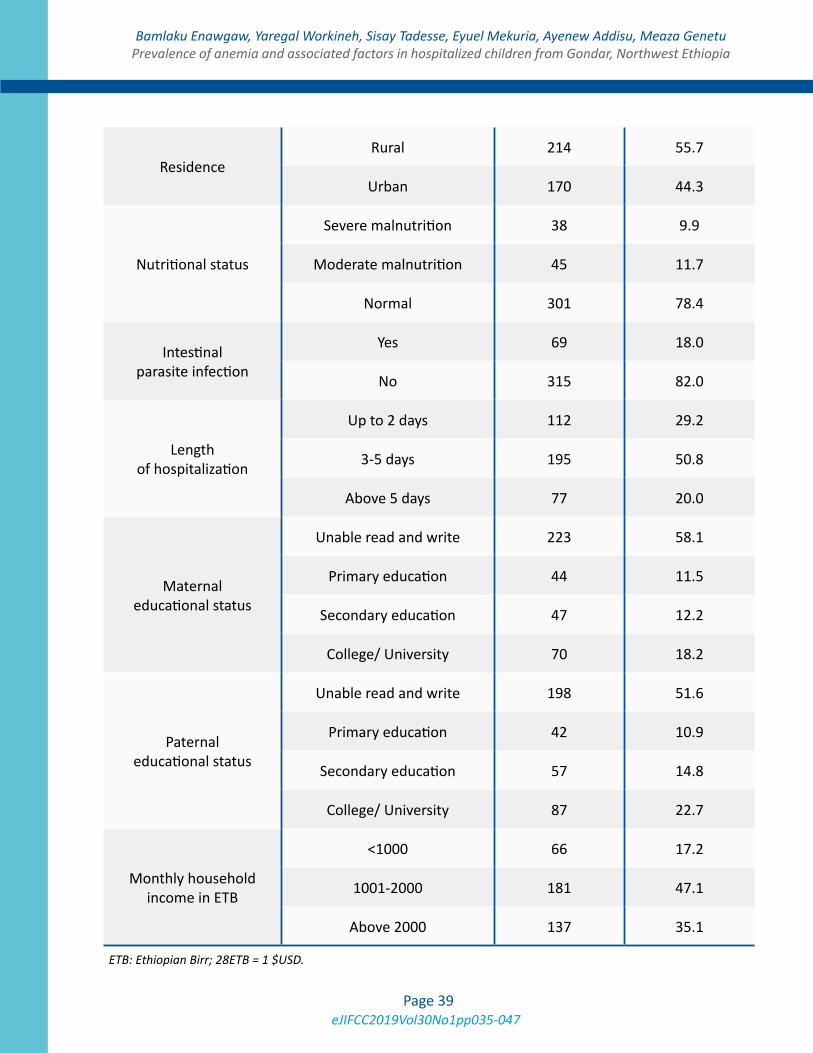
eJIFCC2019Vol30No1pp035-047Page 39
Bamlaku Enawgaw, Yaregal Workineh, Sisay Tadesse, Eyuel Mekuria, Ayenew Addisu, Meaza GenetuPrevalence of anemia and associated factors in hospitalized children from Gondar, Northwest Ethiopia
Residence Rural 214 55.7
Urban 170 44.3
Nutritional status
Severe malnutrition 38 9.9
Moderate malnutrition 45 11.7
Normal 301 78.4
Intestinal parasite infection
Yes 69 18.0
No 315 82.0
Length of hospitalization
Up to 2 days 112 29.2
3-5 days 195 50.8
Above 5 days 77 20.0
Maternal educational status
Unable read and write 223 58.1
Primary education 44 11.5
Secondary education 47 12.2
College/ University 70 18.2
Paternal educational status
Unable read and write 198 51.6
Primary education 42 10.9
Secondary education 57 14.8
College/ University 87 22.7
Monthly household income in ETB
<1000 66 17.2
1001-2000 181 47.1
Above 2000 137 35.1
ETB: Ethiopian Birr; 28ETB = 1 $USD.
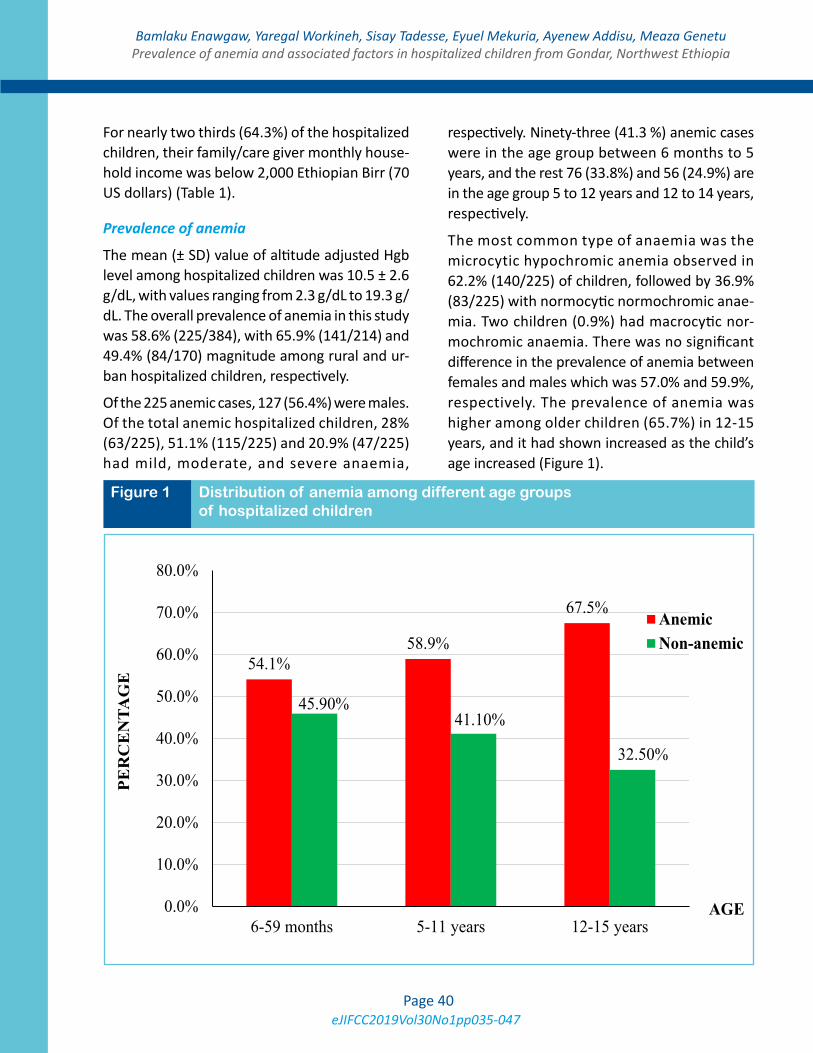
eJIFCC2019Vol30No1pp035-047Page 40
Bamlaku Enawgaw, Yaregal Workineh, Sisay Tadesse, Eyuel Mekuria, Ayenew Addisu, Meaza GenetuPrevalence of anemia and associated factors in hospitalized children from Gondar, Northwest Ethiopia
For nearly two thirds (64.3%) of the hospitalized children, their family/care giver monthly house-hold income was below 2,000 Ethiopian Birr (70 US dollars) (Table 1).
Prevalence of anemia
The mean (± SD) value of altitude adjusted Hgb level among hospitalized children was 10.5 ± 2.6 g/dL, with values ranging from 2.3 g/dL to 19.3 g/dL. The overall prevalence of anemia in this study was 58.6% (225/384), with 65.9% (141/214) and 49.4% (84/170) magnitude among rural and ur-ban hospitalized children, respectively.
Of the 225 anemic cases, 127 (56.4%) were males. Of the total anemic hospitalized children, 28% (63/225), 51.1% (115/225) and 20.9% (47/225) had mild, moderate, and severe anaemia,
respectively. Ninety-three (41.3 %) anemic cases were in the age group between 6 months to 5 years, and the rest 76 (33.8%) and 56 (24.9%) are in the age group 5 to 12 years and 12 to 14 years, respectively.
The most common type of anaemia was the microcytic hypochromic anemia observed in 62.2% (140/225) of children, followed by 36.9% (83/225) with normocytic normochromic anae-mia. Two children (0.9%) had macrocytic nor-mochromic anaemia. There was no significant difference in the prevalence of anemia between females and males which was 57.0% and 59.9%, respectively. The prevalence of anemia was higher among older children (65.7%) in 12-15 years, and it had shown increased as the child’s age increased (Figure 1).
Figure 1 Distribution of anemia among different age groups of hospitalized children
54.1%58.9%
67.5%
45.90%41.10%
32.50%
0.0%
10.0%
20.0%
30.0%
40.0%
50.0%
60.0%
70.0%
80.0%
6-59 months 5-11 years 12-15 years
PER
CE
NTA
GE
AGE
AnemicNon-anemic
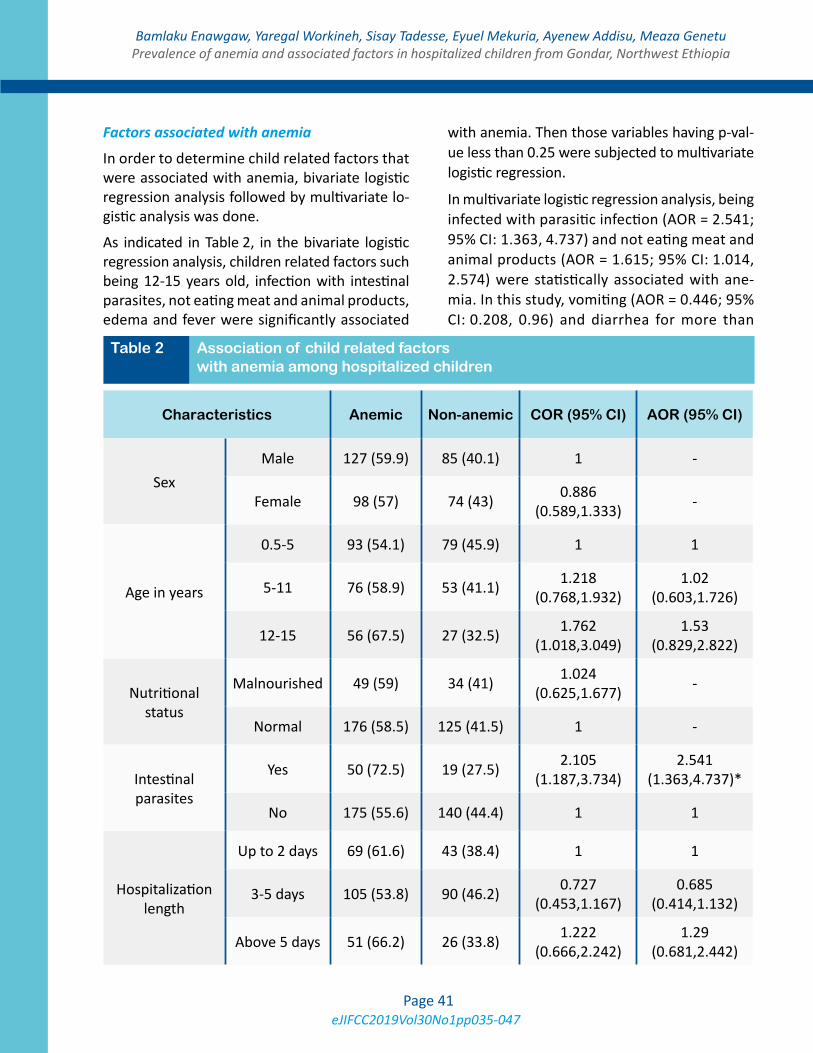
eJIFCC2019Vol30No1pp035-047Page 41
Bamlaku Enawgaw, Yaregal Workineh, Sisay Tadesse, Eyuel Mekuria, Ayenew Addisu, Meaza GenetuPrevalence of anemia and associated factors in hospitalized children from Gondar, Northwest Ethiopia
Factors associated with anemia
In order to determine child related factors that were associated with anemia, bivariate logistic regression analysis followed by multivariate lo-gistic analysis was done.
As indicated in Table 2, in the bivariate logistic regression analysis, children related factors such being 12-15 years old, infection with intestinal parasites, not eating meat and animal products, edema and fever were significantly associated
with anemia. Then those variables having p-val-ue less than 0.25 were subjected to multivariate logistic regression.
In multivariate logistic regression analysis, being infected with parasitic infection (AOR = 2.541; 95% CI: 1.363, 4.737) and not eating meat and animal products (AOR = 1.615; 95% CI: 1.014, 2.574) were statistically associated with ane-mia. In this study, vomiting (AOR = 0.446; 95% CI: 0.208, 0.96) and diarrhea for more than
Table 2 Association of child related factors with anemia among hospitalized children
Characteristics Anemic Non-anemic COR (95% CI) AOR (95% CI)
SexMale 127 (59.9) 85 (40.1) 1 -
Female 98 (57) 74 (43) 0.886 (0.589,1.333) -
Age in years
0.5-5 93 (54.1) 79 (45.9) 1 1
5-11 76 (58.9) 53 (41.1) 1.218 (0.768,1.932)
1.02 (0.603,1.726)
12-15 56 (67.5) 27 (32.5) 1.762 (1.018,3.049)
1.53 (0.829,2.822)
Nutritional status
Malnourished 49 (59) 34 (41) 1.024 (0.625,1.677) -
Normal 176 (58.5) 125 (41.5) 1 -
Intestinal parasites
Yes 50 (72.5) 19 (27.5) 2.105 (1.187,3.734)
2.541 (1.363,4.737)*
No 175 (55.6) 140 (44.4) 1 1
Hospitalization length
Up to 2 days 69 (61.6) 43 (38.4) 1 1
3-5 days 105 (53.8) 90 (46.2) 0.727 (0.453,1.167)
0.685 (0.414,1.132)
Above 5 days 51 (66.2) 26 (33.8) 1.222 (0.666,2.242)
1.29 (0.681,2.442)
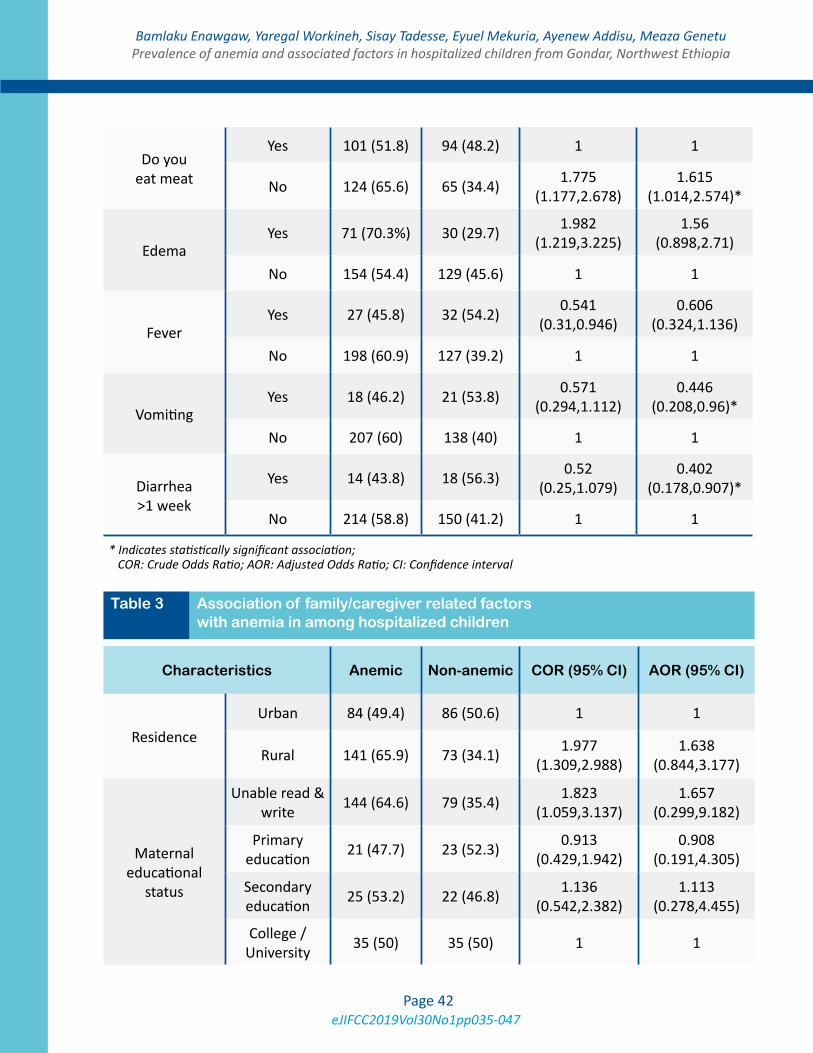
eJIFCC2019Vol30No1pp035-047Page 42
Bamlaku Enawgaw, Yaregal Workineh, Sisay Tadesse, Eyuel Mekuria, Ayenew Addisu, Meaza GenetuPrevalence of anemia and associated factors in hospitalized children from Gondar, Northwest Ethiopia
Do you eat meat
Yes 101 (51.8) 94 (48.2) 1 1
No 124 (65.6) 65 (34.4) 1.775 (1.177,2.678)
1.615 (1.014,2.574)*
EdemaYes 71 (70.3%) 30 (29.7) 1.982
(1.219,3.225)1.56
(0.898,2.71)
No 154 (54.4) 129 (45.6) 1 1
FeverYes 27 (45.8) 32 (54.2) 0.541
(0.31,0.946)0.606
(0.324,1.136)
No 198 (60.9) 127 (39.2) 1 1
Vomiting Yes 18 (46.2) 21 (53.8) 0.571
(0.294,1.112)0.446
(0.208,0.96)*
No 207 (60) 138 (40) 1 1
Diarrhea >1 week
Yes 14 (43.8) 18 (56.3) 0.52 (0.25,1.079)
0.402 (0.178,0.907)*
No 214 (58.8) 150 (41.2) 1 1
* Indicates statistically significant association; COR: Crude Odds Ratio; AOR: Adjusted Odds Ratio; CI: Confidence interval
Table 3 Association of family/caregiver related factors with anemia in among hospitalized children
Characteristics Anemic Non-anemic COR (95% CI) AOR (95% CI)
Residence Urban 84 (49.4) 86 (50.6) 1 1
Rural 141 (65.9) 73 (34.1) 1.977 (1.309,2.988)
1.638 (0.844,3.177)
Maternal educational
status
Unable read & write 144 (64.6) 79 (35.4) 1.823
(1.059,3.137)1.657
(0.299,9.182)
Primary education 21 (47.7) 23 (52.3) 0.913
(0.429,1.942)0.908
(0.191,4.305)
Secondary education 25 (53.2) 22 (46.8) 1.136
(0.542,2.382)1.113
(0.278,4.455)
College / University 35 (50) 35 (50) 1 1
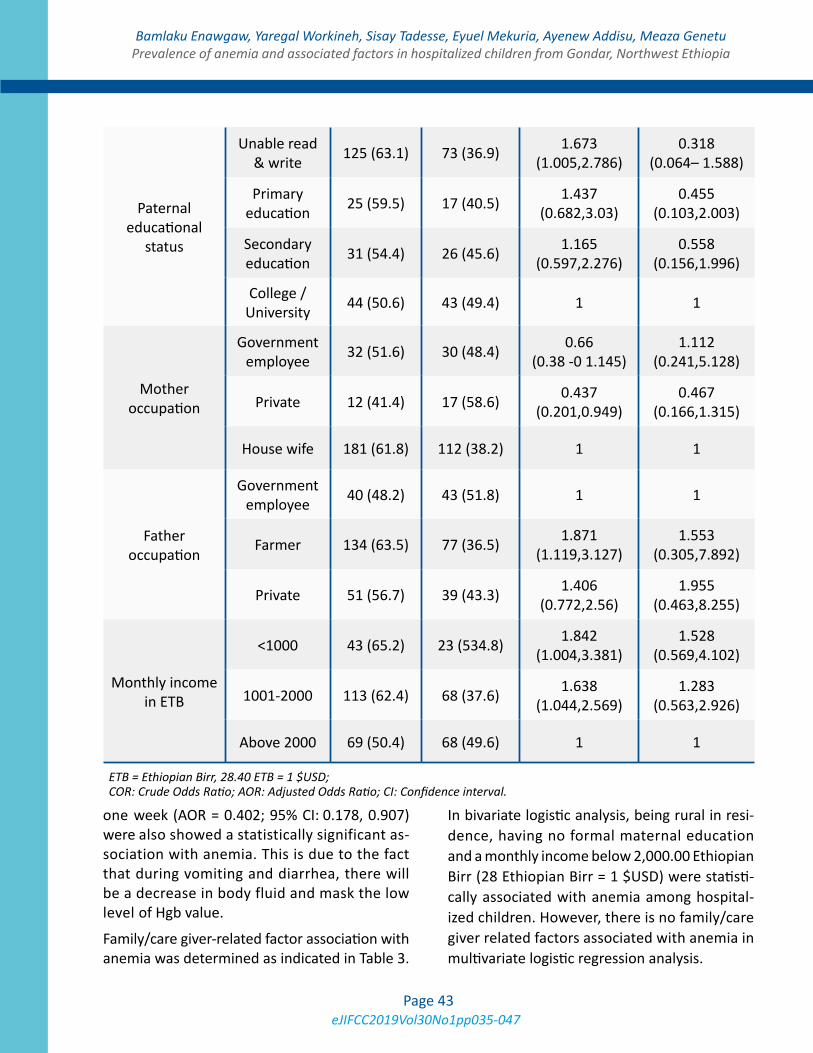
eJIFCC2019Vol30No1pp035-047Page 43
Bamlaku Enawgaw, Yaregal Workineh, Sisay Tadesse, Eyuel Mekuria, Ayenew Addisu, Meaza GenetuPrevalence of anemia and associated factors in hospitalized children from Gondar, Northwest Ethiopia
one week (AOR = 0.402; 95% CI: 0.178, 0.907) were also showed a statistically significant as-sociation with anemia. This is due to the fact that during vomiting and diarrhea, there will be a decrease in body fluid and mask the low level of Hgb value.
Family/care giver-related factor association with anemia was determined as indicated in Table 3.
In bivariate logistic analysis, being rural in resi-dence, having no formal maternal education and a monthly income below 2,000.00 Ethiopian Birr (28 Ethiopian Birr = 1 $USD) were statisti-cally associated with anemia among hospital-ized children. However, there is no family/care giver related factors associated with anemia in multivariate logistic regression analysis.
ETB = Ethiopian Birr, 28.40 ETB = 1 $USD; COR: Crude Odds Ratio; AOR: Adjusted Odds Ratio; CI: Confidence interval.
Paternal educational
status
Unable read & write 125 (63.1) 73 (36.9) 1.673
(1.005,2.786)0.318
(0.064– 1.588)
Primary education 25 (59.5) 17 (40.5) 1.437
(0.682,3.03)0.455
(0.103,2.003)
Secondary education 31 (54.4) 26 (45.6) 1.165
(0.597,2.276)0.558
(0.156,1.996)
College / University 44 (50.6) 43 (49.4) 1 1
Mother occupation
Government employee 32 (51.6) 30 (48.4) 0.66
(0.38 -0 1.145)1.112
(0.241,5.128)
Private 12 (41.4) 17 (58.6) 0.437 (0.201,0.949)
0.467 (0.166,1.315)
House wife 181 (61.8) 112 (38.2) 1 1
Father occupation
Government employee 40 (48.2) 43 (51.8) 1 1
Farmer 134 (63.5) 77 (36.5) 1.871 (1.119,3.127)
1.553 (0.305,7.892)
Private 51 (56.7) 39 (43.3) 1.406 (0.772,2.56)
1.955 (0.463,8.255)
Monthly income in ETB
<1000 43 (65.2) 23 (534.8) 1.842 (1.004,3.381)
1.528 (0.569,4.102)
1001-2000 113 (62.4) 68 (37.6) 1.638 (1.044,2.569)
1.283 (0.563,2.926)
Above 2000 69 (50.4) 68 (49.6) 1 1
eJIFCC2019Vol30No1pp035-047Page 44
Bamlaku Enawgaw, Yaregal Workineh, Sisay Tadesse, Eyuel Mekuria, Ayenew Addisu, Meaza GenetuPrevalence of anemia and associated factors in hospitalized children from Gondar, Northwest Ethiopia
DISCUSSION
The findings from this study indicate that the prevalence of anemia among hospitalized chil-dren aged 6 months to 15 is high. The prevalence was found to be 58.6 %. The overall prevalence is higher than reported from other studies in India (21), Lebanon (14), Nepal (22) and Nigeria (23), where the prevalence were between 32 and 50%. The variations in percentage in differ-ent regions might be due to heterogeneity of the studied population, dietary habits, different nutritional status and incidence of worm infes-tation in a defined geographical spots (21).
In our study, prevalence of anemia was elevat-ed as age increase and it was quite high among older children aged 12-14 years (65.7%). This finding is contrary to that describe by others where the prevalence of anemia was highest among children under age of five (14). The high-est prevalence in age group between 12 and 15 may be attributed to low intake of iron rich food or inappropriate dietary choices in children, poor iron absorption due to iron absorption in-hibiting factors such as tannine in tea which re-duces hemoglobin synthesis or inadequate iron absorption enhancers (vitamin C and hydro-chloric acid) (24). Based on our finding, anemia prevalence in children under five which is 54.1% is lower than the result found in Ghana, Brazil, Bangalore, and Tanzania (13, 17, 25-27).
Different studies had different result on the asso-ciation between anemia and gender. This study found insignificant difference in anemia prev-alence between male and female, 57.0% and 59.9% respectively. While others have demon-strated that the prevalence of anemia can vary between male and female children (28). They ar-gued that the high prevalence of anemia in boys may be due to the faster growth of preschool boys than girls that has high iron demand which cannot be met by diet alone.
Morphological classification of anemia showed microcytic hypochromic anemia was the most predominant type occurring in 62.2% of chil-dren. This finding is similar to the study done in Tanzania, and it is assumed that iron deple-tion is the main factor responsible for the high percentage of microcytic-hypochromic anemia (13). On the other hand, normocytic normo-chromic anemia was the second type of anemia in this study. This may be due to acute blood loss, drug therapy and chronic diseases (anemia of inflammation) (29, 30).
Child related factors like being infected with parasitic infection and not eating meat and ani-mal products were statistically associated with anemia. The lower immune response in children compared to adults, poor hygiene and environ-mental conditions favor the susceptibility of children to parasitic infections (31). In our find-ing, children with parasitic infestation are two and half times more likely to have anemia than children who are free from parasitic infection, (AOR= 2.541; 95% CI: 1.363, 4.737). This finding is similar to study done in Bangladesh (32). The mechanism behind this relation can be due to the fact that the parasite directly induces iron deficiency through blood loss by mechanical rup-ture of host capillaries and arterioles followed by the release of a battery of pharmacologically active polypeptides including anticoagulants, antiplatelet agents, and antioxidants (31).
Not eating meat and animal products were also found to be related to a risk of acquiring ane-mia in our study and this is similar to the study done in Uganda (12). Iron can be found in two forms in foods heme and non-heme. Heme iron is only found in animal products, whereas non-heme iron is only found in plants (33). Iron de-ficiency and/or low bioavailability account for half of the anemia in developing countries (34)accessed 28 November, 2018.
eJIFCC2019Vol30No1pp035-047Page 45
Bamlaku Enawgaw, Yaregal Workineh, Sisay Tadesse, Eyuel Mekuria, Ayenew Addisu, Meaza GenetuPrevalence of anemia and associated factors in hospitalized children from Gondar, Northwest Ethiopia
In this study univariate analysis showed anemia that was significantly associated with maternal related variables like being rural in residence (COR= 1.977 (1.309, 2.988)), have no formal education (COR= 1.823 (1.059, 3.137)) and low monthly income (COR= 1.842 (1.004, 3.381)), but in multivariate analysis this factor was not significant statistically. Since mothers are most-ly care givers for the child, maternal education has always been linked to many child health out-comes. It may also affect health decision mak-ing and thus influence the probability of a child meeting certain nutrition-related requirements.
In addition, anemia among children was also associated with household income. Children living in household with lower monthly income (<2000 Ethiopian Birr) were more likely to have anemia compared to those with higher income. Similar finding was from study conducted in Brazil and northern Ethiopia (9). The reason might be due to children from poor households are less likely to get iron-rich foods.
This study has some limitations in that we lack data on the prevalence of blood parasite like plasmodium falciparum, one of the risk factors considered to be the principal cause of severe anemia in malaria-endemic areas in Africa. The clinical diagnoses of the children were also not included in this study therefore clinical causes of anemia could not be identified.
CONCLUSIONS
Prevalence of anemia in hospital admitted chil-dren aged between 6 months and 15 years is high and it was found to be a severe public health problems. Being more common in children may predispose this vulnerable population to future infections, hematological and developmental disorder. Microcytic, hypochromic and normo-cytic normochromic pattern were the common morphological types of anemia. Parasitic infec-tion and not eating meat and animal products
significantly associate with anemia. Deworming and interventions like iron supplementation and nutritional education activities are important to decrease the prevalence of anemia.
Abbreviations
AOR: Adjusted odds ratio
COR: Crude odds ratio
EDTA: Ethylene Die-amine Tetra-acetic Acid
FA: Fanconi Anemia
HCT: Hematocrit
Hgb: Hemoglobin
IDA: Iron Deficiency Anemia
MCH: Mean Cell Hemoglobin
MCHC: Mean Cell Hemoglobin Concentration
MCV: Mean Cell Volume
RBC: Red Blood Cell
RDW: Red Cell Distribution width
WHO: World Health Organization
Ethical approval and consent to participate
Ethical clearance and approval was granted from University of Gondar, Collage of Medicine and Health Sciences, School of Biomedical and Laboratory Sciences Ethical Review Committee. Permission letter was also obtained from the hospital administrators. The purpose of the research was explained to the study subjects and written informed consent and assent was obtained from each hospitalized children and their care givers and then those who were will-ing to participate were included in the study. Participation was fully voluntarily, refusal at any time during data collection was permitted. Confidentiality was kept. When haemoglobin level of the children was below 11 g/dl, the re-sult was communicated with the physicians.
eJIFCC2019Vol30No1pp035-047Page 46
Bamlaku Enawgaw, Yaregal Workineh, Sisay Tadesse, Eyuel Mekuria, Ayenew Addisu, Meaza GenetuPrevalence of anemia and associated factors in hospitalized children from Gondar, Northwest Ethiopia
Availability of data and materials
All data generated or analyzed during this study are included in this published article.
Competing interests
The authors have declared that they have no ex-isting competing interests.
Funding
No specific funding was received for this work.
Authors’ contributions
• BE & AA: conceived and designed the experiments
• YW, ST, EM, MM: performed the experiments
• BE & MG: analyzed and interpreted results
• All authors contributed to the writing and editing of the manuscript and approved the final version submitted.
Acknowledgments
The authors would like to extend their grati-tude to the University of Gondar comprehensive and specialized referral hospital pediatrics ward staffs for their support during this study. We also thank the data collectors, children and their par-ents/caregivers who participated in this study.
REFERENCES
1. WHO. The global prevalence of anaemia in 2011. Ge-neva: World Health Organization; 2015; Available from: http://www.who.int/iris/handle/10665/177094.
2. Chatterjee A, Bosch RJ, Kupka R, Hunter DJ, Msa-manga GI, Fawzi WW. Predictors and consequences of anaemia among antiretroviral-naïve HIV-infected and HIV-uninfected children in Tanzania. Public Health Nutr. 2010;13(2):289-96.
3. Brabin BJ, Premji Z, Verhoeff F. An analysis of anemia and child mortality. J Nutr. 2001;131(2S-2):636S-45S.
4. WHO/UNICEF/UNU. Iron deficiency anaemia assess-ment, prevention, and control: a guide for programme man-agers. Geneva, World Health Organization. 2001; Avail-able from: http://www.who.int/nutrition/publications/en/ ida_as sessment_prevention_control.pdf.
5. Das P. Can we eliminate nutritional anemia in the near future? South East Asia J Public Health. 2015;5(1):1-3.
6. Ekwochi U, Osuorah DIC, Odetunde OI, Egbonu I, Eze-chukwu CC. Prevalence of iron deficiency anaemia in anaemic under-5 children in Enugu South East Nigeria. Niger J Paed. 2014;41(2):129-32.
7. Sanou D, Ngnie-Teta I. Risk factors for anemia in pre-school children in sub-Saharan Africa. In: Silverberg D, ed-itor. Anemia: InTech; 2012. Available from: http://www.intechopen.com/books/anemia/risk-factors-for-anemia-in-preschool-children-in-sub-saharan-africa.
8. WHO. Haemoglobin concentrations for the diagnosis of anaemia and assessment of severity. Vitamin and Min-eral Nutrition Information System. Geneva: World Health Organization; 2011; Available from: http://www.who.int/vmnis/indicators/haemoglobin.pdf.
9. Adish A, Esrey SA, Gyorkos TW, Johns T. Risk factors for iron deficiency anemia in preschool children in northern Ethiopia. Public Health Nutr. 1999;2(3):243-52.
10. Zein Z. Hematocrit levels and anemia in Ethiopian children. East Afr Med J. 1991;68(6):412-9.
11. Alaofè H, Zee J, Dossa R, O’Brien HT. Education and improved iron intakes for treatment of mild iron-defi-ciency anemia in adolescent girls in southern Benin. Food Nutr Bull. 2009;30(1):24–36.
12. Kikafunda JK, Lukwago FB, Turyashemererwa F. Anae-mia and associated factors among under-fives and their mothers in Bushenyi district, Western Uganda. Public Health Nutr. 2009;12(12):2302-8.
13. Simbauranga RH, Kamugisha E, Hokororo A, Kidenya BR, Makani J. Prevalence and factors associated with se-vere anaemia amongst under-five children hospitalized at Bugando Medical Centre, Mwanza, Tanzania. BMC Hema-tol. 2015;15:13.
14. Salami A, Bahmad HF, Ghssein G, Salloum L, Fakih H. Prevalence of anemia among Lebanese hospital-ized children: Risk and protective factors. PLoS One. 2018;13(8):e0201806.
15. Cetinkaya F, Yildirmak Y, Kutluk G. Severe iron-deficien-cy anemia among hospitalized young children in an urban hospital. Pediatr Hematol Oncol. 2005;22(1):77–81.
16. Kiggundu VL, O’Meara WP, Musoke R, Nalugoda FK, Kigozi G, Baghendaghe E, et al. High prevalence of malar-ia parasitemia and anemia among hospitalized children in Rakai, Uganda. PLoS One. 2013;8(12):e82455.
eJIFCC2019Vol30No1pp035-047Page 47
Bamlaku Enawgaw, Yaregal Workineh, Sisay Tadesse, Eyuel Mekuria, Ayenew Addisu, Meaza GenetuPrevalence of anemia and associated factors in hospitalized children from Gondar, Northwest Ethiopia
17. Mghanga FP, Genge CM, Yeyeye L, Twalib Z, Kibopile W, Rutalemba FJ, et al. Magnitude, severity, and morpho-logical types of anemia in hospitalized children under the age of five in Southern Tanzania. Cureus. 2017;9(7):e1499.
18. Assefa S, Mossie A, Hamza L. Prevalence and severity of anemia among school children in Jimma Town, South-west Ethiopia. BMC Hematol. 2014;14(1):3.
19. Getaneh Z, Enawgaw B, Engidaye G, Seyoum M, Ber-hane M, Abebe Z, et al. Prevalence of anemia and associ-ated factors among school children in Gondar town pub-lic primary schools, northwest Ethiopia: A school based cross-sectional study. PLoS One. 2017;12(12):e0190151.
20. Melku M, Alene KA, Terefe B, Enawgaw B, Biadgo B, Abebe M, et al. Anemia severity among children aged 6–59 months in Gondar town, Ethiopia: a community-based cross-sectional study. Ital J Pediatr. 2018;44(1):107.
21. Ritu S, Ashok D, Vithal TP, Shivani R, Rajaram N. A hos-pital based study on anemia prevalence in children of an Indian Island. Int J Pediatr. 2017;5(12):6245-52.
22. Sharma A, Giri A, Pudasaini S. Prevalence of anemia in children aged 6 months to 15 years: a hospital based study. J Pathol Nep. 2017;7(2):1168-71.
23. Mainasara A, Ibrahim K, Uko E, Jiya N, Erhabor O, Umar A, et al. Prevalence of anaemia among children attending paediatrics department of UDUTH, Sokoto, North-Western Nigeria. IBRR. 2017;7(1):1-10.
24. Bagchi K. Iron deficiency anaemia-an old enemy. East Mediterr Health J. 2004;10(6):754-60.
25. Adu-Amankwaah J, Allotey EA, Kwasie DA, Afeke I, Owiafe PK, Adiukwu PC, et al. Prevalence and morphologi-cal types of anaemia among children under-five years in
the Volta regional hospital of Ghana. Open Access Lib J. 2018;5(2):1-10.
26. Dos Santos RF, Gonzalez ES, de Albuquerque EC, de Arruda IK, Diniz Ada S, Figueroa JN, et al. Prevalence of anemia in under five-year-old children in a children’s hospital in Recife, Brazil. R Rev Bras Hematol Hemoter. 2011;33(2):100-4.
27. Ahuja S, Nagaraj N. Prevalence and risk factors of ane-mia in under five-year-old children in children’s hospital. Int J Contemp Pediatr. 2018;5(2):499-502.
28. Lehmann F, Gray-Donald K, Mongeon M, Di Tommaso S. Iron deficiency anemia in 1-year-old children of disad-vantaged families in Montreal. CMAJ. 1992;146(9):1571-7.
29. Bonnet JD. Normocytic normochromic anemia. Post-grad Med. 1977;61(6):139-42.
30. Nemeth E, Ganz T. Anemia of Inflammation. Hematol Oncol Clin North Am. 2014;28(4):671–81.
31. Odebunmi JF, Adefioye OA, Adeyeba OA. Hookworm infection among school children in Vom, Plateau state Ni-geria. Am Eurasian J Sci Res. 2007;2(1):39-42.
32. Banu H, Khanum H, Hossain MA. Relationships be-tween anaemia and parasitic infections in adolescent girls of Bangladesh. Bangladesh J Zool. 2014;42(1):91-103.
33. Abbaspour N, Hurrell R, Kelishadi R. Review on iron and its importance for human health. J Res Med Sci. 2014;19(2):164–74.
34. Allen LH, De Benoist B, Dary O, Hurrell R. Guidelines on food fortification with micronutrients. World Health Or-ganization and Food and Agriculture Organization of the United Nations; 2006; Available from: http://apps.who.int/iris/bitstream/handle/10665/43412/9241594012_eng.pdf?sequence=1
eJIFCC2019Vol30No1pp048-058Page 48
This is a Platinum Open Access Journal distributed under the terms of the Creative Commons Attribution Non-Commercial License which permits unrestricted non-commercial use, distribution, and reproduction in any medium, provided the original work is properly cited.
Waist circumference cutoff point determination for defining metabolic syndrome in type 2 diabetes mellitus in EthiopiaShewit Hailemariam1, Tadele Melak2, Molla Abebe2
1 Ayder Comprehensive Specialized Hospital, Mekelle University, Tigray Region, Northern Ethiopia2 Department of Clinical Chemistry, School of Laboratory Medicine, College of Medicine and Health Sciences, University of Gondar, Ethiopia
A R T I C L E I N F O A B S T R A C T
Background
Metabolic syndrome (MetS) is a complex disorder char-ac terized by a cluster of interrelated cardiovascular risk factors. So far, cutoff point variability of waist cir-cumference was documented to define MetS.
Objective
To determine the classification power and cutoff point of waist circumference to define MetS among patients with type 2 diabetes.
Methods
An institution-based cross sectional study was conduct-ed from March to April 2017 at Ayder Comprehensive Specialized Hospital among patients with type 2 dia-betes. Using systematic sampling technique, 520 par-ticipants were enrolled into the study. Data were col-lected by checklist, anthropometric measurements and biochemical analyses. Data were entered to Epi-info 3.5.1 and transferred to SPSS 20 for analysis. Participants having more than one abnormal MetS components were categorized as patients and the
Corresponding author:Tadele Melak P.O. Box 196College of Medicine and Health SciencesDepartment of Clinical Chemistry University of GondarAmhara Regional State Ethiopia Phone: +251921576005E-mail: [email protected]
Key words:cutoff point, diabetes mellitus, metabolic syndrome, waist circumference
eJIFCC2019Vol30No1pp048-058Page 49
Shewit Hailemariam, Tadele Melak, Molla AbebeWaist circumference cutoff point estimation for metabolic syndrome in Ethiopia
others were considered as control. The classi-fication power of waist circumference to dis-tinguish patients from controls was determined by ROC curve analysis. Waist circumference cut-off points were determined by taking the point that had a maximum youden index.
Results
Among the 520 participants, 308 (59.2%) were females. The mean age of the participants was 56 ± 10.8 years for males and 55 ± 11.4 years for females. The classification power of waist circumference was 0.67 (0.58-0.75) for male and 0.63 (0.52-0.73) for females. The optimal waist circumference cutoff point to distinguish patients from controls were 95.5 cm (sensi-tivity 39.8%, specificity 86.3%, p< 0.001) for males, and 87.5 cm (sensitivity 73.1%, speci-ficity 54.5%, p< 0.017) for females.
Conclusion
The positive predictive value of waist circumfer-ence was 93% for females and 90% for males in Northern Ethiopia using 87.5 and 95.5 cm points cut-off for females and males, respectively.
INTRODUCTION
Metabolic syndrome (MetS) is a complex dis-order characterized by a cluster of interrelated factors that increase the risk of cardiovascu-lar disease (CVD). In type 2 diabetic patients (T2DM) and those with other non-communica-ble diseases (1), MetS increases the complica-tion rate (2).
Various international organizations are using five parameters including elevation of waist cir-cumference (WC), blood pressure (BP), triglyc-erides (TG), fasting blood glucose (FBG), and reduced HDL-C level to define MetS (3).
Elevated WC is characterized by the accumula-tion of fat in the visceral part of the abdomen and plays a central role in the pathogenesis of MetS (4).
To precisely assess the visceral fat volume, ab-dominal computed tomography (CT) has been considered as the most accurate and reproduc-ible technique (5). However, CT scans are costly and time consuming (6). Because of this limita-tion, a variety of alternative methods are ap-plied to assess abdominal obesity.
Waist to hip ratio and WC are correlated with abdominal imaging. Among them, WC is con-sidered to be simple and inexpensive measure with excellent correlation with the CT results (7). In addition, it is used to define MetS based on various international criteria and different scholars indicted that WC appears to be the best central obesity indicator than BMI and waist to hip ratio (8).
Many organizations and expert groups recom-mend WC as one of the criteria to define MetS. International Diabetes Federation (IDF), particu-larly, needs elevation of WC as an obligatory cri-terion with a different cutoff point in accordance with ethnicity and gender. Recent publications report that WC cutoff point is quite variable among different ethnic groups and between genders. However, based on ethnicity and gen-der, until now, the IDF established WC cutoff point for the general populations for two re-gions only to define MetS, for the European and Asian populations.
In this regard, the African region has no cutoff point for WC to define MetS yet (9). A number of studies support the necessity of locality based WC cutoff points. Consequently, this study aimed to determine WC cut points among T2DM patients in Ayder Comprehensive Specialized Hospital (ACSH), Northern Ethiopia.
eJIFCC2019Vol30No1pp048-058Page 50
Shewit Hailemariam, Tadele Melak, Molla AbebeWaist circumference cutoff point estimation for metabolic syndrome in Ethiopia
MATERIALS AND METHODS
Samples and design
An institution based cross-sectional study was conducted among T2DM patients from March to April 2017 in ACSH. Five hundred twenty par-ticipants were selected based on systematic ran-dom sampling techniques.
Data collection
Data were collected on the basis of self-ad-ministered standardized questionnaires and the measurement of anthropometric, blood pressure and biochemical parameters. A self-administered standardized questionnaire was customized on the basis of the WHO STEP wise approach to non-communicable disease risk fac-tor surveillance (10).
Measurements
Blood pressure was measured after the par-ticipants had rested for at least 5 minutes. The measurements were taken using left arm at the heart level, using BP monitor MB 300-D digital instrument. In each case, the mean of two re-sults was used for analysis (11).
BMI was calculated as weight (kg) divided by height squared (m2). WC was taken by position-ing the non-elastic measuring tape midway be-tween the lower rib margin and the iliac crest. It was measured to the nearest 0.5 cm (12). Fasting (8 to 12 hour) 5 mL venous blood was also collected in clot activated test tubes. Serum was separated within 30 minutes (2000 rpm, 5 minutes). FBG, TG and HDL-C were determined using a Pentra C400 clinical chemistry analyzer.
Data analysis and interpretation
The data were entered into EpiData 3.1 and then transferred to SPSS version 20. Data cleaning was done before analysis, descriptive and summary statistics were also performed. Participants who had one or more abnormal MetS components
(excluding WC and FBS), were coded as case and the others as control (9, 13). The classifica-tion potential (AUC) of WC to distinguish cases from control was determined using ROC curve for both sexes separately. Sensitivity and speci-ficity of WC to distinguish cases from controls was calculated at several WC points. For each WC point Youden index (YI) was calculated. The WC points, having the maximum YI was taken as the optimum cutoff point of WC to classify case from controls. In all conditions, P-value of < 0.05 was considered as statistically significant.
RESULTS
Among the 520 participants, 308 (59.2%) were females. The mean (± SD) ages of the participants were 56 ± 10.8 and 55 ± 11.4 years for males and females, respectively. A majority of the partici-pants, 457/520 (87.9%), were from the urban area (Table 1).
The mean duration of diabetes co-morbidity af-ter diagnoses was 4.7 ± 2.9 years for males and 4.6 ± 2.5 years for females. All of the study par-ticipants are taking anti-diabetic drugs. Seventy two (35%) male and 144 (46.8%) female partici-pants were overweight and obese (Table 2).
Four hundred thirty six patients were investi-gated for MetS (275 females and 161 males). Reduced HDL-C was the most typical abnormal component of MetS in both genders, it was pres-ent in 221 (42.5%) patients. High blood pressure was detected in 157 patients (30.2%) (Table 3).
The classification power of WC to define MetS was characterised by AUC. The value of AUC was 0.67 (95% CI, 0.58-0.75) for males and 0.63 (95% CI, 0.52-0.73) for females, respectively (Figure 1).
The classification power of WC to define the re-duced HDL-C was lower as compared to the oth-er MetS components in both sexes (0.60 in males and 0.53 in females) (Table 4).
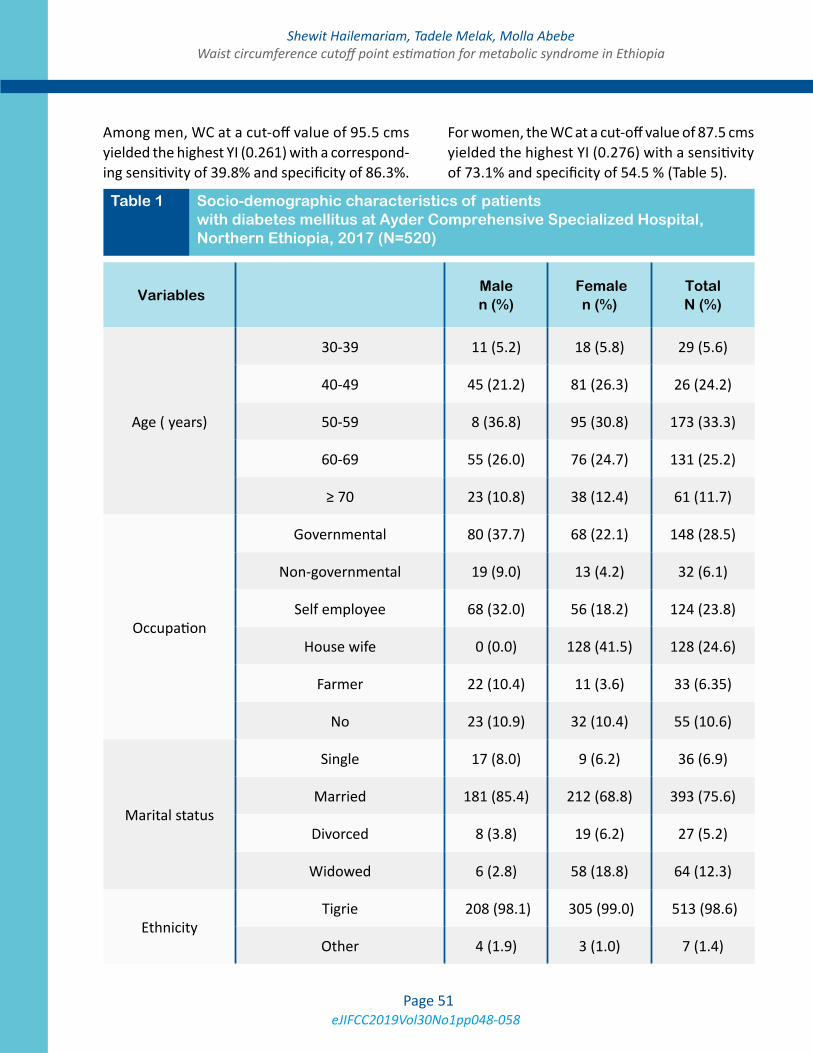
eJIFCC2019Vol30No1pp048-058Page 51
Shewit Hailemariam, Tadele Melak, Molla AbebeWaist circumference cutoff point estimation for metabolic syndrome in Ethiopia
Among men, WC at a cut-off value of 95.5 cms yielded the highest YI (0.261) with a correspond-ing sensitivity of 39.8% and specificity of 86.3%.
For women, the WC at a cut-off value of 87.5 cms yielded the highest YI (0.276) with a sensitivity of 73.1% and specificity of 54.5 % (Table 5).
Variables Male n (%)
Female n (%)
Total N (%)
Age ( years)
30-39 11 (5.2) 18 (5.8) 29 (5.6)
40-49 45 (21.2) 81 (26.3) 26 (24.2)
50-59 8 (36.8) 95 (30.8) 173 (33.3)
60-69 55 (26.0) 76 (24.7) 131 (25.2)
≥ 70 23 (10.8) 38 (12.4) 61 (11.7)
Occupation
Governmental 80 (37.7) 68 (22.1) 148 (28.5)
Non-governmental 19 (9.0) 13 (4.2) 32 (6.1)
Self employee 68 (32.0) 56 (18.2) 124 (23.8)
House wife 0 (0.0) 128 (41.5) 128 (24.6)
Farmer 22 (10.4) 11 (3.6) 33 (6.35)
No 23 (10.9) 32 (10.4) 55 (10.6)
Marital status
Single 17 (8.0) 9 (6.2) 36 (6.9)
Married 181 (85.4) 212 (68.8) 393 (75.6)
Divorced 8 (3.8) 19 (6.2) 27 (5.2)
Widowed 6 (2.8) 58 (18.8) 64 (12.3)
EthnicityTigrie 208 (98.1) 305 (99.0) 513 (98.6)
Other 4 (1.9) 3 (1.0) 7 (1.4)
Table 1 Socio-demographic characteristics of patients with diabetes mellitus at Ayder Comprehensive Specialized Hospital, Northern Ethiopia, 2017 (N=520)
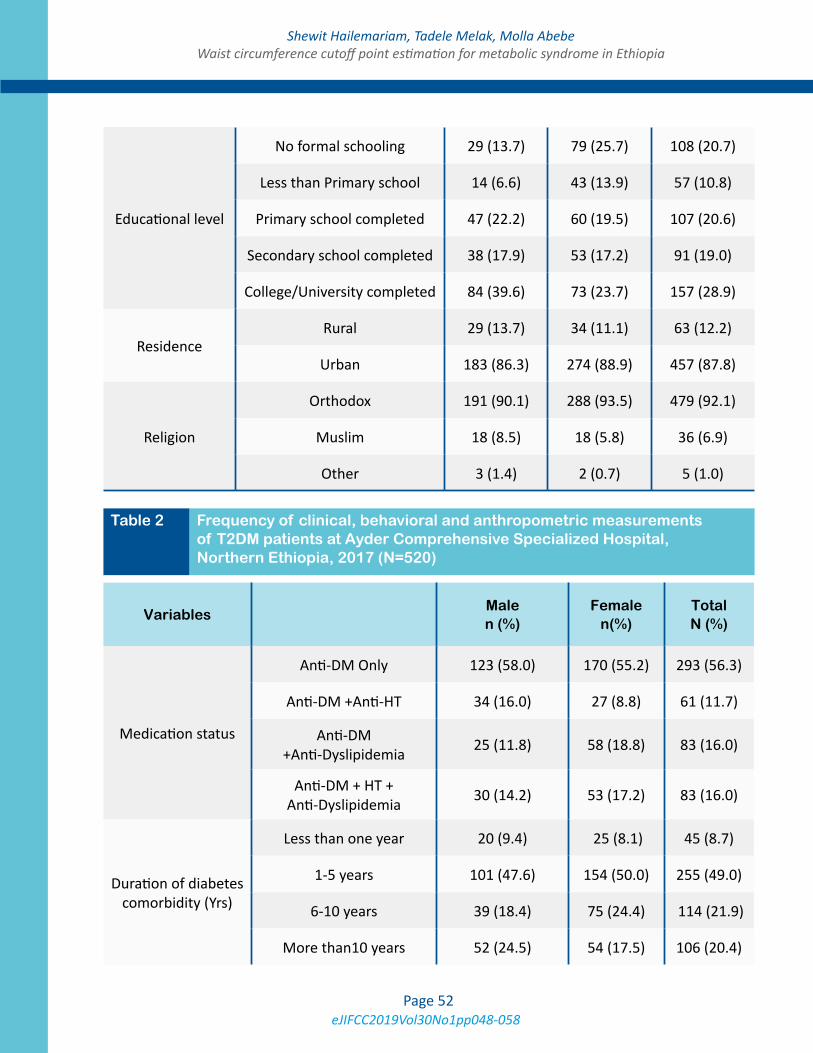
eJIFCC2019Vol30No1pp048-058Page 52
Shewit Hailemariam, Tadele Melak, Molla AbebeWaist circumference cutoff point estimation for metabolic syndrome in Ethiopia
Educational level
No formal schooling 29 (13.7) 79 (25.7) 108 (20.7)
Less than Primary school 14 (6.6) 43 (13.9) 57 (10.8)
Primary school completed 47 (22.2) 60 (19.5) 107 (20.6)
Secondary school completed 38 (17.9) 53 (17.2) 91 (19.0)
College/University completed 84 (39.6) 73 (23.7) 157 (28.9)
ResidenceRural 29 (13.7) 34 (11.1) 63 (12.2)
Urban 183 (86.3) 274 (88.9) 457 (87.8)
Religion
Orthodox 191 (90.1) 288 (93.5) 479 (92.1)
Muslim 18 (8.5) 18 (5.8) 36 (6.9)
Other 3 (1.4) 2 (0.7) 5 (1.0)
VariablesMale n (%)
Female n(%)
Total N (%)
Medication status
Anti-DM Only 123 (58.0) 170 (55.2) 293 (56.3)
Anti-DM +Anti-HT 34 (16.0) 27 (8.8) 61 (11.7)
Anti-DM +Anti-Dyslipidemia 25 (11.8) 58 (18.8) 83 (16.0)
Anti-DM + HT + Anti-Dyslipidemia 30 (14.2) 53 (17.2) 83 (16.0)
Duration of diabetes comorbidity (Yrs)
Less than one year 20 (9.4) 25 (8.1) 45 (8.7)
1-5 years 101 (47.6) 154 (50.0) 255 (49.0)
6-10 years 39 (18.4) 75 (24.4) 114 (21.9)
More than10 years 52 (24.5) 54 (17.5) 106 (20.4)
Table 2 Frequency of clinical, behavioral and anthropometric measurements of T2DM patients at Ayder Comprehensive Specialized Hospital, Northern Ethiopia, 2017 (N=520)
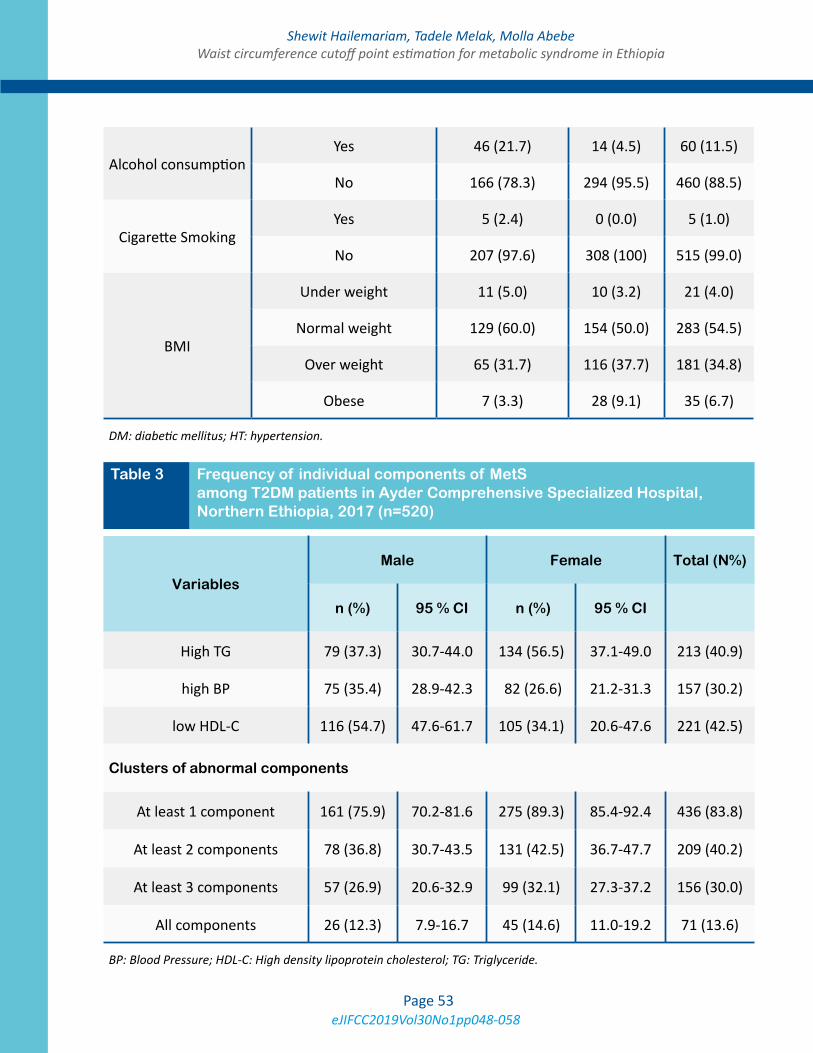
eJIFCC2019Vol30No1pp048-058Page 53
Shewit Hailemariam, Tadele Melak, Molla AbebeWaist circumference cutoff point estimation for metabolic syndrome in Ethiopia
DM: diabetic mellitus; HT: hypertension.
Alcohol consumptionYes 46 (21.7) 14 (4.5) 60 (11.5)
No 166 (78.3) 294 (95.5) 460 (88.5)
Cigarette SmokingYes 5 (2.4) 0 (0.0) 5 (1.0)
No 207 (97.6) 308 (100) 515 (99.0)
BMI
Under weight 11 (5.0) 10 (3.2) 21 (4.0)
Normal weight 129 (60.0) 154 (50.0) 283 (54.5)
Over weight 65 (31.7) 116 (37.7) 181 (34.8)
Obese 7 (3.3) 28 (9.1) 35 (6.7)
Table 3 Frequency of individual components of MetS among T2DM patients in Ayder Comprehensive Specialized Hospital, Northern Ethiopia, 2017 (n=520)
Variables
Male Female Total (N%)
n (%) 95 % CI n (%) 95 % CI
High TG 79 (37.3) 30.7-44.0 134 (56.5) 37.1-49.0 213 (40.9)
high BP 75 (35.4) 28.9-42.3 82 (26.6) 21.2-31.3 157 (30.2)
low HDL-C 116 (54.7) 47.6-61.7 105 (34.1) 20.6-47.6 221 (42.5)
Clusters of abnormal components
At least 1 component 161 (75.9) 70.2-81.6 275 (89.3) 85.4-92.4 436 (83.8)
At least 2 components 78 (36.8) 30.7-43.5 131 (42.5) 36.7-47.7 209 (40.2)
At least 3 components 57 (26.9) 20.6-32.9 99 (32.1) 27.3-37.2 156 (30.0)
All components 26 (12.3) 7.9-16.7 45 (14.6) 11.0-19.2 71 (13.6)
BP: Blood Pressure; HDL-C: High density lipoprotein cholesterol; TG: Triglyceride.
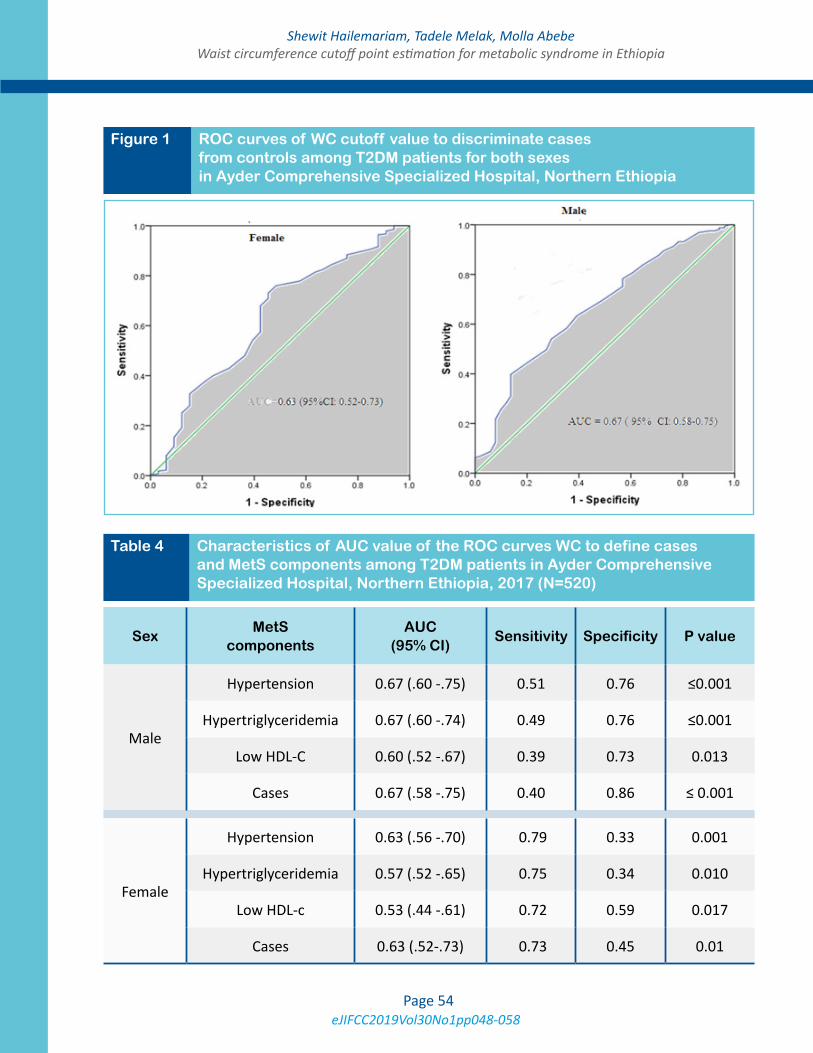
eJIFCC2019Vol30No1pp048-058Page 54
Shewit Hailemariam, Tadele Melak, Molla AbebeWaist circumference cutoff point estimation for metabolic syndrome in Ethiopia
Figure 1 ROC curves of WC cutoff value to discriminate cases from controls among T2DM patients for both sexes in Ayder Comprehensive Specialized Hospital, Northern Ethiopia
Table 4 Characteristics of AUC value of the ROC curves WC to define cases and MetS components among T2DM patients in Ayder Comprehensive Specialized Hospital, Northern Ethiopia, 2017 (N=520)
SexMetS
componentsAUC
(95% CI)Sensitivity Specificity P value
Male
Hypertension 0.67 (.60 -.75) 0.51 0.76 ≤0.001
Hypertriglyceridemia 0.67 (.60 -.74) 0.49 0.76 ≤0.001
Low HDL-C 0.60 (.52 -.67) 0.39 0.73 0.013
Cases 0.67 (.58 -.75) 0.40 0.86 ≤ 0.001
Female
Hypertension 0.63 (.56 -.70) 0.79 0.33 0.001
Hypertriglyceridemia 0.57 (.52 -.65) 0.75 0.34 0.010
Low HDL-c 0.53 (.44 -.61) 0.72 0.59 0.017
Cases 0.63 (.52-.73) 0.73 0.45 0.01
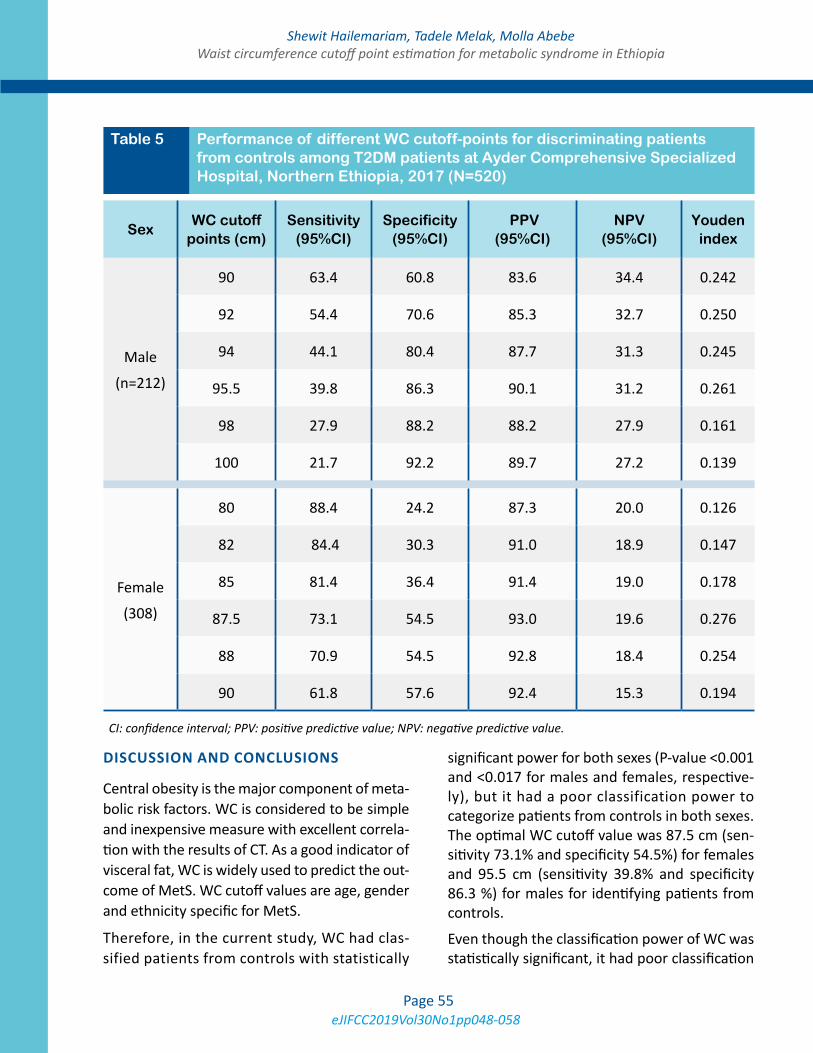
eJIFCC2019Vol30No1pp048-058Page 55
Shewit Hailemariam, Tadele Melak, Molla AbebeWaist circumference cutoff point estimation for metabolic syndrome in Ethiopia
DISCUSSION AND CONCLUSIONS
Central obesity is the major component of meta-bolic risk factors. WC is considered to be simple and inexpensive measure with excellent correla-tion with the results of CT. As a good indicator of visceral fat, WC is widely used to predict the out-come of MetS. WC cutoff values are age, gender and ethnicity specific for MetS.
Therefore, in the current study, WC had clas-sified patients from controls with statistically
significant power for both sexes (P-value <0.001 and <0.017 for males and females, respective-ly), but it had a poor classification power to categorize patients from controls in both sexes. The optimal WC cutoff value was 87.5 cm (sen-sitivity 73.1% and specificity 54.5%) for females and 95.5 cm (sensitivity 39.8% and specificity 86.3 %) for males for identifying patients from controls.
Even though the classification power of WC was statistically significant, it had poor classification
Table 5 Performance of different WC cutoff-points for discriminating patients from controls among T2DM patients at Ayder Comprehensive Specialized Hospital, Northern Ethiopia, 2017 (N=520)
SexWC cutoff
points (cm)Sensitivity
(95%CI)Specificity
(95%CI) PPV
(95%CI)NPV
(95%CI)Youden
index
Male
(n=212)
90 63.4 60.8 83.6 34.4 0.242
92 54.4 70.6 85.3 32.7 0.250
94 44.1 80.4 87.7 31.3 0.245
95.5 39.8 86.3 90.1 31.2 0.261
98 27.9 88.2 88.2 27.9 0.161
100 21.7 92.2 89.7 27.2 0.139
Female
(308)
80 88.4 24.2 87.3 20.0 0.126
82 84.4 30.3 91.0 18.9 0.147
85 81.4 36.4 91.4 19.0 0.178
87.5 73.1 54.5 93.0 19.6 0.276
88 70.9 54.5 92.8 18.4 0.254
90 61.8 57.6 92.4 15.3 0.194
CI: confidence interval; PPV: positive predictive value; NPV: negative predictive value.

eJIFCC2019Vol30No1pp048-058Page 56
Shewit Hailemariam, Tadele Melak, Molla AbebeWaist circumference cutoff point estimation for metabolic syndrome in Ethiopia
power for males (AUC=0.67; 95% CI: 0.58-0.75), and for females (AUC =0.63; 95% CI 0.52-0.73) to discriminate cases from controls (14). Similar to our study, the classification power of WC to classify patient from control was poor in a study conducted in Benin, where, the AUC was 0.67 for males and 0.68 for females (15). Moreover, in Egypt it was also 0.69 for males and 0.63 for females (16).
On the contrary, in several studies such as in Angola (0.85 in males and 0.79 in females) (17), and in Congolese adults (0.899 in males and 0.844 in females) (18), WC had a good classifi-cation power to classify patient from control in both sexes.
In our study, the optimal WC cutoff point that best predicts cases was 95.5 cm for the T2DM males, which is relatively higher than the value for females. The finding from the present study is slightly higher than the IDF recommended val-ue for males, which is 94 cm (9).
In contrast to our study, WC cutoff point in ur-ban African teachers was 90 cm in men (19) and the same to that in black South African T2DM male patients were also 90 cm (20). These val-ues were somewhat different to that found in T2DM male patients in our study area.
The WC cutoff value for T2DM females deter-mined in this study is 87.5 cm which is similar to the study in University employees in Angola (87.5 cms) (21).
The result from this study was higher than the recommended cutoff points to define cases for African females, which is ≥80 cms. Whereas our finding is lower than the study conducted with African females, which was 98 cm (19) and a in study from Egyptian adults (96.25 cms) (16).
The present study suggested that the WC cutoff point for females is lower than males, which is in agreement with the recommended value.
Some studies show that the WC cutoff point for African populations is higher in rural South African females (92 cms) than males (86 cms) (22), in Cape Town 94 cm for females and 83.9 cm for males (23).
Similarly, in Benin, the cutoff is 94 cm for females and 80 cm for males, which is the exact reverse of the recommended value (24). Furthermore, a study in Congolese community also shows high-er WC value for females (99 cms) compared to the males (95 cms) (18).
In general, several studies in Africa that deter-mined WC cutoff points showed a higher WC value in females as compared to males. On the contrary, our finding is higher in males than fe-males, which is in agreement with the IDF.
On the other hand, a study from Tunisian adults showed equal value of WC for both males and females which was 85 cm (25). Although the WC value in adult Egyptian females (96.2 cms) wasn’t higher than males (100.5 cms), it is higher than the IDF recommended value for African females (16).
Further study in prospective cohort is better to determine the optimal WC cutoff point among T2DM patients to define MetS. In addition, studies which can consider the confounders such as lipid lowering medications, age of the participants and duration of diabetes are advis-able in order to increase the classification pow-er of WC.
List of abbreviations
AUC: Area Under the Curve
BMI: Body Mass Index
BP: Blood Pressure
CT: Computed Tomography
CV: Cardiovascular
eJIFCC2019Vol30No1pp048-058Page 57
Shewit Hailemariam, Tadele Melak, Molla AbebeWaist circumference cutoff point estimation for metabolic syndrome in Ethiopia
CVD: Cardiovascular Disease
FBG: Fasting Blood Glucose
HDL-C: High Density Lipoprotein cholesterol
HT: Hypertensive
IDF: International Diabetes Federation
IR: Insulin Resistance
LDL-C: Low Density Lipoprotein cholesterol
MetS: Metabolic syndrome
NCD: Non Communicable Disease
NCEP/ATPIII: National Cholesterol Education Program Adult Treatment Panel III
NT: Normotensive
ROC: Receiver Operating Characteristics
T2DM: Type two Diabetes Mellitus
TG: Triglyceride
VAT: Visceral Adipose Tissue
WC: Waist Circumference
WHO: World Health Organization YI: Youden Index
Ethical issue
Ethical clearance was obtained from the Insti tu-tional Review Board of the University of Gondar. The purpose and importance of the study were explained to the participants. The data were col-lected after a full written consent was received.
Author’s contribution
SH conceived the idea, carried out the proposal writing, participated in the data collection, data analysis and drafted the manuscript. TM and MA participated in data analysis and interpretation of the findings. TM participated on final write-up of the paper. All authors reviewed the manu-script and approved for publication.
Conflict of interests
The authors declared no conflict of interests.
Funding
No specific fund for this research work.
Acknowledgments
The authors would like to acknowledge the study participants and the Ayder Comprehensive Spe-cialized Hospital.
REFERENCES
1. Manish SMRG, Keshav GK, Sukriti K, Gupta A. Site or Size of Waist Circumference, Which one is More impor-tant in Metabolic Syndrome? Int J Med. Public Health. 2016;6(2):69-72.
2. Alshehri AM. Metabolic syndrome and cardiovascular risk. J Family Community Med. 2010;17(2):73.
3. Pedrinelli R, Dell’Omo G, Di Bello V, Pontremoli R, Mari-ani M. Microalbuminuria, an integrated marker of cardio-vascular risk in essential hypertension. J hum hypertens. 2002;16(2):79-89.
4. Fezeu L, Balkau B, Kengne A-P, Sobngwi E, Mbanya J-C. Metabolic syndrome in a sub-Saharan African setting: central obesity may be the key determinant. Atheroscle-rosis. 2007;193(1):70-6.
5. Pischon T, Boeing H, Hoffmann K, Bergmann M, Schulze MB, Overvad K, et al. General and abdominal adiposity and risk of death in Europe. N Engl J Med. 2008;359(20):2105-20.
6. Van der Kooy K, Seidell JC. Techniques for the measure-ment of visceral fat: a practical guide. Int J Obes Relat Metab Disord. 1993;17(4):187-96.
7. Sanches FM, Avesani CM, Kamimura MA, Lemos MM, Axelsson J, Vasselai P, et al. Waist circumference and vis-ceral fat in CKD: a cross-sectional study. Am J Kidney Dis. 2008;52(1):66-73.
8. Ma W-Y, Yang C-Y, Shih S-R, Hsieh H-J, Hung CS, Chiu F-C, et al. Measurement of Waist Circumference Midab-dominal or iliac crest? Diabetes care. 2013;36(6):1660-6.
9. Alberti K, Eckel RH, Grundy SM, Zimmet PZ, Cleeman JI, Donato KA, et al. Harmonizing the metabolic syndrome. Circulation. 2009;120(16):1640-5.
eJIFCC2019Vol30No1pp048-058Page 58
Shewit Hailemariam, Tadele Melak, Molla AbebeWaist circumference cutoff point estimation for metabolic syndrome in Ethiopia
10. WHO. The WHO STEPwise approach to noncommuni-cable disease risk factor surveillance (STEPS): WHO STEP-wise approach surveillance- Instrument 3.1.
11. Ranasinghe P, Cooray DN, Jayawardena R, Katulanda P. The influence of family history of Hypertension on disease prevalence and associated metabolic risk factors among Sri Lankan adults. BMC Public Health. 2015;15(1):1-9.
12. European Health Risk Monitoring (EHRM). National Public Health Institute Recommendation for indicators, international collaboration, protocol and manual of op-erations for chronic disease risk factor surveys 2002.
13. Grundy SM, Brewer HB, Cleeman JI, Smith SC, Len-fant C. Definition of metabolic syndrome. Circulation. 2004;109(3):433-8.
14. Hajian-Tilaki K. Receiver operating characteristic (ROC) curve analysis for medical diagnostic test evalua-tion. Caspian J Intern Med. 2013;4(2):627.
15. Agueh VD, Sossa C, Ouendo DM-E, Paraizo NM, Azan-djemè C, Kpozehouen A, et al. Determination of the opti-mal waist circumference cut-off points in Benin adults. O J Epi. 2015;5(04):217.
16.Assaad-Khalil SH, Mikhail MM, Aati TA, Zaki A, Helmy MA, Megallaa MH, et al. Optimal waist circumference cutoff points for the determination of abdominal obe-sity and detection of cardiovascular risk factors among adult Egyptian population. Indian J Endocrinol Metab. 2015;19(6):804.
17. Magalhães P, Capingana DP, Mill JG. Prevalence of the metabolic syndrome and determination of optimal cut-off values of waist circumference in university employ-ees from Angola: cardiovascular topic. Cardiovasc J Afr. 2014;25(1):27-33.
18. Katchunga PB, Hermans M, Bamuleke BA, Katoto PC, Kabinda JM. Relationship between waist circumference,
visceral fat and metabolic syndrome in a Congolese com-munity: further research is still to be undertaken. Pan Afr Med J. 2013;14(1).
19. Prinsloo J, Malan L, De Ridder J, Potgieter J, Steyn H. Determining the waist circumference cut off which best predicts the metabolic syndrome components in urban Africans: the SABPA study. Exp Clin Endocrinol Diabetes. 2011;119(10):599-603.
20. Kalk WJ, Joffe BI, Sumner AE. The waist circumfer-ence of risk in black South African men is lower than in men of European ancestry. Metabol Syndr Relat Disord. 2011;9(6):491-5.
21. Magalhães P, Capingana DP, Mill JG. Prevalence of the metabolic syndrome and determination of optimal cut-off values of waist circumference in university employees from Angola. Cardiovasc J Afr. 2014; 25(1):27-3.
22. Motala AA, Esterhuizen T, Pirie FJ, Omar MA. The prev-alence of metabolic syndrome and determination of the optimal waist circumference cutoff points in a rural South African community. Diabetes care. 2011;34(4):1032-7.
23. Peer N, Steyn K, Levitt N. Differential obesity indi-ces identify the metabolic syndrome in Black men and women in Cape Town: the CRIBSA study. J Pub Health. 2016;38(1):175-82.
24. Mabchour AE, Delisle H, Vilgrain C, Larco P, Sodjinou R, Batal M. Specific cut-off points for waist circumference and waist-to-height ratio as predictors of cardiometabolic risk in Black subjects: a cross-sectional study in Benin and Haiti. Diabetes Metab Syndr Obes. 2015;8:513.
25. Bouguerra R, Alberti H, Smida H, Salem L, Rayana C, El Atti J, et al. Waist circumference cutoff points for iden-tification of abdominal obesity among the Tunisian adult population. Diabetes Obes Metab. 2007;9(6):859-68.
eJIFCC2019Vol30No1pp059-066Page 59
This is a Platinum Open Access Journal distributed under the terms of the Creative Commons Attribution Non-Commercial License which permits unrestricted non-commercial use, distribution, and reproduction in any medium, provided the original work is properly cited.
Critical issues and new trends on stat tests in clinical laboratoryAriadna Arbiol-Roca, Dolors Dot-Bach Laboratori Clínic Territorial Metropolitana Sud (LCTMS), University Hospital of Bellvitge, L’Hospitalet de Llobregat, Barcelona, Catalonia, Spain
A R T I C L E I N F O A B S T R A C T
Meeting Report on the IX European Symposium on Clinical Laboratory and In Vitro Diagnostics Industry (Barcelona)
The IX European Symposium of the Clinical Laboratory and In Vitro Diagnostics Industry, entitled “Stat Tests in Clinical laboratory”, took place in Barcelona, Catalonia (Spain), between May 17–18, 2017.
The scientific program was structured in several round-tables that dealt with the following topics: emergency laboratory models, accreditation of stat tests by ISO 15189, critical issues of stat tests and the new propos-als of the in vitro diagnostics industry for emergency laboratories. The aim of the Symposium was the dis-cussion of the transformation that stat tests have generated on clinical laboratories in terms of organi-zation, turnaround time, accreditation, and probable evolution of these laboratories coming years.
Corresponding author:Ariadna Arbiol-RocaLaboratori Clínic Territorial Metropolitana Sud (LCTMS) University Hospital of BellvitgeFeixa Llarga s/n, 08907L’Hospitalet de LlobregatBarcelonaSpainE-mail: [email protected]
Key words:stat tests, symposium, clinical laboratory
eJIFCC2019Vol30No1pp059-066Page 60
Ariadna Arbiol-Roca, Dolors Dot-Bach Critical issues and new trends on stat tests in clinical laboratory
INTRODUCTION
The IX European Symposium of the Clinical Laboratory and In Vitro Diagnostics Industry, entitled “Stat Tests in Clinical laboratory”, was held in a most welcoming yet modern envi-ronment at the old gothic Hospital de la Santa Creu. The event was co-organized between the Catalan Association of Clinical Laboratory Sciences (ACCLC) and the Catalan Society of Biology (SCB). The symposium was sponsored by the International Union of Pure and Applied Chemistry (IUPAC) and under the auspices of the European Federation of Clinical Chemistry and Laboratory Medicine (EFLM) and International Federation of Clinical Chemistry and Laboratory Medicine (IFCC).
The topic of stat testing in clinical laboratories was chosen as an opportunity to discuss the cur-rent state of emergency laboratories and also analyse the probable evolution of these labora-tories in the coming years. Stat (from the Latin statim, immediately, but also considered as an acronym for “short turnaround time”) identifies laboratory tests that should be made available within a defined, as short as possible time, ac-cording to clinical necessity (1,2).
There are several reasons that make stat testing an interesting topic for a Symposium. Mainly, organizational and economic aspects: collect-ing blood outside scheduled activity, the need of quick sample transportation to the labora-tory in some cases with pneumatic tube sys-tems, activation of specific paths for managing specimens with priority over routine samples, in many of laboratories entails exclusive staff, specific instrumentation and the need to main-taining back-up instrumentation (3).
EMERGENCY LABORATORY MODELS
Currently, three laboratory models are adopted for the management and performance of stat tests. Each of these solutions is related to the
size and type of hospital or institution in which they are employed (2).
Generally, in small- and medium-size laborato-ries, ordinary and stat tests are integrated, and their analysis is performed in the same place using the same instrumentation. The situation in large laboratories is rather more heteroge-neous, with the majority of organisations con-tinuing to separate stat from ordinary tests, using different instrumentation, personnel and locations. An intermediate option also exists, in which stat test analyses are semi-integrated in an automated core chain with routine samples, all of which are processed at the same time. However, each approach requires specific work-flow processes, leading to different timeliness to produce a validated result. Generally speak-ing, the stat testing process should be struc-tured to fit the context of care in which the test-ing services are required.
There was a strong discussion regarding how to prioritise these stat analyses in order to provide an adequate turnaround time (TAT), such as for samples in a specific emergency chain and branches of the chain for the highest-priority samples. It was concluded that large laborato-ries tend to incorporate stat tests in central au-tomation areas (core), prioritising and adapting circuits to obtain response times appropriate to the needs of each situation.
For decades, stat tests have been performed in dedicated laboratories, either at stand-alone satellite locations or aggregated with central laboratories. However, considering that today all first-line tests can be managed rapidly via total laboratory automation (TLA) (24-hour laborato-ries), the traditional model appears outmoded for several reasons.
Firstly, a dedicated emergency laboratory repre-sents a source of duplication of analytical plat-forms that perform the same assay in both emer-gency and ordinary situations, as well as the
eJIFCC2019Vol30No1pp059-066Page 61
Ariadna Arbiol-Roca, Dolors Dot-Bach Critical issues and new trends on stat tests in clinical laboratory
duplication of operating staff and, sometimes, the duplication of orders for the same test.
Secondly, from an analytical perspective, parallel processing of tests across more than one labora-tory location within a healthcare setting requires that the analyser alignment be checked continu-ously to assure comparability of patient results. Although ensuring that the difference between results produced for the same test in stat and central laboratories does not exceed a clinically acceptable difference is often a challenge, it is mandatory for patient monitoring during hospi-talisation. All this complexity represents a signifi-cant drain on laboratory resources and makes the dedicated emergency laboratory/section model outdated and more expensive than TLA, espe-cially when the latter can manage modern testing processes effectively and with a short TAT (2).
Finally, the chairman enquired as to the role of point-of-care testing (POCT) in emergency lab-oratories. Bedside testing through implemen-tation of point-of-care devices in the emergen-cy department, intensive care unit or any other ward that more often would require urgent test results for patient management.
The experts explained that POCT at satellite lo-cations may represent a new laboratory model. Stat tests may sometimes be performed near an intensive care department as part of critical analyses used in the evaluation of vital func-tions. POCT is typically evaluated positively by clinicians because it allows a reduction in TAT and a reduced length of stay in the emergency department (4).
All the experts agreed that POCT should depend on laboratory staff because it is a stat test ac-tivity. The involvement of laboratory staff in the management of POCT should therefore be total, from the choice of measurement system, staff training, and quality control assurance to the in-tegration of the results into the clinical history of the patient.
ACCREDITATION OF STAT TESTS BY ISO 15189
The second roundtable discussion addressed is-sues regarding the accreditation of stat tests by the International Standard ISO 15189. All experts work at emergency laboratories, ac-credited by UNE-EN ISO 15189, and which perform a high percentage of accredited stat tests. Accreditation is a procedure by which an authoritative body gives formal recognition that an organisation is competent to carry out specific tasks according to certain standards. The National Accreditation and Certification Authority (ENAC) is the agency appointed by the Spanish government to operate as the only national accreditation body. Accreditation of stat test laboratories according to ISO 15189 is becoming more and more a matter of course in Catalonia. However, there are currently only ac-credited stat tests laboratories in the province of Barcelona, with those in Girona, Lleida and Tarragona certified by ISO 9001:2008 or ISO 9001:2015. The essential difference between certification and accreditation is that the latter, as well as management requirements, also re-fers to technical competence (5).
To accredit or not to accredit, that is the ques-tion. All speakers agreed that the process of accreditation would improve the quality of lab services due to the better documentation of processes and the increased responsibilities or interest of management. The first step prior to accreditation is building an enthusiastic team that is educated regarding the development of quality management systems.
There was an interesting debate as to whether the accreditation of stat tests is more difficult than the accreditation of routine analyses. The former is certainly more laborious because emergency laboratories contain many members of staff and accreditation requires an increase in staff competence. Frustration of evaluated
eJIFCC2019Vol30No1pp059-066Page 62
Ariadna Arbiol-Roca, Dolors Dot-Bach Critical issues and new trends on stat tests in clinical laboratory
staff must be avoided, and they must be shown that accreditation is a continuous process of im-provement. Laboratory leaders must ensure that staff technical competence is highly praised, as this can provide a great boost to team spirit, as well as instil a sense of achievement and pride in their accreditation.
It was agreed that quality standards for stat tests should be just as rigorous as those for rou-tine tests. Moreover, internal and external qual-ity controls must be available for all parameter devices and must fulfil the same quality require-ments specified for non-stat test analysis (5).
In addition, interchangeability studies must be carried out when emergency laboratories are separated from routine laboratories using dif-ferent instrumentation. ISO 15189 requires that results obtained using different devices are in-terchangeable in order to assess non-different clinically relevant discrepancies (5).
It was deemed necessary to be proactive in risk management and to make good use of brands listed by ENAC in the final laboratory reports, although the experts outlined the potential dif-ficulties of their use following the regulations.
During the roundtable, it was also emphasised that laboratories should evaluate the impact of work processes and potential failures on exami-nation results, as they can affect patient safety. Laboratories should therefore modify these pro-cesses to reduce or eliminate the identified risks, as well as document decisions and actions taken.
It was noted that the presence of the ENAC mark on reports provides an assurance that the labo-ratory will be able to rely on this endorsement; only laboratories that are actually accredited can make use of the ENAC mark to indicate accred-ited status (5). However, the experts explained there can be difficulties in using the ENAC mark in final reports, with improper use potentially leading ENAC to bring legal action against the laboratory.
Finally, the speakers encouraged the attendees to consider and initiate actions that will lead them to accreditation, arguing that they them-selves had perceived internal improvements in their processes and that they were very satis-fied to have achieved this. Accreditation is a process that involves the whole laboratory and requires both good support from management and the positive assessment of clients (clini-cians and patients).
Hence, higher quality laboratory testing associ-ated with accreditation is expected to improve patient care by aiding the timeliness and accu-racy of medical decision making.
Accreditation programs can help drive improve-ments in the management of individual labo-ratories and laboratory networks and may also have positive spill over effects on performance in other sectors of the health care system. In sum-mary, laboratory accreditation can be achieved through leadership, vision and hard work.
CRITICAL ISSUES OF STAT TESTS
The third debate was attended by a clinician who shared their vision of the laboratory from an outside perspective. Critical issues discussed included the non-conformities that laborato-ries detect in samples and the impact that they may have on result interpretation. All speakers agreed that a strict stance should be taken when dealing with stat test non-conformities such as haemolytic, poorly spotted or insufficient sam-ples. Greater awareness should be promoted among clinicians, as should the continued train-ing of nursing staff involved in sample extrac-tion. It became clear during the debate that in special situations, such as with newborns, it would be necessary to consider a differentiated treatment.
Currently, serum index measurement (hae-molysis, icterus and lipaemia) is automated and determination of the interfering substances is
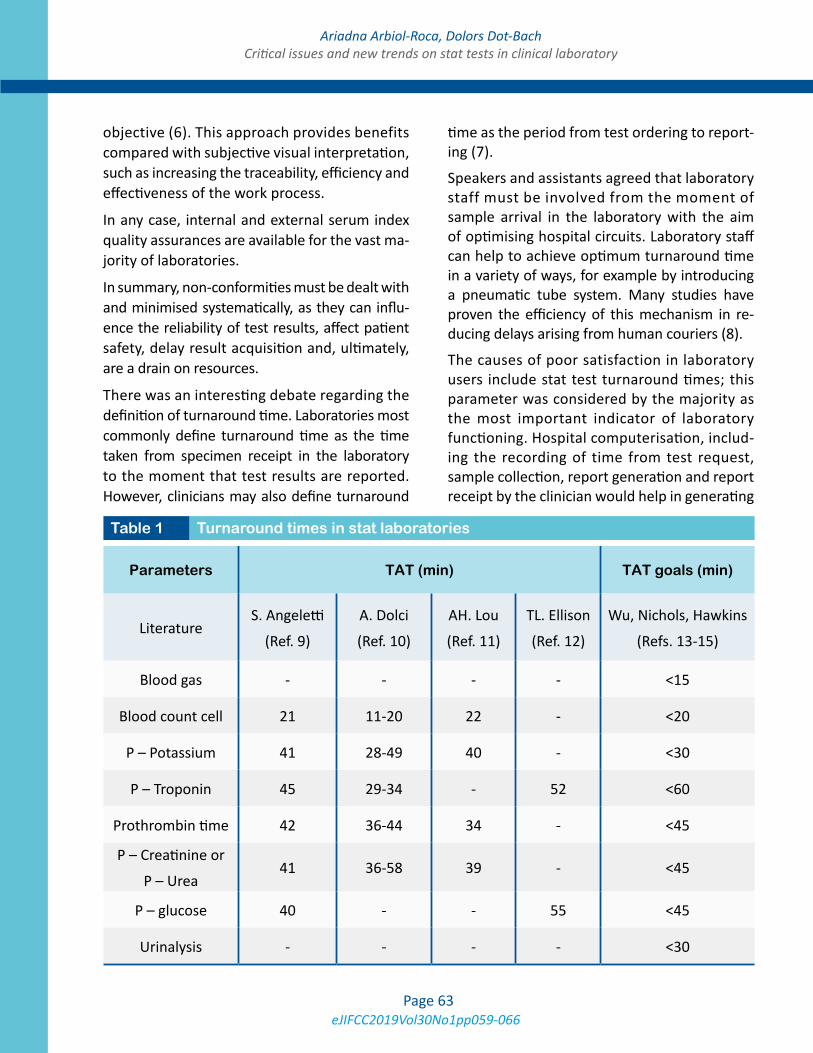
eJIFCC2019Vol30No1pp059-066Page 63
Ariadna Arbiol-Roca, Dolors Dot-Bach Critical issues and new trends on stat tests in clinical laboratory
objective (6). This approach provides benefits compared with subjective visual interpretation, such as increasing the traceability, efficiency and effectiveness of the work process.
In any case, internal and external serum index quality assurances are available for the vast ma-jority of laboratories.
In summary, non-conformities must be dealt with and minimised systematically, as they can influ-ence the reliability of test results, affect patient safety, delay result acquisition and, ultimately, are a drain on resources.
There was an interesting debate regarding the definition of turnaround time. Laboratories most commonly define turnaround time as the time taken from specimen receipt in the laboratory to the moment that test results are reported. However, clinicians may also define turnaround
time as the period from test ordering to report-ing (7).
Speakers and assistants agreed that laboratory staff must be involved from the moment of sample arrival in the laboratory with the aim of optimising hospital circuits. Laboratory staff can help to achieve optimum turnaround time in a variety of ways, for example by introducing a pneumatic tube system. Many studies have proven the efficiency of this mechanism in re-ducing delays arising from human couriers (8).
The causes of poor satisfaction in laboratory users include stat test turnaround times; this parameter was considered by the majority as the most important indicator of laboratory functioning. Hospital computerisation, includ-ing the recording of time from test request, sample collection, report generation and report receipt by the clinician would help in generating
Parameters TAT (min) TAT goals (min)
LiteratureS. Angeletti
(Ref. 9)
A. Dolci
(Ref. 10)
AH. Lou
(Ref. 11)
TL. Ellison
(Ref. 12)
Wu, Nichols, Hawkins
(Refs. 13-15)
Blood gas - - - - <15
Blood count cell 21 11-20 22 - <20
P – Potassium 41 28-49 40 - <30
P – Troponin 45 29-34 - 52 <60
Prothrombin time 42 36-44 34 - <45
P – Creatinine or
P – Urea41 36-58 39 - <45
P – glucose 40 - - 55 <45
Urinalysis - - - - <30
Table 1 Turnaround times in stat laboratories
eJIFCC2019Vol30No1pp059-066Page 64
Ariadna Arbiol-Roca, Dolors Dot-Bach Critical issues and new trends on stat tests in clinical laboratory
turnaround time data. Analysis of any outliers in turnaround times in a lab would then provide an insight into potential causes of delays and the areas that need improvement.
Table 1 shows summarizing data from previous publications on turnaround times for stat test results. Differences among laboratories have been shown. TAT goals for stat samples were established by different recommendations from clinical practice guidelines.
There are situations that these TAT have to be improved, for example: sepsis code, stroke code and myocardial infarction code. Emergency de-partments, primary care physicians, divisions of cardiology, hospital administrations, and labo-ratory staff should work collectively to develop an accelerated protocol for the use of biochem-ical markers in the evaluation of these patients.
Another topic discussed was the catalogue of a stat test laboratory. It was argued that several aspects should be considered before a stat test is included in a catalogue, with the following underlined: cost, knowledge of the property, technological availability, human resources, and characteristics of the test in terms of positive and negative predictive value, sensitivity and specificity, and above all clinical utility.
The catalogue should be adapted to the labora-tory needs of each hospital and it is essential to reach agreement with clinicians. The control of demand must be based on scientific evidence and not guided by economic criteria alone.
In many laboratories, it is obvious that some tests are ordered as stat not for clinical needs but rather for other organisational reasons, such as quick retesting due to previously unsuit-able samples, requests for previously forgotten tests, or a desire to receive routine results more rapidly (16).
Sometimes, users may simply be unaware of the difference between stat and ordinary tests.
However, logistical issues can never be consid-ered a good reason for ordering stat tests, as inappropriately ordered tests may degrade the ability of the laboratory to deliver clinically ur-gent information in a timely fashion. Clinicians not receiving results in the expected timeframe typically order more urgent tests, further re-ducing laboratory effectiveness and increasing costs (17).
Finally, a discussion took place regarding critical results, i.e. those results that must be immedi-ately sent, either by phone or electronically, to the patient care provider by laboratory staff. The question arose as to who should define a result as being of critical value; responses included the requirement for consensus with clinicians, published recommendations and laboratories’ professional experience.
An expert outlined a project involving the Catalan Institute of Health (ICS) and other cen-tres. As part of the project, a descriptive cross-sectional study was undertaken by laboratory professionals and clinicians from hospitals and primary care centres, with biological param-eters reviewed whose values - are likely to be considered as possibly critical - and therefore must be reported. In addition, the critical limits considered and actions carried out after obtain-ing a critical result were also reviewed. From this approach an agreement between the par-ticipating laboratories was reached that subse-quently formed the basis for the construction of an initial model, based on consensus with clini-cal practitioners.
To achieve consensus with clinicians, a Delphi model was applied in real time according to the “Health Consensus” methodology.
The model used data from a questionnaire that was sent to clinicians to value and identify, ac-cording to their criteria, when a result should be considered critical. The document prepared will be available soon.
eJIFCC2019Vol30No1pp059-066Page 65
Ariadna Arbiol-Roca, Dolors Dot-Bach Critical issues and new trends on stat tests in clinical laboratory
PROPOSALS OF THE IN VITRO DIAGNOSTICS INDUSTRY FOR EMERGENCY LABORATORIES
The final debate was performed with the col-laboration of the in vitro diagnostics industry, who outlined potential technological solutions for emergency laboratories.
Initially, each representative of the in vitro di-agnostics industry explained their technological proposal for stat test laboratories. All speakers agreed that each laboratory and hospital is differ-ent and that flexible solutions should be sought for each model.
Currently, three laboratory models are avail-able: ordinary and stat tests fully integrated into automated chains; stat test laboratories inde-pendent from ordinary test laboratories; and an intermediate option in which stat test analyses are semi-integrated in an automated core chain with routine samples, all of which are processed at the same time.
Many laboratories are currently considering the installation of total laboratory automation systems for routine clinical chemistry and labo-ratory haematology testing. The advantages of total laboratory automation include cost reduc-tion and improved turnaround time. Such auto-mated pipelines integrate pre-analytics (check-in, sorting, centrifugation and aliquoting) and post-analytics (storage and disposition), offer-ing the possibility of bulk input, volume detec-tion, aliquoting and storage. All speakers stated that their companies are attempting to find so-lutions with which to prioritise the processing of stat test samples within automated chains.
The moderator and attendees asked the indus-try representatives to promote the develop-ment of computer-based tools that would allow the calculation of turnaround time and allow users to determine exactly how long each pro-cess lasts, including centrifugation, aliquoting,
processing and report global delivery time. They also advised that the industry focus their efforts on achieving improvements in pre-analytical processes. Computer enhancements should also be made available for communicating criti-cal results either through mobile telephony or messaging via tablets and other devices. All speakers agreed that they encounter many problems regarding the protection of data when installing such systems in hospitals. Finally, they were asked to work to offer technological and other solutions so that stat test laboratories can obtain accreditation, according to UNE-EN ISO 15189, for the analyses carried out.
Finally, the in vitro diagnostics industry repre-sentatives acknowledged that it is necessary to work together to solve both current needs and those that may arise in the future.
CONCLUSIONS
We are moving towards a new model of health-care system, in which every patient has a criti-cal pathology and treatment is “emergent” for all. In this scenario, laboratories must consider every test a stat test, so that the separation be-tween routine and stat processes is abolished. Automation, and particularly total laboratory automation, represents a formidable tool with which to both meet increasingly demanding critical needs and, even more importantly, im-prove patient outcomes.
In conclusion, in laboratory medicine, although technology can be used to improve clinical ef-fectiveness and patient outcomes, it must be managed by qualified laboratory professionals.
REFERENCES1. Lippi G, Caputo M, Banfi G, Buttarello M, Ceriotti F, Daves M, et al. Recommendations for the detection and management of critical values in clinical laboratories. Bio-chim Clin. 2008;32:209–16.
2. Soffiati G, Giavarina D. Stat laboratory testing: integra-tion or autonomy? Clin Chem Lab Med. 2010;48(7):927-30.
eJIFCC2019Vol30No1pp059-066Page 66
Ariadna Arbiol-Roca, Dolors Dot-Bach Critical issues and new trends on stat tests in clinical laboratory
3. Lippi G, Mattiuzzi C, Plebani M. Stat testing utilization in clinical laboratories. National survey of Italian Society of Clinical Biochemistry and Molecular Biology (SIBioC). Clin Chem Lab Med. 2014;52(5):e79-84.
4. Plebani M, Lippi G. Point of care testing: evolving sce-narios and innovative perspectives. Clin Chem Lab Med. 2014;52(3):309-11.
5. International Organization for Standardization (ISO). Medical laboratories – particular requirements for qual-ity and competence. ISO 15189:2012.
6. Simundic AM, Nikolac N, Ivankovic V, Ferenec-Ruzic D, Magdic B, Kvaternik M, et al. Comparison of visual vs. automated detection of lipemic, icteric and hemolyzed specimens: can we rely on a human eye? Clin Chem Lab Med. 2009;47(11):1361-5.
7. Salinas M, Lopez-Garrigos M, Gutierrez M, Lugo J, Llorca F, Uris J. Stat laboratory timeliness management according to clinician needs. Clin Chem Lab Med. 2011;49(2):331-3.
8. Guss DA, Chan TC, Killeen JP. The impact of a pneu-matic tube and computerized physician order manage-ment on laboratory turnaround time. Ann Emerg Med. 2008;51(2):181-5.
9. Angeletti S, De Cesaris M, Hart JG, Urbano M, Vitali MA, Fragliasso F, Dicuonzo G. Laboratory Automation and Intra-Laboratory Turnaround Time: Experience at the University Hospital Campus Bio-Medico of Rome. J Lab Autom.2015;20(6):652-8.
10. Dolci A, Giavarina D, Pasqualetti S, Szoke D, Panteghini M. Total laboratory automation: Do stat tests still matter? Clin Biochem. 2017;50:605-611.
11. Lou AH, Elnenaei MO, Sadek I, Thompson S, Crocker BD, Nassar B. Evaluation of the impact of a total auto-mation system in a large core laboratory on turnaround time. Clin Biochem. 2016;49(16-17):1254-1258
12. Ellison TL, Alharbi M, Alkaf M, Elimam S, Alfaries M, Nounou RA, Nasr R, Owaidah T. Implementation of total laboratory automation at a tertiary care hospital in Saudi Arabia: effect on turnaround time and cost efficiency. Ann Saudi Med. 2018;38(5):352-357.
13. Wu AH, Apple FS, Gibler WB, Jesse RL, Warshaw MM, Valdes R. National Academy of Clinical Biochemistry Stan-dards of Laboratory Practice: recommendations for the use of cardiac markers in coronary artery diseases. Clin Chem. 1999;45(7):1104-21.
14. Nichols JH, Christenson RH, Clarke W, Gronowski A, Hammett-Stabler CA, Jacobs E, et al. Executive sum-mary. The National Academy of Clinical Biochemistry Laboratory Medicine Practice Guideline: evidence-based practice for point-of-care testing. Clin Chim Acta. 2007;379(1-2):14-28.
15. Hawkins RC. Laboratory turnaround time. Clin Bio-chem Rev. 2007;28(4):179-94.
16. Scherrenburg J, van de Wijngaart DJ, Janssens PM. Reducing the number of clinical stat phlebotomy orders: feasible or not? Clin Chem Lab Med. 2012;50(12):2141-8.
17. Lippi G, Simundic AM, Plebani M. Phlebotomy, stat testing and laboratory organization: an intriguing relation-ship. Clin Chem Lab Med. 2012;50(12):2065-8.
eJIFCC2019Vol30No1pp067-081Page 67
This is a Platinum Open Access Journal distributed under the terms of the Creative Commons Attribution Non-Commercial License which permits unrestricted non-commercial use, distribution, and reproduction in any medium, provided the original work is properly cited.
Diamond Blackfan Anemia: genetics, pathogenesis, diagnosis and treatmentGetabalew Engidaye1, 2, Mulugeta Melku2, Bamlaku Enawgaw2
1 Amhara Regional State Debre Berhan Health Science College, Debre Berhan, Ethiopia2 Department of Hematology & Immunohematology, School of Biomedical and Laboratory Sciences, College of Medicine and Health Sciences, University of Gondar, Ethiopia
A R T I C L E I N F O A B S T R A C T
Diamond Blackfan Anaemia (DBA) is a sporadic inher-ited anemia with broad spectrum of anomalies that are presented soon after delivery. It is inherited mainly in autosomal dominant inheritance manner and caused by mutations and deletions in either large or small ribosomal protein genes that results in an imbalance between the biosynthesis of rRNA and ribosomal pro-teins, eventually the activation and stabilization of p53. Diagnosing DBA is usually problematic due to a partial phenotype and its wide inconsistency in its clinical ex-pression; however, molecular studies have identified a heterozygous mutated gene in up to 50% of the DBA cas-es and corticosteroid drugs are the backbone treatment options of DBA. Anomalies in bone marrow function in DBA cases are broadly associated with both congenital and acquired bone marrow failure syndromes in hu-man. In this review different literatures were searched in Medline (eg. PubMed, PMC, Hinari, Google schol-ar), OMIM, EMBASE by using search engines (Google, Yahoo, Baidu Ask.com) and searching was performed by using search key words (DBA, ribosomopathies, Bone Marrow Failure Syndromes, pure red cell aplasia). Only human studies were included. This review is summariz-ing the current understandings of DBA.
Corresponding author:Bamlaku EnawgawDepartment of Hematology & ImmunohematologySchool of Biomedical and Laboratory SciencesCollege of Medicine and Health SciencesUniversity of GondarEthiopiaE-mail: [email protected]
Key words:Diamond Blackfan Anemia, ribosomopathies, pure red cell aplasia, ribosomal proteins, bone marrow failure syndromes
eJIFCC2019Vol30No1pp067-081Page 68
Getabalew Engidaye, Mulugeta Melku, Bamlaku EnawgawDiamond Blackfan Anemia: genetics, pathogenesis, diagnosis and treatment
INTRODUCTION
Diamond Blackfan Anemia (DBA) is a sporadic heterogeneous genetic disorder characterized by red blood cell aplasia in association with skeletal anomalies and short stature that classically ap-pear soon after birth (1-4). Although the promi-nent feature of DBA is anemia (5), clinically it is a broader disorder and is manifested by growth retardation and congenital malformations of the head, heart, neck, upper limbs, and urinary sys-tem, which are present in approximately 30% to 50% of the DBA patients (6-9).
As shown by many studies, the incidence of DBA was estimated to be 1-4 cases per 500,000 live births in a year and it seems to be constant over time. No seasonal disparity has been observed as a function of the date of conception. The ten-dency of the disorder across the ethnicity of the people and in both genders, is almost compa-rable (10,11).
Chronic macrocytic-normochromic anemia, low reticulocyte count, and decreased or totally ab-sent erythroid precursors characterized by fail-ure of erythropoiesis with normal production of leukocytes and platelets in the bone marrow, are the main hematological features of DBA (2,3,12). Furthermore, a majority of the patients have laboratory findings of increased mean corpuscular volume (MCV), elevated erythro-cyte adenosine deaminase activity (eADA) and persistently elevated fetal hemoglobin (Hgb F). However, these laboratory findings may not be observed in some DBA cases; and even in the same families, signs and symptoms may vary among affected family siblings (13,14).
After a succession of studies, by now DBA has been shown to be associated with both ribo-somal and non-ribosomal mutations in genes located on more than 11 chromosomes which are responsible for encoding the ribosomal pro-teins (RP) (12,15).
Molecular mechanisms underlying the causal consequence between RP haploinsufficiency and anemia have not yet been clearly eluci-dated. A generally documented pathogenetic hypothesis implies that a defective ribosome biosynthesis leads to apoptosis in erythroid progenitors which in turn is leading to erythroid failure. This mechanism has been named ‘‘ribo-somal stress’’, and there are indications that it may be signaled through p53. All genes iden-tified to be mutated in DBA encode ribosomal proteins which are involved in either the small (RPS) or large (RPL) subunits of these proteins and the scarcity of these proteins can cause the development of the disease (16). The disorders of ribosome synthesis or associated genes that lead to disrupted ribosomal biosynthesis (ribo-somopathy) are more than one independent ribosomal protein mutation i.e., all patients of DBA may not show the same RP mutations (6). Corticosteroids, transfusion therapy and stem cell transplantation are the current options for the treatment of DBA (17,18).
The main aim of this narrative review is to pro-vide the reader with a comprehensive knowl-edge on DBA genetics, pathogenesis, diagno-sis and treatment. Different literatures were searched in Medline (e.g., PubMed, PMC, Hinari, Google scholar), OMIM, EMBASE by us-ing search engines (Google, Yahoo, Baidu Ask.com) and searching was performed by using search key words (Diamond Blackfan Anemia, Ribosomopathies, Pure red cell aplasia, Ribo-somal proteins, Bone marrow failure syndromes). Only human studies were included.
MOLECULAR PATHOPHYSIOLOGY OF DIAMOND BLACKFAN ANEMIA
Impaired ribosomal biogenesis in DBA
Recently, DBA is a well-recognized inherited bone marrow failure syndrome, frequently caused by alterations in ribosomal protein (RP)
eJIFCC2019Vol30No1pp067-081Page 69
Getabalew Engidaye, Mulugeta Melku, Bamlaku EnawgawDiamond Blackfan Anemia: genetics, pathogenesis, diagnosis and treatment
genes. Otherwise it rarely results from the mu-tation of the hematopoietic transcription factor gene, GATA1. After the preliminary descriptions of heterozygous RPS19 mutations in a subset of DBA cases, a substantial progress has been made over the past decades for improved expla-nation of the genetic causes of DBA (13). With a growing emphasis on the RP genes, the search for DBA-related genes, which was initially based on classic genetics techniques including cloning of cytogenetic abnormalities and extended link-age analysis, has shifted to target resequencing of the known RP genes (19-21).
These advanced studies have recognized both large and small subunits of RP gene anomalies which currently includes but is not limited to RPL5, RPL11, RPL35A, RPS7, RPS10, RPS17, RPS19, RPS24, and RPS26 as a mutated gene in multiple families of DBA patients (8,22,23). Changes in larger number of RPs have also been identified in isolated patients or families, includ-ing RPL3, RPL7, RPL9, RPL14, RPL19, RPL23A, RPL26, RPL35, RPL36, RPS8, RPS15, RPS27A, RPL18 and RPL35 (24-26).
Mutations in RP genes have been confirmed to be the direct cause of faulty erythropoiesis and consequently anemia, and are found in more than half of DBA cases (27). The RPS19 gene was the formerly known mutated small ribosomal protein and is still the most frequently mutat-ed gene in DBA patients which accounts about 25% of total DBA patients (13). More than 50% of RPS19 mutations are either deletions of one RPS19 allele, or insertional, frame shift, splice site, or nonsense mutations, which lead to an untimely termination of RPS19 protein synthe-sis. This results in a deficiency of RPS19 protein which is termed as ‘‘haploinsufficiency’’ in hu-man cells (28,29). Again, greater than half of the missense mutations termed as ‘‘class I’’ which cause the RPS19 protein to be folded improper-ly and rapidly aimed at premature degradation
of ribosomal proteins consequently leading to RPS19 haploinsufficiency (30).
RPS19 protein plays an important role in 18S rRNA maturation and 40S synthesis in human cells (29,31,32). Mutations associated with RPS19 can disrupt the pre-rRNA processing of the 18S rRNA and pre-40S subunits, leading to reduced production of 40S ribosomal subunits. Finally, the decreased expression of RPS19 is able to imitate many aspects of the DBA phe-notype (21,35). As a result, this knockdown of RPS19 by RNA interference can cause a severe defect that alters the normal primary human hematopoietic progenitor differentiation and proliferation of the erythroid progenitor (EP) cells (33). Furthermore, the defective erythro-poiesis in DBA caused by RPS19 deficiency can be rescued by ectopic overexpression of exog-enous RPS19. All of these strongly support the notion that RPS19 haploinsufficiency resulted from RPS19 modifications could be the central pathogenic mechanism in the underlying DBA pathology suggesting the feasibility of RPS19 gene augmentation to treat DBA cases (31).
Thus, RPS19-lacking cells suffer from a relatively shortage of 40S rRNA and has a reduced ability for translation initiation. RPS19 deficiency can lead to increased apoptosis in hematopoietic cell lines and bone marrow cells. Suppression of RPS19 prevents cell proliferation and early erythroid differentiation, but not late erythroid maturation in RPS19-deficient DBA cell lines. Haploinsufficiency of RPS19 has been shown in a subset of patients and appears to be sufficient to cause DBA (20,22).
Advanced studies showed that the RPS19Dsk3 mouse recapped the human DBA phenotype in-sofar as a hypoproliferative, pro-apoptotic anemia with growth hindrance. Given existing data, it is now generally believed that DBA resulted from an intrinsic cellular flaw in which erythroid progeni-tors and precursors are greatly sensitive to demise
eJIFCC2019Vol30No1pp067-081Page 70
Getabalew Engidaye, Mulugeta Melku, Bamlaku EnawgawDiamond Blackfan Anemia: genetics, pathogenesis, diagnosis and treatment
by apoptosis (36,37). The phenotypes observed in zebrafish and mouse DBA models DBA can be partly or entirely rescued by alterations in p53, ro-bustly proposed that p53 stabilization and activa-tion plays a noteworthy role in the pro-apoptotic phenotype of cells with RP haploinsufficiency (38).
DBA have led to the formulation of “ribosomal stress” hypothesis in which reduced RP synthe-sis activates p53 that induces the downstream events and leads to cell cycle termination or apoptosis. Finally, this phenomenon results in the DBA phenotype of anemia, deprived growth and results in congenital abnormalities (16).
There are numerous potential mechanisms by which a faulty ribosome assembly or nucleo-lar stress might signal to p53 stimulation. One interesting mechanism in the pathophysiology of DBA is the interaction of ribosomal proteins with Murine Double Minute (MDM2) which is a powerful controller of p53 level and its activity. MDM2 is a ring finger ubiquitin ligase that inter-acts with and enhances the degradation of p53. In this interaction, the large proteins of the 60S subunit namely RPL5, RPL11, and RPL23 have been presented to bind to MDM2 and reduces the activities of MDM2 which in turn results in p53 stabilization (39).
The heterozygous DBA mutations result in loss of function in a single copy of ribosomal protein gene. Thus, the pathophysiology of DBA is now attributed to ribosomal malfunction and these mutations in ribosomal genes have been identi-fied in approximately 50% of DBA patients (40). The large number of ribosomal proteins mutat-ed in DBA fail to cluster in any specific region of the ribosome. Haploinsufficiency or reduced expression of a ribosomal protein results in de-creased levels of the cognate 40S or 60S subunit and a defect in processing of the ribosomal RNA precursors (33,41,42).
Although DBA is considered as a ribosomopathy, it can be also caused by non-RP gene mutations.
GATA1 encodes a transcription factor which is essential for erythroid differentiation and there-fore it is not surprising to state that this gene is involved in DBA pathogenesis (43). The mutation in the GATA1 gene is a Guanine-Cytosine (G→C) transversion at location 48,649,736 on the X chromosome. By applying whole-exome se-quencing, aberration in the zinc-finger transcrip-tion factor gene “GATA1”, has been identified to be one of the possible causative agents for the development of DBA. This G→C transversion is associated with X-linked form of DBA, leading to the substitution of leucine to valine at amino acid 74 of GATA1. This aberration affects GATA1 splic-ing processes and leads to termination of the full-length GATA1 protein level and synthesis of a short isoform what we call GATA1 short (GATA1s) (11). While comparing the two isoforms, there is no exon 2 in GATA1s consequently the absence of a transactivation domain. Full-length GATA1 has a crucial role in humans for the differentia-tion of erythroid cells. During erythroid differen-tiation, full-length GATA1 enhances the synthesis of erythroid genes by silencing megakaryocytic or other hematopoietic lineage-specific genes. This up and down regulation of GATA1 is vital during the megakaryocyte erythroid progenitor (MEP) commitment program to megakaryocytic and erythroid differentiation (44,45).
While the specific role of GATA1s in DBA patho-physiology remains unclear, studies suggest that full-length GATA1 protein level could be an impor-tant driver of DBA pathophysiology. Researchers used short ribonucleic acids (shRNA) against several RPs in normal CD34+ cells to induce RP deficiency to confirm the role of GATA1 in DBA patients.
Thereafter they observed a reduction of full-length GATA1 protein level and erythroid mat-uration defects. On the other hand, increasing the GATA1 protein level could partly rescue de-fects in DBA associated RP haploinsufficiency (46,47).
eJIFCC2019Vol30No1pp067-081Page 71
Getabalew Engidaye, Mulugeta Melku, Bamlaku EnawgawDiamond Blackfan Anemia: genetics, pathogenesis, diagnosis and treatment
Mechanisms of erythroid failure due to ribosomal protein deficiency
DBA typically presents with erythrocyte aplasia in the first one year of life and both quantitative and qualitative defects of erythroid progeni-tors contribute to the abnormal erythropoiesis. Majority of the genes responsible for the de-velopment of DBA are ribosomal proteins sug-gesting that insufficiency in ribosomal function may be the underlying cause of red cell apla-sia in DBA cases. Ribosomal haploinsufficiency leads to disrupted ribosome biosynthesis and a consequent cytoplasmic buildup of numer-ous free RPs which results in the stabilization and activation of p53 (38,48-50). In ribosomal stress conditions, several cytoplasmic free RPs such as RPL11, RPl5, RPL23, RPS7, and RPS27 will bind to Murine double minute (MDM2) and hinders its interaction with p53, leading to the stabilization of p53 (51-53). This pathway has been shown to be upstream of apoptosis and cell-cycle arrest, eventually which leads to DBA erythroid hypoplasia (54,55).
Homozygous inactivation of p53 in RPS19 mu-tant mice totally corrected the DBA erythroid hypoplasia, further corroborating the MDM2/p53- mediated DBA pathogenesis caused by RPS19 mutations and cytoplasmic free RPL26 could influence the translation of p53 mRNA (30,56). However, it is believable that perma-nent overexpression of RPS19, by gene transfer may result in a persistent activation of MDM2 and/or inhibition of p53 (55).
Moreover, when global translation was blocked by inhibition of the translation initiation fac-tor Eukaryotic Transcription Initiation factor 4- Erythroid (eIF4E), the investigators observed a down regulation of full-length GATA1 while the other proteins persisted unaffected. These observations suggest that ribosome biosynthe-sis faults could impact translation of specific proteins, as GATA1. Thus, in addition to the
cytoplasmic free RPs, full length GATA1 level re-duction may participate in the stabilization of p53 and, consequently, the DBA erythroid cell phenotype (47).
Although the mechanism by which mutations in the RP genes caused explicit defects in erythroid cell maturation is not copiously understood, several lines of evidences indicate that p53 ac-tivation induced by ribosomal malfunction may be fundamental for the pathogenesis of DBA (56). Disruption of 40S biosynthesis provoke the release of RPL11 and other RPs into the nucleo-plasm results in the binding with MDM2. This phenomenon can compromise MDM2 activity; thereafter the consequent accumulation of p53. The exhibition of phenotypes such as growth re-tardation, macrocytic anemia with reticulocyto-penia and increased apoptosis in bone marrow progenitors by RPS19 mutant mice suggested the presence of a direct link between DBA phe-notypes and accumulation of p53 (51).
The pathophysiology for erythroid defect in DBA might therefore be because of the failure of a particular protein to achieve a threshold level at a critical stage; for example, by disturbing the stoichiometry of multi-protein erythroid-specif-ic complexes or by a more selective influence on the translation of a vital protein. A global re-duction in translation could also be significant for the pathophysiology of DBA (57).
In conclusion, defective erythropoiesis in DBA is mostly the consequence of either ribosome biogenesis defects due to mutations in ribo-somal protein (RP) genes or as consequence of mutation in the GATA1 gene, leading to a reduction of full-length GATA1 and synthesis of a short isoform, GATA1s. In normal conditions, p53 is degraded because of its interaction with MDM2. In DBA, the ribosome biogenesis defect induces a release of several free RPs in the cyto-plasm, which can inhibit p53 degradation. p53 degradation is also inhibited by the reduction
eJIFCC2019Vol30No1pp067-081Page 72
Getabalew Engidaye, Mulugeta Melku, Bamlaku EnawgawDiamond Blackfan Anemia: genetics, pathogenesis, diagnosis and treatment
in full-length GATA1 synthesis (15). Treatment includes gene therapy strategies such as gene addition (to increase copy numbers of the wild-type form of the mutated proteins), gene silenc-ing (leading to the degradation of the mutated mRNA) and genome editing (such as zinc-finger nucleases, transcription-activator like effector nucleases, or clustered, regulator).
GENETICS AND INHERITANCE OF DIAMOND-BLACKFAN ANEMIA
Inheritance
According to the report of recent studies, ap-proximately 40 – 45% of DBA cases are heredi-tary which are inherited with autosomal domi-nant inheritance which mean that a single copy of altered gene in each cell is adequate to cause the disorder (58) whereas the remaining 55 – 60% of the DBA patients are sporadic, i.e., re-sulted from new aberrations in the gene which occur in people who have no history of this dis-order in their family (12).
Even though autosomal dominant inheritance is the frequently observed pattern of inheritance, autosomal recessive inheritance, which is de-fined as the presence of DBA siblings from un-affected consanguineous parents, with a lesser frequency has been reported. DBA classically presents at 2 - 3 months of age; only 25% of affected offsprings are anemic at birth and hy-drops is occasional (59,60).
Genetics
As shown in the pathophysiology of DBA, it mainly arises from an abnormal ribosomal pro-tein gene with the exception of the rare form resulting from mutation of transcriptional fac-tor GATA1 (6,13,22,24,25,28,61-63). The genes encoding ribosomal proteins belonging to both the large and small ribosomal subunits are found to be mutated in DBA (7,11). This dis-order is described by genetic heterogeneity,
disturbing different ribosomal gene loci. More than a decade of heterozygous mutations re-sulting in haploinsufficiency have been identi-fied for the genes that encode ribosomal pro-teins (40) (Table 1).
Mutations in ribosomal genes account for 60 – 70% of DBA patients. Among these ribosomal gene mutations, about 20% of the cases involve large deletions that require analysis of copy number variation for detection. On the other hand, overall it is estimated that around 35% of the DBA cases remain yet genetically indeter-minate. These ribosomal gene aberrations may be inherited in an autosomal dominant pattern or may arise spontaneously-linked mutations in the transcription factor GATA1 (11).
GENOTYPE AND PHENOTYPE CORRELATION
In general, the phenotypic spectrum of DBA em-braces a wider domain of severity, even within the same families, it ranges from the classical syndrome to individuals with a solitary increase in eADA. No correlation has yet been found between the identity of the DBA gene and he-matological severity, including response to ste-roids. However, craniofacial abnormalities are more linked to mutations affecting either RPL5 or RPL11 (22,29).
Clinical figures from European and American DBA cases disclosed that the incidence of malformations in DBA patients having RPS19 mutations is 31% and this is not significantly different from that of the entire DBA popu-lation (29,64,65). RPS19 mutations are found in some first-degree families presenting only with isolated high eADA and/or macrocytosis. However, large deletions at the 19q13 locus and unbalanced translocation t (X; 19) are al-ways linked to mental retardation, which points to a contiguous gene syndrome. Conversely, the patient with balanced translocation t(X;19)
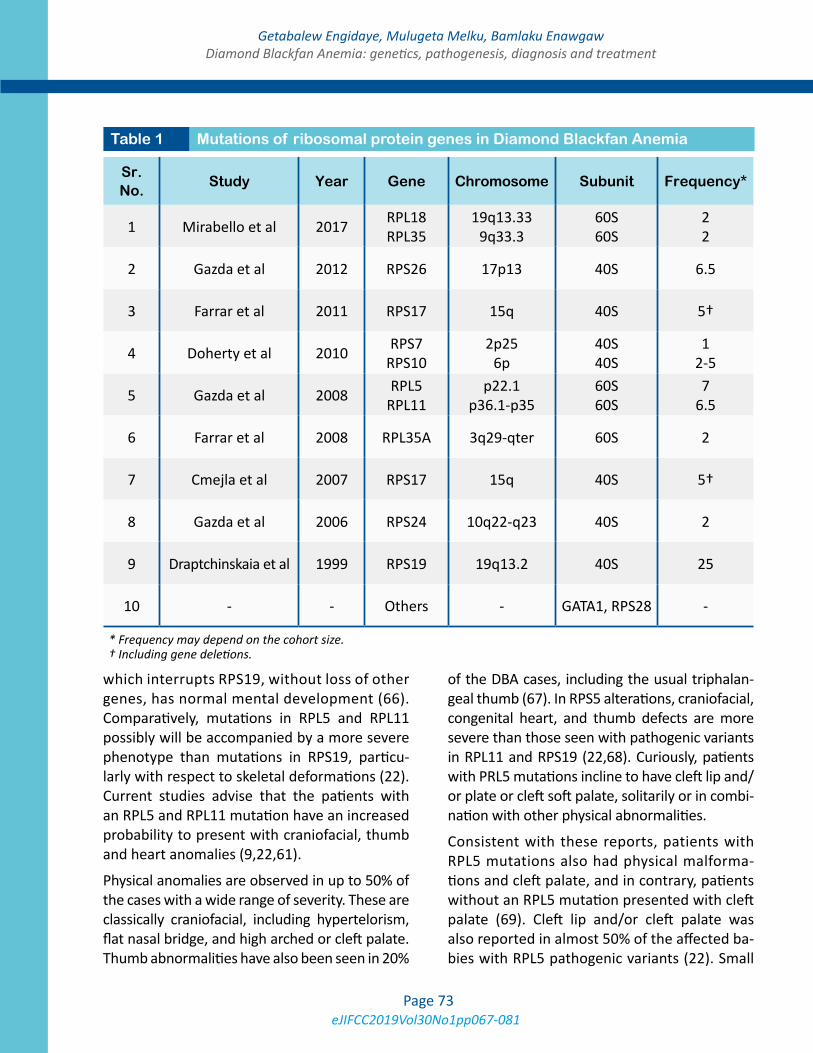
eJIFCC2019Vol30No1pp067-081Page 73
Getabalew Engidaye, Mulugeta Melku, Bamlaku EnawgawDiamond Blackfan Anemia: genetics, pathogenesis, diagnosis and treatment
which interrupts RPS19, without loss of other genes, has normal mental development (66). Comparatively, mutations in RPL5 and RPL11 possibly will be accompanied by a more severe phenotype than mutations in RPS19, particu-larly with respect to skeletal deformations (22). Current studies advise that the patients with an RPL5 and RPL11 mutation have an increased probability to present with craniofacial, thumb and heart anomalies (9,22,61).
Physical anomalies are observed in up to 50% of the cases with a wide range of severity. These are classically craniofacial, including hypertelorism, flat nasal bridge, and high arched or cleft palate. Thumb abnormalities have also been seen in 20%
of the DBA cases, including the usual triphalan-geal thumb (67). In RPS5 alterations, craniofacial, congenital heart, and thumb defects are more severe than those seen with pathogenic variants in RPL11 and RPS19 (22,68). Curiously, patients with PRL5 mutations incline to have cleft lip and/or plate or cleft soft palate, solitarily or in combi-nation with other physical abnormalities.
Consistent with these reports, patients with RPL5 mutations also had physical malforma-tions and cleft palate, and in contrary, patients without an RPL5 mutation presented with cleft palate (69). Cleft lip and/or cleft palate was also reported in almost 50% of the affected ba-bies with RPL5 pathogenic variants (22). Small
Sr. No.
Study Year Gene Chromosome Subunit Frequency*
1 Mirabello et al 2017 RPL18 RPL35
19q13.33 9q33.3
60S 60S
2 2
2 Gazda et al 2012 RPS26 17p13 40S 6.5
3 Farrar et al 2011 RPS17 15q 40S 5†
4 Doherty et al 2010 RPS7 RPS10
2p25 6p
40S 40S
1 2-5
5 Gazda et al 2008 RPL5 RPL11
p22.1 p36.1-p35
60S 60S
7 6.5
6 Farrar et al 2008 RPL35A 3q29-qter 60S 2
7 Cmejla et al 2007 RPS17 15q 40S 5†
8 Gazda et al 2006 RPS24 10q22-q23 40S 2
9 Draptchinskaia et al 1999 RPS19 19q13.2 40S 25
10 - - Others - GATA1, RPS28 -
Table 1 Mutations of ribosomal protein genes in Diamond Blackfan Anemia
* Frequency may depend on the cohort size. † Including gene deletions.
eJIFCC2019Vol30No1pp067-081Page 74
Getabalew Engidaye, Mulugeta Melku, Bamlaku EnawgawDiamond Blackfan Anemia: genetics, pathogenesis, diagnosis and treatment
gestational age was reported in individuals with an RPL5 and RPS19 pathogenic variant as well, which is higher in individuals with RPS5 patho-genic variant (68). Pathogenic variants in RPL11 are largely associated with thumb abnormalities (22); individuals with RPL11 pathogenic variants have been also identified with cleft lip or palate (CL/P) (68).
Individuals with mutated variants of RPS10, RPS19, RPS26 have not yet shown any genotype-phenotype correlations (24). Till now, no gen-otype-phenotype correlations have been also identified in persons with RPS29 pathogenic vari-ants. DBA with mandibulofacial dystostosis were identified in mutants of RPS28 and TSR2 whereas persons with the variants of RPL27, RPL31 and RPL27 have no identified genotype-phenotype correlations (70).
CLINICAL PRESENTATIONS AND DIAGNOSIS
Clinical presentations
Hematologic features
DBA babies typically present with an eryth-rocyte aplasia in the first twelve months of life, with the median age of exhibition of two months but occasionally its presentation may be delayed up to adulthood. By definition, all DBA patients are anemic (71), and it is present at birth in only 15% of patients and fetal hy-drops has occasionally been reported, suggest-ing that erythropoiesis is spared in utero per-haps this is due to transiently being rescued by maternal or placental factors with a post-natal switch from effective to ineffective erythropoi-esis (17,60,72).
Red blood cells are usually macrocytic; re-ticulocyte counts are reduced or zero but the other hematological lineages are not involved as a rule with the exception of slightly an ab-normal lower leukocyte and increased platelet
counts reported at diagnosis. Bone marrow aspirates indicate isolated erythroblastopenia, (usually <5% of nucleated cells on bone mar-row smears) in more than 90 percent of the pa-tients. Another unusual bone marrow pattern is erythroid hyperplasia with maturation deten-tion; apparently normal numbers and matura-tion of erythroblasts have been exceptionally described (17,73).
Bone marrow analysis also demonstrated nor-mal cellularity and morphology except for the erythroid line in all patients (74). Erythroid en-tire aplasia and hypoplasia have been found in DBA cases presented with erythroid maturation arrest with an elevated number of juvenile pre-cursors and indicated dyserythropoietic mor-phology (71,74,75).
The colony assessment for BFU-E confirmed to-tally absent/reduced growth in 83% of patients. Addition of stem cell factor (SCF) induced a no-ticeable increment of erythroid colonies in all the tested subjects. The activity of eADA which is a crucial enzyme in the purine salvage path-way, is usually high in DBA patients (71,74,76). A moderately increased risk of developing he-matological malignancies also exists and initial clinical manifestations such as pallor, shortness of breath while suckling, failure to thrive and systolic murmur are observed during infancy (16). The risk of developing solid tumors, my-elodysplastic syndrome, or leukemia is elevated in DBA patients (77).
Physical abnormalities
More than a third of the disordered persons present with a variety of associated congenital physical anomalies. Especially, thumb and up-per limb malformations as well as craniofacial anomalies including short stature are common. A cute snub nose and wide spaced eyes, and oth-er craniofacial anomalies are also seen. Other defects frequently observed include urogenital
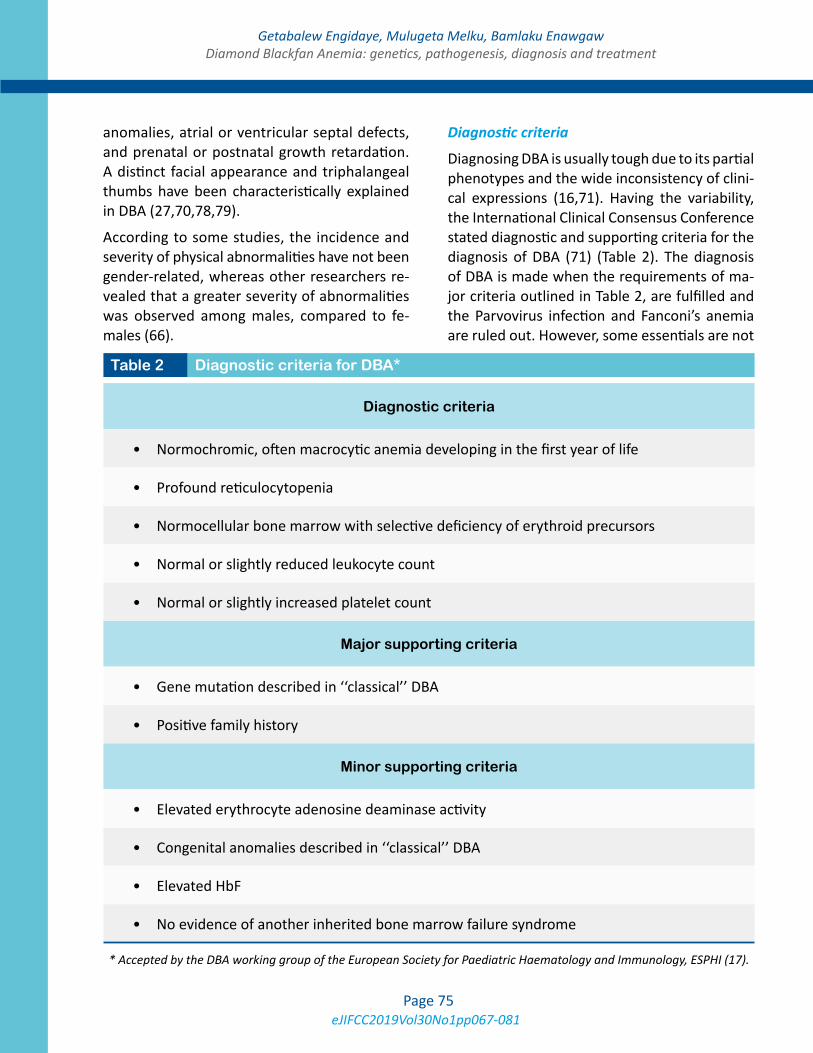
eJIFCC2019Vol30No1pp067-081Page 75
Getabalew Engidaye, Mulugeta Melku, Bamlaku EnawgawDiamond Blackfan Anemia: genetics, pathogenesis, diagnosis and treatment
anomalies, atrial or ventricular septal defects, and prenatal or postnatal growth retardation. A distinct facial appearance and triphalangeal thumbs have been characteristically explained in DBA (27,70,78,79).
According to some studies, the incidence and severity of physical abnormalities have not been gender-related, whereas other researchers re-vealed that a greater severity of abnormalities was observed among males, compared to fe-males (66).
Diagnostic criteria
Diagnosing DBA is usually tough due to its partial phenotypes and the wide inconsistency of clini-cal expressions (16,71). Having the variability, the International Clinical Consensus Conference stated diagnostic and supporting criteria for the diagnosis of DBA (71) (Table 2). The diagnosis of DBA is made when the requirements of ma-jor criteria outlined in Table 2, are fulfilled and the Parvovirus infection and Fanconi’s anemia are ruled out. However, some essentials are not
Table 2 Diagnostic criteria for DBA*
Diagnostic criteria
• Normochromic, often macrocytic anemia developing in the first year of life
• Profound reticulocytopenia
• Normocellular bone marrow with selective deficiency of erythroid precursors
• Normal or slightly reduced leukocyte count
• Normal or slightly increased platelet count
Major supporting criteria
• Gene mutation described in ‘‘classical’’ DBA
• Positive family history
Minor supporting criteria
• Elevated erythrocyte adenosine deaminase activity
• Congenital anomalies described in ‘‘classical’’ DBA
• Elevated HbF
• No evidence of another inherited bone marrow failure syndrome
* Accepted by the DBA working group of the European Society for Paediatric Haematology and Immunology, ESPHI (17).
eJIFCC2019Vol30No1pp067-081Page 76
Getabalew Engidaye, Mulugeta Melku, Bamlaku EnawgawDiamond Blackfan Anemia: genetics, pathogenesis, diagnosis and treatment
included in these criteria such as the presence of typical malformations, the response to ste-roids and the chronic course of the anemia can also help to diagnose DBA (73).
Onset after the age of two years or the absence of isolated bone marrow erythroblastopenia in-duce a big caution in the diagnosis of DBA. The only identification of pathogenic mutants in one of the DBA genes conclusively establishes a di-agnosis of DBA (61,80). Furthermore, molecular diagnosis enables the detection of carriers, and the exclusion of hematopoietic stem cell trans-plantation from sibling donors living with the mutations. However, determining the effects of missense mutations may be difficult, whereas nonsense and frameshift mutations will prob-ably be pathogenic in the majority of cases (73). The bone marrow is classically normocellular, with a scarcity of erythroid precursors. The ery-throid burst-forming units (BFU-E) and erythroid colony-forming units (CFU-E) in vitro are severe-ly reduced, with relative sparing of the granulo-cyte-monocyte colony-forming units (CFU-GM) (81). The erythrocyte adenosine deaminase ac-tivity (eADA) levels are often elevated (74).
DBA may be misdiagnosed with transient eryth-roblastopenia of childhood (TEC). Therefore, to avoid misdiagnosing of DBA, TEC must be ruled out. TEC is a common disorder of children age greater than one year. It is an acquired, short-lived failure of red cell production usually of a month or so in duration. TEC, most likely a post infectious, transient autoimmune IgG-mediated disorder, typically occurs in children probably as the result of infections acquired through contact (82). As in DBA, children with TEC often present with profound anemia as a result of pure red cell aplasia. On the other hand, DBA is a dominantly inherited disorder observed in children younger than one year. It is characterized by presence of congenital anomalies; elevated MCV, fetal Hgb and erythrocyte adenosine deaminase activity (75,76,83,84).
TREATMENT AND PROGNOSIS OF DBA
Heterogeneity of DBA is also shown in response to treatment and in the follow-up of DBA cases. In 2008, a group of veteran clinicians established a consensus for the diagnosis and treatment of DBA. This document represents a gold standard for therapeutic decisions. There are no obvious phenotypic or genotypic differences between remission and non-remission patients (71,83).
Although corticosteroid therapy is endeavored with varying regimens for almost all DBA cases, treating the patients with RBC transfusion may be used primarily in the first year of life to re-duce corticosteroid associated side effects and adverse effects in neonates which may include noteworthy growth disturbances. Even so there is currently no way to select the patients who will respond or not to the treatment, around 80% of the patients initially respond to steroids but those DBA patients who initially responded to this therapy suffered from many side effects. Some DBA cases remained responsive to ste-roids, while efficacy vanished in others taking the treatment (18,71,83). The mode of action of corticosteroids in DBA is particularly obscure. Apoptosis at the progenitor level seems to be the cause of the anemia and corticosteroids seem to have a non-specific anti-apoptotic ef-fect in erythroid progenitors particularly at the colony forming unit-erythroid (CFU-E) proeryth-roblast interface (84).
Patients who are not responsive to steroids or are unable to tolerate the treatment may require chronic RBC transfusion therapy. This therapy is given to most patients every 35 weeks with a goal of sustaining the Hb level greater than 8 g/dL. Based on the child’s growth and function, Hb values may need to be higher for some pa-tients. Since the transfusion therapy of RBC is chronic, iron overload becomes challenging, so careful monitoring of serum ferritin levels and other parameters indicative of iron overload is
eJIFCC2019Vol30No1pp067-081Page 77
Getabalew Engidaye, Mulugeta Melku, Bamlaku EnawgawDiamond Blackfan Anemia: genetics, pathogenesis, diagnosis and treatment
mandatory (71). Pediatric hematologists with expertise in the treatment of DBA will frequent-ly commence iron chelation with intravenous or oral agents after 15 units of red cell transfu-sions. Intravenous chelation is frequently need-ed for the establishment of nonmetallic ports that are magnetic resonance imaging compat-ible (84,85).
Performing allogeneic Hematopoietic Stem Cell Transplantation (HSCT) is another alternative to cure hematological aspects of DBA. This therapy is performed when DBA patients become unre-sponsive to repeated transfusions or to prevent iron overload and organ damage due to depen-dency of frequent transfusions. However, the adverse events due to HSCT may exceed from those adverse events due to iron overloading. In the future, gene therapy is presumed prom-ising for RPS19 deficient DBA patients. Other treatments, have been used in DBA over the last three decades. However, these drugs ap-pear to be largely ineffective and there is cur-rently no evidence that any of these has a major role in the management of DBA (71). The prog-nosis is generally good. However, complications of treatment and a higher incidence of cancer may reduce life expectancy. Disease severity depends on the quality and response to treat-ment. For patients undergoing regular transfu-sions, quality of life is clearly altered (85).
CONCLUSIONS
DBA is a clinically heterogeneous disorder ac-companied by hypoplastic anemia and also manifested by congenital malformations. Even if Ribosomal protein haploinsufficiency have been coined as a primary causative agent of DBA, non-ribosomal proteins such as GATA1 have been identified to have a vital role in the pathogenesis of DBA. The molecular mecha-nisms which are fundamental for the pathogen-esis of DBA are still not entirely understood. The
discovery of RPS19 as the foremost DBA gene led to an exciting scientific research in DBA and other ribosomal disorders. Even though there is convincing evidence for the involvement of p53 in the pathogenesis of DBA, no single pro-posed mechanism so far accounted for all facets of DBA and yet none is mutually exclusive. Even though a number of genes are responsible for DBA, mutations in RPS19 are the major causes of impairment of ribosomal protein biosynthe-sis which lead to nucleolar disorganization and activation of the p53 family. Many treatment options have been tried over the past several years with inconsistent success. Despite many treatments having been tried for the manage-ment of DBA, chronic red blood cell transfusion, corticosteroids and hematopoietic stem cell transplantation remained the cornerstones of therapy.
Abbreviations
CL/P: Cleft of Lip or Palate
DBA: Diamond Blackfan Anemia
eADA: elevated erythrocyte Adenosine Deaminase Activity
HDM: House Dust Mites
MDM: Murine Double Model
RP: Ribosomal Protein
RPL: Large Ribosomal Protein
RPS: Small Ribosomal Protein
TEC: Transient Erythroblastopenia of Childhood
Availability of data and materials
Data sharing not applicable to this article as no datasets were generated or analysed during the current study.
eJIFCC2019Vol30No1pp067-081Page 78
Getabalew Engidaye, Mulugeta Melku, Bamlaku EnawgawDiamond Blackfan Anemia: genetics, pathogenesis, diagnosis and treatment
Competing interest
The authors declare that they have no competing interests.
Authors’ contributions
MS & BE performed literature searching and drafted the manuscript. MM involved in drafting of the manuscript along with MS & BE. All au-thors read and approved the final manuscript.
REFERENCES
1. Diamond LK, Allen DM, Magill FB. Congenital (ery-throid) hypoplastic anemia: a 25-year study. Am J Dis Child. 1961;102(3):403-15.
2. Diamond LK, Blackfan K. Hypoplastic anemia. Am J Dis Child. 1938;56(464-467).
3. Sultana S, Ferdous S, Hossain N, Shah S, Kantidas M, Ferdous A. Diamond Blackfan anemia a rare anemia of infancy. Bangladesh J Child Health. 2007;31(1):40-2.
4. Turgeon ML. Clinical hematology: theory and proce-dures: Lippincott Williams & Wilkins; 2011.
5. Ito E, Konno Y, Toki T, Terui K. Molecular patho-genesis in Diamond–Blackfan anemia. Int J Hematol. 2010;92(3):413-8.
6. Gazda HT, Grabowska A, Merida-Long LB, Latawiec E, Schneider HE, Lipton JM, et al. Ribosomal protein S24 gene is mutated in Diamond-Blackfan anemia. Am J Hum Genet. 2006;79(6):1110-8.
7. Paolini NA, Attwood M, Sondalle SB, Vieira C, van Ad-richem AM, di Summa FM, et al. A Ribosomopathy Re-veals Decoding Defective Ribosomes Driving Human Dys-morphism. Am J Hum Genet. 2017;100(3):506-22.
8. Arbiv OA, Cuvelier G, Klaassen RJ, Fernandez CV, Rob-itaille N, Steele M, et al. Molecular analysis and genotype-phenotype correlation of Diamond-Blackfan anemia. Clin Genet. 2018;93(2):320-8.
9. Vlachos A, Osorio DS, Atsidaftos E, Kang J, Lababidi ML, Seiden HS, et al. Increased Prevalence of Congenital Heart Disease in Children With Diamond Blackfan Anemia Suggests Unrecognized Diamond Blackfan Anemia as a Cause of Congenital Heart Disease in the General Popula-tion: A Report of the Diamond Blackfan Anemia Registry. Circ Genom Precis Med. 2018;11(5):e002044.
10. Wang R, Yoshida K, Toki T, Sawada T, Uechi T, Okuno Y, et al. Loss of function mutations in RPL27 and RPS27 iden-tified by whole-exome sequencing in Diamond-Blackfan anaemia. Br J Haematol. 2015;168(6):854-64.
11. Sankaran VG, Ghazvinian R, Do R, Thiru P, Vergilio J-A, Beggs AH, et al. Exome sequencing identifies GATA1 mu-tations resulting in Diamond-Blackfan anemia. J Clin In-vest. 2012;122(7):2439-43.
12. Ball S. Diamond Blackfan anemia. ASH Education Pro-gram Book. 2011;2011(1):487-91.
13. Draptchinskaia N, Gustavsson P, Andersson B, Petters-son M, Dianzani I, Ball S, et al. The gene encoding ribo-somal protein S19 is mutated in Diamond-Blackfan anae-mia. Nat Genet. 1999;21(2):169-75.
14. Lipton JM. Diamond blackfan anemia: New paradigms for a “not so pure” inherited red cell aplasia. Semin He-matol. 2006;43(3):167-77.
15. Fujiwara T. GATA Transcription Factors: Basic Prin-ciples and Related Human Disorders. Tohoku J Exp Med. 2017;242(2):83-91.
16. Lipton JM, Ellis SR. Diamond-Blackfan anemia: diag-nosis, treatment and molecular pathogenesis. Hematol Oncol Clin North Am. 2009;23(2):261-82.
17. Vlachos A, Muir E. How I treat Diamond-Blackfan ane-mia. Blood. 2010;116(19):3715-23.
18. Sakamoto KM, Narla A. Perspective on Diamond-Blackfan anemia: lessons from a rare congenital bone marrow failure syndrome. Leukemia. 2018;32(2):249-51.
19. McGowan KA, Li JZ, Park CY, Beaudry V, Tabor HK, Sabnis AJ, et al. Ribosomal mutations cause p53-me-diated dark skin and pleiotropic effects. Nat Genet. 2008;40(8):963-70.
20. Miyake K, Utsugisawa T, Flygare J, Kiefer T, Hamagu-chi I, Richter J, et al. Ribosomal protein S19 deficiency leads to reduced proliferation and increased apoptosis but does not affect terminal erythroid differentiation in a cell line model of Diamond-Blackfan anemia. Stem Cells. 2008;26(2):323-9.
21. Narla A, Ebert BL. Ribosomopathies: human disorders of ribosome dysfunction. Blood. 2010;115(16):3196-205.
22. Gazda HT, Sheen MR, Vlachos A, Choesmel V, O’Donohue M-F, Schneider H, et al. Ribosomal protein L5 and L11 mutations are associated with cleft palate and abnormal thumbs in Diamond-Blackfan anemia patients. Am J Hum Genet. 2008;83(6):769-80.
23. Errichiello E, Vetro A, Mina T, Wischmeijer A, Ber-rino E, Carella M, et al. Whole exome sequencing in the differential diagnosis of Diamond-Blackfan anemia: Clinical and molecular study of three patients with novel
eJIFCC2019Vol30No1pp067-081Page 79
Getabalew Engidaye, Mulugeta Melku, Bamlaku EnawgawDiamond Blackfan Anemia: genetics, pathogenesis, diagnosis and treatment
RPL5 and mosaic RPS19 mutations. Blood Cells Mol Dis. 2017;64:38-44.
24. Doherty L, Sheen MR, Vlachos A, Choesmel V, O’Donohue M-F, Clinton C, et al. Ribosomal protein genes RPS10 and RPS26 are commonly mutated in Diamond-Blackfan anemia. Am J Hum Genet. 2010;86(2):222-8.
25. Gazda H, Landowski M, Buros C, Vlachos A, Sieff CA, Newburger PE, et al. Array comparative genomic hybrid-ization of ribosomal protein genes in Diamond-Blackfan anemia patients; evidence for three new DBA genes, RPS8, RPS14 and RPL15, with large deletion or duplica-tion. Blood. 2010;116(21):1007-.
26. Mirabello L, Khincha PP, Ellis SR, Giri N, Brodie S, Chandrasekharappa SC, et al. Novel and known ribosomal causes of Diamond-Blackfan anaemia identified through comprehensive genomic characterisation. J Med Genet. 2017;54(6):417-25.
27. Vlachos A, Dahl N, Dianzani I, Lipton JM. Clinical utility gene card for: Diamond-Blackfan anemia-update 2013. Eur J Hum Genet. 2013;21(10).
28. Farrar JE, Vlachos A, Atsidaftos E, Carlson-Dono-hoe H, Markello TC, Arceci RJ, et al. Ribosomal protein gene deletions in Diamond-Blackfan anemia. Blood. 2011;118(26):6943-51.
29. Campagnoli MF, Ramenghi U, Armiraglio M, Qua-rello P, Garelli E, Carando A, et al. RPS19 mutations in patients with Diamond-Blackfan anemia. Hum Mutat. 2008;29(7):911-20.
30. Angelini M, Cannata S, Mercaldo V, Gibello L, Santoro C, Dianzani I, et al. Missense mutations associated with Diamond–Blackfan anemia affect the assembly of ribo-somal protein S19 into the ribosome. Hum Mol Genet. 2007;16(14):1720-7.
31. Flygare J, Olsson K, Richter J, Karlsson S. Gene therapy of Diamond Blackfan anemia CD34+ cells leads to im-proved erythroid development and engraftment follow-ing transplantation. Exp Hematol. 2008;36(11):1428-35.
32. van Dooijeweert B, van Ommen CH, Smiers FJ, Tam-minga RYJ, Te Loo MW, Donker AE, et al. Pediatric Dia-mond-Blackfan anemia in the Netherlands: An overview of clinical characteristics and underlying molecular de-fects. Eur J Haematol. 2018;100(2):163-70.
33. Flygare J, Aspesi A, Bailey JC, Miyake K, Caffrey JM, Karlsson S, et al. Human RPS19, the gene mutated in Diamond-Blackfan anemia, encodes a ribosomal protein required for the maturation of 40S ribosomal subunits. Blood. 2007;109(3):980-6.
34. Gregory LA, Aguissa-Touré A-H, Pinaud N, Legrand P, Gleizes P-E, Fribourg S. Molecular basis of Diamond–Blackfan anemia: structure and function analysis of RPS19. Nucleic Acids Res. 2007;35(17):5913-21.
35. Sieff CA, Yang J, Merida-Long LB, Lodish HF. Pathogen-esis of the erythroid failure in Diamond Blackfan anae-mia. Br J Haematol. 2010;148(4):611-22.
36. Ohene-Abuakwa Y, Orfali KA, Marius C, SE. B. Two-phase culture in Diamond-Blackfan anemia: localization of erythroid defect. Blood. 2005;105(2):838-46.
37. Tsai PH, Arkin S, Lipton JM. An intrinsic progenitor defect in Diamond-Blackfan anaemia. . Br J Haematol. 1989;73(1):112-20.
38. Ellis SR. Nucleolar stress in Diamond Black-fan anemia pathophysiology. Biochim Biophys Acta. 2014;1842(6):765-8.
39. Jin A, Itahana K, O’Keefe K, Zhang Y. Inhibition of HDM2 and activation of p53 by ribosomal protein. Mol Cell Biol. 2004;24(17):7669-80.
40. Devlin EE, DaCosta L, Mohandas N, Elliott G, Bodine DM. A transgenic mouse model demonstrates a domi-nant negative effect of a point mutation in the RPS19 gene associated with Diamond-Blackfan anemia. Blood. 2010;116(15):2826-35.
41. Choesmel V, Bacqueville D, Rouquette J, Noaillac-Depeyre J, Fribourg S, Crétien A, et al. Impaired ribo-some biogenesis in Diamond-Blackfan anemia. Blood. 2007;109(3):1275-83.
42. Robledo S, Idol RA, Crimmins DL, Ladenson JH, Mason PJ, Bessler M. The role of human ribosomal proteins in the maturation of rRNA and ribosome production. RNA. 2008;14(9):1918-29.
43. Da Costa L, O’Donohue MF, van Dooijeweert B, Al-brecht K, Unal S, Ramenghi U, et al. Molecular approach-es to diagnose Diamond-Blackfan anemia: The EuroDBA experience. Eur J Med Genet. 2017.
44. Doré LC, Crispino JD. Transcription factor networks in erythroid cell and megakaryocyte development. Blood. 2011;118(2):231-9.
45. Bresnick EH, Lee H-Y, Fujiwara T, Johnson KD, Keles S. GATA switches as developmental drivers. J Biol Chem. 2010;285(41):31087-93.
46. Ribeil J-A, Zermati Y, Vandekerckhove J, Cathelin S, Kersual J, Dussiot M, et al. Hsp70 regulates erythropoi-esis by preventing caspase-3-mediated cleavage of GATA-1. Nature. 2007;445(7123):102-5.
47. Ludwig LS, Gazda HT, Eng JC, Eichhorn SW, Thiru P, Ghazvinian R, et al. Altered translation of GATA1 in Dia-mond-Blackfan anemia. Nat Med. 2014;20(7):748-53.
48. Danilova N, Gazda HT. Ribosomopathies: how a com-mon root can cause a tree of pathologies. Dis Model Mech. 2015;8(9):1013-26.
eJIFCC2019Vol30No1pp067-081Page 80
Getabalew Engidaye, Mulugeta Melku, Bamlaku EnawgawDiamond Blackfan Anemia: genetics, pathogenesis, diagnosis and treatment
49. James A, Wang Y, Raje H, Rosby R, DiMario P. Nucleolar stress with and without p53. Nucleus. 2014;5(5):402-26.
50. Golomb L, Volarevic S, Oren M. p53 and ribo-some biogenesis stress: the essentials. FEBS Lett. 2014;588(16):2571-9.
51. Fumagalli S, Di Cara A, Neb-Gulati A, Natt F, Schwem-berger S, Hall J, et al. Absence of nucleolar disruption after impairment of 40S ribosome biogenesis reveals an rpL11-translation-dependent mechanism of p53 induc-tion. Nat Cell Biol. 2009;11(4):501-8.
52. He X, Li Y, Dai M-S, Sun X-X. Ribosomal protein L4 is a novel regulator of the MDM2-p53 loop. Oncotarget. 2016;7(13):16217.
53. Xiong X, Zhao Y, He H, Sun Y. Ribosomal protein S27-like and S27 interplay with p53-MDM2 axis as a target, a sub-strate and a regulator. Oncogene. 2011;30(15):1798-811.
54. Zhou X, Liao J-M, Liao W-J, Lu H. Scission of the p53-MDM2 loop by ribosomal proteins. Genes cancer. 2012;3(3-4):298-310.
55. Dutt S, Narla A, Lin K, Mullally A, Abayasekara N, Meg-erdichian C, et al. Haploinsufficiency for ribosomal pro-tein genes causes selective activation of p53 in human erythroid progenitor cells. Blood. 2011;117(9):2567-76.
56. Dai M-S, Zeng SX, Jin Y, Sun X-X, David L, Lu H. Ri-bosomal protein L23 activates p53 by inhibiting MDM2 function in response to ribosomal perturbation but not to translation inhibition. Mol Cell Biol. 2004;24(17):7654-68.
57. Mauro VP, Edelman GM. The ribosome filter redux. Cell Cycle. 2007;6(18):2246-51.
58. Garçon L, Ge J, Manjunath SH, Mills JA, Apicella M, Parikh S, et al. Ribosomal and hematopoietic defects in induced pluripotent stem cells derived from Diamond Blackfan anemia patients. Blood. 2013;122(6):912-21.
59. Chae H, Park J, Lee S, Kim M, Kim Y, Lee JW, et al. Ri-bosomal protein mutations in Korean patients with Dia-mond-Blackfan anemia. Exp Mol Med. 2014;46:e88.
60. Sonoda M, Ishimura M, Ichimiya Y, Terashi E, Eguchi K, Sakai Y, et al. Atypical erythroblastosis in a patient with Diamond-Blackfan anemia who developed del(20q) my-elodysplasia. Int J Hematol. 2018;108(2):228-31.
61. Cmejla R, Cmejlova J, Handrkova H, Petrak J, Petrty-lova K, Mihal V, et al. Identification of mutations in the ribosomal protein L5 (RPL5) and ribosomal protein L11 (RPL11) genes in Czech patients with Diamond-Blackfan anemia. Hum Mutat. 2009;30(3):321-7.
62. Farrar JE, Nater M, Caywood E, McDevitt MA, Kow-alski J, Takemoto CM, et al. Abnormalities of the large ribosomal subunit protein, Rpl35a, in Diamond-Blackfan anemia. Blood. 2008;112(5):1582-92.
63. Gazda HT, Preti M, Sheen MR, O’Donohue MF, Vla-chos A, Davies SM, et al. Frameshift mutation in p53 regulator RPL26 is associated with multiple physical ab-normalities and a specific pre-ribosomal RNA process-ing defect in diamond–blackfan anemia. Hum Mutat. 2012;33(7):1037-44.
64. Willig T-N, Niemeyer CM, Leblanc T, Tiemann C, Rob-ert A, Budde J, et al. Identification of new prognosis fac-tors from the clinical and epidemiologic analysis of a reg-istry of 229 Diamond-Blackfan anemia patients. Pediatr Res. 1999;46(5):553-61.
65. Zhang JY, Jia M, Zhao HZ, Luo ZB, Xu WQ, Shen HP, et al. A new in-frame deletion in ribosomal protein S19 in a Chinese infant with Diamond-Blackfan anemia. Blood Cells Mol Dis. 2016;62:1-5.
66. Campagnoli MF, Garelli E, Quarello P, Carando A, Va-rotto S, Nobili B, et al. Molecular basis of Diamond-Black-fan anemia: new findings from the Italian registry and a re-view of the literature. Haematologica. 2004;89(4):480-9.
67. Janov AJ, Leong T, Nathan DG, Guinan EC. Diamond-Blackfan anemia natural history and sequelae of treat-ment. Medicine. 1996;75(2):77-87.
68. Quarello P, Garelli E, Carando A, Brusco A, Calabrese R, Dufour C, et al. Diamond-Blackfan anemia: genotype-phenotype correlations in Italian patients with RPL5 and RPL11 mutations. Haematologica. 2010;95(2):206-13.
69. Konno Y, Toki T, Tandai S, Xu G, Wang R, Terui K, et al. Mutations in the ribosomal protein genes in Japanese patients with Diamond-Blackfan anemia. Haematologica. 2010;95(8):1293-9.
70. Gripp KW, Curry C, Olney AH, Sandoval C, Fisher J, Chong JXL, et al. Diamond–Blackfan anemia with man-dibulofacial dystostosis is heterogeneous, including the novel DBA genes TSR2 and RPS28. Am J Med Genet A. 2014;164(9):2240-9.
71. Vlachos A, Ball S, Dahl N, Alter BP, Sheth S, Ramenghi U, et al. Diagnosing and treating Diamond Blackfan anae-mia: results of an international clinical consensus confer-ence. Br J Haematol. 2008;142(6):859-76.
72. Wlodarski MW, Da Costa L, O’Donohue MF, Gastou M, Karboul N, Montel-Lehry N, et al. Recurring mutations in RPL15 are linked to hydrops fetalis and treatment inde-pendence in Diamond-Blackfan anemia. Haematologica. 2018;103(6):949-58.
73. Bessler M, Masson PJ, Link DC, DB. W. Inherited bone marrow failure syndrome. In: Orkin SH, Nathan DG, edi-tors. Hematology of infancy and childhood. 7th ed: Phila-delphia: Saunders; 2009. p. 351–91.
74. Fargo JH, Kratz CP, Giri N, Savage SA, Wong C, Backer K, et al. Erythrocyte adenosine deaminase: diagnostic
eJIFCC2019Vol30No1pp067-081Page 81
Getabalew Engidaye, Mulugeta Melku, Bamlaku EnawgawDiamond Blackfan Anemia: genetics, pathogenesis, diagnosis and treatment
value for Diamond Blackfan anaemia. Br J Haematol. 2013;160(4):547-54.
75. He X, Xu ZL. Clinical features and pathogenic gene de-tection of Diamond-Blackfan anemia. Zhongguo Dang Dai Er Ke Za Zhi. 2017;19(2):171-5.
76. Iolascon A, Heimpel H, Wahlin A, Tamary H. Congeni-tal dyserythropoietic anemias: molecular insights and di-agnostic approach. Blood. 2013;122(13):2162-6.
77. Vlachos A, Rosenberg PS, Atsidaftos E, Alter BP, Lipton JM. Incidence of neoplasia in Diamond Blackfan anemia: a report from the Diamond Blackfan Anemia Registry. Blood. 2012;119(16):3815-19.
78. Dianzani I, Loreni F. Diamond-Blackfan anemia: a ribo-somal puzzle. Haematologica. 2008;93(11):1601-4.
79. Ball S. Diamond Blackfan anemia. Hematology AM Soc Hematol Educ Program. 2011;2011:487-91.
80. Farrar JE, Quarello P, Fisher R, O’Brien KA, Aspesi A, Parrella S, et al. Exploiting Pre-rRNA processing in Dia-mond Blackfan anemia gene discovery and diagnosis. Am J Hematol. 2014;89(10):985-91.
81. Da Costa L, Chanoz Poulard G, Simansour M, French M, Bouvier R, Prieur F, et al. First de novo mutation in RPS19 gene as the cause of hydrops fetalis in Diamond–Blackfan anemia. Am J Hematol. 2013;88(2):160.
82. Dessypris EN, Krantz SB, Roloff JS, JN L. Mode of action of the IgG inhibitor of erythropoiesis in transient erythro-blastopenia of children. Blood. 1982;59 (1):114-23.
83. Lee H, Lyssikatos C, Atsidaftos E, Muir E, Gazda H, Beggs AH, et al. Remission in patients with Diamond Blackfan anemia (DBA) appears to be unrestricted by phenotype or genotype. Blood (ASH Annual Meeting Ab-stracts). 2008;112(11):3092.
84. Jaako P, Flygare J, Olsson K, Schambach A, Baum C, Larsson J, et al. A novel mouse model for RPS19 deficient Diamond-Blackfan anemia locates the erythroid defect at CFU-E/proerythroblast transition. Blood (ASH Annual Meeting Abstracts). 2009;114(22):178.
85. Narla A, Vlachos A, Nathan D. Diamond-Blackfan ane-mia treatment: past, present and future. Semin Hematol. 2011;48(2):117-23.
eJIFCC2019Vol30No1pp082-087Page 82
This is a Platinum Open Access Journal distributed under the terms of the Creative Commons Attribution Non-Commercial License which permits unrestricted non-commercial use, distribution, and reproduction in any medium, provided the original work is properly cited.
Gaucher disease: an underdiagnosed pathology in the Eastern Moroccan populationOuardia Bouayadi1,2, Amina Lyagoubi1,2, Adnane Aarab1,2, Somiya Lamrabat1,2, Abdelilah Berhili1, Mohammed Bensalah1,2, Rachid Seddik1,2
1 Laboratory of Hematology, Mohammed VI University Hospital, Oujda, Morocco2 Faculty of Medicine and Pharmacy, Mohammed the First University, Oujda, Morocco
A R T I C L E I N F O A B S T R A C T
Gaucher disease (GD) is a lysosomal storage disease. It corresponds to a congenital deficit in β-gluco cere-brosidase. This pathology should be considered in the presence of unexplained splenomegaly, with or with-out signs of haemorrhage, skeletal manifestations or hepatomegaly.
The diagnosis is based on the measurement of the β-gluco cerebrosidase activity but the preanalytical process should be respected in order to avoid the under-diagnosis of this disorder and the delay of its management. We report two cases of Gaucher dis-ease collected at Mohammed VI University Hospital and Al Farabi regional hospital in Oujda. We have em-phasized the need for a reference center for overload diseases.
Corresponding author:Ouardia BouayadCentral LaboratoryMohammed VI University HospitalOujda MoroccoE-mail: [email protected]
Key words:splenomegaly, thrombocytopenia, Gaucher cells, β-glucocerebrosidase
Conflict of interest:Authors declared no conflict of interest.
eJIFCC2019Vol30No1pp082-087Page 83
O. Bouayadi, A. Lyagoubi, A. Aarab, S. Lamrabat, A. Berhili, M. Bensalah, R. SeddikGaucher disease: an underdiagnosed pathology in the Eastern Moroccan population
INTRODUCTION
Gaucher disease is a lysosomal storage disease, the transmission is autosomal recessive.
It follows a mutation in the GBA gene coding for a lysosomal enzyme: β-glucocerebrosidase, which hydrolyzes glucosylcerebroside (glycosyl ce-ramide) into ceramide (cerebroside) and glucose.
There are three subtypes of the disease. The most common is type 1, known as the non-neu-ropathic form. Pancytopenia, hepatosplenomeg-aly and bone lesions occur as a result of glucocer-ebroside accumulation in the liver, lung, spleen and bone marrow in these patients.
The two other phenotypes include a severe neurological involvement in type 2 that affects infants and is deadly; in type 3 the neurological involvement is less severe and is also associated with features of types 1 [1].
CASE 1
A 37-year-old male, was admitted to the inter-nal medicine department of the regional hos-pital of Oujda for the management of anemic syndrome with splenomegaly. The clinical ex-amination found mucocutaneous paleness with voluminous splenomegaly, the rest of the clinical examination is without particularity. Laboratory tests revealed bicytopenia with normochromic anemia (Hb at 6.3 g/dL) and thrombocytope-nia at 140 G/L , leukocytes at 5 G/L . Liver and renal functions were normal, the serologies of hepatitis B, hepatitis C and HIV were negative. The abdominal ultrasound showed a huge sple-nomegaly, a normal-size liver without signs of portal hypertension. The myelogram showed a marrow, with cellular abundance a hyperplasia of the erythroblastic line with the presence of many Gaucher cells. X-ray of the skull, thora-columbar spine, and pelvis were normal. The chest CT scan revealed the presence of alveo-lar syndrome with a small left pleural effusion.
The abdominal computed tomography showed significant heterogeneous splenomegaly with compression of adjacent organs and a small flu-id effusion in the Douglas cul-de-sac.
Subsequently, β-glucocerebrosidase [7.5 U/L (reference range: 6.5 - 10.5 U/L)], Chitotriosidase [2980 nmol/h/mL (normal value <120 nmol/h/mL)] and ferritin [833 μg/L (reference range: males 20-200 μg/L)] measurement was done.
The diagnosis of Gaucher disease type 1 was based on clinico-biological data, the cytologi-cal aspect of the marrow and the results of the biomarkers, without enzymatic evidence. The patient was splenectomized; and the patho-logical examination of the spleen showed sub capsular splenic infarction with presence of Gaucher cells.
CASE 2
A 26-year-old male, with no significant medi-cal history was admitted to the Department of Internal Medicine of Mohammed VI University Hospital for the management of splenomegaly with anemic and haemorrhagic syndrome. The history of the disease dated back to 6 months before admission by the progressive appear-ance of anemic syndrome constituted by cuta-neous pallor, asthenia and fatigability, associ-ated with a hemorrhagic syndrome demarked by episodes of repeated epistaxis and diffuses bone pain. The symptomatology constituted hepatic, colic and left hypochondrial pain.
Clinical examination found a cutaneomucous pallor with splenomegaly exceeding the white line of the abdomen, without hepatomegaly or other associated signs. Blood test found a he-moglobin level at 12 g/dL (reticulocyte: 1.54%), platelet count at 40 G/L and leucocytes at 3940/ μL. The serologies of hepatitis A, B and C and leishmaniasis were negative. The myelo-gram showed the presence of many Gaucher cells (Figure 1).
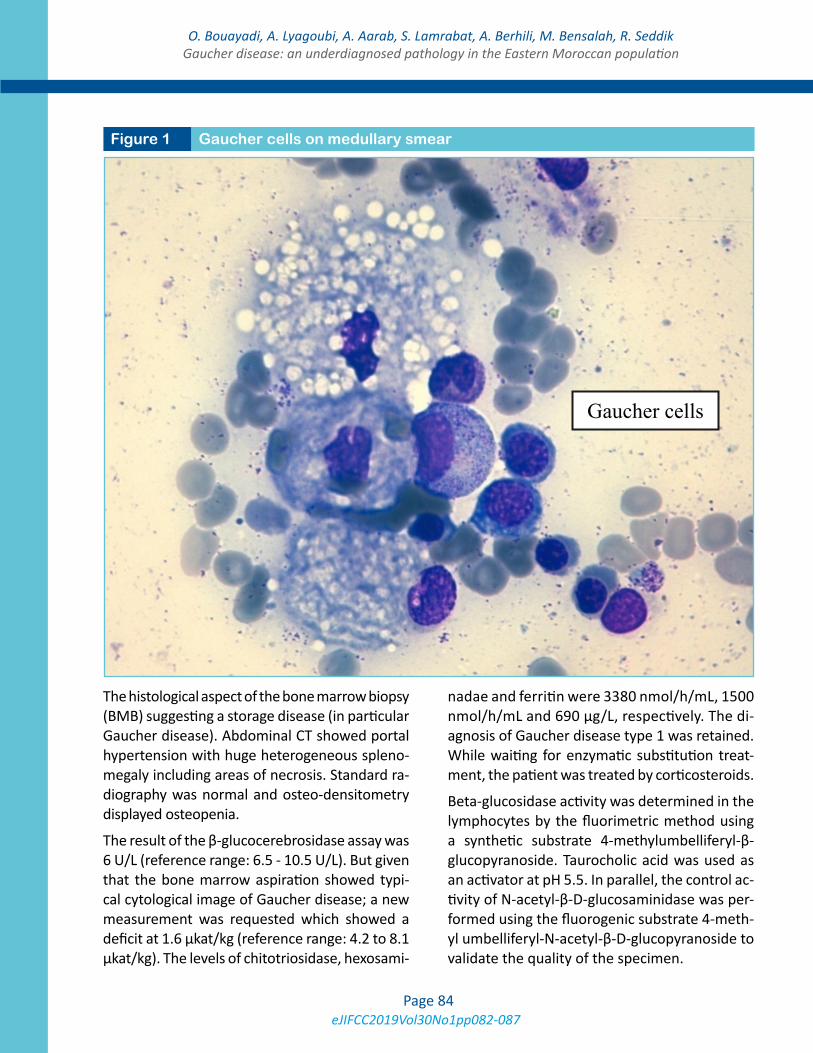
eJIFCC2019Vol30No1pp082-087Page 84
O. Bouayadi, A. Lyagoubi, A. Aarab, S. Lamrabat, A. Berhili, M. Bensalah, R. SeddikGaucher disease: an underdiagnosed pathology in the Eastern Moroccan population
The histological aspect of the bone marrow biopsy (BMB) suggesting a storage disease (in particular Gaucher disease). Abdominal CT showed portal hypertension with huge heterogeneous spleno-megaly including areas of necrosis. Standard ra-diography was normal and osteo-densitometry displayed osteopenia.
The result of the β-glucocerebrosidase assay was 6 U/L (reference range: 6.5 - 10.5 U/L). But given that the bone marrow aspiration showed typi-cal cytological image of Gaucher disease; a new measurement was requested which showed a deficit at 1.6 μkat/kg (reference range: 4.2 to 8.1 μkat/kg). The levels of chitotriosidase, hexosami-
nadae and ferritin were 3380 nmol/h/mL, 1500 nmol/h/mL and 690 μg/L, respectively. The di-agnosis of Gaucher disease type 1 was retained. While waiting for enzymatic substitution treat-ment, the patient was treated by corticosteroids.
Beta-glucosidase activity was determined in the lymphocytes by the fluorimetric method using a synthetic substrate 4-methylumbelliferyl-β-glucopyranoside. Taurocholic acid was used as an activator at pH 5.5. In parallel, the control ac-tivity of N-acetyl-β-D-glucosaminidase was per-formed using the fluorogenic substrate 4-meth-yl umbelliferyl-N-acetyl-β-D-glucopyranoside to validate the quality of the specimen.
Figure 1 Gaucher cells on medullary smear
Gaucher cells
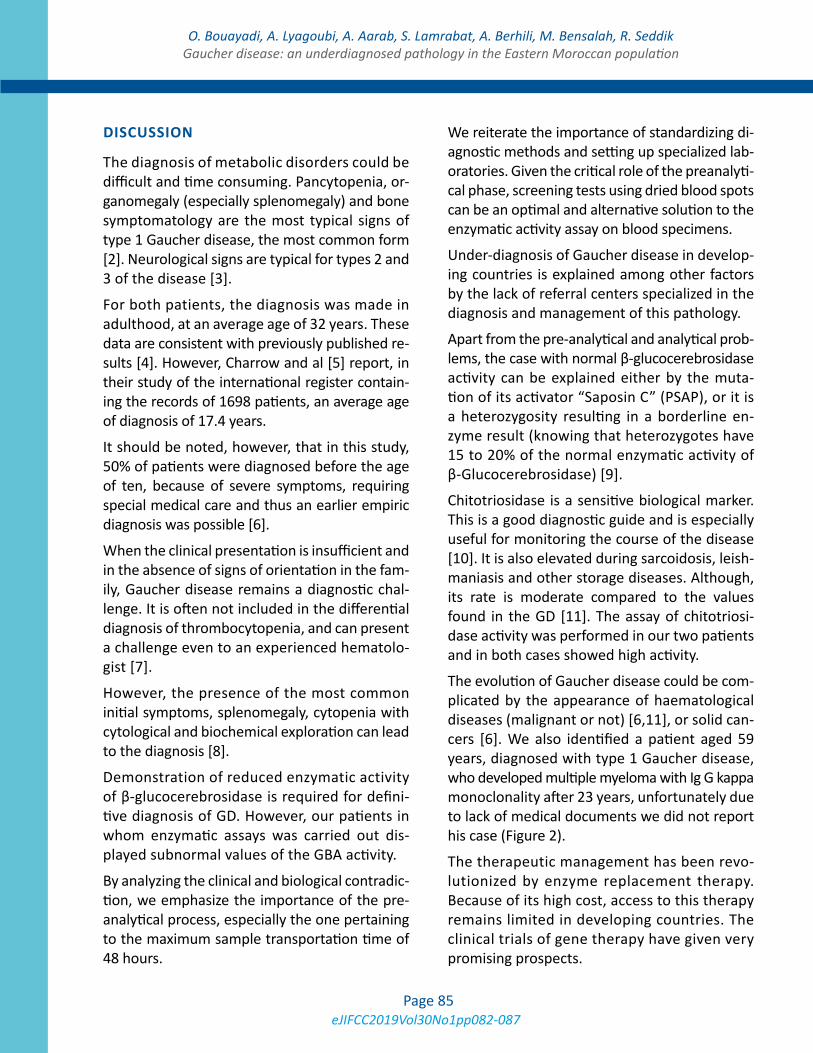
eJIFCC2019Vol30No1pp082-087Page 85
O. Bouayadi, A. Lyagoubi, A. Aarab, S. Lamrabat, A. Berhili, M. Bensalah, R. SeddikGaucher disease: an underdiagnosed pathology in the Eastern Moroccan population
DISCUSSION
The diagnosis of metabolic disorders could be difficult and time consuming. Pancytopenia, or-ganomegaly (especially splenomegaly) and bone symptomatology are the most typical signs of type 1 Gaucher disease, the most common form [2]. Neurological signs are typical for types 2 and 3 of the disease [3].
For both patients, the diagnosis was made in adulthood, at an average age of 32 years. These data are consistent with previously published re-sults [4]. However, Charrow and al [5] report, in their study of the international register contain-ing the records of 1698 patients, an average age of diagnosis of 17.4 years.
It should be noted, however, that in this study, 50% of patients were diagnosed before the age of ten, because of severe symptoms, requiring special medical care and thus an earlier empiric diagnosis was possible [6].
When the clinical presentation is insufficient and in the absence of signs of orientation in the fam-ily, Gaucher disease remains a diagnostic chal-lenge. It is often not included in the differential diagnosis of thrombocytopenia, and can present a challenge even to an experienced hematolo-gist [7].
However, the presence of the most common initial symptoms, splenomegaly, cytopenia with cytological and biochemical exploration can lead to the diagnosis [8].
Demonstration of reduced enzymatic activity of β-glucocerebrosidase is required for defini-tive diagnosis of GD. However, our patients in whom enzymatic assays was carried out dis-played subnormal values of the GBA activity.
By analyzing the clinical and biological contradic-tion, we emphasize the importance of the pre-analytical process, especially the one pertaining to the maximum sample transportation time of 48 hours.
We reiterate the importance of standardizing di-agnostic methods and setting up specialized lab-oratories. Given the critical role of the preanalyti-cal phase, screening tests using dried blood spots can be an optimal and alternative solution to the enzymatic activity assay on blood specimens.
Under-diagnosis of Gaucher disease in develop-ing countries is explained among other factors by the lack of referral centers specialized in the diagnosis and management of this pathology.
Apart from the pre-analytical and analytical prob-lems, the case with normal β-glucocerebrosidase activity can be explained either by the muta-tion of its activator “Saposin C” (PSAP), or it is a heterozygosity resulting in a borderline en-zyme result (knowing that heterozygotes have 15 to 20% of the normal enzymatic activity of β-Glucocerebrosidase) [9].
Chitotriosidase is a sensitive biological marker. This is a good diagnostic guide and is especially useful for monitoring the course of the disease [10]. It is also elevated during sarcoidosis, leish-maniasis and other storage diseases. Although, its rate is moderate compared to the values found in the GD [11]. The assay of chitotriosi-dase activity was performed in our two patients and in both cases showed high activity.
The evolution of Gaucher disease could be com-plicated by the appearance of haematological diseases (malignant or not) [6,11], or solid can-cers [6]. We also identified a patient aged 59 years, diagnosed with type 1 Gaucher disease, who developed multiple myeloma with Ig G kappa monoclonality after 23 years, unfortunately due to lack of medical documents we did not report his case (Figure 2).
The therapeutic management has been revo-lutionized by enzyme replacement therapy. Because of its high cost, access to this therapy remains limited in developing countries. The clinical trials of gene therapy have given very promising prospects.
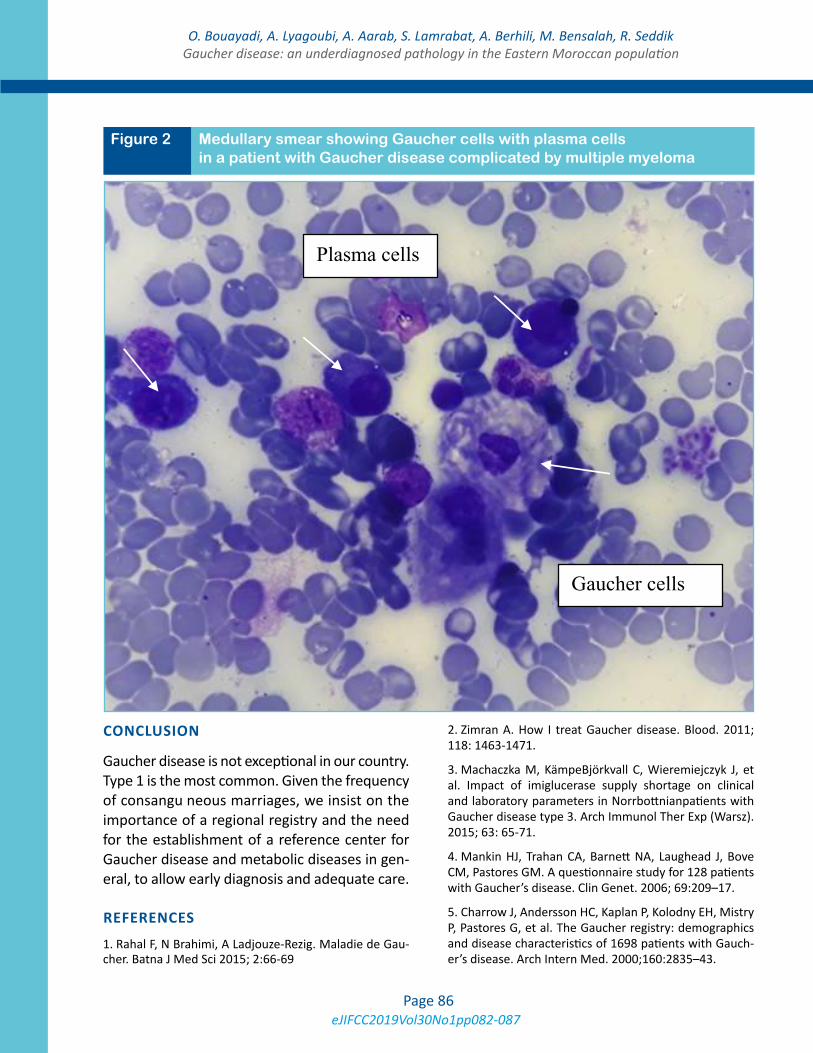
eJIFCC2019Vol30No1pp082-087Page 86
O. Bouayadi, A. Lyagoubi, A. Aarab, S. Lamrabat, A. Berhili, M. Bensalah, R. SeddikGaucher disease: an underdiagnosed pathology in the Eastern Moroccan population
CONCLUSION
Gaucher disease is not exceptional in our country. Type 1 is the most common. Given the frequency of consangu neous marriages, we insist on the importance of a regional registry and the need for the establishment of a reference center for Gaucher disease and metabolic diseases in gen-eral, to allow early diagnosis and adequate care.
REFERENCES
1. Rahal F, N Brahimi, A Ladjouze-Rezig. Maladie de Gau-cher. Batna J Med Sci 2015; 2:66-69
2. Zimran A. How I treat Gaucher disease. Blood. 2011; 118: 1463-1471.
3. Machaczka M, KämpeBjörkvall C, Wieremiejczyk J, et al. Impact of imiglucerase supply shortage on clinical and laboratory parameters in Norrbottnianpatients with Gaucher disease type 3. Arch Immunol Ther Exp (Warsz). 2015; 63: 65-71.
4. Mankin HJ, Trahan CA, Barnett NA, Laughead J, Bove CM, Pastores GM. A questionnaire study for 128 patients with Gaucher’s disease. Clin Genet. 2006; 69:209–17.
5. Charrow J, Andersson HC, Kaplan P, Kolodny EH, Mistry P, Pastores G, et al. The Gaucher registry: demographics and disease characteristics of 1698 patients with Gauch-er’s disease. Arch Intern Med. 2000;160:2835–43.
Figure 2 Medullary smear showing Gaucher cells with plasma cells in a patient with Gaucher disease complicated by multiple myeloma
igure B Medu ary mea showin aucher ce s with p sma cells in a p tie w h G uc er dise c mp d b m lt l
Gaucher cells
Plasma cells
eJIFCC2019Vol30No1pp082-087Page 87
O. Bouayadi, A. Lyagoubi, A. Aarab, S. Lamrabat, A. Berhili, M. Bensalah, R. SeddikGaucher disease: an underdiagnosed pathology in the Eastern Moroccan population
6. Revest M, Perlat A, Decaux O, Lamyb T, Vérin M, Bris-sot P et all, Étude rétrospective sur dix ans des patients atteints de maladie de Gaucher au CHU de Rennes. La Re-vue de médecine interne 30 (2009) 847–856.
7. Mistry PK, Sadan S, Yang R, et al. Consequences of di-agnostic delaysin type 1 Gaucher disease: the need for greater awareness among hematologists-oncologists and an opportunity for early diagnosis and intervention. Am J Hematol. 2007; 82: 697-701.
8. Sokołowska B, Skomra D, Czartoryska B, et al. Gaucher disease - of the possible causes of splenomegaly - case report. Pol Arch Med Wewn. 2004; 112: 1107-1112.
9. Jebar K. La maladie de Gaucher: à propos d’un cas et revue de la littérature, thèse de doctorat en méde-cine, faculté de médecine et de pharmacie-Oujda. 2016; p299.
10. Audemard A, Troussard X, Galateau-Salle F, Mac-ro M. Maladie de Gaucher. Hematologie 2013; 19: 217-222.
11. Stirnemann J, Caubel I, Kettaneh A, Fain O, Belmat-oug N. Aspects épidémiologiques, cliniques, biologiques et thérapeutiques de la maladie de Gaucher. Presse Med 2003; 32:503-511.
eJIFCC2019Vol30No1pp088-094Page 88
This is a Platinum Open Access Journal distributed under the terms of the Creative Commons Attribution Non-Commercial License which permits unrestricted non-commercial use, distribution, and reproduction in any medium, provided the original work is properly cited.
A rare case of non-secretory multiple myeloma: a case report and literature reviewMohammed Bensalah1,2, Somiya Lamrabat1,2, Amina Lyagoubi1, 2, Adnane Aarab1,2, Ouardia Bouayadi1,2, Rachid Seddik1,2
1 Hematology Laboratory, Mohammed VI University Hospital, Oujda, Morocco2 Faculty of Medicine and Pharmacy, Mohammed the First University, Oujda, Morocco
A R T I C L E I N F O C A S E R E P O R T
Non-secretory myeloma (NSM) is a rare form of my-eloma. It is defined as monoclonal plasmocytic prolif-eration of the bone marrow with the same clinical and radiological manifestations of myeloma. However, plasma cells are unable to secrete immunoglobulin (serum and urinary electrophoresis are negative and free light chain measurement is unquantifiable).
This variant of multiple myeloma (MM) usually poses a diagnostic challenge to the biologist and clinician. We report a rare case of non-secretory myeloma in a 76-year-old patient who was diagnosed at the Mohammed V University Hospital Center in Oujda, Morocco.
Corresponding author:Mohammed Bensalah Boulvard Zaid Ben SoltanQuartier Ben KhaldouneRue: N, Numéro: 29Oujda MoroccoE-mail: [email protected]
Key words:non-secretory myeloma, free light chain, Kappa, Lambda
eJIFCC2019Vol30No1pp088-094Page 89
M. Bensalah, S. Lamrabat, A. Lyagoubi, A. Aarab, O. Bouayadi, R. SeddikA rare case of non-secretory multiple myeloma: a case report and literature review
INTRODUCTION
Multiple myeloma is a hematological malignancy characterized by the presence of clonal plasma cells in the marrow that typically secrete an ab-normal immunoglobulin causing a monoclonal gammapathy. This serum protein is often char-acterized by an intact immunoglobulin (heavy and light chain), or it may be characterized only by the light chain. In the urine, an intact immu-noglobulin is also often present [1].
Myeloma is characterized by end-organ damage as manifested by hematologic, renal, or bone complications [2].
Myeloma may be preceded by a premalignant phase in which clonal plasma cells are present but there is no evidence of end-organ dam-age: this is known as “monoclonal gammopa-thy of unknown significance” or “smoldering myeloma” [3].
Non-secretory myeloma (NSM) is a rare clini-cal form of multiple myeloma with monoclonal plasmocytic proliferation of the bone marrow and the same clinical and radiological manifes-tations. However, in the case of non-secretory myeloma, plasma cells are unable to secrete im-munoglobulin (serum and urinary electropho-resis are negative and free light chain measure-ment is unquantifiable) [1].
CLINICAL-DIAGNOSTIC CASE
Mr. B.T., 76 years old, whose medical history includes:
• Chronic smoking for 25 years, weaned 35 years ago;
• Type 2 diabetes with oral antidiabetic drugs;
• Epilepsy treated with Phénobarbital, 0.75 mg/day.
The patient was admitted for mixed-type back pain, left intercostal neuralgia and left rib pain that was resistant to analgesics. Everything
evolves in a context of apyrexia and conservation of the general state.
The osteo-articular examination found pain in the palpation of the lower back spine. The rest of the clinical examination was without any particularities.
The patient has benefited from a biological as-sessment which did not indicate a biological inflammatory syndrome (normal ertyhrocyte sedimentation rate and CRP test) and the com-plete blood count with differential was without abnormalities. Serum protein electrophoresis showed hypogammaglobulinemia at 3.7 g/L and serum and urine immunofixations were negative with a normal Kappa/Lambda ratio. Renal and hepatic status was normal. (Table 1, Figure 1)
Magnetic resonance imaging (MRI) of the thorac-ic spine showed suspicious-looking D9 vertebral body compression with swollen pre-vertebral soft tissue swelling and posterior wall retraction, as well as a heterogeneous aspect of the cervical vertebrae.
The myelogram revealed 85% medullary plasmo-cytosis. (Figure 2)
Immunohistochemistry performed on osteo-medullary biopsy showed medullary infiltra-tion by myelomatous plasmocyte proliferation (CD138 positive) with a Kappa monotype.
Therapeutically, the patient was put on melpha-lan-prednisone-thalidomide (MPT)/Zometa pro-tocol with a partial response (medullary plasmo-cytosis is of 18%).
DISCUSSION
Multiple myeloma is a hematological malig-nancy characterized by monoclonal plasmo-cytic proliferation invading the hematopoietic bone marrow. Serum protein electrophoresis shows either the presence of a narrow peak migrating most often in the gamma globulin
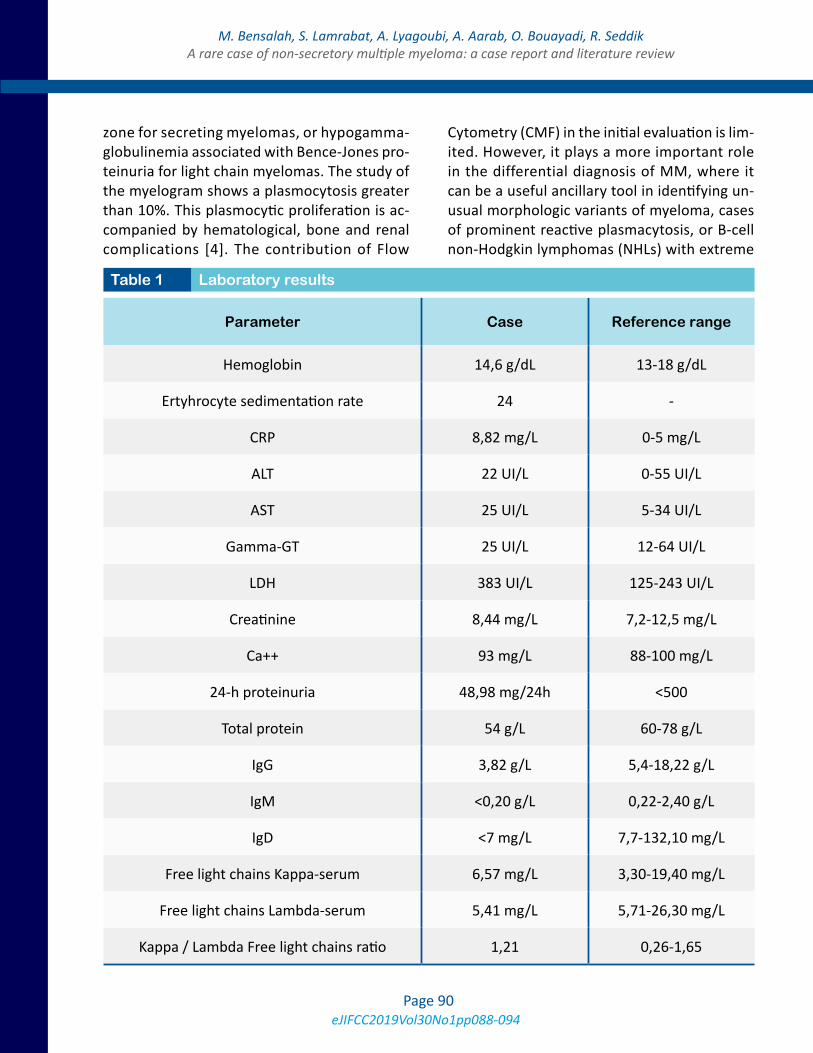
eJIFCC2019Vol30No1pp088-094Page 90
M. Bensalah, S. Lamrabat, A. Lyagoubi, A. Aarab, O. Bouayadi, R. SeddikA rare case of non-secretory multiple myeloma: a case report and literature review
zone for secreting myelomas, or hypogamma-globulinemia associated with Bence-Jones pro-teinuria for light chain myelomas. The study of the myelogram shows a plasmocytosis greater than 10%. This plasmocytic proliferation is ac-companied by hematological, bone and renal complications [4]. The contribution of Flow
Cytometry (CMF) in the initial evaluation is lim-ited. However, it plays a more important role in the differential diagnosis of MM, where it can be a useful ancillary tool in identifying un-usual morphologic variants of myeloma, cases of prominent reactive plasmacytosis, or B-cell non-Hodgkin lymphomas (NHLs) with extreme
Parameter Case Reference range
Hemoglobin 14,6 g/dL 13-18 g/dL
Ertyhrocyte sedimentation rate 24 -
CRP 8,82 mg/L 0-5 mg/L
ALT 22 UI/L 0-55 UI/L
AST 25 UI/L 5-34 UI/L
Gamma-GT 25 UI/L 12-64 UI/L
LDH 383 UI/L 125-243 UI/L
Creatinine 8,44 mg/L 7,2-12,5 mg/L
Ca++ 93 mg/L 88-100 mg/L
24-h proteinuria 48,98 mg/24h <500
Total protein 54 g/L 60-78 g/L
IgG 3,82 g/L 5,4-18,22 g/L
IgM <0,20 g/L 0,22-2,40 g/L
IgD <7 mg/L 7,7-132,10 mg/L
Free light chains Kappa-serum 6,57 mg/L 3,30-19,40 mg/L
Free light chains Lambda-serum 5,41 mg/L 5,71-26,30 mg/L
Kappa / Lambda Free light chains ratio 1,21 0,26-1,65
Table 1 Laboratory results
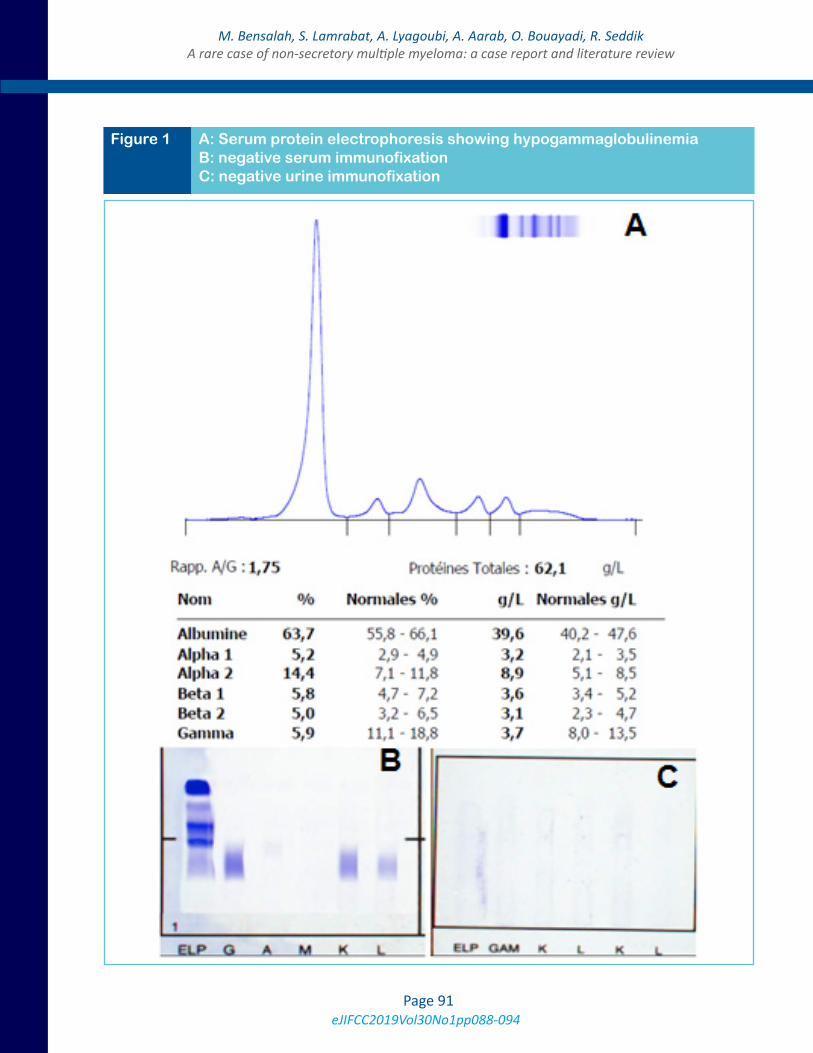
eJIFCC2019Vol30No1pp088-094Page 91
M. Bensalah, S. Lamrabat, A. Lyagoubi, A. Aarab, O. Bouayadi, R. SeddikA rare case of non-secretory multiple myeloma: a case report and literature review
Figure 1 A: Serum protein electrophoresis showing hypogammaglobulinemia B: negative serum immunofixation C: negative urine immunofixation
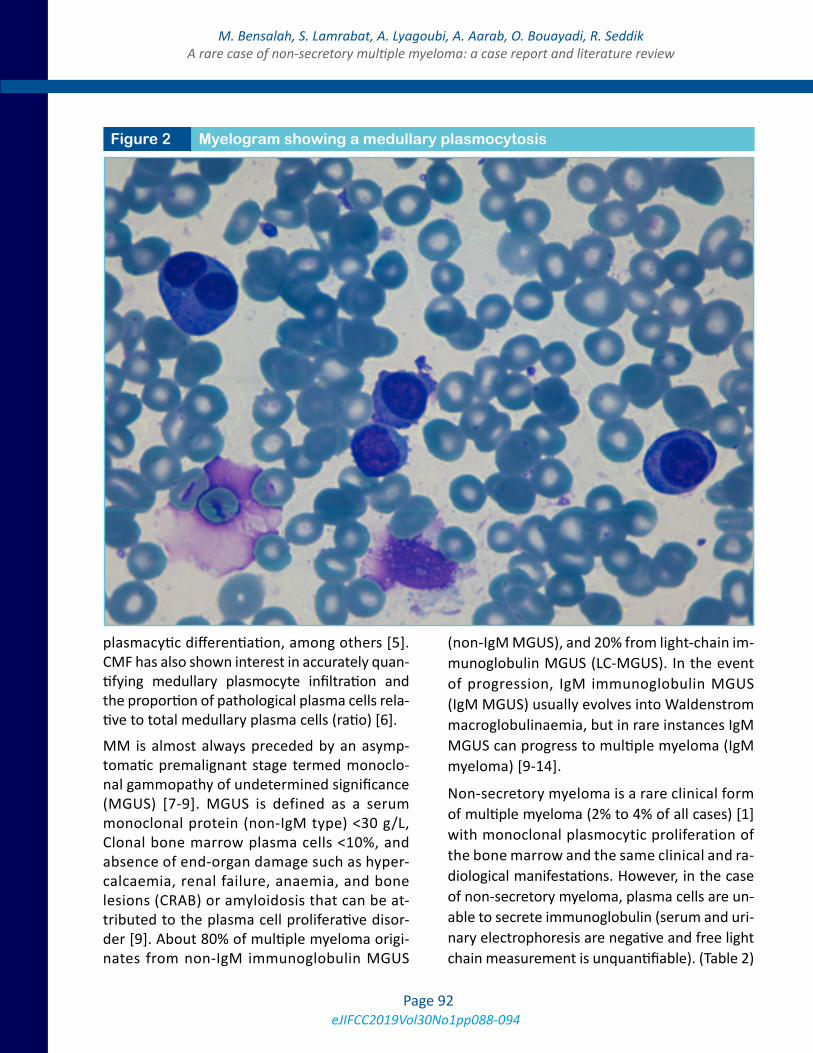
eJIFCC2019Vol30No1pp088-094Page 92
M. Bensalah, S. Lamrabat, A. Lyagoubi, A. Aarab, O. Bouayadi, R. SeddikA rare case of non-secretory multiple myeloma: a case report and literature review
plasmacytic differentiation, among others [5]. CMF has also shown interest in accurately quan-tifying medullary plasmocyte infiltration and the proportion of pathological plasma cells rela-tive to total medullary plasma cells (ratio) [6].
MM is almost always preceded by an asymp-tomatic premalignant stage termed monoclo-nal gammopathy of undetermined significance (MGUS) [7-9]. MGUS is defined as a serum monoclonal protein (non-IgM type) <30 g/L, Clonal bone marrow plasma cells <10%, and absence of end-organ damage such as hyper-calcaemia, renal failure, anaemia, and bone lesions (CRAB) or amyloidosis that can be at-tributed to the plasma cell proliferative disor-der [9]. About 80% of multiple myeloma origi-nates from non-IgM immunoglobulin MGUS
(non-IgM MGUS), and 20% from light-chain im-munoglobulin MGUS (LC-MGUS). In the event of progression, IgM immunoglobulin MGUS (IgM MGUS) usually evolves into Waldenstrom macroglobulinaemia, but in rare instances IgM MGUS can progress to multiple myeloma (IgM myeloma) [9-14].
Non-secretory myeloma is a rare clinical form of multiple myeloma (2% to 4% of all cases) [1] with monoclonal plasmocytic proliferation of the bone marrow and the same clinical and ra-diological manifestations. However, in the case of non-secretory myeloma, plasma cells are un-able to secrete immunoglobulin (serum and uri-nary electrophoresis are negative and free light chain measurement is unquantifiable). (Table 2)
Figure 2 Myelogram showing a medullary plasmocytosis
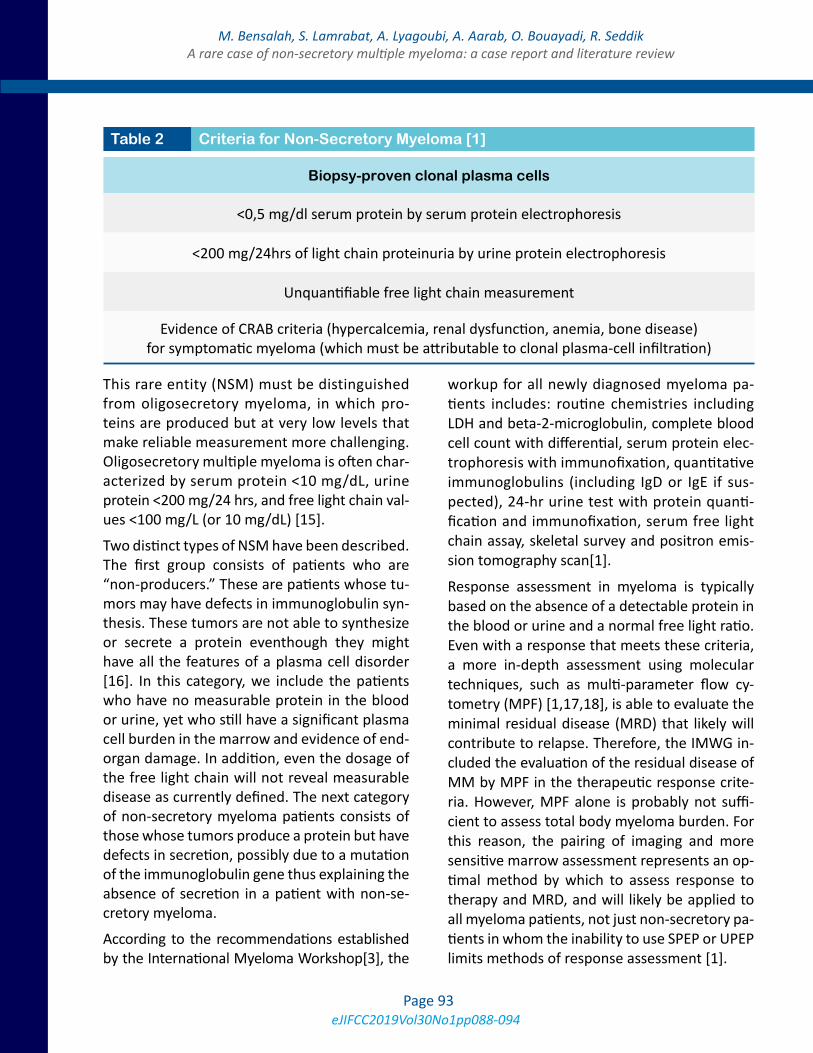
eJIFCC2019Vol30No1pp088-094Page 93
M. Bensalah, S. Lamrabat, A. Lyagoubi, A. Aarab, O. Bouayadi, R. SeddikA rare case of non-secretory multiple myeloma: a case report and literature review
This rare entity (NSM) must be distinguished from oligosecretory myeloma, in which pro-teins are produced but at very low levels that make reliable measurement more challenging. Oligosecretory multiple myeloma is often char-acterized by serum protein <10 mg/dL, urine protein <200 mg/24 hrs, and free light chain val-ues <100 mg/L (or 10 mg/dL) [15].
Two distinct types of NSM have been described. The first group consists of patients who are “non-producers.” These are patients whose tu-mors may have defects in immunoglobulin syn-thesis. These tumors are not able to synthesize or secrete a protein eventhough they might have all the features of a plasma cell disorder [16]. In this category, we include the patients who have no measurable protein in the blood or urine, yet who still have a significant plasma cell burden in the marrow and evidence of end-organ damage. In addition, even the dosage of the free light chain will not reveal measurable disease as currently defined. The next category of non-secretory myeloma patients consists of those whose tumors produce a protein but have defects in secretion, possibly due to a mutation of the immunoglobulin gene thus explaining the absence of secretion in a patient with non-se-cretory myeloma.
According to the recommendations established by the International Myeloma Workshop[3], the
workup for all newly diagnosed myeloma pa-tients includes: routine chemistries including LDH and beta-2-microglobulin, complete blood cell count with differential, serum protein elec-trophoresis with immunofixation, quantitative immunoglobulins (including IgD or IgE if sus-pected), 24-hr urine test with protein quanti-fication and immunofixation, serum free light chain assay, skeletal survey and positron emis-sion tomography scan[1].
Response assessment in myeloma is typically based on the absence of a detectable protein in the blood or urine and a normal free light ratio. Even with a response that meets these criteria, a more in-depth assessment using molecular techniques, such as multi-parameter flow cy-tometry (MPF) [1,17,18], is able to evaluate the minimal residual disease (MRD) that likely will contribute to relapse. Therefore, the IMWG in-cluded the evaluation of the residual disease of MM by MPF in the therapeutic response crite-ria. However, MPF alone is probably not suffi-cient to assess total body myeloma burden. For this reason, the pairing of imaging and more sensitive marrow assessment represents an op-timal method by which to assess response to therapy and MRD, and will likely be applied to all myeloma patients, not just non-secretory pa-tients in whom the inability to use SPEP or UPEP limits methods of response assessment [1].
Biopsy-proven clonal plasma cells
<0,5 mg/dl serum protein by serum protein electrophoresis
<200 mg/24hrs of light chain proteinuria by urine protein electrophoresis
Unquantifiable free light chain measurement
Evidence of CRAB criteria (hypercalcemia, renal dysfunction, anemia, bone disease) for symptomatic myeloma (which must be attributable to clonal plasma-cell infiltration)
Table 2 Criteria for Non-Secretory Myeloma [1]
eJIFCC2019Vol30No1pp088-094Page 94
M. Bensalah, S. Lamrabat, A. Lyagoubi, A. Aarab, O. Bouayadi, R. SeddikA rare case of non-secretory multiple myeloma: a case report and literature review
CONCLUSION
In conclusion, the absence of a monoclonal pro-tein in serum and/or urine does not rule out the diagnosis of MM. Indeed, the diagnosis of non-secreting myeloma should be made in patients with clinico-biological and radiological charac-teristics of MM with a ratio of normal Kappa/Lambda free light chains. As a result, this report has now become a standard for the diagnosis of non-secreting myeloma.
REFERENCES
1. Lonial S,Kaufman JL. Non-secretory myeloma: a clinician’s guide. Oncology (Williston Park). 2013 Sep;27(9):924-8, 930.
2. Lonial S, Miguel JF. Induction therapy for newly di-agnosed multiple myeloma. J Natl Compr Canc Netw. 2013;11:19-28.
3. Dimopoulos M, Kyle R, Fermand JP, et al. Consensus recommendations for standard investigative workup: re-port of the International Myeloma Workshop Consensus Panel 3. Blood. 2011;117:4701-5.
4. Charlot-Lambrecht I, Salmon J.-H, Gagneux-Lemous-su L, Brochot P et J.-P. Eschard. Myélome multiple EMC 2011-01-01, Volume 6, Numéro 4, Pages 1-12.
5. Olteanu H. Role of Flow Cytometry in the Diagnosis and Prognosis of Plasma Cell Myeloma. Surg Pathol Clin. 2016 Mar;9(1):101-16.
6. Gressier M, Chaquin M, Lhermitte L, Asnafi V,Macintyre E, Brouzes C. Intérêt de la cytométrie en flux multipara-métrique 8 couleurs dans la prise en charge des gammap-athies monoclonales. Ann Biol Clin 2013 ; 71 (3) : 313-23.
7. Landgren O, Kyle RA, Pfeiff er RM, et al. Monoclonal gammopathy of undetermined signifi cance (MGUS) consistently precedes multiple myeloma: a prospective study. Blood 2009; 113: 5412–17.
8. Weiss BM, Abadie J, Verma P, Howard RS, Kuehl WM. A monoclonal gammopathy precedes multiple myeloma in most patients. Blood 2009; 113: 5418–22.
9. Rajkumar SV, Dimopoulos MA, Palumbo A, Blade J, Merlini G et al. International Myeloma Working Group updated criteria for the diagnosis of multiple myeloma. Lancet Oncol. 2014 Nov;15(12):e538-48.
10. Rajkumar SV, Dispenzieri A, Kyle RA. Monoclonal gam-mopathy of undetermined signifi cance, Waldenstrom macroglobulinemia, AL amyloidosis, and related plasma cell disorders: diagnosis and treatment. Mayo Clin Proc 2006; 81: 693–703.
11. Kyle RA, Durie BGM, Rajkumar SV, et al, and the In-ternational Myeloma Working Group. Monoclonal gam-mopathy of undetermined signifi cance (MGUS) and smoldering (asymptomatic) multiple myeloma: IMWG consensus perspectives risk factors for progression and guidelines for monitoring and management. Leukemia 2010; 24: 1121–27.
12. Landgren O. Monoclonal gammopathy of undeter-mined signifi cance and smoldering multiple myeloma: biological insights and early treatment strategies. He-matology (Am Soc Hematol Educ Program) 2013; 2013: 478–87.
13. Schuster SR, Rajkumar SV, Dispenzieri A, et al. IgM multiple myeloma: disease defi nition, prognosis, and diff erentiation from Waldenstrom’s macroglobulinemia. Am J Hematol 2010; 85: 853–55.
14. Turesson I, Kovalchik SA, Pfeiff er RM, et al. Monoclo-nal gammopathy of undetermined signifi cance and risk of lymphoid and myeloid malignancies: 728 cases followed up to 30 years in Sweden. Blood 2014; 123: 338–45.
15. Durie BG, Harousseau JL, Miguel JS, et al. Interna-tional uniform response criteria for multiple myeloma. Leukemia. 2006;20:2220.
16. Decourt C, Galea HR, Sirac C, Cogne M. Immunologic basis for the rare occurrence of true nonsecretory plasma cell dyscrasias. J Leukoc Biol. 2004;76:528-36.
17. Paiva B, Martinez-Lopez J, Vidriales MB, et al. Compari-son of immunofixation, serum free light chain, and immu-nophenotyping for response evaluation and prognostica-tion in multiple myeloma. J Clin Oncol. 2011;29:1627-33.
18. Paiva B, Almeida J, Perez-Andres M, et al. Utility of flow cytometry immunophenotyping in multiple my-eloma and other clonal plasma cell-related disorders. Cytometry B Clin Cytom. 2010;78:239-52.
eJIFCC2019Vol30No1pp095-098Page 95
This is a Platinum Open Access Journal distributed under the terms of the Creative Commons Attribution Non-Commercial License which permits unrestricted non-commercial use, distribution, and reproduction in any medium, provided the original work is properly cited.
Increased bleeding risk in a patient with oral anticoagulant therapy and concomitant herbal intake – a case reportPaul Gressenberger, Peter Rief, Philipp Jud, Katharina Gütl, Viktoria Muster, Leyla Ghanim, Marianne Brodmann, Thomas GaryDivision of Angiology, Department of Internal Medicine, Medical University of Graz, Austria
I N F O C A S E R E P O R T
We report the case of a 36-year old male, under stable rivaroxaban therapy for 18 months, who was admitted to our emergency room with sudden onset of hemoptysis.
Anticoagulant therapy was given after recurrent spontaneous deep vein thrombosis (DVT) and a heterozygous Factor-V-Leiden mutation was present. There was no co-medication reported, however, the patient reported a constant intake of three liters of home-brewn ginger tea per day in the last month. The patient was hospitalized to further investigate the reason of hemoptysis.
Corresponding author:Paul GressenbergerDivision of AngiologyMedical University of GrazAuenbruggerplatz 158036 Graz AustriaPhone: +43 316 385 12911Fax: +43 316 385 13788E-mail: [email protected]
Key words:hemoptysis, ginger, rivaroxaban,herbal intake
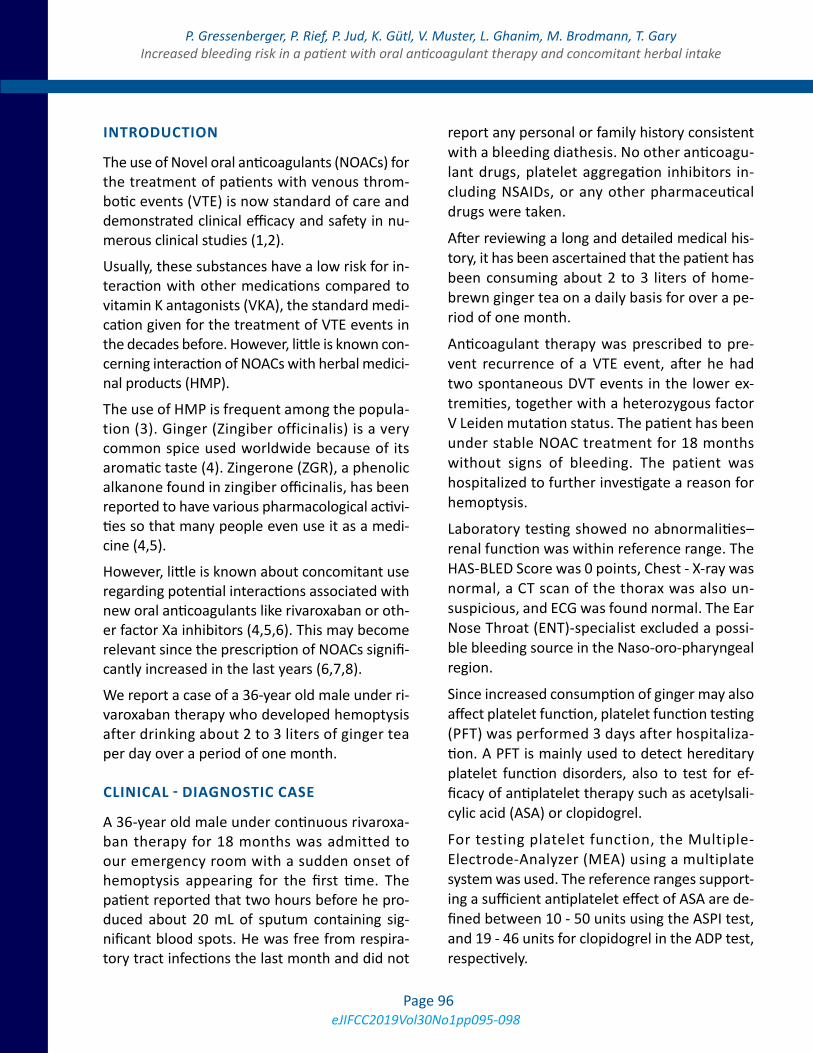
eJIFCC2019Vol30No1pp095-098Page 96
P. Gressenberger, P. Rief, P. Jud, K. Gütl, V. Muster, L. Ghanim, M. Brodmann, T. GaryIncreased bleeding risk in a patient with oral anticoagulant therapy and concomitant herbal intake
INTRODUCTION
The use of Novel oral anticoagulants (NOACs) for the treatment of patients with venous throm-botic events (VTE) is now standard of care and demonstrated clinical efficacy and safety in nu-merous clinical studies (1,2).
Usually, these substances have a low risk for in-teraction with other medications compared to vitamin K antagonists (VKA), the standard medi-cation given for the treatment of VTE events in the decades before. However, little is known con-cerning interaction of NOACs with herbal medici-nal products (HMP).
The use of HMP is frequent among the popula-tion (3). Ginger (Zingiber officinalis) is a very common spice used worldwide because of its aromatic taste (4). Zingerone (ZGR), a phenolic alkanone found in zingiber officinalis, has been reported to have various pharmacological activi-ties so that many people even use it as a medi-cine (4,5).
However, little is known about concomitant use regarding potential interactions associated with new oral anticoagulants like rivaroxaban or oth-er factor Xa inhibitors (4,5,6). This may become relevant since the prescription of NOACs signifi-cantly increased in the last years (6,7,8).
We report a case of a 36-year old male under ri-varoxaban therapy who developed hemoptysis after drinking about 2 to 3 liters of ginger tea per day over a period of one month.
CLINICAL - DIAGNOSTIC CASE
A 36-year old male under continuous rivaroxa-ban therapy for 18 months was admitted to our emergency room with a sudden onset of hemoptysis appearing for the first time. The patient reported that two hours before he pro-duced about 20 mL of sputum containing sig-nificant blood spots. He was free from respira-tory tract infections the last month and did not
report any personal or family history consistent with a bleeding diathesis. No other anticoagu-lant drugs, platelet aggregation inhibitors in-cluding NSAIDs, or any other pharmaceutical drugs were taken.
After reviewing a long and detailed medical his-tory, it has been ascertained that the patient has been consuming about 2 to 3 liters of home-brewn ginger tea on a daily basis for over a pe-riod of one month.
Anticoagulant therapy was prescribed to pre-vent recurrence of a VTE event, after he had two spontaneous DVT events in the lower ex-tremities, together with a heterozygous factor V Leiden mutation status. The patient has been under stable NOAC treatment for 18 months without signs of bleeding. The patient was hospitalized to further investigate a reason for hemoptysis.
Laboratory testing showed no abnormalities–renal function was within reference range. The HAS-BLED Score was 0 points, Chest - X-ray was normal, a CT scan of the thorax was also un-suspicious, and ECG was found normal. The Ear Nose Throat (ENT)-specialist excluded a possi-ble bleeding source in the Naso-oro-pharyngeal region.
Since increased consumption of ginger may also affect platelet function, platelet function testing (PFT) was performed 3 days after hospitaliza-tion. A PFT is mainly used to detect hereditary platelet function disorders, also to test for ef-ficacy of antiplatelet therapy such as acetylsali-cylic acid (ASA) or clopidogrel.
For testing platelet function, the Multiple-Electrode-Analyzer (MEA) using a multiplate system was used. The reference ranges support-ing a sufficient antiplatelet effect of ASA are de-fined between 10 - 50 units using the ASPI test, and 19 - 46 units for clopidogrel in the ADP test, respectively.
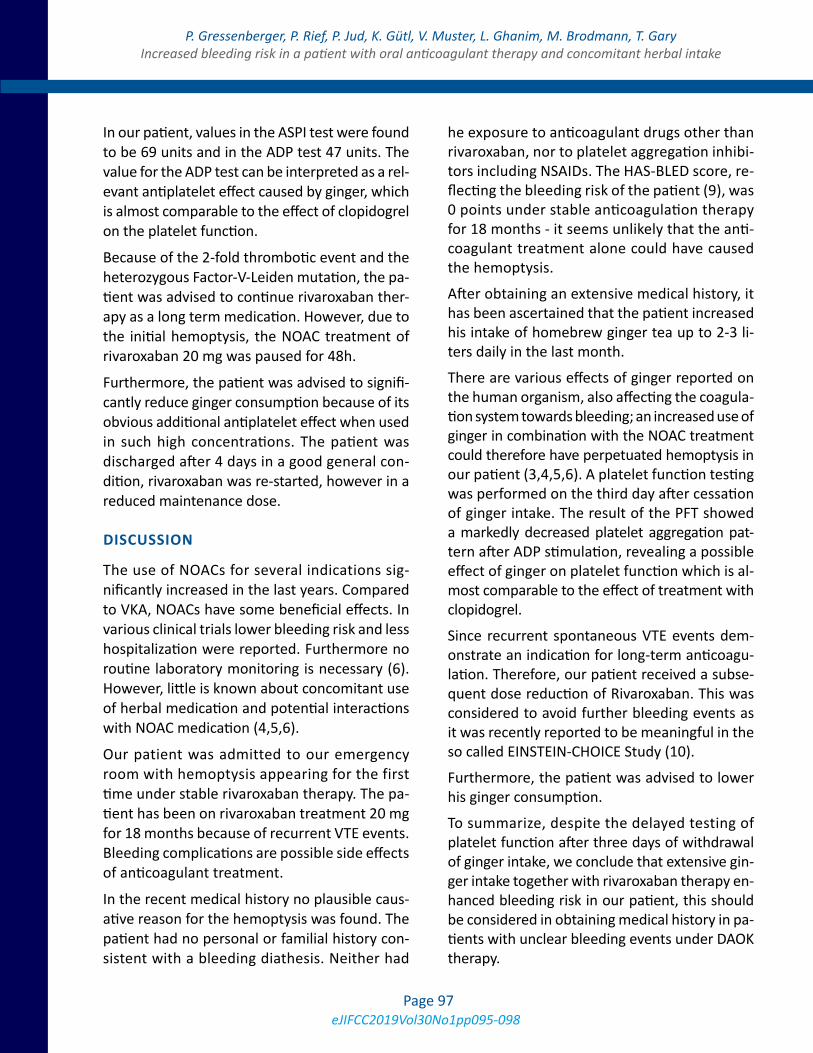
eJIFCC2019Vol30No1pp095-098Page 97
P. Gressenberger, P. Rief, P. Jud, K. Gütl, V. Muster, L. Ghanim, M. Brodmann, T. GaryIncreased bleeding risk in a patient with oral anticoagulant therapy and concomitant herbal intake
In our patient, values in the ASPI test were found to be 69 units and in the ADP test 47 units. The value for the ADP test can be interpreted as a rel-evant antiplatelet effect caused by ginger, which is almost comparable to the effect of clopidogrel on the platelet function.
Because of the 2-fold thrombotic event and the heterozygous Factor-V-Leiden mutation, the pa-tient was advised to continue rivaroxaban ther-apy as a long term medication. However, due to the initial hemoptysis, the NOAC treatment of rivaroxaban 20 mg was paused for 48h.
Furthermore, the patient was advised to signifi-cantly reduce ginger consumption because of its obvious additional antiplatelet effect when used in such high concentrations. The patient was discharged after 4 days in a good general con-dition, rivaroxaban was re-started, however in a reduced maintenance dose.
DISCUSSION
The use of NOACs for several indications sig-nificantly increased in the last years. Compared to VKA, NOACs have some beneficial effects. In various clinical trials lower bleeding risk and less hospitalization were reported. Furthermore no routine laboratory monitoring is necessary (6). However, little is known about concomitant use of herbal medication and potential interactions with NOAC medication (4,5,6).
Our patient was admitted to our emergency room with hemoptysis appearing for the first time under stable rivaroxaban therapy. The pa-tient has been on rivaroxaban treatment 20 mg for 18 months because of recurrent VTE events. Bleeding complications are possible side effects of anticoagulant treatment.
In the recent medical history no plausible caus-ative reason for the hemoptysis was found. The patient had no personal or familial history con-sistent with a bleeding diathesis. Neither had
he exposure to anticoagulant drugs other than rivaroxaban, nor to platelet aggregation inhibi-tors including NSAIDs. The HAS-BLED score, re-flecting the bleeding risk of the patient (9), was 0 points under stable anticoagulation therapy for 18 months - it seems unlikely that the anti-coagulant treatment alone could have caused the hemoptysis.
After obtaining an extensive medical history, it has been ascertained that the patient increased his intake of homebrew ginger tea up to 2-3 li-ters daily in the last month.
There are various effects of ginger reported on the human organism, also affecting the coagula-tion system towards bleeding; an increased use of ginger in combination with the NOAC treatment could therefore have perpetuated hemoptysis in our patient (3,4,5,6). A platelet function testing was performed on the third day after cessation of ginger intake. The result of the PFT showed a markedly decreased platelet aggregation pat-tern after ADP stimulation, revealing a possible effect of ginger on platelet function which is al-most comparable to the effect of treatment with clopidogrel.
Since recurrent spontaneous VTE events dem-onstrate an indication for long-term anticoagu-lation. Therefore, our patient received a subse-quent dose reduction of Rivaroxaban. This was considered to avoid further bleeding events as it was recently reported to be meaningful in the so called EINSTEIN-CHOICE Study (10).
Furthermore, the patient was advised to lower his ginger consumption.
To summarize, despite the delayed testing of platelet function after three days of withdrawal of ginger intake, we conclude that extensive gin-ger intake together with rivaroxaban therapy en-hanced bleeding risk in our patient, this should be considered in obtaining medical history in pa-tients with unclear bleeding events under DAOK therapy.
eJIFCC2019Vol30No1pp095-098Page 98
P. Gressenberger, P. Rief, P. Jud, K. Gütl, V. Muster, L. Ghanim, M. Brodmann, T. GaryIncreased bleeding risk in a patient with oral anticoagulant therapy and concomitant herbal intake
TAKE HOME MESSAGES/LEARNING POINTS
• The use of herbal medicinal products is com-mon among the population. However, little is known about its concomitant use and the potential interactions associated with direct oral anticoagulants.
• Platelet function testing in such situation seems meaningful and may help to support the hypothesis drawn from medical history in patients with unclear bleeding events.
REFERENCES
1. EINSTEIN Investigators. Oral rivaroxaban for symptom-atic venous thromboembolism. N Engl J Med. 2010 Dec 23; 363 (26): 2499-510
2. The Hokusai-VTE Investigators. Edoxaban versus War-farin for the Treatment of Symptomatic Venous Thrombo-embolism. N Engl J Med. 2013 Oct 10; 369 (15): 1406-15
3. Agbabiaka TB, Wider B, Watson LK, Goodman C. Con-current use of prescription drugs and herbal medicinal products in older adults: a systematic review protocol. Drugs Aging. 2017 Dec; 34 (12): 891-905
4. Ahmad B, Rehman MU, Amin I, Arif A, Rasool S, Bhat SA, Afzal I, Hussain I, Bilal S, Mir Mu. A Review on Pharma-
cological Properties of Zingerone (4-(4-Hydroxy-3-metho- xyphenyl)-2-butanone). Scientific World Journal. 2015; 2015: 816364
5. Anti-factor Xa activities of zingerone with anti-platelet aggregation activity.
6. Di Minno A, Frigerio B, Spadarella G, Ravani A, Sansaro D, Amato M, Kitzmiller JP, Pepi M, Tremoli E, Baldassarre D. Old and new oral anticoagulants: Food, herbal medicines and drug interactions. Blood Rev. 2017 Jul; 31(4):193-203
7. Jobski K, Hoffmann F, Herget-Rosenthal S, Dörks M. Oral Anticoagulants in German nursing home residents - Drug use patterns and predictors for treatment choice. Br J Clin Pharmacol. 2017 Nov; 17
8. Sommerauer C, Schlender L, Krause M, Weißbach S, Rieckert A, Martinez YV, Reeves D, Renom-Guiteras A, Kunnamo I, Sönnichsen A. Effectiveness and safety of vi-tamin K antagonists and new anticoagulants in the pre-vention of thromboembolism in atrial fibrillation in older adults - a systematic review of reviews and the develop-ment of recommendations to reduce inappropriate pre-scribing. BMC Geriatr. 2017 Oct 16; 17(Suppl 1): 223
9. Kooiman J, van Hagen N, Iglesias Del Sol A, Planken EV, Lip GY, van der Meer FJ1, Cannegieter SC, Klok FA, Huisman MV. The HAS-BLED Score Identifies Patients with Acute Venous Thromboembolism at High Risk of Major Bleeding Complications during the First Six Months of Anticoagu-lant Treatment. PLoS One. 2015 Apr 23; 10 (4): e0122520
10. Weitz J et al. Rivaroxaban or Aspirin for Extended Treatment of Venous Thromboembolism. N Engl J Med. 2017 Mar 30; 376 (13): 1211-1222
eJIFCC2019Vol30No1pp099-105Page 99
This is a Platinum Open Access Journal distributed under the terms of the Creative Commons Attribution Non-Commercial License which permits unrestricted non-commercial use, distribution, and reproduction in any medium, provided the original work is properly cited.
Unusually low serum alkaline phosphatase activity in a patient with acute on chronic liver failure and hemolysisParul Arora1, Shekhar Singh Jadaun2, Prasenjit Das3, Shalimar2, Sudip K. Datta1
1 Department of Laboratory Medicine, All India Institute of Medical Sciences, New Delhi, India2 Department of Gastroenterology, All India Institute of Medical Sciences, New Delhi, India3 Department of Pathology, All India Institute of Medical Sciences, New Delhi, India
I N F O C A S E R E P O R T
A 28-year-old male with acute on chronic liver failure (ACLF) and hepatic encephalopathy had deranged liv-er function with curiously low level (0-15 IU/L) of se-rum alkaline phosphatase (ALP). Peripheral smear ex-amination suggested hemolytic anemia. The finding of persistent low ALP, after ruling out pre-analytical causes, in ACLF has been reported in Wilson’s disease (WD) with/ without autoimmune hemolytic anemia (AIHA). Definitive evidences of WD were not seen in our case. Positive DCT and histological features sug-gest a diagnosis of autoimmune hepatitis with sec-ondary hemochromatosis and cholangitis. Low ALP might not always be a determinant of bile duct pa-thology in patients of ACLF with AIHA.
Corresponding author:Sudip Kumar DattaDepartment of Laboratory MedicineAll India Institute of Medical SciencesNew Delhi, 110029IndiaPhone: 011-26594629Cell: 9868397278; 9350179698E-mail: [email protected]
Key words:ACLF, autoimmune hepatitis,hemolytic anemia, low ALP,Wilson’s disease

eJIFCC2019Vol30No1pp099-105Page 100
Parul Arora, Shekhar Singh Jadaun, Prasenjit Das, Shalimar, Sudip K. DattaLow serum alkaline phosphatase activity in a patient with acute on chronic liver failure and hemolysis
INTRODUCTION
Acute on chronic liver failure (ACLF) is acute de-terioration of liver function in patients with pre-existing liver disease. The American Association for the Study of Liver Diseases defined ACLF as: “acute deterioration of pre-existing chronic liver disease usually related to a precipitating event and associated with increased mortality at 3 months due to multi-system organ failure” (1). Common causes of ACLF include active alcohol consumption, reactivation of hepatitis B virus infection, superinfection with hepatitis E virus, autoimmune hepatitis flare, sepsis and superim-posed drug or toxic injury.
In our case the patient presented with acute liver failure and hemolytic anemia. However, he was detected with chronic liver disease (CLD) two years back. Most causes of ACLF were ruled out. However, an unusual finding of low serum alkaline phosphatase (ALP) values (<5-15 IU/L) was observed. Possible causes for the same in the setting of ACLF were looked for.
CLINICAL – DIAGNOSTIC CASE
A 28-year-old man presented to the emergency with jaundice for two weeks and progressively increasing abdominal distension. Two days prior to admission he developed malena, decreased urine output and drowsiness. His past records revealed that he was diagnosed with CLD, how-ever the etiology was unknown. He recovered spontaneously during that episode and was as-ymptomatic till the present admission. His rela-tives denied any history of blood transfusion, intravenous drug abuse, tattooing, promiscuity, consumption of alcohol or smoking.
On assessment in casualty, the patient was found to be icteric and hypotensive. His abdo-men was distended; without any guarding or ri-gidity. Neurological examination suggested the presence of grade III hepatic encephalopathy. Kayser–Fleischer ring was not visualized on slit
lamp microscopy. Chest and cardiovascular ex-amination was within normal limits.
On admission he was suspected to be a case of ACLF, which was confirmed in the subsequent two days. His blood investigations revealed: blood urea nitrogen (BUN): 59 mg/dL, serum creatinine: 3 mg/dL, serum total bilirubin: 24.1 mg/dL, direct bilirubin: 17.8 mg/dL, aspartate aminotransferase (AST) levels: 205 IU/L, ala-nine aminotransferase (ALT): 23 IU/L and ALP: 43 IU/L. Blood ammonia level was elevated to 135 µmol/L. Details of the serial liver function are shown in Table 1. It was observed that se-rum ALP values decreased to very low (5-15 IU/L) to even undetectable levels over the next few days.
Prothrombin time, INR and activated partial thromboplastin time were prolonged (Table 1). Hemoglobin and platelet counts were low- 6.4 g/dL and 50,000/mm3 respectively. Leucocytes were normal in count and morphology. Peripheral smear examination was suggestive of hemolytic anemia. Direct Coomb’s test (DCT) was positive and indirect (ICT) was negative.
Serum markers for viral hepatitis (HBsAg, Anti HCV, Total anti-HBcAb, IgM HAV, IgM HEV and HEV RNA) were negative. Autoimmune markers including anti-nuclear antibody, anti–smooth muscle antibody, antibody for liver-kidney mi-crosomal type-1 were negative. Total IgG level was 1590 mg/dL (RI: 840 -1700 mg/dL). Serum copper was 53.5 ug/dL (RI: 70-140 ug/dL) and serum ceruloplasmin 17 mg/dL (RI: 20-60 mg/dL), both marginally on the lower side. 24 hours urine copper estimation could not be done. Urine routine microscopy showed the presence of 12-15 RBC/HPF and 6-8 WBC/HPF. Bile pig-ments were present in urine. However, urine culture was sterile. His esophagogastroscopy showed grade-2 esophageal varices.
The patient was managed with broad-spectrum antibiotics and other supportive measures.
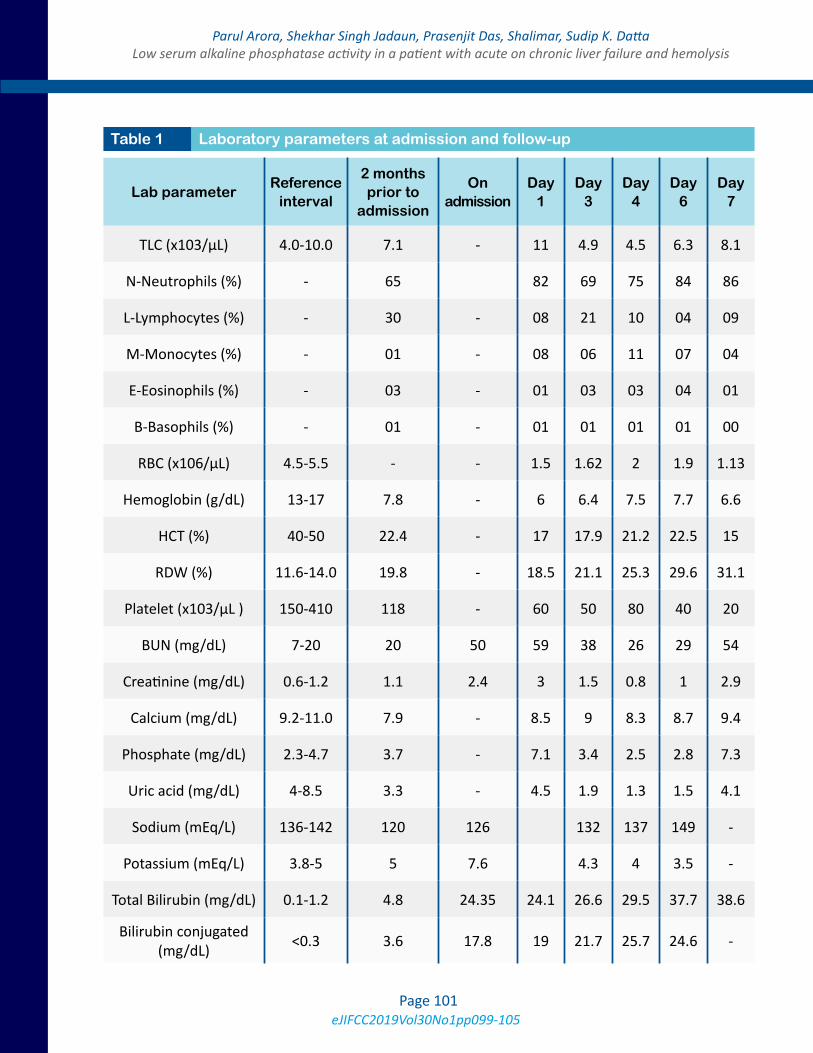
eJIFCC2019Vol30No1pp099-105Page 101
Parul Arora, Shekhar Singh Jadaun, Prasenjit Das, Shalimar, Sudip K. DattaLow serum alkaline phosphatase activity in a patient with acute on chronic liver failure and hemolysis
Lab parameterReference
interval
2 months prior to
admission
On admission
Day 1
Day 3
Day 4
Day 6
Day 7
TLC (x103/μL) 4.0-10.0 7.1 - 11 4.9 4.5 6.3 8.1
N-Neutrophils (%) - 65 82 69 75 84 86
L-Lymphocytes (%) - 30 - 08 21 10 04 09
M-Monocytes (%) - 01 - 08 06 11 07 04
E-Eosinophils (%) - 03 - 01 03 03 04 01
B-Basophils (%) - 01 - 01 01 01 01 00
RBC (x106/μL) 4.5-5.5 - - 1.5 1.62 2 1.9 1.13
Hemoglobin (g/dL) 13-17 7.8 - 6 6.4 7.5 7.7 6.6
HCT (%) 40-50 22.4 - 17 17.9 21.2 22.5 15
RDW (%) 11.6-14.0 19.8 - 18.5 21.1 25.3 29.6 31.1
Platelet (x103/μL ) 150-410 118 - 60 50 80 40 20
BUN (mg/dL) 7-20 20 50 59 38 26 29 54
Creatinine (mg/dL) 0.6-1.2 1.1 2.4 3 1.5 0.8 1 2.9
Calcium (mg/dL) 9.2-11.0 7.9 - 8.5 9 8.3 8.7 9.4
Phosphate (mg/dL) 2.3-4.7 3.7 - 7.1 3.4 2.5 2.8 7.3
Uric acid (mg/dL) 4-8.5 3.3 - 4.5 1.9 1.3 1.5 4.1
Sodium (mEq/L) 136-142 120 126 132 137 149 -
Potassium (mEq/L) 3.8-5 5 7.6 4.3 4 3.5 -
Total Bilirubin (mg/dL) 0.1-1.2 4.8 24.35 24.1 26.6 29.5 37.7 38.6
Bilirubin conjugated (mg/dL) <0.3 3.6 17.8 19 21.7 25.7 24.6 -
Table 1 Laboratory parameters at admission and follow-up
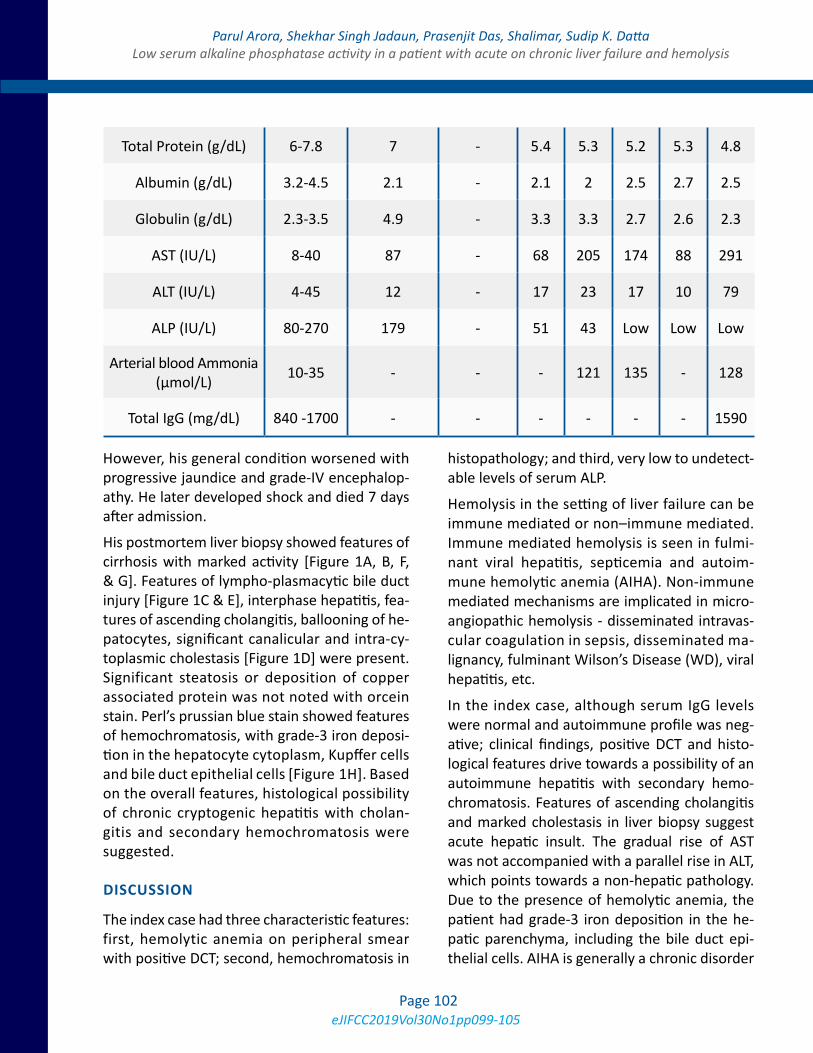
eJIFCC2019Vol30No1pp099-105Page 102
Parul Arora, Shekhar Singh Jadaun, Prasenjit Das, Shalimar, Sudip K. DattaLow serum alkaline phosphatase activity in a patient with acute on chronic liver failure and hemolysis
However, his general condition worsened with progressive jaundice and grade-IV encephalop-athy. He later developed shock and died 7 days after admission.
His postmortem liver biopsy showed features of cirrhosis with marked activity [Figure 1A, B, F, & G]. Features of lympho-plasmacytic bile duct injury [Figure 1C & E], interphase hepatitis, fea-tures of ascending cholangitis, ballooning of he-patocytes, significant canalicular and intra-cy-toplasmic cholestasis [Figure 1D] were present. Significant steatosis or deposition of copper associated protein was not noted with orcein stain. Perl’s prussian blue stain showed features of hemochromatosis, with grade-3 iron deposi-tion in the hepatocyte cytoplasm, Kupffer cells and bile duct epithelial cells [Figure 1H]. Based on the overall features, histological possibility of chronic cryptogenic hepatitis with cholan-gitis and secondary hemochromatosis were suggested.
DISCUSSION
The index case had three characteristic features: first, hemolytic anemia on peripheral smear with positive DCT; second, hemochromatosis in
histopathology; and third, very low to undetect-able levels of serum ALP.
Hemolysis in the setting of liver failure can be immune mediated or non–immune mediated. Immune mediated hemolysis is seen in fulmi-nant viral hepatitis, septicemia and autoim-mune hemolytic anemia (AIHA). Non-immune mediated mechanisms are implicated in micro-angiopathic hemolysis - disseminated intravas-cular coagulation in sepsis, disseminated ma-lignancy, fulminant Wilson’s Disease (WD), viral hepatitis, etc.
In the index case, although serum IgG levels were normal and autoimmune profile was neg-ative; clinical findings, positive DCT and histo-logical features drive towards a possibility of an autoimmune hepatitis with secondary hemo-chromatosis. Features of ascending cholangitis and marked cholestasis in liver biopsy suggest acute hepatic insult. The gradual rise of AST was not accompanied with a parallel rise in ALT, which points towards a non-hepatic pathology. Due to the presence of hemolytic anemia, the patient had grade-3 iron deposition in the he-patic parenchyma, including the bile duct epi-thelial cells. AIHA is generally a chronic disorder
Total Protein (g/dL) 6-7.8 7 - 5.4 5.3 5.2 5.3 4.8
Albumin (g/dL) 3.2-4.5 2.1 - 2.1 2 2.5 2.7 2.5
Globulin (g/dL) 2.3-3.5 4.9 - 3.3 3.3 2.7 2.6 2.3
AST (IU/L) 8-40 87 - 68 205 174 88 291
ALT (IU/L) 4-45 12 - 17 23 17 10 79
ALP (IU/L) 80-270 179 - 51 43 Low Low Low
Arterial blood Ammonia (μmol/L) 10-35 - - - 121 135 - 128
Total IgG (mg/dL) 840 -1700 - - - - - - 1590
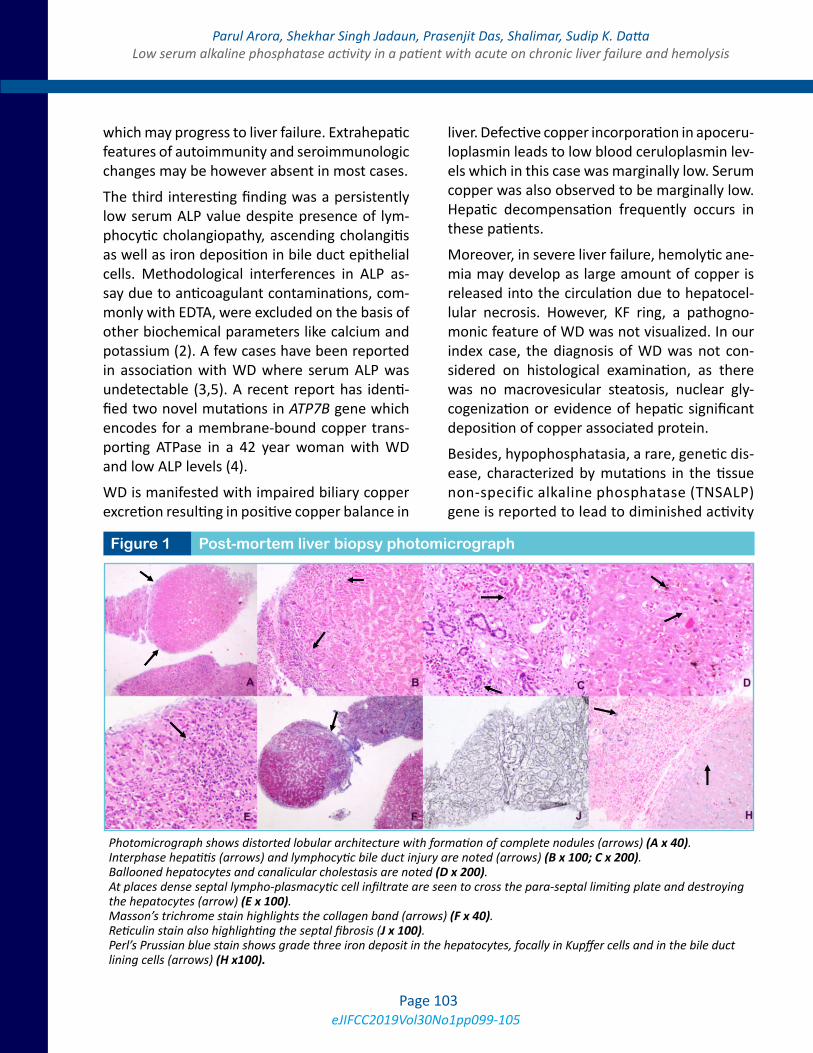
eJIFCC2019Vol30No1pp099-105Page 103
Parul Arora, Shekhar Singh Jadaun, Prasenjit Das, Shalimar, Sudip K. DattaLow serum alkaline phosphatase activity in a patient with acute on chronic liver failure and hemolysis
which may progress to liver failure. Extrahepatic features of autoimmunity and seroimmunologic changes may be however absent in most cases.
The third interesting finding was a persistently low serum ALP value despite presence of lym-phocytic cholangiopathy, ascending cholangitis as well as iron deposition in bile duct epithelial cells. Methodological interferences in ALP as-say due to anticoagulant contaminations, com-monly with EDTA, were excluded on the basis of other biochemical parameters like calcium and potassium (2). A few cases have been reported in association with WD where serum ALP was undetectable (3,5). A recent report has identi-fied two novel mutations in ATP7B gene which encodes for a membrane-bound copper trans-porting ATPase in a 42 year woman with WD and low ALP levels (4).
WD is manifested with impaired biliary copper excretion resulting in positive copper balance in
liver. Defective copper incorporation in apoceru-loplasmin leads to low blood ceruloplasmin lev-els which in this case was marginally low. Serum copper was also observed to be marginally low. Hepatic decompensation frequently occurs in these patients.
Moreover, in severe liver failure, hemolytic ane-mia may develop as large amount of copper is released into the circulation due to hepatocel-lular necrosis. However, KF ring, a pathogno-monic feature of WD was not visualized. In our index case, the diagnosis of WD was not con-sidered on histological examination, as there was no macrovesicular steatosis, nuclear gly-cogenization or evidence of hepatic significant deposition of copper associated protein.
Besides, hypophosphatasia, a rare, genetic dis-ease, characterized by mutations in the tissue non-specific alkaline phosphatase (TNSALP) gene is reported to lead to diminished activity
Figure 1 Post-mortem liver biopsy photomicrograph
Photomicrograph shows distorted lobular architecture with formation of complete nodules (arrows) (A x 40). Interphase hepatitis (arrows) and lymphocytic bile duct injury are noted (arrows) (B x 100; C x 200). Ballooned hepatocytes and canalicular cholestasis are noted (D x 200). At places dense septal lympho-plasmacytic cell infiltrate are seen to cross the para-septal limiting plate and destroying the hepatocytes (arrow) (E x 100). Masson’s trichrome stain highlights the collagen band (arrows) (F x 40). Reticulin stain also highlighting the septal fibrosis (J x 100). Perl’s Prussian blue stain shows grade three iron deposit in the hepatocytes, focally in Kupffer cells and in the bile duct lining cells (arrows) (H x100).
eJIFCC2019Vol30No1pp099-105Page 104
Parul Arora, Shekhar Singh Jadaun, Prasenjit Das, Shalimar, Sudip K. DattaLow serum alkaline phosphatase activity in a patient with acute on chronic liver failure and hemolysis
of the TNSALP enzyme in target tissues. Clinical features include low levels of ALP in serum and bone, osteomalacia and periodontal disease.
Although, this is commonly described in chil-dren, rarely it has also been described in adult-hood, when it is most commonly characterized by poor healing, recurrent metatarsal stress fractures, and bone pain. Our index case did not have any of these manifestations and was safely ruled out for the diagnosis of hypophosphatasia.
Potential interferences from any drugs in the assay of ALP were also ruled out. Drugs that are reported to interfere physiologically or analyt-ically in ALP measurement include ibuprofen, theophylline, cefoxitin, doxycycline, ampho-tericin B, tetracycline, antiepileptics, antico-agulants, lipid-lowering drugs, and inhibitors of bone matrix formation and resorption. Our in-dex patient was managed with broad spectrum antibiotics- Piperacillin with Tazobactam. In ad-dition, he also received Rifaximin, Lactulose and other supportive measures. Piperacillin with Tazobactam is not known to cause lowering of ALP levels, rather may sometimes cause tran-sient increase in its levels.
In summary, peripheral blood and positive DCT of the patient indicate a possible presence of AIHA. On histopathology, autoimmune hepati-tis with secondary hemochromatosis was sug-gested. However, ALP is usually raised in cases of hemochromatosis. Hence, in the index case, whether a persistent low ALP level in the setting of hemochromatosis is caused by a sub-clinical WD or AIHA remains debated.
Two cases with WD with superimposed autoim-mune features have also been reported, how-ever definitive evidences of WD and AIH were observed in those patients (6).
Therefore, it is important to highlight that, in presence of the above two conditions; the se-rum alkaline phosphatase may not be a true de-terminant of any possible bile duct pathology.
LEARNING POINTS
1. Autoimmune hepatitis is an important cause for ACLF and may present without the sero-logical markers for the same.
2. Patients with AIH and WD have been re-ported and may present with overlapping features of both the diseases.
3. Low ALP, although reported with WD may not always be a pointer towards WD; espe-cially in patients with overlapping features.
4. ALP might not always be a true determinant of bile duct pathology.
Abbreviations:
ACLF: Acute on Chronic Liver failure
CLD: Chronic Liver Disease
ALP: Alkaline phosphatase
BUN: Blood urea nitrogen
AST: Aspartate aminotransferase
ALT: Alanine aminotransferase
INR: International normalized ratio
DCT: Direct Coomb’s test
ICT: Indirect Coomb’s test
RI: Reference Interval
AIHA: Autoimmune hemolytic anemia
WD: Wilson’s Disease
REFERENCES
1. Olson JC, Kamath PS. Acute-on-chronic liver failure: con-cept, natural history, and prognosis. Curr Opin Crit Care. 2011 Apr;17(2):165–9.
2. Imafuku Y, Meguro S, Kanno K, Hiraki H, Nemoto U, Hata R, et al. The effect of EDTA contaminated in sera on labo-ratory data. Clin Chim Acta. 2002 Nov;325(1–2):105–11.

eJIFCC2019Vol30No1pp099-105Page 105
Parul Arora, Shekhar Singh Jadaun, Prasenjit Das, Shalimar, Sudip K. DattaLow serum alkaline phosphatase activity in a patient with acute on chronic liver failure and hemolysis
3. Oosthuizen NM. Undetectable serum alkaline phos-phatase activity in a patient with fulminant hepatic failure and hemolytic anemia. Clin Chem. 2011 Mar;57(3):382–5.
4. Chen L, Li X, Zheng Z, Lu X, Lin M, Pan C, et al. A novel ATP7B gene mutation in a liver failure patient with nor-mal ceruloplasmin and low serum alkaline phosphatase. Gene. 2014 Mar 15;538(1):204–6.
5. Shaver WA, Bhatt H, Combes B. Low serum alkaline phosphatase activity in Wilson’s disease. Hepatol Baltim Md. 1986 Oct;6(5):859–63.
6. Milkiewicz P, Saksena S, Hubscher SG, Elias E. Wilson’s disease with superimposed autoimmune features: report of two cases and review. J Gastroenterol Hepatol. 2000 May;15(5):570–4.
Editor-in-chiefJános KappelmayerDepartment of Laboratory Medicine, University of Debrecen, Hungary
Assistant Editor Case Editor Harjit Pal Bhattoa Reinhard B. RaggamDepartment of Laboratory Medicine Department of Internal Medicine University of Debrecen, Hungary Division of Angiology, University of Graz, Austria
Editorial BoardKhosrow Adeli, The Hospital for Sick Children, University of Toronto, Canada Borut Božič, University Medical Center, Lubljana, SloveniaEdgard Delvin, CHU Sainte-Justine Research Center, Montréal, Québec, CanadaNilda E. Fink, Universidad Nacional de La Plata, ArgentinaRonda Greaves, School of Health and Biomedical Sciences, RMIT University, Victoria, AustraliaMike Hallworth, Shrewsbury, United KingdomAndrea R. Horvath, Prince of Wales Hospital and School of Medical Sciences, University of New South Wales, Sydney, AustraliaEllis Jacobs, Abbott, Orlando, FL, USAAllan S. Jaffe, Mayo Clinic, Rochester, USA Bruce Jordan, Roche Diagnostics, Rotkreuz, SwitzerlandGábor L. Kovács, University of Pécs, HungaryEvelyn Koay, National University, SingaporeTamas Kőszegi, University of Pécs, HungaryJanja Marc, University of Ljubljana, SloveniaGary Myers, Joint Committee for Traceability in Laboratory Medicine, USATomris Ozben, Akdeniz University, Antalya, TurkeyMaria D. Pasic, Laboratory Medicine and Pathobiology, University of Toronto, CanadaMaria del C. Pasquel Carrera, College of Chemists, Biochemists and Pharmacists, Pichincha, EcuadorOliver Racz, University of Kosice, SlovakiaRosa Sierra Amor, Laboratorio Laquims, Veracruz, MexicoSanja Stankovic, Institute of Medical Biochemistry, Clinical Center of Serbia, Belgrade, SerbiaDanyal Syed, Ryancenter, New York, USAGrazyna Sypniewska, Collegium Medicum, NC University, Bydgoszcz, PolandPeter Vervaart, LabMed Consulting, AustraliaStacy E. Walz, Arkansas State University, USA
Publisher: IFCC Communications and Publications Division (IFCC-CPD)
Copyright © 2019 IFCC. All rights reserved.
The eJIFCC is a member of the Committee on Publication Ethics (COPE).
The eJIFCC (Journal of the International Federation of Clinical Chemistry) is an electronic journal with frequent updates on its home page. Our articles, debates, reviews and editorials are addressed to clinical laboratorians. Besides offering original scientific thought in our featured columns, we provide pointers to quality resources on the World Wide Web.
This is a Platinum Open Access Journal distributed under the terms of the Creative Commons Attribution Non-Commercial License which permits unrestricted non-commercial use, distribution, and reproduction in any medium, provided the original work is properly cited.
Produced by: www.insoftdigital.com
Published by: www.ifcc.org