the investment climate and the firm - the world bank€¦ · the investment climate and the firm...
TRANSCRIPT

IPM 31 Q
POLICY RESEARCH WORKING PAPER 3 003
The Investment Climate and the Firm
Firm-Level Evidence from China
Mary Hallward-Driemeier
Scott Wallsten
Lixin ColinXu
The World BankDevelopment Research Group HInvestment ClimateMarch 2003
Pub
lic D
iscl
osur
e A
utho
rized
Pub
lic D
iscl
osur
e A
utho
rized
Pub
lic D
iscl
osur
e A
utho
rized
Pub
lic D
iscl
osur
e A
utho
rized
Pub
lic D
iscl
osur
e A
utho
rized
Pub
lic D
iscl
osur
e A
utho
rized
Pub
lic D
iscl
osur
e A
utho
rized
Pub
lic D
iscl
osur
e A
utho
rized

POLICY RESEARCH WORKING PAPER 3003
Abstract
The importance of a country's "investment climate" for level data for rigorous analysis of the investment climate,economic growth has recently received much attention. and investigate empirically the effects of thisHallward-Driemeier, Wallsten, and Xu address the comprehensive set of measures on firm performance ingeneral lack of appropriate data for measuring the China. Overall, their firm-level analysis reveals that theinvestment climate and its effects. The authors use a new main determinants of firm performance in China aresurvey of 1,500 Chinese enterprises in five cities to more international integration, entry and exit, labor marketprecisely define and measure components of the issues, technology use, and access to external finance.investment climate, highlight the importance of firm-
This paper-a product of Investment Climate, Development Research Group-is part of a larger effort in the group tounderstand the investment climate using firm-level datasets. Copies of the paper are available free from the World Bank,1818 H Street NW, Washington, DC 20433. Please contact Paulna Sintim-Aboagye, room MC3-422, telephone 202-473-7644, fax 202-522-1155, email address [email protected]. Policy Research Working Papers are also postedon the Web at http://econ.worldbank.org. The authors may be contacted at [email protected],[email protected], or [email protected]. March 2003. (49 pages)
The Policy Research Working Paper Series disseminates the findings of work in progress to encourage the exchange of ideas aboutdevelopment issues. An objective of the senes is to get the findings out quickly, even if the presentations are less than fully polished. The
papers cany the names of the authors and should be cited accordingly. The fi,idings, interpretations, and conclusions expressed in thispaper are entirely those of the authors. They do not necessarily represent the view of the World Bank, its Executive Directors, or thecountnes they represent.
Produced by the Research Advisory Staff

The Investment Climate and the Firm:Firm-Level Evidence from China
Mary Hallward-Driemeier, Scott Wallsten, Lixin Colin Xu*
'We are grateful to David Dollar, Shuilin Wang, Anqing Shi, Yang Yumin, Li Hui, and Lei Pingjing for their helpin making this research possible. The dataset was collected under the sponsorship of DFID of United Kingdom.


In recent years, policy makers and multinational organizations have focused increasingly
on the importance of a sound "investment climate" in developing countries for economic growth
(Stern, 2002b). Focusing on investment used to mean advocating increased investment
quantities under the assumption that a financing gap was a barrier to development. Few accept
this simplistic view anymore, and, indeed, recent research demonstrates surprisingly little
correlation between investment levels and growth rates, at least in the short run (Easterly 1999).
Instead, a productive "investment climate" can be broadly thought of as an environment where
governance and institutions support entrepreneurship and well-functioning markets in order to
help generate growth and development.
It is difficult to define "investrnent climate" precisely, but Stem (2002b) notes that it is
the "policy, institutional, and behavioral environment, both present and expected, that influences
the returns, and risks, associated with investment." In general, this includes three broad
categories. The first includes macroeconomic or country-level matters, such as fiscal, monetary,
exchange rate policies, and political stability. The second includes governance and institutions,
including bureaucratic harassment and the financial and legal systems. The final category
includes infrastructure necessary for productive investment, including transportation, electricity,
and communications.'
While these categories seem straightforward, identifying their effects is not easy. In
particular, the second two categories pose special difficulties. In addition to measurement
problems (e.g., eliciting truthful responses about bribery and corruption), another issue is that
many of these factors affect individual firms and may not show up in useful ways in aggregate
macroeconomic statistics. For example, it is often noted that India and China have grown at
dramatically different rates over the past decade so that while they had similar per capita
incomes in 1990, the average Chinese citizen now has an income 50 percent higher than the
average Indian citizen. Moreover, as this paper will demonstrate, firms grow in quite different
pace in the five Chinese cities even though they face similar macro and national political
environments. Uncovering the factors underlying such large differences in growth rates requires
microeconomic, as opposed to macroeconomic, data. Unfortunately, there is often very little
' There are several ways one might group various investment climate components. In this paper we generallyfollow the typology laid out by Stem (2002a; Stem 2002b).
1

firm-level data in developing countries. Indeed, while there is a good deal of country-level work
on many of these issues, firm-level analyses are only now beginning to emerge.
This paper has three main goals. First, it attempts to build a comprehensive empirical
framework around the "investment climate" typology with firn-level data. That is, there has
been much discussion of the investment climate, but as yet few comprehensive measures of it.
Second, it demonstrates the necessity of having data at the finn-level, as opposed to more
aggregated levels, to capture the impact of the investment climate on performance. Country-
level, cross-country, empirical analyses implicitly assume that each investment climate measure
has the same impact on each country when controlling for certain country characteristics. Such
analyses are useful in that they can tell us what factors affect aggregated macro indicators on
average. However, economies are heterogeneous and such aggregated analyses cannot tell us
which factors may be important within different countries. Firm level data allows us to assess
factors that comprise the investment climate on firms themselves. Finally, we use a new
enterprise-level dataset covering 1500 Chinese enterprises in five cities to illustrate the above
points, investigate the effects of various investment climate measures on firm performance, and
highlight areas in which reforms may most improve firm performance in China.
Strong firm performance can itself be measured on different dimensions. Here, we
address four: sales growth, investment rate, productivity and employment growth. After
discussing some investment climate measures, the strategy of this paper is to analyze the data at
increasingly disaggregated levels. We first present some aggregate city-level data. While such
city-level aggregations already represent an improvement over country-level analyses, it will be
clear that the aggregated numbers hide a great deal of variation at the firm level. We then move
to an enterprise-level analysis to examine in more detail how the investment climate affects firm
performance. The enterprise-level analysis itself has two components: first, we estimate the
effects of city-industry investment climate variables on firm performance controlling for firm
characteristics, and second, we estimate the effects of the firm-level variation in the investment
climate itself.
At the most general level, the empirical results suggest that the biggest impacts on firm
performance come from international integration, entry and exit, labor market issues, finance,
and technology. Some infrastructure problems common in other developing countries such as
2
losses from electricity outages appeared to have little impact on Chinese firms, on average. The
analysis also finds that controlling for firm characteristics and city and sector dummies:
* More foreign ownership is positively associated with sales, investment, and employment
growth;
* Barriers to entry and exit are associated with lower productivity and sales and
employment growth, while younger firms consistently perform better on all measures;
* Access to finance is correlated with higher sales growth, investment, and productivity;
* Increased labor market flexibility is associated with higher investment and productivity;
* Higher staff quality is associated with higher sales, investment, and productivity, and
investment in worker training is correlated with faster sales growth and investment rate
and possibly productivity;
* Access to information technologies and research and development are correlated with
better outcomes;
While the results should be interpreted with caution - we discuss a number of caveats
below - they highlight the importance and necessity of firm-level data in gathering information
below country and even aggregate sub-national levels. In the sections below we first discuss our
data and the survey that generated it. Second, we discuss in some detail various components of
the investment climate and what the literature says about them so far. In this context we also
present results from the survey aggregated up to the city level. These results show large
differences in many measures across cities, with Shanghai and Guangzhou generally the leader,
Tianjin and Chengdu the laggard. In some cases they also highlight the difficulty surveys face in
gathering truthful information about sensitive issues. Third, we move to the firm-level analysis,
which shows in more detail how these measures affect firm performance. Finally, using the
firm-level results we assess the quantitative importance of various investment climate aspects.
China is a particularly interesting country in which to study the impact of differing
investment climates across regions. Overall, China's growth performance has been impressive,
but economic conditions vary across regions, with eastern and coastal areas generally having
developed more quickly and attracted more investors than have mid- and western areas. Two
broad factors help explain this phenomenon. The first is differences in natural endowments, such
as access to ports. The second is the nature of decentralization of the Chinese economy and
3

policy making. For years, regional governments have been given different degrees of discretion
in setting economic policy. Thus, some experimental provinces and cities were given greater
freedom to choose more liberal policies to attract foreign capital. For instance, Guangdong has
been at the forefront of pro-market reforms. Furthermore, the central and regional tax
arrangements were negotiated province by province, giving regional govemments different
incentives for economic performance (Gordon and Li 2002). These differences have also given
rise to strong regional protectionism (Poncet 2002), as carefully documented by the State
Development Planning Commission (2000). Together, the differences in initial endowments,
regional discretion in policy making, tax arrangements, as well as leadership tumover pattems
have led to strong regional variations in the investment climate; differences that will be exploited
in the analysis presented here.2 To the extent that sub-national level analysis of investment
climate is particularly important in countries that are large, decentralized and feature local
discretion and non-integrated markets, China is an excellent country in which to conduct such an
analysis.
Data and Investment Climate Measures
A good deal of work has by now gone into measuring aspects of the investment climate.
These include, for example, measures of investment risks (the International Country Risk Guide
from the PRS Group), transparency (Transparency International), competitiveness (The Global
Competitiveness Report from the World Economic Forum), governance (e.g., in Kaufmann, et al.
1999; 2002), and regulatory burdens (Djankov, et al. 2002). Each of these indices has proven
quite useful and informative. One notable feature, however, is that they are all at the country
level. That is, each country receives one score for every indicator. Such indicators have limited
potential in pinpointing obstacles to firm productivity and investment and are thus of limited use
in contributing to specific policy advice.
More detailed analysis requires data at the firm, rather than the country, level. In order to
uncover the effects of the investment climate on individual firms, the World Bank is conducting
firm-level surveys in a number of developing and transition economies. An earlier World Bank
initiative, the World Business Environment Survey (WBES), assessed manager's opinions on
2 In this study the five regions included are among some of the stronger performers so that the differences would be
4

obstacles their firms faced. The interest it generated in using micro-data to analyze areas for
reform helped stimulate the larger effort to collect more quantitative information that could allow
for more rigorous assessments, larger sample sizes that could allow for sub-national inferences to
be drawn, and means for measuring how the obstacles directly affected firm performance. That
effort became the investment climate survey work, which is collecting detailed firm-level data in
more than 20 countries.
In China, the investment climate (IC) survey was undertaken in collaboration with the
Enterprise Survey Organization of the Chinese National Bureau of Statistics. The survey
included 1500 firms-300 from each of five cities surveyed-and ten industries. The cities
include Beijing, Chengdu, Guangzhou, Shaghai, and Tianjin. 998 firms are in manufacturing
sectors while 502 are in services. Table 1 lists the specific sectors and the number of firms
surveyed in each. The survey aimed at being as comprehensive as possible, collecting
information on, for example, inputs and outputs, suppliers and customers, finances, interactions
with the government, labor market issues, technology, infrastructure, and corruption. Moreover,
rather than just asking managers for their opinions on certain issues, the survey collected factual
information, providing more objective, quantitative measures of the investment climate. Thus,
for example, rather than asking managers to gauge on a scale of I to 6 the quality of the power
supply as an obstacle to conducting business, they report the number of outages and the value of
the production lost due to inconsistencies in the power supply.
The investment climate is comprised of many factors, as discussed above. These include
sound and stable macroeconomic policies, which are not our focus in this paper as those are truly
macro, rather than micro, level indicators and as such will not vary across our sample.3 We can
narrow the categories beyond the general ones listed above to include the extent of intemational
integration; private sector participation; entry, exit, and other administrative barriers, labor
market flexibility, physical infrastructure, skills and technology endowment, and functioning of
financial markets.
International Integration
even starker should less industrialized or integrated regions be included in the comparison.
5
A good deal of research suggests that countries that are more integrated into the global
economy grow more quickly (see, for example, Maloney 2001; Sachs and Warner 1995).
Integration and openness can take the form of import competition, production intended for
export, foreign direct investment, and foreign ownership. Integration can boost productivity by
increasing the degree of competition and forcing producers to be more efficient and more
innovative. Integration also encourages the flow of ideas and managerial know-how to domestic
firms. Studies that look at firm responses to reduced trade tariffs document a resulting
improvement in productivity, with those facing import competition being the most likely to
invest as a result of the policy change (Levinsohn 1993; Pavcnik 2000). Improved access to
inputs and capital equipment can boost productivity, and the prospect of serving larger markets
through exports can improve scale economies and affect firms' decisions regarding investment,
training, technology and the quality of inputs -- all steps associated with higher productivity
(Hallward-Dreimeier, et al. 2002).
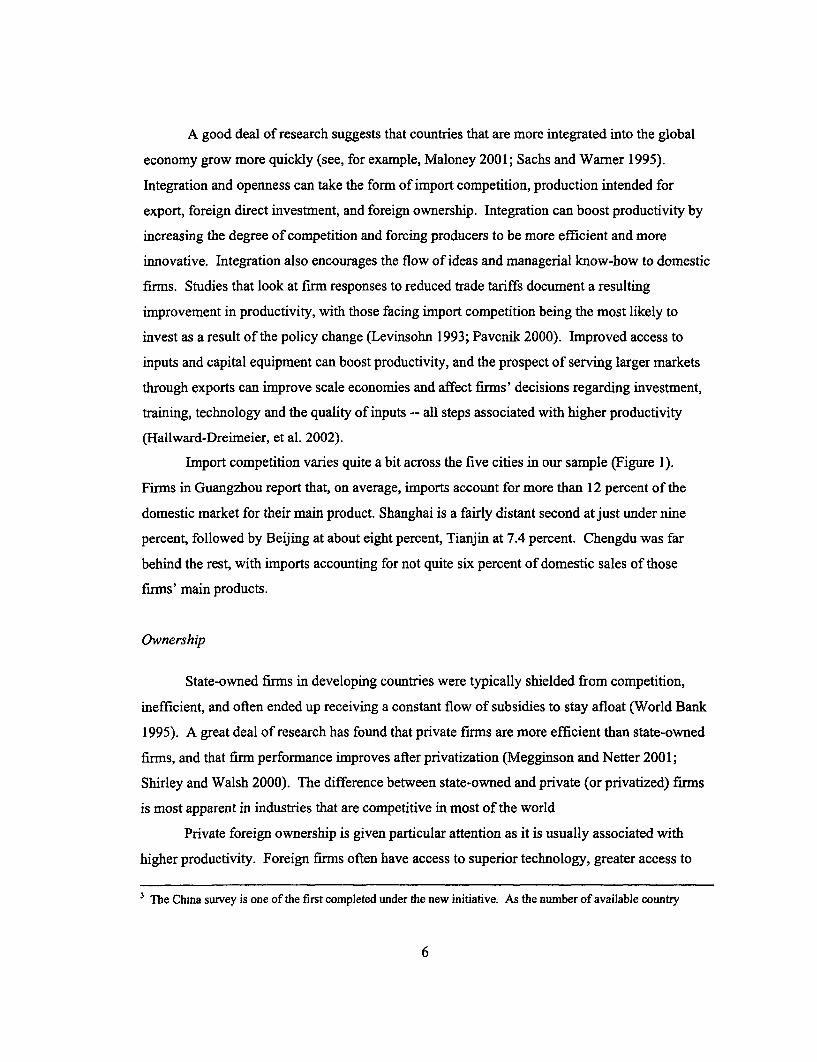
Import competition varies quite a bit across the five cities in our sample (Figure 1).
Finns in Guangzhou report that, on average, imports account for more than 12 percent of the
domestic market for their main product. Shanghai is a fairly distant second at just under nine
percent, followed by Beijing at about eight percent, Tianjin at 7.4 percent. Chengdu was far
behind the rest, with imports accounting for not quite six percent of domestic sales of those
firms' main products.
Ownership
State-owned firms in developing countries were typically shielded from competition,
inefficient, and often ended up receiving a constant flow of subsidies to stay afloat (World Bank
1995). A great deal of research has found that private firms are more efficient than state-owned
firms, and that firm performance improves after privatization (Megginson and Netter 2001;
Shirley and Walsh 2000). The difference between state-owned and private (or privatized) firms
is most apparent in industries that are competitive in most of the world
Private foreign ownership is given particular attention as it is usually associated with
higher productivity. Foreign firmns often have access to superior technology, greater access to
3The China survey is one of the first completed under the new initiative. As the number of available country
6

export markets, and new management techniques. The foreign firms themselves may be more
productive, and the possibility of spillovers through linkages and demonstration effects raises the
possibility that the presence of foreign firms could benefit their suppliers and even their
competitors. Finally, foreign owners tend to be large shareholders, who can internalize the costs
of monitoring and tend to yield greater efforts in monitoring (Shleifer and Vishney, 1985). As a
result, the CEO works harder, and firm performance improves. (See Saggi (2002) for an
overview of the literature).
Figure 2 shows the share of foreign and state ownership of the firrns in our sample by
city. Government (including national, state/provincial, local/municipal, and others including
cooperatives and collective enterprises) on average owned 22% of firms, and foreign investors
21%. This average, however, hides large variation across the cities. The figure shows that
Guanzhou has the lowest share of government ownership and the highest share of foreign
ownership. At the other extreme, Chengdu has the highest share of government ownership (at
around 30 percent) and the lowest share of foreign ownership (at around five percent-one-
seventh of Guangzhou's foreign ownership level).
Entry and Exit
The ease of firm entry and exit is an important deterninant of productivity, investment,
and entrepreneurship (e.g., Lansbury and Mayes 1996). Relatively easy entry and exit allows
poorly performing firms to leave the market and dynamic new ones to enter. Unfortunately,
many developing and transition governments fail to recognize that firm births and deaths are an
inevitable corollary of entrepreneurial risk-taking, and instead erect a maze of administrative
obstacles to starting, operating, and closing firms.
Entrepreneurship, especially, is an important contributor to economic growth and welfare
improvements in transition and developing countries. New firms "have usually been the fastest-
growing segment in transition countries" (McMillan and Woodruff 2002). The scale and effects
of entry can be impressive-Deng Xiaoping expressed his surprise that "all sorts of enterprises
boomed in the countryside, as if a strange army appeared suddenly from nowhere" less than a
datasets grows, the role of different macroeconomic policies can be examined in cross-country comparisons.
7

decade after the first reforms in China in 1978 (Zhao 1996 as quoted in McMillan and Woodruff
2002).
A growing body of literature documents the difficulty entrepreneurs face in establishing
firms in developing countries (e.g., Djankov, et al. 2002; Emery, et al. 2000; Friedman, et al.
2000). Djankov, et al. (2002) compiled data on entry regulations in 85 countries, and discovered
enormous variation in the number of procedures required to start firms across countries, ranging
from a low of two in Canada, to as many as 21 in the Dominican Republic (with Bolivia and
Russia a close second at 20). The time required to establish a firm ranged from two to 152
business days (in Madagascar). These procedures can be extremely costly to the economy-the
cost of official procedures (that is, not including bribes) for setting up a new business was 266
percent of per capita income in Bolivia. They find that stricter regulation of entry is correlated
with more corruption and a larger informal economy. Likewise, Emery et al. (2000) found that
in Africa, "when added together, this whole maze of often duplicative, complex, and non-
transparent procedures can mean delays of up to two years to get investments approved and
operational."
One of the difficulties with surveys done over a relatively short period of time is that it is
not possible to measure entry and exit. Moreover, there is a serious truncation problem since
firms that have exited are, tautologically, no longer around to be surveyed. Nonetheless, two
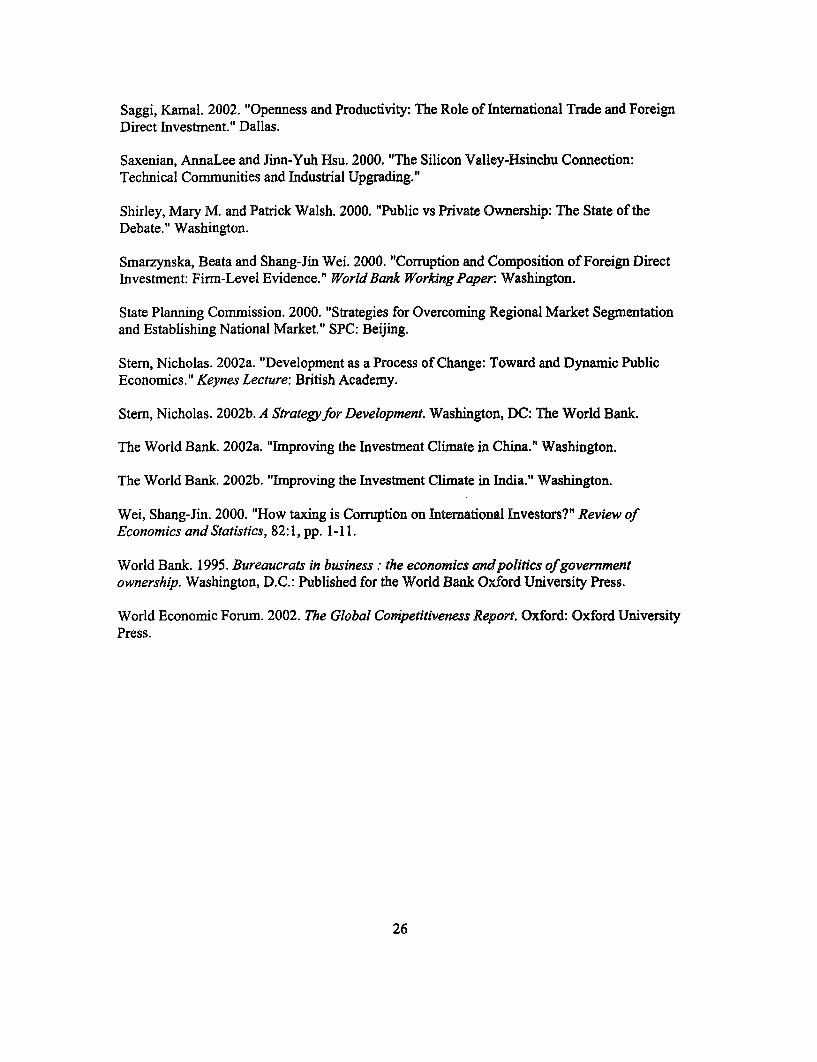
questions in the China survey are potential proxies for entry and exit: excess capacity and the
share of a firm's costs used to subcontract other firms (Figure 3).4
The first measure of entry and exit barriers is excess capacity. Firms often operate with
some excess capacity given adjustment costs and lumpiness of certain investments. Nonetheless,
very high levels of excess capacity can indicate that unproductive firms are not exiting the
market, simultaneously blocking entry by new finns. In the survey, manufacturing firms were
asked to provide their capacity utilization from 1997-2000, which, inversely, yields excess
capacity. The figure reveals that firms in Chengdu have the highest level of excess capacity,
while Guangzhou and Shanghai have the lowest.
4 One additional possible measure of entry and exit is market share, which the survey also collects. The problemwith this indicator is that it is very difficult to interpret. Increased concentration (as indicated in higher market sharefor a give firm) may indicate a lack of competition. On the other hand, productive and efficient firns are also likelyto increase their market share and thus industry concentration. A great deal of literature on this question was rarelyable to reach consensus on which effect is likely to dominate (Bresnahan 1989).
8

The second measure is the share of the firm's cost used for subcontracting.
Subcontracting may be indicative of entry and exit barriers in two ways: in a more flexible
market any given firm may have less reason to keep all activities in-house, while the availability
of subcontractors could indicate ease of entry and extent of firm specialization. In this case
Figure 3 shows that Shanghai has the highest level of subcontracting, while Chengdu has the
lowest.
Regulatory and Administrative Barriers to Firm Operation
In addition to the rather large steps of opening or closing a business, firms also deal with
regulatory and administrative issues that affect day-to-day operations. Friedman, et al. (2000)
compile indices of taxation levels and "over-regulation" (essentially, indices of the business
environment) of firms in 69 countries. While they find no evidence that higher tax rates drive
firms underground, "...every available measure of over-regulation is significantly correlated
with the share of the unofficial economy and the sign of the relationship is unambiguous: more
over-regulation is correlated with a larger unofficial economy" (Friedman, et al. 2000). In other
words, while higher tax rates did not seem to drive away investors, the myriad array of obstacles
to starting and running a business do.
Many of these barriers are also associated with corruption, as they often involve
payments to inspectors who visit the firm or to officials who grant operating permits. Corruption
comes in other forms as well. When infrastructure is poor, bribes are often required to get
telephone or electricity connections. Corruption can easily deter foreign and domestic investors.
Recent empirical research confirms that measures of corruption are significantly and negatively
related to FDI inflows (e.g., Smarzynska and Wei 2000; Wei 2000).5
The survey makes several attempts to uncover information about administrative
hassles and corruption. As one might expect, questions on these topics are the ones firms are
5This discussion should not be interpreted as implying that regulations in developing countries are only onerous andunnecessary. On the contrary, many regulations and regulatory agencies can be important for mitigating marketfailures (e.g,., environmental problems), protecting consumers (e.g., against firms that can exercise market power),and ensuring safe working conditions. The issue is that regulations in developing countries tend to be more complexand bureaucratic than necessary, are associated with corruption, and often are not intended to correct market failuresor protect consumers. Indeed, Djankov, et al. (2002) find that more regulations are generally not associated withbetter societal outcomes in developing countries.
9

least likely to answer, and most likely to not respond truthfully when they do answer (see
Recanatini, et al. 2000 for a survey of the survey literature).
While few firms answered direct questions about side payments and bribes, many more
firms answered indirect questions about red tape, bureaucratic hassle, and the potential need to
pay bribes. Managers were asked how much time they spend with government officials dealing
with business regulations. Firms also provided the number of days in a year that various
inspectors visit their facilities. The results are reported in Figure 4. The reported numbers were
somewhat surprising: managers in Beijing report spending the largest share of their time dealing
with regulatory issues, while firms in Guanzhou receive the most frequent visitations from
various government agency inspectors. Chengdu appears to have the least government
interference of the five cities. However, two sets of possibilities may explain these results. First,
government interference may be lower in Chengdu simply because finrs invest less and take
fewer risks, thus submitting fewer permit applications that bring government inspections.
Second, and related, inspectors may be more likely to harass growing and more profitable firms,
since there are more rents to extract from them.
However, another statistic sheds more light on government interference across cities.
Figure 5 shows the share of firms refusing to disclose the time managers spend dealing with
regulations. Firms in Chengdu were three times as likely to refuse to respond to these questions
as in any other city.6 Large refusal rates may indicate fear of consequences of responding to the
question, indicating especially severe problems - particularly when these firms were willing to
provide information on other virtually all other topics.
Regulations that have particularly strong impact on firms are those covering the labor
market. Restrictions on firing, hiring seasonal or contract workers, and provision of certain
benefits can affect firm productivity as it affects a firm's ability to adjust production to demand.
Moreover, while restrictions on firing may benefit employees already hired (as long as the finn
remains in business), they can end up as obstacles to growth by creating an incentive for firms to
not hire additional permanent labor. In the face of such constraints, firms may seek to use
temporary labor rather than new permanent workers. Non-permanent workers allow firms
6 The share of firms that refuse to respond in Chengdu increases to 40 percent if we assume that a response of zerois equivalent to reftising to answer. The differences in response rates to the question of inspections was much lessstriking, so in the analysis we focus on the share of firms that were willing to respond to questions of interactionswith officials and with the number of inspections.
10

flexibility to adjust to changing demand conditions. Figure 6 shows the average share of
employment that is non-permanent by city. Chengdu has the smallest share of temporary
workers at around 12 percent, while Guanzhou has the largest at 21 percent.
Quality and Availability of Physical and Technological Infrastructure
The quality and availability of infrastructure, including transportation, electricity, and
communications, can have large impacts on firm productivity and growth potential, as well as on
the likelihood that new firms will locate in an area. Indeed, much research has linked these to
economic growth in developing countries (e.g., Canning 1999; Canning and Bennathan 2000;
Easterly and Rebelo 1993).7 China's physical infrastructure has undergone rapid improvements
in the last decade. Compared to India, for example, power outages are rare and waits for phone
lines (or mobile phones) practically nonexistent. Moreover, improvements in those areas
continue (The World Bank 2002a).
Firms' access to information and computing technologies (ICTs) and their use may affect
productivity and economic growth. Clarke (2002), for example, using enterprise-level data in
Eastern European transition economies, finds that even controlling for endogeneity, firms that
have Intemet access are more likely to export than firms that do not.8 Bhavani (2002) finds that
use of technology is beneficial for firms in the Indian auto components industry. Moreover,
ICTs-or, more accurately, involvement in ICT industries-have also been important in spurring
regional economic growth in places such as Taiwan and Bangalore (Arora, et al. 200 1; Athreye
2002; Saxenian and Hsu 2000). To compare the use of ICTs across cities in our sample, we
construct a principal components index that consists of the share of a firm's employees that use
computers, the number of telephones per employee, and the share of employees that use the
Intemet in their jobs. Figure 7 suggests that firms in Shanghai are the most ITC intensive, while
firms in Chengdu are the least.
7 It is not always clear, however, when public investment in infrastructure leads to economic growth. Under someconditions it may have large positive effects, under other conditions it crowds out private investment, and underother conditions-often when the investment was done for political reasons-has no effect at all.8 In a complementary paper, Clarke (2001) fnds that foreign-owned firms are more likely to have Intemet access.Moreover, he found evidence of spillovers from this access, with FDI increasing Internet access among domesticfirms other than firm receiving the FDI.

Access to finance
Access to external finance can also affect growth and productivity. Businesses will
invest in projects where the expected benefits exceed the costs. Efficient investment, however,
can happen only when businesses do not face credit constraints unrelated to their own
performance. Indeed, a great deal of research demonstrates the importance of well-developed
financial markets for economic growth (see Caprio, et al. 2001 for an extensive summary). In
general, countries with deeper financial systems tend to grow faster than countries with more
shallow ones. Relatively few firms in China have access to formal finance than in other Asian
countries (The World Bank 2002b). Approximately half of the firms in our sample have neither
a bank loan or a loan from any other financial institution, and on average only about 20 percent
of firms' working capital comes from bank loans.
To better measure firm access to external finance we construct a principal components
index of formal capital use. The index is comprised of whether a firm has a bank loan, the
number of banks a firm uses, whether the firm has an overdraft facility or line of credit, the share
of loans denominated in a foreign currency, and the share of inputs the firm buys on credit from
its suppliers. A disadvantage of this index is that by using it we cannot tease out different effects
of different types of finance. On the other hand, the index has certain advantages. It captures
not just the use of formal finance, but also the breadth of financial vehicles available to the firm.
As a result, this helps us partly avoid the well-known problem of Chinese state-owned banks
continuously providing loans to money-losing state-owned enterprises. This phenomenon could
result in measures of a firm's ties to banks indicating poor performance. We believe that our
index should be a good measure of both the depth and breadth of finance alternatives available to
the firm. Figure 8 shows that, according to this index, Shaghai has the best access to external
finance, Guangzhou second best, while Tianjin the worst.
Empirical Analysis
The city averages presented above provide some interesting comparisons, but still do not
allow us to investigate the effects of particular investment clirnate measures on fuim
performance. This section attempts to more rigorously evaluate the effects. We use a simple
reduced-form regression analysis, estimating several versions of equation (1).
12

(1) y,. = j6o + 61 *(IC indicators) + 82 Z + a, + as + Ei
The dependent variable is firm performance, for which we use four measures: sales
growth, employment growth, investment rate, and total factor productivity (TFP).9 Z is a vector
of firm-level control variables likely to influence firm performance. These include initial sales,
employment, the firm's age, and level of fixed assets in some specifications. We also control for
city (ao) and sector (a) fixed effects. IC indicators include our investment climate measures,
which relate to the discussion above. More specifically, they include share of foreign and
domestic ownership, the share of output produced for export, the share of imports for the
domestic market in the firm's main product line, excess capacity, the share of costs
subcontracted, share of labor that is nonpermanent, a staff quality index, the share of labor that
receives formal training from the firm, a finance index, a research and development intensity
index, an information and communication technology (ICT) index, the share of output lost as a
result of power outages, the share of output lost through theft, the time (in days) spent dealing
with government inspectors, and whether firms refuse to answer questions about senior
management time with inspectors.
One of the difficult conceptual problems with the analysis is determining how exactly
each investment climate factor is likely to affect the firm. For example, a firm may delay
investments if it has substantial excess capacity. However, the total excess production capacity
in a particular industry or market is also likely to influence a firm's investment decisions. In this
case even a firm with very little excess capacity may be unlikely to invest if the industry as a
whole has excess capacity. The implication of this observation is that some investment climate
indicators may have different impacts at the firm and at more aggregated levels. Another reason
for aggregate-level analysis is that some view the investment climate as similar for certain cluster
of firms. To investigate this possibility, in one specification we estimate equation (1) only with
city-sector averages of those variables to see whether that measure of market conditions affects
the firm. After estimating the equation with the city-sector averages, we turn to an analysis using
purely finm-level variables. Both analyses yield interesting results, but results from the firm-
level variables seem more robust than those from the city-sector variables, further highlighting
the need for firm-level data.
13
In addition to the above conceptual problem, the analysis faces some practical
econometric obstacles: endogeneity, multicollinearity, and, in the pure finn-level analysis,
missing observations. While we do not have perfect solutions to these problems, we recognize
them and attempt to deal with them, as discussed below.
Endogeneity is a serious problem in investment climate analysis. The direction of
causality is often not clear, and competing hypotheses can sometimes explain a particular result.
Unfortunately, the large number of issues and variables we deal with in this paper make
infeasible an instrumental variables approach to mitigating the endogeneity. Instead, we deal
with this in a few ways. First, our city-sector IC variables are more likely to be exogenous to the
firm, since any given firm only weakly affects the city-sector average. Second, the regressions
include city and sector dummies which helps control for those more macro issues that affect both
the IC variable and the firm. Third, in addition to the regressions that explore the IC variables
one by one, estimating the equation with all variables together helps eliminate omitted variables
problems, though at the cost of multicollinearity, as discussed below. And finally, we rely on
common sense, openly discussing the competing explanations for results and which explanations
seem to best fit all the evidence.
The multicollinearity problem, meaning that many of the variables in which we are
interested are likely to be correlated with each other, can make it difficult to interpret results.
The share of a firm's workforce that receives formal training, for example, is probably correlated
with staff quality. Such correlations leave us needing to balance potential omitted variables bias
if we leave out variables correlated with each other, with the multicollinearity problems when
including all relevant variables.
The sample size problem arises from the fact that some data is missing for every firm.
This is not a severe problem when we use the city-sector means as the relevant IC measure, as
we simply calculate the means from all available firms. It is a much more severe problem in the
purely firm-level analysis, since selecting only the observations that have complete information
for all the IC variables reduces the sample size substantially. Indeed, including all the variables
causes the sample size of 1500 firms to decrease by more than half.
9 To denve the TFP measure, we first estimate a Cobb-Douglas production function by each sector, allowing forfirm fixed effects. The residual (including the fixed effects) is then TFP. Estimates based on the translogproduction function estimates are similar.
14

To deal with both multicollinearity and the sample size problem we run the regressions
not only with all the variables included, but also with each IC variable by itself along with only
minimal controls (initial sales, capital, or employment, depending on the dependent variable,
firm age, and city and sector dummies). This practically eliminates the multicollinearity problem
(though at the expense of potential omitted variables bias). Meanwhile, it allows us to retain a
large sample size (1000 - 1300 firms) in the firm-level analysis.'0 This approach has the added
benefit of being a robustness check: we have more confidence in the results when they are
similar in regressions with all IC measures included and when only one IC measure at a time is
included.
Aggregate city-sector investment climate measures
Many of the indicators measured here are affected by policy at the provincial level. The
enforcement of national laws and regulations can vary across provinces, and local governments
have substantial discretion in shaping the provincial investment climate. To analyze the
importance of the investment climate at the local level and to capture the important differences
between locations, we calculated city-sector averages for each of the investment climate
indicators. As mentioned earlier, these measures also benefit from being clearly exogenous to a
particular firm while capturing the environment in which the firm operates. To control for finm-
specific characteristics, the analysis also includes firm age and initial conditions, while sector
dummies control for industry-level effects. Since an observation in the regression is a firm, we
can control for firm-specific characteristics while allowing the IC measures to vary across city-
sectors (i.e., with five cities and ten sectors each IC variable has 50 different values).
We run individual regressions for each investment climate indicator as well as a more
comprehensive specification in which we include all measures simultaneously. For the
regressions looking at each IC variable individually, virtually all the coefficients were of the
expected sign and most were significant (Table 2a to 2f). 1 l The extent of corruption,
'° Fortunately, the distribution of firms by city and sector remains quite close to the original distribution of 1500firms." To check for the robustness of results, two additional sets of regressions were run. The first used averageddependent variables to test if the investment climate indicators are significantly correlated with averageperfonnance. While variables entered significantly if individual indicators were included, there were few remainingsignificant results once all the variables were included. Given there were only 50 observations and so few remaining
15

infrastructure, innovation, degree of openness and the availability of finance yielded particularly
strong results. While these variables exhibit variation at the firm level, they are also some of the
most plausible candidates of variables whose regional variation should be more relevant in
explaining frnm behavior.
As noted above, one concern with asking about corruption directly is that firms have no
incentive to answer truthfully, and may even be fearful of answering. The data reveal strong
regional differences in the willingness to answer such questions. Given the likelihood that non-
response was more likely to represent a higher rather than lower burden of corruption - we
decided not to use the reported responses themselves. Rather, we argue that the share of firms
willing to answer the question is itself a good proxy for the burden of corruption. Thus, we
included the share of firms willing to answer a question about the time managers spend with
officials. The measure is strongly negatively correlated with sales growth, investment and
productivity (Table 2a). In other words, firms in city-sectors where firms are, on average, less
willing to answer questions about corruption and government interactions tended to perform
worse. A second variable we tested was the time spent in inspections. Here, the non-response
issue was much more muted. However, the impact of the results are much smaller - and
positively rather than negatively correlated with performance. Here the effect may be partly
explained as firms that are expanding and innovating may require additional permits. This
interpretation is consistent with the general finding reported above that firms in Chengdu-
considered by many investors to have the worst corruption problems-shows the least time spent
with inspectors while Guanzhou-one of the most dynamic cities-has the most. Indeed, an
interaction of the time with regulators variable and a dummy for whether the firm introduced a
new process or product the last three years captures the positive effect (the results unreported in
this paper), with the direct measure of time in inspections losing its significance.
The share of sales lost in transit due to theft, breakage and spoilage in the city-sector is
negatively correlated with firm performance (Table 2a). This variable captures not just the costs
of production within a plant, but also costs associated with getting goods to customers. Again,
degrees of freedom, the relatively weak results are not surprising. A second set of regressions included citydummies. The effect was to lower the significance of a number of variables, which again was to be expected ascities such as Shanghai and Guangzhou consistently score better on a variety of measures, while Chengdu oftenscores the lowest. The inclusion of city dummies is also somewhat problematic as the variation across cities isprecisely what we are trying to explain in these aggregated location regressions.
16

while there is variation at the firm level, one would expect significant variations across locations.
The effect is significantly negative, particularly for sales growth and productivity.
The availability of IT infrastructure in the city-sector is is positively correlated with
performance (Table 2b). The greater the use of IT within a sector-location, the greater is sales
growth, investment and productivity. Moreover, there is some evidence of spillover effects from
regional innovation efforts. Average R&D activities and labor training practices in a city-sector
are significantly positive for all performance measures. That they are concentrated differently
across locations further demonstrates the importance in local variations in the investment climate
to spur firmns to imnprove their efficiency.
The openness of a location - to foreign owned firms and to competition from imports- is
associated with higher sales growth, productivity and employment growth (Table 2c). The last
result in particular is consistent with the hypothesis that foreign investors can be a source of
spillovers for local firms. Access to finance is also particularly strongly associate with better
performance at the regional level (Table 2d).
The results for entry and exit at the aggregate level are robust, but only for some
dimensions of firm performance (Table 2e). Since a higher share of subcontracting (as a share of
costs) implies more ease of entry, the share of subcontracting acts as a proxy for entry costs here.
It is positively and statistically significantly associated with sales growth and productivity. As a
proxy for exit barrier, higher excess capacity is associated with lower productivity. These pieces
of evidence are consistent with the hypothesis that exit barriers reduce productivity.
Features of labor market exert substantial influences on firm performance (Table 2f).
Higher staff quality is associated with a higher level of productivity. And firms that train more
of their staff had higher sales growth, investment rate, job growth, and productivity. More
overmanning in a city-sector is negatively correlated with a given firm's sales and productivity.
Firms in city-sectors that feature higher share of non-permanent workers have higher investment
rates.
Looking at each IC indicator separately demonstrates that many dimensions of the IC are
important. However, it is more difficult to determine the relative importance of each dimension
when looking at all the aggregate location variables together (Table 3): The multicollinearity of
many of the variables means that the effect of each can not be precisely estimated when all the
17

city-sector IC measures are included simultaneously.12 Within the larger regression, some
coefficients are still statistically significant for some outcomes. A firm's import share is
positively associated with employment growth. The share of firms refusing to answer questions
on managerial time with regulators is still negatively associated with sales growth. Access to
finance is still positively associated with productivity. More R&D outlays are positively, while
share of sales lost from theft or breakage is negatively, associated with employment growth. The
development of ICT is positively associated with productivity. The share of labor receiving
training is positively associated with sales growth, investment rate and productivity. There are
also some surprising results. For instance, firms in city-sectors that feature higher staff quality
have lower employment growth. However, most importantly, a large number of variables lose
their statistical significance even though they are of the expected signs. Looking at multiple
location-specific averages limits the variation across variables, so the weakening of results in the
larger regression is not surprising.
Having explored the possible use of the data at a semi-aggregated level, we next turn to a
purely firm-level analysis. The following section details the approach and results which, in
general, are much more robust than those an aggregated approach yields.
Finn-level analysis
The last section characterizes the investment climate at the city-industry level. However,
the investment climate is likely to differ substantially below the city-industry level for a number
of reasons. There could be district-level competition, for instance. Some districts might be
designed to be a science parks or special economic zone districts; and economy of agglomeration
might show up at the district level instead of the city-industry level. The quality of infrastructure
and government effectiveness could differ at lower level than the city. Moreover, the
enforcement of many laws could be at a more local level than the city level, leaving individual
firms facing quite different types of government-business interaction within a city. All these
considerations suggest that it might be fruitful to take advantage of the variations of the
12 The specification in Table does not control for city dummies. However, our empirical experiments suggest thatcontrolling for it makes little differences in our main qualitative results.
18

investment climate at the firm level. With these in mind, we turn to a detailed firm-level
analysis.
As in the analysis above, we first estimate each IC variable by itself, along with minimal
firm controls, and then estimate the equation with all IC variables included together. As one
would expect given the larger sample size and the likelihood of multicollinearity, the IC
variables are more likely to be significant when included without the other IC variables.
Nonetheless, even with all IC variables included simultaneously, a large number of variables
remain significant. Broadly speaking, the firm-level results are fairly robust, and are basically
the same regardless of which variables are excluded or included. We discuss the results in some
details below. While we present the results for each variable included independently (see Table
4), we base our discussion on the results when including all variables simultaneously (Table 5)
and point out differences between the two approaches when there are any.
The control variables tend to be statistically significant and of the sign one would expect.
Initial sales, capital, and employment are always negative and significant-not surprising since
growth rates will be higher if the initial base is lower. More interesting is that, even controlling
for initial conditions, younger firms have faster sales growth and investment and higher TFP than
do older firms. It also appears that younger firms have faster employment growth, although age
is significant in the employment growth regressions in the single-IC regressions but not with all
IC variables included. Next we turn to the results on the IC variables.
International integration proves to be important (Table 4a), though not all indicators are
significant. The share of the firm owned by foreigners was positively correlated with sales
growth, employment growth, TFP, but not the investment rate. The share of the firms' output
produced for export is significantly correlated with sales and employment growth when tested
without other IC variables but not statistically significant when all other variables are included.'3
The results in Table 4b reveal the importance of components of infrastructure and are
consistent with conventional wisdom about current Chinese industrial development. Technology
use, in particular, tends to be strongly correlated with performance. When all IC measures are
included in the analysis, R&D is correlated with investment, TFP, and employment, while ICT
13 The import share of the domestic market for the firm's main product was positively associated with TFP when thevariable is included only with the control variables (Table 4a), but not significant with all other variables included.It was never significantly correlated with sales, investment, or employment growth. However, it should be noted
19

use sales, investment, and TFP. These two measures are, of course, highly correlated, which
makes including both problematic. When examined individually, both the R&D and ICT use
indices are positively associated with growth in sales, employment, investment, and TFP. In the
individual IC regressions, both variables are positively and significantly associated with all
performance measures. In other words, even controlling for sector, city, age, and baseline
conditions, firms that do more R&D and use ICTs more intensively are more productive and
grow more quickly.
The share of production lost to power outages is negatively correlated only with TFP
when included without the other IC variables (Table 4b), and not significantly correlated with
any outcome when other IC measures are included (Table 5). This result is consistent with
recent efforts to make the electricity supply more reliable.
Labor quality and training tend to be positively correlated with firm performance (Table
4c and Table 5). The staff quality index is positively correlated with investment, TFP, and sales
growth (when city are included). The quality index is significantly positively correlated with all
performance measures in the individual IC regressions. The share of the firm's labor force that
receives formal training from the firm is positively correlated with sales and investment, and also
with TFP in the individual regressions.
The share of workers that are temporary (and seasonal) is positively and significantly
correlated with investment and TFP. These results provide strong evidence that a more flexible
labor force helps firms grow and become more productive. The analysis cannot determine if this
is due to firms getting around particularly onerous regulations or if it reflects looser requirements
that allow finms greater flexibility in using temporary workers, although anecdotes would point
to the latter explanation. Despite the difficulty of precisely identifying what causes this result,
the flexibility and training results together lead to a plausible conclusion: a flexible labor force is
associated with more productive and faster growing firms, but firms' investment in their labor
force pays off-firms that train more do better and firms with better workers do better.
The measurements of administrative hassles, as discussed earlier, need to be interpreted
with caution. The firms' estimate of the total number of days spent dealing with regulatory is
significantly associated with none of our dependent variables when all IC variables are included,
that this variable is one that is most likely to suffer from imprecise measurement. Many managers-especially ofsmall firms-may have had difficulty answering the question with any surety.
20

and only with sales growth in the individual regression (Table 4d)-and the sign is positive.
There are at least two possible explanations for this seemingly strange result. First, firms that are
growing may attract more attention from government officials. Second, firms with plans to grow
may need new permits for expansion, thus necessitating additional meetings with regulatory
agencies for the necessary permits. The dummy variable indicating refusal to answer the
question about senior management time is negatively correlated with TFP, but nothing else.
The index of external finance is positively correlated with all four measures in the
individual IC regressions (Table 4e), and with sales, investment, and TFP when all IC measures
are included (Table 5). This result suggests that access to external finance is an important
component of firm growth.
Finally, excess capacity is negatively correlated with sales and employment growth and
TFP (Table 4f and Table 5). Significant excess capacity can be a barrier to entry. If the excess
capacity arises because inefficient and unproductive firms remain in business through subsidies,
new firms may never enter if they cannot compete with firms facing soft budget constraints. The
extent to which a firm uses subcontractors is positively correlated with TFP.
What do the results imply?
It is difficult to synthesize these results-each IC variable could be the basis of an entire
paper. Nonetheless, if we assume causality, they provide a base for us to estimate how the
average firm may improve if certain elements of the investment climate were improved. In this
section we use the significant coefficients from the analysis to simulate the effect on sales,
employment, investment, and TFP of a one standard deviation improvement in the IC variable.
In particular, we ask a simple question: how much would we expect the four outcomes to change
when key IC indicators increase by one standard deviation? The one-standard-deviation change
represents realistic advances firms and local governments can make to improve firm
performance. To focus on the key factors, and to make sure that our point estimate is significant,
we only focus on those factors that are statistically significant in that outcome regression. Table
6 reports the findings based on the specifications of Table 5.
Improving foreign integration would appear to have one of the largest impacts. A one
standard-deviation change in the share of foreign ownership would increase sales growth by 7.9
21
percentage points, TFP by almost one-third, and employment growth by 7.1 percent. Decreasing
excess capacity would increase sales growth by 6.3 percent, TFP by 17 percent, and employment
growth by 3.5 percent. To the extent that excess capacity is caused by policies that prop up
inefficient and money-losing firms, the analysis suggests that those policies are causing a serious
drag on the performance of other firms.
Improvements in policies related to labor market could also have a large impact on
performance. An increase in the share of temporary labor could increase sales growth by nearly
three percent, investment by 2.1 percent, and TFP by 11.1 percent. One should be careful not to
interpret this result too literally. It does not necessarily mean that more temporary workers, per
se, are better, simply that a more flexible workforce is beneficial to firm growth. Indeed, higher
staff quality and training also improve performance. A one standard deviation increase in the
share of the labor force that receives formal training could yield an increase in sales growth of
4.7 percent and an increase in investment of 2.1 percent.
Increasing the access to external finance would also have positive impacts. A one
standard deviation increase in our index would come with a 4.6 percent increase in sales, a 1.8
percent increase in investment, and a 10 percent increase in TFP.
Finally, technological upgrading could be benefi6ial. A one standard deviation increase
in our R&D index would increase investment by 2.6 percent, TFP by 8.4 percent, and
employment growth by 3.6 percent. The same relative increase in the ICT index, meanwhile,
could bring an increase of 6.7 percent in sales growth, two percent in investment, and 36.3
percent in TFP.
These estimates should not be interpreted with caution. The calculations assume that the
IC measures only affect furm performance, and not vice-versa. It is also unlikely that any of the
variables actually operates completely independently-one may affect another in ways that our
analysis cannot capture. Finally, even if one accepts the point estimates, they do not necessarily
illuminate which policies would be effective and whether those policies would yield the
predicted results.
Nevertheless, these simulations provide some evidence on the magnitude of the effects of
the investrnent climate. It is perhaps more convincing to think of these simulations in the
negative. Government policies to restrict foreign ownership are likely to have large negative
impacts, as are policies that allow unviable finms to continue operations and exacerbate any
22

existing excess capacity problems. Thus, while we would not assert that our simulations provide
definitive answers, they do demonstrate that many IC measures are important to the economy
and suggest where policy initiatives could begin to focus.
Conclusion
The results of this analysis highlight both the importance of these investment climate
indicators on firm performance and the necessity of firm level data for rigorously exploring their
effects. Nonetheless, this analysis barely scratches the surface of what can be done with this sort
of data. Each variable we discuss above relates to large bodies of literature and deserves much
more attention.
The analysis finds that, overall, firm performance is positively correlated with foreign
ownership, R&D, ICTs, staff quality, the share of the firm's labor force that receives training
from the firm, and access to external finance. Excess capacity is negatively correlated with firm
performance, while time spent with regulators is negatively correlated with TFP. These
correlations tend to be obscured by more aggregated data, and are simply unobservable with
country-level data. Constructing policies that can effectively promote growth requires firm-level
data to truly understand bottlenecks to firm growth. While the results should be interpreted with
caution, the analysis holds the promise of a great deal of additional research to uncover more
details of each part of the investment climate discussed here.
23

References
Arora, Ashish, Alfonso Gambardella, and Salvadore Torrisi. 2001. "In the Footsteps of SiliconValley? Indian and Irish Software in the International Division of Labour." SIEPR DiscussionPaper: Stanford.
Athreye, Suma. 2002. "The Indian Software Industry and Its Evolving Service Capability." TheOpen University Working Paper: UK.
Bresnahan, Timothy. 1989. "Empirical Studies of Industries with Market Power," in Handbookof Industrial Organization. Robert Willig ed. Amsterdam: Elsevier Science Publishers, pp. 1011-57.
Canning, David. 1999. "Infrastructure's Contribution to Aggregate Output." World Bank PolicyResearch Working Paper: Washington.
Canning, David and Esra Bennathan. 2000. "The Social Rate of Return on InfrastructureInvestments." World Bank Policy Research Working Paper: Washington.
Caprio, Gerard, Patrick Honohan, and World Bank. 2001. Finance for Growth: Policy Choicesin a Volatile World. Washington, D.C.: Oxford University Press.
Clarke, George. 2001. "Bridging the Digital Divide: How Enterprise Ownership and ForeignCompetition Affect Internet Access in Eastern Europe and Central Asia." World Bank PolicyResearch Working Paper: Washington.
Clarke, George. 2002. "Does Internet Connectivity Affect Export Performance? Evidence fromTransition Countries." WIDER Discussion Paper.
Djankov, Simeon, Rafael La Porta, Florencio Lopez-de-Silanes, and Andrei Shleifer. 2002. "TheRegulation of Entry." Quarterly Journal of Economics, 117:1, pp. 1-37.
Easterly, William. 1999. "The Ghost of Financing Gap: Testing the Growth Model Used in theInternational Financial Institutions." Journal of Development Economics, 60:2, pp. 423-38.
Easterly, William and Sergio Rebelo. 1993. "Fiscal Policy and Economic Growth: An EmpiricalInvestigation." Journal of Monetary Economics, 32:3, pp. 417-58.
Emery, James, Melvin T. Spence, Louis T. Wells, and Timothy Buehrer. 2000. "AdministrativeBarriers to Foreign Investment: Reducing Red Tape in Africa." The International FinanceCorporation: Washington.
Friedman, Eric, Simon Johnson, Daniel Kaufmann, and Pablo Zoido-Lobaton. 2000. "Dodgingthe Grabbing Hand: the Determinants of Unofficial Activity in 69 Countries." Journal of PublicEconomics, 76:3, pp. 459-93.
24

Gordon, Roger and Wei Li. 2002. "Taxation and Economic Growth in China." University ofVirginia Working Paper: Charlottesville.
Hallward-Dreimeier, Mary, Giuseppe larossi, and Kenneth Sokoloff. 2002. "Exports andManufacturing Productivity in East Asia: A Comparative Analysis with Firm-Level Data."NBER Working Paper: Cambridge.
Kaufmann, Daniel, Aart Kraay, and Pablo Zoido-Lobaton. 1999. "Govemance Matters." WorldBank Policy Research Working Papers: Washington.
Kaufmann, Daniel, Aart Kraay, and Pablo Zoido-Lobaton. 2002. "Governance Matters II:Updated Indicators for 2000/0 1. " World Bank Policy Research Working Papers: Washington.
Lansbury, Melanie and David Mayes. 1996. "Entry, Exit, Ownership and the Growth ofProductivity," in Sources of Productivity Growth. David Mayes ed. Cambridge: CambridgeUniversity Press.
Levinsohn, James. 1993. "Testing the Imports-As-Market-Discipline Hypothesis." Journal ofInternational Economics., 35:1/2, pp. 1-22.
Maloney, W.F. 2001. "Missed Opportunities: Innovation and Resource-Based Growth in LatinAmerica." WorldBank WorkingPaper: Washington.
McMillan, John and Christopher Woodruff. 2002. "The Central Role of Entrepreneurs inTransition Economies." Journal ofEconomic Perspectives, 16:3, pp. 153-70.
Megginson, William L. and Jeffrey M. Netter. 2001. "From State to Market: A Survey ofEmpirical Studies on Privatization." Journal of Economic Literature, 39:2, pp. 321-89.
Pavcnik, Nina. 2000. "Trade Liberalization, Exit and Productivity Improvements: Evidencefrom Chilean Plants." NBER Working Paper: Cambridge, MA.
Poncet, Sandra. 2002. "Domestic Market Fragmentation and Economic Growth in China."CERDI Working Paper.
PRS Group. 2002. "International Country Risk Guide." Syracuse.
Recanatini, Francesca, Scott Wallsten, and Lixin Colin Xu. 2000. "Surveying Surveys andQuestioning Questions: Learning from World Bank Experience." World Bank Policy ResearchWorking Paper Series: Washington.
Sachs, Jeffrey and Andrew Warner. 1995. "Economic Convergence and Economic Policies."NBER Working Paper: Cambridge.
25
Saggi, Kamal. 2002. "Openness and Productivity: The Role of Intemational Trade and ForeignDirect Investment." Dallas.
Saxenian, AnnaLee and Jinn-Yuh Hsu. 2000. "The Silicon Valley-Hsinchu Connection:Technical Communities and Industrial Upgrading."
Shirley, Mary M. and Patrick Walsh. 2000. "Public vs Private Ownership: The State of theDebate." Washington.
Smarzynska, Beata and Shang-Jin Wei. 2000. "Corruption and Composition of Foreign DirectInvestment: Firm-Level Evidence." World Bank Working Paper: Washington.
State Planning Commission. 2000. "Strategies for Overcoming Regional Market Segmentationand Establishing National Market." SPC: Beijing.
Stem, Nicholas. 2002a. "Development as a Process of Change: Toward and Dynamic PublicEconomics." Keynes Lecture: British Academy.
Stem, Nicholas. 2002b. A Strategyfor Development. Washington, DC: The World Bank.
The World Bank. 2002a. "Inproving the Investmnent Climate in China." Washington.
The World Bank. 2002b. "Improving the Investment Climate in India." Washington.
Wei, Shang-Jin. 2000. "How taxing is Corruption on Intemnational Investors?" Review ofEconomics and Statistics, 82:1, pp. 1-1 1.
World Bank. 1995. Bureaucrats in business: the economics andpolitics of governmentownership. Washington, D.C.: Published for the World Bank Oxford University Press.
World Economic Forum. 2002. The Global Competitiveness Report. Oxford: Oxford UniversityPress.
26

Figure 1Imports' Share of domestic sales of firms' main product
0 140
0 120
0 100
0 080
0080
Bealing Chengdu Guangzhou Shanghal Tlanjk
Figure 2Firm Ownership
0.400
0 350
0 300 -
0 250 -
0 200 -*foreign0 mgovernmentl
0.150-
0.100
0 050
0 0000
Beijing Chengdu Guangzhou Shanghai Tianjin
27
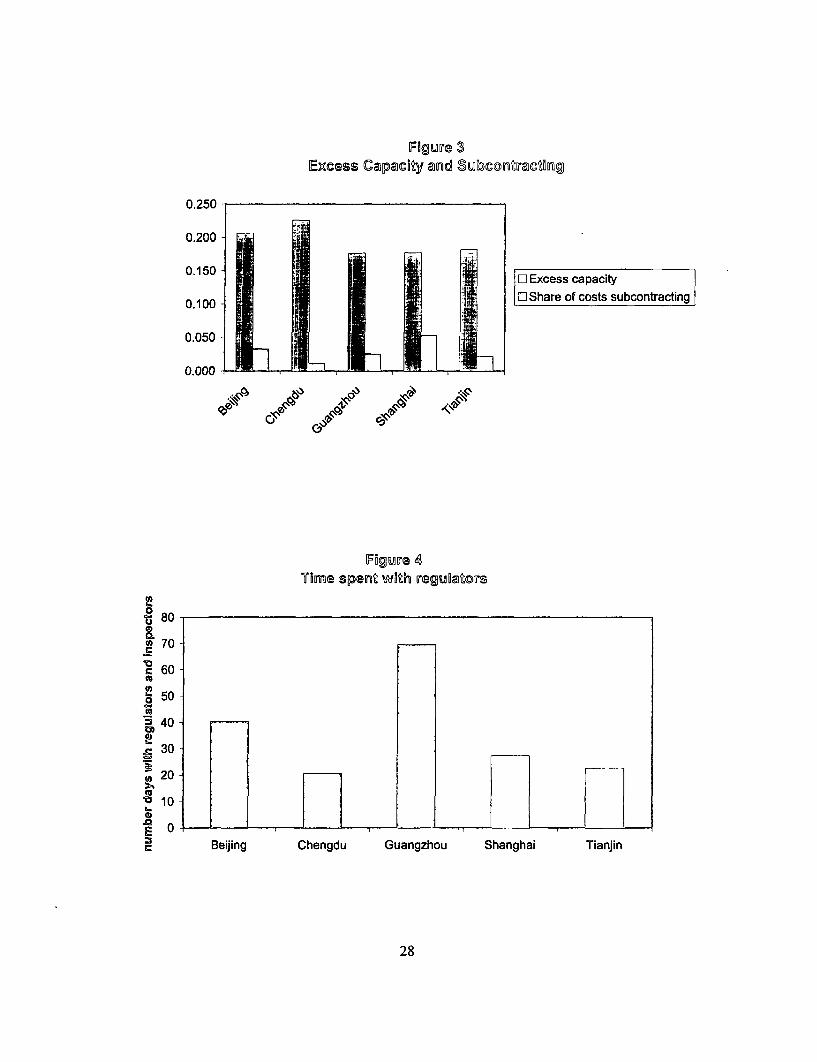
Figure 3Excess Capacity and Subcontracting
0.250
0.200 -
0.150 - ~ ~ ~ ~ ~ ~~~~~ xcs cpcity
0.150 - E Share of costs subcontracting
0.1000-|E
4~~~~~~~~K
Figure auTime spent with reguaotrz
800.-
70 0C60-
50
12~ ~ ~ ~ ~~~~2
340
u20-
0 10
C ~~Beijing Chengdu Guangzhou Shanghai Tianjin
28

Figure 5Share of firms refusing to respond to regulation questions
0.35
0.3
025
0.2
0.15
0.1
0.05 . , , 0
Beijing Chengdu Guangzhou Shanghai Tianjin
Figure 6Share of workforce that is nonpermanent
0.250
0 200
0 150
0 100 X
0 050 . .: , _
0.000Beijing Chengdu Guangzhou Shanghai Tianjin
29
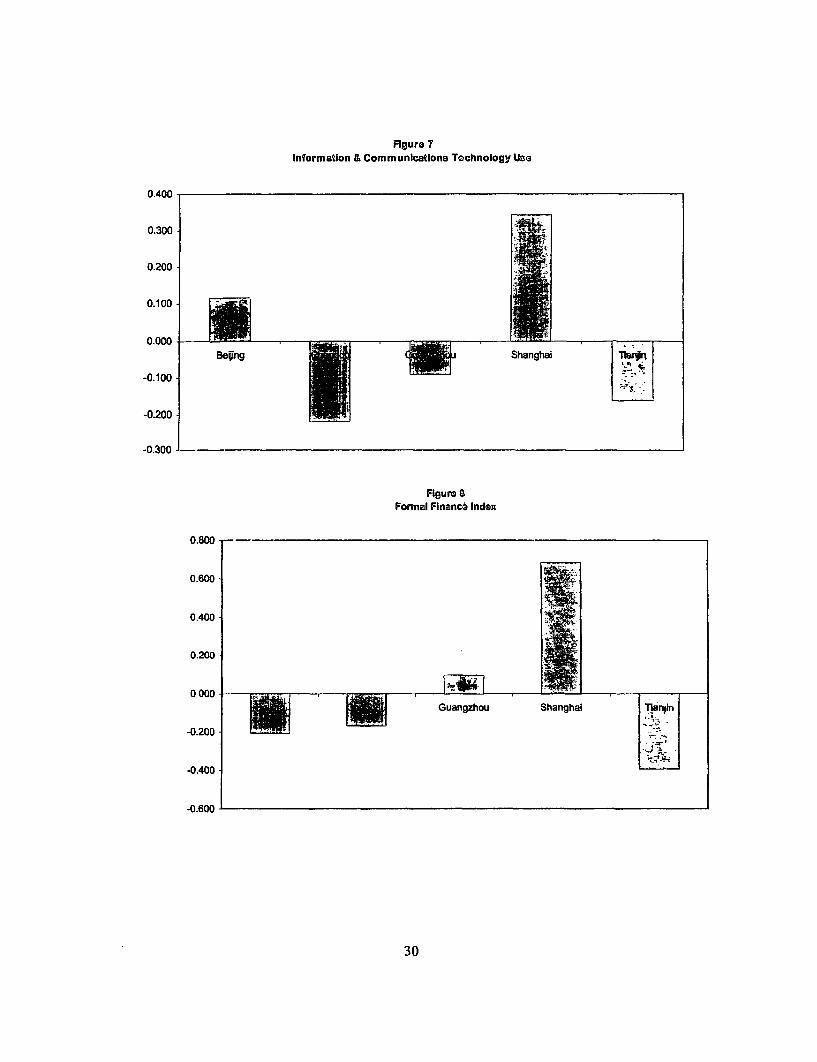
Figure 7Informatlon & Communications Technology Use
0.400
0.300
0.200-
0.100
0.000
-0.100 Beg Shanghai g-0.200
-0.200, 1:
-0.300_
Figurm 8Formal Finance Index
0.800 -
0.600 -
0.400 -
0.200 -
Guangzhou Shanghai Tanrlir_
-0.200
-0.400
-0.600
30
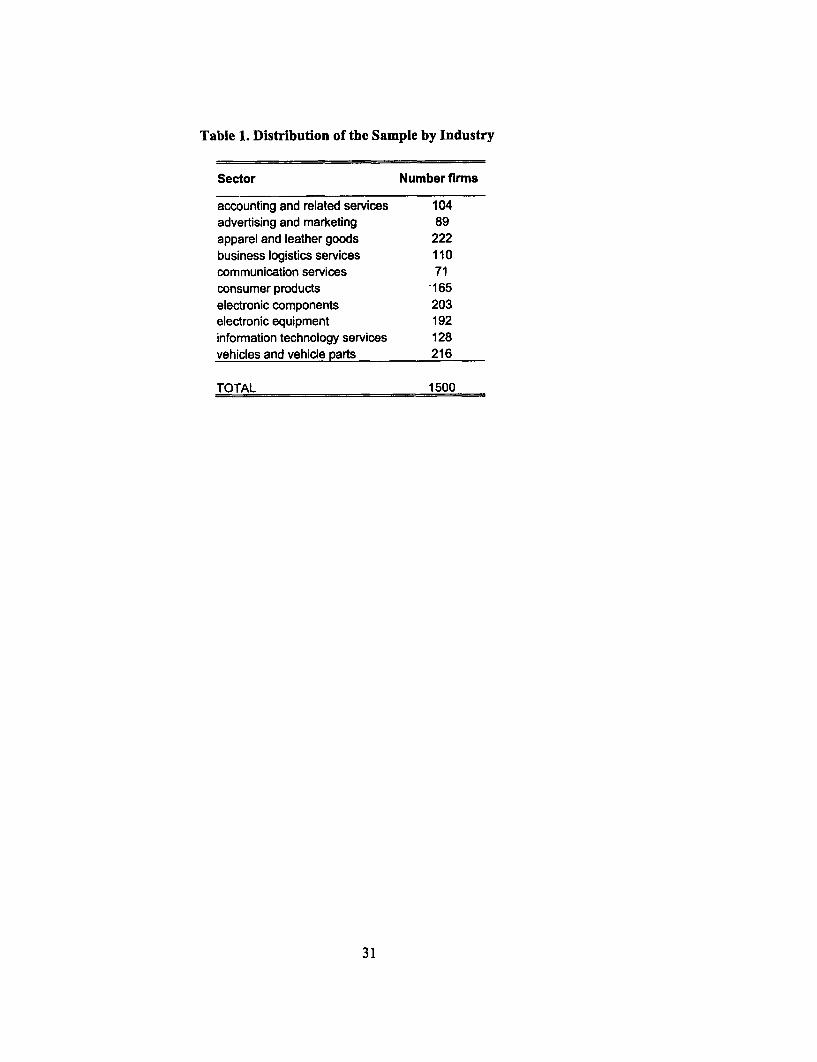
Table 1. Distribution of the Sample by Industry
Sector Number firms
accounting and related services 104advertising and marketing 89apparel and leather goods 222business logistics services 110communication services 71consumer products -165electronic components 203electronic equipment 192information technology services 128vehicles and vehicle parts 216
TOTAL 1500
31

Table 2a. City-Sector Investment Climate Measures and Firrm Performance:Administrative Barriers and Corruption
Sales growth Investment TFP Employment Sales Investment TFP Employment Sales Investment TFP Employmentrate growth growth rate growth growth rate growth
Share of firms refusing to answer -0.248 -0.122 0.701 -0.080managers' time with regulators (2.31)-- (2.50)°* (2.04)° (0.56)
Time with regulators/inspectors 0.005 0.002 0.021 0.003
(3.34).. (3 37).. (4.73).. (2.13)-share of sales lost from theft or -0.897 -0.276 -3.744 -0.673breakage (2.30)°° (1.56) (3.14r) (1.24)log(initial sales) -0.042 -0.045 -0.044
(6.69). (7.20)*- (6.91 )log(initial capital) -0.009 -0.010 -0.010
(3.67)*°* (3.97)... (3.82)°°log(labor) 0.002 -0.014 -0.009
(0.06) (0.53) (0.32)log(initial labor) -0.052 -0.053 -0.052
(3.52)°° (3.51)... (3.46)...log(flrm age) -0.145 -0.051 -0.370 -0.093 -0.144 -0.050 -0.379 -0.093 -0.143 -0.050 -0.368 -0.092
(11.25)°°° (9.54)°°°. (10.37)-o (5.7l)°°° (11.26)°°- (9.36)ooo. (10.78)... (5.69)*° ... 11* (9.30)°t- (10.38)°°°. (5.62)°°°Constant 0.960 0.383 2.298 0.511 0.721 0.262 2.328 0.393 0.850 0.318 2.955 0.489
(9.96)°°° (8.97) ... (7.96)--° (5.26)°-° (10.07)... (9.05) ... (11.20)°° (6.79) ... (1 1.80)°° (110.97)... (16.45)°°°. (6.28)°°°
Observations 1294 1274 1333 1309 1294 1274 1333 1309R-squared 0.20 0.17 0.63 0.10 0.20 0.18 0.63 0.10Note. $, **, $$$ represent statistical significance at the 10, 5 and 1 percent levels. City and industry dummies included.The investment climate variables are city-industry averages; controls at the firm level are initial sales, capital, labor, and firm age.
32

Table 2.b. City-Sector Investment Climate Measures And Firm Performance:Physical And Technological Infrastructure
Sales Investment TFP Employment Sales Investment TFP Employment Sales Investment TFP Employmentgrowth rate growth growth rate growth growth rate growth
ICT index 0.147 0.035 0.765 0.153(3.90).*. (2.12)-^ (7.63)... (1.33)
R&D index 0 094 0.042 0.448 0.123(3.43).*. (3.34)'* (5.58)... (2.21 )^
share sales lost from -0.269 -0.360 -1.903 -1.483electricity outages (0.36) (0.91) (0.74) (1.54)
log(initial sales) -0.047 -0.045 -0.042(7.43)... (7.16)'* (6.74)^**
log(initial capital) -0.010 -0.011 -0.009(3.97)... (4.16)... (3.65)...
log(labor) -0.027 -0.028 -0.001(0.99) (1.02) (0.05)
log(initial labor) -0.056 -0.056 -0.051(3.36).*. (3.53)^* (3.49).*.
log(firm age) -0.140 -0.049 -0.350 -0.089 -0.144 -0.050 -0.367 -0.093 -0.143 -0.050 -0.371 -0.092(10.88)... (9.17)... (9.97)... (5.19)... (11.23)*** (9.37)*** (10.43)... (5.66)... (11.09)*** (9.27)*** (10.41)*** (5.63) ...
Constant 0.696 0.274 2.122 0.328 0.868 0.333 3.094 0.536 0.809 0.317 2.854 0.510(9.76)*** (8.97)-** (11.05)**' (3.53)^** (12.50)... (11.44)... (17.13)*** (6.47)*** (10.31)^*^ (9.65)-- (13.95)... (6.09) ...
Observations 1294 1274 1333 1309 1294 1274 1333 1309 1294 1274 1333 1309R-squared 0.20 0.17 0.64 0.11 0.20 0.18 0.63 0.11 0.19 0.17 0.63 0.10Note. *, **, *** represent statistical significance at the 10, 5 and I percent levels. City and industry dummies included.The investment climate variables are city-industry averages; controls at the firm level are initial sales, capital, labor, and firm age.
33

Table 2c. City-Sector Investment Climate Measures and IFirm Performance:]International Integration and Ownership
Sales Investment TFP Employment Sales Investment TFP Employment Sales Investment TFP Employmentgrowth rate growth growth rate growth growth rate growth
Share foreign ownership 0.216 -0.060 0.742 0.297(1.87)- (1.15) (1.95)e (2.26)--
Share domestic private 0.219 -0.089 -0.062 0.233ownership (1.35) (1.25) (0.12) (1.33)Imports as share of 0.010 0.002 0.033 0.014domestic market (2.81)° (1.12) (3.13)*°* (3.10)***
Exports as share of sales 0.047 -0.036 0.208 0.074
(0.64) (1.28) (1.09) (1.37)log(initial sales) -0.043 -0.044 -0.042
(6.89)- (6.99).. (6.76)..log(intial capital) -0.009 -0.009 -0.009
(3 56)... (3.73)* (3 63).log(labor) -0.006 -0.008 -0.003
(0.22) (0.29) (0.10)log(initial labor) -0.053 -0.054 -0.052
(3.50)o (3.62).. (3.50)-log(firm age) -0.140 -0.051 -0.357 -0.087 -0.139 -0.049 -0.361 -0.086 -0.142 -0.051 -0.367 -0.090
(110.71)-t (9.36)... (9.80)... (5.29)... (10.84)°°° (9.11)*°° (10.10)... (5.58)... (10.96)... (9.3l)--- (I10.11)- (5.43)...Constant 0.611 0.379 2.746 0.244 0.784 0.300 2.706 0.425 0.797 0.306 2.758 0.454
(4.13)°°° (5.83)... (6.04)... (1.78)° (11.88)... (10.89)... (15.97)... (7.54)a- (11.99)**" (11.13)*°* (16.12)... (7.42)...
Observations 1294 1274 1333 1309 1294 1274 1333 1309 1294 1274 1333 1309R-squared 0.20 0.17 0.63 0.10 0.20 0.17 0.63 0.11 0.19 0 17 0.63 0.10
Note. *, "'t, ** represent statistical significance at the 10, 5 and 1 percent levels. City and industry dunmnies included.The investment climate variables are city-industry averages; controls at the firm level are initial sales, capital, labor, and firm age.
34

Table 2.d. City-Sector Investment Climate Measures And Firm Performance:Finance
Sales growth Investment rate TFP Employment growth
finance index 0.084 0.016 0.543 0.087(3.35)*** (1.61) (7.78)*** (1.94)*
log(Qnitial sales) -0.047(7.20).**
log(initial capital) -0.010(3.95)***
log(labor) -0.036(1.33)
log(initial labor) -0.056(3.51).*.
log(firm age) -0.138 -0.049 -0.339 -0.088(10.65)*** (9.09)*** (9.70)*** (5.51)...
Constant 0.910 0.322 3.355 0.551(111.92)** (10.98)*** (18.76)*** (5.70)***
Observations 1294 1274 1333 1309R-squared 0.20 0.17 0.64 0.11
Note. *, **, *** represent statistical significance at the 10, 5 and 1 percent levels. City and industry dununies included.The investment climate variables are city-industry averages; controls at the firm level are initial sales, capital, labor, and firm age.
35
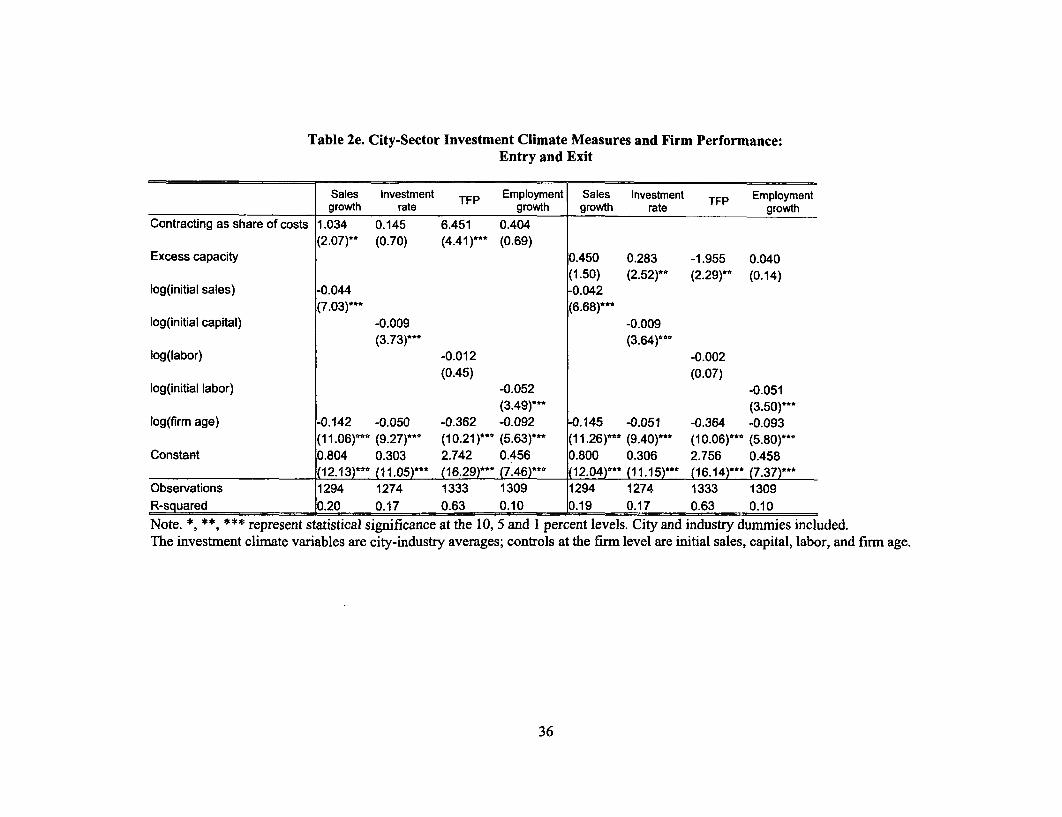
Table 2e. City-Sector Investment Climate Measures and Firm Performance:Entry and Exit
Sales Investment TFP Employment Sales Investment TFP Employmentgrowth rate growth growth rate growth
Contracting as share of costs 1.034 0.145 6.451 0.404(2.07)** (0.70) (4.41)*** (0.69)
Excess capacity 0.450 0.283 -1.955 0.040(1.50) (2.52)** (2.29)** (0.14)
log(initial sales) -0.044 -0.042(7.03)*** (6.68)***
log(initial capital) -0.009 -0.009(3.73)*** (3.64)**.
log(labor) -0.012 -0.002(0.45) (0.07)
log(initial labor) -0.052 -0.051(3.49)*** (3.50)***
log(firm age) -0.142 -0.050 -0.362 -0.092 -0.145 -0.051 -0.364 -0.093(11.06)... (9.27)*** (10.21)*** (5.63)*** (11.26)*** (9.40)*** (10.06).** (5.80)*.*
Constant 0.804 0.303 2.742 0.456 0.800 0.306 2.756 0.458(12.13)*** (11 .05)*** (1 6.29)*** (7.46)*** (12.04)*** (11.15)*** (16.14)*** (7.37)**"
Observations 1294 1274 1333 1309 1294 1274 1333 1309R-squared 0.20 0.17 0.63 0.10 0.19 0.17 0.63 0.10Note. *, **, *** represent statistical significance at the 10, 5 and 1 percent levels. City and industry dummies included.The investment climate variables are city-industry averages; controls at the firn level are initial sales, capital, labor, and firm age.
36
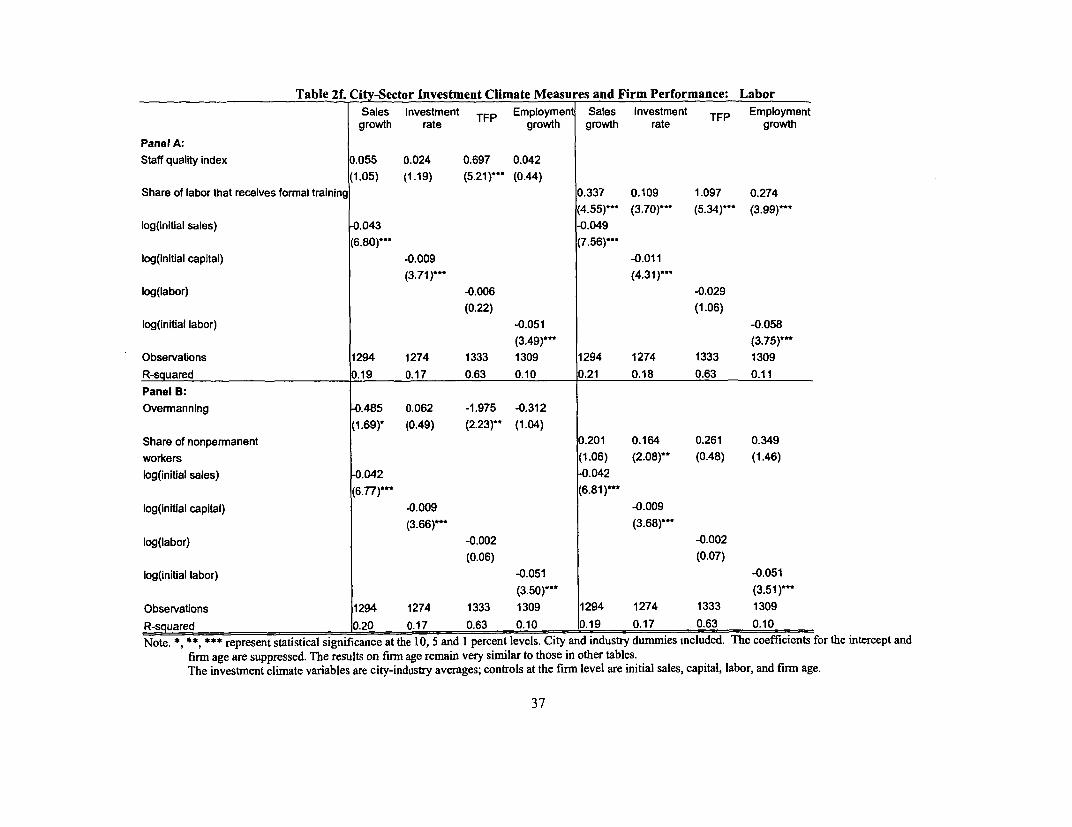
Table 2f. City-Sector Investment Climate Measures and Firm Performance: LaborSales Investment TFP Employment Sales Investment TFP Employmentgrowth rate growth growth rate growth
Panel A:Staff quality index 0.055 0.024 0.697 0.042
(1.05) (1.19) (5.21)*r (0.44)Share of labor that receives formal training 0.337 0.109 1.097 0.274
(4.55)**^ (3.70)**- (5.34)^-* (3-99)-*-log(initial sales) -0.043 -0.049
(6.80)*' (7.56)**-log(initial capital) -0.009 -0.011
(3.71)* (4.31)*-log(labor) -0.006 -0.029
(0.22) (1.06)log(initial labor) -0.051 -0.058
(3.49)'* (3.75)-Observations 1294 1274 1333 1309 1294 1274 1333 1309R-squared 0.19 0.17 0.63 0.10 0.21 0.18 0.63 0.11Panel B:Overmanning -0.485 0.062 -1.975 -0.312
(1.69)* (0.49) (2.23)** (1.04)Share of nonpermanent 0.201 0.164 0.261 0.349workers (1.06) (2.08)*' (0.48) (1.46)log(initial sales) -0.042 *0.042
(6.77)-* (6.8l)*--log(initial capital) -0.009 -0.009
(3.66)- (3.68)*^*log(labor) -0.002 -0.002
(0.06) (0.07)log(initial labor) -0.051 -0.051
(3.50)*.* (3.51)***Observations 1294 1274 1333 1309 1294 1274 1333 1309R-squared 0.20 0.17 0.63 0.10 0.19 0.17 0.63 0.10Note. , **, '** represent statistical significance at the 10, 5 and 1 percent levels. City and industry dummies mcluded. The coefficients for the intercept and
firm age are suppressed. The results on firm age remain very similar to those in other tables.The investment climate variables are city-industry averages; controls at the firm level are initial sales, capital, labor, and firm age.
37
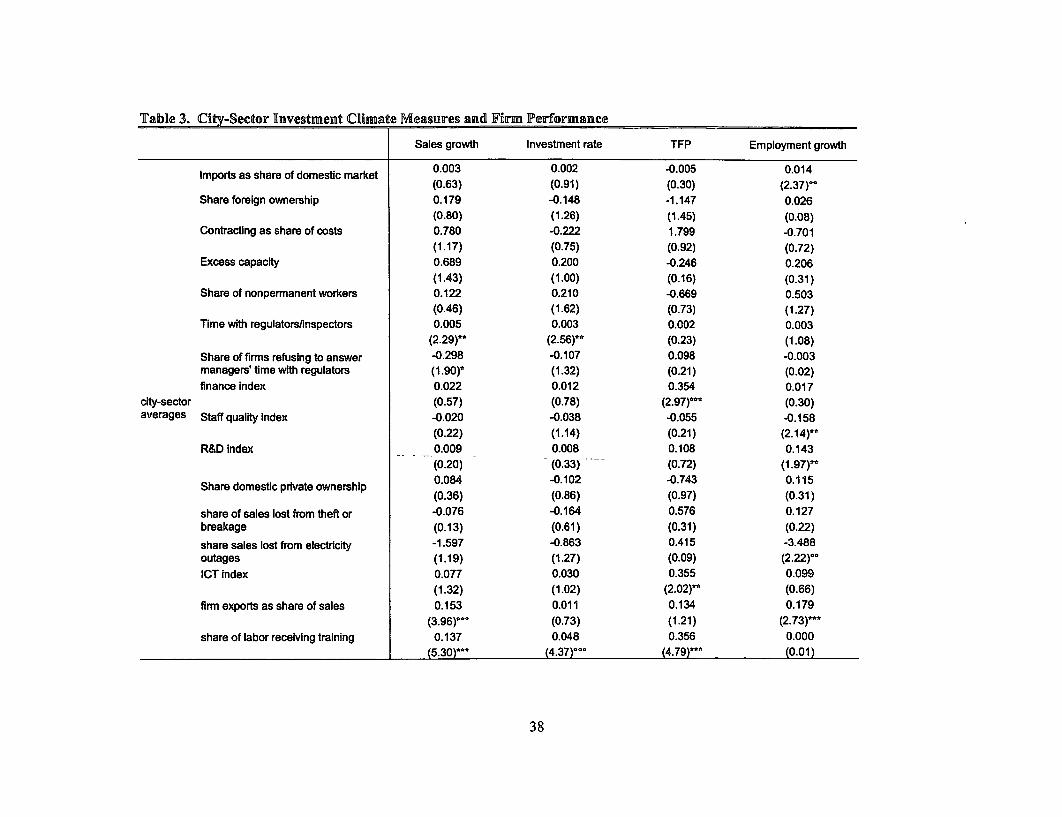
Table 3. City-Sector Investment Climate Measures and Firm Peerformance
Sales growth Investment rate TFP Employment growth
Imports as share of domestic market 0.003 0.002 -0.005 0.014(0.63) (0.91) (0.30) (2.37)-
Share foreign ownership 0.179 -0.148 -1.147 0.026(0.80) (1.26) (1.45) (0.08)
Contracting as share of costs 0.780 -0.222 1.799 -0.701(1.17) (0.75) (0.92) (0.72)
Excess capacity 0.689 0.200 -0.246 0.206(1.43) (1.00) (0.16) (0.31)
Share of nonpermanent workers 0.122 0.210 -0.669 0.503(0.46) (1.62) (0.73) (1.27)
Time with regulators/nspectors 0.005 0.003 0.002 0.003(2.29)- (2.56)*- (0.23) (1.08)
Share of firms refusing to answer 40.298 40.107 0.098 -0.003managers! time with regulators (1.90)- (1.32) (0.21) (0.02)finance index 0.022 0.012 0.354 0.017
city-sector (0.57) (0.78) (2.97)aa (0.30)averages Staff quality index -0.020 -0.038 -0.055 -0.158
(0.22) (1.14) (0.21) (2.14)-R&D index 0.009 0.008 0.108 0.143
(0.20) (0.33) (0.72) (1.97)-0.084 -0.102 -0.743 0.115(0.36) (0.86) (0.97) (0.31)
share of sales lost from theft or -0.076 -0.164 0.576 0.127breakage (0.13) (0.61) (0.31) (0.22)
share sales lost from electricity -1.597 40.863 0.415 -3.488outages (1.19) (1.27) (0.09) (2.22)-ICT index 0.077 0.030 0.355 0.099
(1.32) (1.02) (2.02)-- (0.66)firm exports as share of sales 0.153 0.011 0.134 0.179
(3.96)... (0.73) (1.21) (2.73).share of labor receiving training 0.137 0.048 0.356 0.000
(5.30). (4.37)- (4.79)... (0.01)
38

Table 3. City-Sector Investment Climate Measures and Firm Performance (Cont'd)
Sales growth Investment rate TFP Employment growth
log(firm age) -0.121 -0 046 -0.307 -0.068l 9. 11)-- (8.53)... (8.02)... (4.84)-^^
share capital leveraged 0.118 0.021 -0.071 0.061(2.88)^-* (1.19) (0.55) (1.16)
log(initial sales) 4.056(8.12)^-
log(initial capital) -0.013
firm level (4.80)-^log(labor) -0.072
(2.52)^^log(initlal labor) -0.074
(3.89)^*border 0.028 0.006 -0.170 0.056
(1.16) (0.46) (1.86)- (1.55)Constant 0.697 0.459 4.148 0.451
(2.03)-^ (2.53)^* (3.69)r* (0.87)
Observations 1181 1165 1224 1193R-squared 0.25 0.23 0.67 0.14
Note. *, *, * represent statistical significance at the 10, 5 and I percent levels. Industry dummies included.
39

Table 4.a. Firm-LeveR Analysis:Il nternational Rntegration
Sales Investment TFP Employment Sales Investment TFP Employment Sales Investment TFP Employmentgrowth rate growth growth rate growth growth rate growth
Share foreign ownership 0.140 0.002 0.813 0.102(3.25)-- (0.1 1) (6.54)--a (2.07)-
Share domestic private -0.054 -0.003 0.311 -0.009ownership (1.76)- (0 24) (3.24)-°° (0.25)Imports as share of 0.084 0.026 0.435 0.101domestic market (1.13) (0.84) (2.04)" (1.62)Exports as share of sales 0.130 -0.000 0.058 0.143
(3.50)- (0.02) (0.52) (3.41)-log(initial sales) -0.033 -0.034 -0.028
(5.58)- (5.19)- (4.80)-log(inifial capital) -0.027 -0.032 -0.027
(8.40) aa (9.04)- (8.45)-log(labor) -0.041 -0.033 -0.047
(1.63) (1.21) (1 .82)-log(iniUlal labor) -0.058 -0.043 -0.062
(5.82)-° (5.55).. (6.45r)log(firm age) -0.132 -0.073 -0.270 . -0.082 -0.148 -0.070 -0.330 -0.084 -0.132 -0.070 -0.355 -0.072
(9.12)--t (13.04)-§ (7.26)*°- (4.73)... (10.30)--a (12.64)... (8.56)°°° (6.73)... (10.0or-° (13.55)°°* (9.83)°-° (4.56)-9Constant 0.633 0.305 2.568 0.466 0.626 0.338 2.861 0.342 0.700 0.353 3.146 0.500
g849)o-a (10.9l)--a (10.42)--t (5.5l)-° (8.72)--* (12.75)-* (11.67)--a (6.56)ooa (9.59)°°° (14.3l)--° (14.01)... (7.21)r°
Observations 1220 1298 1263 1235 1036 1093 1062 1043 1188 1261 1231 1200R-sguared 0.17 0.25 0.66 0.13 0.17 0.26 0.66 0.16 0.15 0.24 0.65 0.13Note. , t, and * represent statistical significance at the 10, 5 and 1 percent levels. City and industry dummies included.
40
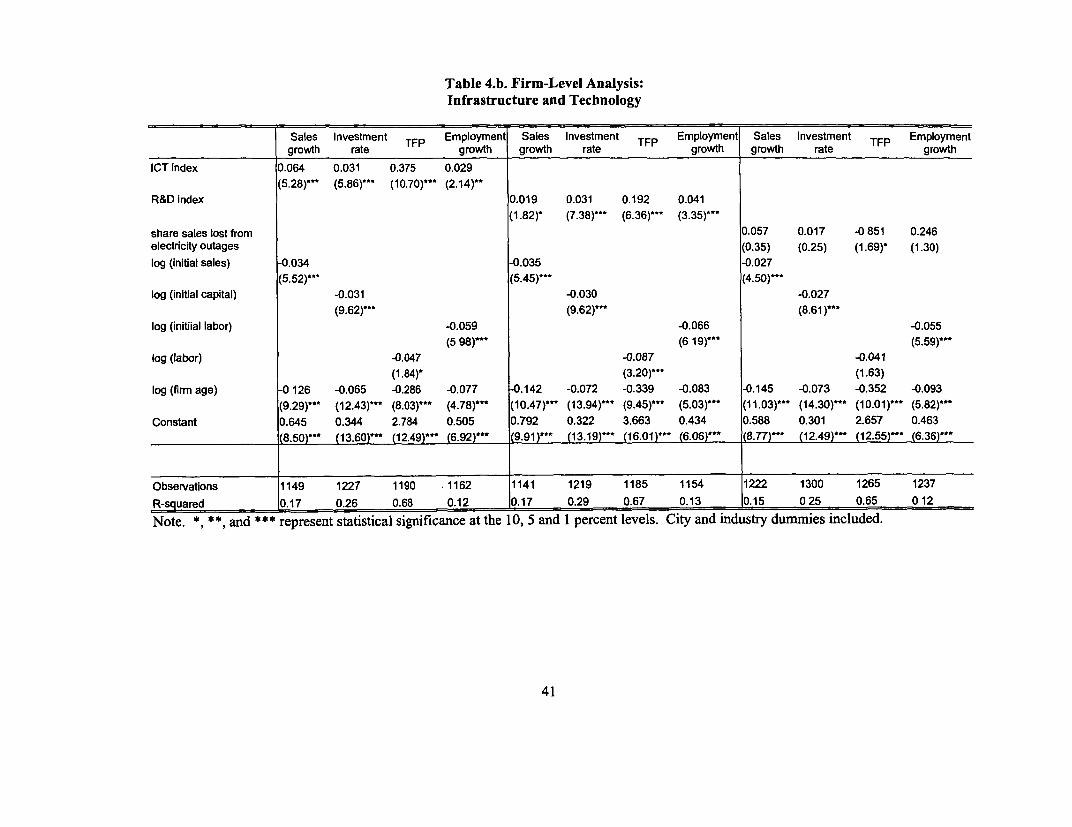
Table 4.b. Firm-Level Analysis:Infrastructure and Technology
Sales Investment F Employment Sales Investment TFP Employment Sales Investment TFP Employmentgrowth rate T growth growth rate growth growth rate growth
ICT index 0.064 0.031 0.375 0.029(5.28)... (5.86)... (10.70)... (2.14)--
R&D index 0.019 0.031 0.192 0.041(1.82) (7.38)r* (6.36)... (3.35)*..
share sales lost from 0.057 0.017 -0 851 0.246electricity outages (0.35) (0.25) (1.69)- (1.30)log (initial sales) -0.034 -0.035 -0.027
(5.52)... (5.45)... (4.50)...log (initial capital) -0.031 -0.030 -0.027
(9.62)... (9.62)... (8.61)...log (initiial labor) -0.059 -0.066 -0.055
(5 98)-- (6 19)... (5.59)--log (labor) -0.047 -0.087 -0.041
(1.84)' (3.20)... (1.63)log (firm age) -0 126 -0.065 -0.286 -0.077 4.142 -0.072 -0.339 -0.083 -0.145 -0.073 -0.352 -0.093
(9.29)... (12.43)... (8.03)'-- (4.78)... (10.47) ... (13.94)*** (9.45)'- (5.03).. (11.03)... (14.30)... (10-01)... (5.82)**-Constant 0.645 0.344 2.784 0.505 0.792 0.322 3.663 0.434 0.588 0.301 2.657 0.463
(8.50)*- (13.60)-- (12.49)... (6.92) (9.91)-.. (13.19) (16.01)... (6.06)'-- (8.77)- (12.49)- (12.55)- (6.36)...
Observations 1149 1227 1190 1162 1141 1219 1185 1154 1222 1300 1265 1237R-squared 0.17 0.26 0.68 0.12 0.17 0.29 0.67 0.13 0.15 0 25 0.65 0 12Note. * * and *** represent statistical significance at the 10, 5 and 1 percent levels. City and industry dummies included.
41

TabRe 4.c. Firm-Level Analysis:Labor
Sales Investment TFP Employ. Sales Investment TFP Employ. Sales Investment TFP Employ Sales Investment TFP Employ.growth rate growth growth rate growth growth rate growth growth rate growth
Share of non- 0 075 0.044 0.21 0 023permanent workers (1 59) (2 25)- (1.52) (044)
Staff quality index 0 056 0 036 0.32 0 03
(4 69)... (7 45)... (9 76)*- (2.04)-Share of labor that 0.108 0 06 0 298 -0.012receives training (4 46)-- (5.81)- (4.23)*- -0 42
Overmanning -0.207 -0 075 -0.453 -0.072(2 84)-- (2.50)- (2 08)- (0.90)
log(initial capital) -0 026 -0 035 -0.033 -0 029(8.27)... (9 50)--- (9.65)--- (8.83)...
log(labor) -0.04 -0 047 -0.053 -0 055-1 55 (1.69)' (1 93r (2.06)-
log(initial labor) -0.056 -0 07 -0 061 -0.057(5.84)... (5 75).e (5 37)-' (5.60)*.*
log(inibal sales) -0 025 -0 043 -0.035 -0 026(4.23)-- (6 20)... (5.32)*.. (4 11)--*
log(firm age) -0.136 -0.069 -0 353 -0 081 -0.129 -0 058 -0 274 -0.084 -0 13 -0.065 -0.3 -0.087 0.128 -0.066 -0.305 -0.084(10.19)- (13.28)- (9.81). (5.14)* (8.70) (10 19)- (7 32)** (4.35). (9 04)' (11.53).. (7.86) (4.72) (8.99)- (11.82)' (8 09)- (4.98).
Constant 0.698 0.346 3.094 0.522 0.53 0.169 2.152 0.331 0 702 0.285 2.882 0.584 0.533 0.303 2 617 0 467(9.37). (13 93)-- (13 61). (7 38) (5.42). (4 61) (6 68)- (2.92). (8.69).. (10.14)- (11 94)- (7.10).. (7.62)-- (12 18)- (12 37).* (6.34)
Observabons 1188 1261 1231 1200 953 1009 1015 961 1030 1097 1069 1041 1075 1145 1115 1089
R-squared 0.15 0 24 0.65 0 12 0 19 0.3 0 72 0.14 0.18 0.28 0.67 0.12 0.15 0.25 0.65 0.12
Note. *, t, and ¢** represent statistical significance at the 10, 5 and 1 percent levels. City and industry dummies included.
42

Table 4.d. Firm-Level Analysis:Administrative Burdens and Corruption
Sales Investment TFP Employment Sales Investment TFP Employment Sales Investment TFP Employmentgrowth rate growth growth rate growth growth rate growth
Time with regulatorsfinspectors 0.048 0.009 -0.087 0 023(2.19)- (0.94) (1.31) (0.91)
Share of firms refusing to -0.019 0.003 -0.186 -0.022answer managers' time withregulators (0.62) (0.21) (2.12)-- (0.61)share of sales lost from theft or -0.179 -0.028 -0.230 0.043breakage (1.00) (0.37) (0.43) (0.21)log(initial sales) -0.028 -0.027 -0.027
(4.70)*.. (4.49)-*' (4.55)-log (initial capital) -0 027 -0.027 -0.027
(8.65)-- (8.11)*** (8.62)...log(labor) -0.034 -0.037 -0.040
(1.34) (1.43) (1.57)log (initial labor) -0.057 -0.056 -0.055
(5.70)... (5.35)... (5.62)-log(firm age) -0.145 -0.073 -0.352 -0.093 -0.141 -0.074 -0.354 -0.094 -0.145 -0.073 -0.351 -0.094
(11.10)*** (14.34)-- (10.00)*-* (5.83)... (10.49)... (13.90)** (9.84)... (5.60)... (11.06)... (14.33)*.. (9.97)*** (5.85).*.Constant 0.589 0.300 2.605 0.475 0.607 0.306 2.603 0.391 0.597 0.303 2.609 0.479
(8.94)-- (12.65)*^* (2.44)*** (6.60)*** (8.90)*** (12.42)*** (12.32)*-* (5.54)*** (9.02)-*' (12.73)**- (12.42)*-* (6.67)***Observations 1222 1300 1265 1237 1131 1203 1167 1143 1222 1300 1265 1237R-squared 0.16 0.25 0.65 0.12 0.15 0.25 0.66 0.12 0.15 0.25 0.65 0.12
Note. *, *, and *** represent statistical significance at the 10, 5 and 1 percent levels. City and industry dummies included.
43

Table 4.e. IFirm-Level Analysis:Finance
Sales growth Investment rate TFP Employment growth
Finance index 0.051 0.022 0.143 0.047(5.30)*** (5.65)*** (5.00)*.* (4.31)***
share capital leveraged
log(inilial capital) -0.032(9.82)...
log(labor) -0.101(3.63)***
log(initial labor) -0.072(7.13)***
log(initial sales) -0.039(6.17).**
log(firm age) -0.140 -0.071 -0.347 -0.078(10.68)*** (14.03).*. (9.78)*.* (4.97)***
Constant 0.719 0.391 3.359 0.625(9-99).*. (15.48).*. (14.38)** (8.65)*.*
Observations 1185 1258 1228 1197R-squared 0.17 0.26 0.65 0.13
Note. 8, ^, and * represent statistical significance at the 10, 5 and 1 percent levels. City and industry dummies included.
44
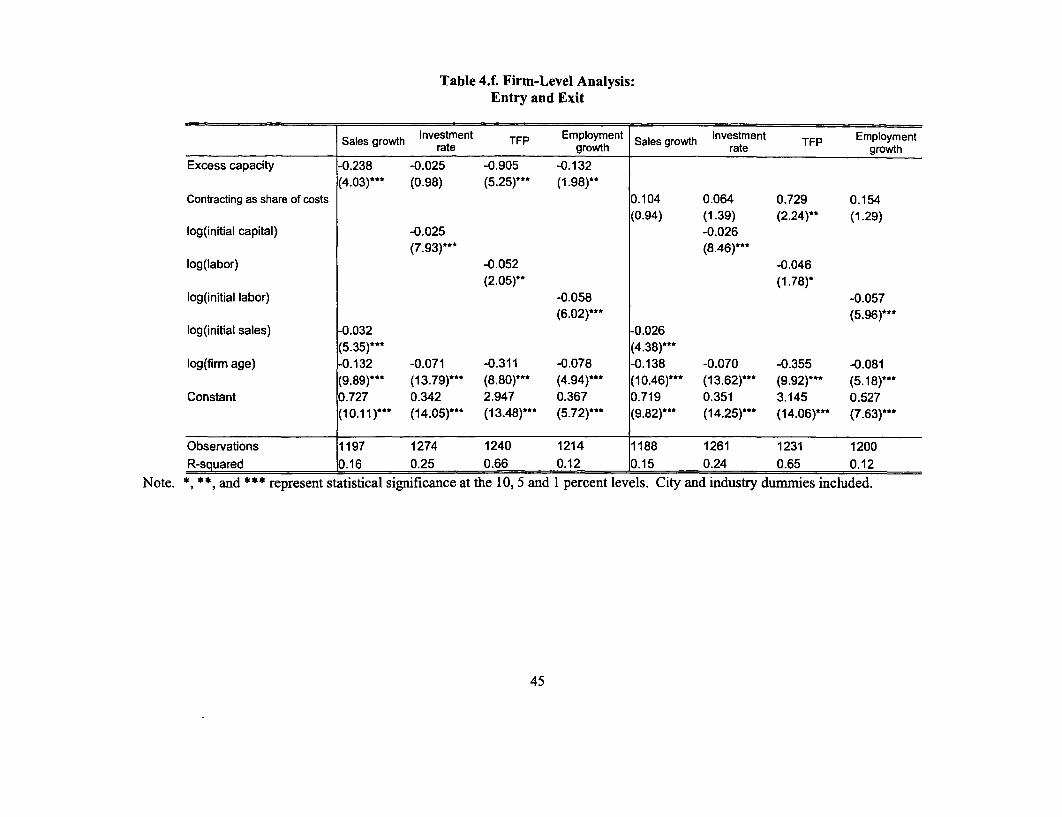
Table 4.f. Firm-Level Analysis:Entry and Exit
Sals rothInvestment TFP Employment Sales growth Investment TFP EmploymentSales growth Invesrate growth rate growth
Excess capacity -0.238 -0.025 -0.905 -0.132(4.03)*** (0.98) (5.25)**. (1.98)**
Contracting as share of costs 0.104 0.064 0.729 0.154(0.94) (1.39) (2.24)** (1.29)
log(initial capital) -0.025 -0.026(7.93)*** (8.46)***
log(labor) -0.052 -0.046(2.05)** (1.78)*
log(initial labor) -0.058 -0.057(6.02)*** (5.96)***
log(initial sales) -0.032 -0.026(5.35)*** (4.38)***
log(firm age) -0.132 -0.071 -0.311 -0.078 -0.138 -0.070 -0.355 -0.081(9.89)*** (13.79)*** (8.80)*** (4.94)*** (10.46)*** (13.62)*** (9.92)*** (5.18)***
Constant 0.727 0.342 2.947 0.367 0.719 0.351 3.145 0.527(10.11)*** (14.05)** (13.48)** (5.72)*** (9.82)*** (14.25)*** (14.06)*** (7.63)***
Observations 1197 1274 1240 1214 1188 1261 1231 1200R-squared 0.16 0.25 0.66 0.12 0.15 0.24 0.65 0.12
Note. * *, and *** represent statistical significance at the 10, 5 and 1 percent levels. City and industry dummies included.
45
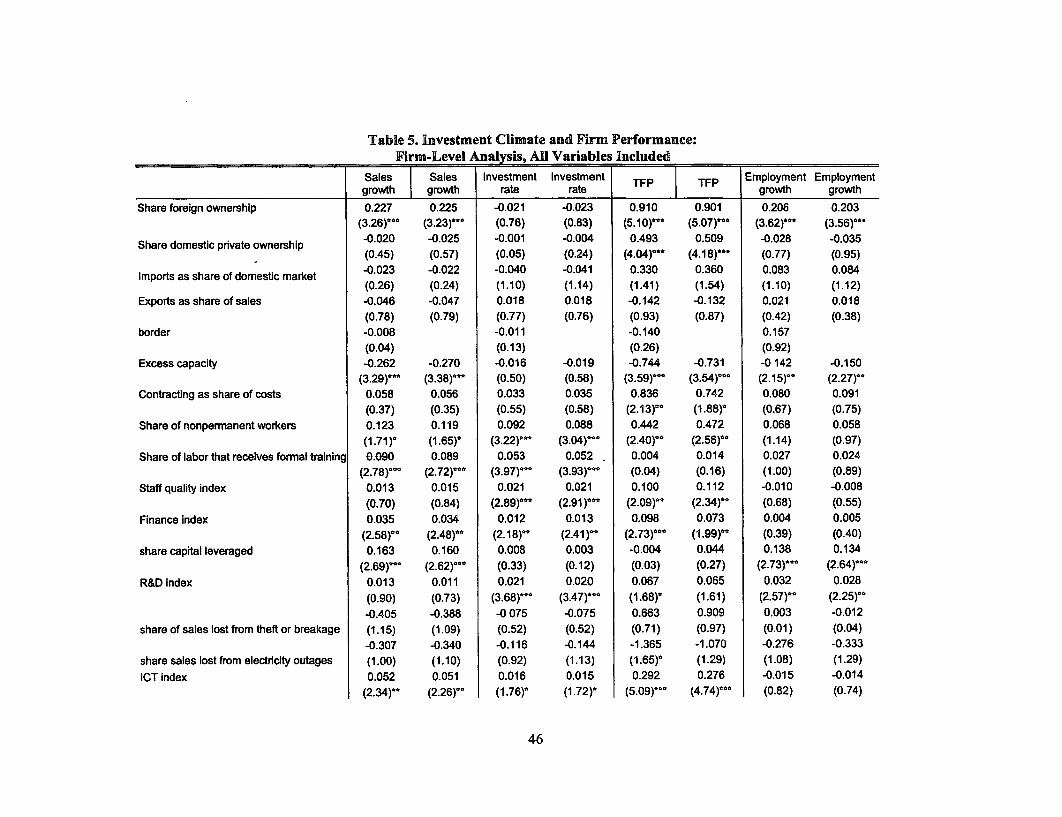
Table 5. Investment CliUmate and Firm Performance:Firm-Level Analysis, All Variables Included
Sales Sales Investment Investment TFP TFP Employmentgrowth | growth rate rate growth growth
Share foreign ownership 0.227 0.225 -0.021 -0.023 0.910 0.901 0.206 0.203
(3.26)r (3.23)r- (0.76) (0.83) (5.1o0)°° (5.07)r (3.62r)* (3.56)°-
Share domestic private ownership -0.020 -0.025 -0.001 -0.004 0.493 0.509 -0.028 -0.035(0.45) (0.57) (0.05) (0.24) (4.04)- (4.18)-- (0.77) (0.95)-0.023 -0.022 -0.040 -0.041 0.330 0.360 0.083 0.084(0.26) (0.24) (1.10) (1.14) (1.41) (1.54) (1.10) (1.12)
Exports as share of sales -0.046 -0.047 0.018 0.018 -0.142 -0.132 0.021 0.018
(0.78) (0.79) (0.77) (0.76) (0.93) (0.87) (0.42) (0.38)
border -0.008 -0.011 -0.140 0.157(0.04) (0.13) (0.26) (0.92)
Excess capacity -0.262 -0.270 -0.016 -0.019 -0.744 -0.731 -0 142 -0.150
(3.29)r (3.38)-- (0.50) (0.58) (3.59)°° (3.54)r- (2.15)-- (2.27r
Contracting as share of costs 0.058 0.056 0.033 0.035 0.836 0.742 0.080 0.091(0.37) (0.35) (0.55) (0.58) (2.13)r (1.88)* (0.67) (0.75)
Share of nonpermanent workers 0.123 0.119 0.092 0.088 0.442 0.472 0.068 0.058
(1.71)- (1.65) (3.22)*- (3.04)- (2.40) (2.56)* (1.14) (0.97)Share of labor that receives formal training 0.090 0.089 0.053 0.052 0.004 0.014 0.027 0.024
(2.78)r (2.72)°° (3.97)°° (3.93)- (0.04) (0.16) (1.00) (0.89)
Staff quality index 0.013 0.015 0.021 0.021 0.100 0.112 -0.010 -0.008(0.70) (0.84) (2.89)... (2.91)°° (2.09)°° (2.34)'° (0.68) (0.55)
Finance index 0.035 0.034 0.012 0.013 0.098 0.073 0.004 0.005(2.58)°° (2.48)°° (2.18)°° (2.41)° (2.73)r- (1 ggr)* (0.39) (0.40)
share capital leveraged 0.163 0.160 0.008 0.003 -0.004 0.044 0.138 0.134
(2.69). (2.62).. (0.33) (0.12) (0.03) (0.27) (2.73). (2.64)..R&D index 0.013 0.011 0.021 0.020 0.067 0.065 0.032 0.028
(0.90) (0.73) (3.68)... (3.47)*° (1.68)r (1.61) (2.57)°° (2.25)--
-0.405 -0.388 -0 075 -0.075 0.663 0.909 0.003 -0.012share of sales lost from theft or breakage (1.15) (1.09) (0.52) (0.52) (0.71) (0.97) (0.01) (0.04)
-0.307 -0.340 -0.116 -0.144 -1.365 -1.070 -0.276 -0.333share sales lost from electricity outages (1.00) (.1-0) (0.92) (1.13) (1.65r (1.29) (1.08) (1.29)ICT index 0.052 0.051 0.016 0.015 0.292 0.276 -0.015 -0.014
(2.34)°° (2.26)-4 (1.76)° (1.72)- (5.09)*** (4.74)*° (0.82) (0.74)
46

Table 5. Investment Climate and Firm Performance:Firm-Level Analysis, All Variables Included (Cont'd)
Sales Sales Investment Investment TFP TFP Employment Employmentgrowth growth rate rate growth growth
Share of firms refusing to answer -0.021 -0.027 0.009 0.006 -0.079 -0.051 0.036 0.024managers' time with regulators (0.52) (0.67) (0.54) (0.37) (0.77) (0.48) (1.09) (0.70)Time with regulators/inspectors 0.060 0.057 0.007 0.003 0.004 0.015 0.015 0.012
(1.58) (1.49) (0.43) (0.18) (0.04) (0.14) (0.46) (0.37)log (initial sales) -0.079 -0.080
(7.45r- (7.50)...log (initial capital) -0.053 -0.052
(10.39)^^^ (10.19)...log (inital labor) -0.095 -0.095
(7.92)^ (7.93)^^log (labor) -0.118 -0.110
(2.96)"^* (2.77)*^^log (firm age) -0.087 -0.084 -0.052 -0.053 -0.145 -0.131 -0.016 -0.015
(4.12)^ (3.96)-- (6.67)*^ (6.78)^^ (3.00)... (2.71)- (0.88) (0.83)Constant 0.784 0.800 0.262 0.253 1.576 1.270 0.387 0.369
(4.63r" (4.93)... (4.38)-- (4.54)^^- (3.22)'^^ (2.65)-^* (3.02)^^^ (2.89)**
City dummies included yes no yes no yes no yes noindustry dummies yes yes yes yes yes yes yes yes
Observations 569 569 603 603 606 606 572 572R-squared 0.29 0.29 0.38 0.39 0.80 0.80 0.25 0.26Note. *, **, and *** represent statistical significance at the 10, 5 and 1 percent levels. City and industry dummies included.
47
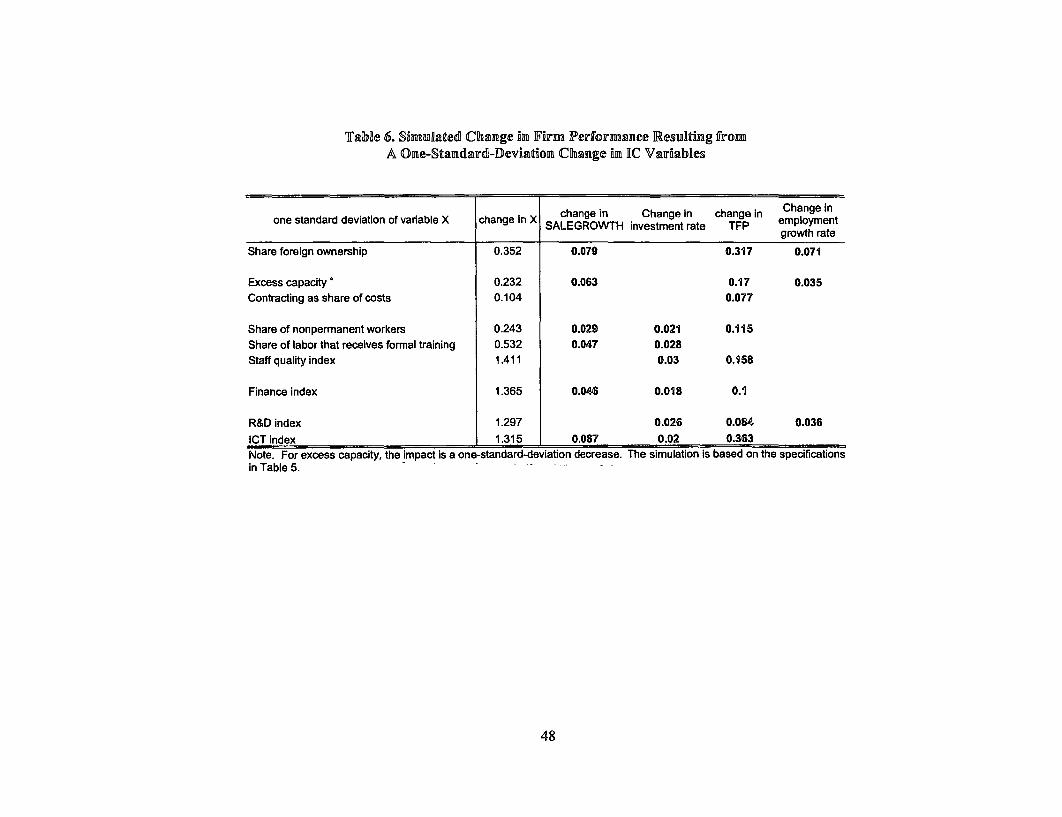
T'able 6. Simulated Change in Firm Performance Resulting fromA One-Standard-Deviation Change in IC Variabiles
change in Change in change In Change inone standard deviation of variable X change in X SALEGROWTH investment rate TFP employment
growth rate
Share foreign ownership 0.352 0.079 0.317 0.071
Excess capacity * 0.232 0.063 0.17 0.035Contracting as share of costs 0.104 0.077
Share of nonpermanent workers 0.243 0.029 0.021 0.115Share of labor that receives formal training 0.532 0.047 0.028Staff quality Index 1.411 0.03 0.158
Finance index 1.365 0.048 0.018 0.1
R&D index 1.297 0.026 0.084 0.036ICT index 1.315 0.067 0.02 0.363Note. For excess capacity, the impact is a one-standard-deviation decrease. The simulation is based on the specificationsin Table 5.
48


Policy Research Working Paper Series
ContactTitle Author Date for paper
WPS2983 Telecommunication Reform in Ghana Luke Haggarty March 2003 P Sintim-AboagyeMary M. Shirley 37644Scott Wallsten
WPS2984 Finance and Income Inequality. George Clarke March 2003 P Sintim-AboagyeTest of Alternative Theories Lixin Colin Xu 37644
Heng-fu Zou
WPS2985 The Impact of Minimum Wages on Vivi Alatas March 2003 T MaileiEmployment in a Low Income Lisa Cameron 87347Country: An Evaluation Using theDifference-in-Differences Approach
WPS2986 Government Bonds in Domestic and Stijn Claessens March 2003 E KhineForeign Currency: The Role of Daniela Klingebiel 37471Macroeconomic and Institutional Sergio SchmuklerFactors
WPS2987 East Asia's Dynamic Development Ho-Chul Lee March 2003 L. JamesModel and the Republic of Korea's Mary P. McNulty 35621Experiences
WPS2988 Trade Facilitation and Economic John S Wilson March 2003 P FlewittDevelopment: Measuring the Impact Catherine L. Mann 32724
Tsunehiro Otsuki
WPS2989 Decentralization and Public Services: Peyvand Khaleghian March 2003 H SladovichThe Case of Immunization 37698
WPS2990 Ways Out of Poverty Diffusing Best Michael Klein March 2003 F ShahPractices and Creating Capabilities- 84846Perspectives on Policies for PovertyReduction
WPS2991 Tenure Security and Land-Related Klaus Deininger March 2003 M FernandezInvestment Evidence from Ethiopia Songqing Jin 33766
Berhanu AdenewSamuel Gebre-SelassieBerhanu Nega
WPS2992 Market and Nonmarket Transfers of Klaus Deininger March 2003 M FernandezLand in Ethiopia: Implications for Songqing Jin 33766Efficiency, Equity, and Nonfarm Berhanu AdenewDevelopment Samuel Gebre-Selassie
Mulat Demeke
WPS2993 Dealing with the Coffee Crisis in Panos Varangis March 2003 P VarangisCentral America Impacts and Paul Siegel 33852Strategies Daniele Giovannucci
Bryan Lewin
WPS2994 Options for Financing Lifelong Miguel Palacios March 2003 E JamesLearning 31756
WPS2995 Commodity Market Reform in Africa: Takamasa Akiyama March 2003 P KokilaSome Recent Experience John Baffes 33716
Donald F. LarsonPanos Varangis

Policy Research Working Paper Series
ContactTitle Author Date for paper
WPS2996 Bank Competition, Financing Thorsten Beck March 2003 K LabrieObstacles, and Access to Credit Ashl Demirguq-Kunt 31001
Vojislav Maksimovic
WPS2997 Financial and Legal Institutions Thorsten Beck March 2003 K. Labrieand Firm Size Asl1 Demirgug-Kunt 31001
Vojislav Maksimovic
WPS2998 Does Micro-Credit Empower Women? Mark M. Pitt March 2003 P. KokilaEvidence from Bangladesh Shahidur R. Khandker 31001
Jennifer Cartwright
WPS2999 Explaining Liberalization Philipp Harms March 2003 P FlewittCommitments in Financial Aaditya Mattoo 32724Services Trade Ludger Schuknecht
WPS3000 International Climate Regime beyond Franck Lecocq March 2003 V. Soukhanov2012: Are Quota Allocations Rules Renaud Crassous 35721Robust to Uncertainty?
WPS3001 An Introduction to Financial and Antonio Estache March 2003 G. Chenet-SmithEconomic Modeling for Utility Martin Rodriguez Pardina 36370Regulators Jose Maria Rodriguez
German Sember
WPS3002 Information-Based Instruments for Uwe Deichmann March 2003 Y. D'SouzaImproved Urban Management Somik V. Lall 31449
Ajay SunPragya Rajoria