pilot investment climate assessment - world...
TRANSCRIPT
Pilot Investment ClimateAssessment
Improving theInvestment Climatein Bangladesh
An Investment Climate Assessment
Based on an Enterprise Survey
Carried Out by the Bangladesh Enterprise
Institute and the World Bank
June 2003
33689
Pub
lic D
iscl
osur
e A
utho
rized
Pub
lic D
iscl
osur
e A
utho
rized
Pub
lic D
iscl
osur
e A
utho
rized
Pub
lic D
iscl
osur
e A
utho
rized
Pub
lic D
iscl
osur
e A
utho
rized
Pub
lic D
iscl
osur
e A
utho
rized
Pub
lic D
iscl
osur
e A
utho
rized
Pub
lic D
iscl
osur
e A
utho
rized

ii
© 2003 The International Bank for Reconstructionand Development / THE WORLD BANK1818 H Street, N.W.Washington, D.C. 20433, USA
The material in this work is copyrighted. No part ofthis work may be reproduced or transmitted in anyform or by any means, electronic or mechanical,including photocopying, recording, or inclusion inany information storage and retrieval system, withoutthe prior written permission of the World Bank. TheWorld Bank encourages dissemination of its workand will normally grant permission promptly.
For permission to photocopy or reprint, pleasesend a request with complete information to theCopyright Clearance Center, Inc, 222 RosewoodDrive, Danvers, MA 01923, USA, telephone978-750-8400, fax 978-750-4470,
www.copyright.com All other queries on rights and licenses, including
subsidiary rights, should be addressed to the Office of the Publisher, World Bank, 1818 H Street NW,Washington, DC 20433, USA, fax 202-522-2422, e-mail [email protected]
Library of Congress Cataloging-in-Publication Datahas been applied for.
Acknowledgments iv
Acronyms and Abbreviations v
Executive Summary vi
1. Investment Climate Matters 1
Key Features of the Investment Climate 1
Governance 1
Infrastructure 2
Access to Finance 2
International Integration 3
Human Resources 3
Linking the Investment Climate with Growth 3
An Overview of the Bangladesh Economy 3
The Survey—and What Its Findings Reveal 8
2. Bangladesh’s Investment Climate in
International Perspective 10
A Strong Macroeconomic Performance 10
Poor Integration with the Global Economy 11
Serious Deficiencies in Infrastructure 13
Power 15
Transport, Ports, and Customs 16
Telecommunications 18
Governance Problems 20
Governance Quality 20
Entry 22
Access to Finance 23
Lagging in Human Resources 24
A Weak Record in Technological Innovation 26
3. The Effects of Bangladesh’s
Investment Climate on Firms 28
International Integration—The Potential of Exports and the Rise of a New Industry 28
Governance a Big Burden on Firms 29
Regulation 29
Corruption 31
Legal System 32
Access to Finance a Growing Concern 32
Flexible Rules for Labor 34
Greater Difficulties for Small- and Medium-Size Enterprises 34
Comparing the Investment Climates in Chittagong and Dhaka 37
Infrastructure 37
Regulation and Corruption 38
What’s the Bottom Line? 38
Simulating the Gains from a Better Investment Climate 39
4. Conclusions and PolicyRecommendations 42
Easing Bottlenecks in Infrastructure 42
Power 42
Telecommunications 45
Transport, Ports, and Customs 46
Strengthening Governance 46
Improving Access to Finance 47
Appendix 1: Sampling Methodology 50
Trade Associations Contacted 52
Chambers of Commerce Contacted 53
Other Sources 53
Government Sources 53
Others 53
Appendix 2: Technical Appendix 56
Regression Analyses 56
Simulations 57
Indexes 57
Appendix 3: Standard Investment Climate Tables 62
References 73
Contents iii
Acknowledgments iv
The authors gratefully acknowledge financial supportfrom the United Kingdom’s Department forInternational Development (DFID), which supportedthe implementation of the survey and the collaborationwith the Bangladesh Enterprise Institute (BEI) in thesurvey and analytical work. BEI staff contributing tothis report include Farooq Sobhan and M. H.Khaleque. World Bank staff contributing to the reportinclude Khurshid Alam, George R. G. Clarke, DavidDollar, Giuseppe Iarossi, Esperanza Lasagabaster,Syed A. Mahmood, Giovanni Tanzillo, and Scott
Wallsten. The study team appreciates the efforts ofadvisors of the survey team. Members of the advisorypanel include Sayed Alamgir, F. Chowdhury,Ambassador Mustafa Faruque Mohammed,Ambassador M. Aminul Islam, Ambassador M.Shafiullah, Zahid Hussain, and M. Shamsur Rahman.The authors thank Arif Ahamed of World Bank, K. B. AlMasum, and Ayesha Novera for excellent researchassistance and the Survey and Research System inBangladesh for collaborating with the BEI inimplementing the survey.
Acronyms and Abbreviations v
ASYCUDA++ Automated System for CustomsData
BEI Bangladesh Enterprise Institute BPDB Bangladesh Power Development
Board BSIC Bangladesh Standard Industrial
ClassificationBTTB Bangladesh Telegraph and
Telephone Board DESA Dhaka Electric Supply Authority DESCO Dhaka Electric Supply Company DFID Department for International
Development DIFE Department of Inspection for
Factories and Establishments,Ministry of Labor andEmployment, Bangladesh
GDP gross domestic productNCBs national commercial banks PGCB Power Grid Company of
BangladeshUNCTAD United Nations Conference on
Trade and Development UNESCO United Nations Educational,
Scientific, and CulturalOrganization
R&D research and development TFP total factor productivity
Over the past decade Bangladesh performed well onmany macroeconomic indicators, became moreintegrated with the world economy, and achievedimpressive social gains. This progress in the 1990s isheartening. But the performance of other low-incomecountries suggests that Bangladesh has fallen shortof its growth potential. While Bangladesh hasmaintained fairly high per capita growth for the pastdecade, its growth has nonetheless lagged far behindthat in some countries. Take China and India. As aresult of the more rapid growth in these countries, abig gap has opened up in per capita income, thoughall three countries started out at similar income levelsin the 1980s.
Which features of Bangladesh’s investmentclimate pose particular obstacles to economic growthand development? To answer that question, thisinvestment climate assessment uses data from a 2002survey of a 1001 manufacturing firms in Bangladeshand from myriad publicly available sources. The hopeis that its results will help identify the reforms mostcritical to private sector development and facilitateconsensus on a more far-reaching agenda of reform.Some of the main findings:
• Infrastructure poses some of the most severeobstacles facing firms. Bangladesh fares worsethan its neighbors on general measures ofinfrastructure, and the vast majority of firms reportthat problems in infrastructure seriously hampertheir growth.
• Electricity problems plague firms in Bangladesh,which has less generation capacity per capitathan its neighbors. Firms report experiencingpower outages or surges nearly every day theyoperate. As a result, more than 70 percent rely on electric generators—at great expense. Onaverage, these generators cost more than$20,000 to purchase and 50 percent more perkilowatt-hour to operate than the price of powerfrom the public grid.
• Corruption is pervasive. Bangladesh ranks worseon measures of corruption than its neighbors—with more than half the firms reporting it as a majoror very severe obstacle.
• Firms view regulation as a serious problem.Starting a firm in Bangladesh is fairly difficult. Andonce firms are running, they receive frequent visitsfrom government agencies—about 17 a year onaverage.
• Finance appears to be a looming problem. Whilemost firms appear to have access to finance, it is mostly short-term and nearly 60 percent of firms with a line of credit report having exhaustedthat credit. Moreover, the very large share of nonperforming loans portends potentialdifficulties.
• Small- and medium-size firms are disproportionatelyaffected by all these problems. The smaller the firm,the more of its resources it devotes to bribes andto dealing with government visits and inspections—and the less likely it is to have access to formalfinance. These problems can pose great barriers tomarket entry and growth for small firms.
Dealing with these problems is no simple matter.But their size and prevalence underscore the urgencyof reform. Among the potentially most importantreforms are unbundling electricity generation andtransmission, encouraging private investment in thepower sector, corporatizing the ports, increasingaccountability in the civil service, and streamliningregulatory procedures while eliminating unnecessaryones.
What would the private sector stand to gain fromsuch reforms? Simulations based on the surveyresults estimate the potential gains from a 50 percentimprovement in critical investment climate measures.While a 50 percent improvement may sound large,such a change would still leave Bangladesh with, forexample, less reliable electricity and longer waits incustoms than firms in China endure. The simulation
Executive Summary vi
results suggest that the improvements could boostsales growth from 7 percent to more than 10 percent,raise the investment rate from about 9.5 percent to 12 percent, and more than double total factorproductivity.
Carrying out the needed reforms may be difficult,but the costs of avoiding and delaying them are high.
And the urgency of reform will only increase as theMultifibre Arrangement is phased out by December2004, deepening the obstacles posed by a poorinvestment climate. The survey findings show, inrigorous, quantifiable ways, how much the poorinvestment climate costs firms—and how the voices ofthe thousand firms call out for reform.
Executive Summary vii
1. Investment Climate Matters
In recent years policymakers and multilateralorganizations have increasingly emphasized theimportance of a sound investment climate forpromoting economic growth in developing countries(Stern 2002b). Emphasizing investment used to meanadvocating greater quantities of investment, under theassumption that a financing gap was a barrier todevelopment. Today, few accept this simplistic view.Indeed, recent research shows surprisingly littlecorrelation between investment levels and growthrates, at least in the short run (Easterly 1999). Thuswhile this report is concerned with investment, it does not focus on its quantity. Instead, it focuses on the institutional and policy environment thatdetermines whether investments pay off in greatercompetitiveness for firms and in sustained growth forthe economy—that is, the investment climate.1 Aproductive investment climate can be broadly thoughtof as an environment in which governance andinstitutions support entrepreneurship and well-functioning markets in order to help generate growthand development.
Key Features of the Investment ClimateDefining investment climate precisely is difficult. Butone useful definition is the “policy, institutional, andbehavioral environment, both present and expected,that influences the returns, and risks, associated withinvestment” (Stern 2002b). This environment isgenerally seen as having three main features:macroeconomic conditions, governance, andinfrastructure. Macroeconomic (or country-level)factors include such issues as fiscal, monetary, andexchange rate policies and political stability.Governance relates to government interactions withbusiness, which typically mean regulation andcorruption, both of which affect the costs of starting andrunning a business. Infrastructure refers to the qualityand quantity of physical infrastructure (such as power,
transport, and telecommunications). More broadly, itcan also refer to financial infrastructure (such asbanking)—or access to finance. Beyond these featuresof the investment climate, this report also looks atinternational integration and human resources.
GovernanceA country’s general structure of governance and theinstitutions that govern interactions between businessand government determine the burden that firms facein complying with government regulations, the qualityof government services, and the extent to whichcorruption is associated with the procurement of these services. A large regulatory burden is oftenassociated with corruption, involving payments toinspectors who visit firms or to officials who grantpermits. Corruption can easily deter foreign anddomestic investors. Recent empirical researchconfirms, for example, that measures of corruption aresignificantly and negatively related to inflows offoreign direct investment (Smarzynska and Wei 2000;Wei 2000).
Finding quantitative measures of the quality ofgovernment regulation and the cost imposed bycorruption is generally difficult. But many researchersand practitioners have tried to produce aggregatestatistics that can be used for comparisons acrosscountries. One study looks at the regulatory andadministrative issues affecting firms’ day-to-dayoperations. Friedman and others (2000) compileindexes of taxation levels and “overregulation”(essentially, indexes of the business environment) in69 countries. While they find no evidence that highertax rates drive firms underground, they do find asignificant correlation between measures ofoverregulation and the size of the unofficial economy:“more overregulation is correlated with a largerunofficial economy” (Friedman and others 2000). Thuswhile higher tax rates do not appear to drive awayinvestors, the myriad obstacles to starting andrunning a business do.
1Investment Climate Matters
Investment Climate Matters 2
This does not mean that all regulations indeveloping countries are only onerous andunnecessary. On the contrary, regulations andregulatory agencies can play an important role inmitigating market failures (such as environmentalpollution), protecting consumers (for example, againstfirms that can exercise market power), and ensuringsafe working conditions. But regulations in developingcountries tend to be more complex and bureaucraticthan necessary, are associated with corruption, andoften are not intended to correct market failures orprotect consumers. Indeed, Djankov and others(2002) find that more regulations are generally notassociated with better societal outcomes indeveloping countries. This report focuses on the costsof regulatory inspections to firms, however; societaloutcomes are beyond its scope.
A particularly important aspect of governance isthe ease with which firms can enter and exit amarket—an important determinant of productivity,investment, and entrepreneurship (Lansbury andMayes 1996). Where entry and exit are relatively easy,poorly performing firms can leave the market—permitting their assets to be reallocated to moreproductive uses—and new, more productive andinnovative firms can emerge. The entrepreneurshipthat is unleashed accelerates economic growth andwelfare improvements in developing and transitioneconomies. New firms “have usually been the fastest-growing segment in transition countries” (McMillanand Woodruff 2002).
But the governments of many developing andtransition economies, failing to recognize that birthsand deaths of firms are an inevitable corollary ofentrepreneurial risk taking, have erected a maze ofadministrative obstacles to starting, operating, andclosing firms. Compiling data on entry regulations in85 countries, Djankov and others (2002) discoverenormous variation in the number of proceduresrequired to start firms, ranging from 2 in Canada to 20in the Dominican Republic (with Bolivia and the
Russian Federation also close to 20). The timerequired to establish a firm ranges from 2 businessdays to 214 in Mozambique. These procedures canbe extremely costly to the economy: in Mozambiquethe cost of official procedures (that is, excludingbribes) for setting up a new business amounts to 214 percent of per capita income. In Africa, Emeryand others (2000) find, “this whole maze of often duplicative, complex, and non-transparentprocedures can mean delays of up to two years to getinvestments approved and operational.” Moreover,Djankov and others (2002) find that stricter regulationof entry is correlated with more corruption and a largerinformal economy.
InfrastructureIn countries with poor infrastructure, businesses mustdevote more resources to such tasks as acquiringinformation, procuring inputs, and getting theirproducts to market. Especially for goods marketedinternationally, poor infrastructure can undermine thecompetitiveness of firms—at best making it morecostly for them to operate, and at worst deterring themfrom entering markets where they would otherwisehave been able to operate efficiently.
Infrastructure and firm performance interact inseveral ways. Established firms already connected toutilities are affected by the quality of the service. Newfirms or firms hoping to expand are concerned withdifficulties in connecting to utilities.
Access to FinanceEconomic theory holds that businesses will invest inprojects where the expected benefits exceed the costof investment. But this efficient outcome can beachieved only when entrepreneurs face no creditconstraints unrelated to their own performance. Creditconstraints are less likely in countries with well-developed and well-functioning financial systems.Indeed, a great deal of research has shown theimportance of financial sector development for growth
Investment Climate Matters 3
(Levine 1997; World Bank 2001b). A healthy financialsystem, by freeing firms from financial constraints,allows them to expand according to their expectedpotential rather than their current stock of cash. Thuscountries with well-developed financial systems(banks, stock and bond markets) tend to grow fasterthan countries with less well-developed systems.
International IntegrationResearch has shown that countries that aggressivelypursued integration with the global economy (such asBrazil, China, India, Malaysia, Mexico, the Philippines,and Thailand) grew more quickly in the 1990s thanthose that did not. Indeed, many studies find thatopenness to trade and foreign direct investmentaccelerates growth (for example, Dollar and Kraay2001; and Frankel and Romer 1999).
Studies using different measures of openness totrade—including the relative size of trade (asmeasured by imports and exports as a share of GDP)and the degree of trade distortion (as measured byaverage tariff rates and dispersion)—strongly suggestthat greater openness is associated with faster growthin both industrial and developing countries. Sachsand Warner (1995) find that openness is a highlysignificant determinant of growth and, whencombined with property rights, might even represent asufficient condition for growth in poor economies.Kang and Sawada (2000) find a similar effect ofopenness on growth, arguing that openness,combined with financial development, increasesgrowth in developing countries by reducing the costof investing in human capital.
Human ResourcesThe availability of inputs is a crucial element of theinvestment climate. For human resources, this impliesmore than just an abundant supply of workers. It also implies workers with sufficient education andtechnological know-how.
Linking the Investment Climate with GrowthStudies have found strong correlations betweenmeasures of investment climate and economic growth(see, for example, Kaufmann, Kraay, and Zoido-Lobatón 2000; and Knack and Keefer 1995). Thesestudies typically use data generated from surveys ofprivate businesses and reflect the extent to whichinvestors or firms perceive problems with harassment,corruption, and inefficient regulation. But most macro-level indicators of investment climate used in thesestudies are of little help to countries in identifyingexactly what needs to be done to create a betterinvestment climate. That requires delving much moredeeply, drawing on micro-level evidence from surveysof large numbers of firms, including small andmedium-size enterprises.
To begin to get an objective, empirical look at theinvestment climate at the firm level in Bangladesh, thisreport uses a new survey of 1,001 firms in Chittagongand Dhaka. Following a standard approach forinvestment climate assessments, it compares theinvestment climate in Bangladesh with that in othercountries—including its main competitors, China,India, and Pakistan—using similar surveys andpublicly available country-level data sets (box 1.1).And it explores the investment climate indicators fromBangladesh in more depth at the firm level, throughanalyses that include investigations of how theinvestment climate differs between Chittagong andDhaka and between small and large firms.
An Overview of the Bangladesh EconomyIn the 1990s Bangladesh became increasinglyintegrated with the global economy, with its tradedoubling over the decade to reach 31 percent of GDPby 2001. Efforts to increase integration had started inthe 1980s and continued into the early 1990s. As earlyas 1982 the country’s New Industrial Policy began to lift import controls and encourage exports. The
Investment Climate Matters 4
Revised Industrial Policy of 1986 furthered thesereforms, loosening more restrictions on imports,reducing antiexport bias by rationalizing tariffs, andeasing the import of inputs for production. By the endof the 1990s average nominal tariff rates inBangladesh had declined from more than 100 percentto about 20 percent, and tariff rates for manufacturedimports from 52 percent to 16 percent. The fixedexchange rate system was replaced with a moreflexibly administered system, foreign investment wasderegulated (with a few exceptions), and restrictionson repatriating profit and income from foreigninvestment were eliminated.
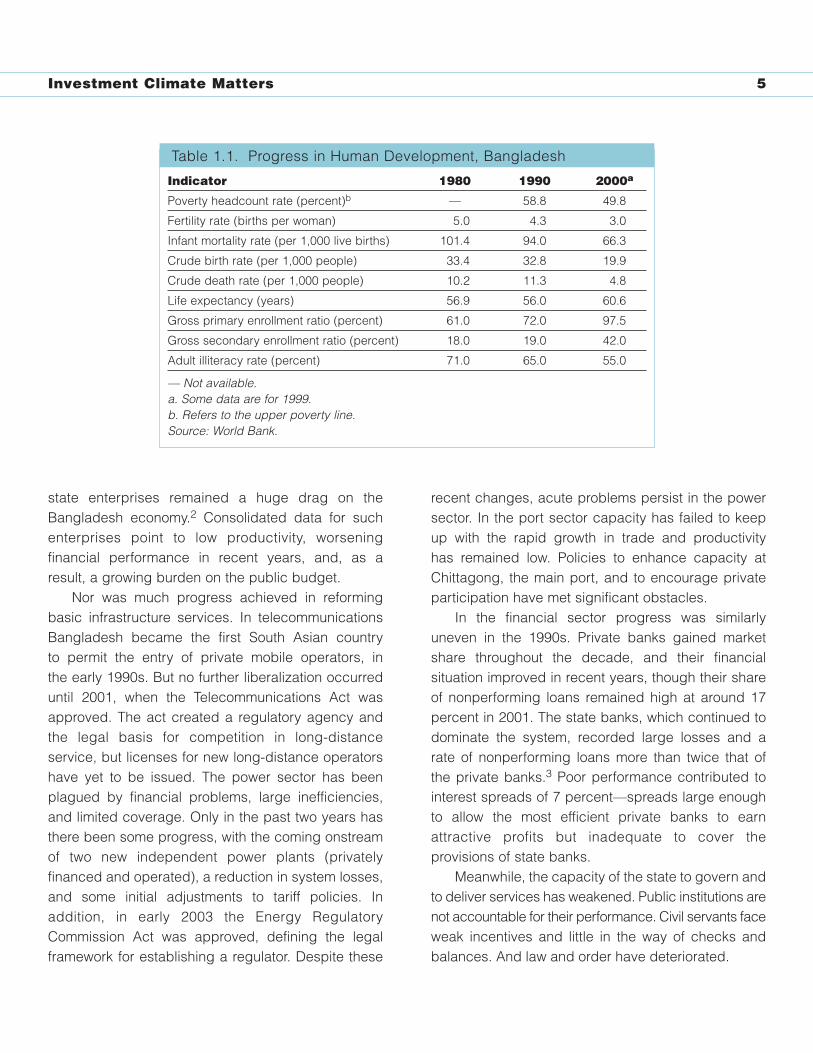
In parallel, the country undertook substantialinvestments in human development, making greatstrides in such areas as primary enrollment, girls’education, immunization, child nutrition, and fertilityreduction. Primary enrollment, for example, rose from61 percent in 1980 to 72 percent in 1990 and 97.5percent in 2000 (table 1.1).
By contrast, reforms in other areas, particularly inthe institutional and regulatory framework, were farless encouraging. Efforts launched in the early 1990sto deepen liberalization across economic sectorssoon lost momentum. The program to divest stateenterprises in manufacturing quickly stagnated, and
Investment climate assessments systematically analyzethe conditions for private investment and enterprisegrowth in a country, drawing on the experience of localfirms to pinpoint the areas where reform is most needed to improve the private sector’s productivity andcompetitiveness. By providing a practical foundation forpolicy recommendations and involving local partnersthroughout the process, the assessments are designed togive greater impetus to policy reforms that can speed theprivate sector’s growth, leading to faster economic growthand poverty reduction.
Produced by the World Bank Group in closepartnership with a public or private institution in eachcountry, the investment climate assessments are basedon a survey of private enterprises designed to find outwhat difficulties they encounter in starting and running abusiness—and, if the business fails, in exiting. Thesurvey captures firms’ experience in a range of areas—financing, governance, regulation, tax policy, laborrelations, conflict resolution, infrastructure services,supplies and marketing, technology and training. All these are areas where difficulties can addsubstantially to the costs of doing business. The surveyattempts to quantify these costs. Using a standardmethodology, the assessment then compares the surveyfindings with those in similar countries to evaluate how
the country’s private sector is faring and how well it cancompete.
The findings of the survey, combined with relevantinformation from other sources, provide a practical basisfor identifying the most important areas for reform aimedat improving the investment climate. The assessmentslook in detail at policy, regulatory, and institutional factorsthat hamper the provision of good-quality infrastructureservices and the functioning of product, financial, andother markets, linking the constraints to firms’ costs andproductivity.
In each country the investment climate assessmentsdraw on the guidance and expertise of local partners ingovernment and the business community. The findingsand policy recommendations emerging from theassessments are discussed extensively with the privatesector and other stakeholders in the country. This broaddissemination of the findings is aimed at engaging notonly policymakers but also business leaders, investors,nongovernmental organizations, and the donorcommunity in shaping the national private sectordevelopment strategy, forging consensus on the prioritiesfor reform of the investment climate, and laying thegroundwork for concrete responses to the problemsidentified. Updates of the assessment can help trackprogress in improving the investment climate.
Box 1.1. What Is an Investment Climate Assessment?
Investment Climate Matters 5
state enterprises remained a huge drag on theBangladesh economy.2 Consolidated data for suchenterprises point to low productivity, worseningfinancial performance in recent years, and, as aresult, a growing burden on the public budget.
Nor was much progress achieved in reformingbasic infrastructure services. In telecommunicationsBangladesh became the first South Asian country to permit the entry of private mobile operators, in the early 1990s. But no further liberalization occurreduntil 2001, when the Telecommunications Act wasapproved. The act created a regulatory agency andthe legal basis for competition in long-distanceservice, but licenses for new long-distance operatorshave yet to be issued. The power sector has beenplagued by financial problems, large inefficiencies,and limited coverage. Only in the past two years hasthere been some progress, with the coming onstreamof two new independent power plants (privatelyfinanced and operated), a reduction in system losses,and some initial adjustments to tariff policies. Inaddition, in early 2003 the Energy RegulatoryCommission Act was approved, defining the legalframework for establishing a regulator. Despite these
recent changes, acute problems persist in the powersector. In the port sector capacity has failed to keepup with the rapid growth in trade and productivity has remained low. Policies to enhance capacity atChittagong, the main port, and to encourage privateparticipation have met significant obstacles.
In the financial sector progress was similarlyuneven in the 1990s. Private banks gained marketshare throughout the decade, and their financialsituation improved in recent years, though their shareof nonperforming loans remained high at around 17percent in 2001. The state banks, which continued todominate the system, recorded large losses and arate of nonperforming loans more than twice that ofthe private banks.3 Poor performance contributed tointerest spreads of 7 percent—spreads large enoughto allow the most efficient private banks to earnattractive profits but inadequate to cover theprovisions of state banks.
Meanwhile, the capacity of the state to govern andto deliver services has weakened. Public institutions arenot accountable for their performance. Civil servants faceweak incentives and little in the way of checks andbalances. And law and order have deteriorated.
Indicator 1980 1990 2000a
Poverty headcount rate (percent)b — 58.8 49.8
Fertility rate (births per woman) 5.0 4.3 3.0
Infant mortality rate (per 1,000 live births) 101.4 94.0 66.3
Crude birth rate (per 1,000 people) 33.4 32.8 19.9
Crude death rate (per 1,000 people) 10.2 11.3 4.8
Life expectancy (years) 56.9 56.0 60.6
Gross primary enrollment ratio (percent) 61.0 72.0 97.5
Gross secondary enrollment ratio (percent) 18.0 19.0 42.0
Adult illiteracy rate (percent) 71.0 65.0 55.0
— Not available.a. Some data are for 1999. b. Refers to the upper poverty line.Source: World Bank.
Table 1.1. Progress in Human Development, Bangladesh

Investment Climate Matters 6
Despite this mixed picture in reform, Bangladeshachieved positive growth results. In 1991–2000 realGDP growth averaged about 4.8 percent a year (60percent for the period), and its volatility declined.Contributing to this higher growth trajectory washigher private investment and greater integration withthe global economy. Private investment increasedfrom a very depressed level of 4 percent of GDP in theearly 1970s to more than 15 percent of GDP in the late1990s (table 1.2). Investment growth has been themost stable stimulus to GDP growth during the lasttwo decades. Exports began to emerge as anothermajor source of growth in the late 1980s, becomingeven more important in the 1990s. The export stimuluscame mainly from woven garments and knitwear,which grew from $32 million in the early 1980s tonearly $5 billion in early 2000. Woven garments andknitwear now account for 75 percent of Bangladesh’stotal annual exports. The next largest items are frozen
food and raw jute, which respectively account for 5percent and 4 percent of total exports.
The new growth pattern is reflected in thestructure of the economy, which underwent significantchanges (table 1.3). The share of agriculture(including fisheries) declined from about 32 percent ofGDP in the early 1980s to slightly over 24 percent ofGDP in fiscal year 2002. The share of manufacturing,on the other hand, increased from less than 11percent of GDP in the early 1980s to 15 percent ofGDP in fiscal year 2002. However, the latter is stillsmall relative to the share of manufacturing in theSouth East Asian economies (around 25–35 percentof GDP). Also manufacturing activity remains heavilyconcentrated in Dhaka and Chittagong.
Bangladesh’s economic performance, combinedwith its notable success in slowing population growthover the past two decades, produced real per capitaGDP growth of 3.1 percent a year (36 percent over the
FY81 FY91 FY99 FY00 FY01 FY02
Investment 17.6 16.9 22.2 23.0 23.1 23.2
Private 12.4 10.3 15.5 15.6 15.8 16.8
Public 5.2 6.6 6.7 7.4 7.2 6.4
Gross Domestic Saving 12.5 14.6 17.7 17.9 18.0 18.2
Gross National Saving 17.8 19.7 22.3 23.1 22.4 23.4
Source: World Bank.
Table 1.2. Investment and Savings as Percent of GDP,Bangladesh (1981–2002)
FY81 FY91 FY99 FY00 FY01 FY02
Agriculture and fishing 32.3 28.7 24.3 24.3 24.6 24.1
Manufacturing 10.8 12.2 15.2 15.0 14.8 15.0
Other 56.8 59.1 60.5 60.7 60.6 60.9
GDP 100.0 100.0 100.0 100.0 100.0 100.0
Source: Bangladesh Bureau of Statistics
Table 1.3 GDP Composition of Selected Sectors, Bangladesh(1981–2002)
Investment Climate Matters 7
decade). Not surprisingly, survey-based estimates ofconsumption poverty show that the 1990s were aperiod of declining poverty. While 59 percent of thecountry’s population was poor in 1991–92, the povertyrate dropped to 50 percent in 2000, reflecting adecline of 1.8 percent a year (see World Bank 2002afor a discussion of the poverty line applied). This trendis encouraging. In the previous decade, marked byslower GDP growth of about 4.3 percent a year,poverty declined by only 0.8 percent a year in 1983–91 (see Interim Poverty Reduction Strategy Paper2003).
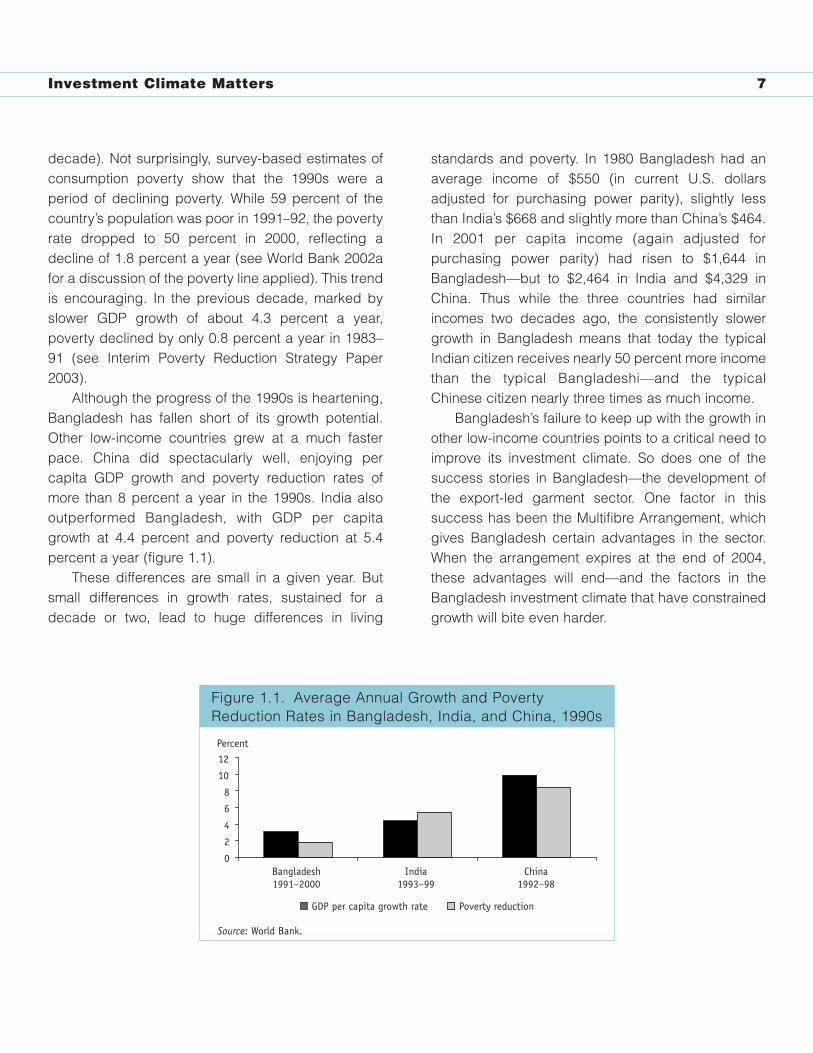
Although the progress of the 1990s is heartening,Bangladesh has fallen short of its growth potential.Other low-income countries grew at a much fasterpace. China did spectacularly well, enjoying percapita GDP growth and poverty reduction rates ofmore than 8 percent a year in the 1990s. India alsooutperformed Bangladesh, with GDP per capitagrowth at 4.4 percent and poverty reduction at 5.4percent a year (figure 1.1).
These differences are small in a given year. Butsmall differences in growth rates, sustained for adecade or two, lead to huge differences in living
standards and poverty. In 1980 Bangladesh had anaverage income of $550 (in current U.S. dollarsadjusted for purchasing power parity), slightly lessthan India’s $668 and slightly more than China’s $464.In 2001 per capita income (again adjusted forpurchasing power parity) had risen to $1,644 inBangladesh—but to $2,464 in India and $4,329 inChina. Thus while the three countries had similarincomes two decades ago, the consistently slowergrowth in Bangladesh means that today the typicalIndian citizen receives nearly 50 percent more incomethan the typical Bangladeshi—and the typicalChinese citizen nearly three times as much income.
Bangladesh’s failure to keep up with the growth inother low-income countries points to a critical need toimprove its investment climate. So does one of thesuccess stories in Bangladesh—the development ofthe export-led garment sector. One factor in thissuccess has been the Multifibre Arrangement, whichgives Bangladesh certain advantages in the sector.When the arrangement expires at the end of 2004,these advantages will end—and the factors in theBangladesh investment climate that have constrainedgrowth will bite even harder.
Figure 1.1. Average Annual Growth and Poverty Reduction Rates in Bangladesh, India, and China, 1990s
0
2
4
6
8
10
12
Bangladesh1991–2000
India1993–99
China1992–98
GDP per capita growth rate Poverty reduction
Percent
Source: World Bank.
Figure 1.1. Average Annual Growth and PovertyReduction Rates in Bangladesh, India, and China, 1990s
Investment Climate Matters 8
The Survey—and What Its Findings RevealWhat factors in the investment climate have preventedBangladesh from growing more quickly? To gather thefirm-level data imperative for answering this question,the Bangladesh Enterprise Institute and the WorldBank conducted a survey of manufacturingenterprises in late 2002. The lack of a reliable andrecent census of manufacturers made sampleselection especially difficult. The sample ultimatelywas drawn from a census of manufacturing industriesprovided by the Bangladesh Bureau of Statistics,combined with lists of firms provided by tradeassociations and chambers of commerce (seeappendix 1 for a detailed discussion of the samplingmethodology).4
Two criteria were used to choose industries for thesurvey: the industries had to be important to theBangladesh economy, and there had to be someoverlap with industries covered by surveys in othercountries to facilitate comparisons. The two criteriaare complementary in Bangladesh. For example, theready-made garment industry is especially importantto Bangladesh, and firms in this industry compete with
similar manufacturers in such countries as China,India, and Pakistan.
Six industries were included in the survey:garments, textiles, food and food processing, leatherand leather products, electronics, and chemicals andpharmaceuticals. The survey collected data from atotal of 1,001 firms in Dhaka (and surrounding areas)and Chittagong (see appendix 1 for a breakdown ofthe firms by industry, city, and other factors).
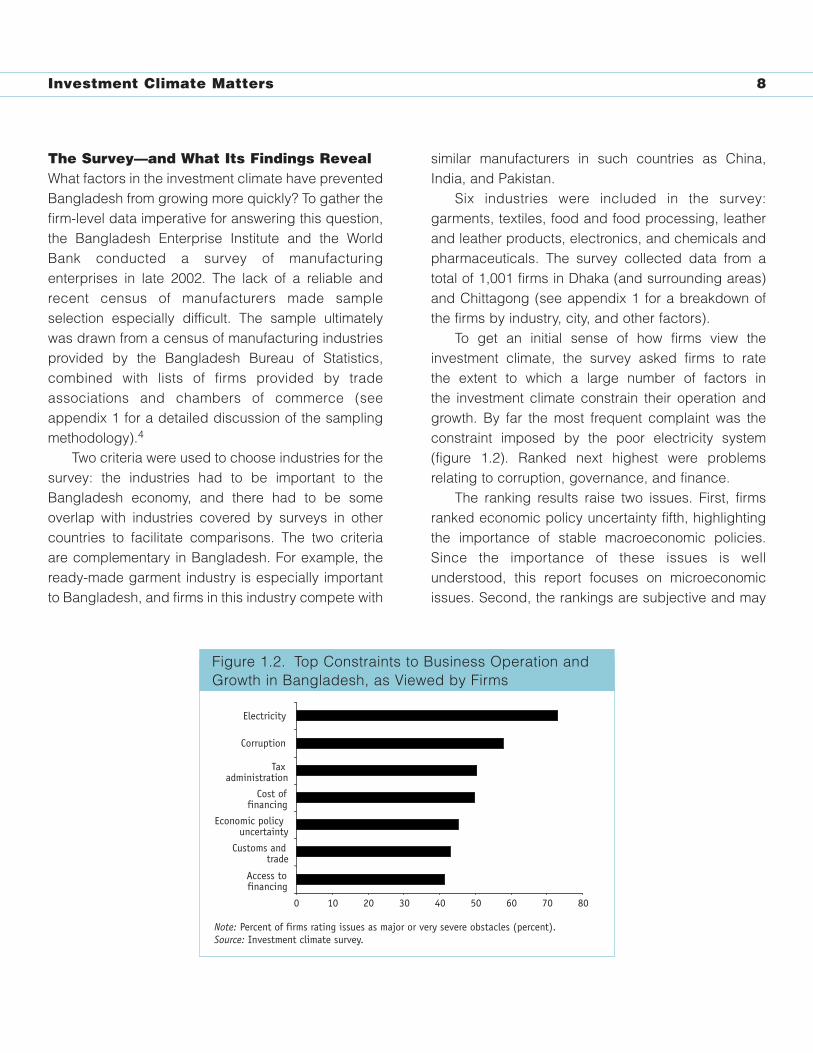
To get an initial sense of how firms view theinvestment climate, the survey asked firms to rate the extent to which a large number of factors in the investment climate constrain their operation andgrowth. By far the most frequent complaint was theconstraint imposed by the poor electricity system(figure 1.2). Ranked next highest were problemsrelating to corruption, governance, and finance.
The ranking results raise two issues. First, firmsranked economic policy uncertainty fifth, highlightingthe importance of stable macroeconomic policies.Since the importance of these issues is wellunderstood, this report focuses on microeconomicissues. Second, the rankings are subjective and may
0 10 20 30 40 50 60 70 80
Access tofinancing
Customs andtrade
Economic policyuncertainty
Cost offinancing
Taxadministration
Corruption
Electricity
Figure 1.2. Top Constraints to Business Operation and Growth in Bangladesh, as Viewed by Firms
Note: Percent of firms rating issues as major or very severe obstacles (percent).Source: Investment climate survey.
Figure 1.2. Top Constraints to Business Operation andGrowth in Bangladesh, as Viewed by Firms
Investment Climate Matters 9
not indicate actual economic problems. Mostentrepreneurs want cheaper financing, but that doesnot necessarily mean that the cost of financing is aneconomic problem.
Nonetheless, these rankings provide a startingpoint for the analysis, and the survey contains awealth of additional information to investigate theseand other issues more objectively and in greaterdepth. Most important, the analysis reveals that thegeneral constraints identified by the firms imposeserious costs on them.
The survey findings, while recording someremarkable improvements in Bangladesh in recentyears, also underscore many unfavorable features ofits investment climate. And they measure the seriouseffort that the country must undertake if it is tostimulate growth and catch up with faster-growingeconomies. Among the aims of this study is to aidBangladesh’s national Poverty Reduction StrategyProgram, one of whose objectives is to accelerategrowth to 7 percent a year—up from less than 5percent in the previous decade. But is this growthtarget realistic for Bangladesh? How will it beattained? The Interim Poverty Reduction StrategyPaper, recognizing the private sector as the mainengine of economic growth, encourages furtheropening of the trade regime and removal of theantiexport bias as well as improvements in a host offactors relating to the investment climate. The hope isthat this study, by shedding further light on the cost of
a poor investment climate, will help inform the nationaldebate on issues relating to private sectordevelopment and aid the consensus buildingnecessary to enact productive reforms.
Notes
1. While social infrastructure is recognized as noless important than its physical and financialcounterparts, a deliberate choice was made toexclude the provision of education and healthservices from the definition of investment climateused in this report. The issues involved inimproving social services are quite different fromthose involved in improving infrastructure andregulation of industry, the focus of the report.
2. In late 2001 state enterprises had physical assetsamounting to 35 percent of GDP, employmentsurpassing 250,000, and investment equal to 9percent of GDP (World Bank 2001a).
3. The market share of national commercial banks(NCBs) and specialized development banksremained at 58 percent at the end of 2001.
4. The survey and its analysis focus on theinvestment climate of the urban manufacturingsector and will therefore need to becomplemented with analytical pieces on ruraldevelopment.

Bangladesh’s Investment Climate in International Perspective 10
2. Bangladesh’s Investment Climate in International Perspective
Comparing the investment climate in Bangladesh withthose in other countries of East and South Asia, as thischapter does, might seem to diminish the progressthat Bangladesh has made, since these are countriesthat have performed relatively well in recent decades.But good performers provide more usefulbenchmarks than poor performers. If Bangladesh is to meet its Millennium Development Goals, recentestimates suggest, it will need to accelerate GDPgrowth to about 7 percent a year over the next decade(Bangladesh 2003). So comparing the performance ofBangladesh with that of economies that are doing wellprovides useful information—both on areas where itlags behind and on areas where it is doing well.
How well does Bangladesh fare in thiscomparison with other Asian countries? On somemeasures, quite well, especially given its lower percapita income. Bangladesh has recorded a relativelystrong performance in economic growth and inflation.It has greatly increased school enrollment, and in timethe improvements in enrollment should boost other
measures of human resources (such as literacy) thatremain low. Bangladesh also appears to performbetter than other low-income countries in somedimensions of governance, that is, regulatory qualityand government efficiency.
But Bangladesh performs less well in other areas.It is less integrated with the global economy thanother Asian countries, with low trade and foreigndirect investment and high formal and informalbarriers to trade. It has poor-quality physicalinfrastructure, especially in the power sector. It doespoorly on some measures of governance, with highcorruption, a weak rule of law, and a largeadministrative burden for starting a business. And itperforms poorly on technology-related issues, withrelatively low spending on research and developmentand weak basic research.
A Strong Macroeconomic PerformanceBangladesh has turned in a strong macroeconomicperformance in recent years. The country’s per capitaGDP growth, negative in the 1970s, rose to 1.7percent in the 1980s and to 3.1 percent in 1990–2001(figure 2.1). Its per capita growth in the 1990s
Figure 2.1. Average Annual Per Capita GDP Growth in Bangladesh and Comparator Countries, 1990–2001
–10123456789
Bang
lade
sh -
1970
s
Bang
lade
sh -
1980
s
Bang
lade
sh -
199
0-20
01
Phili
ppin
es
Low
inco
me
Paki
stan
Low
& m
iddl
e in
com
e
Indo
nesi
a
Indi
a
Sri L
anka
Thai
land
Mal
aysi
a
Chin
a
Source: World Bank 2002c.
Percent
Figure 2.1. Average Annual Per Capita GDP Growth inBangladesh and Comparator Countries, 1990–2001
Bangladesh’s Investment Climate in International Perspective 11
compared favorably with that in other low-incomecountries, where growth averaged 1.2 percent overthe decade. But Bangladesh lagged behind manyother countries in East and South Asia, where percapita growth in the 1990s averaged 3.5 percent in India, 3.7 percent in Sri Lanka, and 8.2 percent inChina.
Nonetheless, Bangladesh made strong gains inper capita income. Moreover, the growth wasaccompanied by—and contributed to—a host of otherachievements: a decline in the poverty rate (from 59percent in 1990–91 to 50 percent in 2000; Stern2002a), a significant drop in fertility (from 6.3 birthsper woman in 1975 to 3.3 in 1997–99), a reduction ininfant mortality (from 153 deaths per 1,000 live birthsin 1975 to 66 in 2000), and impressive gains incombating child malnutrition and starvation. All thesegains are consistent with recent evidence showingthat while GDP growth alone is not sufficient forreducing poverty, it does benefit the poor (Dollar and Kraay 2002), making it significantly easier for countries to achieve their poverty reduction goals.
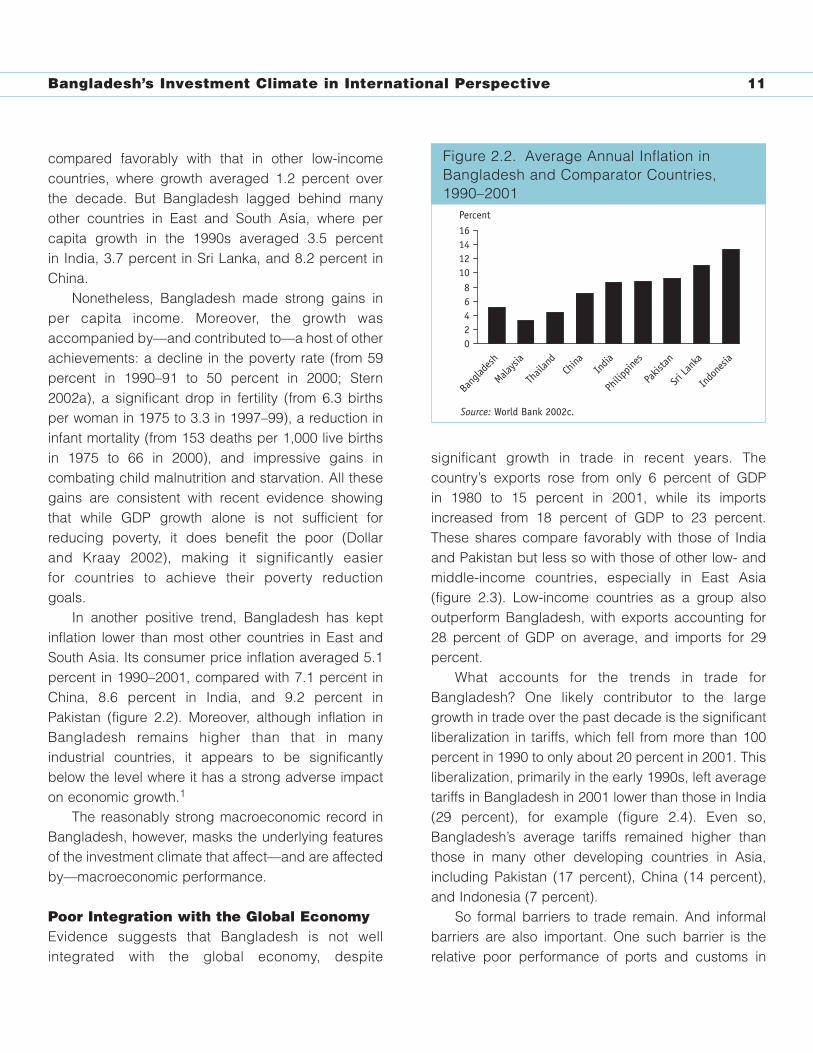
In another positive trend, Bangladesh has keptinflation lower than most other countries in East andSouth Asia. Its consumer price inflation averaged 5.1percent in 1990–2001, compared with 7.1 percent inChina, 8.6 percent in India, and 9.2 percent inPakistan (figure 2.2). Moreover, although inflation inBangladesh remains higher than that in manyindustrial countries, it appears to be significantlybelow the level where it has a strong adverse impacton economic growth.1
The reasonably strong macroeconomic record inBangladesh, however, masks the underlying featuresof the investment climate that affect—and are affectedby—macroeconomic performance.
Poor Integration with the Global EconomyEvidence suggests that Bangladesh is not wellintegrated with the global economy, despite
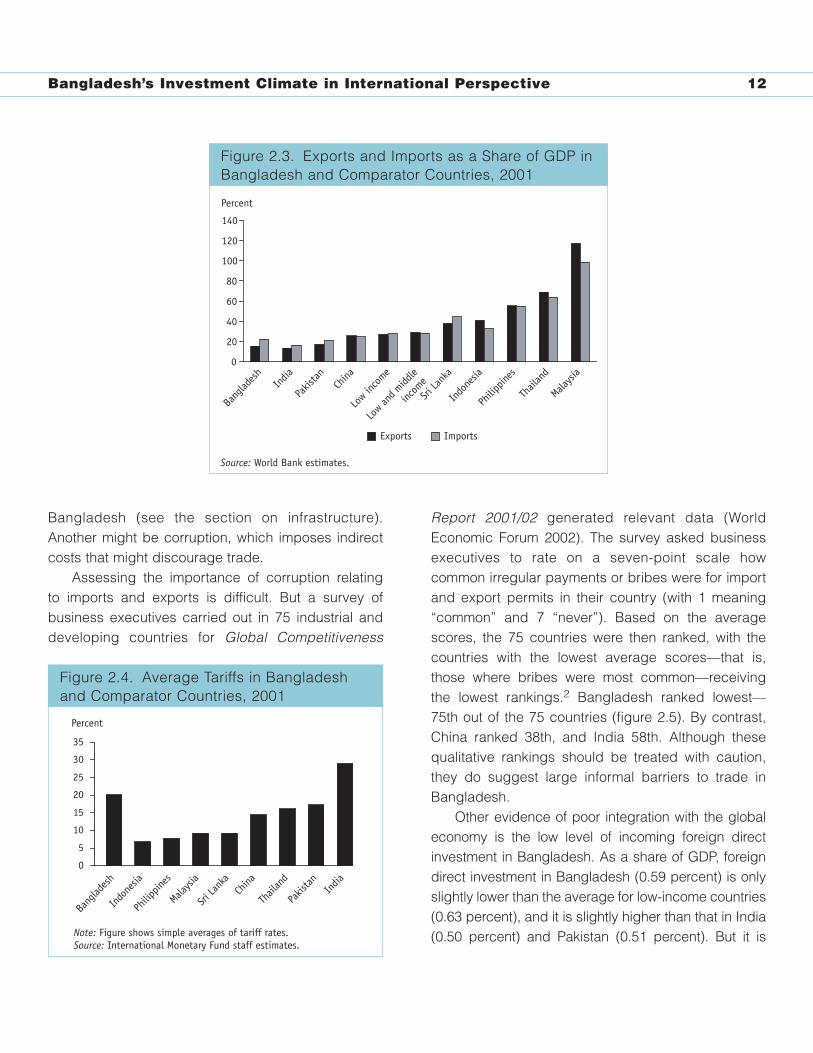
significant growth in trade in recent years. Thecountry’s exports rose from only 6 percent of GDP in 1980 to 15 percent in 2001, while its importsincreased from 18 percent of GDP to 23 percent.These shares compare favorably with those of Indiaand Pakistan but less so with those of other low- andmiddle-income countries, especially in East Asia(figure 2.3). Low-income countries as a group alsooutperform Bangladesh, with exports accounting for28 percent of GDP on average, and imports for 29percent.
What accounts for the trends in trade forBangladesh? One likely contributor to the largegrowth in trade over the past decade is the significantliberalization in tariffs, which fell from more than 100percent in 1990 to only about 20 percent in 2001. Thisliberalization, primarily in the early 1990s, left averagetariffs in Bangladesh in 2001 lower than those in India(29 percent), for example (figure 2.4). Even so,Bangladesh’s average tariffs remained higher thanthose in many other developing countries in Asia,including Pakistan (17 percent), China (14 percent),and Indonesia (7 percent).
So formal barriers to trade remain. And informalbarriers are also important. One such barrier is therelative poor performance of ports and customs in
Figure 2.2. Average Annual Inflation in Bangladesh and Comparator Countries, 1990–2001
02468
10121416
Malaysia
Thail
and
China
India
Philip
pines
Pakis
tan
Sri La
nka
Indo
nesia
Source: World Bank 2002c.
Percent
Bang
lades
h
Figure 2.2. Average Annual Inflation inBangladesh and Comparator Countries,1990–2001
Bangladesh’s Investment Climate in International Perspective 12
Bangladesh (see the section on infrastructure).Another might be corruption, which imposes indirectcosts that might discourage trade.
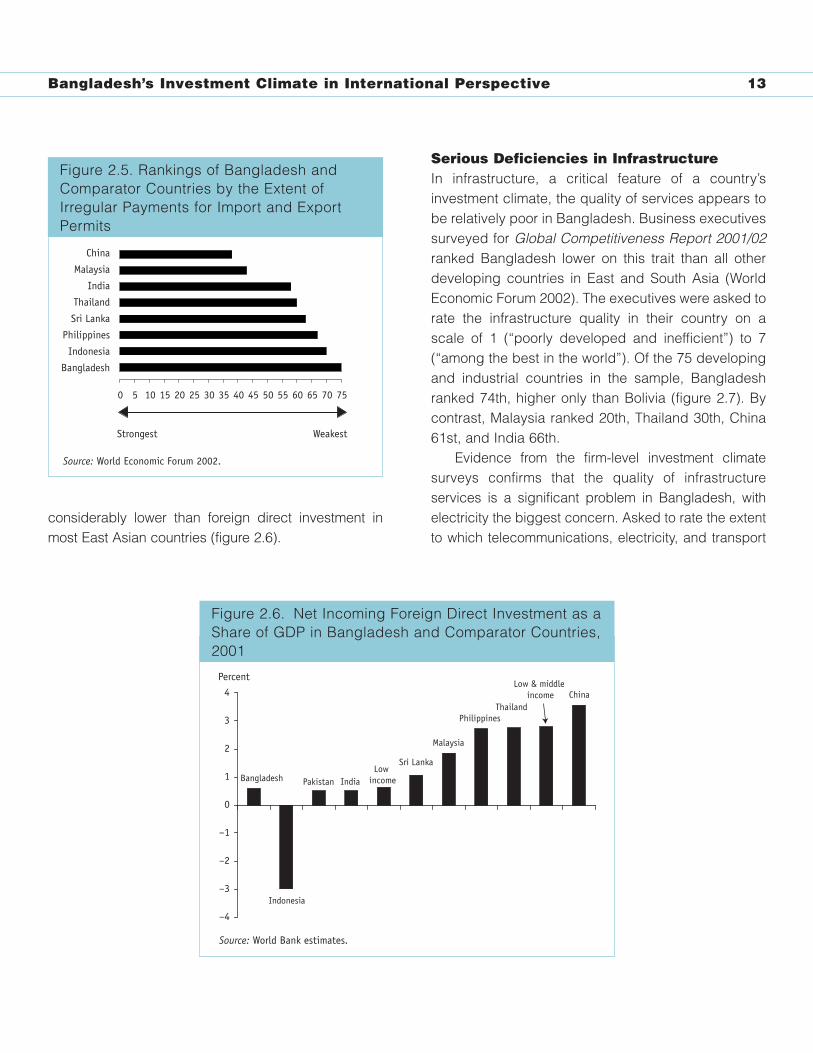
Assessing the importance of corruption relating to imports and exports is difficult. But a survey ofbusiness executives carried out in 75 industrial anddeveloping countries for Global Competitiveness
Report 2001/02 generated relevant data (WorldEconomic Forum 2002). The survey asked businessexecutives to rate on a seven-point scale howcommon irregular payments or bribes were for importand export permits in their country (with 1 meaning“common” and 7 “never”). Based on the averagescores, the 75 countries were then ranked, with thecountries with the lowest average scores—that is,those where bribes were most common—receivingthe lowest rankings.2 Bangladesh ranked lowest—75th out of the 75 countries (figure 2.5). By contrast,China ranked 38th, and India 58th. Although thesequalitative rankings should be treated with caution,they do suggest large informal barriers to trade inBangladesh.
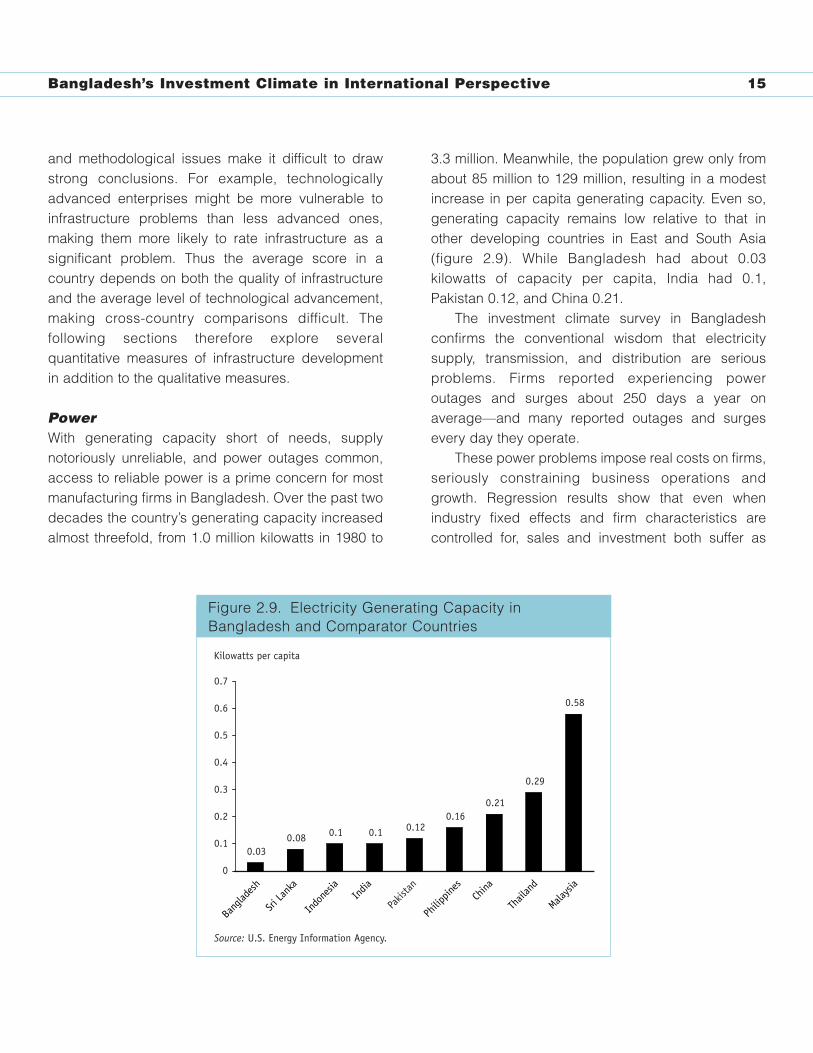
Other evidence of poor integration with the globaleconomy is the low level of incoming foreign directinvestment in Bangladesh. As a share of GDP, foreigndirect investment in Bangladesh (0.59 percent) is onlyslightly lower than the average for low-income countries(0.63 percent), and it is slightly higher than that in India(0.50 percent) and Pakistan (0.51 percent). But it is
Figure 2.4. Average Tariffs in Bangladesh and Comparator Countries, 2001
0
5
10
15
20
25
30
35
Bang
lades
h
Indo
nesia
Philip
pines
Malaysia
Sri La
nka
China
Thail
and
Pakis
tan India
Note: Figure shows simple averages of tariff rates.Source: International Monetary Fund staff estimates.
Percent
Figure 2.4. Average Tariffs in Bangladeshand Comparator Countries, 2001
Figure 2.3. Exports and Imports as a Share of GDP in Bangladesh and Comparator Countries, 2001
0
20
40
60
80
100
120
140
Bang
lades
h
Pakis
tan
Low in
come
Sri La
nka
Philip
pines
Malaysia
Exports Imports
Source: World Bank estimates.
Percent
India
China
Low an
d midd
le
incom
e
Indo
nesia
Thail
and
Figure 2.3. Exports and Imports as a Share of GDP inBangladesh and Comparator Countries, 2001
Bangladesh’s Investment Climate in International Perspective 13
considerably lower than foreign direct investment inmost East Asian countries (figure 2.6).
Serious Deficiencies in InfrastructureIn infrastructure, a critical feature of a country’sinvestment climate, the quality of services appears tobe relatively poor in Bangladesh. Business executivessurveyed for Global Competitiveness Report 2001/02ranked Bangladesh lower on this trait than all otherdeveloping countries in East and South Asia (WorldEconomic Forum 2002). The executives were asked torate the infrastructure quality in their country on ascale of 1 (“poorly developed and inefficient”) to 7(“among the best in the world”). Of the 75 developingand industrial countries in the sample, Bangladeshranked 74th, higher only than Bolivia (figure 2.7). Bycontrast, Malaysia ranked 20th, Thailand 30th, China61st, and India 66th.
Evidence from the firm-level investment climatesurveys confirms that the quality of infrastructureservices is a significant problem in Bangladesh, withelectricity the biggest concern. Asked to rate the extentto which telecommunications, electricity, and transport
Figure 2.6. Net Incoming Foreign Direct Investment as a Share of GDP in Bangladesh and Comparator Countries, 2001
Bangladesh
Indonesia
Pakistan IndiaLow
income
Sri Lanka
Malaysia
Philippines
ChinaThailand
Low & middle income
–4
–3
–2
–1
0
1
2
3
4
Source: World Bank estimates.
Percent
Figure 2.6. Net Incoming Foreign Direct Investment as aShare of GDP in Bangladesh and Comparator Countries,2001
Figure 2.5. Rankings of Bangladesh and Comparator Countries by the Extent of Irregular Payments for Import and Export Permits
0 5 10 15 20 25 30 35 40 45 50 55 60 65 70 75
Bangladesh
China
Malaysia
India
Thailand
Sri Lanka
Philippines
Indonesia
Source: World Economic Forum 2002.
Strongest Weakest
Figure 2.5. Rankings of Bangladesh andComparator Countries by the Extent ofIrregular Payments for Import and ExportPermits

Bangladesh’s Investment Climate in International Perspective 14
hampered enterprise operations and growth in theircountry, only 4 percent of enterprises in Bangladeshreported that electricity posed no obstacle (figure 2.8).Electricity was a smaller concern in China, where 37percent of enterprises reported that it was no obstacle,and in Pakistan, where 21 percent considered it noobstacle. Enterprises in Bangladesh rated services in
other infrastructure sectors higher, with transport posingno obstacle for 19 percent and telecommunications noobstacle for 30 percent. Still, these shares wereconsiderably smaller than those in China and Pakistan.
Although these responses suggest that the poorquality of infrastructure is a serious problem forenterprises in Bangladesh, the data are qualitative,
Figure 2.8. Share of Firms in Bangladesh and Comparator Countries Reporting That Infrastructure Is No Obstacle to Business Operations
30
4752
19
44 47
4
37
21
0
10
20
30
40
50
60
Bangladesh China Pakistan
Telecommunications Transport Electricity
Source: Investment climate surveys.
Percent
Figure 2.8. Share of Firms in Bangladesh andComparator Countries Reporting That Infrastructure IsNo Obstacle to Business Operations
Figure 2.7. Rankings of Bangladesh and Comparator Countries by Overall Quality of Infrastructure
0 5 10 15 20 25 30 35 40 45 50 55 60 65 70 75
Bangladesh
Malaysia
Thailand
Indonesia
China
Sri Lanka
India
Philippines
Vietnam
Source: World Economic Forum 2002.
Strongest Weakest
Figure 2.7. Ranking of Bangladesh and ComparatorCountries by Overall Quality of Infrastructure
Bangladesh’s Investment Climate in International Perspective 15
and methodological issues make it difficult to drawstrong conclusions. For example, technologicallyadvanced enterprises might be more vulnerable toinfrastructure problems than less advanced ones,making them more likely to rate infrastructure as asignificant problem. Thus the average score in acountry depends on both the quality of infrastructureand the average level of technological advancement,making cross-country comparisons difficult. Thefollowing sections therefore explore severalquantitative measures of infrastructure developmentin addition to the qualitative measures.
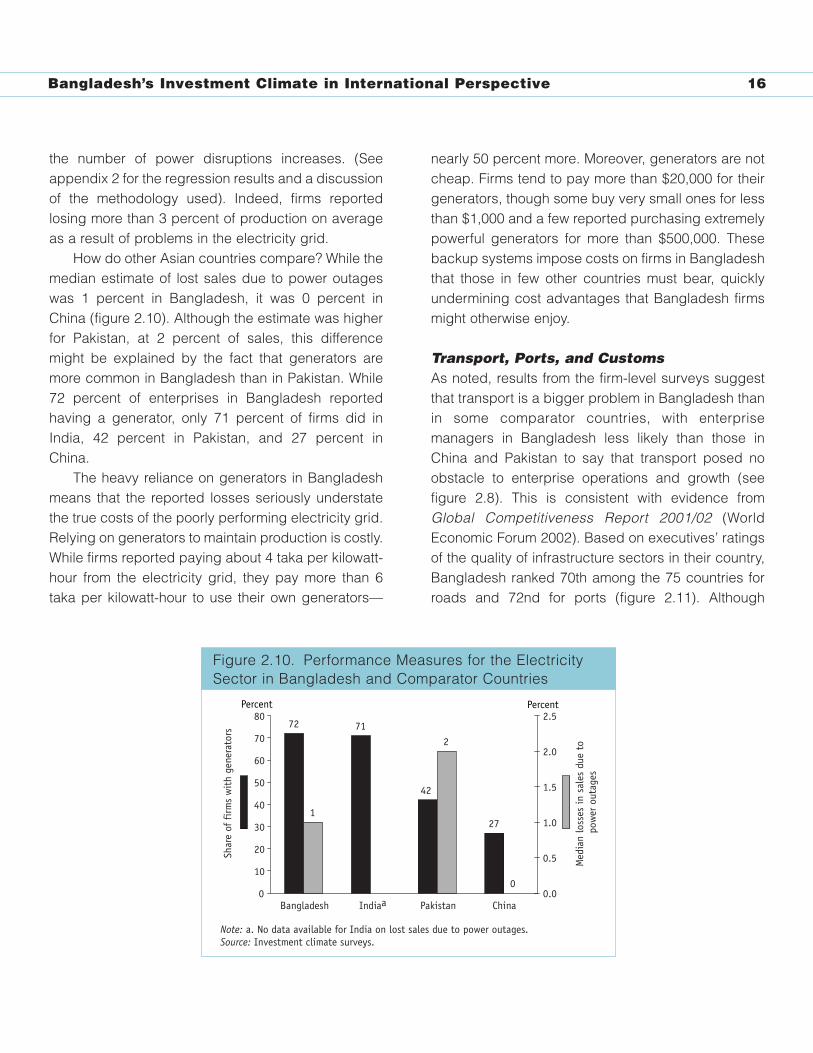
PowerWith generating capacity short of needs, supplynotoriously unreliable, and power outages common,access to reliable power is a prime concern for mostmanufacturing firms in Bangladesh. Over the past twodecades the country’s generating capacity increasedalmost threefold, from 1.0 million kilowatts in 1980 to
3.3 million. Meanwhile, the population grew only fromabout 85 million to 129 million, resulting in a modestincrease in per capita generating capacity. Even so,generating capacity remains low relative to that inother developing countries in East and South Asia(figure 2.9). While Bangladesh had about 0.03kilowatts of capacity per capita, India had 0.1,Pakistan 0.12, and China 0.21.
The investment climate survey in Bangladeshconfirms the conventional wisdom that electricitysupply, transmission, and distribution are seriousproblems. Firms reported experiencing poweroutages and surges about 250 days a year onaverage—and many reported outages and surgesevery day they operate.
These power problems impose real costs on firms,seriously constraining business operations andgrowth. Regression results show that even whenindustry fixed effects and firm characteristics arecontrolled for, sales and investment both suffer as
Figure 2.9. Electricity Generating Capacity in Bangladesh and Comparator Countries
0.030.08 0.1 0.1 0.12
0.160.21
0.29
0.58
0
0.1
0.2
0.3
0.4
0.5
0.6
0.7
Source: U.S. Energy Information Agency.
Kilowatts per capita
Bang
lades
h
Malaysia
Thail
and
Indo
nesia
China
Sri La
nka
India
Philip
pines
Pakis
tan
Figure 2.9. Electricity Generating Capacity inBangladesh and Comparator Countries
Bangladesh’s Investment Climate in International Perspective 16
the number of power disruptions increases. (Seeappendix 2 for the regression results and a discussionof the methodology used). Indeed, firms reportedlosing more than 3 percent of production on averageas a result of problems in the electricity grid.
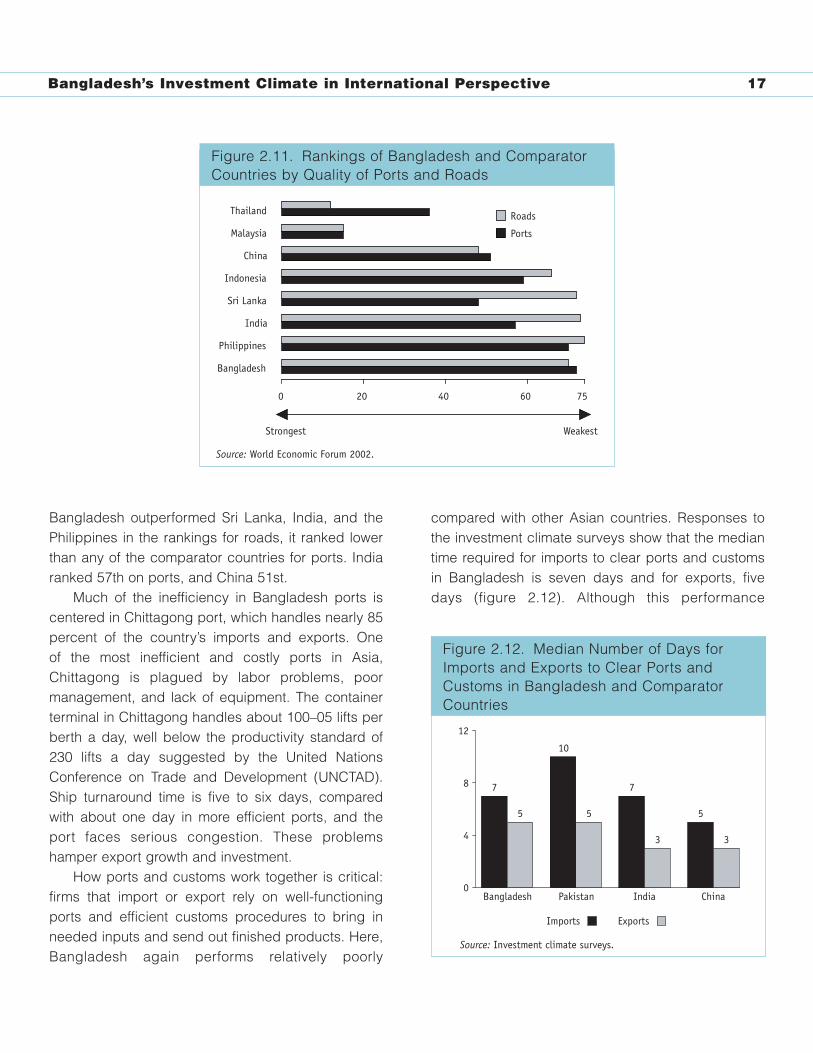
How do other Asian countries compare? While themedian estimate of lost sales due to power outageswas 1 percent in Bangladesh, it was 0 percent inChina (figure 2.10). Although the estimate was higherfor Pakistan, at 2 percent of sales, this differencemight be explained by the fact that generators aremore common in Bangladesh than in Pakistan. While72 percent of enterprises in Bangladesh reportedhaving a generator, only 71 percent of firms did inIndia, 42 percent in Pakistan, and 27 percent inChina.
The heavy reliance on generators in Bangladeshmeans that the reported losses seriously understatethe true costs of the poorly performing electricity grid.Relying on generators to maintain production is costly.While firms reported paying about 4 taka per kilowatt-hour from the electricity grid, they pay more than 6taka per kilowatt-hour to use their own generators—
nearly 50 percent more. Moreover, generators are notcheap. Firms tend to pay more than $20,000 for theirgenerators, though some buy very small ones for lessthan $1,000 and a few reported purchasing extremelypowerful generators for more than $500,000. Thesebackup systems impose costs on firms in Bangladeshthat those in few other countries must bear, quicklyundermining cost advantages that Bangladesh firmsmight otherwise enjoy.
Transport, Ports, and CustomsAs noted, results from the firm-level surveys suggestthat transport is a bigger problem in Bangladesh thanin some comparator countries, with enterprisemanagers in Bangladesh less likely than those inChina and Pakistan to say that transport posed noobstacle to enterprise operations and growth (seefigure 2.8). This is consistent with evidence fromGlobal Competitiveness Report 2001/02 (WorldEconomic Forum 2002). Based on executives’ ratingsof the quality of infrastructure sectors in their country,Bangladesh ranked 70th among the 75 countries forroads and 72nd for ports (figure 2.11). Although
Figure 2.10. Performance Measures for the Electricity Sector in Bangladesh and Comparator Countries
72 71
42
271
2
00
10
20
30
40
50
60
70
80
Bangladesh Indiaa Pakistan China
Shar
e of
fir
ms
wit
h ge
nera
tors
0.0
0.5
1.0
1.5
2.0
2.5
Med
ian
loss
es in
sal
es d
ue t
o po
wer
out
ages
Note: a. No data available for India on lost sales due to power outages.Source: Investment climate surveys.
Percent Percent
Figure 2.10. Performance Measures for the ElectricitySector in Bangladesh and Comparator Countries
Bangladesh’s Investment Climate in International Perspective 17
Bangladesh outperformed Sri Lanka, India, and thePhilippines in the rankings for roads, it ranked lowerthan any of the comparator countries for ports. Indiaranked 57th on ports, and China 51st.
Much of the inefficiency in Bangladesh ports iscentered in Chittagong port, which handles nearly 85percent of the country’s imports and exports. One of the most inefficient and costly ports in Asia,Chittagong is plagued by labor problems, poormanagement, and lack of equipment. The containerterminal in Chittagong handles about 100–05 lifts perberth a day, well below the productivity standard of230 lifts a day suggested by the United NationsConference on Trade and Development (UNCTAD).Ship turnaround time is five to six days, comparedwith about one day in more efficient ports, and theport faces serious congestion. These problemshamper export growth and investment.
How ports and customs work together is critical:firms that import or export rely on well-functioningports and efficient customs procedures to bring inneeded inputs and send out finished products. Here,Bangladesh again performs relatively poorly
compared with other Asian countries. Responses tothe investment climate surveys show that the mediantime required for imports to clear ports and customsin Bangladesh is seven days and for exports, fivedays (figure 2.12). Although this performance
Figure 2.12. Median Number of Days for Imports and Exports to Clear Ports and Customs in Bangladesh and Comparator Countries
7
5
10
5
7
3
5
3
0
4
8
12
Bangladesh Pakistan India China
Source: Investment climate surveys.
Imports Exports
Figure 2.12. Median Number of Days forImports and Exports to Clear Ports andCustoms in Bangladesh and ComparatorCountries
Figure 2.11. Rankings of Bangladesh and Comparator Countries by Quality of Ports and Roads
0 20 40 60 75
Bangladesh
Thailand
Malaysia
China
Indonesia
Sri Lanka
India
Philippines
Roads
Ports
Source: World Economic Forum 2002.
Strongest Weakest
Figure 2.11. Rankings of Bangladesh and ComparatorCountries by Quality of Ports and Roads
Bangladesh’s Investment Climate in International Perspective 18
compares well with Pakistan’s, it falls short of that inIndia and China.
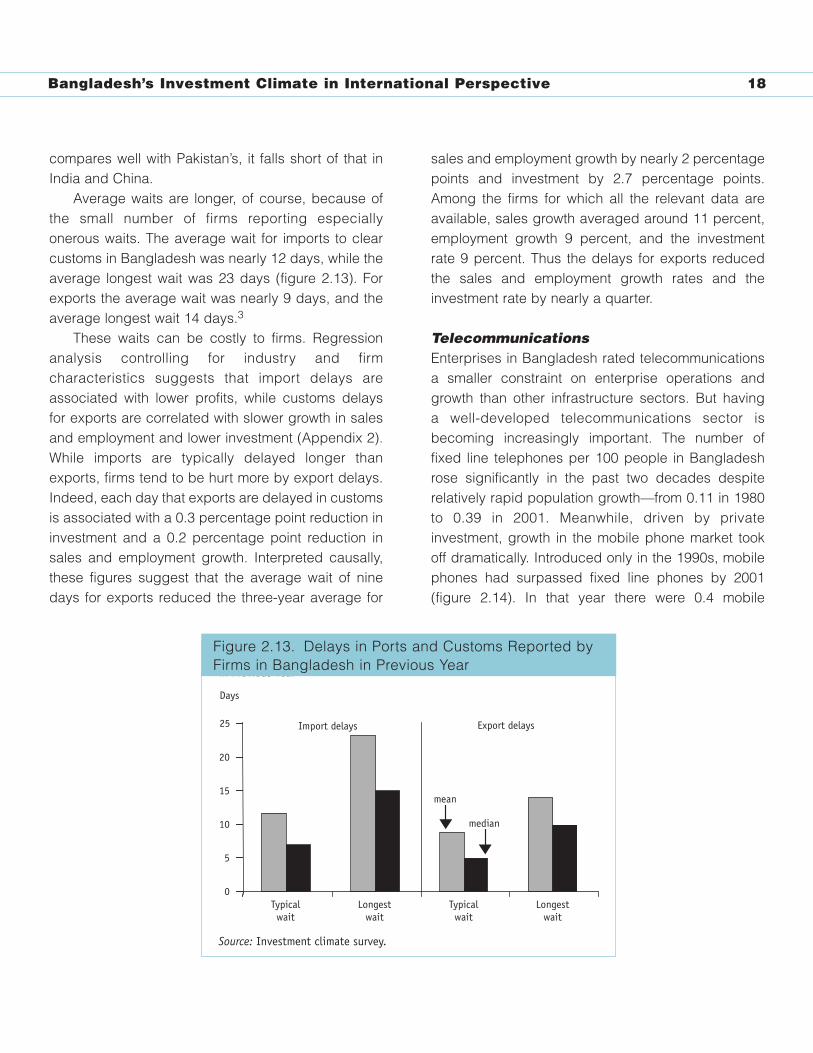
Average waits are longer, of course, because ofthe small number of firms reporting especiallyonerous waits. The average wait for imports to clearcustoms in Bangladesh was nearly 12 days, while theaverage longest wait was 23 days (figure 2.13). Forexports the average wait was nearly 9 days, and theaverage longest wait 14 days.3
These waits can be costly to firms. Regressionanalysis controlling for industry and firmcharacteristics suggests that import delays areassociated with lower profits, while customs delaysfor exports are correlated with slower growth in salesand employment and lower investment (Appendix 2).While imports are typically delayed longer thanexports, firms tend to be hurt more by export delays.Indeed, each day that exports are delayed in customsis associated with a 0.3 percentage point reduction ininvestment and a 0.2 percentage point reduction insales and employment growth. Interpreted causally,these figures suggest that the average wait of ninedays for exports reduced the three-year average for
sales and employment growth by nearly 2 percentagepoints and investment by 2.7 percentage points.Among the firms for which all the relevant data areavailable, sales growth averaged around 11 percent,employment growth 9 percent, and the investmentrate 9 percent. Thus the delays for exports reducedthe sales and employment growth rates and theinvestment rate by nearly a quarter.
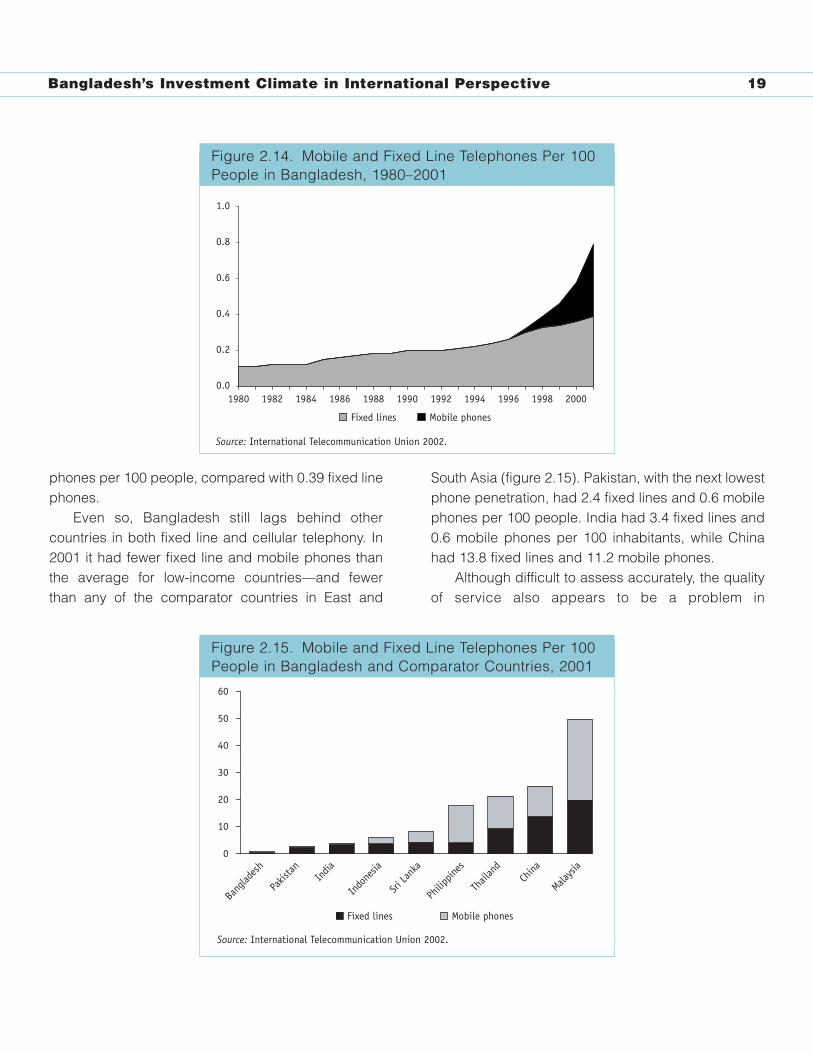
TelecommunicationsEnterprises in Bangladesh rated telecommunicationsa smaller constraint on enterprise operations andgrowth than other infrastructure sectors. But having a well-developed telecommunications sector isbecoming increasingly important. The number offixed line telephones per 100 people in Bangladeshrose significantly in the past two decades despiterelatively rapid population growth—from 0.11 in 1980to 0.39 in 2001. Meanwhile, driven by privateinvestment, growth in the mobile phone market tookoff dramatically. Introduced only in the 1990s, mobilephones had surpassed fixed line phones by 2001(figure 2.14). In that year there were 0.4 mobile
Figure 2.13. Delays in Ports and Customs Reported by Firms in Bangladesh in Previous Year
0
5
10
15
20
Typicalwait
Longestwait
Typicalwait
Longestwait
Import delays Export delays
mean
median
Days
25
Source: Investment climate survey.
Figure 2.13. Delays in Ports and Customs Reported byFirms in Bangladesh in Previous Year
Bangladesh’s Investment Climate in International Perspective 19
phones per 100 people, compared with 0.39 fixed linephones.
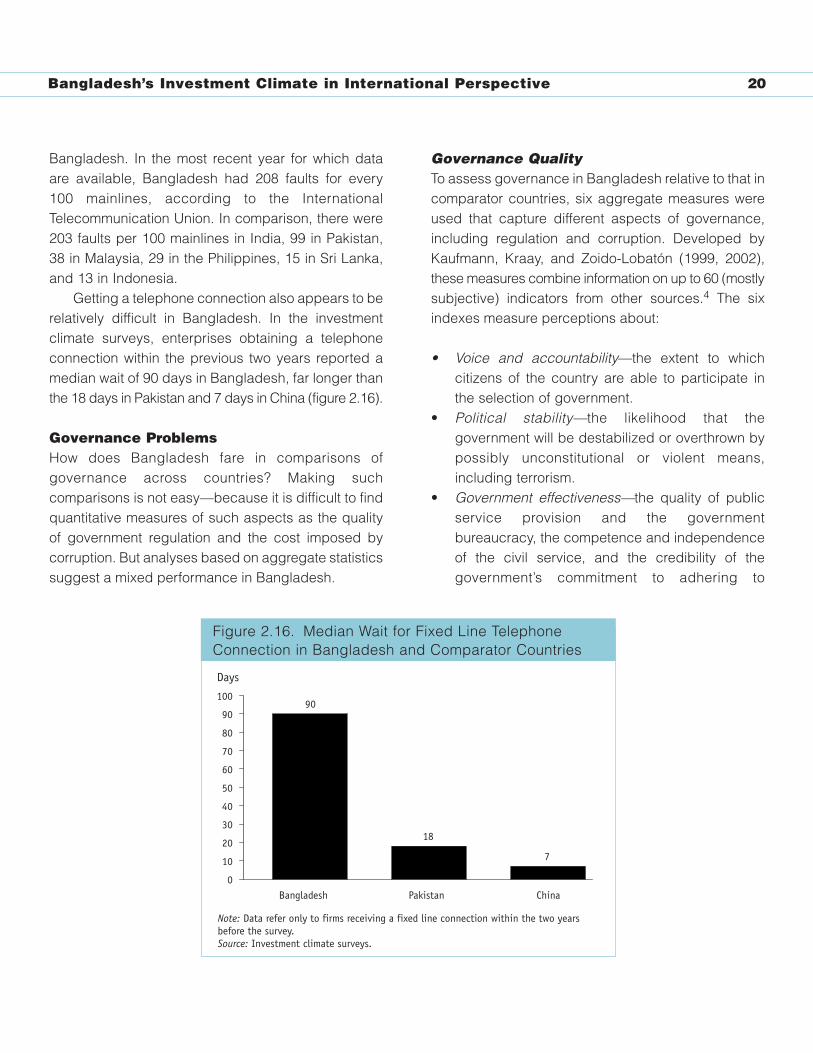
Even so, Bangladesh still lags behind othercountries in both fixed line and cellular telephony. In2001 it had fewer fixed line and mobile phones thanthe average for low-income countries—and fewerthan any of the comparator countries in East and
South Asia (figure 2.15). Pakistan, with the next lowestphone penetration, had 2.4 fixed lines and 0.6 mobilephones per 100 people. India had 3.4 fixed lines and0.6 mobile phones per 100 inhabitants, while Chinahad 13.8 fixed lines and 11.2 mobile phones.
Although difficult to assess accurately, the qualityof service also appears to be a problem in
Figure 2.15. Mobile and Fixed Line Telephones Per 100 People in Bangladesh and Comparator Countries, 2001
0
10
20
30
40
50
60
Bang
lades
h
Pakis
tan India
Indo
nesia
Sri La
nka
Philip
pines
Thail
and
China
Malaysia
Fixed lines Mobile phones
Source: International Telecommunication Union 2002.
Figure 2.15. Mobile and Fixed Line Telephones Per 100People in Bangladesh and Comparator Countries, 2001
Figure 2.14. Mobile and Fixed Line Telephones Per 100 People in Bangladesh, 1980–2001
0.0
0.2
0.4
0.6
0.8
1.0
1980 1982 1984 1986 1988 1990 1992 1994 1996 1998 2000
Fixed lines Mobile phones
Source: International Telecommunication Union 2002.
Figure 2.14. Mobile and Fixed Line Telephones Per 100People in Bangladesh, 1980–2001
Bangladesh’s Investment Climate in International Perspective 20
Bangladesh. In the most recent year for which dataare available, Bangladesh had 208 faults for every100 mainlines, according to the InternationalTelecommunication Union. In comparison, there were203 faults per 100 mainlines in India, 99 in Pakistan,38 in Malaysia, 29 in the Philippines, 15 in Sri Lanka,and 13 in Indonesia.
Getting a telephone connection also appears to berelatively difficult in Bangladesh. In the investmentclimate surveys, enterprises obtaining a telephoneconnection within the previous two years reported amedian wait of 90 days in Bangladesh, far longer thanthe 18 days in Pakistan and 7 days in China (figure 2.16).
Governance ProblemsHow does Bangladesh fare in comparisons ofgovernance across countries? Making suchcomparisons is not easy—because it is difficult to findquantitative measures of such aspects as the quality of government regulation and the cost imposed bycorruption. But analyses based on aggregate statisticssuggest a mixed performance in Bangladesh.
Governance Quality To assess governance in Bangladesh relative to that incomparator countries, six aggregate measures wereused that capture different aspects of governance,including regulation and corruption. Developed byKaufmann, Kraay, and Zoido-Lobatón (1999, 2002),these measures combine information on up to 60 (mostlysubjective) indicators from other sources.4 The sixindexes measure perceptions about:
• Voice and accountability—the extent to whichcitizens of the country are able to participate inthe selection of government.
• Political stability—the likelihood that thegovernment will be destabilized or overthrown bypossibly unconstitutional or violent means,including terrorism.
• Government effectiveness—the quality of publicservice provision and the governmentbureaucracy, the competence and independenceof the civil service, and the credibility of thegovernment’s commitment to adhering to
Figure 2.16. Median Wait for Fixed Line Telephone Connection in Bangladesh and Comparator Countries
90
18
7
0
10
20
30
40
50
60
70
80
90
100
Bangladesh Pakistan China
Note: Data refer only to firms receiving a fixed line connection within the two years before the survey. Source: Investment climate surveys.
Days
Figure 2.16. Median Wait for Fixed Line TelephoneConnection in Bangladesh and Comparator Countries
Bangladesh’s Investment Climate in International Perspective 21
announced policies. This measure focuses mainlyon “inputs” that governments need to implementgood policies and deliver public goods.
• Regulatory quality—the quality of governmentpolicies. This measure, based on “outputs” ratherthan “inputs,” focuses on the prevalence ofmarket-unfriendly policies (such as price controlsor inadequate bank supervision) as well asperceptions about the burden imposed onbusinesses by regulation.
• Rule of law—the extent to which individuals haveconfidence in and abide by the rules of society.This includes perceptions about the incidence ofcrime (violent and nonviolent), the effectivenessand predictability of the judiciary, and theenforceability of contracts.
• Control of corruption—the extent of corruption(that is, the illegal use of public power for privategain).
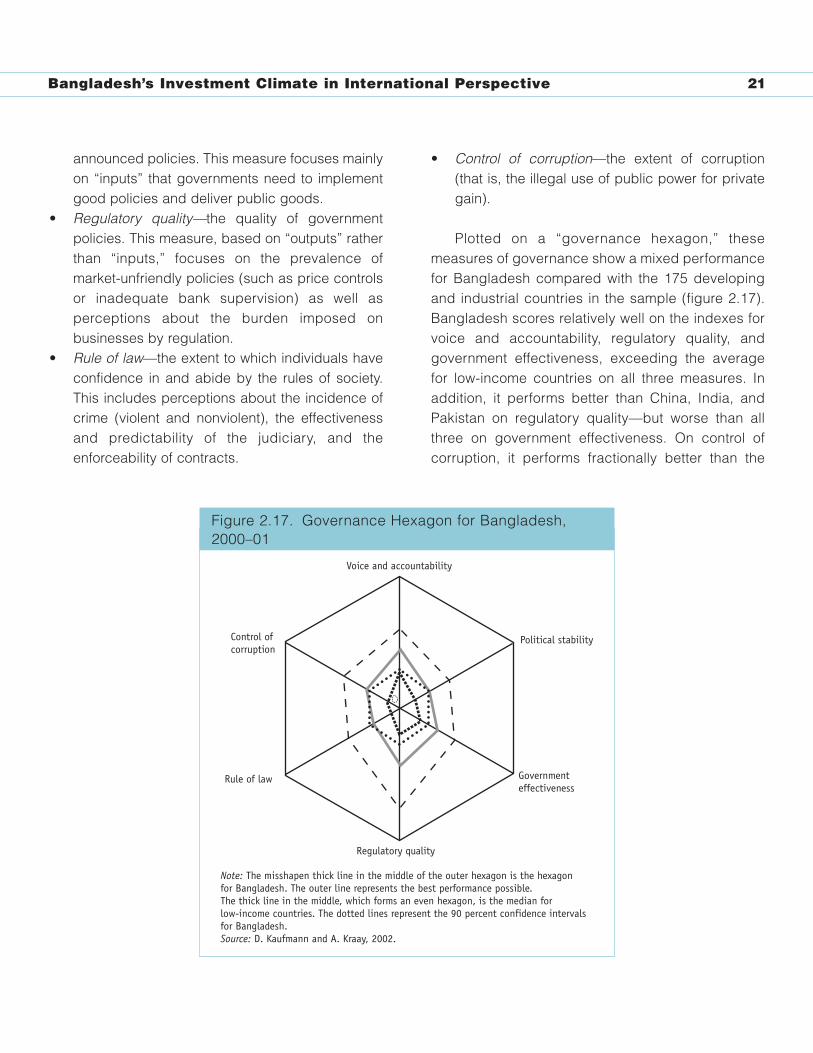
Plotted on a “governance hexagon,” thesemeasures of governance show a mixed performancefor Bangladesh compared with the 175 developingand industrial countries in the sample (figure 2.17).Bangladesh scores relatively well on the indexes forvoice and accountability, regulatory quality, andgovernment effectiveness, exceeding the averagefor low-income countries on all three measures. Inaddition, it performs better than China, India, andPakistan on regulatory quality—but worse than allthree on government effectiveness. On control ofcorruption, it performs fractionally better than the
Figure 2.17. Governance Hexagon for Bangladesh, 2000–01
Note: The misshapen thick line in the middle of the outer hexagon is the hexagon for Bangladesh. The outer line represents the best performance possible. The thick line in the middle, which forms an even hexagon, is the median for low-income countries. The dotted lines represent the 90 percent confidence intervals for Bangladesh.Source: D. Kaufmann and A. Kraay, 2002.
Voice and accountability
Control of corruption
Rule of law
Regulatory quality
Government effectiveness
Political stability
Figure 2.17. Governance Hexagon for Bangladesh,2000–01
Bangladesh’s Investment Climate in International Perspective 22
average for low-income countries but worse thaneither China or India. And on both political stabilityand rule of law, Bangladesh performs worse than theaverage for low-income countries and worse thanChina, India, and Pakistan.
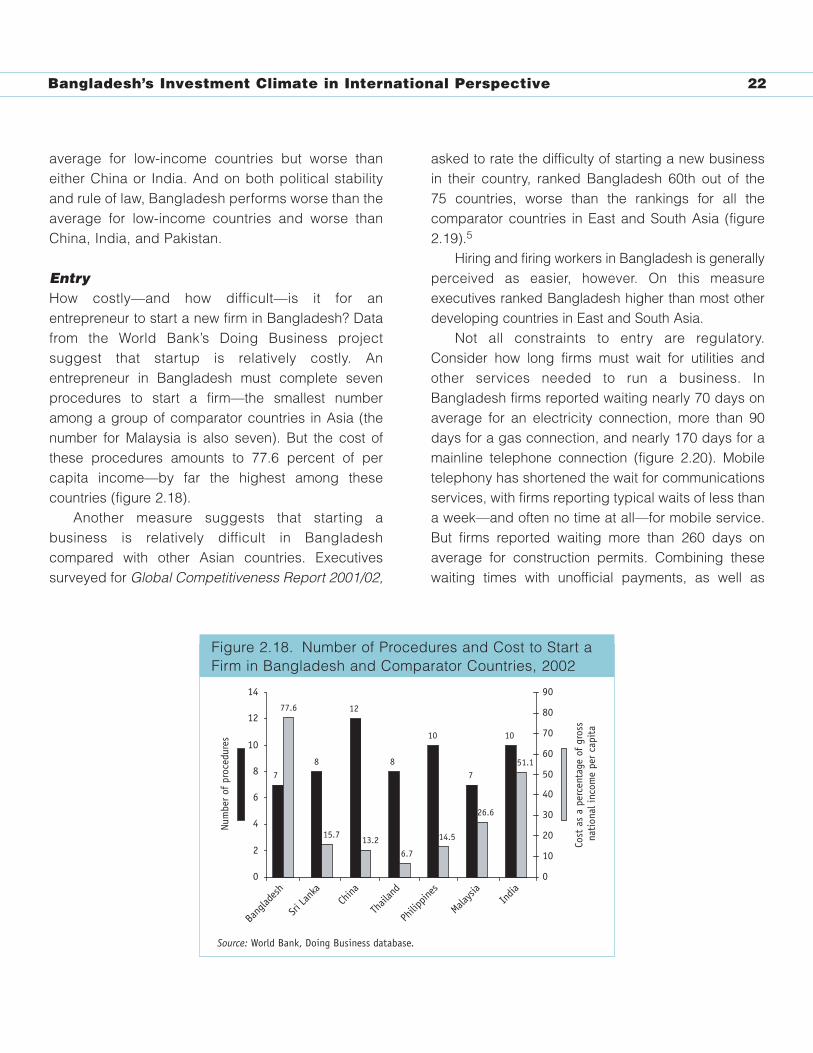
EntryHow costly—and how difficult—is it for anentrepreneur to start a new firm in Bangladesh? Datafrom the World Bank’s Doing Business projectsuggest that startup is relatively costly. Anentrepreneur in Bangladesh must complete sevenprocedures to start a firm—the smallest numberamong a group of comparator countries in Asia (thenumber for Malaysia is also seven). But the cost ofthese procedures amounts to 77.6 percent of percapita income—by far the highest among thesecountries (figure 2.18).
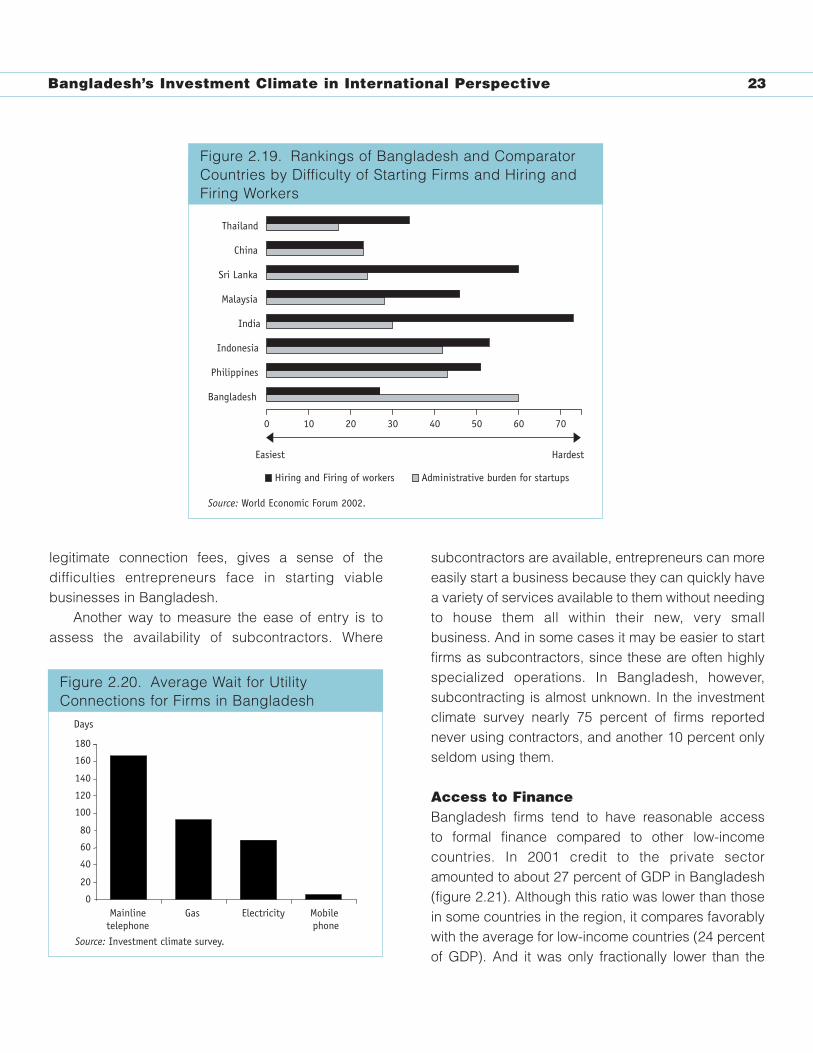
Another measure suggests that starting abusiness is relatively difficult in Bangladeshcompared with other Asian countries. Executivessurveyed for Global Competitiveness Report 2001/02,
asked to rate the difficulty of starting a new businessin their country, ranked Bangladesh 60th out of the 75 countries, worse than the rankings for all thecomparator countries in East and South Asia (figure2.19).5
Hiring and firing workers in Bangladesh is generallyperceived as easier, however. On this measureexecutives ranked Bangladesh higher than most otherdeveloping countries in East and South Asia.
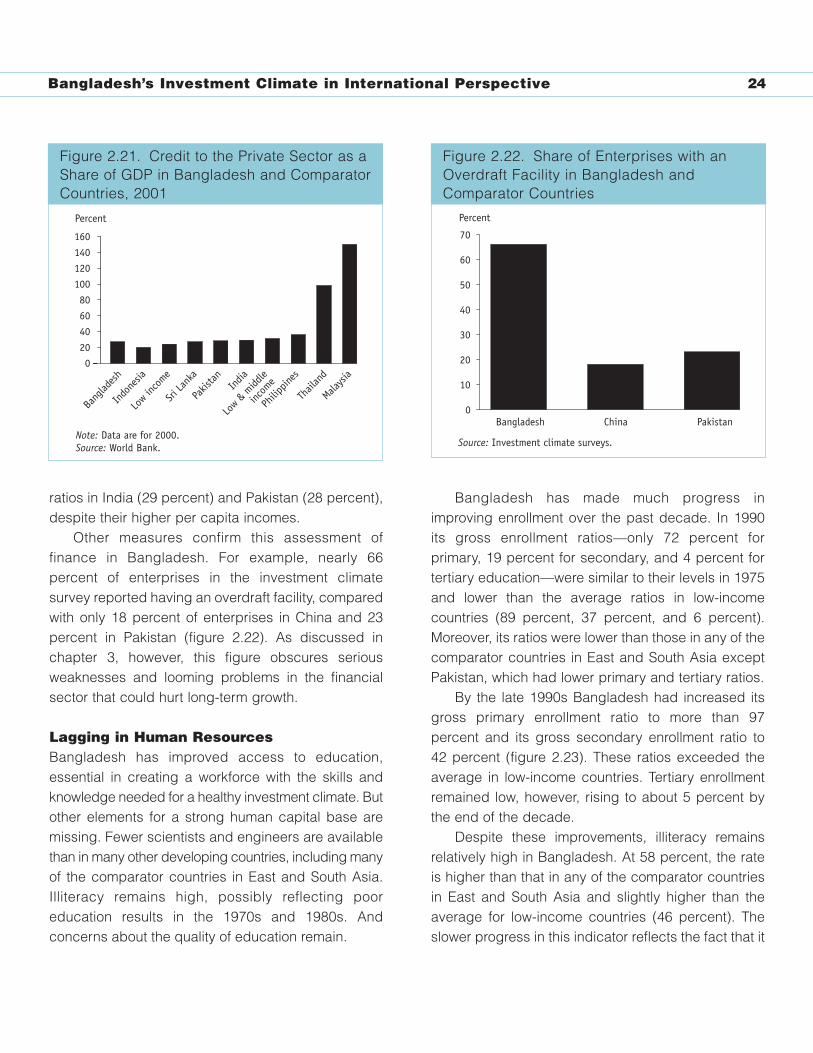
Not all constraints to entry are regulatory.Consider how long firms must wait for utilities andother services needed to run a business. InBangladesh firms reported waiting nearly 70 days onaverage for an electricity connection, more than 90days for a gas connection, and nearly 170 days for amainline telephone connection (figure 2.20). Mobiletelephony has shortened the wait for communicationsservices, with firms reporting typical waits of less thana week—and often no time at all—for mobile service.But firms reported waiting more than 260 days onaverage for construction permits. Combining thesewaiting times with unofficial payments, as well as
Figure 2.18. Number of Procedures and Cost to Start a Firm in Bangladesh and Comparator Countries, 2002
Bang
lades
h
Sri La
nka
China
Thail
and
Philip
pines
Malaysia
India
Num
ber
of p
roce
dure
s
Cost
as
a pe
rcen
tage
of
gros
s na
tion
al in
com
e pe
r ca
pita
Source: World Bank, Doing Business database.
78
12
8
10
7
10
77.6
15.713.2
6.7
14.5
26.6
51.1
0
2
4
6
8
10
12
14
0
10
20
30
40
50
60
70
80
90
Figure 2.18. Number of Procedures and Cost to Start aFirm in Bangladesh and Comparator Countries, 2002
Bangladesh’s Investment Climate in International Perspective 23
legitimate connection fees, gives a sense of thedifficulties entrepreneurs face in starting viablebusinesses in Bangladesh.
Another way to measure the ease of entry is toassess the availability of subcontractors. Where
subcontractors are available, entrepreneurs can moreeasily start a business because they can quickly havea variety of services available to them without needingto house them all within their new, very smallbusiness. And in some cases it may be easier to startfirms as subcontractors, since these are often highlyspecialized operations. In Bangladesh, however,subcontracting is almost unknown. In the investmentclimate survey nearly 75 percent of firms reportednever using contractors, and another 10 percent onlyseldom using them.
Access to FinanceBangladesh firms tend to have reasonable access to formal finance compared to other low-incomecountries. In 2001 credit to the private sectoramounted to about 27 percent of GDP in Bangladesh(figure 2.21). Although this ratio was lower than thosein some countries in the region, it compares favorablywith the average for low-income countries (24 percentof GDP). And it was only fractionally lower than the
Figure 2.19. Rankings of Bangladesh and Comparator Countries by Difficulty of Starting Firms and Hiring and Firing Workers
0 10 20 30 40 50 60 70
Bangladesh
Thailand
China
Sri Lanka
Malaysia
India
Indonesia
Philippines
Administrative burden for startupsHiring and Firing of workers
Source: World Economic Forum 2002.
Easiest Hardest
Figure 2.19. Rankings of Bangladesh and ComparatorCountries by Difficulty of Starting Firms and Hiring andFiring Workers
Figure 2.20. Average Wait for Utility Connections for Firms in Bangladesh
0
20
40
60
80
100
120
140
160
180
Mainlinetelephone
Gas Electricity Mobile phone
Days
Source: Investment climate survey.
Figure 2.20. Average Wait for UtilityConnections for Firms in Bangladesh
Bangladesh’s Investment Climate in International Perspective 24
ratios in India (29 percent) and Pakistan (28 percent),despite their higher per capita incomes.
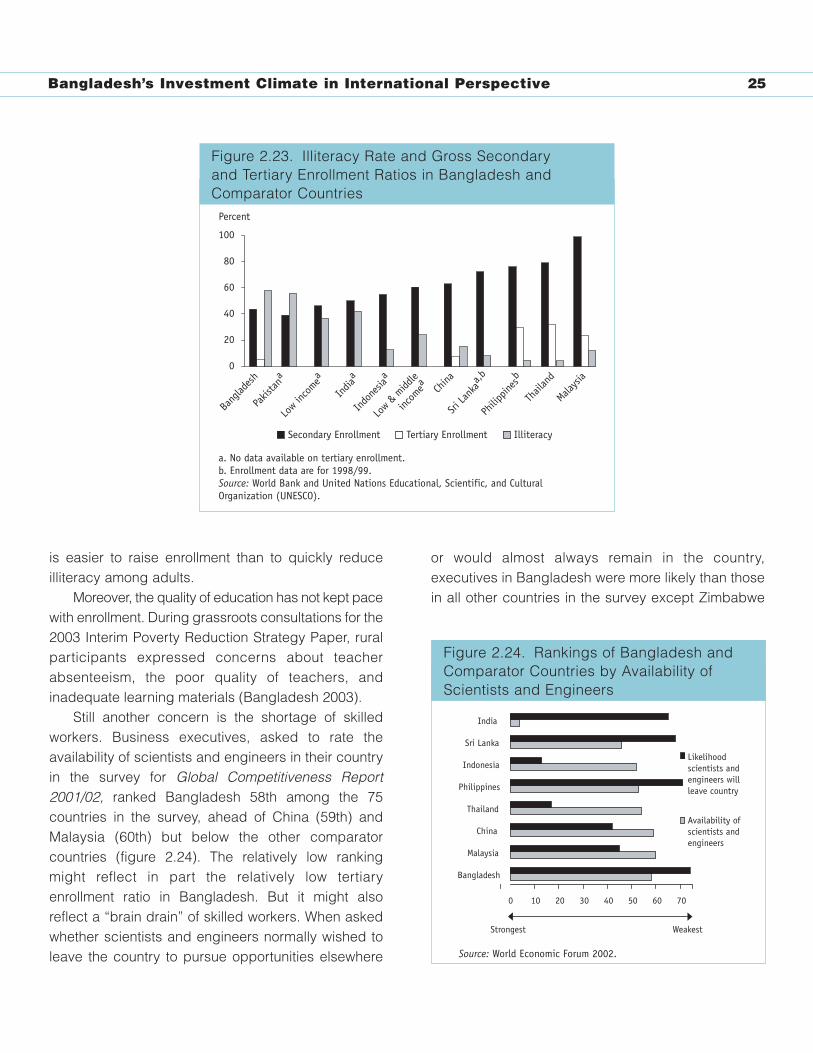
Other measures confirm this assessment offinance in Bangladesh. For example, nearly 66percent of enterprises in the investment climatesurvey reported having an overdraft facility, comparedwith only 18 percent of enterprises in China and 23percent in Pakistan (figure 2.22). As discussed inchapter 3, however, this figure obscures seriousweaknesses and looming problems in the financialsector that could hurt long-term growth.
Lagging in Human Resources Bangladesh has improved access to education,essential in creating a workforce with the skills andknowledge needed for a healthy investment climate. Butother elements for a strong human capital base aremissing. Fewer scientists and engineers are availablethan in many other developing countries, including manyof the comparator countries in East and South Asia.Illiteracy remains high, possibly reflecting pooreducation results in the 1970s and 1980s. Andconcerns about the quality of education remain.
Bangladesh has made much progress inimproving enrollment over the past decade. In 1990its gross enrollment ratios—only 72 percent forprimary, 19 percent for secondary, and 4 percent fortertiary education—were similar to their levels in 1975and lower than the average ratios in low-incomecountries (89 percent, 37 percent, and 6 percent).Moreover, its ratios were lower than those in any of thecomparator countries in East and South Asia exceptPakistan, which had lower primary and tertiary ratios.
By the late 1990s Bangladesh had increased itsgross primary enrollment ratio to more than 97percent and its gross secondary enrollment ratio to 42 percent (figure 2.23). These ratios exceeded theaverage in low-income countries. Tertiary enrollmentremained low, however, rising to about 5 percent bythe end of the decade.
Despite these improvements, illiteracy remainsrelatively high in Bangladesh. At 58 percent, the rateis higher than that in any of the comparator countriesin East and South Asia and slightly higher than theaverage for low-income countries (46 percent). Theslower progress in this indicator reflects the fact that it
Figure 2.22. Share of Enterprises with an Overdraft Facility in Bangladesh and Comparator Countries
0
10
20
30
40
50
60
70
Bangladesh China Pakistan
Source: Investment climate surveys.
Percent
Figure 2.22. Share of Enterprises with anOverdraft Facility in Bangladesh andComparator Countries
Figure 2.21. Credit to the Private Sector as a Share of GDP in Bangladesh and Comparator Countries, 2001
0
20
40
60
80
100
120
140
160
Bang
lades
h
Indo
nesia
Low in
come
Sri La
nka
Pakis
tan India
Low &
midd
le
incom
e
Philip
pines
Thail
and
Malaysia
Note: Data are for 2000. Source: World Bank.
Percent
Figure 2.21. Credit to the Private Sector as aShare of GDP in Bangladesh and ComparatorCountries, 2001
Bangladesh’s Investment Climate in International Perspective 25
is easier to raise enrollment than to quickly reduceilliteracy among adults.
Moreover, the quality of education has not kept pacewith enrollment. During grassroots consultations for the2003 Interim Poverty Reduction Strategy Paper, ruralparticipants expressed concerns about teacherabsenteeism, the poor quality of teachers, andinadequate learning materials (Bangladesh 2003).
Still another concern is the shortage of skilledworkers. Business executives, asked to rate theavailability of scientists and engineers in their countryin the survey for Global Competitiveness Report2001/02, ranked Bangladesh 58th among the 75countries in the survey, ahead of China (59th) andMalaysia (60th) but below the other comparatorcountries (figure 2.24). The relatively low rankingmight reflect in part the relatively low tertiaryenrollment ratio in Bangladesh. But it might alsoreflect a “brain drain” of skilled workers. When askedwhether scientists and engineers normally wished toleave the country to pursue opportunities elsewhere
or would almost always remain in the country,executives in Bangladesh were more likely than thosein all other countries in the survey except Zimbabwe
Figure 2.24. Rankings of Bangladesh and Comparator Countries by Availability of Scientists and Engineers
0 10 20 30 40 50 60 70
Bangladesh
India
Sri Lanka
Indonesia
Philippines
Thailand
China
Malaysia
Likelihood scientists andengineers willleave country
Availability ofscientists andengineers
Source: World Economic Forum 2002.
Strongest Weakest
Figure 2.24. Rankings of Bangladesh andComparator Countries by Availability ofScientists and Engineers
F gure 2.23. Illiteracy Rate and Gross Secondary and Tertiary Enrollment Ratios in Bangladesh and Comparator Countries
0
20
40
60
80
100
Bang
lades
h
Pakis
tana
Low in
comea
India
a
Indo
nesiaa
Low &
midd
le
incom
ea
China
Sri La
nkaa,b
Philip
pinesb
Thail
and
Malaysia
Secondary Enrollment IlliteracyTertiary Enrollment
a. No data available on tertiary enrollment.b. Enrollment data are for 1998/99.Source: World Bank and United Nations Educational, Scientific, and Cultural Organization (UNESCO).
Percent
Figure 2.23. Illiteracy Rate and Gross Secondary and Tertiary Enrollment Ratios in Bangladesh andComparator Countries
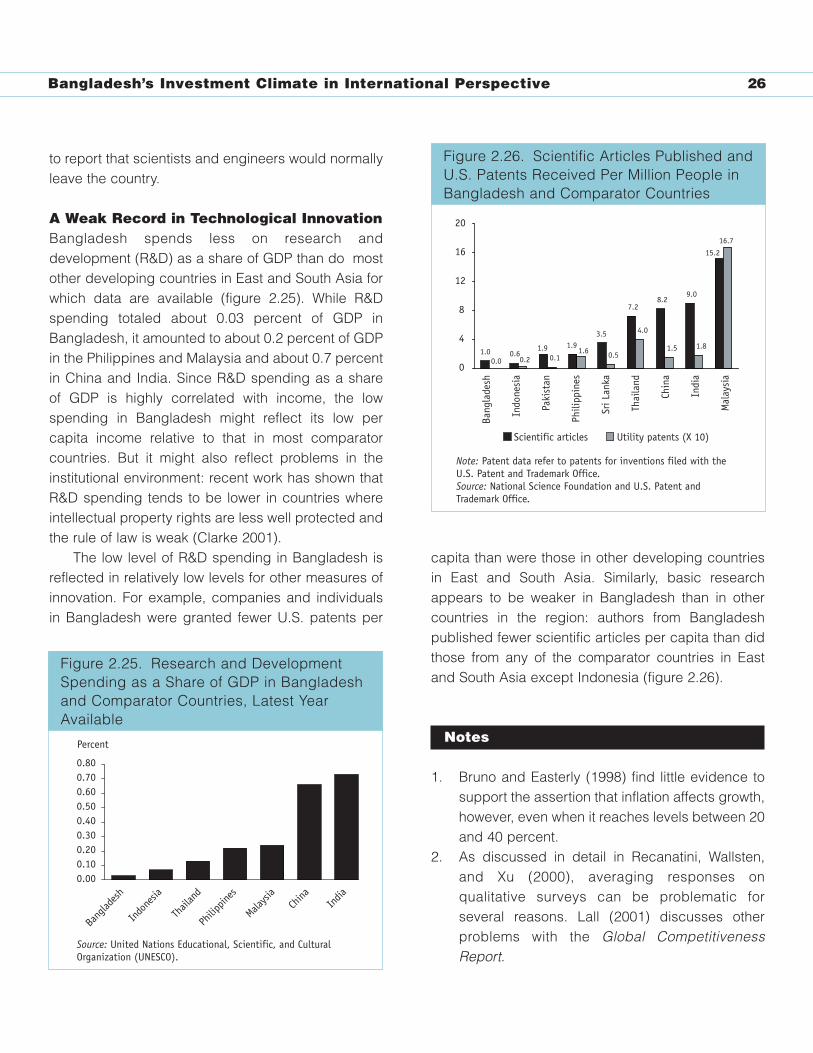
Bangladesh’s Investment Climate in International Perspective 26
to report that scientists and engineers would normallyleave the country.
A Weak Record in Technological InnovationBangladesh spends less on research anddevelopment (R&D) as a share of GDP than do mostother developing countries in East and South Asia forwhich data are available (figure 2.25). While R&Dspending totaled about 0.03 percent of GDP inBangladesh, it amounted to about 0.2 percent of GDPin the Philippines and Malaysia and about 0.7 percentin China and India. Since R&D spending as a share of GDP is highly correlated with income, the lowspending in Bangladesh might reflect its low percapita income relative to that in most comparatorcountries. But it might also reflect problems in theinstitutional environment: recent work has shown thatR&D spending tends to be lower in countries whereintellectual property rights are less well protected andthe rule of law is weak (Clarke 2001).
The low level of R&D spending in Bangladesh isreflected in relatively low levels for other measures ofinnovation. For example, companies and individualsin Bangladesh were granted fewer U.S. patents per
capita than were those in other developing countriesin East and South Asia. Similarly, basic researchappears to be weaker in Bangladesh than in othercountries in the region: authors from Bangladeshpublished fewer scientific articles per capita than didthose from any of the comparator countries in Eastand South Asia except Indonesia (figure 2.26).
Notes
1. Bruno and Easterly (1998) find little evidence tosupport the assertion that inflation affects growth,however, even when it reaches levels between 20and 40 percent.
2. As discussed in detail in Recanatini, Wallsten,and Xu (2000), averaging responses onqualitative surveys can be problematic forseveral reasons. Lall (2001) discusses otherproblems with the Global CompetitivenessReport.
Figure 2.26. Scientific Articles Published and U.S. PatentsReceived Per Million People in Bangladesh and Comparator Countries
1.0 0.61.9 1.9
3.5
7.28.2
9.0
15.2
0.0 0.2 0.11.6 0.5
4.0
1.5 1.8
16.7
0
4
8
12
16
20
Indo
nesi
a
Paki
stan
Phili
ppin
es
Sri L
anka
Thai
land
Chin
a
Indi
a
Mal
aysi
a
Scientific articles Utility patents (X 10)
Note: Patent data refer to patents for inventions filed with the U.S. Patent and Trademark Office.Source: National Science Foundation and U.S. Patent and Trademark Office.
Bang
lade
sh
Figure 2.26. Scientific Articles Published andU.S. Patents Received Per Million People inBangladesh and Comparator Countries
Figure 2.25. Research and Development Spending as a Share of GDP in Bangladesh and Comparator Countries, Latest Year Available
0.000.100.200.300.400.500.600.700.80
Bang
lades
h
Indo
nesia
Thail
and
Philip
pines
Malaysia
China
India
Source: United Nations Educational, Scientific, and Cultural Organization (UNESCO).
Percent
Figure 2.25. Research and DevelopmentSpending as a Share of GDP in Bangladeshand Comparator Countries, Latest YearAvailable
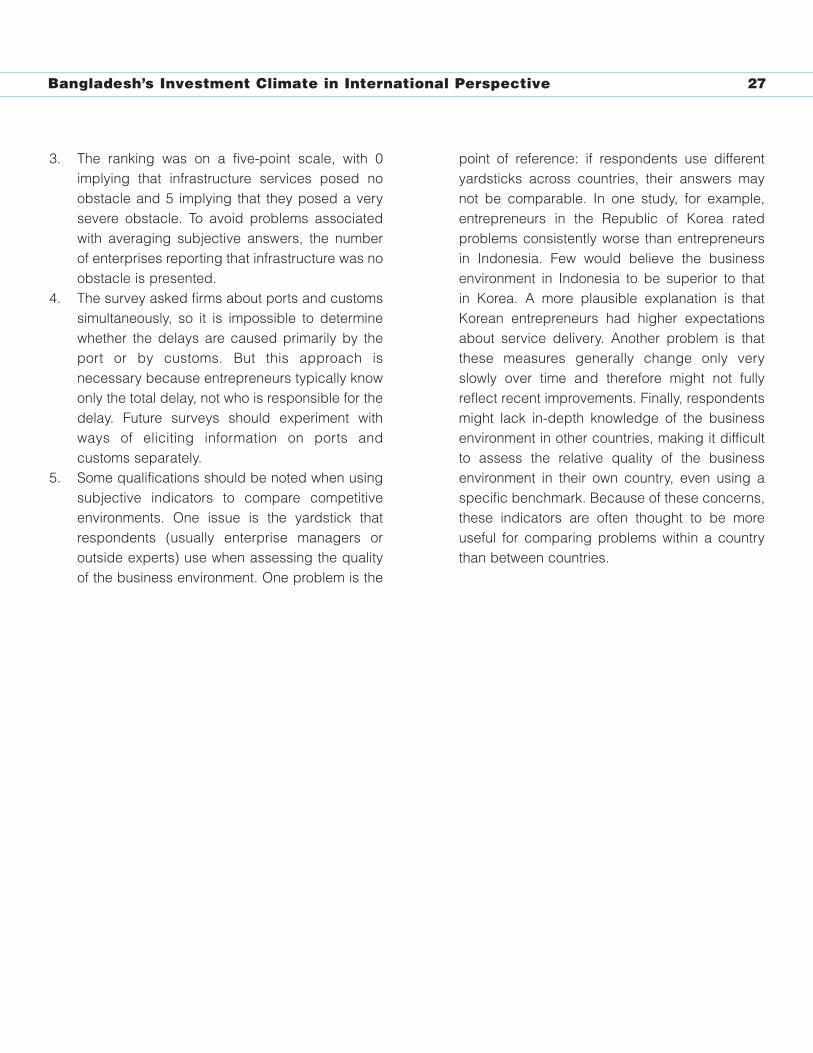
Bangladesh’s Investment Climate in International Perspective 27
3. The ranking was on a five-point scale, with 0implying that infrastructure services posed noobstacle and 5 implying that they posed a verysevere obstacle. To avoid problems associatedwith averaging subjective answers, the numberof enterprises reporting that infrastructure was noobstacle is presented.
4. The survey asked firms about ports and customssimultaneously, so it is impossible to determinewhether the delays are caused primarily by theport or by customs. But this approach isnecessary because entrepreneurs typically knowonly the total delay, not who is responsible for thedelay. Future surveys should experiment withways of eliciting information on ports andcustoms separately.
5. Some qualifications should be noted when usingsubjective indicators to compare competitiveenvironments. One issue is the yardstick thatrespondents (usually enterprise managers oroutside experts) use when assessing the qualityof the business environment. One problem is the
point of reference: if respondents use differentyardsticks across countries, their answers maynot be comparable. In one study, for example,entrepreneurs in the Republic of Korea ratedproblems consistently worse than entrepreneursin Indonesia. Few would believe the businessenvironment in Indonesia to be superior to that in Korea. A more plausible explanation is thatKorean entrepreneurs had higher expectationsabout service delivery. Another problem is thatthese measures generally change only veryslowly over time and therefore might not fullyreflect recent improvements. Finally, respondentsmight lack in-depth knowledge of the businessenvironment in other countries, making it difficultto assess the relative quality of the businessenvironment in their own country, even using aspecific benchmark. Because of these concerns,these indicators are often thought to be moreuseful for comparing problems within a countrythan between countries.
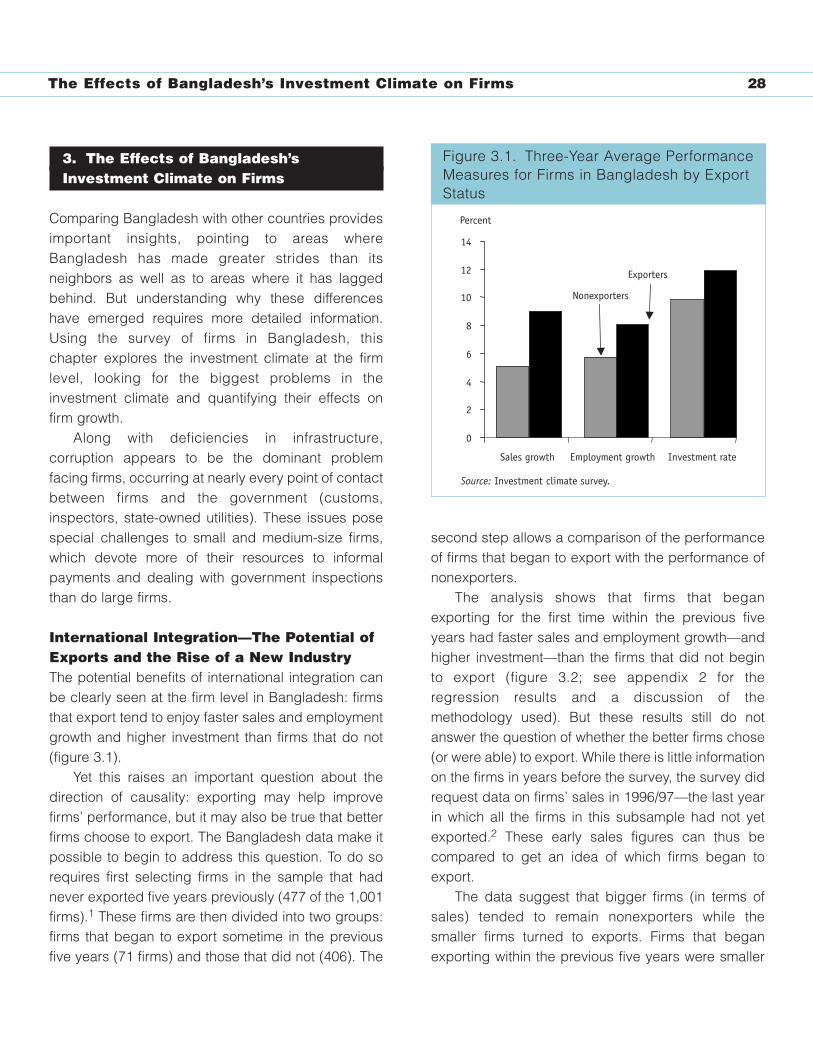
The Effects of Bangladesh’s Investment Climate on Firms 28
3. The Effects of Bangladesh’s Investment Climate on Firms
Comparing Bangladesh with other countries providesimportant insights, pointing to areas whereBangladesh has made greater strides than itsneighbors as well as to areas where it has laggedbehind. But understanding why these differenceshave emerged requires more detailed information.Using the survey of firms in Bangladesh, this chapter explores the investment climate at the firmlevel, looking for the biggest problems in theinvestment climate and quantifying their effects onfirm growth.
Along with deficiencies in infrastructure,corruption appears to be the dominant problemfacing firms, occurring at nearly every point of contactbetween firms and the government (customs,inspectors, state-owned utilities). These issues posespecial challenges to small and medium-size firms,which devote more of their resources to informalpayments and dealing with government inspectionsthan do large firms.
International Integration—The Potential ofExports and the Rise of a New IndustryThe potential benefits of international integration canbe clearly seen at the firm level in Bangladesh: firmsthat export tend to enjoy faster sales and employmentgrowth and higher investment than firms that do not(figure 3.1).
Yet this raises an important question about thedirection of causality: exporting may help improvefirms’ performance, but it may also be true that betterfirms choose to export. The Bangladesh data make itpossible to begin to address this question. To do sorequires first selecting firms in the sample that hadnever exported five years previously (477 of the 1,001firms).1 These firms are then divided into two groups:firms that began to export sometime in the previousfive years (71 firms) and those that did not (406). The
second step allows a comparison of the performanceof firms that began to export with the performance ofnonexporters.
The analysis shows that firms that beganexporting for the first time within the previous fiveyears had faster sales and employment growth—andhigher investment—than the firms that did not beginto export (figure 3.2; see appendix 2 for theregression results and a discussion of themethodology used). But these results still do notanswer the question of whether the better firms chose(or were able) to export. While there is little informationon the firms in years before the survey, the survey didrequest data on firms’ sales in 1996/97—the last yearin which all the firms in this subsample had not yetexported.2 These early sales figures can thus becompared to get an idea of which firms began toexport.
The data suggest that bigger firms (in terms ofsales) tended to remain nonexporters while thesmaller firms turned to exports. Firms that beganexporting within the previous five years were smaller
Figure 3.1. Three-Year Average Performance Measures for Firms in Bangladesh by Export Status
0
2
4
6
8
10
12
14
Sales growth Employment growth Investment rate
Exporters
Nonexporters
Source: Investment climate survey.
Percent
Figure 3.1. Three-Year Average PerformanceMeasures for Firms in Bangladesh by ExportStatus
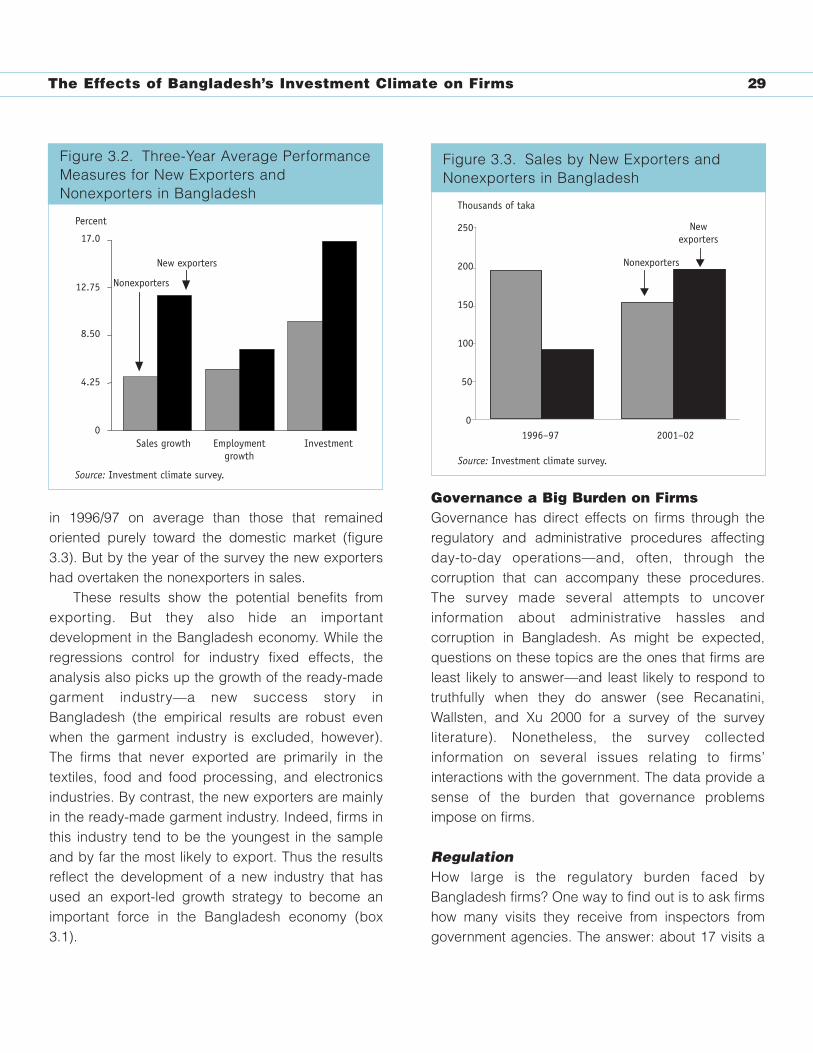
The Effects of Bangladesh’s Investment Climate on Firms 29
in 1996/97 on average than those that remainedoriented purely toward the domestic market (figure3.3). But by the year of the survey the new exportershad overtaken the nonexporters in sales.
These results show the potential benefits fromexporting. But they also hide an importantdevelopment in the Bangladesh economy. While theregressions control for industry fixed effects, theanalysis also picks up the growth of the ready-madegarment industry—a new success story inBangladesh (the empirical results are robust evenwhen the garment industry is excluded, however).The firms that never exported are primarily in thetextiles, food and food processing, and electronicsindustries. By contrast, the new exporters are mainlyin the ready-made garment industry. Indeed, firms inthis industry tend to be the youngest in the sampleand by far the most likely to export. Thus the resultsreflect the development of a new industry that hasused an export-led growth strategy to become animportant force in the Bangladesh economy (box3.1).
Governance a Big Burden on FirmsGovernance has direct effects on firms through theregulatory and administrative procedures affectingday-to-day operations—and, often, through thecorruption that can accompany these procedures.The survey made several attempts to uncoverinformation about administrative hassles andcorruption in Bangladesh. As might be expected,questions on these topics are the ones that firms areleast likely to answer—and least likely to respond totruthfully when they do answer (see Recanatini,Wallsten, and Xu 2000 for a survey of the surveyliterature). Nonetheless, the survey collectedinformation on several issues relating to firms’interactions with the government. The data provide asense of the burden that governance problemsimpose on firms.
RegulationHow large is the regulatory burden faced byBangladesh firms? One way to find out is to ask firmshow many visits they receive from inspectors fromgovernment agencies. The answer: about 17 visits a
0
17.0
Sales growth Employmentgrowth
Investment
Nonexporters
New exporters
Figure 3.2. Three-Year Average Performance Measures for New Exporters and Nonexporters in Bangladesh
Percent
Source: Investment climate survey.
4.25
8.50
12.75
Figure 3.2. Three-Year Average PerformanceMeasures for New Exporters andNonexporters in Bangladesh
Figure 3.3. Sales by New Exporters and Nonexporters in Bangladesh
0
250
1996–97 2001–02
Thousands of taka
Nonexporters
Newexporters
Source: Investment climate survey.
200
150
100
50
Figure 3.3. Sales by New Exporters andNonexporters in Bangladesh
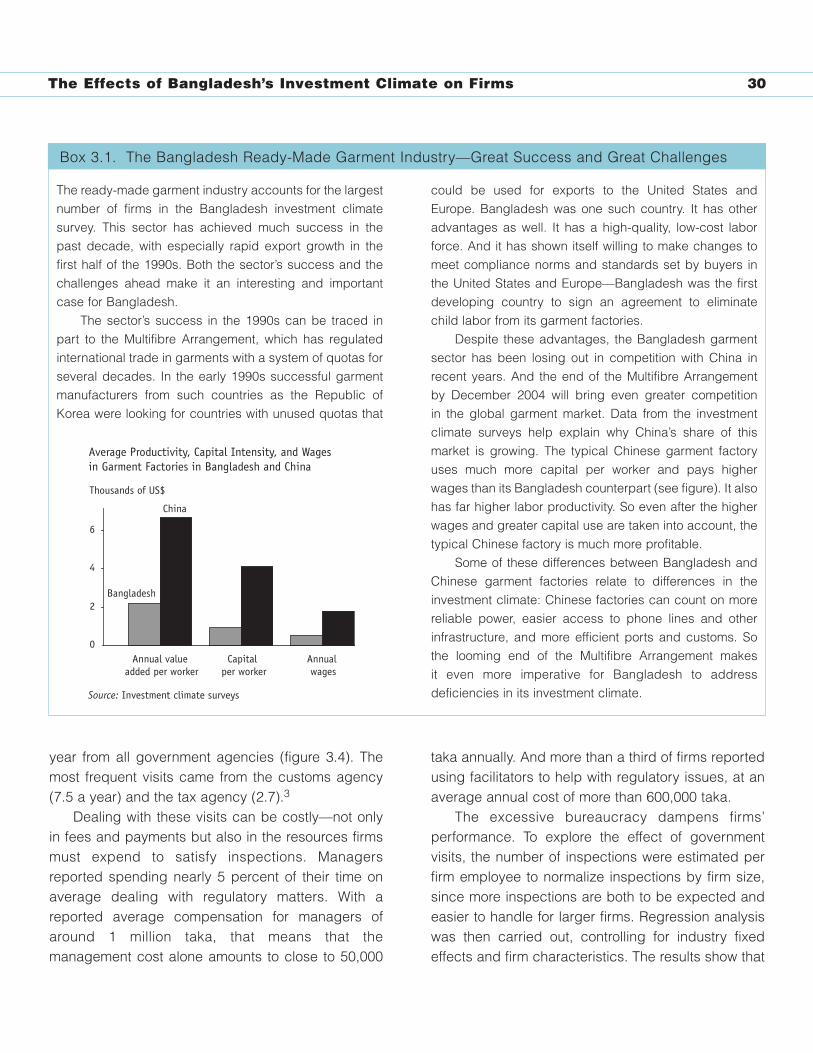
The Effects of Bangladesh’s Investment Climate on Firms 30
year from all government agencies (figure 3.4). Themost frequent visits came from the customs agency(7.5 a year) and the tax agency (2.7).3
Dealing with these visits can be costly—not onlyin fees and payments but also in the resources firmsmust expend to satisfy inspections. Managersreported spending nearly 5 percent of their time onaverage dealing with regulatory matters. With areported average compensation for managers ofaround 1 million taka, that means that themanagement cost alone amounts to close to 50,000
taka annually. And more than a third of firms reportedusing facilitators to help with regulatory issues, at anaverage annual cost of more than 600,000 taka.
The excessive bureaucracy dampens firms’performance. To explore the effect of governmentvisits, the number of inspections were estimated perfirm employee to normalize inspections by firm size,since more inspections are both to be expected andeasier to handle for larger firms. Regression analysiswas then carried out, controlling for industry fixedeffects and firm characteristics. The results show that
The ready-made garment industry accounts for the largestnumber of firms in the Bangladesh investment climatesurvey. This sector has achieved much success in thepast decade, with especially rapid export growth in thefirst half of the 1990s. Both the sector’s success and thechallenges ahead make it an interesting and importantcase for Bangladesh.
The sector’s success in the 1990s can be traced inpart to the Multifibre Arrangement, which has regulatedinternational trade in garments with a system of quotas forseveral decades. In the early 1990s successful garmentmanufacturers from such countries as the Republic ofKorea were looking for countries with unused quotas that
could be used for exports to the United States andEurope. Bangladesh was one such country. It has otheradvantages as well. It has a high-quality, low-cost laborforce. And it has shown itself willing to make changes tomeet compliance norms and standards set by buyers inthe United States and Europe—Bangladesh was the firstdeveloping country to sign an agreement to eliminatechild labor from its garment factories.
Despite these advantages, the Bangladesh garmentsector has been losing out in competition with China inrecent years. And the end of the Multifibre Arrangementby December 2004 will bring even greater competition in the global garment market. Data from the investmentclimate surveys help explain why China’s share of thismarket is growing. The typical Chinese garment factoryuses much more capital per worker and pays higherwages than its Bangladesh counterpart (see figure). It alsohas far higher labor productivity. So even after the higherwages and greater capital use are taken into account, thetypical Chinese factory is much more profitable.
Some of these differences between Bangladesh andChinese garment factories relate to differences in theinvestment climate: Chinese factories can count on morereliable power, easier access to phone lines and otherinfrastructure, and more efficient ports and customs. Sothe looming end of the Multifibre Arrangement makes it even more imperative for Bangladesh to addressdeficiencies in its investment climate.
Box 3.1. The Bangladesh Ready-Made Garment Industry—Great Success and Great Challenges
Average Productivity, Capital Intensity, and Wages in Garment Factories in Bangladesh and China
0
2
4
6
Annual value added per worker
Capital per worker
Annual wages
Bangladesh
China
Thousands of US$
Source: Investment climate surveys
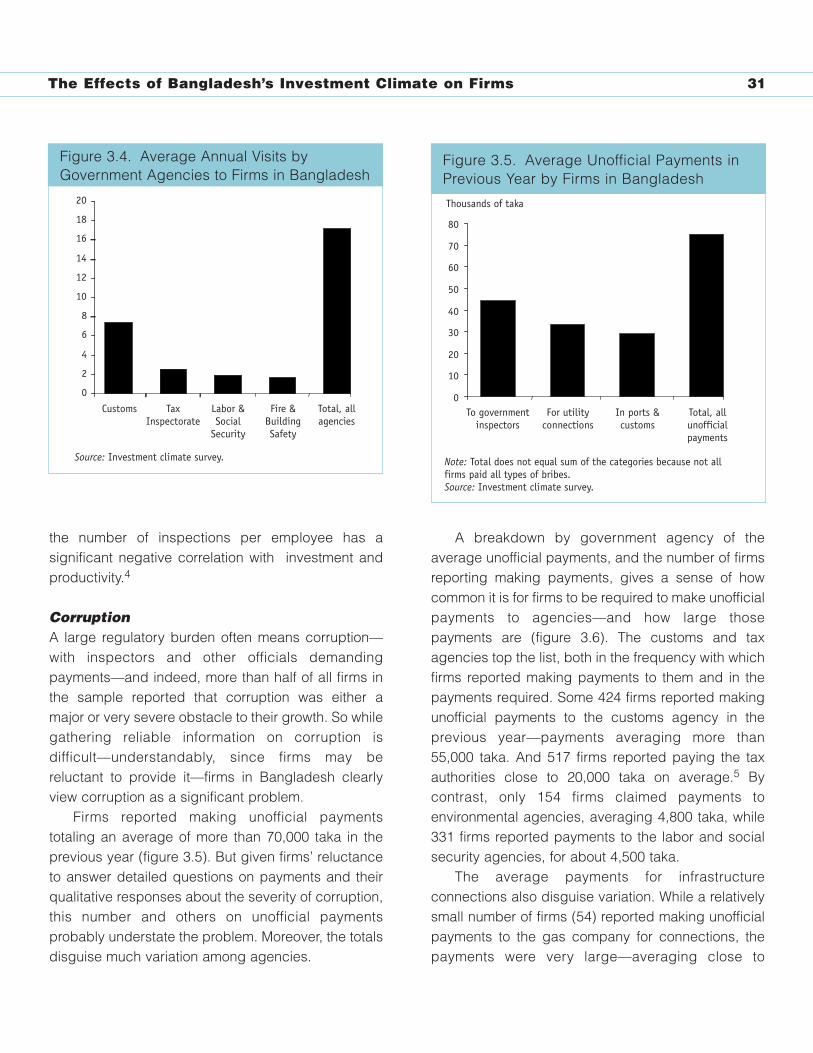
The Effects of Bangladesh’s Investment Climate on Firms 31
the number of inspections per employee has asignificant negative correlation with investment andproductivity.4
CorruptionA large regulatory burden often means corruption—with inspectors and other officials demandingpayments—and indeed, more than half of all firms inthe sample reported that corruption was either amajor or very severe obstacle to their growth. So whilegathering reliable information on corruption isdifficult—understandably, since firms may bereluctant to provide it—firms in Bangladesh clearlyview corruption as a significant problem.
Firms reported making unofficial paymentstotaling an average of more than 70,000 taka in theprevious year (figure 3.5). But given firms’ reluctanceto answer detailed questions on payments and theirqualitative responses about the severity of corruption,this number and others on unofficial paymentsprobably understate the problem. Moreover, the totalsdisguise much variation among agencies.
A breakdown by government agency of theaverage unofficial payments, and the number of firmsreporting making payments, gives a sense of howcommon it is for firms to be required to make unofficialpayments to agencies—and how large thosepayments are (figure 3.6). The customs and taxagencies top the list, both in the frequency with whichfirms reported making payments to them and in thepayments required. Some 424 firms reported makingunofficial payments to the customs agency in theprevious year—payments averaging more than55,000 taka. And 517 firms reported paying the taxauthorities close to 20,000 taka on average.5 Bycontrast, only 154 firms claimed payments toenvironmental agencies, averaging 4,800 taka, while331 firms reported payments to the labor and socialsecurity agencies, for about 4,500 taka.
The average payments for infrastructureconnections also disguise variation. While a relativelysmall number of firms (54) reported making unofficialpayments to the gas company for connections, thepayments were very large—averaging close to
Figure 3.5. Average Unofficial Payments in Previous Year by Firms in Bangladesh
0
10
20
30
40
50
60
70
80
To governmentinspectors
For utilityconnections
In ports &customs
Total, allunofficialpayments
Thousands of taka
Note: Total does not equal sum of the categories because not all firms paid all types of bribes.Source: Investment climate survey.
Figure 3.5. Average Unofficial Payments inPrevious Year by Firms in Bangladesh
Figure 3.4. Average Annual Visits by Government Agencies to Firms in Bangladesh
0
2
4
6
8
10
12
14
16
18
20
Customs TaxInspectorate
Labor &Social
Security
Fire &BuildingSafety
Total, allagencies
Source: Investment climate survey.
Figure 3.4. Average Annual Visits byGovernment Agencies to Firms in Bangladesh
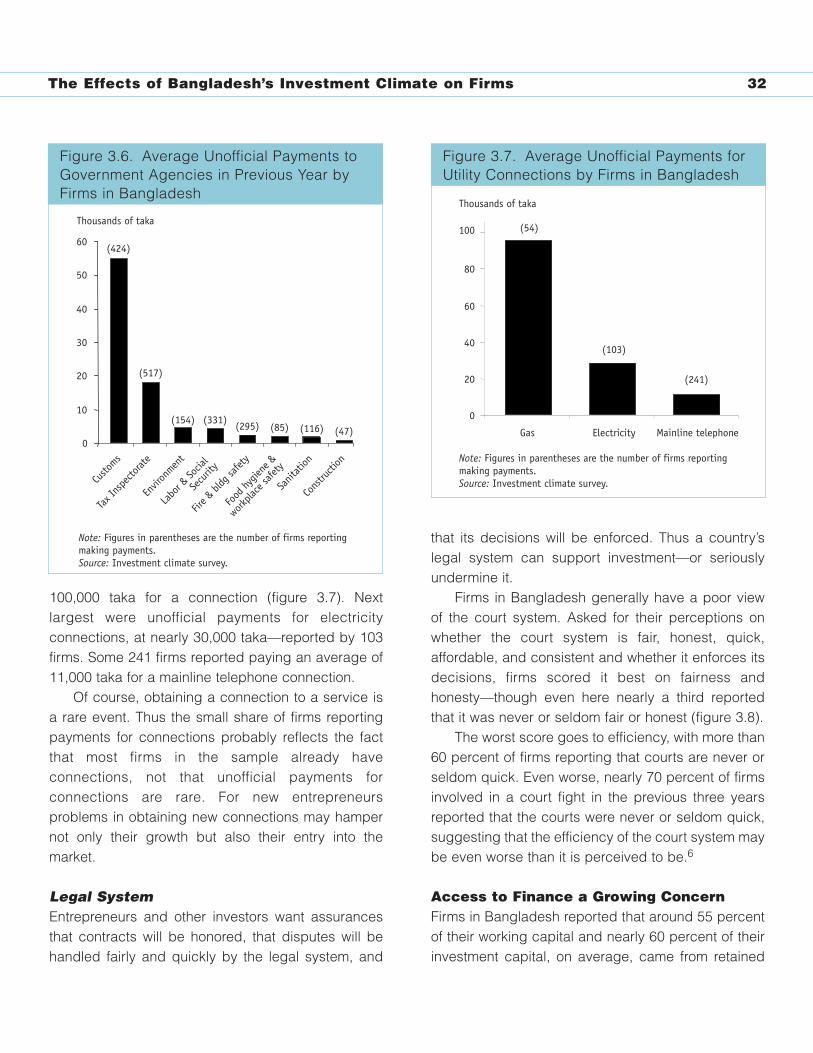
The Effects of Bangladesh’s Investment Climate on Firms 32
100,000 taka for a connection (figure 3.7). Nextlargest were unofficial payments for electricityconnections, at nearly 30,000 taka—reported by 103firms. Some 241 firms reported paying an average of11,000 taka for a mainline telephone connection.
Of course, obtaining a connection to a service isa rare event. Thus the small share of firms reportingpayments for connections probably reflects the factthat most firms in the sample already haveconnections, not that unofficial payments forconnections are rare. For new entrepreneursproblems in obtaining new connections may hampernot only their growth but also their entry into themarket.
Legal SystemEntrepreneurs and other investors want assurancesthat contracts will be honored, that disputes will behandled fairly and quickly by the legal system, and
that its decisions will be enforced. Thus a country’slegal system can support investment—or seriouslyundermine it.
Firms in Bangladesh generally have a poor viewof the court system. Asked for their perceptions onwhether the court system is fair, honest, quick,affordable, and consistent and whether it enforces itsdecisions, firms scored it best on fairness andhonesty—though even here nearly a third reportedthat it was never or seldom fair or honest (figure 3.8).
The worst score goes to efficiency, with more than60 percent of firms reporting that courts are never orseldom quick. Even worse, nearly 70 percent of firmsinvolved in a court fight in the previous three yearsreported that the courts were never or seldom quick,suggesting that the efficiency of the court system maybe even worse than it is perceived to be.6
Access to Finance a Growing ConcernFirms in Bangladesh reported that around 55 percentof their working capital and nearly 60 percent of theirinvestment capital, on average, came from retained
Figure 3.6. Average Unofficial Payments to Government Agencies in Previous Year by Firms in Bangladesh
0
10
20
30
40
50
60(424)
(517)
(154) (331)(295) (85) (47)
Custo
ms
Tax I
nspe
ctorat
e
Envir
onmen
t
Labo
r & So
cial
Secu
rity
Fire &
bldg
safet
y
Food
hygie
ne &
workpla
ce sa
fety
Sanit
ation
Cons
tructi
on
Note: Figures in parentheses are the number of firms reporting making payments.Source: Investment climate survey.
(116)
Thousands of taka
Figure 3.6. Average Unofficial Payments toGovernment Agencies in Previous Year byFirms in Bangladesh
F gure 3.7. Average Unofficial Payments for Utility Connections by Firms in Bangladesh
0
20
40
60
80
Gas Electricity Mainline telephone
(54)
(103)
(241)
Thousands of taka
Note: Figures in parentheses are the number of firms reporting making payments.Source: Investment climate survey.
100
Figure 3.7. Average Unofficial Payments forUtility Connections by Firms in Bangladesh
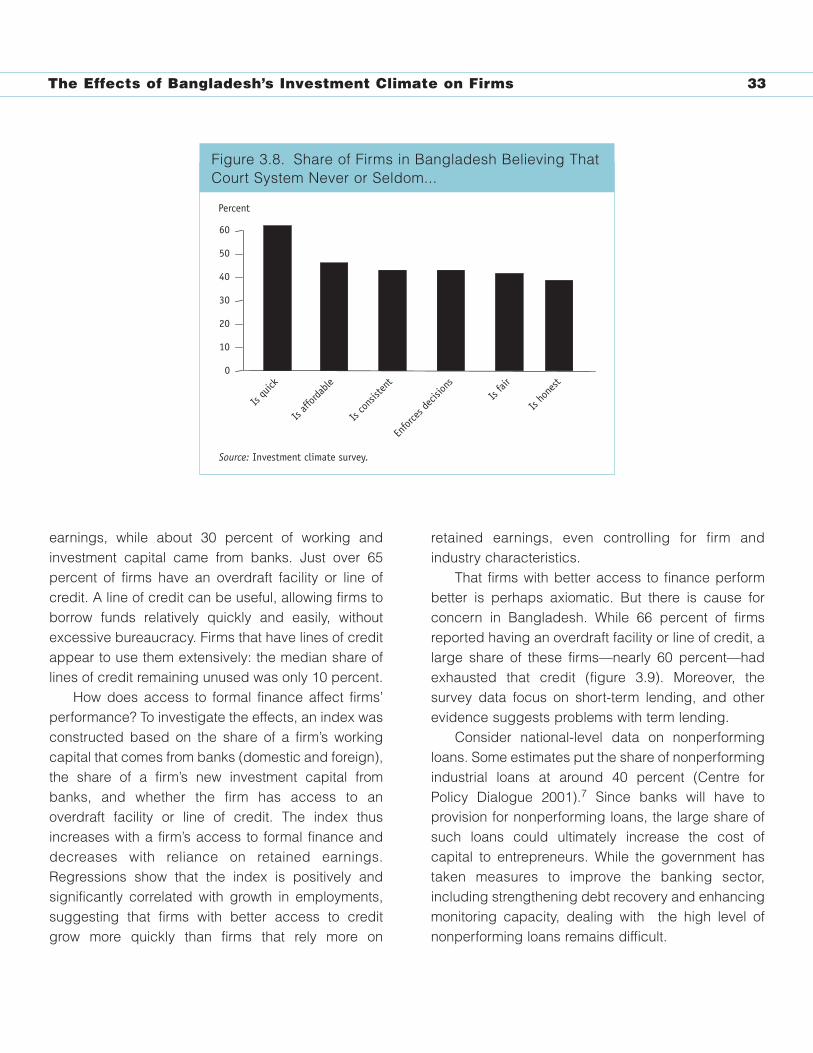
The Effects of Bangladesh’s Investment Climate on Firms 33
earnings, while about 30 percent of working andinvestment capital came from banks. Just over 65percent of firms have an overdraft facility or line ofcredit. A line of credit can be useful, allowing firms toborrow funds relatively quickly and easily, withoutexcessive bureaucracy. Firms that have lines of creditappear to use them extensively: the median share oflines of credit remaining unused was only 10 percent.
How does access to formal finance affect firms’performance? To investigate the effects, an index wasconstructed based on the share of a firm’s workingcapital that comes from banks (domestic and foreign),the share of a firm’s new investment capital frombanks, and whether the firm has access to anoverdraft facility or line of credit. The index thusincreases with a firm’s access to formal finance anddecreases with reliance on retained earnings.Regressions show that the index is positively andsignificantly correlated with growth in employments,suggesting that firms with better access to creditgrow more quickly than firms that rely more on
retained earnings, even controlling for firm andindustry characteristics.
That firms with better access to finance performbetter is perhaps axiomatic. But there is cause forconcern in Bangladesh. While 66 percent of firmsreported having an overdraft facility or line of credit, alarge share of these firms—nearly 60 percent—hadexhausted that credit (figure 3.9). Moreover, thesurvey data focus on short-term lending, and otherevidence suggests problems with term lending.
Consider national-level data on nonperformingloans. Some estimates put the share of nonperformingindustrial loans at around 40 percent (Centre forPolicy Dialogue 2001).7 Since banks will have toprovision for nonperforming loans, the large share ofsuch loans could ultimately increase the cost ofcapital to entrepreneurs. While the government hastaken measures to improve the banking sector,including strengthening debt recovery and enhancingmonitoring capacity, dealing with the high level ofnonperforming loans remains difficult.
Figure 3.8. Share of Firms in Bangladesh Believing That Court System Never or Seldom...
0
60
Is qu
ick
Is aff
ordab
le
Is co
nsist
ent
Enfor
ces d
ecisi
ons
Is fai
r
Is ho
nest
Percent
50
40
30
20
10
Source: Investment climate survey.
Figure 3.8. Share of Firms in Bangladesh Believing ThatCourt System Never or Seldom...
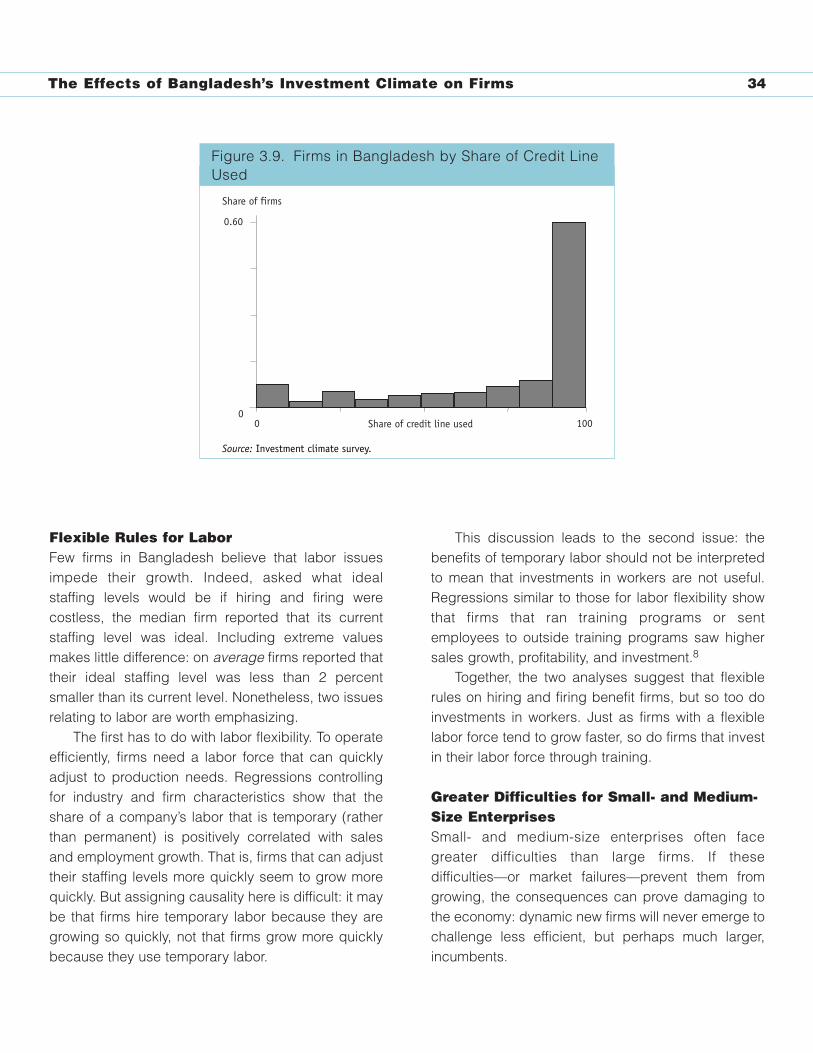
The Effects of Bangladesh’s Investment Climate on Firms 34
Flexible Rules for LaborFew firms in Bangladesh believe that labor issuesimpede their growth. Indeed, asked what idealstaffing levels would be if hiring and firing werecostless, the median firm reported that its currentstaffing level was ideal. Including extreme valuesmakes little difference: on average firms reported thattheir ideal staffing level was less than 2 percentsmaller than its current level. Nonetheless, two issuesrelating to labor are worth emphasizing.
The first has to do with labor flexibility. To operateefficiently, firms need a labor force that can quicklyadjust to production needs. Regressions controllingfor industry and firm characteristics show that theshare of a company’s labor that is temporary (ratherthan permanent) is positively correlated with salesand employment growth. That is, firms that can adjusttheir staffing levels more quickly seem to grow morequickly. But assigning causality here is difficult: it maybe that firms hire temporary labor because they aregrowing so quickly, not that firms grow more quicklybecause they use temporary labor.
This discussion leads to the second issue: thebenefits of temporary labor should not be interpretedto mean that investments in workers are not useful.Regressions similar to those for labor flexibility showthat firms that ran training programs or sentemployees to outside training programs saw highersales growth, profitability, and investment.8
Together, the two analyses suggest that flexiblerules on hiring and firing benefit firms, but so too doinvestments in workers. Just as firms with a flexiblelabor force tend to grow faster, so do firms that investin their labor force through training.
Greater Difficulties for Small- and Medium-Size EnterprisesSmall- and medium-size enterprises often facegreater difficulties than large firms. If thesedifficulties—or market failures—prevent them fromgrowing, the consequences can prove damaging tothe economy: dynamic new firms will never emerge tochallenge less efficient, but perhaps much larger,incumbents.
Figure 3.9. Firms in Bangladesh by Share of Credit Line Used
Share of firms
Share of credit line used0 1000
0.60
Source: Investment climate survey.
Figure 3.9. Firms in Bangladesh by Share of Credit LineUsed
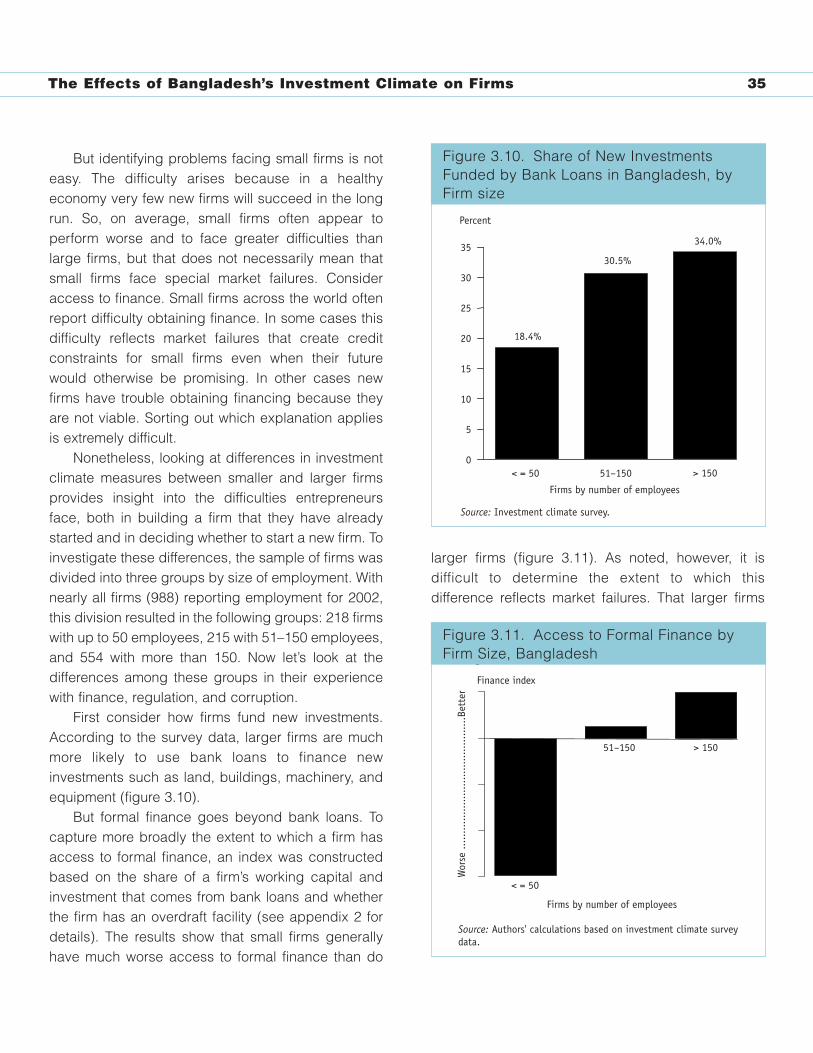
The Effects of Bangladesh’s Investment Climate on Firms 35
But identifying problems facing small firms is noteasy. The difficulty arises because in a healthyeconomy very few new firms will succeed in the longrun. So, on average, small firms often appear toperform worse and to face greater difficulties thanlarge firms, but that does not necessarily mean thatsmall firms face special market failures. Consideraccess to finance. Small firms across the world oftenreport difficulty obtaining finance. In some cases thisdifficulty reflects market failures that create creditconstraints for small firms even when their futurewould otherwise be promising. In other cases newfirms have trouble obtaining financing because theyare not viable. Sorting out which explanation appliesis extremely difficult.
Nonetheless, looking at differences in investmentclimate measures between smaller and larger firmsprovides insight into the difficulties entrepreneursface, both in building a firm that they have alreadystarted and in deciding whether to start a new firm. Toinvestigate these differences, the sample of firms wasdivided into three groups by size of employment. Withnearly all firms (988) reporting employment for 2002,this division resulted in the following groups: 218 firmswith up to 50 employees, 215 with 51–150 employees,and 554 with more than 150. Now let’s look at thedifferences among these groups in their experiencewith finance, regulation, and corruption.
First consider how firms fund new investments.According to the survey data, larger firms are muchmore likely to use bank loans to finance newinvestments such as land, buildings, machinery, andequipment (figure 3.10).
But formal finance goes beyond bank loans. Tocapture more broadly the extent to which a firm hasaccess to formal finance, an index was constructedbased on the share of a firm’s working capital andinvestment that comes from bank loans and whetherthe firm has an overdraft facility (see appendix 2 fordetails). The results show that small firms generallyhave much worse access to formal finance than do
larger firms (figure 3.11). As noted, however, it isdifficult to determine the extent to which thisdifference reflects market failures. That larger firms
Figure 3.11. Access to Formal Finance by Firm Size, Bangladesh
< = 50
51–150 > 150
Wor
se ..........................................B
ette
r
Finance index
Firms by number of employees
Source: Authors' calculations based on investment climate survey data.
Figure 3.11. Access to Formal Finance byFirm Size, Bangladesh
Figure 3.10. Share of New Investments Funded by Bank Loans in Bangladesh, by Firm Size
0
35
< = 50 51–150 > 150
18.4%
30.5%
34.0%
Firms by number of employees
30
25
20
15
10
5
Percent
Source: Investment climate survey.
Figure 3.10. Share of New InvestmentsFunded by Bank Loans in Bangladesh, byFirm size
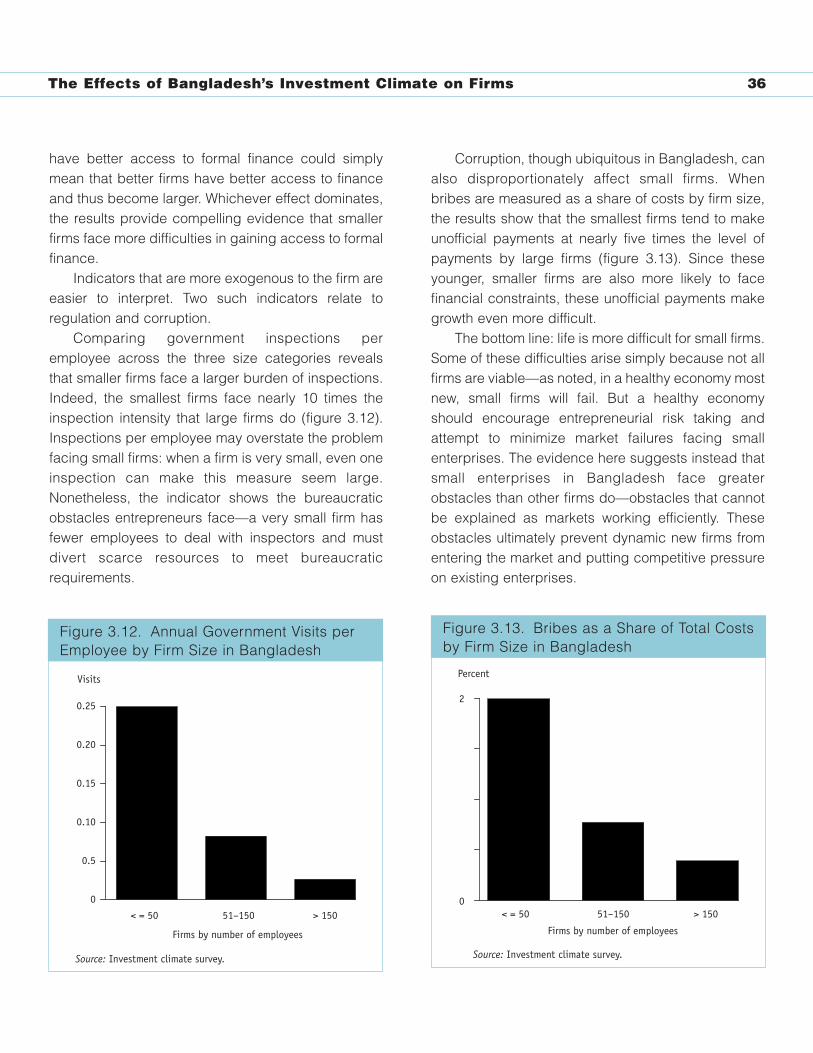
The Effects of Bangladesh’s Investment Climate on Firms 36
have better access to formal finance could simplymean that better firms have better access to financeand thus become larger. Whichever effect dominates,the results provide compelling evidence that smallerfirms face more difficulties in gaining access to formalfinance.
Indicators that are more exogenous to the firm areeasier to interpret. Two such indicators relate toregulation and corruption.
Comparing government inspections peremployee across the three size categories revealsthat smaller firms face a larger burden of inspections.Indeed, the smallest firms face nearly 10 times theinspection intensity that large firms do (figure 3.12).Inspections per employee may overstate the problemfacing small firms: when a firm is very small, even oneinspection can make this measure seem large.Nonetheless, the indicator shows the bureaucraticobstacles entrepreneurs face—a very small firm hasfewer employees to deal with inspectors and mustdivert scarce resources to meet bureaucraticrequirements.
Corruption, though ubiquitous in Bangladesh, canalso disproportionately affect small firms. Whenbribes are measured as a share of costs by firm size,the results show that the smallest firms tend to makeunofficial payments at nearly five times the level ofpayments by large firms (figure 3.13). Since theseyounger, smaller firms are also more likely to facefinancial constraints, these unofficial payments makegrowth even more difficult.
The bottom line: life is more difficult for small firms.Some of these difficulties arise simply because not allfirms are viable—as noted, in a healthy economy mostnew, small firms will fail. But a healthy economyshould encourage entrepreneurial risk taking andattempt to minimize market failures facing smallenterprises. The evidence here suggests instead thatsmall enterprises in Bangladesh face greaterobstacles than other firms do—obstacles that cannotbe explained as markets working efficiently. Theseobstacles ultimately prevent dynamic new firms fromentering the market and putting competitive pressureon existing enterprises.
Figure 3.13. Bribes as a Share of Total Costs by Firm Size in Bangladesh
0
2
< = 50 51–150 > 150
Firms by number of employees
Source: Investment climate survey.
Percent
Figure 3.13. Bribes as a Share of Total Costsby Firm Size in Bangladesh
Figure 3.12. Annual Government Visits per Employee by Firm Size in Bangladesh
0
0.25
< = 50 51–150 > 150
Firms by number of employees
0.5
0.10
0.15
0.20
Source: Investment climate survey.
Visits
Figure 3.12. Annual Government Visits perEmployee by Firm Size in Bangladesh
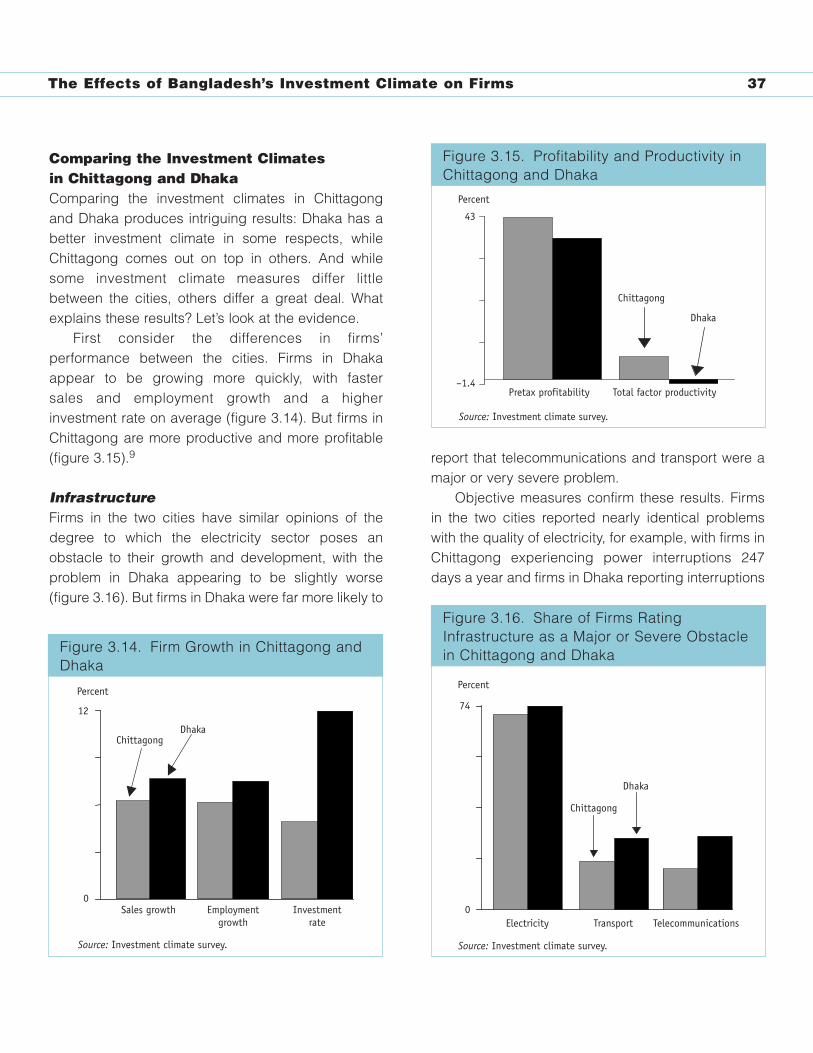
The Effects of Bangladesh’s Investment Climate on Firms 37
Comparing the Investment Climates in Chittagong and DhakaComparing the investment climates in Chittagong and Dhaka produces intriguing results: Dhaka has a better investment climate in some respects, whileChittagong comes out on top in others. And whilesome investment climate measures differ littlebetween the cities, others differ a great deal. Whatexplains these results? Let’s look at the evidence.
First consider the differences in firms’performance between the cities. Firms in Dhakaappear to be growing more quickly, with faster sales and employment growth and a higherinvestment rate on average (figure 3.14). But firms inChittagong are more productive and more profitable(figure 3.15).9
InfrastructureFirms in the two cities have similar opinions of thedegree to which the electricity sector poses anobstacle to their growth and development, with theproblem in Dhaka appearing to be slightly worse(figure 3.16). But firms in Dhaka were far more likely to
report that telecommunications and transport were amajor or very severe problem.
Objective measures confirm these results. Firmsin the two cities reported nearly identical problemswith the quality of electricity, for example, with firms inChittagong experiencing power interruptions 247days a year and firms in Dhaka reporting interruptions
Figure 3.16. Share of Firms Rating Infrastructure as a Major or Severe Obstacle in Chittagong and Dhaka
0
74
Electricity Transport Telecommunications
Chittagong
Dhaka
Source: Investment climate survey.
Percent
Figure 3.16. Share of Firms RatingInfrastructure as a Major or Severe Obstaclein Chittagong and Dhaka
Figure 3.14. Firm Growth in Chittagong and Dhaka
0
12
Sales growth Employmentgrowth
Investmentrate
ChittagongDhaka
Source: Investment climate survey.
Percent
Figure 3.14. Firm Growth in Chittagong andDhaka
Figure 3.15. Profitability and Productivity in Chittagong and Dhaka
–1.4
43
Pretax profitability Total factor productivity
Chittagong
Dhaka
Source: Investment climate survey.
Percent
Figure 3.15. Profitability and Productivity inChittagong and Dhaka
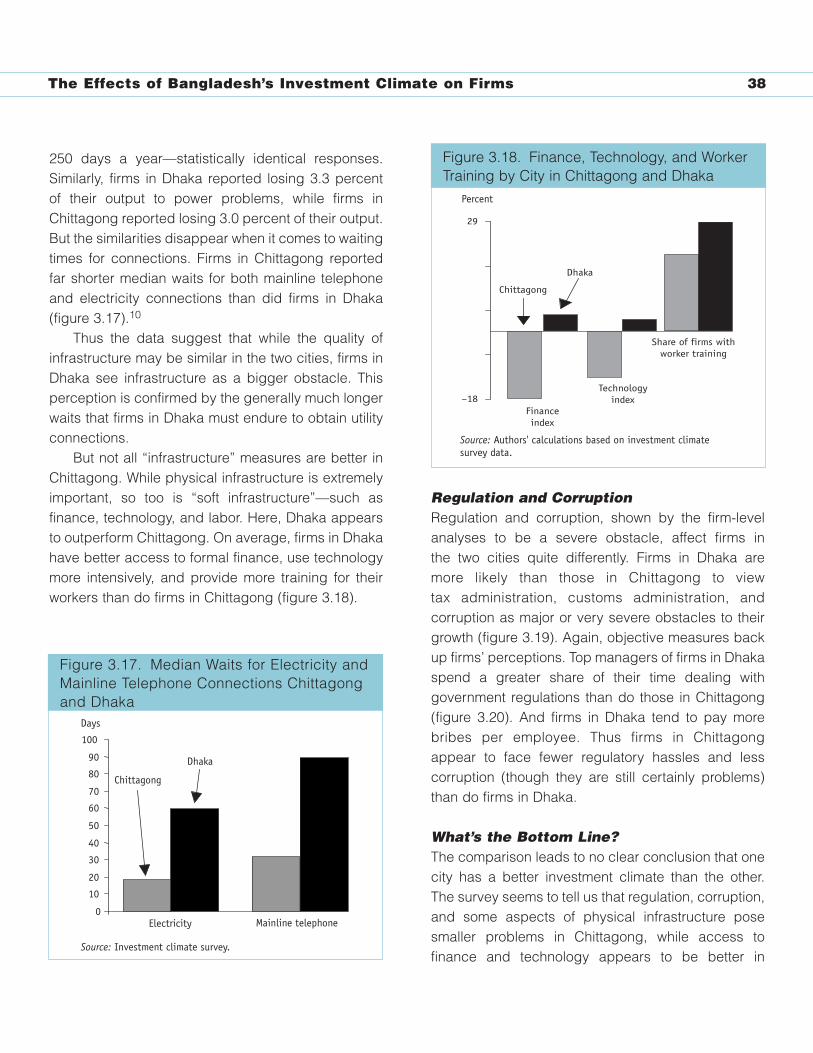
38The Effects of Bangladesh’s Investment Climate on Firms
250 days a year—statistically identical responses.Similarly, firms in Dhaka reported losing 3.3 percent of their output to power problems, while firms inChittagong reported losing 3.0 percent of their output.But the similarities disappear when it comes to waitingtimes for connections. Firms in Chittagong reportedfar shorter median waits for both mainline telephoneand electricity connections than did firms in Dhaka(figure 3.17).10
Thus the data suggest that while the quality ofinfrastructure may be similar in the two cities, firms inDhaka see infrastructure as a bigger obstacle. Thisperception is confirmed by the generally much longerwaits that firms in Dhaka must endure to obtain utilityconnections.
But not all “infrastructure” measures are better inChittagong. While physical infrastructure is extremelyimportant, so too is “soft infrastructure”—such asfinance, technology, and labor. Here, Dhaka appearsto outperform Chittagong. On average, firms in Dhakahave better access to formal finance, use technologymore intensively, and provide more training for theirworkers than do firms in Chittagong (figure 3.18).
Regulation and CorruptionRegulation and corruption, shown by the firm-levelanalyses to be a severe obstacle, affect firms in the two cities quite differently. Firms in Dhaka aremore likely than those in Chittagong to view tax administration, customs administration, andcorruption as major or very severe obstacles to theirgrowth (figure 3.19). Again, objective measures backup firms’ perceptions. Top managers of firms in Dhakaspend a greater share of their time dealing withgovernment regulations than do those in Chittagong(figure 3.20). And firms in Dhaka tend to pay morebribes per employee. Thus firms in Chittagongappear to face fewer regulatory hassles and lesscorruption (though they are still certainly problems)than do firms in Dhaka.
What’s the Bottom Line?The comparison leads to no clear conclusion that onecity has a better investment climate than the other.The survey seems to tell us that regulation, corruption,and some aspects of physical infrastructure posesmaller problems in Chittagong, while access tofinance and technology appears to be better in
Figure 3.18. Finance, Technology, and Worker Training by City in Chittagong and Dhaka
–18
29
Chittagong
Dhaka
Financeindex
Technologyindex
Share of firms withworker training
Source: Authors' calculations based on investment climate survey data.
Percent
Figure 3.18. Finance, Technology, and WorkerTraining by City in Chittagong and Dhaka
Figure 3.17. Median Waits for Electricity and Mainline Telephone Connections Chittagong and Dhaka
0
10
20
30
40
50
60
70
80
90
100
Electricity Mainline telephone
Chittagong
Dhaka
Source: Investment climate survey.
Days
Figure 3.17. Median Waits for Electricity andMainline Telephone Connections Chittagongand Dhaka
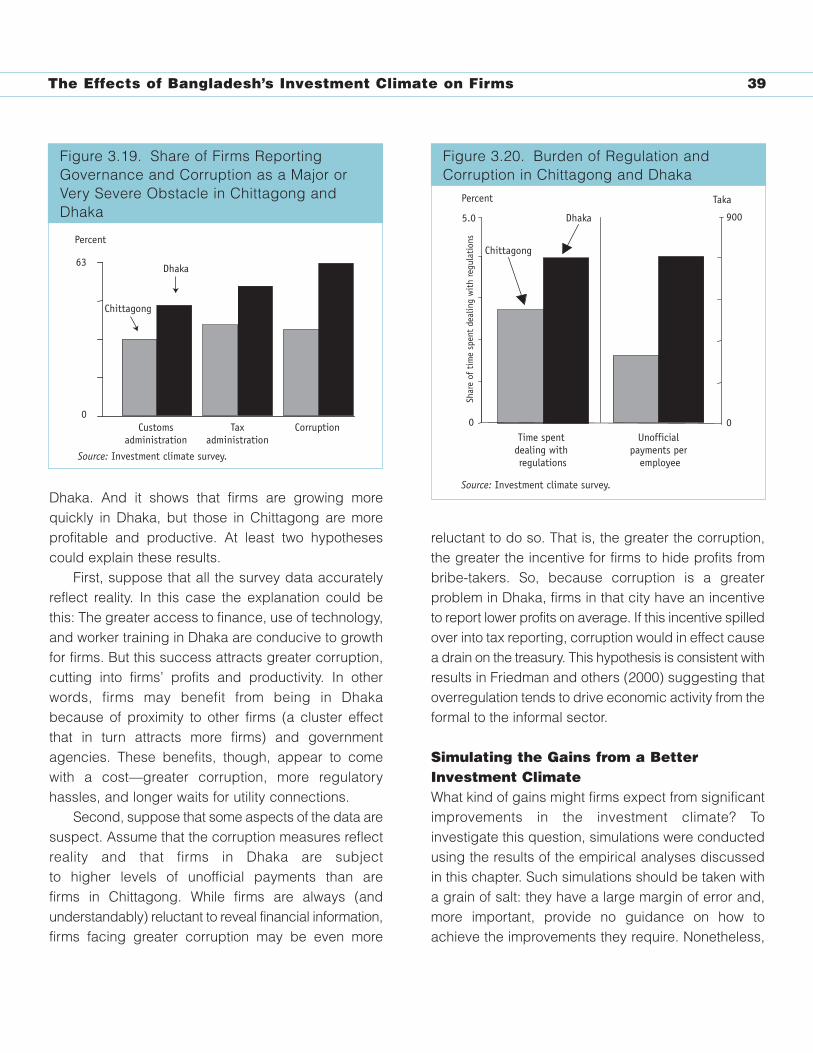
The Effects of Bangladesh’s Investment Climate on Firms 39
Dhaka. And it shows that firms are growing morequickly in Dhaka, but those in Chittagong are moreprofitable and productive. At least two hypothesescould explain these results.
First, suppose that all the survey data accuratelyreflect reality. In this case the explanation could bethis: The greater access to finance, use of technology,and worker training in Dhaka are conducive to growthfor firms. But this success attracts greater corruption,cutting into firms’ profits and productivity. In otherwords, firms may benefit from being in Dhakabecause of proximity to other firms (a cluster effectthat in turn attracts more firms) and governmentagencies. These benefits, though, appear to comewith a cost—greater corruption, more regulatoryhassles, and longer waits for utility connections.
Second, suppose that some aspects of the data aresuspect. Assume that the corruption measures reflectreality and that firms in Dhaka are subject to higher levels of unofficial payments than are firms in Chittagong. While firms are always (andunderstandably) reluctant to reveal financial information,firms facing greater corruption may be even more
reluctant to do so. That is, the greater the corruption,the greater the incentive for firms to hide profits frombribe-takers. So, because corruption is a greaterproblem in Dhaka, firms in that city have an incentiveto report lower profits on average. If this incentive spilledover into tax reporting, corruption would in effect causea drain on the treasury. This hypothesis is consistent withresults in Friedman and others (2000) suggesting thatoverregulation tends to drive economic activity from theformal to the informal sector.
Simulating the Gains from a BetterInvestment ClimateWhat kind of gains might firms expect from significantimprovements in the investment climate? Toinvestigate this question, simulations were conductedusing the results of the empirical analyses discussedin this chapter. Such simulations should be taken witha grain of salt: they have a large margin of error and,more important, provide no guidance on how toachieve the improvements they require. Nonetheless,
Figure 3.19. Share of Firms Reporting Governance and Corruption as a Major or Very Severe Obstacle in Chittagong and Dhaka
0
63
Customsadministration
Taxadministration
Corruption
Chittagong
Dhaka
Source: Investment climate survey.
Percent
Figure 3.19. Share of Firms ReportingGovernance and Corruption as a Major orVery Severe Obstacle in Chittagong andDhaka
Figure 3.20. Burden of Regulation and Corruption in Chittagong and Dhaka
0
5.0 900
Chittagong
Dhaka
0
Percent Taka
Time spent dealing with regulations
Unofficial payments per
employeeSh
are
of t
ime
spen
t de
alin
g w
ith
regu
lati
ons
Source: Investment climate survey.
Figure 3.20. Burden of Regulation andCorruption in Chittagong and Dhaka
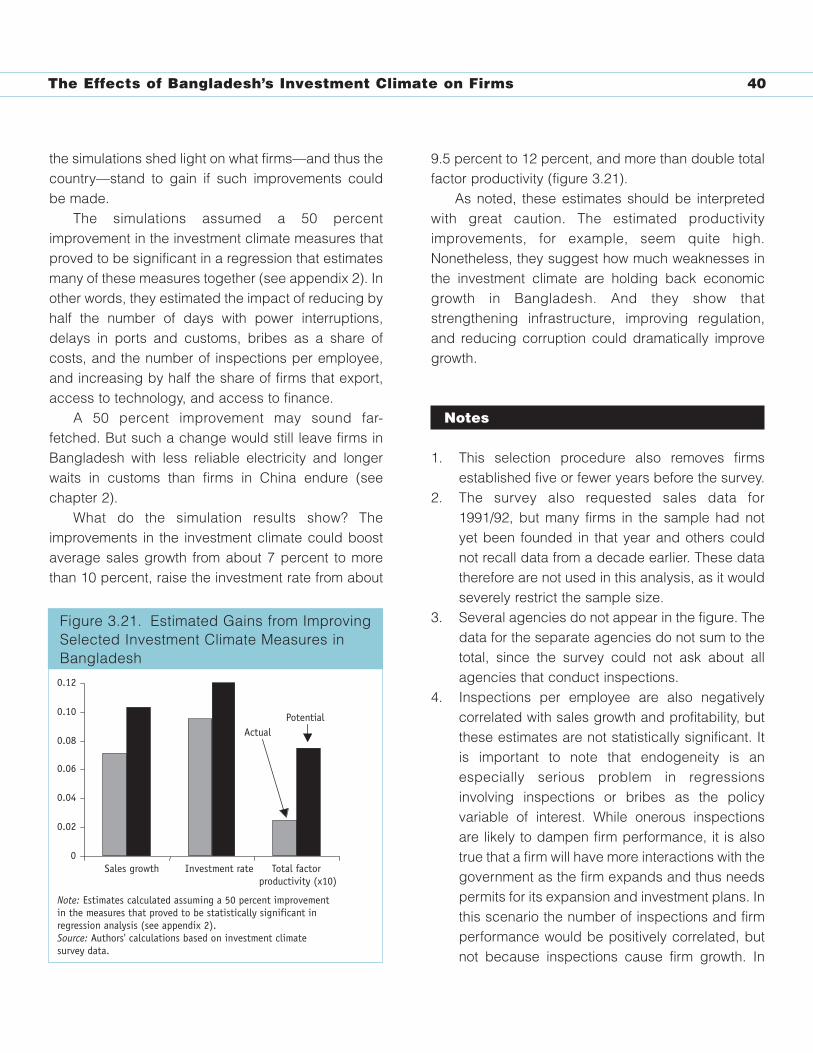
The Effects of Bangladesh’s Investment Climate on Firms 40
the simulations shed light on what firms—and thus thecountry—stand to gain if such improvements couldbe made.
The simulations assumed a 50 percentimprovement in the investment climate measures thatproved to be significant in a regression that estimatesmany of these measures together (see appendix 2). Inother words, they estimated the impact of reducing byhalf the number of days with power interruptions,delays in ports and customs, bribes as a share ofcosts, and the number of inspections per employee,and increasing by half the share of firms that export,access to technology, and access to finance.
A 50 percent improvement may sound far-fetched. But such a change would still leave firms inBangladesh with less reliable electricity and longerwaits in customs than firms in China endure (seechapter 2).
What do the simulation results show? Theimprovements in the investment climate could boostaverage sales growth from about 7 percent to morethan 10 percent, raise the investment rate from about
9.5 percent to 12 percent, and more than double totalfactor productivity (figure 3.21).
As noted, these estimates should be interpretedwith great caution. The estimated productivityimprovements, for example, seem quite high.Nonetheless, they suggest how much weaknesses inthe investment climate are holding back economicgrowth in Bangladesh. And they show thatstrengthening infrastructure, improving regulation,and reducing corruption could dramatically improvegrowth.
Notes
1. This selection procedure also removes firmsestablished five or fewer years before the survey.
2. The survey also requested sales data for1991/92, but many firms in the sample had notyet been founded in that year and others couldnot recall data from a decade earlier. These datatherefore are not used in this analysis, as it wouldseverely restrict the sample size.
3. Several agencies do not appear in the figure. Thedata for the separate agencies do not sum to thetotal, since the survey could not ask about allagencies that conduct inspections.
4. Inspections per employee are also negativelycorrelated with sales growth and profitability, butthese estimates are not statistically significant. Itis important to note that endogeneity is anespecially serious problem in regressionsinvolving inspections or bribes as the policyvariable of interest. While onerous inspectionsare likely to dampen firm performance, it is alsotrue that a firm will have more interactions with thegovernment as the firm expands and thus needspermits for its expansion and investment plans. Inthis scenario the number of inspections and firmperformance would be positively correlated, butnot because inspections cause firm growth. In
F gure 3.21. Estimated Gains from Improving Selected Investment Climate Measures in Bangladesh
0
0.02
0.04
0.06
0.08
0.10
0.12
Sales growth Investment rate Total factor productivity (x10)
ActualPotential
Note: Estimates calculated assuming a 50 percent improvement in the measures that proved to be statistically significant in regression analysis (see appendix 2). Source: Authors' calculations based on investment climate survey data.
Figure 3.21. Estimated Gains from ImprovingSelected Investment Climate Measures inBangladesh
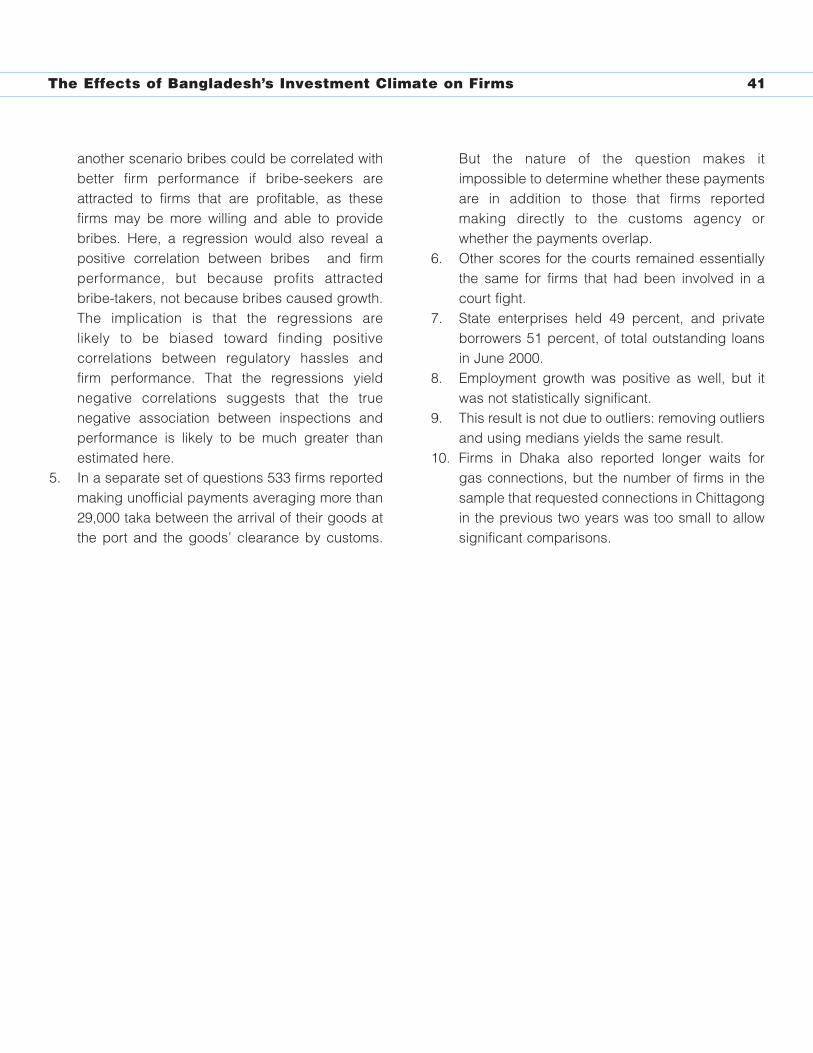
The Effects of Bangladesh’s Investment Climate on Firms 41
another scenario bribes could be correlated withbetter firm performance if bribe-seekers areattracted to firms that are profitable, as thesefirms may be more willing and able to providebribes. Here, a regression would also reveal apositive correlation between bribes and firmperformance, but because profits attractedbribe-takers, not because bribes caused growth.The implication is that the regressions are likely to be biased toward finding positivecorrelations between regulatory hassles and firm performance. That the regressions yieldnegative correlations suggests that the truenegative association between inspections andperformance is likely to be much greater thanestimated here.
5. In a separate set of questions 533 firms reportedmaking unofficial payments averaging more than29,000 taka between the arrival of their goods atthe port and the goods’ clearance by customs.
But the nature of the question makes itimpossible to determine whether these paymentsare in addition to those that firms reportedmaking directly to the customs agency orwhether the payments overlap.
6. Other scores for the courts remained essentiallythe same for firms that had been involved in acourt fight.
7. State enterprises held 49 percent, and privateborrowers 51 percent, of total outstanding loansin June 2000.
8. Employment growth was positive as well, but itwas not statistically significant.
9. This result is not due to outliers: removing outliersand using medians yields the same result.
10. Firms in Dhaka also reported longer waits for gas connections, but the number of firms in thesample that requested connections in Chittagongin the previous two years was too small to allowsignificant comparisons.
Conclusions and Policy Recommendations 42
4. Conclusions and PolicyRecommendations
This report points to several features of the investmentclimate in Bangladesh that require urgent attention ifthe country is to grow more quickly: physicalinfrastructure, governance, and the financial system(ordered loosely by importance). Small- and medium-size enterprises have suffered more from thedeficiencies in these areas than large companies. Atthe same time, companies able to export haveperformed better than companies that do not export.Yet without meaningful reforms in infrastructure,governance, and finance, entering the export marketwill be difficult for small- and medium-sizeenterprises. Moreover, the situation will worsen as theMultifibre Arrangement is phased out by December2004 and Bangladesh loses advantages that havehelped ease the pressure imposed on firms by thepoor investment climate.
The Interim Poverty Reduction Strategy Paperhas already identified infrastructure, governance andcorruption, and finance as issues requiring attention.Yet the acuteness of the problems affecting theprivate sector’s performance and competitivenesssuggests that in many areas the government mayneed to consider a more profound agenda of reform.
Easing Bottlenecks in InfrastructurePower tops the list of infrastructure concerns inBangladesh. But reforms in telecommunications,transport, and ports and customs will also be criticalto ease the bottlenecks hampering private enterprisein Bangladesh.
PowerThe power sector has seen some improvements in thepast two years: Two new independent power plants, witha capacity of 810 megawatts, have come onstream,expanding generation capacity by about 20 percent andimproving the reliability of supply (table 4.1). System
losses have fallen from 35 percent to 30 percent, andrevenue collection has increased from 91 percent of billedelectricity to 98 percent. And two tariff adjustments sinceearly 2002 have increased cost recovery and reducedcross-subsidies from firms to residential consumers.
But despite these recent improvements, firmscontinue to face high costs from power outages—andlong waits for new connections continue to delay theentry of new firms. Moreover, the sector is bankrupt,imposing a big drain on scarce fiscal resources(World Bank 2002a).
A radical and systematic restructuring to eliminateremaining inefficiencies would allow the sector to fulfillits role in development, with both more confidenceand greater sustainability. Indeed, the sector can playan important role: the country has sufficient energyresources (mainly natural gas), and these resourcescan be converted into electricity more competitivelythan many of its neighbors and peers can generateelectricity. Key elements of a sector restructuring planwould include improving sector and enterprisegovernance, undertaking financial restructuring,introducing independent regulation, and phasing incompetition.
The current administration has tacitly endorsedthe Vision and Policy Statements on Power SectorReforms (2000), which supports unbundling thesector and encouraging private participation.Transmission and dispatch functions and assets havebeen transferred to the Power Grid Corporation ofBangladesh, and a few generation and distributioncompanies are being corporatized. But this processneeds to be accelerated, and measures taken to strengthen the governance of these newcorporations.1 To promote better governance of stateenterprises, measures should be explored forensuring a clear division of responsibilities betweenmanagement and the board and regular publicationof business plans and performance outcomes.Achieving sound governance in distribution willrequire ensuring full payment by public sector entities
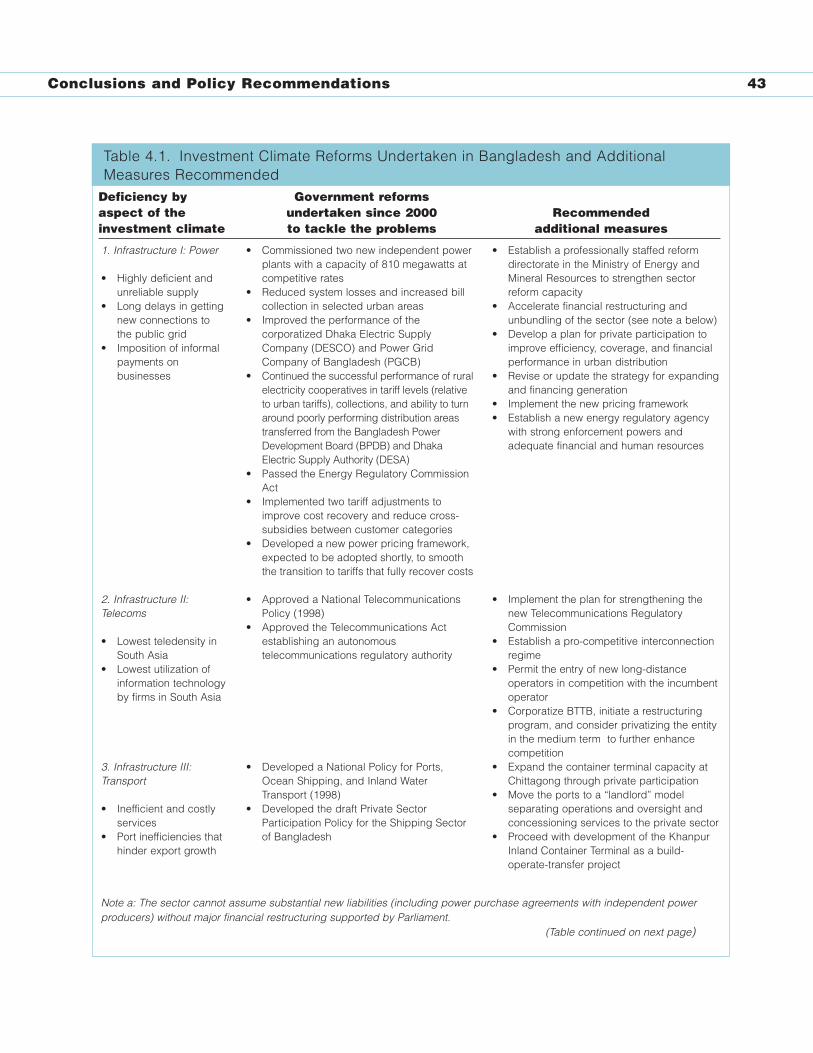
Conclusions and Policy Recommendations 43
Deficiency by Government reformsaspect of the undertaken since 2000 Recommended investment climate to tackle the problems additional measures
1. Infrastructure I: Power
• Highly deficient andunreliable supply
• Long delays in gettingnew connections tothe public grid
• Imposition of informalpayments onbusinesses
2. Infrastructure II:Telecoms
• Lowest teledensity inSouth Asia
• Lowest utilization ofinformation technologyby firms in South Asia
3. Infrastructure III:Transport
• Inefficient and costlyservices
• Port inefficiencies thathinder export growth
• Commissioned two new independent powerplants with a capacity of 810 megawatts atcompetitive rates
• Reduced system losses and increased billcollection in selected urban areas
• Improved the performance of thecorporatized Dhaka Electric SupplyCompany (DESCO) and Power GridCompany of Bangladesh (PGCB)
• Continued the successful performance of ruralelectricity cooperatives in tariff levels (relativeto urban tariffs), collections, and ability to turnaround poorly performing distribution areastransferred from the Bangladesh PowerDevelopment Board (BPDB) and DhakaElectric Supply Authority (DESA)
• Passed the Energy Regulatory CommissionAct
• Implemented two tariff adjustments toimprove cost recovery and reduce cross-subsidies between customer categories
• Developed a new power pricing framework,expected to be adopted shortly, to smooththe transition to tariffs that fully recover costs
• Approved a National TelecommunicationsPolicy (1998)
• Approved the Telecommunications Actestablishing an autonomoustelecommunications regulatory authority
• Developed a National Policy for Ports,Ocean Shipping, and Inland WaterTransport (1998)
• Developed the draft Private SectorParticipation Policy for the Shipping Sectorof Bangladesh
• Establish a professionally staffed reformdirectorate in the Ministry of Energy andMineral Resources to strengthen sectorreform capacity
• Accelerate financial restructuring andunbundling of the sector (see note a below)
• Develop a plan for private participation toimprove efficiency, coverage, and financialperformance in urban distribution
• Revise or update the strategy for expandingand financing generation
• Implement the new pricing framework• Establish a new energy regulatory agency
with strong enforcement powers andadequate financial and human resources
• Implement the plan for strengthening thenew Telecommunications RegulatoryCommission
• Establish a pro-competitive interconnectionregime
• Permit the entry of new long-distanceoperators in competition with the incumbentoperator
• Corporatize BTTB, initiate a restructuringprogram, and consider privatizing the entityin the medium term to further enhancecompetition
• Expand the container terminal capacity atChittagong through private participation
• Move the ports to a “landlord” modelseparating operations and oversight andconcessioning services to the private sector
• Proceed with development of the KhanpurInland Container Terminal as a build-operate-transfer project
Note a: The sector cannot assume substantial new liabilities (including power purchase agreements with independent powerproducers) without major financial restructuring supported by Parliament.
(Table continued on next page)
Table 4.1. Investment Climate Reforms Undertaken in Bangladesh and AdditionalMeasures Recommended
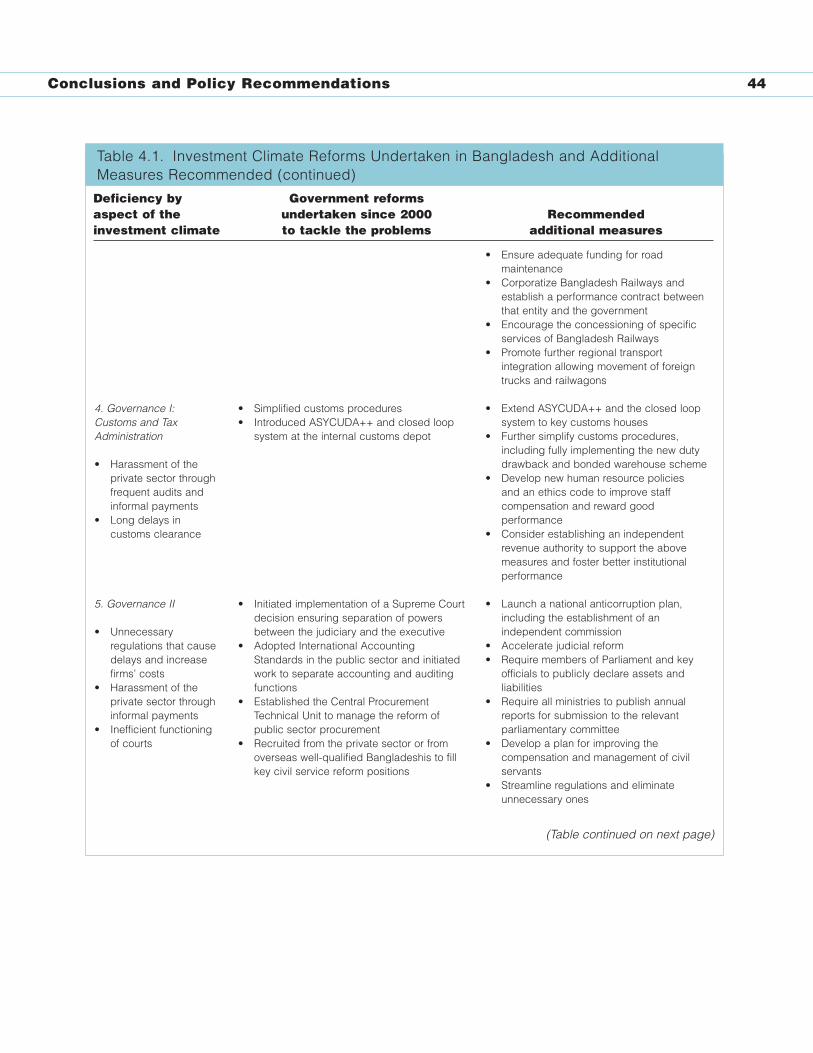
Conclusions and Policy Recommendations 44
4. Governance I:Customs and TaxAdministration
• Harassment of theprivate sector throughfrequent audits andinformal payments
• Long delays incustoms clearance
5. Governance II
• Unnecessaryregulations that causedelays and increasefirms’ costs
• Harassment of theprivate sector throughinformal payments
• Inefficient functioningof courts
• Simplified customs procedures • Introduced ASYCUDA++ and closed loop
system at the internal customs depot
• Initiated implementation of a Supreme Courtdecision ensuring separation of powersbetween the judiciary and the executive
• Adopted International AccountingStandards in the public sector and initiatedwork to separate accounting and auditingfunctions
• Established the Central ProcurementTechnical Unit to manage the reform ofpublic sector procurement
• Recruited from the private sector or fromoverseas well-qualified Bangladeshis to fillkey civil service reform positions
• Ensure adequate funding for roadmaintenance
• Corporatize Bangladesh Railways andestablish a performance contract betweenthat entity and the government
• Encourage the concessioning of specificservices of Bangladesh Railways
• Promote further regional transportintegration allowing movement of foreigntrucks and railwagons
• Extend ASYCUDA++ and the closed loopsystem to key customs houses
• Further simplify customs procedures,including fully implementing the new dutydrawback and bonded warehouse scheme
• Develop new human resource policies and an ethics code to improve staffcompensation and reward goodperformance
• Consider establishing an independentrevenue authority to support the abovemeasures and foster better institutionalperformance
• Launch a national anticorruption plan,including the establishment of anindependent commission
• Accelerate judicial reform • Require members of Parliament and key
officials to publicly declare assets andliabilities
• Require all ministries to publish annualreports for submission to the relevantparliamentary committee
• Develop a plan for improving thecompensation and management of civilservants
• Streamline regulations and eliminateunnecessary ones
Deficiency by Government reformsaspect of the undertaken since 2000 Recommended investment climate to tackle the problems additional measures
(Table continued on next page)
Table 4.1. Investment Climate Reforms Undertaken in Bangladesh and AdditionalMeasures Recommended (continued)
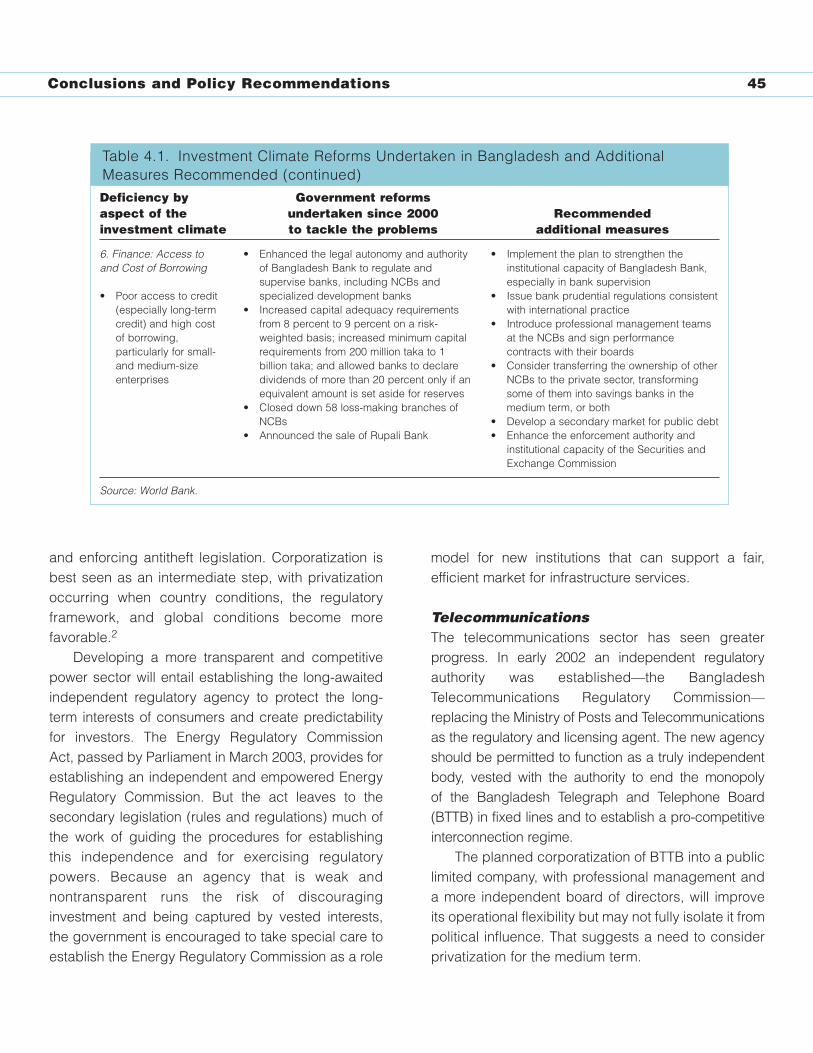
Conclusions and Policy Recommendations 45
and enforcing antitheft legislation. Corporatization isbest seen as an intermediate step, with privatizationoccurring when country conditions, the regulatoryframework, and global conditions become morefavorable.2
Developing a more transparent and competitivepower sector will entail establishing the long-awaitedindependent regulatory agency to protect the long-term interests of consumers and create predictabilityfor investors. The Energy Regulatory Commission Act, passed by Parliament in March 2003, provides forestablishing an independent and empowered EnergyRegulatory Commission. But the act leaves to thesecondary legislation (rules and regulations) much ofthe work of guiding the procedures for establishingthis independence and for exercising regulatorypowers. Because an agency that is weak andnontransparent runs the risk of discouraginginvestment and being captured by vested interests,the government is encouraged to take special care toestablish the Energy Regulatory Commission as a role
model for new institutions that can support a fair,efficient market for infrastructure services.
TelecommunicationsThe telecommunications sector has seen greaterprogress. In early 2002 an independent regulatoryauthority was established—the BangladeshTelecommunications Regulatory Commission—replacing the Ministry of Posts and Telecommunicationsas the regulatory and licensing agent. The new agencyshould be permitted to function as a truly independentbody, vested with the authority to end the monopoly of the Bangladesh Telegraph and Telephone Board(BTTB) in fixed lines and to establish a pro-competitiveinterconnection regime.
The planned corporatization of BTTB into a publiclimited company, with professional management anda more independent board of directors, will improveits operational flexibility but may not fully isolate it frompolitical influence. That suggests a need to considerprivatization for the medium term.
Deficiency by Government reformsaspect of the undertaken since 2000 Recommended investment climate to tackle the problems additional measures
6. Finance: Access toand Cost of Borrowing
• Poor access to credit(especially long-termcredit) and high costof borrowing,particularly for small-and medium-sizeenterprises
• Enhanced the legal autonomy and authorityof Bangladesh Bank to regulate andsupervise banks, including NCBs andspecialized development banks
• Increased capital adequacy requirementsfrom 8 percent to 9 percent on a risk-weighted basis; increased minimum capitalrequirements from 200 million taka to 1billion taka; and allowed banks to declaredividends of more than 20 percent only if anequivalent amount is set aside for reserves
• Closed down 58 loss-making branches ofNCBs
• Announced the sale of Rupali Bank
• Implement the plan to strengthen theinstitutional capacity of Bangladesh Bank,especially in bank supervision
• Issue bank prudential regulations consistentwith international practice
• Introduce professional management teamsat the NCBs and sign performancecontracts with their boards
• Consider transferring the ownership of otherNCBs to the private sector, transformingsome of them into savings banks in themedium term, or both
• Develop a secondary market for public debt• Enhance the enforcement authority and
institutional capacity of the Securities andExchange Commission
Source: World Bank.
Table 4.1. Investment Climate Reforms Undertaken in Bangladesh and AdditionalMeasures Recommended (continued)
Conclusions and Policy Recommendations 46
International experience over the past twodecades has proved the importance of competitivemarkets and broad private participation forsuccessful expansion of telecommunicationsservices. That lesson has been borne out inBangladesh, where private investment has driven therapid expansion of mobile phones.3
Transport, Ports, and CustomsDelays in ports and customs impose big costs onfirms. Productivity at the container terminal inChittagong is very low, and the port is already workingbeyond its capacity, creating serious congestion.Moving the ports—especially Chittagong—to a “landlord” model separating operations fromoversight could do much to improve efficiency. Alsoimportant is to proceed quickly with the much-neededexpansion of container terminal capacity atChittagong, involving the private sector.4
The development of the Khanpur Inland ContainerTerminal as a build-operate-transfer project shouldalso receive support. Preparation for the bidding ofthe Khanpur terminal is already well advanced,thanks to assistance from the InfrastructureInvestment Facilitation Center. Further development ofinland waterways will ease the traffic pressurebetween Dhaka and Chittagong and allow a newchannel of communication with Mongla port, openingfresh opportunities for Mongla to become a moreimportant seaport.
Other transport modes also need attention.Allocating adequate funding for road maintenance willbe critical to prevent further deterioration of the roadnetwork. And the railways system, highly deterioratedand inefficient, will need a significant overhaul.5
Strengthening GovernanceGovernance—especially regulation and corruption—is an important concern in Bangladesh, viewed byfirms as a serious problem. There are no easysolutions. But the Interim Poverty Reduction Strategy
Paper recognizes the imperative of strengtheninggovernance and the need to intervene on severalfronts:
• Encouraging a greater flow of information. • Establishing and enforcing clear rules and
regulations for public sector administration,supported by the separation of power among thethree branches of government.
• Promoting voice and participation of civil societyto foster a more transparent government.
Initial steps have been taken in some of theseareas, though many challenges remain. Thegovernment has adopted International AccountingStandards and initiated the separation of accountingand auditing functions. It has created a new centralprocurement unit to manage the reform ofprocurement processes. And, more important, it hasreaffirmed its intention (and legislation is beingdrafted) to form an independent AnticorruptionCommission that will replace the Bureau ofAnticorruption, an ineffective agency that has sufferedfrom much political interference.6 Complementingthese efforts should be new disclosure requirementson assets and liabilities for high public officials andgreater accountability for public institutions.Ministries, for example, could be required to publishannual reports with performance outcomes fordiscussion by relevant parliamentary committees.
But broader public administration reform will berequired to create a new governance framework. Afew steps have been taken—such as stoppingautomatic recruitment to fill vacant positions andrecruiting senior managers on contract from theprivate sector and abroad to address the severe skillshortage. But more far-reaching reforms will beneeded, including rationalizing cadres and revisingthe skill mix while introducing better compensationpackages and performance-based salaries. Thesharp erosion of financial benefits and the weak
Conclusions and Policy Recommendations 47
performance incentives have contributed much to thepoor governance culture of the public administration(see Bangladesh 2000 and World Bank 2002b).
Forcefully pursuing the Supreme Court’s mandate toensure separation of powers between the executive andthe judiciary, together with other measures, would domuch to lessen corruption and delays in the lower courts. So would decentralizing the lowerjudiciary, simplifying procedures, and introducingeffective mechanisms to ensure transparency andaccountability. Also important are modernizing thepolice force and improving the quality of officers andpersonnel through training programs. Creating aneffective Anticorruption Commission (as discussedabove) would help improve oversight of the police force.
The short term offers opportunities forstreamlining regulations and eliminating unnecessaryones, accelerating service delivery, and reducing thescope for informal payments. Procedures for the entryof new firms could be simplified, for example,reducing unnecessary costs and delays andencouraging informal firms to enhance their legalstatus and thus improve their access to finance.Customs and tax administration—where the surveyfindings point to cumbersome procedures, a highlevel of informal payments, and a large burden ofinspections—warrant particular attention.
Efforts are under way to improve customsadministration procedures—an important bottleneckto trade. The establishment of the Automated Systemfor Customs Data (ASYCUDA++) has alreadyspeeded clearance of goods at the internal customsdepot and reduced opportunities for informalpayments; the completion of the closed loop systemwithin a few months will add to these gains. Deployingthese systems at larger customs sites—including theDhaka customs house, Chittagong, and Benapol—before the end of 2003 will bring even greaterbenefits. Initial reforms of tax administration are alsounder way.
Improving Access to FinanceThe survey findings portend potential problems infirms’ access to finance. Many firms appear to haveexhausted the bank credit immediately available tothem, financing is primarily short term, and its cost ishigh. Real borrowing rates have sometimes exceeded10 percent in the past decade. The banking system isdominated by four large national commercial banks(NCBs), which create instability and stifle competition.
The Interim Poverty Reduction Strategy Paperlays out some positive initial steps for addressing thedistortions in the financial sector. These includeincreasing the sector’s independence, enhancingregulatory authority, and strengthening the humanresources of the Bangladesh Bank. For the NCBs, itproposes establishing more suitable representativeson the boards and new management teams, startingwith Agrani Bank. Meanwhile, the government hasoffered Rupali Bank for sale. Achieving morepermanent improvements in the banking system’sperformance will require deeper reforms for otherNCBs. Ultimately, transferring their ownership to theprivate sector will be critical to isolate the institutionsfrom political influence, introduce modern bankingpractices, and encourage new investments ininformation technology systems.7 Privatization willneed to be coupled with strong prudential regulation,and for that reason the program of the BangladeshBank to strengthen regulatory and supervisorycapacity should move forward with full force (WorldBank 2003a).
Capital markets remain at a nascent stage andenjoy little confidence among the limited number ofinvestors. The development of a secondary market forpublic debt, essential for improving public debtmanagement, would also facilitate the gradual growthof a broader market in fixed income securities. Andstrengthening the institutional capacity and authorityof the Securities and Exchange Commission wouldfoster greater transparency and improve the
governance practices of public companies—criticalfor boosting investor confidence.
Over the past decade Bangladesh performed well onmany macroeconomic indicators, became moreintegrated with the world economy, and madeimpressive social gains. But in many sectors it haslagged behind its neighbors and competitors. Theresult has been a widening gap in standards of livingwith such countries as China and India, though all threecountries had similar per capita incomes two decadesago. Economic growth has been held back bydeficiencies in the investment climate—most notably ininfrastructure, governance, and finance. These issuesare linked: the infrastructure services that appear topose the largest obstacles for businesses are state-runoperations, and the banking system continues to bedominated by the NCBs. As the country movesforward, the findings of the investment climate surveyshould help identify the reforms most critical to privatesector development and facilitate consensus on amore far-reaching agenda of reform.
Notes
1. Proper unbundling will entail determining howmany electricity distribution companies and
generation companies would be cost-effective inBangladesh and developing a path of transitionfrom the “single buyer” model to directcontracting between generators and eligiblecustomers (such as large industries or bulkconsumers).
2. See World Bank (2003b) for a more extensivediscussion of the power sector structure andcritical sector reforms.
3. See World Bank (2003b, 2003c) for in-depthanalysis of reform priorities in telecommunications.
4. Sri Lanka and India have allowed the construction of private container terminals next to the old public ports. The new private portshave instituted some competition, forcing someimprovements in the public ports.
5. See World Bank (2003b) for further analysis ofports, railways, and roads and key priorities forreform.
6. The report of the Bangladesh Public AdministrationReform Commission (2000), which provides a moredetailed analysis of the situation, recommendsforming an independent Anticorruption Commissionvested with strong authority.
7. Privatization might not be a viable option for all NCBs, however, and liquidation (ortransformation into a savings bank) might alsoneed to be explored.
Conclusions and Policy Recommendations 48

APPENDIX 1Sampling Methodology
Industrial statistics in Bangladesh are inadequate.There is no consolidated institutional effort to generatecomprehensive, periodic data on industry. The qualityof the statistical data that are available erodes duringthe long time lag between their collection and theirpublication. Official information based on the censusof manufacturing industries by the BangladeshBureau of Statistics is lacking in quality. And the latestDirectory of Manufacturing Establishments (coveringfirms employing 10 or more workers) dates to 1989–90. Lacking a reliable and updated universe, theinvestment climate survey team therefore had todevelop its own sample frame. It adopted themethodology of assembling in one unique frame theestablishment lists from different sources.
The first step was to identify the strata to includein the sample. It was decided that the strata would bedetermined on the basis of firms’ activity, level ofemployment, and location. The sectors to be includedin the survey were selected mainly on the basis oftheir importance as measured by value added, exportpotential, and recent growth trends. The sample frameof manufacturing establishments was grouped into six sectors: garments, textiles, leather and leatherproducts, electrical and electronics, pharmaceuticalsand chemicals, and food and food processing. It wasalso agreed that:
• The sample frame would comprise manufacturingestablishments employing 10 or more workers.These would include both domestically andforeign-owned enterprises.
• The manufacturing units would be located in andaround Dhaka (including Gazipur, Savar, Narsindi,Narayanganj, and Manikganj) and Chittagong(including Hathazari, Fauzdarhat, and Sitakundu),including the export processing zones in theseareas.
• Establishments with head offices in Chittagongand Dhaka would be included in the sampleframe.
Once the strata were agreed on, the team devotedits efforts to compiling the sample frame. While the most recent Directory of ManufacturingEstablishments—which publishes results from the lastcensus of nonfarm activities, carried out in 1986—wasconsidered too outdated to serve as a basis for thesample frame, the annual census of manufacturingindustries, the main source of macro-level estimatesfor manufacturing, was more useful. The survey teamobtained this list, which included firms’ name,address, sector of activity (classified according to theBangladesh Standard Industrial Classification [BSIC]at the four-digit level), and size of employment.
In a second approach the team canvassed alltrade associations and chambers of commerce fortheir lists of members. The coverage and quality ofthese lists varied. For some subsectors—such astextiles, garments, pharmaceuticals, and leather—thelists were reasonably comprehensive and up to date.But none of the trade associations (except theBangladesh Garment Manufacturers & ExportersAssociation) or chambers of commerce were able to provide employment figures. Moreover, smallenterprises were underrepresented on the lists,because they have little incentive to join and pay themembership fee. A comprehensive list of tradeassociations and chambers of commerce wasobtained from the Federation of BangladeshChambers of Commerce and Industry, the apex bodyfor all national trade associations and chambers ofcommerce in Bangladesh. A total of 35 tradeassociations and 9 chambers of commerce wereapproached (see lists at the end of the appendix).
A final effort was made to collect data from othergovernment organizations that maintain some sort oflist. Two of these were the Bangladesh Small andCottage Industries Corporation and the Ministry ofLabor and Employment’s Department of Inspection forFactories and Establishments (DIFE). The DIFE wasapproached in June 2002, when it was undertaking anationwide survey of factories and establishments.
Appendix 1 — Sampling Methodology 50
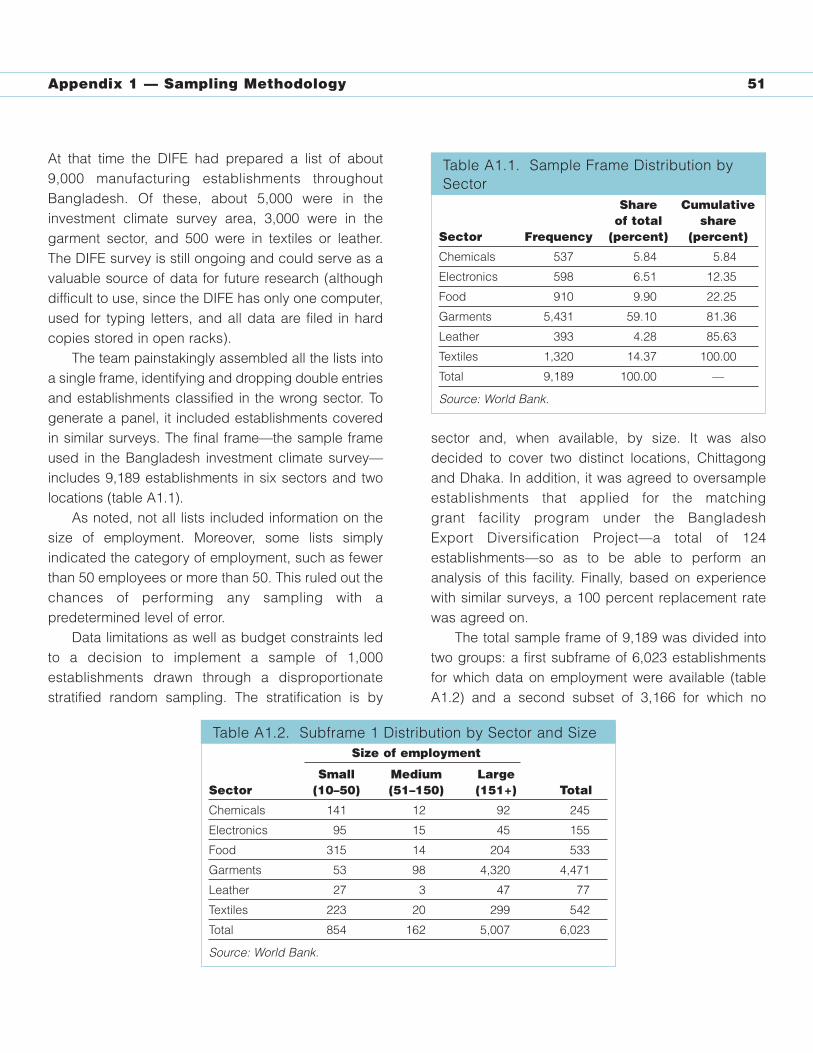
At that time the DIFE had prepared a list of about9,000 manufacturing establishments throughoutBangladesh. Of these, about 5,000 were in theinvestment climate survey area, 3,000 were in thegarment sector, and 500 were in textiles or leather.The DIFE survey is still ongoing and could serve as avaluable source of data for future research (althoughdifficult to use, since the DIFE has only one computer,used for typing letters, and all data are filed in hardcopies stored in open racks).
The team painstakingly assembled all the lists intoa single frame, identifying and dropping double entriesand establishments classified in the wrong sector. Togenerate a panel, it included establishments coveredin similar surveys. The final frame—the sample frameused in the Bangladesh investment climate survey—includes 9,189 establishments in six sectors and twolocations (table A1.1).
As noted, not all lists included information on thesize of employment. Moreover, some lists simplyindicated the category of employment, such as fewerthan 50 employees or more than 50. This ruled out thechances of performing any sampling with apredetermined level of error.
Data limitations as well as budget constraints ledto a decision to implement a sample of 1,000establishments drawn through a disproportionatestratified random sampling. The stratification is by
sector and, when available, by size. It was alsodecided to cover two distinct locations, Chittagongand Dhaka. In addition, it was agreed to oversampleestablishments that applied for the matching grant facility program under the Bangladesh Export Diversification Project—a total of 124establishments—so as to be able to perform ananalysis of this facility. Finally, based on experiencewith similar surveys, a 100 percent replacement ratewas agreed on.
The total sample frame of 9,189 was divided intotwo groups: a first subframe of 6,023 establishmentsfor which data on employment were available (tableA1.2) and a second subset of 3,166 for which no
Appendix 1 — Sampling Methodology 51
Share Cumulativeof total share
Sector Frequency (percent) (percent)
Chemicals 537 5.84 5.84
Electronics 598 6.51 12.35
Food 910 9.90 22.25
Garments 5,431 59.10 81.36
Leather 393 4.28 85.63
Textiles 1,320 14.37 100.00
Total 9,189 100.00 —
Source: World Bank.
Table A1.1. Sample Frame Distribution bySector
Size of employment
Small Medium Large Sector (10–50) (51–150) (151+) Total
Chemicals 141 12 92 245
Electronics 95 15 45 155
Food 315 14 204 533
Garments 53 98 4,320 4,471
Leather 27 3 47 77
Textiles 223 20 299 542
Total 854 162 5,007 6,023
Source: World Bank.
Table A1.2. Subframe 1 Distribution by Sector and Size
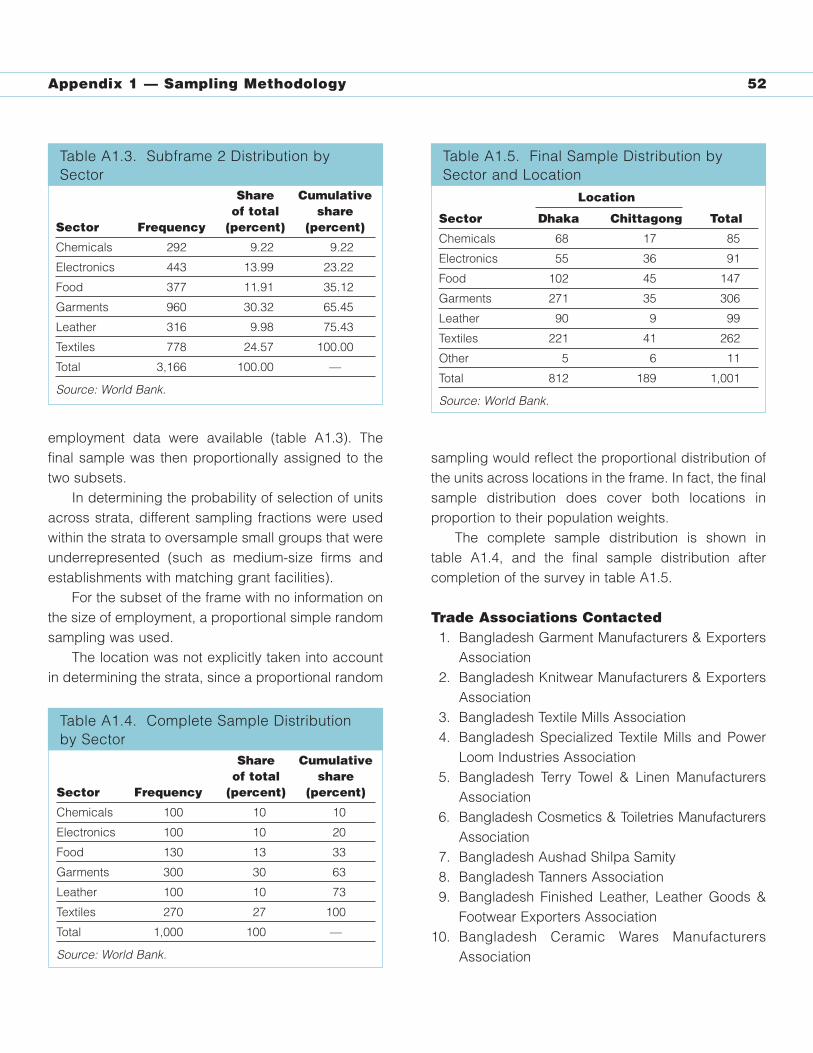
employment data were available (table A1.3). Thefinal sample was then proportionally assigned to thetwo subsets.
In determining the probability of selection of unitsacross strata, different sampling fractions were usedwithin the strata to oversample small groups that wereunderrepresented (such as medium-size firms andestablishments with matching grant facilities).
For the subset of the frame with no information onthe size of employment, a proportional simple randomsampling was used.
The location was not explicitly taken into accountin determining the strata, since a proportional random
sampling would reflect the proportional distribution ofthe units across locations in the frame. In fact, the finalsample distribution does cover both locations inproportion to their population weights.
The complete sample distribution is shown intable A1.4, and the final sample distribution aftercompletion of the survey in table A1.5.
Trade Associations Contacted1. Bangladesh Garment Manufacturers & Exporters
Association2. Bangladesh Knitwear Manufacturers & Exporters
Association3. Bangladesh Textile Mills Association4. Bangladesh Specialized Textile Mills and Power
Loom Industries Association5. Bangladesh Terry Towel & Linen Manufacturers
Association6. Bangladesh Cosmetics & Toiletries Manufacturers
Association7. Bangladesh Aushad Shilpa Samity8. Bangladesh Tanners Association9. Bangladesh Finished Leather, Leather Goods &
Footwear Exporters Association10. Bangladesh Ceramic Wares Manufacturers
Association
Appendix 1 — Sampling Methodology 52
Share Cumulativeof total share
Sector Frequency (percent) (percent)
Chemicals 292 9.22 9.22
Electronics 443 13.99 23.22
Food 377 11.91 35.12
Garments 960 30.32 65.45
Leather 316 9.98 75.43
Textiles 778 24.57 100.00
Total 3,166 100.00 —
Source: World Bank.
Table A1.3. Subframe 2 Distribution bySector
Share Cumulative of total share
Sector Frequency (percent) (percent)
Chemicals 100 10 10
Electronics 100 10 20
Food 130 13 33
Garments 300 30 63
Leather 100 10 73
Textiles 270 27 100
Total 1,000 100 —
Source: World Bank.
Table A1.4. Complete Sample Distributionby Sector
Location
Sector Dhaka Chittagong Total
Chemicals 68 17 85
Electronics 55 36 91
Food 102 45 147
Garments 271 35 306
Leather 90 9 99
Textiles 221 41 262
Other 5 6 11
Total 812 189 1,001
Source: World Bank.
Table A1.5. Final Sample Distribution bySector and Location
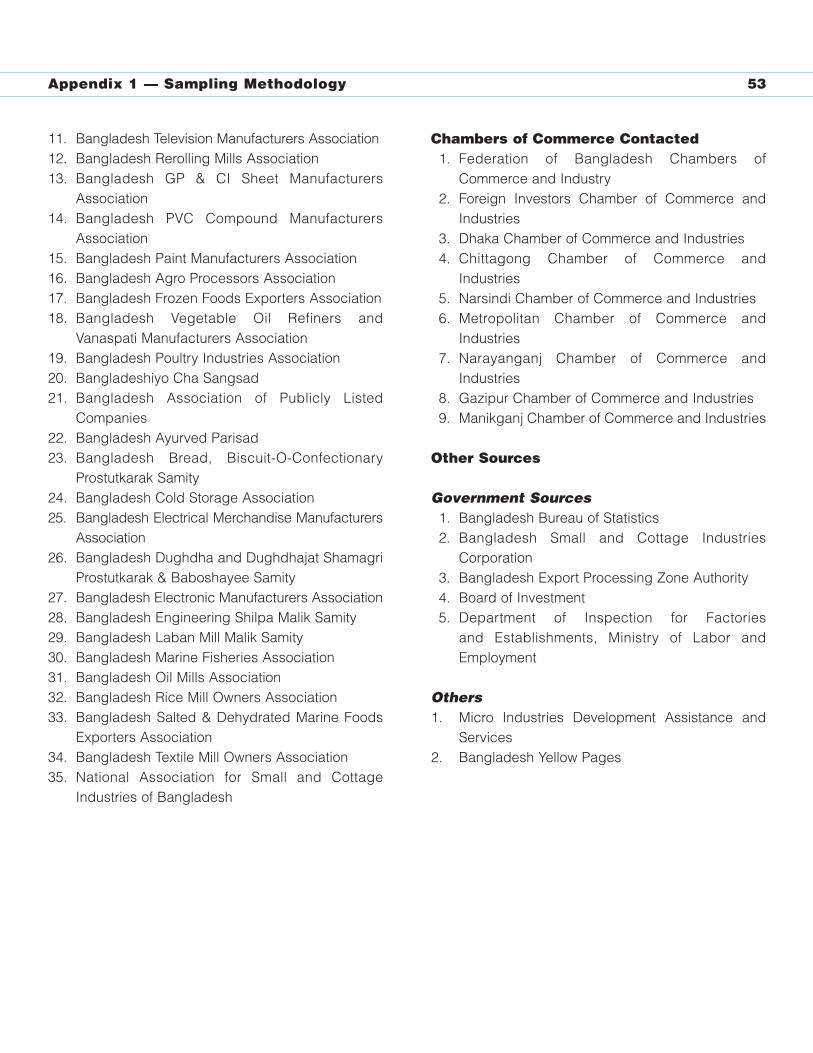
11. Bangladesh Television Manufacturers Association12. Bangladesh Rerolling Mills Association13. Bangladesh GP & CI Sheet Manufacturers
Association14. Bangladesh PVC Compound Manufacturers
Association15. Bangladesh Paint Manufacturers Association16. Bangladesh Agro Processors Association17. Bangladesh Frozen Foods Exporters Association18. Bangladesh Vegetable Oil Refiners and
Vanaspati Manufacturers Association19. Bangladesh Poultry Industries Association20. Bangladeshiyo Cha Sangsad21. Bangladesh Association of Publicly Listed
Companies22. Bangladesh Ayurved Parisad23. Bangladesh Bread, Biscuit-O-Confectionary
Prostutkarak Samity24. Bangladesh Cold Storage Association25. Bangladesh Electrical Merchandise Manufacturers
Association26. Bangladesh Dughdha and Dughdhajat Shamagri
Prostutkarak & Baboshayee Samity27. Bangladesh Electronic Manufacturers Association28. Bangladesh Engineering Shilpa Malik Samity29. Bangladesh Laban Mill Malik Samity30. Bangladesh Marine Fisheries Association31. Bangladesh Oil Mills Association32. Bangladesh Rice Mill Owners Association33. Bangladesh Salted & Dehydrated Marine Foods
Exporters Association34. Bangladesh Textile Mill Owners Association35. National Association for Small and Cottage
Industries of Bangladesh
Chambers of Commerce Contacted1. Federation of Bangladesh Chambers of
Commerce and Industry2. Foreign Investors Chamber of Commerce and
Industries 3. Dhaka Chamber of Commerce and Industries4. Chittagong Chamber of Commerce and
Industries5. Narsindi Chamber of Commerce and Industries6. Metropolitan Chamber of Commerce and
Industries7. Narayanganj Chamber of Commerce and
Industries8. Gazipur Chamber of Commerce and Industries9. Manikganj Chamber of Commerce and Industries
Other Sources
Government Sources1. Bangladesh Bureau of Statistics2. Bangladesh Small and Cottage Industries
Corporation3. Bangladesh Export Processing Zone Authority 4. Board of Investment5. Department of Inspection for Factories
and Establishments, Ministry of Labor andEmployment
Others 1. Micro Industries Development Assistance and
Services2. Bangladesh Yellow Pages
Appendix 1 — Sampling Methodology 53
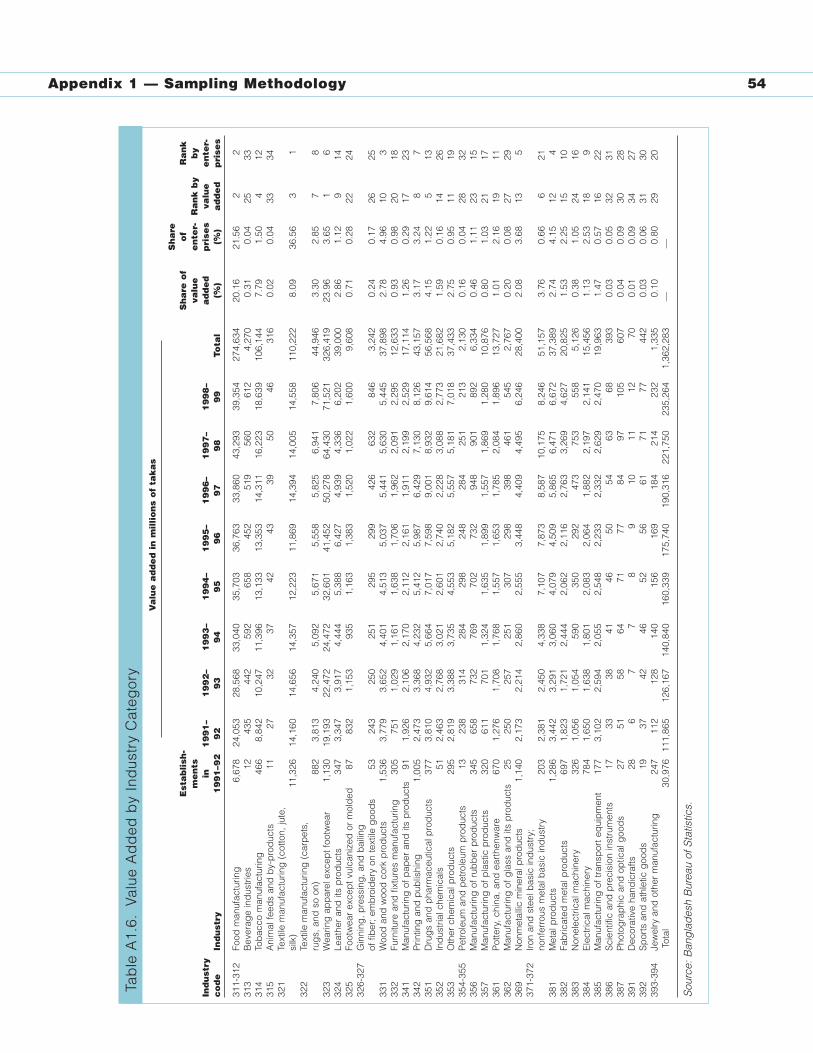
Appendix 1 — Sampling Methodology 54
Va
lue
ad
de
d i
n m
illio
ns
of
tak
as
Sh
are
Est
ab
lish
-S
ha
re o
fo
fR
an
km
en
ts
valu
e
en
ter-
R
an
k b
y b
y In
du
stry
in
1
99
1–
19
92
–1
99
3–
19
94
–1
99
5–
19
96
–1
99
7–
19
98
–a
dd
ed
p
rise
s va
lue
e
nte
r-
co
de
Ind
ust
ry1
99
1–9
29
29
39
49
59
69
79
89
9To
tal
(%)
(%)
ad
de
dp
rise
s
311-
312
Food
man
ufac
turin
g6,
678
24,0
5328
,568
33,0
4035
,703
36,7
6333
,860
43,2
9339
,354
274,
634
20.1
621
.56
22
313
Bev
erag
e in
dus
trie
s12
435
442
592
658
452
519
560
612
4,27
00.
310.
0425
3331
4To
bac
co m
anuf
actu
ring
466
8,84
210
,247
11,3
9613
,133
13,3
5314
,311
16,2
2318
,639
106,
144
7.79
1.50
412
315
Ani
mal
feed
s an
d b
y-p
rod
ucts
1127
3237
4243
3950
4631
60.
020.
0433
3432
1Te
xtile
man
ufac
turin
g (
cotto
n, ju
te,
silk
)11
,326
14,1
6014
,656
14,3
5712
,223
11,8
6914
,394
14,0
0514
,558
110,
222
8.09
36.5
63
132
2Te
xtile
man
ufac
turin
g (
carp
ets,
ru
gs,
and
so
on)
882
3,81
34,
240
5,09
25,
671
5,55
85,
825
6,94
17,
806
44,9
463.
302.
857
832
3W
earin
g a
pp
arel
exc
ept f
ootw
ear
1,13
019
,193
22,4
7224
,472
32,6
0141
,452
50,2
7864
,430
71,5
2132
6,41
923
.96
3.65
16
324
Leat
her
and
its
pro
duc
ts34
73,
347
3,91
74,
444
5,38
86,
427
4,93
94,
336
6,20
239
,000
2.86
1.12
914
325
Foot
wea
r ex
cep
t vul
cani
zed
or
mol
ded
8783
21,
153
935
1,16
31,
383
1,52
01,
022
1,60
09,
608
0.71
0.28
2224
326-
327
Gin
ning
, pre
ssin
g, a
nd b
ailin
g
of fi
ber
; em
bro
ider
y on
text
ile g
ood
s53
243
250
251
295
299
426
632
846
3,24
20.
240.
1726
2533
1W
ood
and
woo
d c
ork
pro
duc
ts1,
536
3,77
93,
652
4,40
14,
513
5,03
75,
441
5,63
05,
445
37,8
982.
784.
9610
333
2Fu
rnitu
re a
nd fi
xtur
es m
anuf
actu
ring
30
575
11,
029
1,16
11,
638
1,70
61,
962
2,09
12,
295
12,6
330.
930.
9820
1834
1M
anuf
actu
ring
of p
aper
and
its
pro
duc
ts91
1,92
62,
106
2,17
02,
112
2,16
11,
911
2,19
92,
529
17,1
141.
260.
2917
2334
2P
rintin
g a
nd p
ublis
hing
1,00
52,
473
3,36
84,
232
5,41
25,
987
6,42
97,
130
8,12
643
,157
3.17
3.24
87
351
Dru
gs
and
pha
rmac
eutic
al p
rod
ucts
377
3,81
04,
932
5,66
47,
017
7,59
89,
001
8,93
29,
614
56,5
684.
151.
225
1335
2In
dus
tria
l che
mic
als
512,
463
2,76
83,
021
2,60
12,
740
2,22
83,
088
2,77
321
,682
1.59
0.16
1426
353
Oth
er c
hem
ical
pro
duc
ts29
52,
819
3,38
83,
735
4,55
35,
182
5,55
75,
181
7,01
837
,433
2.75
0.95
1119
354-
355
Pet
role
um a
nd p
etro
leum
pro
duc
ts13
238
314
284
298
248
284
251
213
2,13
00.
160.
0428
3235
6M
anuf
actu
ring
of r
ubb
er p
rod
ucts
345
658
732
769
702
732
948
901
892
6,33
40.
461.
1123
1535
7M
anuf
actu
ring
of p
last
ic p
rod
ucts
320
611
701
1,32
41,
635
1,89
91,
557
1,86
91,
280
10,8
760.
801.
0321
1736
1P
otte
ry, c
hina
, and
ear
then
war
e67
01,
276
1,70
81,
768
1,55
71,
653
1,78
52,
084
1,89
613
,727
1.01
2.16
1911
362
Man
ufac
turin
g o
f gla
ss a
nd it
s p
rod
ucts
2525
025
725
130
729
839
846
154
52,
767
0.20
0.08
2729
369
Non
met
allic
min
eral
pro
duc
ts1,
140
2,17
32,
214
2,86
02,
555
3,44
84,
409
4,49
56,
246
28,4
002.
083.
6813
537
1-37
2Iro
n an
d s
teel
bas
ic in
dus
try;
no
nfer
rous
met
al b
asic
ind
ustr
y 20
32,
381
2,45
04,
338
7,10
77,
873
8,58
710
,175
8,24
651
,157
3.76
0.66
621
381
Met
al p
rod
ucts
1,28
63,
442
3,29
13,
060
4,07
94,
509
5,86
56,
471
6,67
237
,389
2.74
4.15
124
382
Fab
ricat
ed m
etal
pro
duc
ts69
71,
823
1,72
12,
444
2,06
22,
116
2,76
33,
269
4,62
720
,825
1.53
2.25
1510
383
Non
elec
tric
al m
achi
nery
326
1,05
61,
054
590
350
292
473
753
558
5,12
60.
381.
0524
1638
4E
lect
rical
mac
hine
ry78
41,
650
1,63
81,
801
2,08
32,
064
1,88
22,
197
2,14
115
,456
1.13
2.53
189
385
Man
ufac
turin
g o
f tra
nsp
ort e
qui
pm
ent
177
3,10
22,
594
2,05
52,
548
2,23
32,
332
2,62
92,
470
19,9
631.
470.
5716
2238
6S
cien
tific
and
pre
cisi
on in
stru
men
ts17
3338
4146
5054
6368
393
0.03
0.05
3231
387
Pho
tog
rap
hic
and
op
tical
goo
ds
2751
5864
7177
8497
105
607
0.04
0.09
3028
391
Dec
orat
ive
hand
icra
fts28
67
78
910
1112
700.
010.
0934
2739
2S
por
ts a
nd a
thle
tic g
ood
s19
3742
4652
5661
7177
442
0.03
0.06
3130
393-
394
Jew
elry
and
oth
er m
anuf
actu
ring
24
711
212
814
015
616
918
421
423
21,
335
0.10
0.80
2920
Tota
l30
,976
111,
865
126,
167
140,
840
160,
339
175,
740
190,
316
221,
750
235,
264
1,36
2,28
3—
—
Sou
rce:
Ban
gla
des
h B
urea
u of
Sta
tistic
s.
Tab
le A
1.6.
Valu
e A
dd
ed b
y In
dus
try
Cat
egor
y

APPENDIX 2Technical Appendix
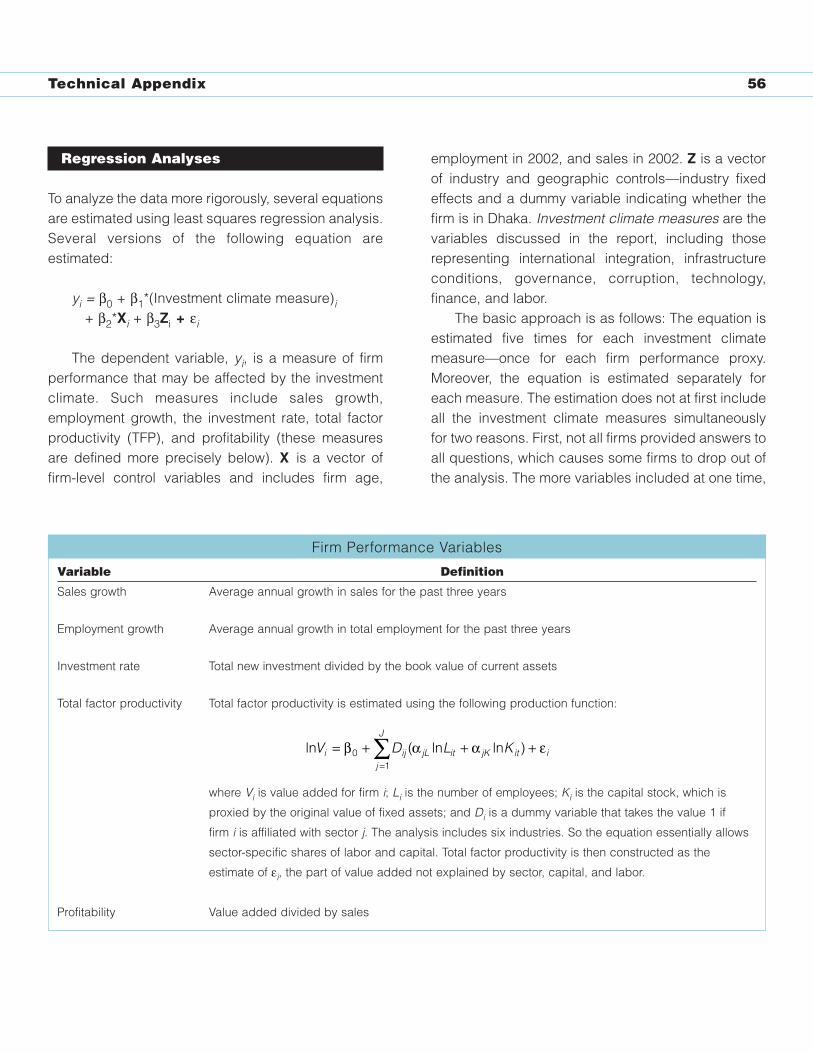
Regression Analyses
To analyze the data more rigorously, several equationsare estimated using least squares regression analysis.Several versions of the following equation areestimated:
yi = β0 + β1*(Investment climate measure)i+ β2*Xi + β3Zi + εi
The dependent variable, yi, is a measure of firmperformance that may be affected by the investmentclimate. Such measures include sales growth,employment growth, the investment rate, total factorproductivity (TFP), and profitability (these measuresare defined more precisely below). X is a vector offirm-level control variables and includes firm age,
employment in 2002, and sales in 2002. Z is a vectorof industry and geographic controls—industry fixedeffects and a dummy variable indicating whether thefirm is in Dhaka. Investment climate measures are thevariables discussed in the report, including thoserepresenting international integration, infrastructureconditions, governance, corruption, technology,finance, and labor.
The basic approach is as follows: The equation isestimated five times for each investment climatemeasure—once for each firm performance proxy.Moreover, the equation is estimated separately foreach measure. The estimation does not at first includeall the investment climate measures simultaneouslyfor two reasons. First, not all firms provided answers toall questions, which causes some firms to drop out ofthe analysis. The more variables included at one time,
Technical Appendix 56
Variable Definition
Sales growth Average annual growth in sales for the past three years
Employment growth Average annual growth in total employment for the past three years
Investment rate Total new investment divided by the book value of current assets
Total factor productivity Total factor productivity is estimated using the following production function:
where Vi is value added for firm i; Li is the number of employees; Ki is the capital stock, which is
proxied by the original value of fixed assets; and Di is a dummy variable that takes the value 1 if
firm i is affiliated with sector j. The analysis includes six industries. So the equation essentially allows
sector-specific shares of labor and capital. Total factor productivity is then constructed as the
estimate of εi, the part of value added not explained by sector, capital, and labor.
Profitability Value added divided by sales
ln ( ln ln )V D L Ki ij jL it jK itj
J
i= + + +=
∑β α α ε01
Firm Performance Variables
the smaller the sample becomes. Thus estimating theequation with all variables simultaneously would resultin too small a sample. Second, investment climatevariables tend to be correlated with one another,causing collinearity problems when all are includedsimultaneously. Looking at each one separately helpsavoid both these problems.
The results of these regressions are shown in tableA2.1. The table is constructed for viewingconvenience. Each investment climate measure isestimated separately—not with the others—along withthe firm and industry characteristics, which are notshown in the table. Instead, the table simply showsthe coefficient on the investment climate measure, thestatistical significance of the estimate, and thenumber of observations in that particular analysis.
SimulationsConstructing the simulations requires estimating theinvestment climate measures simultaneously. To dealwith the problem of missing observations, the missingobservations are replaced with the sector-city meanfor that variable. This approach makes it possible torun regressions with the complete data set to derivethe coefficients necessary to estimate the simulatedresults of improving investment climate measures.1
The results of these sets of regressions are shown intable A2.2.
IndexesA common difficulty arising in investment climateanalyses is that any one feature of the investmentclimate actually consists of several related factors. Forexample, theory and practice tell us that “access toformal finance” is important, but how can we measureit? The surveys collect several pieces of relevantinformation, but selecting a single one that representsfinance is difficult. Including multiple finance variablesin a regression, however, would lead to seriousmulticollinearity problems.
In two cases—finance and information andcommunications technology—this problem is solvedby constructing principal components indexes. Thistype of index is intended to extract the maximumpossible information from a series of related variables.The index is the linear combination of the variablesthat captures the most variation possible.
The finance index is derived from three variables:the firm’s share of working capital from bank loans, itsshare of new investments from bank loans, andwhether the firm has an overdraft facility. Theinformation and communications technology index isderived using the share of the firm’s employeesengaged in research and development (R&D)activities, the share of spending on R&D, the share ofspending on communications, and whether the firmregularly uses email.
The advantage of these indexes is that theycapture a large amount of information on particularinvestment climate variables, where any singlevariable would provide an incomplete picture. Theirmain disadvantage is that while they are useful forcomparison, their absolute values are not meaningful.That is, an index shows how one firm compares withanother in access to finance or use of information andcommunications technology, but a score of, say, 0.2 is meaningless by itself. To deal with this problem, the indexes are presented along with some of theircomponents.
Notes
1. As a robustness check, the regressionsrepresented in table A2.2 were run with theimputed variables to see whether the imputationsappear to affect the results. The results werequalitatively identical whether actual data wereused or missing observations were replaced withcity-sector means.
Technical Appendix 57
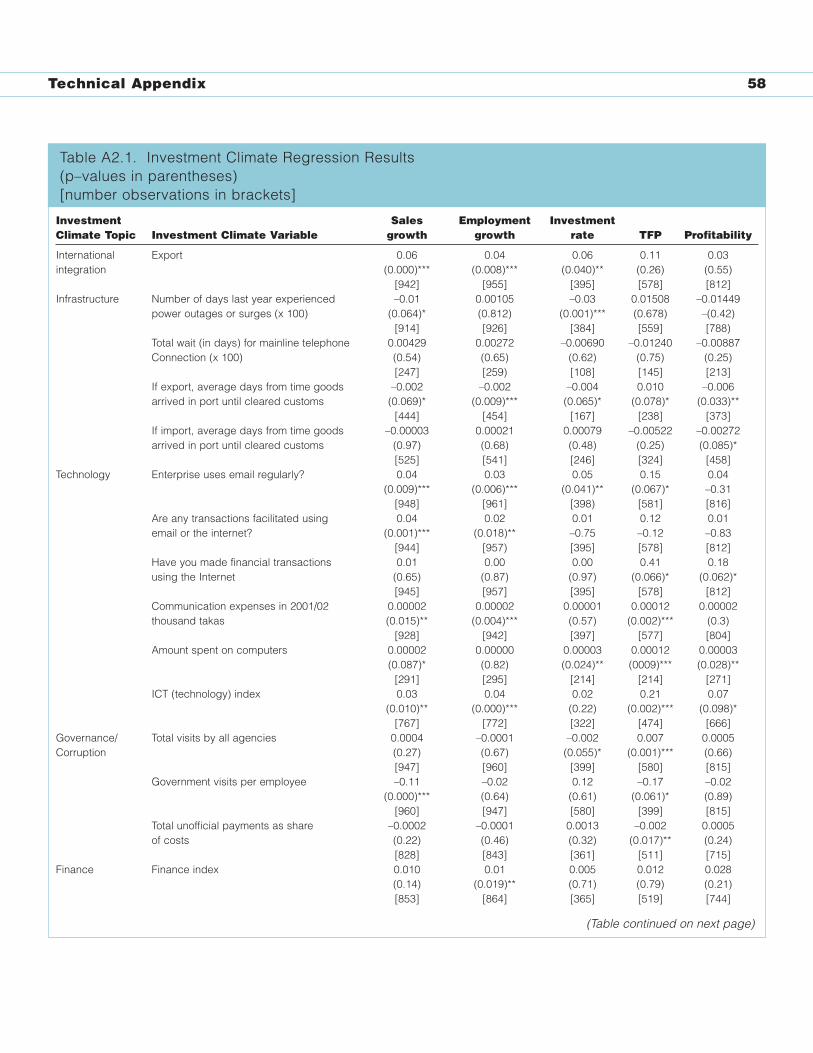
Technical Appendix 58
Table A2.1. Investment Climate Regression Results(p–values in parentheses)[number observations in brackets]
Investment Sales Employment InvestmentClimate Topic Investment Climate Variable growth growth rate TFP Profitability
International Export 0.06 0.04 0.06 0.11 0.03integration (0.000)*** (0.008)*** (0.040)** (0.26) (0.55)
[942] [955] [395] [578] [812]Infrastructure Number of days last year experienced –0.01 0.00105 –0.03 0.01508 –0.01449
power outages or surges (x 100) (0.064)* (0.812) (0.001)*** (0.678) –(0.42)[914] [926] [384] [559] [788)
Total wait (in days) for mainline telephone 0.00429 0.00272 –0.00690 –0.01240 –0.00887Connection (x 100) (0.54) (0.65) (0.62) (0.75) (0.25)
[247] [259) [108] [145] [213]If export, average days from time goods –0.002 –0.002 –0.004 0.010 –0.006arrived in port until cleared customs (0.069)* (0.009)*** (0.065)* (0.078)* (0.033)**
[444] [454] [167] [238] [373]If import, average days from time goods –0.00003 0.00021 0.00079 –0.00522 –0.00272arrived in port until cleared customs (0.97) (0.68) (0.48) (0.25) (0.085)*
[525] [541] [246] [324] [458]Technology Enterprise uses email regularly? 0.04 0.03 0.05 0.15 0.04
(0.009)*** (0.006)*** (0.041)** (0.067)* –0.31[948] [961] [398) [581] [816]
Are any transactions facilitated using 0.04 0.02 0.01 0.12 0.01email or the internet? (0.001)*** (0.018)** –0.75 –0.12 –0.83
[944] [957) [395] [578] [812]Have you made financial transactions 0.01 0.00 0.00 0.41 0.18using the Internet (0.65) (0.87) (0.97) (0.066)* (0.062)*
[945] [957] [395] [578] [812]Communication expenses in 2001/02 0.00002 0.00002 0.00001 0.00012 0.00002thousand takas (0.015)** (0.004)*** (0.57) (0.002)*** (0.3)
[928] [942] [397] [577] [804]Amount spent on computers 0.00002 0.00000 0.00003 0.00012 0.00003
(0.087)* (0.82) (0.024)** (0009)*** (0.028)**[291] [295] [214] [214] [271]
ICT (technology) index 0.03 0.04 0.02 0.21 0.07(0.010)** (0.000)*** (0.22) (0.002)*** (0.098)*
[767] [772] [322] [474] [666]Governance/ Total visits by all agencies 0.0004 –0.0001 –0.002 0.007 0.0005Corruption (0.27) (0.67) (0.055)* (0.001)*** (0.66)
[947] [960] [399] [580] [815]Government visits per employee –0.11 –0.02 0.12 –0.17 –0.02
(0.000)*** (0.64) (0.61) (0.061)* (0.89)[960] [947] [580] [399] [815]
Total unofficial payments as share –0.0002 –0.0001 0.0013 –0.002 0.0005of costs (0.22) (0.46) (0.32) (0.017)** (0.24)
[828] [843] [361] [511] [715]Finance Finance index 0.010 0.01 0.005 0.012 0.028
(0.14) (0.019)** (0.71) (0.79) (0.21)[853] [864] [365] [519] [744]
(Table continued on next page)
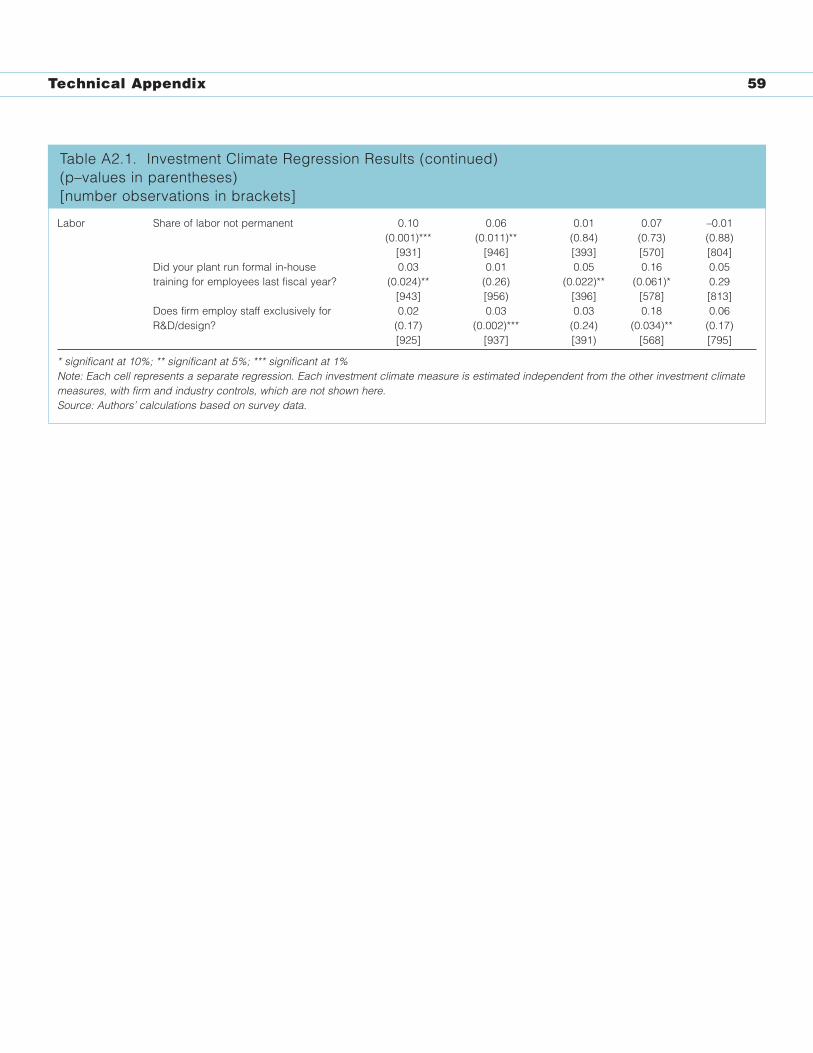
Technical Appendix 59
Labor Share of labor not permanent 0.10 0.06 0.01 0.07 –0.01(0.001)*** (0.011)** (0.84) (0.73) (0.88)
[931] [946] [393] [570] [804]Did your plant run formal in-house 0.03 0.01 0.05 0.16 0.05training for employees last fiscal year? (0.024)** (0.26) (0.022)** (0.061)* 0.29
[943] [956) [396] [578] [813]Does firm employ staff exclusively for 0.02 0.03 0.03 0.18 0.06R&D/design? (0.17) (0.002)*** (0.24) (0.034)** (0.17)
[925] [937] [391) [568] [795]
* significant at 10%; ** significant at 5%; *** significant at 1%Note: Each cell represents a separate regression. Each investment climate measure is estimated independent from the other investment climatemeasures, with firm and industry controls, which are not shown here. Source: Authors’ calculations based on survey data.
Table A2.1. Investment Climate Regression Results (continued)(p–values in parentheses)[number observations in brackets]
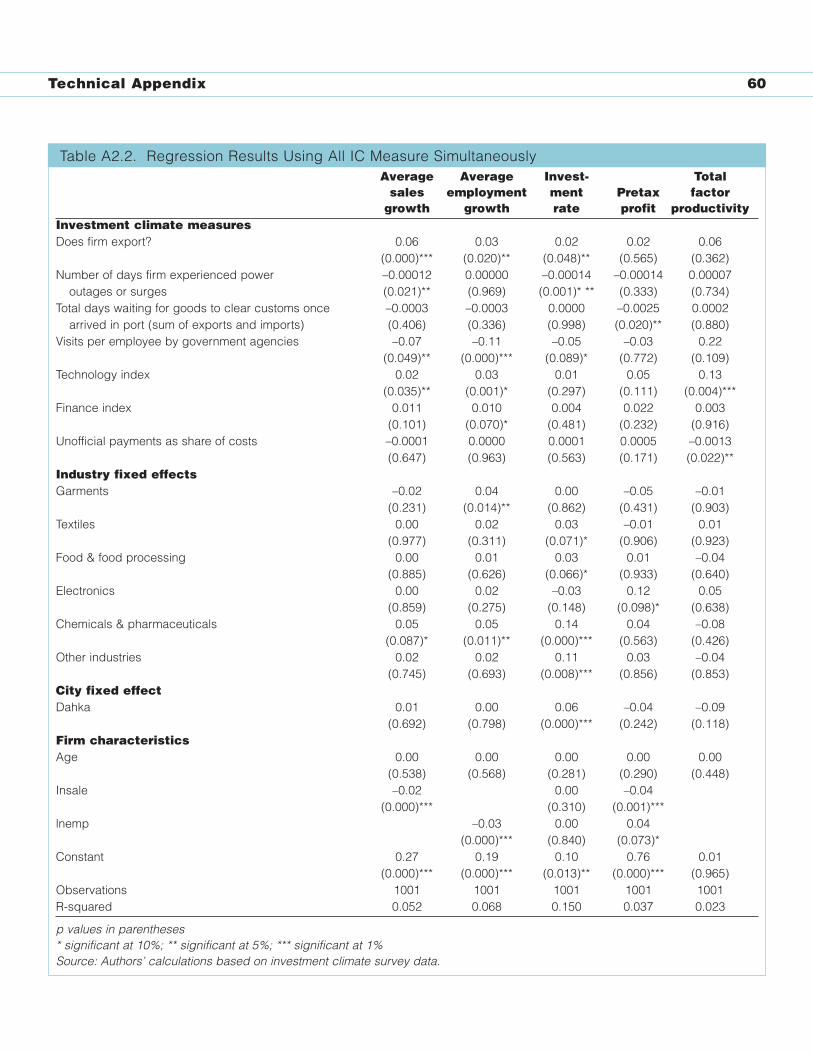
Average Average Invest- Totalsales employment ment Pretax factor
growth growth rate profit productivityInvestment climate measuresDoes firm export? 0.06 0.03 0.02 0.02 0.06
(0.000)*** (0.020)** (0.048)** (0.565) (0.362)Number of days firm experienced power –0.00012 0.00000 –0.00014 –0.00014 0.00007
outages or surges (0.021)** (0.969) (0.001)* ** (0.333) (0.734)Total days waiting for goods to clear customs once –0.0003 –0.0003 0.0000 –0.0025 0.0002
arrived in port (sum of exports and imports) (0.406) (0.336) (0.998) (0.020)** (0.880)Visits per employee by government agencies –0.07 –0.11 –0.05 –0.03 0.22
(0.049)** (0.000)*** (0.089)* (0.772) (0.109)Technology index 0.02 0.03 0.01 0.05 0.13
(0.035)** (0.001)* (0.297) (0.111) (0.004)***Finance index 0.011 0.010 0.004 0.022 0.003
(0.101) (0.070)* (0.481) (0.232) (0.916)Unofficial payments as share of costs –0.0001 0.0000 0.0001 0.0005 –0.0013
(0.647) (0.963) (0.563) (0.171) (0.022)**Industry fixed effectsGarments –0.02 0.04 0.00 –0.05 –0.01
(0.231) (0.014)** (0.862) (0.431) (0.903)Textiles 0.00 0.02 0.03 –0.01 0.01
(0.977) (0.311) (0.071)* (0.906) (0.923)Food & food processing 0.00 0.01 0.03 0.01 –0.04
(0.885) (0.626) (0.066)* (0.933) (0.640)Electronics 0.00 0.02 –0.03 0.12 0.05
(0.859) (0.275) (0.148) (0.098)* (0.638)Chemicals & pharmaceuticals 0.05 0.05 0.14 0.04 –0.08
(0.087)* (0.011)** (0.000)*** (0.563) (0.426)Other industries 0.02 0.02 0.11 0.03 –0.04
(0.745) (0.693) (0.008)*** (0.856) (0.853)City fixed effectDahka 0.01 0.00 0.06 –0.04 –0.09
(0.692) (0.798) (0.000)*** (0.242) (0.118)Firm characteristicsAge 0.00 0.00 0.00 0.00 0.00
(0.538) (0.568) (0.281) (0.290) (0.448)Insale –0.02 0.00 –0.04
(0.000)*** (0.310) (0.001)***lnemp –0.03 0.00 0.04
(0.000)*** (0.840) (0.073)*Constant 0.27 0.19 0.10 0.76 0.01
(0.000)*** (0.000)*** (0.013)** (0.000)*** (0.965)Observations 1001 1001 1001 1001 1001R-squared 0.052 0.068 0.150 0.037 0.023
p values in parentheses* significant at 10%; ** significant at 5%; *** significant at 1%Source: Authors’ calculations based on investment climate survey data.
Technical Appendix 60
Table A2.2. Regression Results Using All IC Measure Simultaneously
APPENDIX 3Standard Investment Climate Tables
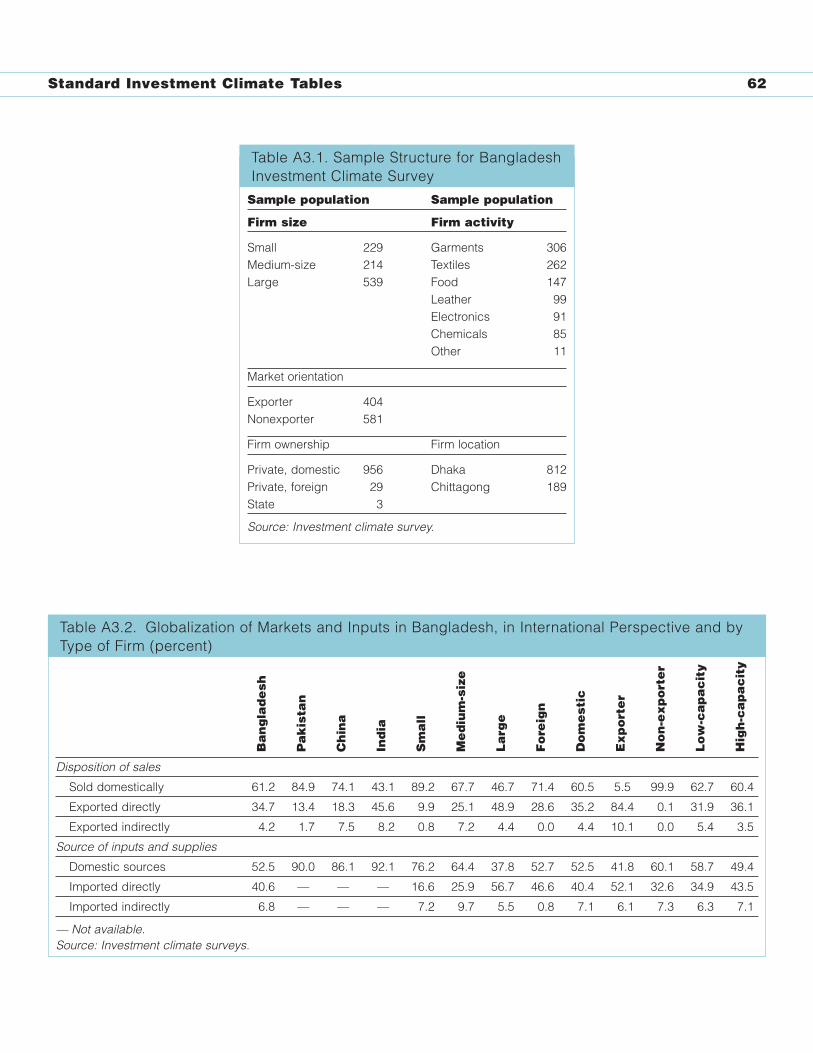
Table A3.1. Sample Structure for BangladeshInvestment Climate Survey
Standard Investment Climate Tables 62
Sample population Sample population
Firm size Firm activity
Small 229 Garments 306Medium-size 214 Textiles 262Large 539 Food 147
Leather 99Electronics 91Chemicals 85Other 11
Market orientation
Exporter 404Nonexporter 581
Firm ownership Firm location
Private, domestic 956 Dhaka 812Private, foreign 29 Chittagong 189State 3
Source: Investment climate survey.
Disposition of sales
Sold domestically 61.2 84.9 74.1 43.1 89.2 67.7 46.7 71.4 60.5 5.5 99.9 62.7 60.4
Exported directly 34.7 13.4 18.3 45.6 9.9 25.1 48.9 28.6 35.2 84.4 0.1 31.9 36.1
Exported indirectly 4.2 1.7 7.5 8.2 0.8 7.2 4.4 0.0 4.4 10.1 0.0 5.4 3.5
Source of inputs and supplies
Domestic sources 52.5 90.0 86.1 92.1 76.2 64.4 37.8 52.7 52.5 41.8 60.1 58.7 49.4
Imported directly 40.6 — — — 16.6 25.9 56.7 46.6 40.4 52.1 32.6 34.9 43.5
Imported indirectly 6.8 — — — 7.2 9.7 5.5 0.8 7.1 6.1 7.3 6.3 7.1
— Not available.Source: Investment climate surveys.
Ba
ng
lad
esh
Pa
kis
tan
Ch
ina
Ind
ia
Sm
all
Me
diu
m-s
ize
La
rge
Fo
reig
n
Do
me
stic
Ex
po
rte
r
No
n-e
xp
ort
er
Lo
w-c
ap
ac
ity
Hig
h-c
ap
ac
ity
Table A3.2. Globalization of Markets and Inputs in Bangladesh, in International Perspective and byType of Firm (percent)
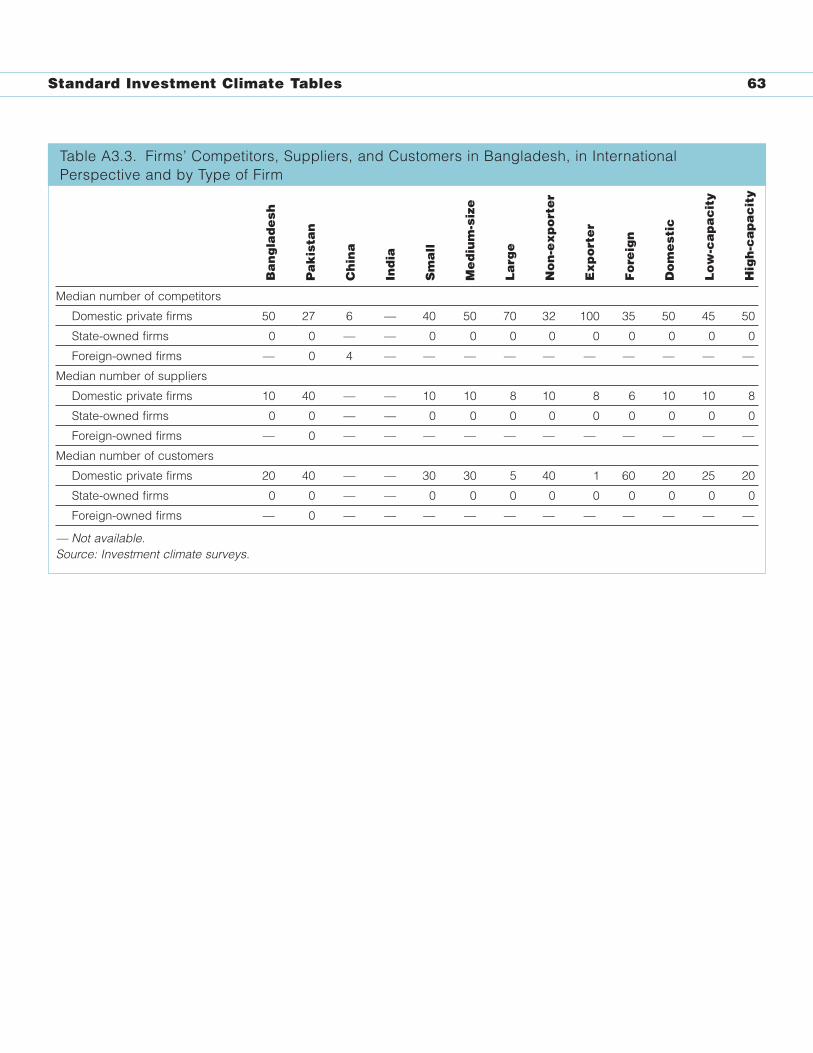
Standard Investment Climate Tables 63
Ba
ng
lad
esh
Pa
kis
tan
Ch
ina
Ind
ia
Sm
all
Me
diu
m-s
ize
La
rge
No
n-e
xp
ort
er
Ex
po
rte
r
Fo
reig
n
Do
me
stic
Lo
w-c
ap
ac
ity
Hig
h-c
ap
ac
ity
Table A3.3. Firms’ Competitors, Suppliers, and Customers in Bangladesh, in InternationalPerspective and by Type of Firm
Median number of competitors
Domestic private firms 50 27 6 — 40 50 70 32 100 35 50 45 50
State-owned firms 0 0 — — 0 0 0 0 0 0 0 0 0
Foreign-owned firms — 0 4 — — — — — — — — — —
Median number of suppliers
Domestic private firms 10 40 — — 10 10 8 10 8 6 10 10 8
State-owned firms 0 0 — — 0 0 0 0 0 0 0 0 0
Foreign-owned firms — 0 — — — — — — — — — — —
Median number of customers
Domestic private firms 20 40 — — 30 30 5 40 1 60 20 25 20
State-owned firms 0 0 — — 0 0 0 0 0 0 0 0 0
Foreign-owned firms — 0 — — — — — — — — — — —
— Not available.Source: Investment climate surveys.
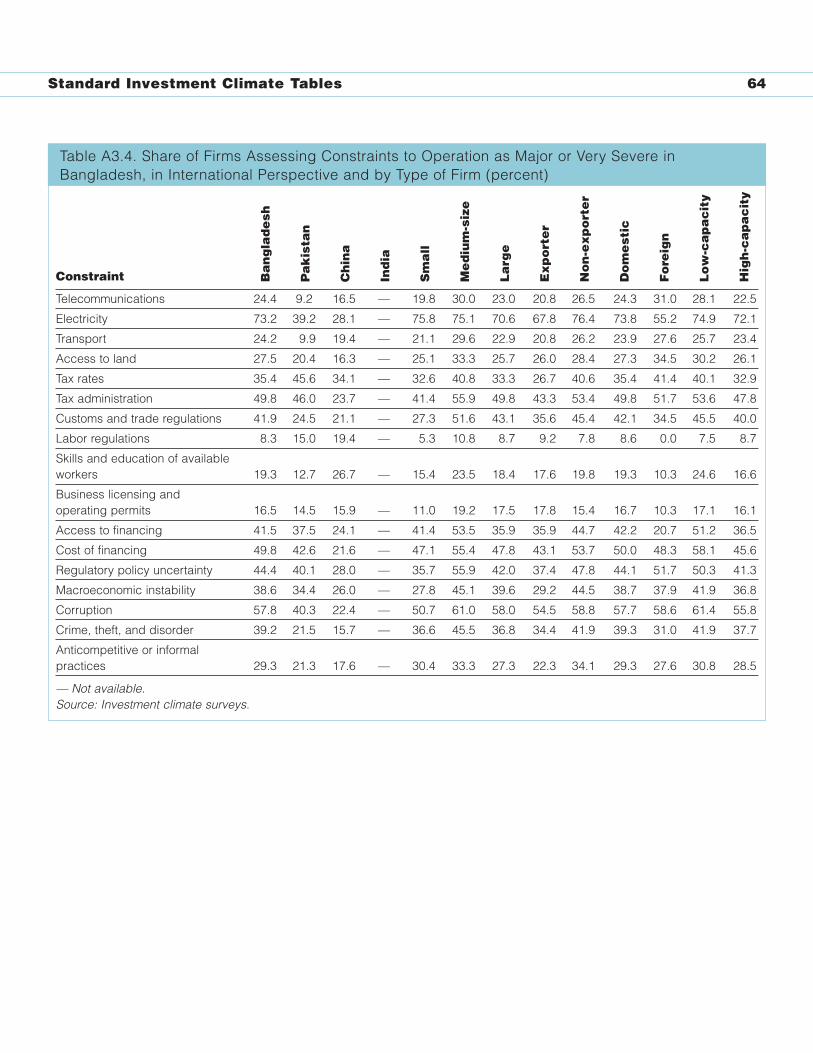
Standard Investment Climate Tables 64
Telecommunications 24.4 9.2 16.5 — 19.8 30.0 23.0 20.8 26.5 24.3 31.0 28.1 22.5
Electricity 73.2 39.2 28.1 — 75.8 75.1 70.6 67.8 76.4 73.8 55.2 74.9 72.1
Transport 24.2 9.9 19.4 — 21.1 29.6 22.9 20.8 26.2 23.9 27.6 25.7 23.4
Access to land 27.5 20.4 16.3 — 25.1 33.3 25.7 26.0 28.4 27.3 34.5 30.2 26.1
Tax rates 35.4 45.6 34.1 — 32.6 40.8 33.3 26.7 40.6 35.4 41.4 40.1 32.9
Tax administration 49.8 46.0 23.7 — 41.4 55.9 49.8 43.3 53.4 49.8 51.7 53.6 47.8
Customs and trade regulations 41.9 24.5 21.1 — 27.3 51.6 43.1 35.6 45.4 42.1 34.5 45.5 40.0
Labor regulations 8.3 15.0 19.4 — 5.3 10.8 8.7 9.2 7.8 8.6 0.0 7.5 8.7
Skills and education of availableworkers 19.3 12.7 26.7 — 15.4 23.5 18.4 17.6 19.8 19.3 10.3 24.6 16.6
Business licensing and operating permits 16.5 14.5 15.9 — 11.0 19.2 17.5 17.8 15.4 16.7 10.3 17.1 16.1
Access to financing 41.5 37.5 24.1 — 41.4 53.5 35.9 35.9 44.7 42.2 20.7 51.2 36.5
Cost of financing 49.8 42.6 21.6 — 47.1 55.4 47.8 43.1 53.7 50.0 48.3 58.1 45.6
Regulatory policy uncertainty 44.4 40.1 28.0 — 35.7 55.9 42.0 37.4 47.8 44.1 51.7 50.3 41.3
Macroeconomic instability 38.6 34.4 26.0 — 27.8 45.1 39.6 29.2 44.5 38.7 37.9 41.9 36.8
Corruption 57.8 40.3 22.4 — 50.7 61.0 58.0 54.5 58.8 57.7 58.6 61.4 55.8
Crime, theft, and disorder 39.2 21.5 15.7 — 36.6 45.5 36.8 34.4 41.9 39.3 31.0 41.9 37.7
Anticompetitive or informal practices 29.3 21.3 17.6 — 30.4 33.3 27.3 22.3 34.1 29.3 27.6 30.8 28.5
— Not available.Source: Investment climate surveys.
Ba
ng
lad
esh
Pa
kis
tan
Ch
ina
Ind
ia
Sm
all
Me
diu
m-s
ize
La
rge
Ex
po
rte
r
No
n-e
xp
ort
er
Do
me
stic
Fo
reig
n
Lo
w-c
ap
ac
ity
Hig
h-c
ap
ac
ity
Table A3.4. Share of Firms Assessing Constraints to Operation as Major or Very Severe inBangladesh, in International Perspective and by Type of Firm (percent)
Constraint
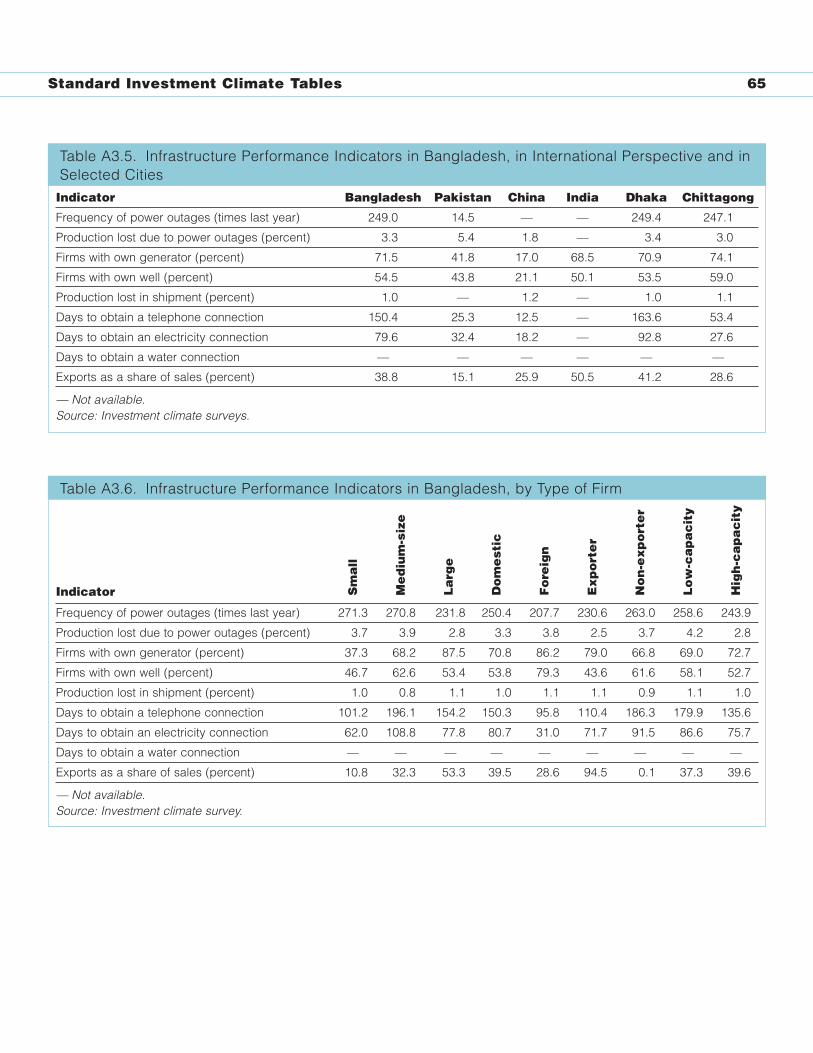
Standard Investment Climate Tables 65
Sm
all
Me
diu
m-s
ize
La
rge
Do
me
stic
Fo
reig
n
Ex
po
rte
r
No
n-e
xp
ort
er
Lo
w-c
ap
ac
ity
Hig
h-c
ap
ac
ity
Table A3.6. Infrastructure Performance Indicators in Bangladesh, by Type of Firm
Indicator
Frequency of power outages (times last year) 271.3 270.8 231.8 250.4 207.7 230.6 263.0 258.6 243.9
Production lost due to power outages (percent) 3.7 3.9 2.8 3.3 3.8 2.5 3.7 4.2 2.8
Firms with own generator (percent) 37.3 68.2 87.5 70.8 86.2 79.0 66.8 69.0 72.7
Firms with own well (percent) 46.7 62.6 53.4 53.8 79.3 43.6 61.6 58.1 52.7
Production lost in shipment (percent) 1.0 0.8 1.1 1.0 1.1 1.1 0.9 1.1 1.0
Days to obtain a telephone connection 101.2 196.1 154.2 150.3 95.8 110.4 186.3 179.9 135.6
Days to obtain an electricity connection 62.0 108.8 77.8 80.7 31.0 71.7 91.5 86.6 75.7
Days to obtain a water connection — — — — — — — — —
Exports as a share of sales (percent) 10.8 32.3 53.3 39.5 28.6 94.5 0.1 37.3 39.6
— Not available.Source: Investment climate survey.
Indicator Bangladesh Pakistan China India Dhaka Chittagong
Frequency of power outages (times last year) 249.0 14.5 — — 249.4 247.1
Production lost due to power outages (percent) 3.3 5.4 1.8 — 3.4 3.0
Firms with own generator (percent) 71.5 41.8 17.0 68.5 70.9 74.1
Firms with own well (percent) 54.5 43.8 21.1 50.1 53.5 59.0
Production lost in shipment (percent) 1.0 — 1.2 — 1.0 1.1
Days to obtain a telephone connection 150.4 25.3 12.5 — 163.6 53.4
Days to obtain an electricity connection 79.6 32.4 18.2 — 92.8 27.6
Days to obtain a water connection — — — — — —
Exports as a share of sales (percent) 38.8 15.1 25.9 50.5 41.2 28.6
— Not available.Source: Investment climate surveys.
Table A3.5. Infrastructure Performance Indicators in Bangladesh, in International Perspective and inSelected Cities
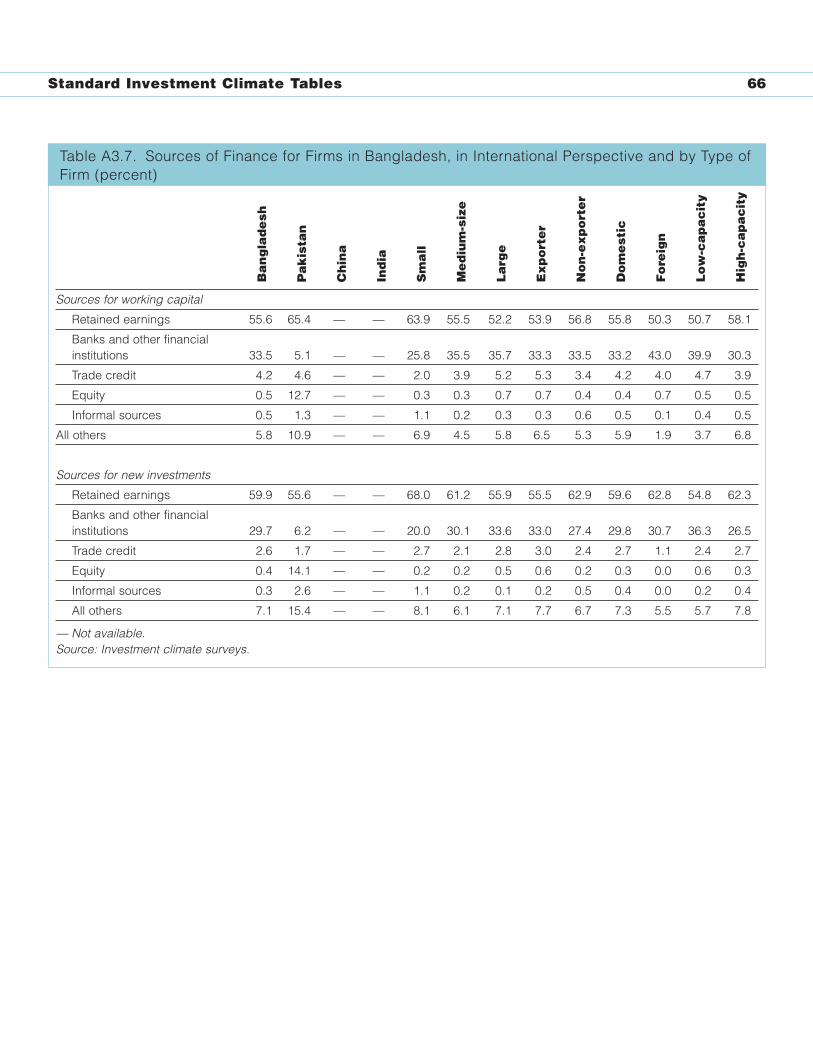
Standard Investment Climate Tables 66
Sources for working capital
Retained earnings 55.6 65.4 — — 63.9 55.5 52.2 53.9 56.8 55.8 50.3 50.7 58.1
Banks and other financialinstitutions 33.5 5.1 — — 25.8 35.5 35.7 33.3 33.5 33.2 43.0 39.9 30.3
Trade credit 4.2 4.6 — — 2.0 3.9 5.2 5.3 3.4 4.2 4.0 4.7 3.9
Equity 0.5 12.7 — — 0.3 0.3 0.7 0.7 0.4 0.4 0.7 0.5 0.5
Informal sources 0.5 1.3 — — 1.1 0.2 0.3 0.3 0.6 0.5 0.1 0.4 0.5
All others 5.8 10.9 — — 6.9 4.5 5.8 6.5 5.3 5.9 1.9 3.7 6.8
Sources for new investments
Retained earnings 59.9 55.6 — — 68.0 61.2 55.9 55.5 62.9 59.6 62.8 54.8 62.3
Banks and other financialinstitutions 29.7 6.2 — — 20.0 30.1 33.6 33.0 27.4 29.8 30.7 36.3 26.5
Trade credit 2.6 1.7 — — 2.7 2.1 2.8 3.0 2.4 2.7 1.1 2.4 2.7
Equity 0.4 14.1 — — 0.2 0.2 0.5 0.6 0.2 0.3 0.0 0.6 0.3
Informal sources 0.3 2.6 — — 1.1 0.2 0.1 0.2 0.5 0.4 0.0 0.2 0.4
All others 7.1 15.4 — — 8.1 6.1 7.1 7.7 6.7 7.3 5.5 5.7 7.8
— Not available.Source: Investment climate surveys.
Table A3.7. Sources of Finance for Firms in Bangladesh, in International Perspective and by Type ofFirm (percent)
Ba
ng
lad
esh
Pa
kis
tan
Ch
ina
Ind
ia
Sm
all
Me
diu
m-s
ize
La
rge
Ex
po
rte
r
No
n-e
xp
ort
er
Do
me
stic
Fo
reig
n
Lo
w-c
ap
ac
ity
Hig
h-c
ap
ac
ity
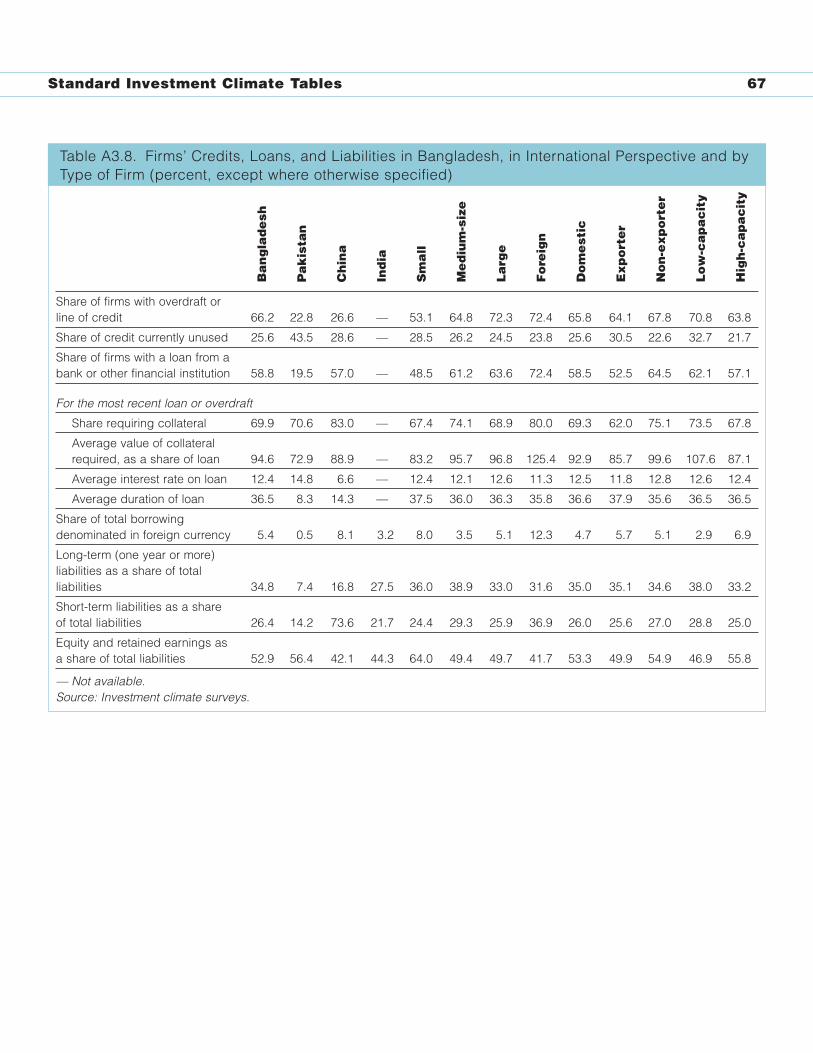
Standard Investment Climate Tables 67
Table A3.8. Firms’ Credits, Loans, and Liabilities in Bangladesh, in International Perspective and byType of Firm (percent, except where otherwise specified)
Ba
ng
lad
esh
Pa
kis
tan
Ch
ina
Ind
ia
Sm
all
Me
diu
m-s
ize
La
rge
Fo
reig
n
Do
me
stic
Ex
po
rte
r
No
n-e
xp
ort
er
Lo
w-c
ap
ac
ity
Hig
h-c
ap
ac
ity
Share of firms with overdraft or line of credit 66.2 22.8 26.6 — 53.1 64.8 72.3 72.4 65.8 64.1 67.8 70.8 63.8
Share of credit currently unused 25.6 43.5 28.6 — 28.5 26.2 24.5 23.8 25.6 30.5 22.6 32.7 21.7
Share of firms with a loan from a bank or other financial institution 58.8 19.5 57.0 — 48.5 61.2 63.6 72.4 58.5 52.5 64.5 62.1 57.1
For the most recent loan or overdraft
Share requiring collateral 69.9 70.6 83.0 — 67.4 74.1 68.9 80.0 69.3 62.0 75.1 73.5 67.8
Average value of collateral required, as a share of loan 94.6 72.9 88.9 — 83.2 95.7 96.8 125.4 92.9 85.7 99.6 107.6 87.1
Average interest rate on loan 12.4 14.8 6.6 — 12.4 12.1 12.6 11.3 12.5 11.8 12.8 12.6 12.4
Average duration of loan 36.5 8.3 14.3 — 37.5 36.0 36.3 35.8 36.6 37.9 35.6 36.5 36.5
Share of total borrowing denominated in foreign currency 5.4 0.5 8.1 3.2 8.0 3.5 5.1 12.3 4.7 5.7 5.1 2.9 6.9
Long-term (one year or more) liabilities as a share of total liabilities 34.8 7.4 16.8 27.5 36.0 38.9 33.0 31.6 35.0 35.1 34.6 38.0 33.2
Short-term liabilities as a share of total liabilities 26.4 14.2 73.6 21.7 24.4 29.3 25.9 36.9 26.0 25.6 27.0 28.8 25.0
Equity and retained earnings as a share of total liabilities 52.9 56.4 42.1 44.3 64.0 49.4 49.7 41.7 53.3 49.9 54.9 46.9 55.8
— Not available.Source: Investment climate surveys.
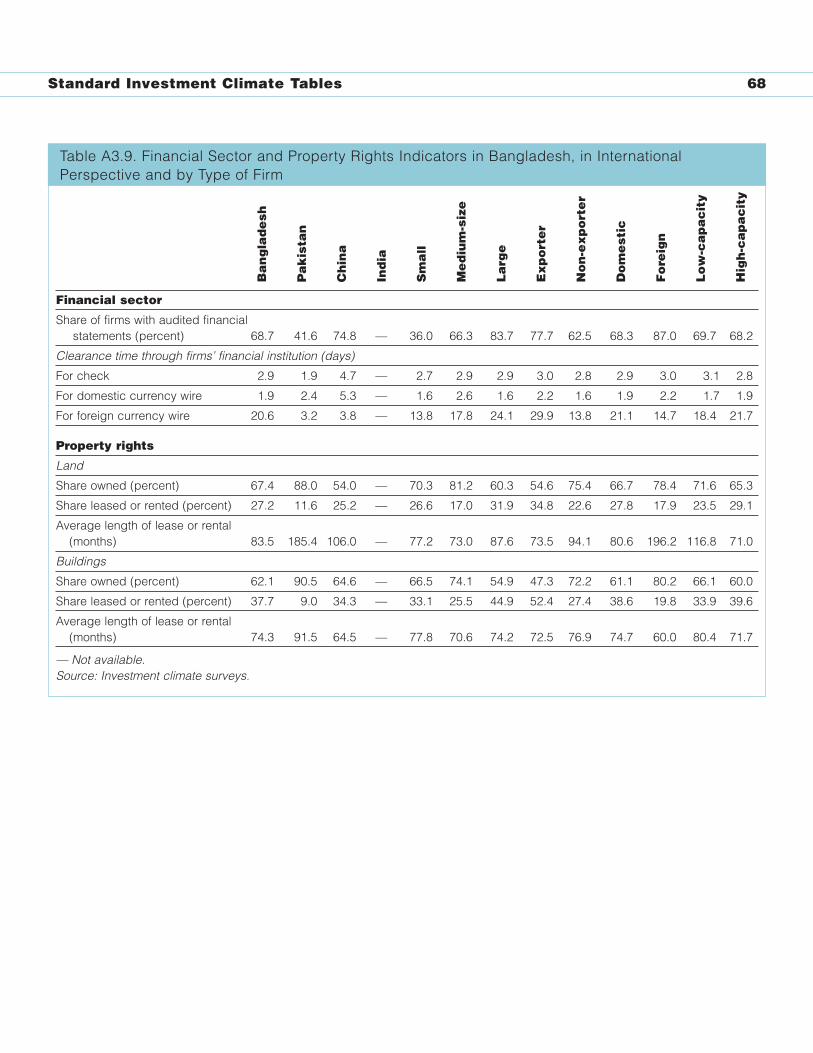
Standard Investment Climate Tables 68
Financial sector
Share of firms with audited financialstatements (percent) 68.7 41.6 74.8 — 36.0 66.3 83.7 77.7 62.5 68.3 87.0 69.7 68.2
Clearance time through firms’ financial institution (days)
For check 2.9 1.9 4.7 — 2.7 2.9 2.9 3.0 2.8 2.9 3.0 3.1 2.8
For domestic currency wire 1.9 2.4 5.3 — 1.6 2.6 1.6 2.2 1.6 1.9 2.2 1.7 1.9
For foreign currency wire 20.6 3.2 3.8 — 13.8 17.8 24.1 29.9 13.8 21.1 14.7 18.4 21.7
Property rights
Land
Share owned (percent) 67.4 88.0 54.0 — 70.3 81.2 60.3 54.6 75.4 66.7 78.4 71.6 65.3
Share leased or rented (percent) 27.2 11.6 25.2 — 26.6 17.0 31.9 34.8 22.6 27.8 17.9 23.5 29.1
Average length of lease or rental (months) 83.5 185.4 106.0 — 77.2 73.0 87.6 73.5 94.1 80.6 196.2 116.8 71.0
Buildings
Share owned (percent) 62.1 90.5 64.6 — 66.5 74.1 54.9 47.3 72.2 61.1 80.2 66.1 60.0
Share leased or rented (percent) 37.7 9.0 34.3 — 33.1 25.5 44.9 52.4 27.4 38.6 19.8 33.9 39.6
Average length of lease or rental (months) 74.3 91.5 64.5 — 77.8 70.6 74.2 72.5 76.9 74.7 60.0 80.4 71.7
— Not available.Source: Investment climate surveys.
Table A3.9. Financial Sector and Property Rights Indicators in Bangladesh, in InternationalPerspective and by Type of Firm
Ba
ng
lad
esh
Pa
kis
tan
Ch
ina
Ind
ia
Sm
all
Me
diu
m-s
ize
La
rge
Ex
po
rte
r
No
n-e
xp
ort
er
Do
me
stic
Fo
reig
n
Lo
w-c
ap
ac
ity
Hig
h-c
ap
ac
ity
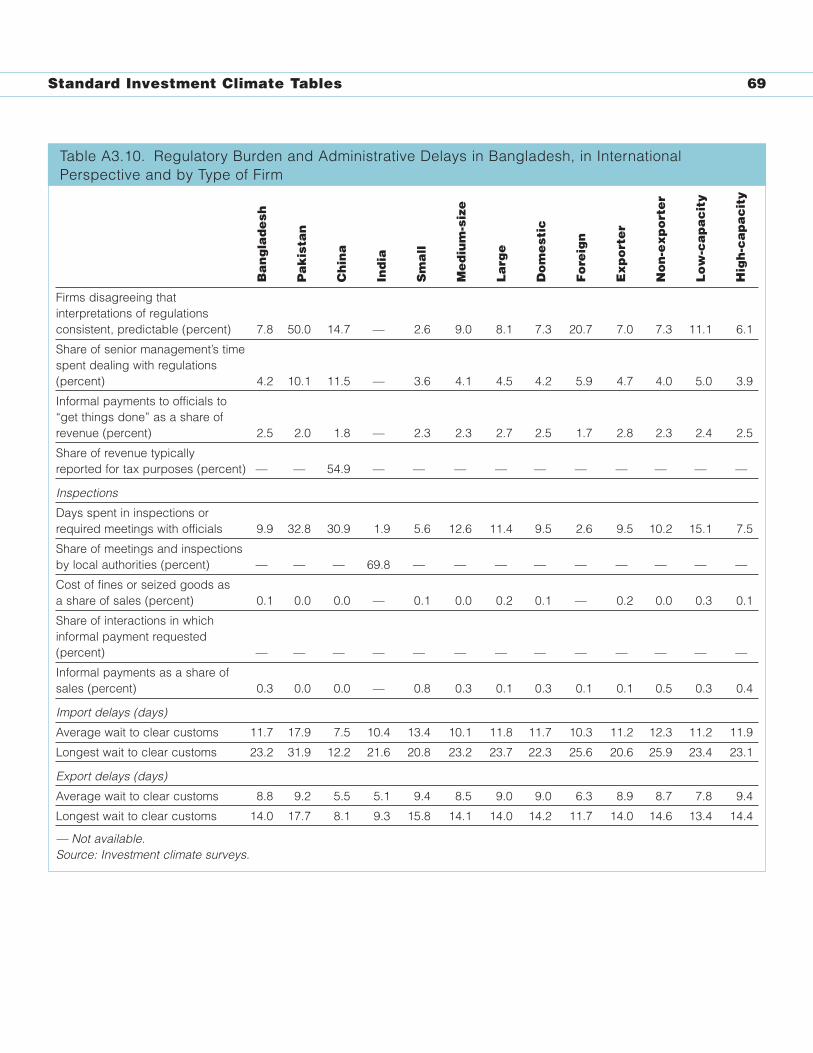
Standard Investment Climate Tables 69
Table A3.10. Regulatory Burden and Administrative Delays in Bangladesh, in InternationalPerspective and by Type of Firm
Ba
ng
lad
esh
Pa
kis
tan
Ch
ina
Ind
ia
Sm
all
Me
diu
m-s
ize
La
rge
Do
me
stic
Fo
reig
n
Ex
po
rte
r
No
n-e
xp
ort
er
Lo
w-c
ap
ac
ity
Hig
h-c
ap
ac
ity
Firms disagreeing that interpretations of regulations consistent, predictable (percent) 7.8 50.0 14.7 — 2.6 9.0 8.1 7.3 20.7 7.0 7.3 11.1 6.1
Share of senior management’s time spent dealing with regulations (percent) 4.2 10.1 11.5 — 3.6 4.1 4.5 4.2 5.9 4.7 4.0 5.0 3.9
Informal payments to officials to “get things done” as a share of revenue (percent) 2.5 2.0 1.8 — 2.3 2.3 2.7 2.5 1.7 2.8 2.3 2.4 2.5
Share of revenue typically reported for tax purposes (percent) — — 54.9 — — — — — — — — — —
Inspections
Days spent in inspections or required meetings with officials 9.9 32.8 30.9 1.9 5.6 12.6 11.4 9.5 2.6 9.5 10.2 15.1 7.5
Share of meetings and inspections by local authorities (percent) — — — 69.8 — — — — — — — — —
Cost of fines or seized goods as a share of sales (percent) 0.1 0.0 0.0 — 0.1 0.0 0.2 0.1 — 0.2 0.0 0.3 0.1
Share of interactions in which informal payment requested (percent) — — — — — — — — — — — — —
Informal payments as a share of sales (percent) 0.3 0.0 0.0 — 0.8 0.3 0.1 0.3 0.1 0.1 0.5 0.3 0.4
Import delays (days)
Average wait to clear customs 11.7 17.9 7.5 10.4 13.4 10.1 11.8 11.7 10.3 11.2 12.3 11.2 11.9
Longest wait to clear customs 23.2 31.9 12.2 21.6 20.8 23.2 23.7 22.3 25.6 20.6 25.9 23.4 23.1
Export delays (days)
Average wait to clear customs 8.8 9.2 5.5 5.1 9.4 8.5 9.0 9.0 6.3 8.9 8.7 7.8 9.4
Longest wait to clear customs 14.0 17.7 8.1 9.3 15.8 14.1 14.0 14.2 11.7 14.0 14.6 13.4 14.4
— Not available.Source: Investment climate surveys.
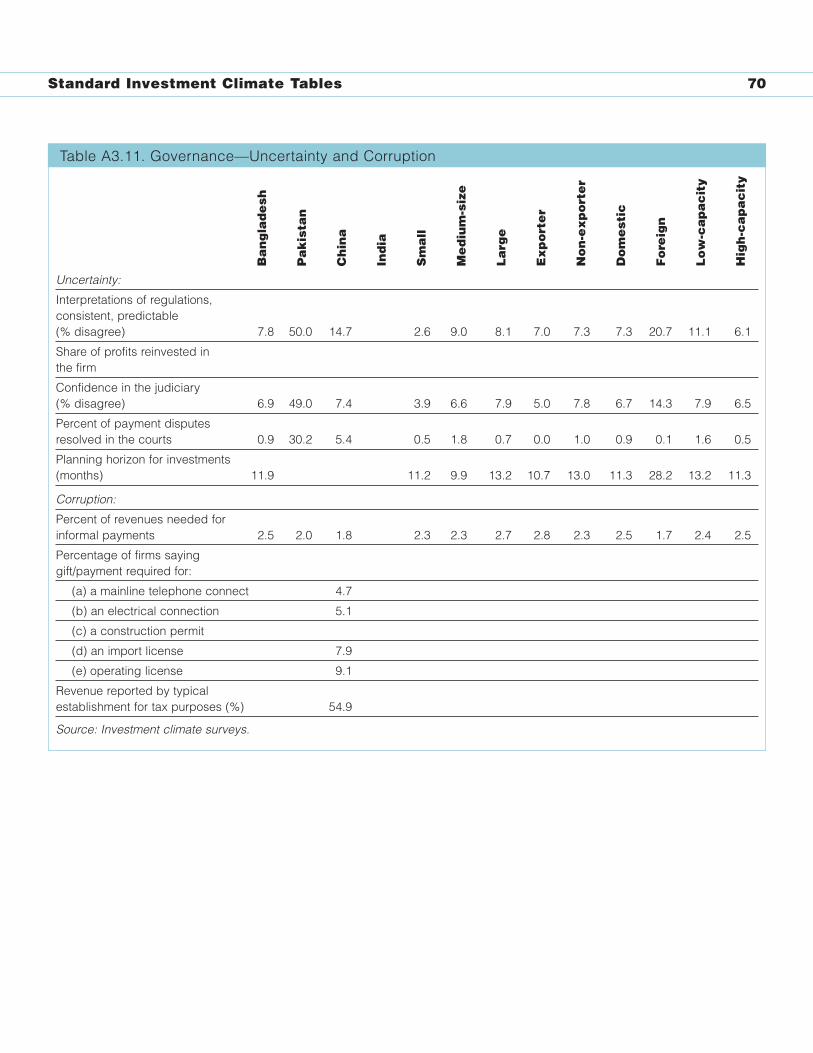
Uncertainty:
Interpretations of regulations, consistent, predictable (% disagree) 7.8 50.0 14.7 2.6 9.0 8.1 7.0 7.3 7.3 20.7 11.1 6.1
Share of profits reinvested in the firm
Confidence in the judiciary (% disagree) 6.9 49.0 7.4 3.9 6.6 7.9 5.0 7.8 6.7 14.3 7.9 6.5
Percent of payment disputes resolved in the courts 0.9 30.2 5.4 0.5 1.8 0.7 0.0 1.0 0.9 0.1 1.6 0.5
Planning horizon for investments (months) 11.9 11.2 9.9 13.2 10.7 13.0 11.3 28.2 13.2 11.3
Corruption:
Percent of revenues needed for informal payments 2.5 2.0 1.8 2.3 2.3 2.7 2.8 2.3 2.5 1.7 2.4 2.5
Percentage of firms saying gift/payment required for:
(a) a mainline telephone connect 4.7
(b) an electrical connection 5.1
(c) a construction permit
(d) an import license 7.9
(e) operating license 9.1
Revenue reported by typical establishment for tax purposes (%) 54.9
Source: Investment climate surveys.
Standard Investment Climate Tables 70
Table A3.11. Governance—Uncertainty and Corruption
Ba
ng
lad
esh
Pa
kis
tan
Ch
ina
Ind
ia
Sm
all
Me
diu
m-s
ize
La
rge
Ex
po
rte
r
No
n-e
xp
ort
er
Do
me
stic
Fo
reig
n
Lo
w-c
ap
ac
ity
Hig
h-c
ap
ac
ity
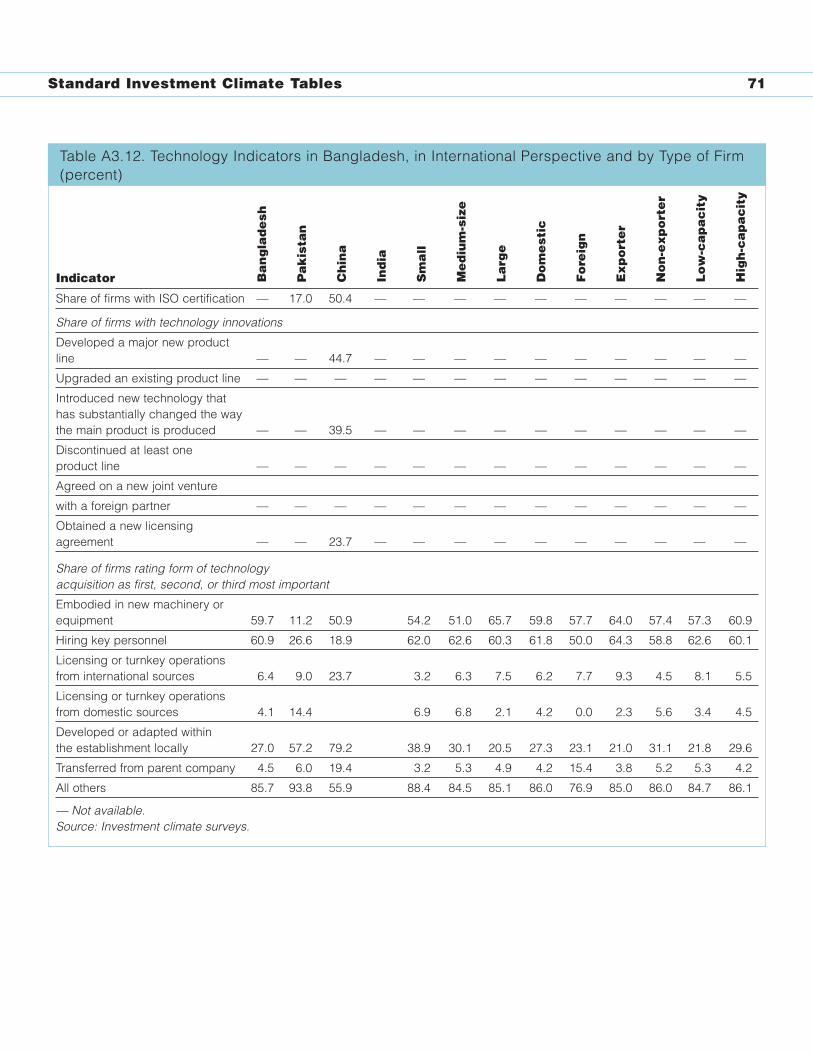
Share of firms with ISO certification — 17.0 50.4 — — — — — — — — — —
Share of firms with technology innovations
Developed a major new product line — — 44.7 — — — — — — — — — —
Upgraded an existing product line — — — — — — — — — — — — —
Introduced new technology that has substantially changed the way the main product is produced — — 39.5 — — — — — — — — — —
Discontinued at least one product line — — — — — — — — — — — — —
Agreed on a new joint venture
with a foreign partner — — — — — — — — — — — — —
Obtained a new licensing agreement — — 23.7 — — — — — — — — — —
Share of firms rating form of technology acquisition as first, second, or third most important
Embodied in new machinery or equipment 59.7 11.2 50.9 54.2 51.0 65.7 59.8 57.7 64.0 57.4 57.3 60.9
Hiring key personnel 60.9 26.6 18.9 62.0 62.6 60.3 61.8 50.0 64.3 58.8 62.6 60.1
Licensing or turnkey operations from international sources 6.4 9.0 23.7 3.2 6.3 7.5 6.2 7.7 9.3 4.5 8.1 5.5
Licensing or turnkey operations from domestic sources 4.1 14.4 6.9 6.8 2.1 4.2 0.0 2.3 5.6 3.4 4.5
Developed or adapted within the establishment locally 27.0 57.2 79.2 38.9 30.1 20.5 27.3 23.1 21.0 31.1 21.8 29.6
Transferred from parent company 4.5 6.0 19.4 3.2 5.3 4.9 4.2 15.4 3.8 5.2 5.3 4.2
All others 85.7 93.8 55.9 88.4 84.5 85.1 86.0 76.9 85.0 86.0 84.7 86.1
— Not available.Source: Investment climate surveys.
Standard Investment Climate Tables 71
Table A3.12. Technology Indicators in Bangladesh, in International Perspective and by Type of Firm(percent)
Ba
ng
lad
esh
Pa
kis
tan
Ch
ina
Ind
ia
Sm
all
Me
diu
m-s
ize
La
rge
Do
me
stic
Fo
reig
n
Ex
po
rte
r
No
n-e
xp
ort
er
Lo
w-c
ap
ac
ity
Hig
h-c
ap
ac
ity
Indicator
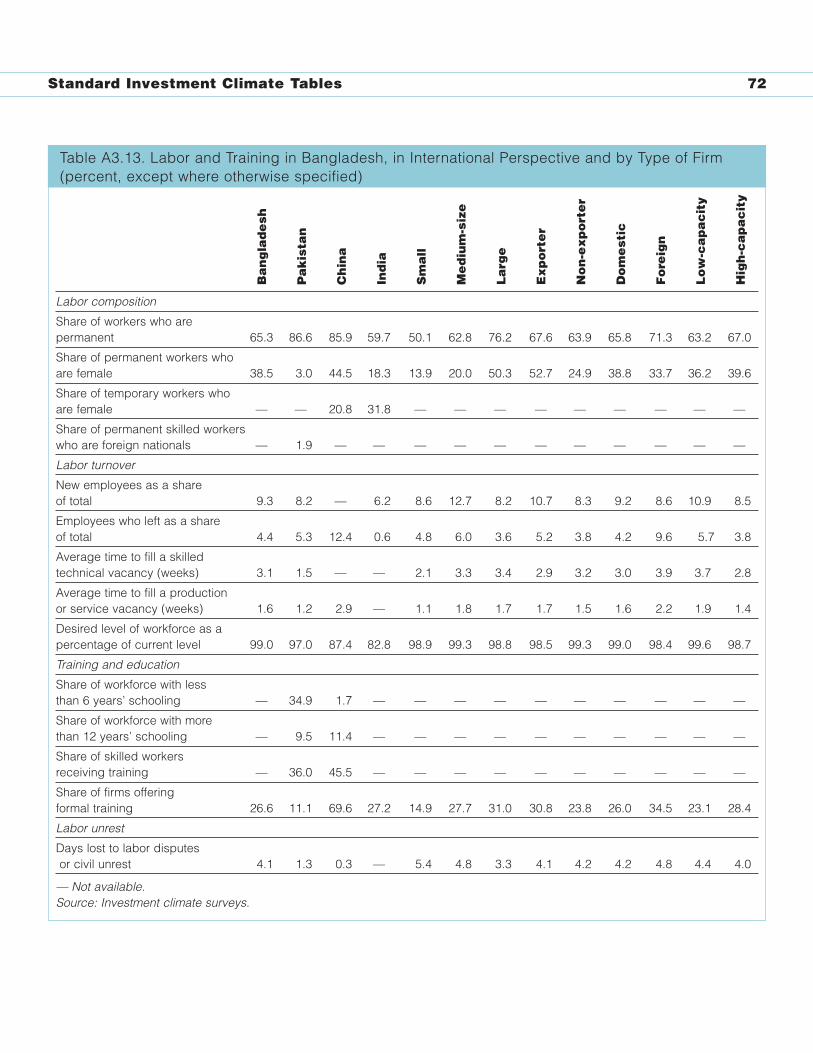
Labor composition
Share of workers who are permanent 65.3 86.6 85.9 59.7 50.1 62.8 76.2 67.6 63.9 65.8 71.3 63.2 67.0
Share of permanent workers who are female 38.5 3.0 44.5 18.3 13.9 20.0 50.3 52.7 24.9 38.8 33.7 36.2 39.6
Share of temporary workers who are female — — 20.8 31.8 — — — — — — — — —
Share of permanent skilled workers who are foreign nationals — 1.9 — — — — — — — — — — —
Labor turnover
New employees as a share of total 9.3 8.2 — 6.2 8.6 12.7 8.2 10.7 8.3 9.2 8.6 10.9 8.5
Employees who left as a share of total 4.4 5.3 12.4 0.6 4.8 6.0 3.6 5.2 3.8 4.2 9.6 5.7 3.8
Average time to fill a skilled technical vacancy (weeks) 3.1 1.5 — — 2.1 3.3 3.4 2.9 3.2 3.0 3.9 3.7 2.8
Average time to fill a production or service vacancy (weeks) 1.6 1.2 2.9 — 1.1 1.8 1.7 1.7 1.5 1.6 2.2 1.9 1.4
Desired level of workforce as a percentage of current level 99.0 97.0 87.4 82.8 98.9 99.3 98.8 98.5 99.3 99.0 98.4 99.6 98.7
Training and education
Share of workforce with less than 6 years’ schooling — 34.9 1.7 — — — — — — — — — —
Share of workforce with more than 12 years’ schooling — 9.5 11.4 — — — — — — — — — —
Share of skilled workers receiving training — 36.0 45.5 — — — — — — — — — —
Share of firms offering formal training 26.6 11.1 69.6 27.2 14.9 27.7 31.0 30.8 23.8 26.0 34.5 23.1 28.4
Labor unrest
Days lost to labor disputesor civil unrest 4.1 1.3 0.3 — 5.4 4.8 3.3 4.1 4.2 4.2 4.8 4.4 4.0
— Not available.Source: Investment climate surveys.
Standard Investment Climate Tables 72
Table A3.13. Labor and Training in Bangladesh, in International Perspective and by Type of Firm (percent, except where otherwise specified)
Ba
ng
lad
esh
Pa
kis
tan
Ch
ina
Ind
ia
Sm
all
Me
diu
m-s
ize
La
rge
Ex
po
rte
r
No
n-e
xp
ort
er
Do
me
stic
Fo
reig
n
Lo
w-c
ap
ac
ity
Hig
h-c
ap
ac
ity
References
Bangladesh, Ministry of Finance, Economic RelationsDivision. 2002. “Bangladesh: A National Strategyfor Economic Growth, Poverty Reduction andSocial Development.” Dhaka.
Bangladesh, Public Administration ReformCommission. 2000. “Report of the PublicAdministration Reform Commission.” Dhaka.
Bruno, Michael, and William Easterly. 1998. “InflationCrises and Long-Run Growth.” Journal ofMonetary Economics 41 (1): 3–26.
Centre for Policy Dialogue. 2001. “Policy Brief onIndustry and Trade.” CPD Task Force Draft Report.Dhaka.
Clarke, George R. G. 2001. “How Institutional Qualityand Economic Factors Impact TechnologicalDeepening in Developing Countries.” Journal of International Development 13 (8): 1097–119.
———. 2002. “Does Internet Connectivity AffectExport Performance? Evidence from TransitionCountries.” WIDER Discussion Paper 2002/74.United Nations University, World Institute forDevelopment Economics Research, Helsinki.
Djankov, Simeon, Rafael La Porta, Florencio López-de-Silanes, and Andrei Shleifer. 2002. “TheRegulation of Entry.” Quarterly Journal ofEconomics 117 (1): 1–37.
Dollar, David, and Aart Kraay. 2001. “Trade, Growth,and Poverty.” Finance and Development 38 (3):16–19.
———. 2002. “Growth Is Good for the Poor.” Journalof Economic Growth 7 (3): 195–225.
Easterly, William. 1999. “The Ghost of Financing Gap:Testing the Growth Model Used in the InternationalFinancial Institutions.” Journal of DevelopmentEconomics 60 (2): 423–38.
Emery, James, Melvin T. Spence, Louis T. Wells, andTimothy Buehrer. 2000. “Administrative Barriers to Foreign Investment: Reducing Red Tape
in Africa.” International Finance Corporation,Washington, D.C.
Frankel, Jeffrey, and David Romer. 1999. “Does TradeCause Growth?” American Economic Review 89(3): 379–99.
Friedman, Eric, Simon Johnson, Daniel Kaufmann,and Pablo Zoido-Lobatón. 2000. “Dodging theGrabbing Hand: The Determinants of UnofficialActivity in 69 Countries.” Journal of PublicEconomics 76 (3): 459–93.
International Monetary Fund. 2002a. “Bangladesh:Selected Issues and Statistical Appendix.”Washington, D.C.
———. 2002b. “Bangladesh: Staff Report for the 2001Article IV Consultation.” Washington, D.C.
Kaufmann, Daniel, and Aart Kraay. 2002. “Growthwithout Governance.” Economia 3 (1).[http://www.worldbank.org/wbi/governance/pubs/growthgov.htm].
Kaufmann, Daniel, Aart Kraay, and Pablo Zoido-Lobatón. 1999. “Governance Matters.” PolicyResearch Working Paper 2196. World Bank,Washington, D.C.
———. 2000. “Governance Matters, fromMeasurement to Action.” Finance andDevelopment 37 (2): 10–13.
———. 2002. “Governance Matters II: UpdatedIndicators for 2000/01.” Policy Research WorkingPaper 2772. World Bank, Washington, D.C.
Knack, Stephen, and Philip Keefer. 1995. “Institutionsand Economic Performance: Cross-Country TestsUsing Alternative Institutional Measures.”Economics and Politics 7 (3): 207–27.
Lall, Sanjaya. 2001. “Competitiveness Indices andDeveloping Countries: An Economic Evaluation ofthe Global Competitiveness Report.” WorldDevelopment 29 (9): 1501–25.
Lansbury, Melanie, and David Mayes. 1996. “Entry,Exit, Ownership and the Growth of Productivity.” InDavid Mayes, ed., Sources of Productivity Growth.Cambridge: Cambridge University Press.
References 73
Levine, Ross. 1997. “Financial Development andEconomic Growth: Views and Agenda.” Journal ofEconomic Literature 35 (2): 688–726.
Li, Wei, and Lixin Colin Xu. 2001. “Liberalization andPerformance in the Telecommunications Sectoraround the World.” World Bank, Washington, D.C.
McMillan, John, and Christopher Woodruff. 2002. “TheCentral Role of Entrepreneurs in TransitionEconomies.” Journal of Economic Perspectives 16(3): 153–70.
Recanatini, Francesca, Scott Wallsten, and Lixin ColinXu. 2000. “Surveying Surveys and QuestioningQuestions: Learning from World BankExperience.” Policy Research Working Paper2307. World Bank, Washington, D.C.
Sachs, Jeffrey D., and Andrew M. Warner. 1995.Economic Convergence and Economic Policies.NBER Working Paper 5039. Cambridge, Mass.:National Bureau of Economic Research.
Smarzynska, Beata, and Shang-Jin Wei. 2000.“Corruption and Composition of Foreign DirectInvestment: Firm-Level Evidence.” PolicyResearch Working Paper 2360. World Bank,Washington, D.C.
Stern, Nicholas. 2002a. “The Investment Climate,Governance, and Inclusion in Bangladesh.” WorldBank, Office of the Senior Vice President,Development Economics, Washington, D.C.
———. 2002b. A Strategy for Development.Washington, D.C.: World Bank.
Tybout, James. 2000. “Manufacturing Firms inDeveloping Countries: How Well Do They Do, and
Why?” Journal of Economic Literature 38 (1):11–44.
Wallsten, Scott. 2001. “An Econometric Analysis ofTelecom Competition, Privatization, andRegulation in Africa and Latin America.” Journal ofIndustrial Economics 49 (1): 1–20.
Wei, Shang-Jin. 2000. “How Taxing Is Corruption onInternational Investors?” Review of Economicsand Statistics 82 (1): 1–11.
World Bank. 1998. “Strategy for Establishing a Soundand Competitive Banking Sector.” Vol. 1.Washington, D.C.
———. 2001a. Bangladesh: A Review of PublicEnterprise Performance and Strategy.Washington, D.C.
———. 2001b. Finance for Growth: Policy Choices ina Volatile World. World Bank Policy ResearchReport. Washington, D.C.
———. 2002a. “Bangladesh—Public ExpenditureReview”. Washington, D.C.
———. 2002b. “Taming Leviathan—ReformingGovernance in Bangladesh: An InstitutionalReview.” Washington, D.C.
———. 2002c. World Development Indicators 2002.Washington, D.C.
———. 2003a. “Bangladesh—Central BankStrengthening Project.” Washington, D.C.
———. 2003b. “Bangladesh Country FrameworkReport on Infrastructure.”Washington, D.C. Draft.
———. 2003c. “Bangladesh—TelecommunicationsTechnical Assistance Project.” Washington, D.C.
World Economic Forum. 2002. GlobalCompetitiveness Report 2001/02. Geneva.
References 74