the internet’s premiere resource for unbiased reviews, news and
TRANSCRIPT

In Part 1, we explained what can go wrong with
Wi-Fi signals and how access points can work to
improve your wireless performance. It’s time for
a reality check. We throw six contenders against
65 clients and some hellish interference.
Who’s left standing?
Why your Wi-Fi SuckS and How It Can Be Helpedby William Van Winkle, July 2011
The Internet’s premiere resource for unbiased reviews, news and information on technology.

2
We took a lengthy journey through the ins and outs of Wi-Fi signals in last week’s Why Your Wi-Fi Sucks And How It Can Be Helped, Part 1, examining many of the factors that can both damage and improve signal performance. This week, it’s time to tie it all together in a real-world arena and let vying wireless technologies duke it out to the death—sometimes almost literally.
As we mentioned before, prior attempts to stage this sort of test failed because the results were too variable to be accurate. We regrouped, though, and came back with a new test setup that proved far more reliable and useful. In the image below, you see a panorama view of our test
environment. Essentially, this is an empty office environ-ment we filled with 60 Dell notebooks and nine iPad and iPad 2 tablets. We then picked five competing access points and their respective controllers (when applicable) and tested them in various scenarios. All told, the rental bill totaled about $15,000, and a testing team put in three heavy days of benchmarking time. You simply don’t see wireless inter-ference testing done at this scale in the wild.
As we suggested in the first part of this story, we’re unaware of any testing ever having been done quite like this. Our objective was to test access point performance under heavy interference conditions, and from this derive some sense of
Tom’s WLAN Test Environment

Why Your Wi-Fi Sucks and How It Can Be Helped
3
how the wireless technologies we previously examined play out in the real world. If you missed our prior article, we strongly suggest reviewing it now. Otherwise, the results we explain later may not make as much sense.
In the following pages, we’ll take a look at our access point contestants, how we tested, and analyze the test results. To give you an early hint, there turns out not to be a one-size-fits-all product. Best results will vary according to the dynamics of the access point/client arrangement. Which technologies make the most sense for your situation? Keep reading!
As you can see, we conducted two line-of-sight tests, one at 10 feet between the access point and client and another at 70 feet. The map shows desk areas and partitions within the line-of-sight path, but as you can see below, no obstructions were actually in place. A third test at 100 feet was done with a large kitchen/break area blocking the direct data path.
We had a wired side of the network, attached to which was the access point being tested. For all tests, we used an AP and whatever network infrastructure was necessary to sup-port it. For example, the Ruckus and Aruba APs used wireless controllers, while the HP and Apple did not. Attached to this was a data server running an IxChariot (version 7.1) endpoint, a program that drives data back and forth and reports results back to the console, which was running on a sepa-rate wired network node. We ran another IxChariot endpoint on the wireless client connected to the AP.
Specifically, our hardware was as follows:
Devices Under TestApple AirPort Extreme: Dual-band 802.11n (3x3:2), standalone, version 7.5.1
Aruba AP125: Dual-band 802.11n (3x3:2) with Aruba 3200 controller running ArubaOS (ver. 6.0.0.1)
Cisco Aironet 3502i: Dual-band 802.11n (2x3:2) with Cisco 4402 controller (ver. 7.0.98.0)
HP E-MSM460: Dual-band 802.11n (3x3:3) standalone running version 5.5.0.0-01-9514
Meraki MR24: Dual-band 802.11n (3x3:3) running Mer-aki Enterprise Cloud Controller
Ruckus ZoneFlex 7363: Dual-band 802.11n (2x2:2) with Ruckus ZoneDirector 1106 (version 9.1.0.0.38)
We brought in the Apple for two reasons. First, we wanted an example of a good consumer-grade router/access point as a basis for comparison against e nterprise gear, because a lot of consumers and small business people remain baffled by the massive price gap between the two groups. Second, in the last couple of router roundups we did at Tom’s Hard-ware, readers complained that we omitted Apple. Well...here you go.

4
Of these six APs, only Meraki and HP employ triple-antenna, three-stream (3x3:3) configurations. In fact, these were the only two 3x3:3 APs we were able to find on the market in time for testing. The Aruba AP125 is a fairly standard model for the company, and it’s been around for a while. Likewise, Ruckus’s 2x2:2 ZoneFlex 7363 is fairly mid-range within the company’s lineup. The Cisco 3500 is the networking titan’s current high-end AP.
We would also like to point out that most of the access points reviewed here use omnidirectional antennas, as dis-cussed extensively in our precursor to this piece. Ruckus, which we showed last time, and Meraki, shown here, are two exceptions. To the untrained eye, Meraki and Ruckus seem to use very similar designs, each employing directional antennas in an effectively circular pattern. However, Meraki is using planar inverted F antennas (PIFAs). The larger ones are for 2.4 GHz and the smaller are for 5 GHz, thus leaving only three antennas for each band. We’ll see how this spin on the circular design performs in a bit.
ClientsFor our single client, we used a Dell Latitude E6410 with the following specifications:
• Intel Core i7-620M (2.67 GHz)• 4 GB RAM• Centrino Ultimate-N 6300 (3x3:3)• Windows 7 Professional (64-bit)• Power plugged in for all tests
Each wireless test on this client was run four times, with the laptop turned 90 degrees for each instance. Throughput numbers represent an average of these four results.
For our 5 GHz interference and load tests, we used 60 Dell Vostro 3500 laptops with the following specs:
• Intel Core i3 2.27 GHz• 3 GB RAM• DW1520 Wireless-N WLAN half-mini card
(Broadcom, driver 5.60.48.35)• Windows XP Professional SP3• Power plugged in for all tests
Not least of all, we used five Apple iPad 2 tablets to better examine the impact of ultramobile devices in a mixed wire-less network. Careful readers might remember from part 1 that we noted having nine iPads and iPad 2 units—which we did. However, when push came to shove, we ended up only using data from tests featuring the five iPad 2 tablets. The remaining four iPads didn’t play into the data we even-tually recorded in order to have consistent client antenna designs. At least they made for impressive photography.
We debated for some time over whether to run the bulk of our tests on 2.4 GHz or 5.0 GHz and ultimately sided with the latter for two reasons. First, while most consumer products are clearly using 2.4 GHz, enterprises are now transition-ing to 5 GHz on new roll-outs because of it is the less-used band. In testing predominantly enterprise-class equipment, we wanted to use today’s best of breed spectrum, and right now that means 5 GHz. There is simply far less traffic in that
Ruckus puts forth the best effort in the largest number of tests, but it does so with a mere 2x2:2 design through engineering and deep attention to the factors necessary to provide a high-quality wireless experience in increasingly hostile RF conditions.
iPad running IxChariot
60 laptops and 5 Apple iPad 2 tablets
Why Your Wi-Fi Sucks and How It Can Be Helped
5
band, which means (in general) better client performance. Second, you’re seeing increasing numbers of dual-band rout-ers and access points appearing in the consumer space as ven-dors bring their higher-end technologies to the mainstream. Ultimately, as Wayne Gretzky would say, we decided to tar-get where the puck is going, not where it has been.
For 2.4 GHz testing, we placed all devices on channel 1. For 5 GHz, we went with channel 36.
In our 5 GHz interference testing, interference and adverse contention conditions were generated by the 60 Dell clients all connecting to an AP mounted to the ceiling roughly above the middle of the client cluster. In the corner of our office space, shown by the green dot on the previous envi-ronment map, we mounted the AP being tested to the ceil-ing. Thus we had two discrete wireless LANs, the small one (single client and AP under test) having to function in the face of 61 interfering Wi-Fi devices. In effect, this setup is like two people trying to have a normal conversation on a patio overlooking an adjacent open-air rock concert. We wanted two separate WLANs in order to isolate interfer-ence as our main variable, not interference and client load.
For our 2.4 GHz tests, we wanted a worst-case scenario, so we combined a 100-foot client-to-AP distance, plus obstructed line-of-sight, plus having a non-Wi-Fi RF noise generator
placed right on the spot where our client sat for the 70-foot 5 GHz tests. This raises an interesting point from our part 1 discussion about the difference between types of interfer-ence and their impact on communication performance.
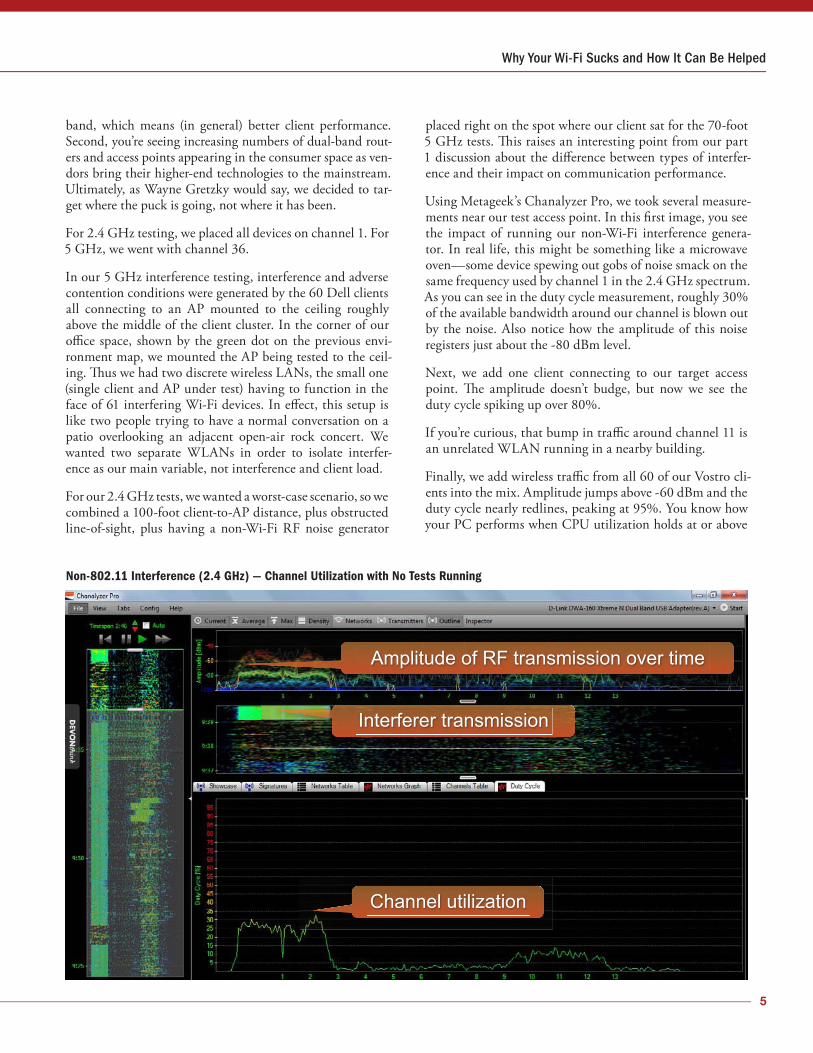
Using Metageek’s Chanalyzer Pro, we took several measure-ments near our test access point. In this first image, you see the impact of running our non-Wi-Fi interference genera-tor. In real life, this might be something like a microwave oven—some device spewing out gobs of noise smack on the same frequency used by channel 1 in the 2.4 GHz spectrum. As you can see in the duty cycle measurement, roughly 30% of the available bandwidth around our channel is blown out by the noise. Also notice how the amplitude of this noise registers just about the -80 dBm level.
Next, we add one client connecting to our target access point. The amplitude doesn’t budge, but now we see the duty cycle spiking up over 80%.
If you’re curious, that bump in traffic around channel 11 is an unrelated WLAN running in a nearby building.
Finally, we add wireless traffic from all 60 of our Vostro cli-ents into the mix. Amplitude jumps above -60 dBm and the duty cycle nearly redlines, peaking at 95%. You know how your PC performs when CPU utilization holds at or above
Non-802.11 Interference (2.4 GHz) — Channel Utilization with No Tests Running

6
Non-802.11 Interference (2.4 GHz) — Channel Utilization During Single Client Performance Tests
802.11 Co-Channel Interference (5 GHz) — Channel Capacity During Multi Client Performance Tests

Why Your Wi-Fi Sucks and How It Can Be Helped
7
90%? Imagine something analogous with Wi-Fi contention. Refer back to our contention discussion in part 1 and con-sider how common it would be for packets to require resend-ing over and over in such an environment. How the access point deals with this situation will be critical in determining the end-user’s experience.
Before we delve into any hard testing, we felt it was impor-tant to give a sense of wireless coverage from each of our six access points. You’ve seen where the laptop systems are located within our environment. If we were running a normal office, the logical placement of the access point would be directly above the middle of our 60-cli-ent cluster (which is where we mounted our second access point, not the unit under test, during interference testing). So, to get an idea of how well each access point might serve such an environment in terms of coverage, we worked with commercial wireless solutions provider Connect802 to perform a thorough site survey for all six APs.
With a test notebook strapped into a harness and running AirMagnet Survey Professional Edition, our Connect802 technician made six complete walking tours of our office area. In the following images, you can see the path he walked marked by the little red arrows on each map.
We did make one modification from the software’s default setting. When our Connect802 specialist men-tioned that an access point would need a roughly -70 to -75 dBm sig-nal in order to hold a usable Wi-Fi connection, we had the technician change the color scale on his maps such that light blue hits at -75 dBm and light blue/green is at -70 dBm. This way, you can assume that green shading (and on into the stronger
yellow and red zones) represents a dependable Wi-Fi signal.
In the 2.4 GHz range, HP clearly fares worst. Kudos to Apple for making a fairly equivalent showing to Aruba, Cisco, and Meraki, although note how Apple, Aruba, and Meraki all have one quirky dead spot in each of their decent
Wi-Fi Signal Heat Maps: 2.4 GHz

8
coverage areas. Cisco and Ruckus do not share this problem. In terms of green coverage to the building’s far wall, Ruckus provides the most coverage.
With 5 GHz mapping, this second verse runs very similar to the first, only this time we’d give the nod to Cisco for hav-ing the most -70 dBm or better coverage. With its longer wavelengths, 2.4 GHz is known to be somewhat more pen-etrating and long-reaching than 5 GHz. Either way, though,
such maps are essential when deploying wireless coverage across a broad area because you have to know how many APs you’ll need to service your users. Better coverage is one of the factors that lead to purchasing fewer APs.
We begin with the single-client downlink test at 5 GHz with a 10-foot line-of-sight distance. HP handily trounces the field here, thanks to its triple-stream capability. Given that, it’s not surprising that Meraki comes in second place.
Downlink TCP Performance at 10’ LoSOne 5 GHz client
Meraki 24
Aruba 125
Ruckus 7363
Apple Extreme
Cisco 3500
140 150 160
Mb/s170 180
169.52
166.25
161.45
156.03
152.42
Uplink TCP Performance at 10’ LoSOne 5 GHz client
Meraki 24
Aruba 125
Ruckus 7363
HP 460
Apple Extreme
Cisco 3500
Mb/s0 10 20 30 40 50 60 70 80 90 100 110 120 130140 150160 170
157.47136.55
129.51128.47
126.15113.68
Wi-Fi Signal Heat Maps: 2.4 GHz

Why Your Wi-Fi Sucks and How It Can Be Helped
9
These are the only two APs able to leverage all three of the client’s potential streams.
In the 10-foot uplink test, Meraki soars out to 157 Mb/s, leaving the next four contenders clustered around 130 Mb/s and Cisco bringing up the rear at 114 Mb/s. Why would the triple-stream HP fall back into the pack here? We don’t have a good explanation. Theoretically, it should have done bet-ter. Our only explanation would be that perhaps HP has a somewhat asymmetrical orientation in its omnidirectional antennas. This might explain the lag we see, as well as the jump witnessed on the next page—if the client happened to fall in a sweet spot for that AP’s signal.
After all of the many optimizations we discussed in part 1, why doesn’t Ruckus sweep the field and win here? Because in all wireless approaches, there are compromises. Ruckus APs are designed for adaptability. Keep in mind that the AP being tested doesn’t know its distance from the client. It only senses signal strength. So, if an AP is programmed to keep continually searching for a better pattern, it’s going to spend resources essentially saying, “Can I hear you bet-ter this way? Nope, so I’ll go back to how I was. Well, how
about this way? Nope, back again. How about...?” At such close range, there’s only one best path: direct line-of-sight. Attempting to optimize to anything else is only going to hamper performance, but Ruckus keeps trying. That’s the trade-off. Additionally, the benefits of single-antenna beam-forming and signal steering vanish in such close quarters.
Does it need to be said that anything over 100 Mb/s is a very respectable result for 802.11n? Still, we have a roughly 30% variance from low (HP) to high (Ruckus) here, so obviously something is afoot if both three-stream APs are trailing the two-stream Ruckus. Meraki puts on a good show in second place, but HP now comes in last. This may be a case of the AP’s inability to maintain all three diverse streams.
Imagine standing in an open field trying to run three streams with spatial multiplexing. It wouldn’t work, right? There’s nothing to bounce those secondary signals off of. The only stream available is the direct line-of-sight between the AP and client. To some degree, that principle may be influencing these results. If the HP can’t effectively utilize
the nearby walls and other objects to sustain three reliable streams, then it may have to drop down to two streams, or even one (we suspect two in this case). Meanwhile, the dif-ference between 10 feet and 70 is huge for Ruckus, which can now bring its arsenal of transmit/receive options to bear on the current conditions. Again, note Cisco’s 10% boost here over the herd with only two streams.
Here’s some definite weirdness. While it’s not unusual for uplink speeds to trail downlinks, both Aruba and HP show improvements. We haven’t ruled out some sort of fluke sweet spot that affected both APs, but the odds of this explanation being correct seem small.
We should also inquire about the more than 45 Mb/s differ-ence between Ruckus’s uplink and downlink speeds. Most likely, the answer lies in the nature of beamforming. Beam-forming has to do with transmitting, not receiving. The beamforming access point can control how it sends out sig-nals, but it has no control over how signals send from the client device.
Said differently, you can cup your hands behind your ears, but you can’t tell someone else how loudly to talk or whether to make a tube out of their hands. At the beginning of part 1, we mentioned the radical difference it made when we switched a netbook from a Cisco 802.11n dongle and AP to a Ruckus Wi-Fi bridge. Part of the reason for this is because both sides of the wireless connection were using the same adaptive technology. Both adapters were using all of those spatial multiplexing, polarization, and other tricks (not to mention working on 5 GHz rather than 2.4 GHz) to get an
Downlink TCP Performance at 70’ LoSOne 5 GHz client
Ruckus 7363
Meraki 24
Cisco 3500
Aruba 125
Apple Extreme
HP 460
Mb/s
0 10 20 30 40 50 60 70 80 90 100 110 120 130 140 150
136.11
114.70
113.68
103.45
103.33
101.69
Uplink TCP Performance at 70’ LoSOne 5 GHz client
HP 460
Aruba 125
Cisco 3500
Apple Extreme
Ruckus 7363
Meraki 24
Mb/s0 10 20 30 40 50 60 70 80 90 100 110 120
112.86
108.23
100.44
97.43
89.63
82.90

10
optimal connection in both directions. Obviously, though, we had to settle on a single client adapter that would best represent what people would be using in an average high-demand environment.
Now we get to the fun stuff. If there was ever a question whether nearby devices could cause interference with your own Wi-Fi connection, these tests should prove the answer. Compare the 102 to 136 Mb/s seen on the prior page’s no-interference downlink tests with these numbers. HP, Cisco, and Aruba hold up fairly well, only giving up 30 or 40 Mb/s. Meraki and Apple are simply crushed.
Uplink performance in the face of 61 interfering devices tells the same story, only worse. Apple manages to limp along and complete the test. Meraki simply rolls over and gives up part-way through the test run.
In these circumstances, Ruckus’ adaptability can come into full play. Beamforming, spatial multiplexing, polarization diversity, and all the rest assist with the downlink. If noth-ing else, the ability to ignore interference through the use of directional antennas (see part 1, page 16) clearly benefits Ruckus’ uplink performance.
Again, pinpointing exact reasons why this or that access point falls on its face would be largely speculative. We could mention that Apple and Meraki are the two least-expensive APs in our group, and maybe the “you get what you pay for” principle is dominating these results. After all, whatever the marketing bullet points say, you don’t get a luxury sedan for the price of an econobox.
Moreover, you might be starting to see a pattern here with Cisco. Like Ruckus, Cisco suffers at short range, but at lon-ger distances, Cisco performs well, even against a storm of interference. Clearly, Cisco put a lot of attention into refin-ing its receive sensitivity, which would explain the 3502i’s second-place showing in our uplink test here.
We wanted to test our five access points under worst-case conditions, which is where our 100-foot, non-line-of-sight test comes in. We also used this test to switch everything over to 2.4 GHz—again, in search of a worst-case scenario.
Without interference, Meraki rejoins the race and performs very well, perhaps somehow managing to bring all three of its streams to bear on the distance and obstructions. HP can’t
TCP Downlink Performance with Interference at 70’ LoS
One 5 GHz client with 60 interfering clients
Ruckus 7363
Aruba 125
HP 460
Cisco 3500
Apple Extreme
Meraki 24
Mb/s
95908580757065605550454035302520151050
88.55
67.93
67.81
56.30
17.76
10.27
TCP Uplink Performance with Interference at 70’ LoS
One 5 GHz client with 60 interfering clients
Ruckus 7363
Cisco 3500
HP 460
Aruba 125
Apple Extreme
Meraki 24
Mb/s
8580757065605550454035302520151050
78.89
48.11
37.53
24.82
2.15
0.50
TCP Downlink Performance 100’ No LoS
One 2.4 GHz client with no interference
Ruckus 7363
Meraki 24
Cisco 3500
HP 460
Aruba 125
Apple Extreme
Mb/s
8580757065605550454035302520151050
76.26
51.85
38.37
35.28
33.81
27.34
TCP Uplink Performance 100’ No LoS
One 2.4 GHz client with no interference
Ruckus 7363
Meraki 24
Cisco 3500
Apple Extreme
HP 460
Aruba 125
Mb/s
95908580757065605550454035302520151050
88.55
69.11
48.11
42.14
37.53
32.94
Why Your Wi-Fi Sucks and How It Can Be Helped
11
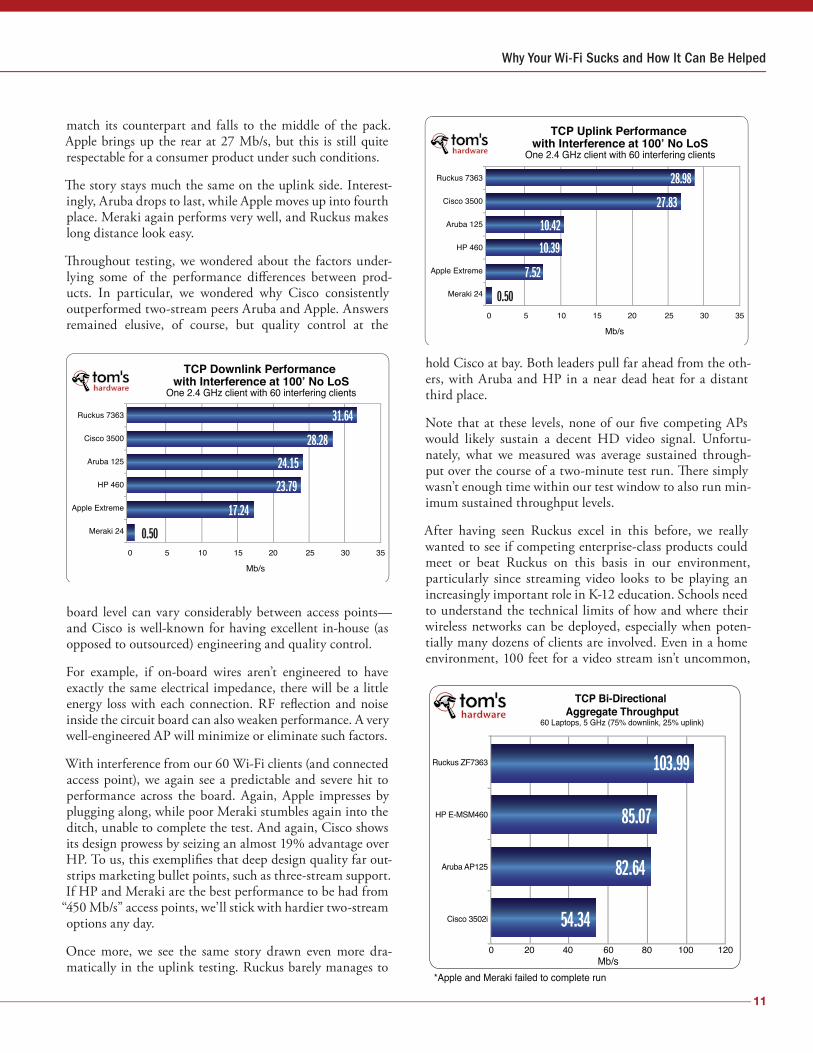
match its counterpart and falls to the middle of the pack. Apple brings up the rear at 27 Mb/s, but this is still quite respectable for a consumer product under such conditions.
The story stays much the same on the uplink side. Interest-ingly, Aruba drops to last, while Apple moves up into fourth place. Meraki again performs very well, and Ruckus makes long distance look easy.
Throughout testing, we wondered about the factors under-lying some of the performance differences between prod-ucts. In particular, we wondered why Cisco consistently outperformed two-stream peers Aruba and Apple. Answers remained elusive, of course, but quality control at the
board level can vary considerably between access points—and Cisco is well-known for having excellent in-house (as opposed to outsourced) engineering and quality control.
For example, if on-board wires aren’t engineered to have exactly the same electrical impedance, there will be a little energy loss with each connection. RF reflection and noise inside the circuit board can also weaken performance. A very well-engineered AP will minimize or eliminate such factors.
With interference from our 60 Wi-Fi clients (and connected access point), we again see a predictable and severe hit to performance across the board. Again, Apple impresses by plugging along, while poor Meraki stumbles again into the ditch, unable to complete the test. And again, Cisco shows its design prowess by seizing an almost 19% advantage over HP. To us, this exemplifies that deep design quality far out-strips marketing bullet points, such as three-stream support. If HP and Meraki are the best performance to be had from
“450 Mb/s” access points, we’ll stick with hardier two-stream options any day.
Once more, we see the same story drawn even more dra-matically in the uplink testing. Ruckus barely manages to
hold Cisco at bay. Both leaders pull far ahead from the oth-ers, with Aruba and HP in a near dead heat for a distant third place.
Note that at these levels, none of our five competing APs would likely sustain a decent HD video signal. Unfortu-nately, what we measured was average sustained through-put over the course of a two-minute test run. There simply wasn’t enough time within our test window to also run min-imum sustained throughput levels.
After having seen Ruckus excel in this before, we really wanted to see if competing enterprise-class products could meet or beat Ruckus on this basis in our environment, particularly since streaming video looks to be playing an increasingly important role in K-12 education. Schools need to understand the technical limits of how and where their wireless networks can be deployed, especially when poten-tially many dozens of clients are involved. Even in a home environment, 100 feet for a video stream isn’t uncommon,
TCP Downlink Performance with Interference at 100’ No LoS
One 2.4 GHz client with 60 interfering clients
Ruckus 7363
Cisco 3500
Aruba 125
HP 460
Apple Extreme
Meraki 24
Mb/s
35302520151050
31.64
28.28
24.15
23.79
17.24
0.50
TCP Uplink Performance with Interference at 100’ No LoS
One 2.4 GHz client with 60 interfering clients
Ruckus 7363
Cisco 3500
Aruba 125
HP 460
Apple Extreme
Meraki 24
Mb/s
35302520151050
28.98
27.83
10.42
10.39
7.52
0.50
*Apple and Meraki failed to complete run
Ruckus ZF7363
HP E-MSM460
Aruba AP125
Cisco 3502i
TCP Bi-Directional Aggregate Throughput
60 Laptops, 5 GHz (75% downlink, 25% uplink)
Mb/s20 40 60 80 100 1200
103.99
85.07
82.64
54.34

12
although the amount of interference likely to be encoun-tered by consumers should be less than we inflicted here.
In a modern tech enthusiast’s home, it’s not unthinkable that there could be a dozen Wi-Fi devices connecting to a single access point. Just counting laptops and smartphones, how many devices there are connecting at your local coffee shop? Imagine how many there would be in a school gym-nasium for a community event or a corporate board room for an all-hands executive meeting. Having 60 notebooks connect to a single AP, all of them running bi-directional traffic concurrently, isn’t far-fetched. How well a given AP performs under such conditions not only determines the quality of the end-user’s experience, but also how many APs
an organization has to buy to handle an anticipated load in a given area.
Here we get our first look at how our APs stack up when get-ting hammered by 60 laptop clients. Trying to reflect a real-istic usage scenario, we settled on the ratio of 75% downlink and 25% uplink traffic. Only four APs survived the test.
We know from our first results that optimal throughput for one client is in the 160 to 170 Mb/s range. You’ll get a sense from the iPad data coming up shortly how aggre-gate throughput increases for multiple, concurrent clients. But there are limits. Any given AP can only handle so much traffic before it starts to strain under the load. Even
Aggregate Throughput (TCP Downlink)60 Laptops
(Simultaneous downloads of 1MB file)
Elapsed time (h:mm:ss)
147.00140.00
120.00
100.00
80.00
60.00
40.00
20.00
0.000:00:00 0:00:20 0:00:40 0:01:00 0:01:20 0:01:40 0:01:50
*failed to complete test runs
Mbp
s
Throughput
Ruckus 7363: 111.10 Mbit/s
HP E-MSM460: 88.41 Mbit/s
Aruba AP125: 76.42 Mbit/s
Meraki MR24: 48.68 Mbit/s*Cisco 3502i: 38.17 Mbit/s
AirPort Extreme: 3.83 Mbit/s*
147.00140.00
120.00
100.00
80.00
60.00
40.00
20.00
0.000:00:00 0:00:20 0:00:40 0:01:00 0:01:20 0:01:40 0:01:50
Aggregate Throughput (TCP Uplink)60 Laptops
(Simultaneous downloads of 1MB file)
Elapsed time (h:mm:ss)
115.50110.00
100.00
90.00
80.00
70.00
60.00
50.00
40.00
20.00
10.00
30.00
0.000:00:00 0:00:20 0:00:40 0:01:00 0:01:20 0:01:40 0:01:50
*failed to complete test runs
Mbp
s
Throughput
Ruckus 7363: 95.59 Mbit/s
HP E-MSM460: 76.81 Mbit/sAruba AP125: 68.76 Mbit/s
Meraki MR24: 41.98 Mbit/s*
Cisco 3502i: 61.81 Mbit/sAirPort Extreme: 53.75 Mbit/s

Why Your Wi-Fi Sucks and How It Can Be Helped
13
when we compared aggregate performance of one note-book against ten, Ruckus, Aruba, and HP only showed a 10% to 20% total throughput gain for the notebook group. The aggregate performance for Apple and Meraki actually dropped substantially, already forced to their knees by just ten clients.
Sixty laptops, all transferring 1 MB test files repeatedly, is a pretty heavy burden—too heavy for Apple and Meraki to sustain. Let’s take a closer look at the actual IxChariot data to see what’s really happening.
One of the qualities to look for in an access point or router is the consistency of its connections. When viewed in terms of throughput over time, you don’t want a lot of crazy peaks and troughs. You want users to have a stable connec-tion speed, and the floor of the throughput range is at least equally important. Consider the impact on playback of a 10 Mb/s video stream when 15 Mb/s of average throughput keeps dipping down into the 3 to 5 Mb/s range.
Cisco’s flat download range here looks outstanding. The problem is that it’s so low. Incredibly, both Cisco and Apple fare far better on uplink performance than downlink, no doubt because there’s far less uplink traffic.
Ruckus offers the flattest, highest results across both data sets, with HP and Aruba both putting in impressive show-ings. Poor Apple’s chart is almost comical, like it managed a single downlink heartbeat before passing into the great beyond. Meraki at least flopped about in cardiac arrest for a while.
Now that we know how laptops perform in aggregate, how about the tablets rising up in the market to replace many of them? This is why we brought our assortment of iPads and iPad 2s into the fray.
The bad news with the iPad 2 is that it’s a poky performer. The good news is that it is reliably poky under even terri-ble conditions. The following images use the same AP color scheme we employed on the prior page. Surprisingly, Cisco turns out to be the laggard of the group at roughly 10 Mb/s, but everyone else packs into that tight 12 to 14 Mb/s band.
If aggregate performance scaled perfectly, we’d see five iPad 2s topping out around 60 Mb/s. Instead, our best-perform-ing APs in this test peak just over 40 Mb/s. Cisco seems to hover around the 28 Mb/s mark.
As we look back, we see that even a mid-range laptop blows the iPad 2 away on Wi-Fi speed, thanks in part to having three antennas instead of one. Maybe this is an unfair com-parison because the expected usage for both device types is very different. Still, it’s reasonable to expect that tablets will continue to gain market traction and seek to take on new, more demanding applications as they evolve. Obvi-ously, wireless capabilities in tablets are not keeping pace with processor and graphics improvements, and this needs to change—quickly.
More to the point of this article, having an AP able to make the best of underperforming devices is only going to become more important as we continue to move away from larger systems (desktops and notebooks) into handheld
Single iPad2 vs. LaptopTCP Throughput
(5 GHz, 70’ LoS)Throughput
Mbp
s
Elapsed time (h:mm:ss)
136.50
100.00
80.00
60.00
40.00
20.00
0.000:00:00
LaptopsiPads
0:01:00
120.00
5 iPad2s vs. 5 LaptopsAggregate TCP Throughput
(5 GHz, 70’ LoS)Throughput
Mbp
sElapsed time (h:mm:ss)
147.00140.00
100.00
80.00
60.00
40.00
20.00
0.000:00:00
LaptopsiPads
0:01:00
120.00

14
Aggregate Throughput (TCP Downlink)Single iPad 2
(Simultaneous downloads of 1MB file)Throughput
Elapsed time (h:mm:ss)Not all results are graphed
Mbp
s
17.850
16.000
14.000
12.000
10.000
8.000
6.000
4.000
2.000
0.0000:00:00 0:00:10 0:00:20 0:00:30 0:00:40 0:00:50 0:01:00
Aggregate Throughput (TCP Downlink)Five x iPad 2
(Simultaneous downloads of 1MB file)Throughput
Elapsed time (h:mm:ss)Not all results are graphed
Mbp
s
47.25044.000
40.000
36.000
32.000
28.000
24.000
20.000
16.000
12.000
8.000
4.000
0.0000:00:00 0:00:10 0:00:20 0:00:30 0:00:40 0:00:50 0:01:00
Why Your Wi-Fi Sucks and How It Can Be Helped
15
client devices and their scaled-back wireless capabilities. Smartphones have even smaller single antennas than the iPad. And remember from part 1, page 6 how airtime fair-ness works. If you allow those slow handhelds on your WLAN without airtime fairness implemented at the access point, those devices will significantly drag down the per-formance of larger, faster systems. Our next page illustrates this dramatically.
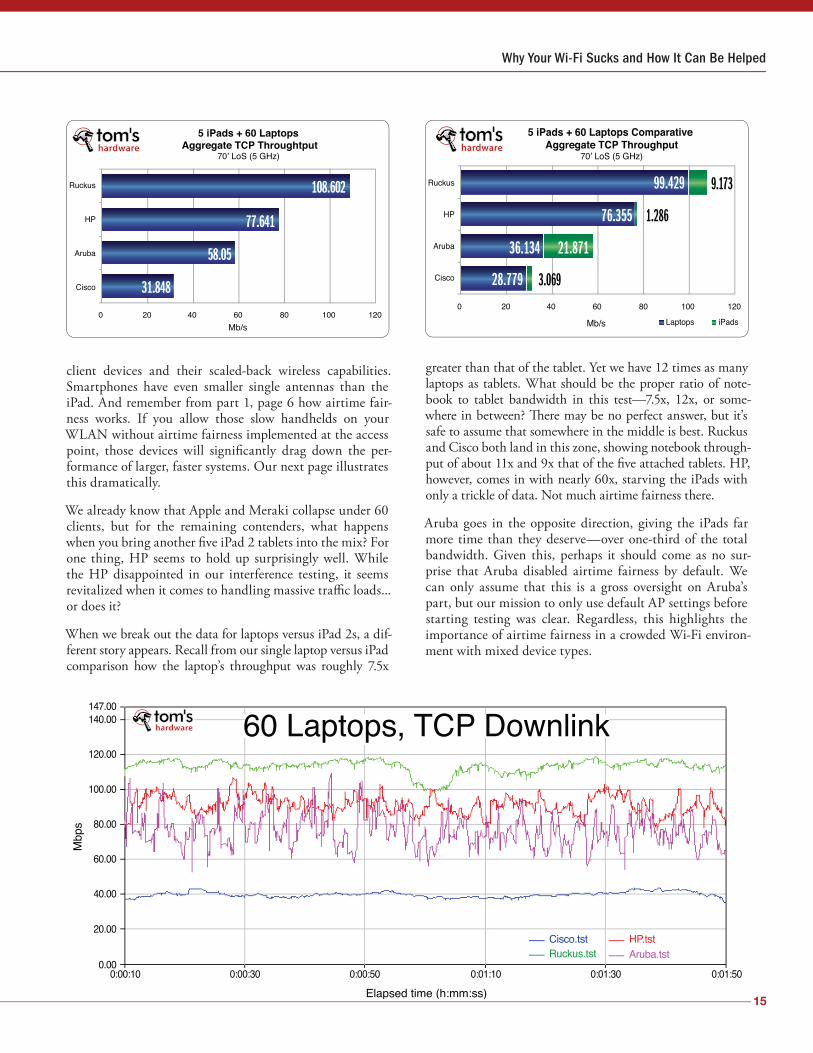
We already know that Apple and Meraki collapse under 60 clients, but for the remaining contenders, what happens when you bring another five iPad 2 tablets into the mix? For one thing, HP seems to hold up surprisingly well. While the HP disappointed in our interference testing, it seems revitalized when it comes to handling massive traffic loads...or does it?
When we break out the data for laptops versus iPad 2s, a dif-ferent story appears. Recall from our single laptop versus iPad comparison how the laptop’s throughput was roughly 7.5x
greater than that of the tablet. Yet we have 12 times as many laptops as tablets. What should be the proper ratio of note-book to tablet bandwidth in this test—7.5x, 12x, or some-where in between? There may be no perfect answer, but it’s safe to assume that somewhere in the middle is best. Ruckus and Cisco both land in this zone, showing notebook through-put of about 11x and 9x that of the five attached tablets. HP, however, comes in with nearly 60x, starving the iPads with only a trickle of data. Not much airtime fairness there.
Aruba goes in the opposite direction, giving the iPads far more time than they deserve—over one-third of the total bandwidth. Given this, perhaps it should come as no sur-prise that Aruba disabled airtime fairness by default. We can only assume that this is a gross oversight on Aruba’s part, but our mission to only use default AP settings before starting testing was clear. Regardless, this highlights the importance of airtime fairness in a crowded Wi-Fi environ-ment with mixed device types.
5 iPads + 60 Laptops Aggregate TCP Throughtput
70’ LoS (5 GHz)
Ruckus
HP
Aruba
Cisco
0 20 40 60 80 100 120
108.602
77.641
58.05
31.848
Mb/s
5 iPads + 60 Laptops Comparative Aggregate TCP Throughput
70’ LoS (5 GHz)
Ruckus
HP
Aruba
Cisco
0 20 40 60 80 100
Laptops iPads
120
99.429
76.355
36.134
28.779
21.871
9.173
1.286
3.069
Mb/s
147.00140.00
120.00
100.00
80.00
60.00
40.00
20.00
0.000:00:10 0:00:30 0:00:50 0:01:10 0:01:30
Cisco.tstRuckus.tst
0:01:50
Elapsed time (h:mm:ss)
60 Laptops, TCP Downlink
Mbp
s
HP.tstAruba.tst

16
Just to make this airtime fairness point even more explicit, let’s dig into a further breakdown of access point perfor-mance. Going back to our 60-laptop downlink tests, the original throughput chart of the four survivors looks like this in IxChariot:
As we saw in the bar graphs, Ruckus tops the field, HP and Aruba battle for runner-up, and Cisco pulls along slow but steady around 40 Mb/s. The extra insight you get here is that HP demonstrates a tighter bandwidth range than its Aruba counterpart, making it an even better choice between the pair.
Now look at how these four APs divide up their bandwidth on a per-client basis.
Cisco and Ruckus both do excellent jobs at making sure each client gets a fairly equal slice of the available band-width. HP does fairly even work, save for that one 9.4% slice. Aruba, which did not have airtime fairness enabled, slips even further, giving over 20% of the bandwidth pie to only two clients, leaving that much less for the other 58.
But even Aruba’s favoritism can be overlooked in the face of Meraki’s egregious, haphazard allocations. We ran a
Aruba Cisco
HP Ruckus
0.7% Pair 10.6% Pair 31.5% Pair 50.9% Pair 70.6% Pair 90.7% Pair 110.9% Pair 130.4% Pair 161.3% Pair 181.1% Pair 200.7% Pair 220.6% Pair 241.7% Pair 261.5% Pair 281.4% Pair 302.4% Pair 321.3% Pair 341.7% Pair 362.3% Pair 387.6% Pair 401.3% Pair 421.3% Pair 441.4% Pair 463.0% Pair 481.3% Pair 501.8% Pair 5213.9% Pair 540.9% Pair 562.0% Pair 580.9% Pair 60
1.2% Pair 11.7% Pair 32.2% Pair 52.1% Pair 71.4% Pair 91.1% Pair 111.4% Pair 131.2% Pair 151.1% Pair 171.4% Pair 192.2% Pair 211.5% Pair 231.3% Pair251.7% Pair 271.6% Pair 291.6% Pair 311.3% Pair 332.1% Pair 351.7% Pair 371.4% Pair 391.4% Pair 411.3% Pair 431.0% Pair 451.0% Pair 473.4% Pair 493.0% Pair 511.7% Pair 531.3% Pair 551.3% Pair 571.1% Pair 59
1.2% Pair 21.2% Pair 41.5% Pair 61.1% Pair 81.2% Pair 101.4% Pair 121.5% Pair 141.0% Pair 161.5% Pair 181.5% Pair 201.4% Pair 221.7% Pair 241.5% Pair 261.0% Pair 281.6% Pair 301.6% Pair 329.1% Pair 342.1% Pair 361.7% Pair 382.0% Pair 401.5% Pair 421.5% Pair 441.3% Pair 461.4% Pair 482.2% Pair 501.6% Pair 521.8% Pair 541.3% Pair 561.7% Pair 581.1% Pair 60
2.1% Pair 10.9% Pair 31.9% Pair 51.0% Pair 71.6% Pair 90.5% Pair 111.0% Pair 131.8% Pair 151.8% Pair 172.2% Pair 192.1% Pair 210.7% Pair 231.9% Pair 251.8% Pair 272.2% Pair 292.1% Pair 312.1% Pair 331.1% Pair 351.6% Pair 372.1% Pair 391.3% Pair 411.0% Pair 431.3% Pair 450.8% Pair 472.1% Pair 492.1% Pair 512.2% Pair 531.3% Pair 552.0% Pair 571.8% Pair 59
2.2% Pair 22.0% Pair 42.0% Pair 62.1% Pair 81.8% Pair 101.3% Pair 122.1% Pair 142.2% Pair 161.9% Pair 182.0% Pair 202.2% Pair 221.9% Pair 241.3% Pair 260.4% Pair 281.8% Pair 300.2% Pair 322.0% Pair 342.2% Pair 361.6% Pair 382.3% Pair 401.2% Pair 422.2% Pair 441.6% Pair 462.3% Pair 481.0% Pair 502.2% Pair 522.1% Pair 541.1% Pair 560.7% Pair 581.7% Pair 60
1.5% Pair 11.0% Pair 31.5% Pair 51.8% Pair 71.7% Pair 91.3% Pair 111.5% Pair 131.1% Pair 151.6% Pair 171.9% Pair 191.6% Pair 211.3% Pair 231.9% Pair 251.4% Pair 271.8% Pair 292.1% Pair 311.7% Pair 331.7% Pair 351.9% Pair 372.1% Pair 391.8% Pair 411.3% Pair 431.9% Pair 451.8% Pair 471.5% Pair 491.8% Pair 511.5% Pair 531.5% Pair 552.3% Pair 572.1% Pair 59
1.8% Pair 21.5% Pair 42.0% Pair 62.0% Pair 81.8% Pair 101.4% Pair 121.6% Pair 141.5% Pair 161.7% Pair 182.0% Pair 201.8% Pair 221.6% Pair 241.6% Pair 261.7% Pair 281.4% Pair 301.6% Pair 322.0% Pair 341.7% Pair 361.9% Pair 381.7% Pair 401.2% Pair 421.7% Pair 441.5% Pair 461.6% Pair 482.1% Pair 501.8% Pair 521.4% Pair 542.3% Pair 561.2% Pair 581.1% Pair 60
0.7% Pair 20.3% Pair 41.3% Pair 60.5% Pair 80.8% Pair 101.1% Pair 120.9% Pair 150.5% Pair 171.1% Pair 191.8% Pair 210.6% Pair 231.2% Pair 251.1% Pair 272.6% Pair 291.4% Pair 312.7% Pair 331.9% Pair 352.2% Pair 373.7% Pair 390.7% Pair 411.2% Pair 431.1% Pair 451.0% Pair 473.5% Pair 491.2% Pair 512.3% Pair 531.6% Pair 552.4% Pair 570.8% Pair 59
Per Client Airtime by Vendor

Why Your Wi-Fi Sucks and How It Can Be Helped
17
sequence of tests on the MR24, looking to see how the AP handled fairness under increasing load. The results are very telling.
Notice that the aggregate bandwidth with five laptops is almost on par with that of only two laptops. However, even with only five laptops in play, one client receives 45% of the bandwidth while another gets just 2%. Remember that these notebooks are all identical in both hardware and soft-ware configuration. There is no reason at all for the access point to favor one client over another. With 10 clients, this simply turns ridiculous. One client gets 85% of the band-width and eight clients get absolutely nothing. Yet the aggregate bandwidth still reports as almost 90 Mb/s, which sounds rosy on its surface. Out of 60 laptops (before the AP gave up trying), only three received any appreciable band-width; 54 received no data at all.
Deep analysis like what we’ve done here—well over 300 test runs across a wide array of variable factors—is essential if buyers want any kind of true understanding about client performance. When it comes to total environment band-width, those big average Mb/s numbers you see in most router and access point reviews are not painting anything close to a complete picture.
In this two-part series, we sought to take a deeper look at performance by spotlighting the two primary environmental factors that weigh on Wi-Fi performance—interference and
Meraki MR24 Airtime Fairness2 Laptops, 100.97 Mb/s average
45.5% Pair 154.5% Pair 2
5 Laptops, 99.65 Mb/s average 10 Laptops, 89.39 Mb/s average
60 Laptops, 46.69 Mb/s average
27.4% Pair 145.4% Pair 3
0.0% Pair 10.0% Pair 30.0% Pair 50.0% Pair 70.0% Pair 9
0.0% Pair 10.0% Pair 30.0% Pair 50.0% Pair 82.2% Pair 11
0.0% Pair 210.0% Pair 2319.8% Pair 2543.1% Pair 270.0% Pair 29
0.0% Pair 130.0% Pair 150.0% Pair 170.0% Pair 19
0.0% Pair 320.0% Pair 340.0% Pair 360.0% Pair 380.0% Pair 40
4.1% Pair 510.0% Pair 530.0% Pair 550.0% Pair 570.0% Pair 59
0.0% Pair 420.0% Pair 440.0% Pair 470.0% Pair 49
0.0% Pair 20.0% Pair 40.0% Pair 70.0% Pair 90.0% Pair 12
0.0% Pair 220.0% Pair 240.0% Pair 260.0% Pair 280.0% Pair 31
0.0% Pair 140.0% Pair 160.0% Pair 180.0% Pair 20
0.0% Pair 330.0% Pair 350.0% Pair 370.0% Pair 390.0% Pair 41
0.0% Pair 520.0% Pair 540.0% Pair 560.0% Pair 581.7% Pair 60
0.0% Pair 430.0% Pair 460.0% Pair 4829.1% Pair 50
14.8% Pair 20.0% Pair 485.2% Pair 60.0% Pair 80.0% Pair 10
2.0% Pair 5
20.3% Pair 24.9% Pair 4
client load—and many of the technologies access points can use to combat those factors. In part because wireless inter-ference is so difficult to control, most reviewers have never sought to tackle it in a real-world context. And certainly, our results shouldn’t be taken as fixed gospel. Someone could roughly duplicate our test setup and, because of fluctuating conditions, see different test results, if only through product tweaking. As stated earlier, we did no tweaking here—we only tested and reported. Had we started tweaking, we’d still be in that office recording throughput scores.
By now, the results should lead to their own inevitable
Smart, adaptive antenna technology is not analogous to clean alternative ener-gies, but it does provide a giant leap forward in how well we can utilize existing bandwidth resources.

18
conclusions. Apple makes a fine consumer router, but the difference between enterprise-class equipment and con-sumer gear here is glaring. This should be a red flag to power users placing an increasing number of Wi-Fi devices in their homes, as well as any business looking to save dollars by grabbing off-the-shelf gear at the nearest big retailer. The levels of engineering and component quality between the two product classes are worlds apart.
At the same time, there are obviously qualitative differences between enterprise access points. If you want performance under fire from ambient interference, Cisco and especially Ruckus are the two clear choices from our group. The same statement applies to airtime fairness and making sure that all clients get an approximately equal amount of bandwidth at any given time. When it comes to distance, you have to take a closer look at the environmental conditions and the specific attributes of your wireless devices.
In optimal, close-range, with little to no interference and only one client vying for the access point’s attention, the Meraki MR24 suddenly morphs into our top performer, most likely thanks to its three-stream design meshing well with our 3x3:3 Intel client adapter. Start adding distance and obstructions, and the situation changes. It also matters whether you want to emphasize downstream or upstream bandwidth from your AP. Aruba and HP are neither stun-ningly bad nor particularly impressive, but again—mileage may vary according to how you fine-tune the device.
Good Wi-Fi is not about brute force and raw speed. It’s about understanding RF and doing something about it. The products that outperformed in our testing weren’t the
biggest and most expensive, or even the ones that used the highest number of streams. Ruckus puts forth the best effort in the largest number of tests, but it does so with a mere 2x2:2 design through engineering and deep attention to the factors necessary to provide a high-quality wireless experience in increasingly hostile RF conditions. From our group, Cisco is the only other vendor that seems to have provided even close to the same level of attention and control.
A Ruckus representative once mentioned to us in passing that his company had been in advanced talks with at least one panel manufacturer that was interested in putting the company’s antenna technology on a circuit board mounted behind the notebook’s LCD panel, built right into the lid. Can you imagine how performance might differ with both the client and access point using the same adaptive tech-nologies? Sadly, the talks went nowhere because the ven-dor refused to pay Ruckus’ asking price for the technol-ogy. Even in the consumer world, we know that Netgear once brought Ruckus tech to market in one of its 802.11g products, but this soon died out for similar reasons. People don’t understand the qualitative difference between wire-less approaches. Instead they see Mb/s and access times, and that ends the discussion.
It shouldn’t be this way. In the Wi-Fi arena, we’re facing a bandwidth dilemma not unlike the world’s impending oil shortage. As demand and usage continue to climb, our abil-ity to effectively and efficiently use those resources will con-tinue to diminish. Smart, adaptive antenna technology is not analogous to clean alternative energies, but it does pro-vide a giant leap forward in how well we can utilize existing bandwidth resources.
Buy smart and, when possible, demand better from wireless manufacturers.Buy smart and, when possible, demand better from wireless manufacturers.
Ruckus ZoneFlex 7363Mid-Range Dual-Band802.11n (2x2:2) AP