the influence of geometry c)n dragline bucket filling
TRANSCRIPT

THE INFLUENCE OF GEOMETRY C)N DRAGLINE BUCKET
FILLING PERFORMANCE
Schalk Willem Petrus Esterhuyse
Thesis presented in partial fulfillment ofthe requirements for the degree of
Master of Engineering
at the
lJniversity of Stellenbosch
Department of Mechanical Engineering
Thesis Supervisor: Prof. A.H. Basson
December 1997

DECLARATION
I, the undersigned, hereby declared that the work contained in this thesis is my own
original work and has not previously in its entirety or in part been submitted at any
university for a degree.
Signature:. Date:
Stellenbosch University http://scholar.sun.ac.za

Summary
This thesis desc1ibes the procedure followed in order to establish geometry changes to the
current lig!1tweight dragline bucket lmilt by Wright Equipment Compan:Y to improve its
performance. The bucket performs very well as is and big changes v , e not expected.
This project was done as part of the Mechanical Engineering Masterr- Jegree requirements
at the University of Stellenbosch, while being employed by Wriglh Equipment
A scale model dragline was designed and built to be used in collecting the data. The most
significant variables when considering dragline bucket filling were established and ranked
according to their relative influence. The tests were done, using four different scale model
dragline buckets and changing a 11umber of variables on each of them at different drag
angles and in different digging conditions.
Eventually it was found that a shorter, wider bucket with a lower hitch, resulted in
improved performance as far as filling distance and filling energy requirements were
concerned. The maximum required drag force was not increased, meaning stalling of the
bucket would not be a problem. The changes do have some structural implications though
aud should be investigated before any changes are made.
Stellenbosch University http://scholar.sun.ac.za

Opsomming
Die tesis be£kryf die prosedure wat gevolg is om geometrie veranderinge aan die liggewig
sleepgraatbak, wat deur die maatskappy Wright Equipment vervaardig word, te
ondersoek. Die uiteindelike doel was om di~ produktiwiteit van die bak (gedefinieer as die
hoeveel bogrond wat in 'n gegewe tyd geskuif word} te verbeter Die projek het deel
gevorm van die vereistes vir 'n Meestersgraad in Meganiese lngenieurswese by die
Universiteit van Stellenbosch.
'n Skaalmodel sleepgraaf is ontwerp en gebou vir gebruik in die versameling van die
nodige data. Die belangrikste faktore betrokke by die vulling van sleepgraatbakke is
vasgestel en in rangorde van belangrikheid gegroepeer. Vier skaalmodel sleepgraatbakke,
waarop verskillende geometriese veranderinge gedoen kon word, is gebruik in toetse teen
verskillendt sleephoeke en grondkondisies.
Daar is gevind dat 'n korter, wyer bak met 'n laer sleeppUt"'t '1. v~rbetering in
werkverrigting gee in terme van afstand om te vul en energie ve1·t.· :•.• Die maksimum
sleepkrag benodig is ook nie verhoog nie, met die gevolg dat str:, l,' nie 'n probleeill sal
wees me. Die voorgestelde veranderinge het egter struk.i.t..•' ic imt"i'---dsies wat eers
ondersoek sal moet word voor enige veranderinge gedoen word.
11
Stellenbosch University http://scholar.sun.ac.za

Ackn(\wledgements
The author wishes to si.,cerely thank the following persons:
George Murray for his advice while building the Scale Model Draglinr.
Johan Govea for his continued support.
Ossie Zaayman for advice on the construction of the Scale Model Dragline and for his
time spent discussing the results.
Ronnie Mattheis for advice during the constmction of the SMD and overall assistance.
Patrick \\ tlliams, the boilermaker who helped with the construction of the scale model
dragline, for his efforts.
Chris Pretorius tor assistance in performing the tests and for construction of the scale
model dragline buckets.
Special thanks go to Barlows Equipment Manufacturing CO SA for the opportunity
offered to complete a Masters thesis on the subject.
Ill
Stellenbosch University http://scholar.sun.ac.za

TABLE OF CONTENTS
Summary
Acknowledgements
Table of contents
List of Figures
List ofT lbles
1. INTRODUCTION
2. SHORT OVERVIEW OF STRIP MINING
2. 1. Determining the lithology structure
2.2. Designing ofthe mine
2.3. Overburden removal
2. 3. 1 . Draglines
2.3.2. Bucket wheel excavators (BWE)
2.3.3. ShoveUTruck/Front End Loader combinations
2.3.4. Scrapers
2.3.5. Hydraulic mining
2.4. Loading and conveying of coal
2.5. Reclamation
3. DRAGLINES AND THEIR OPERATION
3. 1 Mining methods
3. 1. 1. Single seam methods
3. 1. 1. 1. Side cast
3 .1.1.2. Extended bench
3.1.1.3. Advance bench
3.1.2. Two seam methods
3 1.2.1. Two- bench.
IV
Ill
IV
VIII
XV
3
3
3
4
5
5
6
8
10
10
10
12
17
18
18
20
21
22
22
Stellenbosch University http://scholar.sun.ac.za

3.1.2.2. Pullback 23
3. I . 2. 3. Extended lower bench 24
3.2. Drilling and Blasting 24
3 2. 1. Drilling and Blasting design 25
3.2.2. Explosives 26
3.3. Selection and sizing of draglines 27
3.4. Performance and Productivity 28
3.4.!. Defining productivity 29
3.4.2. Optimisation 30
3.4.2. 1. Mathematical models 30
3.4.2.2. Monitm;ng systems 33
3.5. Dragline buckets 34
3.5.1. Rigging 34
3. 5. 2. Filling behaviour 36
3.5.2.1. Performance measurement 36
3.5.2.2. Influencing factors 37
4. CONSTRUCTlON OF THE SCALE MODEL DRAGLINE 38
4. 1 . General 38
4.2. Sizing ofthe drag, swing and hoist motors 40
4.2.1. Swing motor 41
4.2.2. Drag motor 42
4.2.3. Hoist motor 44
4.3 Electrical system and controls 45
4.4. Hydraulics 45
4.5. Rigging 46
4.6. Data acquisitioning system 47
V
Stellenbosch University http://scholar.sun.ac.za
5. EXPERIMENTAL PROCEDURE
5. 1 . Work done by Rowlands ( 1991 )
5.2. Determining the parameters and sequence oftesting
5.2.1. General discussion offactors involved
5.2 2. Determining the importance offactors
5.2 2.1. Influence of a change in bucket width
5.2.2.2. Rating of other factors
that influence bucket performance
5 2 3. Sequence of testing
5.3. Testing procedure
5. 4. Additional tests
5.4.1. Change in drag angle
5.4.2. Overburden carrying characteristics
6. DESIGN OF TEST BUCKETS AND SOIL SELECTION
6.1. Design of test buckets
6.2. Soil selection
6.2.1. Obtaining soil from a mine
6 2.2. The Rosin Rammler distribution
6.2.3. The selected option
7. DISCUSSION OF RESULTS
7. 1. Comparison of different bucket widths
7.2. Comparison of different digging materials
7.3. Comparison of different angles of attack
7.4. Comparison of difterent numbers of teeth
7.5. Comparison of different drag angles
7 6. The effect of changing the hitch position horizontally
7. 7. QuantifYing the effect of bucket width and hitch height on the
maximum required drag force
VI
50
50
52
52
53
54
55
56
59
59
60
60
62
62
65
66
67
69
71
T2
74
75
77
78
79
80
Stellenbosch University http://scholar.sun.ac.za

7.8. Conclusions regarding the influence of geometry on dragline buckets 82
8. UNDERSTANDING THE DIGGING PROCESS 85
8.1. Theoretical static analysis of the forces on the oucket at engagement ~;6
8.2. Qualitative assessment ofthe influence in chanf:?e of parameters on digging
performance 88
9. CONCLUSIONS AND RECOMMENDATIONS 90
I 0. REFERENCES 93
APPENDICES
Appendix A: Tables relating to the pre-test ranking ofvariables
Appendix B: Figures relating to optimum carry angles
Appendix C: Figures relating to the test data
Appendix D: Test data
GLOSSARY
VII
Stellenbosch University http://scholar.sun.ac.za
LIST OF FIGURES
Fi&ure Description Page
A dragline with its components 12
2 A draglinc bucket and its rigging 13
3 The dragline bucket carry angle 14
4 Dragline operating parameters 15
5 Side casting 18
6 The;; t>xtended bench mining method 20
7 The advance bench mlhing method 21
8 The two bench mining method 22
9 The pullback bench mining method 23
10 The extended lower bench mining method 24
11 Blast design for a vctical hole 2.5
12 Lines of constant carry angle in the 20 space under the dragline 35
boom
13 The scale model dragline 39
VIII
Stellenbosch University http://scholar.sun.ac.za
14 La you·£ of the swing, drag and lv1ist motors 39
15 Sensors fitted to the bu.::ket 48
l6 The four test buckets 62
17 Side view comparison of the test buckets 63
18 Comparison between tests perfonned by Barlows and Acirl 67
19 Forces on the bucket at engagement 87
20 Theoretical teeth force at engagement 88
Bl Payload volume as a function of carry angle for the four test 81
buckets as calculated with a 2D theoretical model for an angle of
repose of 3 8 deg
B2 Payload volume as a function of carry angle for the four test 82
buckets as calculated with a 2D theoretical model for an angle of
repose of 42 deg
B3 Maximum payloau and optimum carry angle for the four buckets 83
for ditferent angles of repose
B4 Optimum cany angle at pick-up for Test bucket i 2 i'~ crusher rur. 84
with angle of repose between 42 and 48 deg:·ees
85 Optimum carry angl~ at pick-up tor Test bucket 11 in cm~1er run B4
with angle of repose between 42 and 48 degrees
IX
Stellenbosch University http://scholar.sun.ac.za

86
87
Cl
C2
C3
C4
CS
C6
C7
C8
Optimum carry angle at pick-up for Test bucket 10 in crusher run
with angle of repose between 42 and 48 degrees
Optimum carry angle at pick-up for Test bucket (;~ in crusher run
with angle of repose between 42 and 48 degrees
Comparison between drag force and distance in crushed rock and
crusher run for tests RK 106833 and CR 106833
Filling distance as a function of Hitch Height for the four test
buckets in crushed rock
Filling distance as a function of Hitch Height for the four test
buckets in crusher run
Max drag force as a function of Hitch Height for the four test
buckets in crushed rock
Max drag force as a fimction of Hitch Height for the four test
buckets in crusher run
Filling en~rgy as a function of Hitch Height for the four test
buckets in crushed rock
Filling energy as a function of Hitch Height for the four test
buckets in cmsher run
Filling distance as a function of Hitch Height for bucket 12 in two
spoils
X
85
85
Cl
C2
CJ
C4
c5
C6
C7
C8
Stellenbosch University http://scholar.sun.ac.za

C9
CIO
c 11
C12
C13
C14
Cl5
Cl6
CI7
C18
Filling distance as a function of Hitch Height for bucket 1 1 in two
spoils
Filling distance as a function of Hitch Height for bucket 1 0 in two
spoils
Filling distance as a function of Hitch Height for bucket 09 in two
spoils
Max drag force as a function of Hitch Height for bucket 12 in
two spoils
Max drag force as a function of Hitch i-Ieight for bucket 11 In
two spoils
Max drag force as a function of Hitch Height for bucket 10 in
two spoils
Max drag force as a function of Hitch Height for bucket 09 in
two spoils
Filling energy as a function of Hitch Height for bucket 12 in two
spoils
Filling energy as a f . .mction of Hitch Height for bucket 11 in two
spoils
Filling energy as a function of Hitch Height for bucket 10 in two
spoils
XI
C9
CIO
Cl!
C12
Cl3
C14
Cl5
CI6
C17
C18
Stellenbosch University http://scholar.sun.ac.za
C19
C20
C21
C22
C23
C24
C25
C26
C27
Filling energy as a function of Hitch Height for bucket 09 in two
spoils
Filling distance as a function of Hitch Height for four angles of
attack for bucket 1 0 in crushed rock
Filling distance as a function of Hitch Height for two angles of
attack for bucket 1 1 in crusher run
Max drag force as a function of Hitch Height for four angles of
attack for bucket 1 0 in crushed rock
Max drag force as a function of Hitch Height for two angles of
attack for bucket I 1 in crusher run
Filling energy as a function of Hitch Height for four angles of
attack for bucket 1 0 in crushed rock
Filling energy as a function of Hitch Height for two angles of
attack for bucket 1 1 in crusher run
Filling disiance as a funct:on of Hitch Height for bucket 10 in
crushed rock with a 8 deg angle of attack and different numbers
of teeth
Filling distanr::e as a function of Hitch Height for bucket 10 in
crushed rock with a 12 deg angie of aHack and different numbers
of teeth
XII
C19
C20
C21
C22
C23
C24
C25
C26
Stellenbosch University http://scholar.sun.ac.za

C28
C29
C30
C31
C32
C33
C34
C3j
C36
Max drag force as a function of Hitch Height for bucket 1 0 in
crushed rock with a 8 deg angle of attack and different numbers
of teeth
Max drag force as a function of Hitch Height for bucket 10 in
cmshed rock with a 12 deg angle of attack and different numbers
of teeth
Filling energy as a function of Hitch Height for bucket 1 0 in
crushed rock with a 8 deg angle of attack and different numbers
of teeth
Filling energy as a function of Hitch Height for bucket 10 in
crushed rock with a 12 deg angle of attack and different numbers
of teeth
Filling distance as a function of Hitch Height for bucket 10 at
two drag angles in crushed stone
Filling distance as a function of Hitch Height for bucket 12 at
two drag angles in Cl ushed stone
Max drag force as a fimction of Hitch Height for bucket 10 at
two drag angles in crushed stone
Max drag force as a function of Hitch Height for bucket 12 at
tw0. d~- ~ mgles in crushed stone
Filling en~,·gy as a function of Hitch Height for bucket I 0 at t\\<o
drag angles in crushed stone
XIII
C28
C29
C30
C31
C32
C33
C34
C35
C36
Stellenbosch University http://scholar.sun.ac.za

C37
C38
C39
C40
C41
C42
C43
C44
C45
C46
Filling energy as a function of Hitch Height for bucket 12 at two
drag angles in crushed stone
Filling distance as a function of Hitch Height for a shift of the
hitch in a horisontal direction
Max drag force as a function of Hitch Height for a shift of the
hitch in a horisontal direction
Filling energy as a function of Hitch Height for a shift of the hitch
in a horisontal direction
Relationships for performance parameters as a function of bucket
width on hitch height 3 in cmshed rock
Relationships for performance parameters as a function of bucket
width on hitch height 3 in crusher run
Relationships for performance parameters as a function of bucket
width on hitch height 2 in cmshed rock
Relationships for performance parameters as a function of bucket
width on hitch height 2 in crusher run
Relationship between hitch height and tilling distance for the
different buckets in crusher run
Relation~ hip for the Max drag force as a function of Hitch Height
for the different buckets in crusher run
XIV
C37
C38
C39
C40
C41
C42
C43
C44
C45
C46
Stellenbosch University http://scholar.sun.ac.za

LIST OF TABLES
Table Descriptioll
2
..., -'
4
5
AI
A2
A3
A4
AS
Repr Jducibility of tests
Rating of the importance of factors int1uencing bucket filling
Sequence for tests
Comparing the values obtained with bucket 12 in hitch 2 with the
values obtained with bucket 1 0 in hitch 3
Comparing the values obtained with bucket 12 in hitch 2 with the
values obtained with bucket I 0 in hitch 3
Determi:: 1.3 the mf1ucnce of bucket width on filling distance and
specific, ~iggin~ energy
Determining the influence of teeth length on fi.Hing distance and
specific digging energy
Determining the influence of digging material on filling distance
and specific digging energy
Determining the influence of angle of attack on filling distance
and specific digging energy
Determining the influence of position of COG on filling distance
and specific digging energy
XV
Page
49
56
58
82
82
AI
AI
A2
A2
A3
Stellenbosch University http://scholar.sun.ac.za

A6 Comparison between hitch heights for minimum filling distance
and maximum engagement rate
XVl
A4
Stellenbosch University http://scholar.sun.ac.za

l. INTRODUCTION
Draglines are used extensively on open strip mines to uncover coal, which is one of the
primary energy sources known to mankind. Removing the overburden from the ':.:oal is the
most expensive and time consuming operation on coal mines It is therefore very
important that this stripping should be done as efficiently as possible.
South Africa and Australia are two of the worlds largest produc~rs of coal. In South
Africa it is generally accepted that an improvement of 1% in the efficiency of a dragline,
will result in a RI million increase in annual production per dragline. Additionally, the
energy cortsumption of a dragline is vast and if any savings could be made on the amount
of electrical energy consumed, it will result in bigger p:-ofit margins.
A lot of research has been <:lone on improving the productivity of draglines. This involved
work on systems to monitor production (section 3.4.2.2), mathematical models to predict
productivity (section 3.4.2.1) and research on dragline operation (section 3.1). Very little
work has been done on dragline buckets, but it is widely accepted that the bucket does
have a big influence on th~ productivity of the dragline (Rowlands, 1991; Smit, 1996;
f>undari, 1981 and Lumley and Jensen, 1996 ). Where research has been done by bucket
manufacturers it was not published hecause of competition between the bucket
manufactur~rs.
Making use of the knowledge of a bucket shop supervisor at Optimum mine, Dries Smith,
a new bucket was developed by Northwest Applied Technology (design), VR-Steel (steel
supply) and bdrlows Equipment Manufacturing Company SA (manufacturers) who
formed a joint company called Wright Equipment. This bucket proved to be very
successful in the mining industry and when exporting the buckets to Australia became a
real possibility, it was decided to initi~te a bucket development program. For this purpose
a scale model dragline was built and tests were conducted. The aim of the project was to
establish a geometry for a dragline bucket that would allow it to fill in a shorter distancf>
(in different materials) and with lower energy consumption than the current design. The
Stellenbosch University http://scholar.sun.ac.za
maximum required drag force was not to increase as that could cause the bucket to stall.
The project was therefore focused on increasing the productivity of a dragline by
optimising bucket design. Huge profits in terms of increased production is possible as
discussed in section 3. 5.
In section 2 a shoil overview of strip m!ning is given and in section 3 a detailed discussiun
on draglines and operating methods associated with them is presented. These two
sections were included as it was seen as important to have a thorough knowledge of
especially the operation of draglines and at least an idea of the operation and layout of a
coal mine. They also sho .r; draglines to be the most popular stripping machine and shows
that huge financial gains in t emts of increased r ·oduction is possible if the productivity of
a dragline can be increased. Sections 4, 5 and 6 discuss the construction of the scale
model dragline, the designing of the experiments and the design and construction of the
test buckets and the soil selection. Section 7 discusses the results of the tests, section 8 is
aimed at understanding the digging process qualitatively and section 9 presents
conclusions that can be drawn from this project and recommendations on areas in ..vhich
research is needed.
It was found that widening the bucket and lowering the hitch would result in better
performance, but there are problems associated with su·~h changes. Discussions should be
held with different mines to see which changes will be feasible and a 6 cubic meter bucket
should be built and tested to eliminate possible scalmg errors
Stellenbosch University http://scholar.sun.ac.za

2. SHORT OVERVIEW OF STRIP MINING
When comparing strip mining to the more costly and corr.plex underground mining · :s
obvious that it plays c; very important economic role. Panagiotou ( 1990) points out that
opencast mining is easier, safer ar.d requires less initial investment than underground
mmmg.
2.1 Deter·mining the litholoJF~ structu.-e
According to Mon~y ( 1990) most identification is made by drilling holes and analysing the
drill cuttings and cores in the region of interest. Drill-hole logging techniques combined
with cores and drill hole cuttings are used to interpret the lithology sequence. These
techniques (like the density log, caHiper leg, resistivity log, etc.) make use of differences
like density a.nd electrical resistance of the different materials to determine the position of
the coal layers. The data is then presented on a number of different charts and maps to
present and interpret data.
It is essential to pick up the coal structure accurately, including possible faults and joints
(as described by Ward, 1990). Faults can render an attractive area unminab!e and joints
are natural weaknesses in the rock structure of which advantage could be taken in the
mining sequence. The stmcture influences the equipment selection. The amount and
quality (for example calorific value) of coal is of importance in determining the feasibility
of the operation as a whole.
2.2 Designing of the mine
Morey (1990) :lassifies the designing ofthe mir.e into three groups:
I . Geologic (depths, widths and slopes)
2. Mechanical (operating radii, reach, capacity, ground pressure and cycle time)
3 Operational (scheduled hours, operator efficiency. availability, utilisation, mobility and
required coal production rate)
3
Stellenbosch University http://scholar.sun.ac.za

The above only goes to show the wide range of vari1bles that need to be taken into
account when designing a mine and each of the groups has to be dealt with in detai',
requiring a lot of experience, research and expertise.
2.3 Overburden removal
In an opencast mine the biggest cost is associated with removal of the overburden and
therefore this is the process where efficiency is the most important (Chatte1~ee et al, 1975;
Morey, 1990; Streck, 1981 and Kemp and Chapman, 1978).
The overburden is classified by Aiken and GunneH ( 1990) into the following cattegories:
1. Topsoil: Support vegetation as must be replaced after coal extraction.
2. Soft overburden: Can usually be excavated without blasting aiid ts used m
recountouring of the landscape.
3. Medium hard: Includes a wide variety of rock and light blasting IS required for
excavation with a dragline.
4. Hard rock: Drilling and blasting must be performed.
The different methods used for stripping (removiPg overburden) are vast and they can be
used in a number of combinations. The most common methods are Draglines, Bucket
Wheel Excavators (BWE), Truck/Shovel/Front End Loader combinations, Scrapers and
Hydraulic Mining. Aiken and Gunnett ( 1990) defines the stripping ratio m stripping index
as the volume of over~urden that needs to be removed per volume of coal uncoven:t:
Therefore:
, . . . " J"olume ql overburden remon!d (m') .Stnppmg ra/10 = ,,R. = ··---·· ·---.---
unit volume nj coal (1 ;n') (2.3.1)
4
Stellenbosch University http://scholar.sun.ac.za

2.3.1. Draglines
Draglines are the most popular stripping tool In Chapter 1 th1.., 'tatement 1.,
shown to be vaiid and a comprehensive discussion on dragiine-.. eh \\eil a" m1nmg
methods associated with them are presented In the ft)!IO\'.Hl~l -.-.'..:tlur.' 1\rh~r
mining methods that are used are discussed and comparec to the draul1nc m:ntn\.!
method.
2.3.2. Bucket wheel excavators (BV\- E)
The bucket wheel excavator is a machine having a rotating v .. ht>el v.,;tli hud.::t·,
mounted on its perimeter (almost like a ~atermill) on a sometimes c\tend!t>k
boom. The bucket capacity can be up to 6 3 cubic meter" ( Jinarajan. l 'JR2 1 !he
machine is moumed on crawlers, and can rotate around a \ertical ax1s
The two biggest advantages of the BWE Rre its enormous production rate and lb
high breakout force when compared to draglines Strech ( 1981) points out that in
deep mines (50 to 150 m) the high production rate of the BWE is needed Other
advantages of the BWE is that it is generally used on wide operating benches
(resulting in more stable pit slopes), reclamation Is easier ( Aiken and Gunnett
1990) and manpower requirements are low (Jinarajan, 1982) The ex ea\ ated
material is preferably delivered to a belt conveyer (rail wagon:-; are also an option)
(Jinarajan, 1982), which eliminates the need for mobile transpon and s;ne~ the
associated high fuel costs ( Aiken and Gunnett. I Cl90)
The BWE is mostly used in soft overburden and. comt.ined \\ Ith the higher
breakout force, :!-:c ··~•-·-• i'': il\<i-,tl!lg j, c:!llll!Ull'J \Jl!lclrd_lan. l c)82 and \1ure\.
1990), although blasting is scmetintes used i~1 con_1unction \\ ith 8\\T I :\tkinson et
al, 1986) Improvements in the desig11 of BWE over the last fe\\ vears. alicw. s the
handlmg of harder digging conditions ( ~\iken and Gunnett. l C)C)Q) The facts that it
is not applicable in hard digging conditions. that it is less flexible than a dragline
for example and that (being a continuous excavator) if one elemeni of the S\stern
Stellenbosch University http://scholar.sun.ac.za

breaks down, the whole system is at a standstill, are the biggest disadvantages
(Aiken and Gunnett, 1990)
In all operating methods two cutting techniques are used (Morey, 1990) - drop
cutting (cutting vertically down) and terrace cutting (cutting horizontally across
the face). Aiken and Gunnett ( 1990) show three operating methods (with all three
:nethods employing terrace cutting) - block excavation, bench excavation and
lateral block excavation. The reason for employing terrace cutting is that it :1ssists
in the reclamation process as discussed in section 2. 5. Atkinson et al ( 1986)
points out that the most important operating characteristics is digging height, cut
width and boom length.
Morey ( 1990) mentions an interesting development in increasing the productivity
of the BWE that might have application in other operations. At one location
plugging was a problem - it was overcome by a loosely fltted chain in a bucket
back that had been cut out. By doing so the bucket tended to be self cleaning.
2.3.3. Shovei/Truci</Fr·ont End Loader combinations
According to Aiken and Gunnett ( 1990) shovels can be grouped under stripping or
quarry shovels, the first being used for overburden removal and the latter for
loading onto trucks or rail cars.
Stripping shovels: Shovels can be used as the pnmary means of overburder.
stripping or it can be used in conjunction with draglines or BWE. Their
advantages are that they have a higher breakout force than the dragline and can
also hanile ma1.erial having a lesser degree of fragmentdtion (Jinarajan, 1982). It is
however less vr:rsatile than the d: _gline because of the higher ground bearing
pressure, which prevents them from being positioned near an edge or on spoil piles
(see the extended bench mining method used with draglines that is described in
section 3.1 .1 '2i (Jinarajan, 1982). According to Morey ( 1.990) the operating cost
6
Stellenbosch University http://scholar.sun.ac.za

of sho,;e)s is higher than that of draglines and Sargent ( 1990) points out that the
last stripping shovel was sold in 1969 and although there are still some in
operation, they will eventually phase out. The largest stripping shovel has a bu.:ket
capacity of 180 cubic yards and a 215 ft boom (Jinarajan, 1982 and Morey, 1990).
Shovel/Truck: Shovels can also be used to load excavated material onto trucks
for transport (quarry shovels). Truck loading shovels can be of tvvG type~ -
hydraulic or rope shovels. Hydraulic shovels have a maximum bucket capacity of
about 30 cubic metres. Rope shovels are either electrical!y or diesel powered.
Electric rope shovels are relatively cheap (but not very mobile), are very reliable
and has a long life (Adams, 1990). Diesel rope shoveis are more mobile, but have
the disadvantage that it loses power at high altitudes (Jinarajan, 1982). Adarns
( 1990) claims that hydraulic diesel sLovels have gained a lot of g1o~~.. .fl the last
decade and are challenging draglines and rope shovels. While the lighter hydraulic
shovel has a shorter life than the rope shovel, the lower ownership cost and higher
productivity make it a lower ~ost machine (Jmarajan, 1982).
The shovel loads accurately onto the t,ucks and have a short cycle time. It should
be positioned in such a way that it can spot trucks on both sides. The shovel
dumping height must be higher than the truck loading height and the load should
not be swung over the truck cabin (Jinarajan, 1982}.
The main advantage of this system is its versatility (Jinarajan, 1982 and Bertoldi,
1977). Another advantage i;,; that if one of the units breaks down the other still
goes on operating, whereas in the case of the BWE or dragline the whole stripping
operation comes to a standstill. Disadvantages of the system are the dependence
on manpower and the high fuel costs associated with it, as well as the fact that it
becomes less productive as depth increases (Jinarajan, 1982). It is also limited by
steep grades, a large amount of road construction is needed and dust generation is
high. A shovel/rail transport system can save on fuel but it is not as mobile and the
7
Stellenbosch University http://scholar.sun.ac.za
shovel is unproductive during train trips (Jinarajan, 1990). Accordinp to Karpuz
( 1990) shovel productivity can be improved by up to 15% when assisted by
blasting in medium digging conditions. According to Morey ( 1990) overb:.1rden
removal by shovel/truck costs three times as much as dragline stripping, but it is
easy to match the system to production goals- :-.imply increase the fleet.
Trucks are either of the rear dump or bottom dump type. The bottom dump type
is used .vhen the material is unloaded over a hopper or is spread and the rear dump
type is used to dump over an edge (Jinarajan, 1982). The excavator should fill the
truck in 3 to 5 passes (Aiken and Gunne;t, 1990 and Sargent, 1990). The biggest
trucks in use are 119.8 cubic metres, designed to ca!l)' 176 tons ofmaterial.
Front end loader/Truck: Using front end loaders to load trucks instead of
shovels provides more mobility and flexibility, but the loading operation takes
longer and the maintenance cost is higher (Jinarajan, 1982). Over short distances
the front end loader can also be used in a load and haul type operat;on (Adams,
1990)
2.3.4. Scrapers
Scrapers as the primary means (often used in conjunction with other methods) of
overburden removal should only be considered in soft overburden with depths of
less than 20 meters (Morey, 1990). Morey ( 1990), as well as Aiken and Gunnett
( 1990 ), classifY scrapers into four categories:
1. Single engine scraper: It is usually assisted by a dozer in the loading stage
and it can handle a wide range of materials. The reason for dozer assistance is
that it is uneconomical to give the scraper more power than needed for haulage
because of the high percentage of time spent transporting overburden, resulting
in the scraper being underpowered for the loading cycle (Jinarajan, 1982).
2. Elevating scraper: It self loads with a powered elevator, but is limited to
material of gravel size.
8
Stellenbosch University http://scholar.sun.ac.za

3. Dual engine scraper: It can ~e used in wet C'•nditions since it has got better
traction.
4. Push-pull scraper: It is dual engine scrapers working in tandem. The lead
scraper is push loaded by the second and then the second scraper is pull loaded
by the first. They then separate and haul as individual dual engine scrapers. In
this way the need for a dozer is eliminated
Scrapers are often used for prestripping, smce the topsoil (which is often
unconsolidated material on which a dragline cannot be positioned) is then removed
- this topsoil can be stored and reclamation is made easier (Jinarajan, 1982 and
Morey, 1990). Prestripping with scrapers can also help in eliminating dragline
rehandle (Aiken and Gunnett, 1990 and Morey, 1990). Another advantage of
scrapers is that pit width does nG. influence the efficiency of the operation and it is
very safe (Morey, 1990). Downtime on one unit also does not influence other
units and the overburden removn 1 rate can be matched to the required coal output
by simply introducing other units into the system.
Disadvantages of scrapers are that their use is limited to loose formations and they
are not efficient in wet conditions (Jinarajan, 1982). Road construction is high and
the manpower needed is higher than with draglines. Operating and maintenance
costs is high, but initial investment costs is less than for draglines. The process is
limited by steep grades (Morey, 1990).
9
Stellenbosch University http://scholar.sun.ac.za

2.3.5. Hydraulic Minine
This method is limited to soft overburden and huge quantities of water is needed
(Jinarajan, 1982 and Aiken and Gunnett, 1990). Jinarajan ( 1990) claims the
method to be 20 % cheaper than dragline side casting, but points out that the
application is very limited. The material is excavated and mixed by pumping high
pressure water onto it and the slurry is pumped away.
2.4 Loading and conveying of coal
Light blasting is sometimes needed to break the coal layer (Woodring and Sullivan, 1990)
The coal is loaded onto dumptmcks or conveyer belts. Normally the coal will be loaded
with rope or hydraulic shovels onto dumptrucks, but scrapers can be used for loading and
hauling of coal (Morey, 1990). The space needed for loading the coal at the bottom of the
pit deterr.jnes the minimum width of the strips that are to be mined.
In order to maintain a balance in the production cycle, the coal removal equipment must
be matched to the overburden removal equipment, but, since the overburden removal is
the critical factor as far as time and costs is concerned, the coal removal equipment will
generally have excess capacity (Morey, 1990). This will be of good use when a dragline
has finished a strip and has to wait for coal removal before it can continue in the opposite
direction on the next strip (see section 3.1.1.1 where deadheading of a dragline is
discussed}.
When thin partings are found between the coal layers, the coal loading equipment can be
used to remove it as draglines for example are not used on thin partings (Jinarajan, 1982).
2.5. Reclamation
After the coal has been extracted the landscape has to be returned more or less to its
original shape, making sure that any toxic material is buried. The topsoil has to be in
place, otherwise vegetation growth will not be supported, and the area has to be seeded. If
the above measures are not taken the mine could face severe financial penalties.
10
Stellenbosch University http://scholar.sun.ac.za

The mineral content of the spoil piles has to be well known, otherwise run-off water can
cause huge damage to the ecology (Aiken and Gunnett, 1990). Removing the overburden
can take place in horizontal and vertical layers. In order to store the topsoil and bury toxic
wastt, stripping horizontal layers is preferable (Bandopadhyay and Ramani).
11
Stellenbosch University http://scholar.sun.ac.za
3. DRAG LINES AND THEIR OPERATION
A dragline is an overburden stripping machine that combines the excavation and transportation
of overburden into one motion, which is one of its biggest advantages. It is used to mine
shallow coal deposits and is generally assisted by blasting. It has a boom extending at an angle
of about 38 degrees to the horizontal. From the boompoint down and from the machine
outwards, cables - that are wounded onto drums on the machine - run to a bucket tha't is
manipulated by changing the lengths of the cables. The machine can rotate on its base around
a vertical axis. It scoops a bucket full of overburden, swings to the side (usuRlly through
about 90 degrees) and the material is dumped where the coal has already been removed. In so
doing the area is mined in narrow strips (between 25 and 60 meters wide), starting where the
stripping index is the lowest. The first cut that is made is termed the box cut. Each strip is
divided into a number of blocks (the strip width, overburden height and block length are the
important parameters) which are then excavated from several dragline positions (Humphrey,
1990; Francis, 1995; Jinarajan, 1982; and Morey, 1990). Figure 1 shows a typical dragline
and its components.
Boom Poinl ~
Figure I: A dragline with its components
12
Stellenbosch University http://scholar.sun.ac.za

A dragline bu~ket along with its terminology and rigging (chains and cables attached to it) are
shown in Figure 2:
Hois': Rope_
Hoist Chain-
~ ' DragChain -.-:---~~1,
_o~a~~~~'~ -..Drag Hitch Hei~
~ Drag Rope
Teeth & Front Up
Figure 2: A dragline bucket and its rigging.
It can be seen from th~ figure that the drag hitch is the connection point for the drag chain and
the hoist trunnion the connection point for the hoist chain. The hitch height is defined as the
vertical distance from the bucket floor to the hitch and has a very big influence on filling
performance. The angle of attack of the teeth is defined as the angle between the bucket floor
(horizontal) and the forward face of the teeth. The drag, hoist and dump ropes are also
shown. Figure 3 shows the carry angle as will be used in subsequent discussions - it is the
angle between the bucket floor and the horisontal. The drag angle is defined in Figure 20 in
section 8 - it is the angle the drag ropes make with the horizontal.
13
Stellenbosch University http://scholar.sun.ac.za

Figure 3: The dragline bucket carry angle
Draglines can be grouped into three classes (Aiken and Gunnett, 1990):
1. Truck mounted draglines; These are not for overburden r~moval and will not be
discussed here.
2. Crawler mounted draglines: Bucket capacity is less than 19 cubic meters and it ts
usually diesel powered for mobility (Humphrey, 1990).
3. Walking dragline: These are the most common draglines and the rest of the discussion
will deal with them. The machine rests on a big round tub (because of its wtight) and
walks with a crankshaft mechanism ,~.,hich puts the shoes down, tip the machine forward
and tht:n, with about 80% of the weight of the machine on the shoes and 20% on the tront
of the tub, the machine is slided backwards in steps cf about two meters. The largest
bucket fitted to a machine is 168 cu hie meters (although the highest rercentage of buckets
falls in the 45 to 65 cubic meter class) and the longest boom ic; 128 meters (Humphrey,
1990 and Jinarajan, 1982). As Rowlands ( 1991) noticed, the size of draglines have not
increased in the past few years - other ways to increase productivity has been developed.
Recently however the largest dragline ever built, the P&H 9160, wa~ offered on tender.
The machine weighs about 7700 tons. Humphrey ( 1990) mentions that some of the
smaller draglines have live booms (meaning the angle of the boom can vary). This
14
Stellenbosch University http://scholar.sun.ac.za
obviously has big advantages in terms of having a long reach at tirst and a higher dumping
height (and shorter reach) later (see figure 4 for definitions).
The key parameters for a dragline are the bvom length (and angle) and the bucket capacity.
The boom length and angle determine the operating parameters of the dragline, being dumping
radius, dumping height and digging depth, and it also influences the size of the bucket that can
be rigged to it (Jinarajan, 1982). Figure 4 shows a dragline po~itioned in a pit with the
appropriate definitions of the operating parameters. Rd is the dra51ine dumping radius, Rt' is
the effective reach and So is the stand-off distance. Ho is the depth of the overburden or the
bench height and Wol is the pit width. The dumping height is not shown, that is th~ maximum
height at which the dragline can dump, measvred vertically from the level on which the
dragline stands.
1------Re --------.-of
Figure 4: Dragline operating parameters
The drag!ine cycle consists ofthe following steps (Rowlands, 1991 and Humphrey, 1990):
1. Bucket spotting: This is the positioning of the bucket to start filling it.
2. Bucket fining: This is the most conplex and the least understood part of the dragline
cycle. It can accoum for 25% of th~e cycle time and therefore optimisation i.;; very
important.
3. Disenga~~, hoist and swing: When the bucket is visually full the operator disengages it
by applying tension to the hoist ope. While swmgmg, the drag rope is paid out (for
15
Stellenbosch University http://scholar.sun.ac.za
dumping occcurs under boom point) and the hoist rope is pulled in (to obtain an adequate
dumping height).
4. Dumping: Under boom point the tension in the drag rope drops, resulting in a drop in the
tension of the dump rope. This causes the bucket to tilt forward and the material is
dumped onto the spoil pile.
5. Return swing: The bucket is sv.rtmg back, the hoist rope is lowered and the drag rope is
pulled in to position the bucket for the next cycle.
The dragline offers a lot of advantages over other mining m~thods. It is widely regarded as
the best combination between productivity and versatility - making them the most popular
stripping tool (Bc.ndopadhyay and Ramani~ Hrebar et al., 1967 and Adams, 1990: Although a
B\\ E can move a cubic meter of overburden at a lower cost than a drab .ne, its application is
very limited (Bertoldi, 1077). Bertoldi ( 1977) also performed a ~ost analysis of the
productivity of mining a hypothetical deposit by means of a dragline, truck/shovel and scraper
mining system. Including depreciation, insurance, etc., the dragline was found to be the most
efficient, in other words, the dragline had the lowest overall cost per cubic yard of overburden
moved. It can also handle various types of material, have low operator fatigue, can dig above
and below bench level and has a low bearing pressure (meaning it can be :;ituated close w
edges) (Humphrey, 1990~ Aiken and Gunnett, 1990 and Steidle, 1979).
The biggest disadvantage of the dragline is its high initial cost. With draglmes being the most
popular strippmg tool and with stripping accounting for the highest cost on the mine, the
overall success of many strip coal mines depends primarily on the efficient use of draglines to
remove overburden (C'hatterjee et al , 1975 ). Other disadvantages are the fact that it has got a
relative low breakout force, the distance that the material can be transported is small, a dozer
is usually r.ee '~d in support and fragmer.tation car. influence the productivity to a high degree
(Bertoldi, 1977)
The coincidental P'-)int for a dragline is defined by Humphrey { 1990) as the point where the
hoist, swing and drag times are equal and as short as possible for dumping - this point
16
Stellenbosch University http://scholar.sun.ac.za

obviously changes with the pick-up position of the bucket and the bucket rigging. If only the
hoist and swing are l:Onsidered (at their maximum speed for the given dragline) the bucket
follows the ·;wing - hoist coincidental curve. If dumping occurs above this curve. the cycle is
hoist dependant (or hoist critical) - meaning the swing must wait on the hoist. If dumping
Jc.;urs below this curve. the cycle is swing dependant (or swing critical) ·· meaning the hoist
must wait on the swing (Humphrey, 1990 and Morcy, 1990).
Improvements in dragline design that have received attention, apart from having bigger, more
powerful machines, have been in the development of aluminium booms. The booms, being
lighter for the same strength, can be longer, swing time is reduced and buckets can be bigger.
The tub·Jlar members are filled w1th gas and pressure sensors warn against the development of
cracks (AdarP~, 1990). There are also machines working with triangular booms, but Ste~dle
(I 979) found them to be inferior to rectangular booms. The reason for thrs is simply that the
loading imp0sed on the boom duting the swing cycle is shared between the two outer
members (the third member being on the neutral axis for swing loading) and this re~alts in a
more uneven load distribution than is the case with a rectangular boom.
3.1. Mining methods
The most common mining methods asso<.:iated with dragiines will be discussed subsequently.
These form the basis of all operations and can be used in coritbination with shovels,
shovels/trucks/front end loader combinations, scrapers and BWE, depending on the lithology
of the mine. The number of individual ~ystems that can be used in total is therefore vast. The
different mining methods will be discussed undt>r single and double seam applications.
17
Stellenbosch University http://scholar.sun.ac.za

3.1.1 Single seam methods
3. 1. 1. 1. Side cast
This is the simplest and most desirable mining method. The overburden is removed in
thin strips from the area that is mined. Each strip is divided into lengths (the cut, set or
block length), which is excavated from several tub positions. The dragline swings
through about 90 degrees and casts into the empty pit where the coal has already been
removed (Humphrey, 1990). Figure 5 shows the dragline position with respect to the
pit when performing side casting.
=IT=~ + /+ S.T :+-•--~t---
1
T\1. -~-z. --FOSITiDNS "" •
J· .... .-SIT
LINOTH.
_L
L---·--1 I I I I· I I I
F1t0M WISITIDN I--T~ ,KDM miT:Io:it~J~;;·'---~{:_ _ __,..L.~-----
Figure 5: Simple side casting
18
Stellenbosch University http://scholar.sun.ac.za

The block is excavated with the dragline in several positions as shown in Figure 5.
From position 1 the key cut (the Cll! fixes the alignment and slope of the new highwall)
is made. According to Morey ( 1990) the key cut has to be made since the dragline
cannot control the bucket against an open face, which would result in the width of the
strip (or cut width) getting less as the dragline progresses. If the coal deposit is
shallow positions 1 and 2 might be adequate to mine the block, but with deeper
overburden the drag ropes will be pulled into the fact· and the dragline will have to be
moved forward, utilising positions 3 and 4. Positions 2 and 4 should be as close to the
previous highwall as possible (this is where the low bearing pressure of the dragline
becomes an advantage) as this will maximise the reach of the dragline. The method as
described here requires no rehandle, which, along with its simplicity, are the main
advantages.
This paragraph is applicable to all of the mining methods and not just to the simple side
cast method. When the dragline reaches the end of the strip, excavation cannot
continue immediately since the coal in the final set must be removed first. The dragline
can either walk back along the strip (termed deadheading) and start excavating the
e~~~~ffigi~trn~ITSfnlY~nctHwotS)ScMi&!Bi~eitoW~ t~~'lhYfnft>fef)1.0~Saim~a~
could be a problem though if the soil top layer is not firm enough to support the
dragline weight and the choice ol:-viously must depend on the strip length. Some mines
opt for deadheading if laying over would result in more than two shifts being lost
(Morey, 1990). If laying over is the selected option, maintenanl-~ should be scheduled
for that period (Humphrey, 1990)
19
Stellenbosch University http://scholar.sun.ac.za
3.1.1.2. Extended bench
Figure 6 shows the extended bench method.
Figure 6: The extended bench mining method.
This method is used when a mine has to make best use of the existing equipment and
the reach of the dragline needs to be extended. The dragline support level is extended
cut from the old highwall closer to the spoil. Tl:e material from which the extended
bench is built will normally come from the key cut. The material is then levelled and
the base prepared for the dragline. Here the lower bearing pressure is of advantage
again as this method cannot be employed with stripping shovels. The dragfine is then
repositioned on the extended bench to remove the material from the final cut and the
previous extended bench. The disadvantage of this method is that some material (the
material used to form the extended bench, coming from the key cut) .tust be rehandled
and in doing so lowers the productivity ofthe dragline. (Aiken and Gunnett, 1990 and
Hurnphrey, 1990)
20
Stellenbosch University http://scholar.sun.ac.za

3. 1 . 1 . 3 Advance bench
Figure 7 shows the advance bench method.
Figure 7: The advance bench mining method.
This method is used when the terrain is uneven or the top layer is unconsolidated
materi&l. The overburden is divided into an uprer and lower bench. The dragline is
positioned on the lower bench and the upper ber:.(:h is removed ahead of the dragline by
means of chop cutting (a digging method in which the bucket is dropped teeth first into
the overburden that is above tub height - this is a very wear intensive digging method
and the productivity is low because of low fill factors, long swing angles and longer
filling distances). Sometimes a buckwall at the toe of the spoil pile will be built from
more competent material first to contain the unconsolidated material.
21
Stellenbosch University http://scholar.sun.ac.za
The advantages of this digging method are that the required dragline reach is
shortened, rehandle may be avoided, a level return path for deadheading can be
provided and the dragline is positioned on mort: stable material. The disadvantages ?_; e
that, during chop cutting, the productivity is low and the wear on bucket and r~gging is
high, but the chop cutting should account for only a small percentage of ti1e time spent
di>~ging. (Humphrey, 1990: Morey, 1990~ Bertoldi, 1977~ PundH;i, 1981; Jinarajan,
1982 and A.iken and Gunnett, 1990). Aiken and Gunnett (19':.!0) also mention that it
might be more productive 'w do the prestripping (remov(; upper bench) by some other
means, for example semper~.
J.1.2 Two seam methods
These are mostly a combination 0f the above methods and will be discussed only
shortly. These methods could also be used in very deep single seem applications. It is
a brief summary ofHumiJhrey (1990).
3.1.2.1 Two- bench
Figure 8 shows the two bench method.
Figure 8: The two bench mining method.
22
Stellenbosch University http://scholar.sun.ac.za

This is the most straight forward of the two seam methods. The upper bench is
removed and spoiled in the bottom of the previous pit. A second dragline or a second
pass with the same dragline removes the lower bench and it is spoiled on top of the
first.
The disadvantages of this method are that the upper bur den highwall must be set back
tar enough to allow swinging clearance for the dragline on the lower bench. When
only one dragline is being used this method also results in conflicting requirements,
since a long reach is required when the dJ 3gline is positioned on the upper bench and a
high spoiling height is required when operating on the lower bench. This results in the
dragline being a mismatch for one of the situations.
3.1.2.2. Pullback
Figure 9 shows the pullback method.
Figure 9: The pullback bench mining method.
The spoil from the upper bench is removed as in the two ·· bench method. This spoil is
then levelled and a second pass is made with the dragline on the spoil bench. A
disadvantage of this method is that the operation from the spoil bench is not as efficient
as normal dragline operation.
23
Stellenbosch University http://scholar.sun.ac.za

3.1.2.3. Extended lower bench
Figure 10 shows the extended lower bench method.
/ \~/
Figure 10: The extended lower bench mining method.
This method is used to help equalise the size requirements for the two benches. The
material from the upper bench is placed against the lower bench highwall to form an
extended bench for excavation of the lower bench.
3.2. Drilling and Blasting
This is a very important part of the excavation process as this determines the fragmentation
which is essential for good productivity (Huddart and Runge, 1979; Jinarajan, 1982 and
Howarth et al., 1987) and the blasting design must be such that the best advantage is obtained
from the explosives energy.
Bauer and Crosby ( 1990B) divides drills into three groups, percussion, rotary and jet piercing
drills. Percussion drills plays only a minor role, rotary drills are the most popular and can be
used for drilling vertical and inclined holes while jet piercing drills is not popular due to the
cost of oxygen and fuel (being a bume1} Jinarajan (1982) mentions the use of rotary -
percussive drills in very hard rock. According to Jinarajan ( 1 982) the drills are either crawler
or wheel mounted. Crawler mounted drills withstand the rough conditions better and is
24
Stellenbosch University http://scholar.sun.ac.za
generally bigger than 250 mm, while wheel mounted drills are used for drills smaller than 250
mm and is more mobile.
3.2.1. Drilling and Blasting design
Holes are normally drilled vertically because it is easier, even though inclined holes
result in less vibration, more stable slopes and better fragmentation (Jinarajan, 1982
and Ball, 1988).
Bauer and Crosby ( 1990), Ball ( 1988) and Ash ( 1990) consider the hole diameter, hole
length, inclination, drilling pattern, the type, quantity and utilisation and the firing
sequence to be the important factors in designing a blast. Figure I I shows the blast
design parameters for a vertical hole.
H -B
__ __._ __ ~_-----
D
L
I -i
u _ _j_
H Bench height 8 Burden
T Stemming L Charge length U Subgrade
S Spacing 0 Hole diameter
Figure 11: Blast design for a vertical hole.
25
Stellenbosch University http://scholar.sun.ac.za

According to Ash ( 1990) the most important design parameter is the hole diameter as
that conti v:s the explosive quantity. Ash (1990) presents empirical relationships to
determine the appropriate dimensions given the bench height. Ball ( 1988) provides
rules of thumb for the blasting design. The burden (B) should be 3 0 (in hard rock) to
40 (in soft rock) times tte hole diameter (D). The spacing (S) should be 1 (in hard
rock) to 1.25 (in soft rock) times the burden (B). The subgrade (or subdrilling) (U)
should be 0.2 to 0.3 times the burden (B) except when blasting on the coal bed in
which case it should be negative. According to Ash ( 1990) the stemming (T) should
be 2/3 of the burden (B). The must common hole sizes are 143 and 162 mm (BalL
1988). Ash ( 1990) and Ball ( 1988} agrees on the fact that the best stemming material
is angular chippings. Holes can be collar or bottom primed depending on the blasting
design but bottom primed blasts are generally safer and the explosive energy utilisation
is better.
A ratio used to review blast results is the blasting ratio:
volume of rock broken (m 3 )
Blasting ratio=--------------'-...;._ ' mass of explosive used (kg) powder factor
(321.1.)
Throw or cast blasting is an attempt to shift some of the overburden towards the spoil
pile using the explosives energy. Morey ( 1990) doubts whether there is any real
advantage to be gained by that, since a Jot of grading is needed before the dragline can
start working and sometimes tht~ dragline is used to rebuild its own working bench.
3.2.2. Explosive:-.
According to Ash ( 1990) the most important properties of explosives are density,
sensitivity, sensitiveness, reaction velocity, water resistance and the fumes they
produce. Since drilling is expensive, explosives with a high density are preferred as
they have a higher energy output per unit volume. Sensitivity is the ease of initiation
and ~ensitiveness the ability of the reaction to continue once started. The reaction
26
Stellenbosch University http://scholar.sun.ac.za

velocity is the speed at which the explosive's reaction propagate. Water resistance is
important since water can cause lower energy release values or misfire in some
explosives. The fumes associated with explosives is important -.ince it could be toxic
and it could be trapped in pit bottoms if iis density is higher than that of air. A good
primer (identified by cap sensitivity S( · nore than 1.2, a high reaction velocity and
immunity to the environment) is import~ .. nt. Holes are normally either collar or bottom
primed.
Explosives that are commonly used can be divided into the following groups:
1. OCG: Opencast gelignite (Jinarajan, 1982). It is expensive but works under all
conditions including wate. y conditions. Being solid cartridges however some of
the explosive energy is lost in the airgap between the cartridge and the wall of the
borehole.
2. Slurries: (Jinarajan, 1982 and Bauer and Crosby, 1990). TNT and LOX are the
most popular, they are cheap and work under watery conditions. SMS (site mixed
slurries) is also used.
3. ANFO: (Jinarajan, 1982 and Bauer and Crosby, 1990). Ammonium Nitrate Fuel
Oil (ANFO) is cheap, but can only be used in dry conditions. When brown fumes
are present at blast it indicates an insufficient amount of explosive or watery
conditions. It has also got a low density. The low bulk density can be rectified by
adding emulc;;ions (45 to 50% of mix) resulting in heavy ANFO that can also be
used in wet conditions but is more expensive. Aluminium is added to the emulsion
to increase the SG and the sensitivity and glass microballoons can also be added to
increase sensitivity.
3.3. Selection and sizing of draglines
The selection of a dragline is mainly based on determining the required reach (horizontal
distance from tub centre to boom point) and the buci~et capacity or rated suspended load
based on an annual coal requirement (Hrebar and Dagdelen, 1976; Mooney and Gibson, 1979
and Humphrey, 1990). Speake et al. ( 1977) derived equations to determine the reach for a
27
Stellenbosch University http://scholar.sun.ac.za
dragline in a single, two and three seam mining application. using simple trigonometry and
considering a two dimensional cross sectional area ofthe pit.
The effective radius of the dragline is the dragline reach (or dumping radius) from which the
stand-off (horizontal distance from tub centre to old highwail crest) has been subtracted. The
stand-off varies for different applications, but should not be less than 75% of the tub diameter.
The allowable load (rate::i suspended load) is the w·eight of the bucket, rigging and overburden
carried and should be selected based on a 1 00% fill fuctor even if it is ~~ss, since overloading
of the boom can result in very expensive maintenance to be done later as well as downtime
resulting in loss of production.
Woodring and Sullivan ( 1990) discussed the selection of a dragline. From three options that
could be chosen they :;howed tha~ in some instances a longer ooorn combined with a smaller
bucket could be more efficient than a shorter boom with a bigger bucket In section 3.4.2 a
number of models attempting to optimise dragline operations are presented and it can be seen
that to obtain a true optimum would be very difficult. Mooney and Gibson ( 1979) mentioned
that, vvhen '-~:·lectin}~ il dragline ;~:;d trying to optirlli~e the operation, 1t 1s common to assume a
pit width (<strip width), but that dragline operations is dt:pendant on pit width, with the result
that the best ofthe few op1i::ms considered is taken which is not necessarily the optimum.
3.4. Performance and Produdivity
According to Bertoldi ( 1977) the main factors affecting dragline productivity are deadheading
(walking the machine without excavating), rehandling (rroving the same overburden twice),
chop down (excavating above tub level, letting the bucK.et drop teeth first into the overburden
which is a very wear intensive anJ inefficient excavation method) and keycutting (excavation
of a trench to form the new highwall).
28
Stellenbosch University http://scholar.sun.ac.za

Operators have a big influence on the productivity of the dragline as well as on the amount of
maintenance that will be needed. This is evidenced by the large number of training facilities
that exist.
3.4.1. Q~fin:.;..;, productivity
The most important performance variable for a dragline is the amount of ovuburden it
moves in a period of time. This is dependant on the number of cycles in a given time
and the volume moved with each cycle.
Number of cycles: Humphrey ( 1990) gives a breakdown to define the availability and
utilisatir-'1 of a dragline. The calendar hours (He) is the total number of hours in a
certain period, say a year. The scheduled hours (Hs; is the time it can be expected to
operate and is obtained after time for scheduled shutdowns, power shutdowns and
strikes have been subtracted from the calendar hours. The available hours (Ha) is tht';
time the machine is mechanically and electrically ready to operate and is obtained aft,!r
time for repair maintenance has been subtracted from the scheduled hours. The
operating hours (Hu) is the time in which the dragline is operating at full potentia.l -::nd
is obtained after time spent on walking, bench preparation and clean-up ha·v'e been
subtracted from the available hours H
The availability (A) is then defined as H: and
the utilisation (U) as fl, . With the average cycle time (Tc in seconds) known the H ,,
cyc!es per operating year can be calculated:
3600 Hs r.:ycles per year = -. -. - >< -- x A >< {!
le vear (3.4.11)
Volume moved per cycle: When the m,,teriai is blasted it expands (or swells) an::l the
hank cuhic yard swell factor (Fs) is defined as With the bucket capacity (Be)
loose cubic .van/ ·
29
Stellenbosch University http://scholar.sun.ac.za

known and assuming a till factor (Ffl for the bucket (defined as the 1)ercentage of the
bucket that is filled) the overburden moved per cycl~ can be calculated as:
overburden volume moved per LJ!Ct<! = _B_c >< l:f l·s
(3.4i.2)
f.'rom the above the total amount of overburden moved per year can be calculated by
multiplying equations (3.4.1.1.) and (3.4.1.2.) To determine the prime amount of
overburden moved per year the rehandle (percentage of overburden that must be
handled a second time) must be taken into account. From the above it can be seen that
the biggest bucket will not necessarily have the highest productivity, since a smaller,
lighter bucket might have a faster cycle time_
Of secondary importance is the amount of electrical energy consumed during the cycle,
with a lower energy consumption per cubic yard moved associated with a higher
efficiency. Electrical power is consumed in huge quantities by the dragline and
substantial financial gains is possible if reductions in this area is possible.
3.4.2. Optimisation
Optimisation of dragline excavatioi1 have received much attention_ The work that has
been done in this area, mostly was in one of four areas of which two will be discuss.ed
here_ The one was in mathematical models calculating or optimising dragline
productivity and a second was in monitoring the efficiency of the dragline so the mine
could know how the dragline was performing. Then efforts were also made to
increase the availability of the machine (decreasing the amount of unscheduled
maintenance) and a lot of effort went into c pt irnising drilling and blasting_
L4.2.l_ Mathematical models
Optimismg the overburden removal rate is very difficult, since a lot of factors need to
be taken into account. Several models in which the efficiency of mining a block or
strip, with the block and dragiine dimensions as inputs, have been developed_ Walk
30
Stellenbosch University http://scholar.sun.ac.za

and swing times are based 011 regression analysis done on actual recorded times and the
validity of the models were compared with actual dragline operations. Averages filling
times are used. Some of the models could incorporate rehandle in whidl case it was
used for the construction of an extended bench. (Bandopadhyay and Ramani;
Chatte1jee et al., 1975; Huddart and Runge, 1979 and Baafi et al, 1995)
Chatterjee et al. ( 197 5) summarises the most significant variables as
1. Number and location of dragline positions
2. Zones of digging from these positions.
3. Length, depth and width of each cut.
4. Length of strip.
5. Angle of repose of spoii pile.
6. Swell factor.
7. Dragline dimensions and spc~ifications.
These variables are interrelated, for example the pit width (or cut width) is a function
of the coal removal equipment (space needed), the overburden depth, the blasting
pattern, the material characteristics and dragline dimensions (Humphrev, 1990).
Huddart and Runge ( 1979) notes however, that the coal deposit and overburden depth
is fixed and that the dimensions that can be varied are pit width, bench height and
block length (usually the mine planning is done for an existing dragline, in other words
the dragline dimensions is fixed as well). The bench height is defined as the height
above the coal at which the dragline is positioned. The cut length, dugout length or
block length is the length between major digout cycles. The panel width, cut wila .I,
block width or strip width is the width of each consecutive strip that is mined.
The following general guidelines are suggested (the suggestions made by Chironis
( 1978) is based on productivity monitoring and not on a simulation model):
Block length: Of the three, dragline productivity is least sensitive to block length
(Huddart and Runge, 1979). According to Chironis ( 197S) the block length should be
31
Stellenbosch University http://scholar.sun.ac.za

as long as possible. This view is supported by Morey (1990) as long as the bucket
does not need to be cast beyond the reach ofthe boom.
Block width: Of the three, dragline productivity is most sensitive to block width
(Huddart and Runge, 1979). According to Bertoidi ( 1977) the narrowest practical pit
usually is the most economic since rehandle is minimised, dragline cycl time is
reduced and reclamation is easier and cheaper because of more clo<>ely spaced spoil
piles. Morey ( 1990) notes that narrow widths allow more flexibility with the
placement of spoil (which is of advantage for road construction) and that wider pits
require less dragline walk time. It is believed that a wider pit is beneficial up to the
point that rehandle is required, but the space needed to load coal at the bottom of the
pit, the mine layout and overburden depth may require pit widths in which rehandle is
needed.
Bench height: According to Morey ( !990) the bench height should be as high as
possible (within the reach ofthe dragline). This is probably to eliminate the amount of
pre-~ ·: · t>i~g that is done with machines that are less productive than draglines.
It is also suggested that the key cut should be as wide as possible without creating
rehandle (Chironis, i 978) and that, if the swing angle exceeds 150 degrees, a full 360
degree swing should be made (Chironis, 1978 and Jinarajan, 1982) since the
accelerating and decelerating times at the dumping position could then be saved.
According to (Chatterjee et al., 1975) contplete 30 modelling v,ould be of great
assistance in mine planning. Francis ( J 995) attempted exactly that, although the
project was not finished at the time of writing this thesis. The data used in the model
was obtained from a Tritronix T9000 sy~tem. This allowed the calculation of filling
time and payload as a function of dragline position and position where the bucket
started to fill. Swing and walk times were based on regression analysis. By dividing
the block to be mined (with the block dimensions as the input values) into several
sections and considering all feasible combinations of excavation the optimum mining
sequence could be calculated. Applied to simple side casting, the model predicted the
32
Stellenbosch University http://scholar.sun.ac.za

ideal zig zag pattern of dragline positioning. Refinement was still needed and the
model still needed to be extended to other mining methods by incorporating, for
example, rehandle
An Australian company, Earth Technology, developed a software package 3D-DIG
that models all aspects of dragline operations and, with the overburden, coal, dragline
dimensions, acceieration times and drag, hoist and swing speeds as inputs, calculates
the efficiency of mining a specific piece of the mine It graphically sho·..vs the mining
sequence on the computer and can incorporate rehandle and other operations
associated with the dragline (like prestripping with truck and shovel).
3.4.2.2. Monitoring systems
A number of monitOiing systems have been developed to monitor the performance of
draglines. These systems also guard against tightline situations and some of the
systems give feedback to the operator in order for him to realise what the effect of
changes in his operating style has on dragline performance. (Chironis, 1978; Kemp and
Chapman, 1978; Kemp and Horvath, 1979; Nicholas, 1978).
The Tritronics T9000 Dragline Performance Monitor records more than 40
performance variables for the dragline on each cycle. These.:.: variables include the
position of the bucket at start of fill and end of fill, swing angles, amount of
overburden moved, dumping heights, walking times, etc. (Francis, 1995). With this
infomtation the mine has got all information needed for good mine planning, for
evaluating operators and for comparison ot: for example, the effect of different buckets
on productivity, but it must be remembered that the operators and digging conditions
can have an influence on the result
J.S. Draeline Buckets
"Unfortunately bucket design is still an inexact science and there are no hard and fast rules to
follow" ( Pundari, 1981 ). Rowla'lds (1991) found this statement to be true and the work he
33
Stellenbosch University http://scholar.sun.ac.za

did on draglines is still considered to be the only report on dragline bucket design (Swiericzuk,
1994).
It was pointed out earlier that the skill of the operator is of great importance. but according to
Rowlands ( 1991) and from discussions with mine personnel, it is 0!Jvious that the bucket
influences dragline perfor!nance to a high extent. Rowlands ( 1991 ) identify areas in the
dragline operation in which improvements were made to increase productivity. These included
more powerful swing motors to reduce cycle time, increases in machine reliability by
performing preventative maintenance, improvements in pit design and mine planning (use of
computers), monitoring of the efficiency of the operation, training of the operators, better
blasting practices and the elimination of peak electrical loads. He then states that lightweight
buckets were the only documented improvements in bucket desigr and that it was a neglected
area - it seems as if the mines had something that worked and nobody bothered trying to
improve it. When considering the amount of effort that has gone into dragline research in
general, it is obvious that the need exists to improve bucket design, since it is widely known
that small increases in productivity could yield huge extra earnings in terms of increased
production. In South Africa it is generally accepted that an increase in productivity of 1% can
yield increases in production worth R 1 million a year per dragline. An increase of 9% for
example for a mine having four draglines, result~ in roughly R36 million a year increase in
production.
3.5.!. Rigging
The dragline bucket is manipulated by the drag and hoist ropes (Figure 2 on page 1 3 ).
The hoist rope is used to raise and lower the bucket and the drag rope to move it
forward and backward. The carry angle of the bucket (Figure 3 page 14} is controlied
by the tension in the dump rope which is mainly influenced by the drag rope.
(Humphrey, 1990).
Knights and Shanks ( 1992) developed a model to calculate the carry angle of the
bucket in the two dimensional space under the dragline boom The model was based
34
Stellenbosch University http://scholar.sun.ac.za

on statics (observation of working buckets suggested that dynamic effects are 01,
important when the r·ICket is dumping). The model allows easy visual comparison
between different rigging options and calculates the forces in each component. Figure
12 (taken from Knights and Shanks ( 1992)) plots constant carry angle curves for a
typi<:al rigging setup. It can be noted that the constant carry angle curves more or
less follows the trajectory of the bucket, meaning that the bucket could be kept dose
to its carry angle at disengagement almost to the dumping point. This of course is an
aim of rigging design, since material is lost either from the !TIOuth or the back of the
bucket wh..:n the carry angle changes.
...... ,
j-- ........... , ......... , ........ .
Height 60
5B
49 I I
39 I .. -.. ,
')r ... J
1B g
........... ,_10 I ........ ,_ ')n
' "'tJ I i
:-3g
( I'! )
Figure 12: Lines of constant carry angle in the 2D space under the dragline boom.
[Knights and Shanks. 1992]
35
Stellenbosch University http://scholar.sun.ac.za

Rigging design has changed very little since the dragline has been born. The most
noticeable changes are the connecting of the dump rope to the top rail instead of the
arch (only in a few cases), which is probably to reduce the loading on the arch, and the
use of inside trunnions by Bucyrus Erie (BE) in orde1 to ..:l.iminate the spreader bar.
According to Ferreira ( 1997) the inside trunnions also suffer less abrasive wear, since
the material in contact with it is at rest, while the outside trunnions is being pulled
through the material continuously. During the development, that led to the inside
trunnion configuration, they also discovered that the position of the hoist trunnion in
particular is very important in the bucket design - shifting it to the top rail resulted in
inadequate dumping, while shifting it to the back of the bucket resulted in premature
dumping
Lumley ·:md Jensen (1996) did a rigging study on several scale size buckets and they
came to the very important conclusion that, provided the bucket is set up at it's
optimum carry angle by changing the dump rope length, the length 0f the hoist and
drag chains, within reason, will not affect the productivity of the bucket to a high
extent.
3.5.2. Filling behaviour
3.5.2.1. Performance measurement
The most important performance variable is the filling distance (Rowlands, 1991 ).
Apart from the saving in time, an additional advantage of minimising tiilmg di::,t.mce is
t'-1at it reduces the amount of wear on the bucket.
The other important performance variable is the amount of payload picked up by the
bucket. These two variables result in the amount of overburden moved in a certain
period of time which is the way a mine evaluates the performance of a bucket.
Another commonly used method of comparing the performance of ground engaging
equipment is by calculating the specific di.gging energy (a measure of the ease of
36
Stellenbosch University http://scholar.sun.ac.za

digging) (Hendricks et al., 1988). This is the amount of energy absorbed to excavate a
unit volume of overburden. In the documented project, buckets of constant volurr.e
were used and were therefore compared on the basis of the amount of energy absorbed
to fill
The amount of drag power available is limited and too high drag power requirements
can cause the bucket to stall. This can be overcome by applying some hoist force
which causes the required drag force to drop (like a plow behind a tractor) and the
bucket can commence to fill. This however will waste some time and the length to fill
will be lengthened somewhat Also, with the DC motor characteristics that reduces
speed at higher torque requirements, it follows that the filling time for the same
distance will be more in the case of high force requirements. All considering,
geometrical changes should keep the required drag force as low as possible.
3. 5. 2. 2. Influencing factors
Overburden: The overburden does have a big influence on the performance of the
bucket, not only on the filling performance, but also on the life of the bucket due to
abrasion. As was discussed in section 3.2. the fragmentation is very important. In wet
conditions overburden with a high clay content can cause plugging of the bucket. The
influence of overburden characteristics on dragline bucket:; has, apart from
fragmentation, however not been well researched.
Bucket geometry: This was what was to be established in this project The work that
has been done on it previously is discussed in section 5. 1. Pundari ( 1981) and
Rowlands ( 1991) suggest that it would be difficult to come up with a single design that
will work well under all conditions and ~'" cr0motes the idea of designing buckets for
specific purposes. Hovvever, one still wants a bucket that will perform well under a
range of conditions. The most important factors influencing dragline bucket filling
were found by Rowlands ( 1 991) to be bucket width, hitch height, angle of attack of
teeth and teeth length
37
Stellenbosch University http://scholar.sun.ac.za
4. CONSTRUCTION OF THE SCALE MODEL DRAGLINE.
The purpose of the scale model dragline (see Figures 13 and I 4) was to operate the
scaled bucket in a similar fashion as a reai size bucket It is therefore obvious that the
operating parts that would influence the bucket had to be designed with great care.
The construction of the scale model dragline (hereafter SMD) will only be presented
briefly (considering that really only the hoist and drag motors and the data
aquisitioning system is necessary to obtain tilling data) The author was solely
responsible for designing and had one boiler maker to assist in the construction of the
SMD - it amounted to more than half a year of hard work and therefore accaunts for
much of the effort going ir,::o the project as a whole, even though not reported in
detail. There were for example a lot of general strength calculations, calculations for
the expected life from bearings, etc. that are not included. The author was also solely
responsible for sourcing and ordering parts which account for a Jot of effort when
taken down to the level of circlips, bearings and keys for shafts.
It could be argue<! that for the tests one really only needs a rig similar to the large scale
test rig presented by Rowlands ( 1991 ), but it was realised that, once finished, the SMD
had huge possibilities in terms of training and when presenting the testing facility to
potential customers a scaled down version of a dragline wvuld make a bigger
impression than a rig. Another advantage of the SMD IS that it can be used in
productivity studies and for dynamic simulation of rigging.
-t.l. General
The SMD was constructed on the tracks and rotating frame of a O&K RH6 excavator
that had been scrapped. The rotating frame was broken loose from the tracks.
The swing bearing was first taken from the rotating frame, it was stripped, cleaned,
lubricated and reassembled. A new mount was Lbricated and used to mount the
bearing on the tracks All the cracks on the tracks and rotating frame were gouged
and repaired welded. An extension to the rotating frame was made to allow for the
cabin and the rotating frame was then assembled on the tracks.
38
Stellenbosch University http://scholar.sun.ac.za
Figure 13: The scale model dragline
' . \,:···\
.~.,···"'.'.·'s·.c,.., .~ . -~
~· . . . : .· ..
' .. ··.:.
Figure 14: Layout ofthe swing, drag and hoist motors
Stellenbosch University http://scholar.sun.ac.za
The boom of the mini-dragline was made twelve metres long (scaled down 1 to I 0
frorr, a real dragline). It was made up in sections that were then bolted together. This
allows the boom to be changed to virtually any iength required The support for the
boom consists of the mast (fi·om which tv.;o cables run to boom-poin!) which in turn is
supported by the backlegs
The hydraulic powerpack and electric motors with control panel were fitted on tht>
rotating frame that was covered by the machinery house. The rotating frame for the
machinery house was made from rectangular tubing and was covered by 3 mm
steelplate. It was split in half to allow for removal of the machinery house. On the
side a sliding door was fitted with windows right aruund. The machinery house was
designed to be weatherproof - the only possible leak is were the hoist cable goes
through the roof. The cabin was built in a similar way. Large windows \vere placed in
front to allow for good visibility. The operator chair, controls and the data acquisition
system were fitted inside the cabin. The cabin was also designed to be removable and
was also mad~ weatherproof
4.2 Sizing of the Drag, Swing and Hoist motor ..
As far as the filling of the bucket is concerned these are the most important
components by far. The same motor was selected for all three components. It was a
180 Volt DC motor. Choo::;ing an AC motor woul~ have been cheaper but the control
would have been more expensive and, since on draglines DC motors are generally
used, DC motors were chosen for the application. The rontwl on the motors involved
the ability to set a maximum speed and torque for the motors. The speed of the
motors are also proportional to the amount that the controls (two joysticks for drag
and hoist and two footpedals for swing) are moved. The acceleration and deceleration
times can also be changed - thi~ is important in order not to put to high stresses on the
boom when the bucket is swinging and for training purposes it provides the ability to
obtain the same 'feel' as on a real jragline
The gearboxes that were chosen for the hoist and drag motors are I :97 in-line
gc:::arboxes. The swing gearbox is a right angle bevel gear gearbox with ratio 1: I OS. A
40
Stellenbosch University http://scholar.sun.ac.za

worm drive gearbox could not be selected - even though the acceleration and
deceleration could be changed, a power failure could cause se,·ere damagt: to the
gearbox (and machine) since it is not reversible and would '~ome to ao abrupt stnp -
this would have a catastrophic result when the machine is swinging due to the large
moment of inertia. Subscquemly the procedure for sizing the motors is presented
In the end three similar motors were chosen - it means fewer different parts on the
SMD and the excess power presented no problems, since it could be limited.
:-'.2.1. Swing motor
The power fx the swing motor was determined by calculating the approximate
moment o/ inertia around the swing axis and, wanting the dragline to acceler.qte
fi·om standstill to about 2. 5 rpm (estimated required maximum} in 15 degrees, the
i:orque and therefore the power requirements l:ould be calculated The moment of
inertia was estimated to be approximately 70 000 kg. m 1 . This was calculated by
breaking the SMD up into masses at specified distances from the rotation axis and
incorporating a safety factor Jf 1.5 ·-~ allow for uncertainties. The angular
acceleration required could then be calculated from:
(42.1!.)
( Sauer et al., 1986) where
- 2;r N . 0 = ---- IS the angular velol:ity and 60 ~ . (42.12.)
N = rev/min
\Nith 0 = 0 0 '
15 Jr 0 = -- and lv = 2.5 rpm the angultr acceleration was calculated
180
as 0 = 0.131 rad Is 1 . The required torque could then be calculated from
T=IG (4.21 3.)
41
Stellenbosch University http://scholar.sun.ac.za
giving T = 9163 Nm
With the required speed of2.5 rpm the power required could be calculated from:
P=T0 (42.1.4.)
giving 2.4 kW. With the gearbox driving a 15 tooth pinion which in turn drives a 95
tooth internal gear (effectively a second gearbox) and assuming a 90% efficiency for
b0th, the required power output rrom the motor is:
P = 2
.4 = 2.96 kW 0.9 X 0.9
The above approach is conservative in the sense that the torque output from a DC
motor is high at low speed and low at high speed. The calculations were done fix a
high torque and speed. The maximum output speed of the motor is 1750 rpm.
With a 1:105 and 15:95 gearbox in series the maximum rotational speed of the
SMD would be:
Ns 1m =1750xli105><15i95=2.63 rpm
The above show that the setected motor can provide the required power and that
the rotational speed ofthe SMD is sufficient with the gearbox as selected.
4.2.2. Drag motor
The power for the drag motors could be calculated from the required force in the
rope, the speed at which the bucket had to move and the radius of the drag drum.
The maximum drag speed of a Marion 8050 dragline is approximately 2.5 mis
{Rowlands, 1991 ). Determining the maximum drag force expected, proved to be
not all that easy. Rowlands ( 1991) presents ti1e following empirical, line?r
42
Stellenbosch University http://scholar.sun.ac.za

relationship between bucket size and drag stall force by plotting data for several
draglines:
F(kN) = 40.4 x 1 '(m 3) + 688 (4.2.2.1)
where:
F = Drag stall force (kN)
V= Bucket capacity (cubic metres)
Obviously this cannot hold for small buckets, since a zero volume bucket would
require a 688 kN drag stall force. It is however significant that the plotted data
showed a linear relationship between bucket size and drag stall force. It was then
argued that if data on the maximum drag force measured in similar tests for both a
smaller and bigger bucket than the typical 60 litre bucket that would be used in the
tests could be obtained, scaling it linear according to equation (4.2.2.2.) would
result in one of the values being conservative.
(4.2 2.2)
V= volume (I)
I· ~60 = drag stall force for 60 litre bucket (units same as 1r.. ~.w
!;~ 1 • = drag stall force for V litre bucket
Swiericzuk ( 1994) did rigging experiments on a 14.5 litre bucket for his engineering
degree at the University of Queensland. The maximum drag force measured by him
was about 1 1 00 N, which translates to 4 3 71 N ( 446 kg) drag force required for a 60
litre bucket, according to equation (4.2.2.2)
Rowlands (1991) measured a maximum drag force of 28300 N for a 250 litre
bucket, which equates to 6792 N (692 kg) for a 60 litre bucket From equations
43
Stellenbosch University http://scholar.sun.ac.za

(42.1.2), (4.2.1.3.) and (4.21.4.) the output torque of the motor could be
calculated as 20.19 Nm (speed of motor is 1750 rpm and power is 3700 W). With a
1 :97 gearbox and assuming an efficiency of 90 percent, the output torque from the
gearbox is 1763 Nm. For a 0.18 metre radius drum, the force that can be applied
was calculated to be 9792 N (998 kg). It can be seen that this is sufficient for the
purpose, allowing a fair margin for the uncertainties such as digging material,
bucket width etc.
The maximum output speed from the gearbox is 18.04 rpm (i 750/97) or 0.3 rev/s.
The drag drum has a 0.18 metre radius and thus a 1.131 metre circumference and
the resulting maximum speed of~l-te buc:(et !:::. U.34 rrJs, \lhich is mo -~ th::m sufficient
for a tenth scale model.
The above calculations show that the selected motor m·~d gearbox easily answer to
the set requirements.
4.2.3. Hoist motor
Th~ selected motor and gearbo;{ to1· hoi::.ting the bucket are exactly the same as for
the d;·a.g. The spe~.d has already been shown to be sufficient. The force in a rope
with a mass hanging to it is proportional to the mass and also to the volume since
m==pV (4231.)
ar1d therefore a similar relationship exists for the hoist force as for the drag force.
Swiericzuk ( 1994) reports a maximum hoist force of 560 N that equates to a 2225
N (227 kg) required hoist force for a 60 litre bucket ;:-J·\~ it is clnr that the selected
motor satisfies the requirements.
44
Stellenbosch University http://scholar.sun.ac.za

4 . .>. Electrical system and controls
The electrical system is fairly simple. The incoming power source to the SMD is 380
V AC. To transfer the power to the rotating body, not twisting the cable, a slip ring
was mounted on the slew distributor (see next section). From there the power was
transferred to the control box that also contains the DC drives. It was then transferred
to the drag-, swing-, hoist- and hydraulic motors, each having a switch in the cabin
within easy reach of the operator.
The controls consist of two joysticks - the right hand side being for the drag and the
left hand side for the hoist. Then there are two foot pedals for the swing and !he
hydraulic valves for operating the tracks. The drag joystick was wired such that the
bucket moves toward the operato:- when being pulled and away when being pushed as
on most draglines. Pulling the hoist joystick causes the bucket to lift (and visa versa)
and the machine swings to the side ofthe foot pedal that is activated.
4.4 Hydraulics
A fairly simple hydraulic layout was chosen to drive the tracks. It consi~i.S of a
gearpump capable of delivering appmximately 67 l!min at 25 MPa. It is driven by a 22
kW 380 V AC motor. Calculating the actual pressure and flow rate was a problem
since no specifications were available on the hydraulic motors nor on the final drive -
not even from the distributors The expert knowledge of a hydraulic company
(HYTEC) was called on who, from previous experience, were able to supply a system
that worked. The capacity of the tank is 260 litres, which might not be enough to
dissipate the generated heat in rhe long run, but, since the SMD would be required to
neither travel often nor travel long distances, the size was limited mainly due to space
problems.
The hydraulic valve also forms the controls for the tracks and was placed in the cabin
within easy reach of the operator. The hydraulic oil passes through the valves (one
valve for each track) and through a slew distributor that prevents the hydraulic hoses
from twisting and eventually breaking. There are five lines through the slew distributor
- two for each hydraulic motor (one is a supply line and the other a return line) and one
45
Stellenbosch University http://scholar.sun.ac.za
for the combined leak lines. Having passed through the hydraulic motor (the direction
is being determined by the valve) the oil then passes back through the slew distributor
through a filter and into the tank.
As mentioned in the previous section, the incoming power is transferred to the rotating
car body through a slip ring. Obviously the slip ring and the slew distributor had to be
mounted on tr~ rotation centre of the frame on the tracks - this was accomplished by
manufacturing the slew distributor with a hole through its centre with the slip ring
mounted on top of the slew distributor. The power cable to the slip ring could then be
passed through the hole.
4.5 Rigging
It is a well known fact that the rigging of a dragline is of great importance, since the
configuration influences, among others, the forces in the ropes, the carry angle of the
bucket, the suspended load, the load carrying capability in the two dimensional space
under the boom and the dumping characteristics.
It however proved to be very difficult to get a representative set-up. Because of
competition between companies, the rigging manufacturers like ESCO and Scheffer
Mechanical were not willing to supply any information regarding weights or 5izes -
they were concerned about the fact that Barlows might start manufacturing rigging.
The wear on the rigging is also very extensive, especially on the drag chains. The
chains lose mass (up to 50 percent in ten months according to Smit (1996)) and wear
in the crotches cause the inside length of the shackle to increase. Both of the above
factors cause the distribution of weight to vary. The rigging had to be manufactured
from commercially available chain, cable and D-shackles due to time and financial
limitations and therefo1 e perfect scaling was not possible. Since this project was
primarily focused on the influence of the bucket filling performance due to geometry
and with a rigging testing programme already defined, it was decided to do the best
possible given the limitations.
46
Stellenbosch University http://scholar.sun.ac.za

The best that could be done was to visit a mine and measure the rigging components.
The 1igging that wa~ measured was standard ESCO rigging. The weights were
estimated from data supplied from the mine for example for a 23 shackle drag chain
with two pearlinks.
It was estimated that a drag link weighs approximately 90 - ! 00 kilogram and have an
effective inside length of 400 mm. Scaling the effective length by a factor of ten and
the mass by a factor of thousand (linear scale to the power three) a 1ink with a inside
length of 40 mm and a mass of 90 - 1 00 g would be representative. The best that
could be done was an inside length of 39 mm and a mass of 80 g. It was slightly
lighter than what was >Jeeded -but it would account for a rigging set-up having worn a
bit.
The hoist chains were estimated to be between 42 - 46 kilogram and of inside length
300 mm. The closest to the scaled version that could be found was a 30 g link with
inside length of 29 mm. The dimensions of the spreader bar varies according to the
width of the bucket. At Optimum Colliery the spreader bar is made one meter wider
than the bucket and this approach was followed in the experiments. Dimensions for
the dump block were measured and scaled down linearly. The drag and hoist ropes
usually are 90 mm :'1 diameter and in a double dump configuration the dump ropes are
about 50 mm in diameter. These values were scaled down linearly.
4.6 Data acquisition system
The data acquisitioning system obviously is very important. The system consists of
five loadcells, an inclinometer, a potentiometer, an amplifier/power supply and a
PCMCIA data acquisition card.
The loadcells were fitted in line on two drag ropes, two dump ropes (for a double
dump configuration) and one hoist rope. The loadcells in the drag ropes were two 500
kg loadcells (selected on the basis ofthe c::tlculations in section 4.2.1.2). The loadcell
in the hoist rope was also a 500 kg load cell (selected on the basis of the calculations
made in section 4.2.1.3 ), while the loadcells in the dump ropes were I 00 kg loadcells
47
Stellenbosch University http://scholar.sun.ac.za
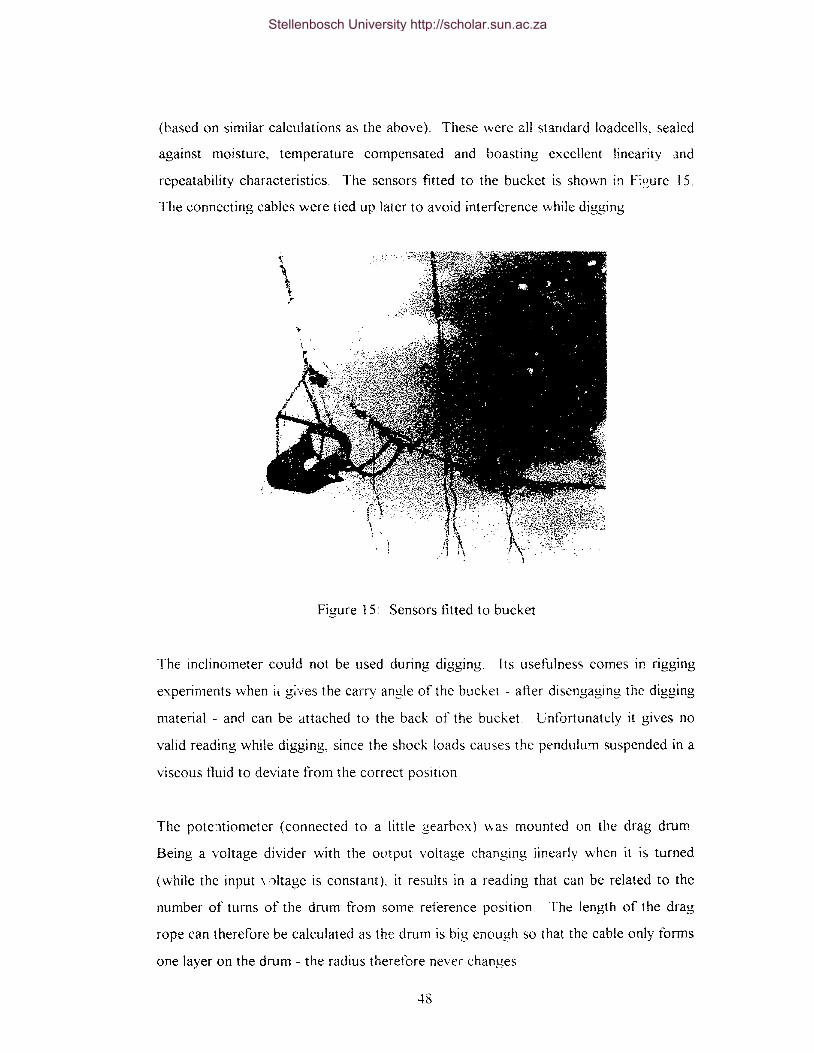
(based on similar calculations as the above) These were all standard Joadcells, sealed
against moisture, temperature compensated and boasting excellent linearity and
repeatability characteristics. The sensors fitted to the bucket is shown i~ Fi~~ure l5.
The connecting cables were tied up later to avoid interference while digging
Figure 1 5: Sensors fitted to bucket
The inclinometer could not be used during digging Its usefulness comes in rigging
experiments when il g;ves the carry angle of the bucket - after disengaging the digging
material - and can be attached to the back of the bucket. L;nfortunately it gives no
valid reading while digging, since the shock loads causes the pendulum suspended in a
viscous tluid to deviate from the correct position
The pote:ltiometer (connected to a little gearbox) v,as mounted on the drag drum.
Being a voltage divider with the output voltage changing linearly when it is turned
(while the input ' ·1ltage is constant), it results in a reading that can be related to the
number of turns of the drum from some reference position The length of the drag
rope can therefore be calculated as the drum is big enough so that the cable only forms
one layer on the drum - the radius therefore never changes
.f8
Stellenbosch University http://scholar.sun.ac.za
A custom huilt amplifier/power supply was purchased. It provides the excitation
voltage for the loadcells, amplifying the resulting signal (full scale 5 Volts representing
500 kg) as well as being a power supply for !he inclinometer and potentiometer and
measuring : '· '~ resulting signal. A digital read out with channel selector eased the
calibration. The output from the amplifier/power supply was fed into a twelve bit
PCMCIA card that plugged into a personal computer and the data was written to a file
with a simple software programme. All readings were taken ten times a second and
therefore a twenty hertz filter was build into the amplifier/power supply to avoid
aliasing. This provided a continuous set of readings for all the measured values.
The loadcells were simply calibrated by zeroing and then hanging weights from it. This
was repeated to assure repeatability, which was found to be within 1%. The
potentiometer was calibrated by taking readings and measuring the distance from the
fairleads to the drag hitch. A regression line was then titted through these points,
resulting in an equation relating a voltage to distance from the fairlead. To test for
repeatability a piece of masking tape was attached to the drag rope just in front of the
fairleads. The displayed measurement was then noted. The drag rope was paid out
and pulled in till the same value was displayed on the digital readout. The position of
the masking tape was noted ana it was found that repeatability was very good (within
about 10 mm). In order to check that the results for a specific test set-up would be
reproducible, twenty runs were done, the results of which is summarised in Table 1.
The values in brackets indicate what percentage or percentage change of the average a
given value represents. It can be ::,een that the repeatability of results were good
(especially the filling distance which is the most critical performance parameter) when
considering the testing environment.
Table 1: Reproducibility oftests
average standard minimum maximum
deviation
filling distance (m) 2.107 0.052 (2.47) 2.008 (4.7) 2.233 (6)
filling ene~gy (J) 3780 149 (3.94) 3528 (6.7) 4048 (7.1)
drag force (kg) 384 16 (4.2) 357 (7) 410 (6.8)
49
Stellenbosch University http://scholar.sun.ac.za
5. EXPERIMENTAL PROCEDURE.
Swiericzuk (1994) who at that time was studying at the University of Queensland, where
substantial research is being done on draglines states: " .. .Jeff Rowlands commenced work
towards a PhD through The University of Queensland, studying ['l··agline Bucket Design
(Rowlands, 1991 ). This was widely accepted as the first detailed report centred on the
filling and design of dragli:1~ buckets." When searching for literature on draglines this
statement was found to be valid A let of literature exists on draglines in general, but very
little on the bucket itself Anothc~r pmblem is that, since there are considerable profits to
be made on iragline buckets. work that has been done on the subject is cften confidential
and therefore impossible to obtain.
It must also be mentioned that scale m-.'del testing of draglines is being done at a number
of institutions. This proves that there is some merit in scale model testing. The University
of Illinois has a training facility in which a l: 150 scaie dragline is used and the image
magnified onto a screen for training purposes (Anon., 1994). At the University of
Queensland the large scale test rig and a model similar to the one at the Urtiversity of
Illinois exists (Sharrock et al., 1996). Scale model draglines (1:10 scale as well) are used
by two Australian companies, ACIRL and Dragline Technologies, for research and
training. Jt must however be stressed that these companies focus primarily on training and
research, while Wright Equipment is believed to be the only bucket manufacturer with this
ability.
5.1 Work done by Rowlands ( 1991)
!n his report Rowlands ( 1991) on a number of occasions pointed out that there really has
bc:en done no comprehensive work on the dragline bucket itself, even though a lot of
em?hasis was placed on draglines in general The need for further research on the subject
was also emphasised. Because of the uniqueness of the report it was studied in great
depth in order to set up a testing facility and an appropriate expErimental procedure.
50
Stellenbosch University http://scholar.sun.ac.za
The work done by Row lands (1991) included test work on a11 existing Small Scale Test
Rig, which basically is a structure and motors simulating the drag and hoist functions of a
dragline and aliowed the simulation of the motion of the bucket during ara6ging and
hoisting. The size ofthe bucket used was 1.3 litres. Thereafter a Two Dimensional Test
Rig was built consisting of a bucket profile (slice taken out of the middle) running between
two glass plates. This was done to observe material flow characteristics and helped in the
development ofthe Shear Zone Theory.
The final stage of the project involved the construction of a Large Scale Test Rig which
proved to be the most useful part for designing the experiments presented here since the
raw data was included in the text. The aim his experiments was to determine factors that
had a definite effect on the performance of a dragline bucket.
For these experiments two buckets were used - a Standard (STD) and a University of
Queensland (UQ) bucket, with the UQ bucket having been wider and correspondingly
shorter to obtain approximately similar volumes. They were testea in two different
matciials- gravel (Gravel) and decomposed granite (Deco). Short (S) and long (L) teeth
were used in the experiments as wdl as a low (L) and high (H) angle of atta~k (only the
short teeth were tested at a high angle of attack). Weights (a choice between one and
1\.vo) were attached to the back of the bucket to correspondingly move the centre of
gravity. The designation of the tests was done in the following consistent way -
(bucket)(material)(length of teeth)(angle of attack of teeth)(number of ballast
weights)(hitch height). A typical Oi;:signation would be STD Deco SL 12 - meaning the
test was done with the standard bucket in the decomposed granite, using shmi teeth with 8
low angle of attack, with one weight attached to the back of the bucket and the drag chain
in hitch number two
As can be seen the factors that influence the performance of the bucket v..as investigated,
but no effort was made to optimise any of these which was the main objective of this
project when it was originated.
51
Stellenbosch University http://scholar.sun.ac.za

The work as presented in this thesis differs from that of Row;ands ( 1991) in the following
aspects:
I. The geometry of the different buckets were comparable in th;}t the relative position of
the teeth, "~n!re of gravit) and hitch height were the :.ame and the buskets were
exactly the same weight anc: size.
2. Trends for changes in specific parameters were established 'Tlore clearly. This was
possible since more values of each variable were tested (for example four bucket
'vvidths instead of two) and these valves covered a s;naller range, causing the bucket to
till in all instances. In the case of Rowlands ( 1991) the spread was very, causing the
bucket not to fill in a lot of instances and this prevented clear trends to be established.
3. Row lands ( I 091) did not comment Ol' the increase in required drag force that would
be caused with his proposed changes. This is seen to be quite important and is
discussed in detail in section 7. 7.
5.2 Oetermining the parameter-s and sew en er of testing
5.2.1. General discussion of far*prs involved
The digging cycle is a very complex and not we!~ u11derstood part of the
excavation cycle. Then it also is true that there is a ·vast numher of factors that
influer.ce this cycle and they can be split up into four categories - those that are site
related, those that are machine related, those that are bucket related and those that
are rigging related.
Factors that are site related: drag angle, start drag distance from
fairleads, type of material, size and
distribution (fragment!'ltion), angle of
repose of the digging material, cohesion of
the digging material, moisture content of
the digging material.
Stellenbosch University http://scholar.sun.ac.za

Factors that are bucket related:
F~ctors that are machine related:
Factors that are rigging related:
position of the drag hitch (vertically and
horizontally), position of the hoist trunnion
(vertically and horizontally), the position of
the centre of gravity (vertically and
horizontally), mass, length ofbucket, width
ofbucket, height ofbucket length ofteeth_
angle of attack of teeth, number of teeth,
etc.
available drag power drag speed and rated
suspended load.
the lengths of the drag and upper and
lower hoist chain along with the dump
rope length determine the carry anglt>,
which was the irvst important nggmg
related parameter (see section 5.3).
The above is by no means a complete list of the factors influencint; bucket
performance. It just serves to illustrate that the number of factors that one ideally
would like to test quickly becomes almost uncontrollable. Bearing in mind that
wanting to rio m variations of n variables requires n"' tests, it becomes clear that
really only the most important factors shol!ld be included in the experiments.
5 .. 2.2. Determining the importance of factors
According to Rowlands ( 1991) the single most importan;' factor influencing the
performance ofthe dragline buc!<et is hitch height The tests performed by him ~as
discussed in section 3. 1) were sorted into groups, for example STD Deco SL 11 to
STD Deco SL 15 - a specific group therefore represents only a change in hitch
height (from l to 5 ).
Stellenbosch University http://scholar.sun.ac.za
The raw data (Rowlands, 1991) was then used to determine the relative influence
of the factors that had been tested. In each group the minimum filling distance and
corresponding specific digging energy (SDE) were noted as well as the hitch
height at which they occurreJ. The hitch height was therefore ignored when
comparisons were made - thus in all comparisons an optimum hitch height was
assumed (the optimum hitch height was noted however to allow for the
observation of trends). This optimum could now be described by the followmg
designation - STD Deco SL 1. Note that the last number referring to the hitch
height has been left out (the '1' therefore corresponds to one weight added to the
rear of the bu..:kt::t). The comparisons could then be made to these optimum
values.
5.2.2.1 Influence of a change in bucket width
The UQ bucket was made 33% wider than the STD bucket. It is a big chanee, like
all the others (as will be shown in sections 5.2.2.2), and it was concluded that
comparing the different factors (even though not hundred percent correct) would
give valuable information .as to their relative influence.
For investigating the influence of change in bucket width, the data was compared
as in Table AI, Appendix A The bucket designation (UQ or STD) was taken out
of the designation, leaving for example Deco SL 1 (tests done in decomposed
granite, with short teeth, low angle of attack and with one weight added to the rear
of the bucket). The optimum values were then plotted in two columns, STD and
UQ. The difference between the two buckets under the same circumstances (the
only difference having been the hitch position which was taken as the optimum for
each individual bucket) could then be compared.
The above was done for all the different groups. The difference in the filling
distance and the SDE were then calculated for each group and the average was
obtained. This average was used to determine the importance of the difference (in
54
Stellenbosch University http://scholar.sun.ac.za

this case bucket width) - if it had a large value the difference was seen to be
important and visa versa. The average difference for a change in bucket width was
0.52 meter for the filling distance and 19.87 for the SDE (specific digging energy
(J/cubic meter)). The average difference in filling distance was about 20% which is
substantial.
5.2.2.2 Rating of the importance of other factors that influence digging
~ormance.
The other factors that were investigated were length of teeth, digging materia.l,
angle of attack and change in ce11tre of gnwity.
The teeth length was changed from 120 to 185 mm (54% increase). The
difference in digging material could not be quantified but their physical properties
were completely different. The one wr.s gravel (like being used to built tar roads)
distributed narrowly around a median particle of size of 14.3 mm (between 6 and
25 mm). The other was decomposed granite with a median particle size of 1.5 mm
being distributed from fines (therefore high clay content) to almost 50 mm.
The angle of attack was changed from 45 to 55 degrees (22% increase) and the
change in centre of gravity was obtained by adding an extra weight of 3 7. 5 kg to
the back of a 13 7. 5 kg bucket ( 1 00 kg bucket plus one 3 7. 5 kg weight that was
always attached). The change in the centre of gravity therefore was also
significant.
Similar tables (Table A2 to A6, Appendix A) as the one described in the previous
section were drawn up for differences in teeth length, digging material, angle of
attack and change in centre of gravity. The results (absolute values) are shown in
Table 2:
55
Stellenbosch University http://scholar.sun.ac.za
Table 2: Rating ofthe importance offactors i~fluencing bucket filling.
Average difference in Average
filling distance. difference in SDE
Bucket width 0.52 19.87 ----
Length of teeth 0.34 18.15
Digging material 0.20 14.93
Angle of attack 0.16 7.03
Change in COG 0.02 8.01
It can be seen that the bucket design (width) is by far the most important factor.
The length of the teeth, the material in which the bucket digs and the angle of
attack to a lesser extent also have a significant influence.
It can also be seen that a change in centre of gravity does not influence the
perfcnnance of the bucket much - the optimum hitch height just changes to obtain
a new equilibrium of forces. Note: {f the optimum hitch height is not changed the
sh{ft in ( YJG uymfd have a pronounced effect on the peiformance c?f the bucket.
It is also interesting that there is no evidence that the bucket filled better when it
was heavier (two weights attached and hitch height changed to compensate for the
shitl: in COG). This might lead to the conclusion that, in well-fragmented material,
the bucket weight does not have a big influence on digging performance.
5.2.3 Sequence of testing
It was pointed out earlier that the number of tests needed to be done, to test a
certain number of variables, increases dramatically as the variables increase. A fair
number of variables have to be tested to obtain useful information however, and it
was decided not to test all possible combinations of variables.
56
Stellenbosch University http://scholar.sun.ac.za
In the previous section the importance of the different factors influencing bucket
performance was rated. The design of the bucket (width) seems to be the most
important. It was therefore decided to build four buckets of different widths (see
section 6.1) for details on the design of the buckets ..
The length of the teeth was also seen to have a big influence, but smce
considerable eitort and cost went into designing new teeth for the current dragline
bucket, it was decided not to change the length of the teeth during the tests. Since
the teeth are cast, changes are difficult and expensive and it was decided that
chan?es in teeth length could be investigated at a later stage.
The influence of the soil type on bucket performance was also seen to be high.
Obviously a bucket design that performs well over a range of conditions is desired.
It was decided (see section 6.2) to test the bucket in two soil types. The first
would be 26.5 mm crushed rock (no fines and very uniform) and the other 26.5
mm cmsher run (top size 26.5 nun going down to fines). The crushed rock was
chosen to simulate rocky conditions and the crusher run to establish the influence
of fines. If deemed necessary a crusher sand could also be tested to monitor the
performance in topsoil, but this accounts for only a small percentage of the
operating time and was not included initially.
The angle of attack was also seen to have a fairly big influence and it was decided
to test four different angles of attack. In addition the number of teeth could also
be varied (5, 6 or 7 teeth). The position of the COG was seen to be not that
important if the hitch was changed accordingly and it was decided to keep the
position constant. The sequence for the tests, in each soil type, was planned as in
Table3:
57
Stellenbosch University http://scholar.sun.ac.za
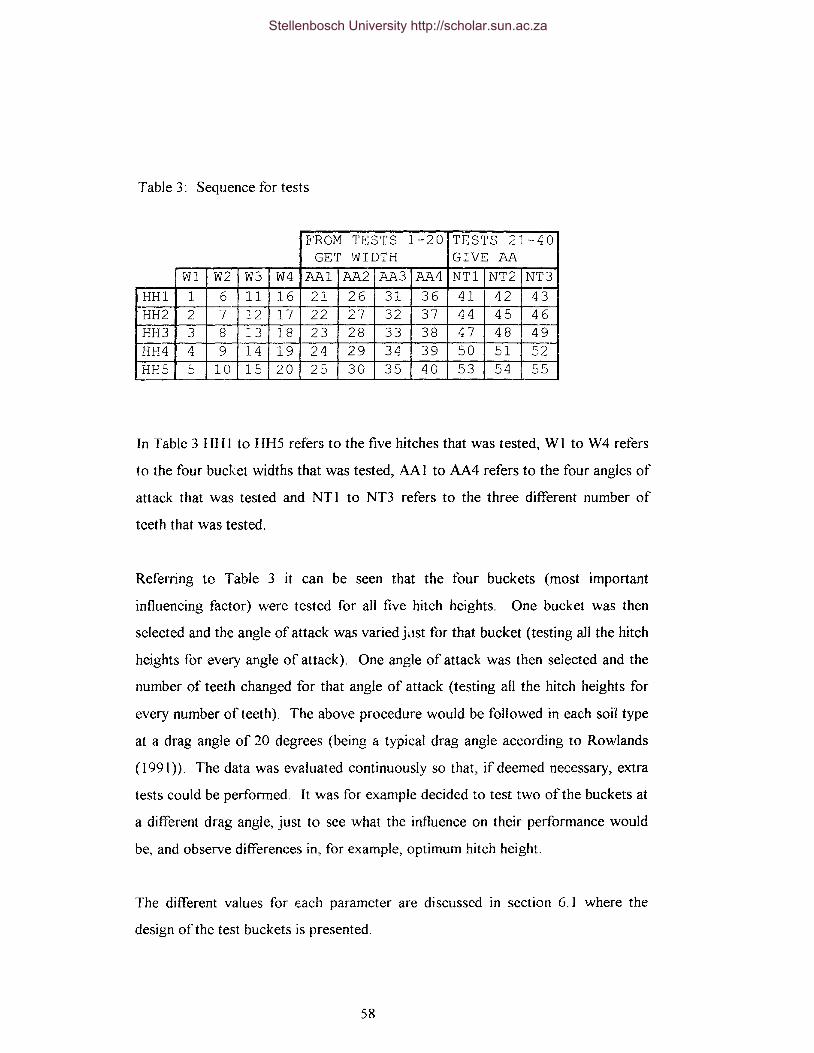
Table 3: Sequence for tests
FROM TESTS 1--2 0 TESTS 21-40 GET WIDTH GIVE AA
W1 W2 W3 W4 AA1 AA2 AA3 AA4 NT1 NT2 NT3 HH1 1 6 11 16 21 26 31 36 41 42 43 HH2 2 7 12 17 22 27 32 37 44 45 46 HH3 3 8 13 18 23 28 33 38 47 48 49 HH4 4 9 14 19 24 29 34 39 50 51 52 HH5 5 10 15 20 25 30 35 40 53 54 55
In Table 3 HHI to HH5 refers to the five hitches that was tested, Wl to W4 refers
to the four bucket widths that was tested, AA 1 to AA4 refers to the four angles of
attack that was tested and NT I to NT3 refers to the three different number of
teeth that was tested.
Referring to Table 3 it can be seen that the four buckets (most important
influencing factor) were tested for all five hitch heights. One bucket was then
selected and the angle of attack was varied just for that bucket (testing all the hitch
heights for every angle of attack). One angle of attack was then selected and the
number of teeth changed for that angle of attack (testing all the hitch heights for
every number ofteeth). The above procedure would be followed in each soii type
at a drag angle of 20 degrees (being a typical drag angle according to Rowlands
(I 991 )). The data was evaluated continuously so that, if deemed necessary, extra
tests could be performed. It was for example decided to test two of the buckets at
a different drag angle, just to see what the influence on their performance would
be, and observe differences in, for example, optimum hitch height.
The different values for e.ach parameter are discussed in section G. I where the
design ofthe test buckets is presented.
58
Stellenbosch University http://scholar.sun.ac.za

5.3 Testing orocedure In order to obtain meaningful results the testing had to be done very consisttntly. The
testing sequence was explained in the previous section. The design 0f the test buckets and
the soil selection were done very carefully to allow for meaningful and repeatable values
and are explained in section 6.
The tests were done in the following consistent way. The optimum carry angle and the
amount of material carried by each bucket werP determined separately. The digging
material was prepared to be exactly the same as for the previous test The bucket was
positioned in the same starting position for each test The drag ropes were then tightened
just enough so that the bucket did not move. Dragging then conunenced and continued
until the bucket was full (a full bucket was defined as one where soil started to spill over
the rear of the bucket). The data acquisitioning was done only for this part of the cycle.
The bucket was then emptied and the bank was level!ed to its original state.
The drag force on the SMD was not limited. When the bucket on a real dragline stalls the
operator applies on!y a slight hoist force, with the result that the resistance for~e on the
bucket decreases and it continues to fills. This procedure was avoided on the SMD since
the human factor then was another variable that could not be monitored. The drag speed
was also kept as constant as possible to 0.20 m/s (the max. drag speed on a Marion 8050
dragline is 2.5 m/s). The speed was calculated from the acquired data and in no test did
the above average vary more than 0.05 m/s. Five tests were done for each different set-up
to obtain a good average.
5.4 Additional tests
From the beginning it was realised that additional tests would probably be needed.
Eventually the extra tests that we1 e done were to establish the effect of a change in the
drag angle and to establish the overburden carrying characteristics ofthe different buckets.
59
Stellenbosch University http://scholar.sun.ac.za

5.4.1. Change in drag angle
To establish whether a change in drag angle would have a significant influen~e on
the optimum bucket configuration, it was decided t0 do some tests at a 30 degree
drag angle instead of the normal 20 degrees suggested by Row lands ( 1991 ) . This
was only done for two buckets in crushed stone and only with the angle of attack
at 8 degrees and the number of teeth at 6. The results of these tests are discussed
along with the rest ofthe test results in section 7.
5.4.2. Overburden carrying characteristics
Originally it was assumed that the optimum carry angle at pick-up would be equal
to the drag angle, as suggested by Howarth et al. ( 1987). It was realised however
that the different buckets might have different optimum carry angles, resulting in
some of the buckets having been tested, and therefore having been set up, at an
angle closer to their optimum. In order to gain some insight into the overburden
carrying characteristics of the different buckets, the theoretical optimum for a
simple two dimensional profile, having the correct height and length of the
different buckets, was calculated. This was done for different angles of repose.
Three graphs, each giving the theoretical optimum volume in the bucket as a
function of carry angle for a specific angle of repose, are shown in Figure B 1 and
82, Appendix B.
A comparison of the results is presented in Figure 83, Appendix B. From this
figure the optimum carry angle appears to be fairly insensitive to a change in angle
of repose even though the volume of overburden in the bucket is affected
considerably. There also seems to be quite a difference in the amount of
overburden carried by the different buckets, as well as a difference between the
optimum carry angle of the buckets. Since the amount of overburden in the bucket
is of great importance, it was necessary to do tests to see what the effect of the
bucket dimensions is on the amount of overburden carried, as well as on the
optimum carry angle.
oO
Stellenbosch University http://scholar.sun.ac.za

The tests were only done in the crusher run (angle of repose between 38 and 42
degrees) and consisted of changing the dump rope length to obtain difterent carry
angles r,• the pick-up point (with the drag angle staying constant). In section 3.5.1
it is discussed that the rigging design should allow the bucket to maintain ifs carry
angle at pick-up through to the dump point The volume of overburden carried by
the bucket at disengagement was then measured (after shaking the bucket in order
to lose unstable material) as well as the carry angle of the bucket. Figures 84 to
87, Appendix 8 show the results obtained for the different buckets. It was
difficult to obtain an accurate value for the overburden volume (it would probably
be better to just weigh the mass of the overburden), but from the graphs it can be
seen (ignoring the values for bucket ll) that there is not an appreciable difference
in the amount of overburden carried by the different buckets. This contradicts the
results of the two dimensional model as discussed above and suggests that a
theoretical overburden carrying model will have to be more comprehensive. The
fact that the buckets were the same volume and carried the same amount ~f
overburden resulted in the buckets eventually being compared on grounds of
filling distance, filling energy and maximum required drag force alone.
61
Stellenbosch University http://scholar.sun.ac.za

6. DESIGN OF TEST BUCKETS AND SOIL SELECTION
The design of the test buckets was done very carefully to allow for the comparison of results
between the different geometries. The selection of the soil was also seen to very important in
terms of modelling real operating conditions. The aim was to optimise the current dragline
bucket. In scaling up the optimum design some caution must be applied however - it was
stated earlier that the digging cycle is very complex and not well understood. When looking at
it in terms of the possibility to destroy a reputation that took years to build, it is obvious that
certain precautions will have to be taken in order to minimise risk involved in the scaling
uncertainties. It was decided to design a 6 cubic metre dragline bucket according to the
results from the tests performed and monitor the performance. By giving it for example three
hitch heights the optimum hitch can be determined and compared to the results from the 60
litre bucket. · Apart from minimising risk, additional insight would .be obtained on the scaling
· effects. This was defined as a separate project and will not be documented here - it is
mentioned only to show that, where knowledge might be lacking, an additional step will be
taken to ensure good results.
6.1 Design of test buckets
When designing the test buckets, the reference was obviously the current design. From the
start it was known that the current design performs very well in the field and big changes were
not expected. The different values of the parameters were therefore centered around the
current values. Figure 16 show a photo of the four test buckets and Figure 17 shows a side
view comparison of the four buckets used in the project.
Figure 16: The four test buckets
62
Stellenbosch University http://scholar.sun.ac.za

0
0 \
',,\ 0 \---0 -------1
]_ .
/
Figure 17: Side view comparison of the test buckets
Stellenbosch University http://scholar.sun.ac.za

The spread between the dimensions of the bucket was also not made to wide, since a test in
which the bucket doe:; not till does not provide usefull information and the observation >f
trends cannot be done as effecttvely. This was realised when reworking the ra ., datl'l trom
Ro\dands (1991 ). In some instances only one of the tive hitches he tested produced a full
bucket and that made comparisons difficult. On the other hand the spread must be such that
an optimum can be observed.
The bucket~ were designed to have the same struck volume. Row lands ( 1991) used the
following formula:
where
Volume = L x W x H x 0.9 '"""""' llll: tl\'t'
L""e =average length
Have= average height
W .... .., = avcrete width
(6.11.)
The calculated volume is the struck volume and the factor 0.9 is to account for the loss in
capacity due to the curvature of the rear wall.
This approach was not consider~d accurate enough for this project (a difference in widrh must
have an influence on the factor that account for the loss in capacity) and a detailed spreadsheet
program was written to calculale the volume of the buckets exactly. This allowed the buckets
to be designed to have exactly the same struck volume.
The front ring assembly (lip with teeth, cheekplates and arch) of the differeni buckets was
desigued to be the same apa.i1 from a difference in width. This was needed to be able to
compare results obtained on the same hitch heights of different buckets. The wider buckets
were then made shorter to have the same struck volume. The bucket widths that were chosen
64
Stellenbosch University http://scholar.sun.ac.za

was the cunent width (scaled down 1/10}. 0.9 times the cu:-rertt width, 1.1 times the current
width and 1.2 times the current width. The designs were done on PRO ENGINEER. a soiid
modelling CA 0 package - the ditfere11t buckets could then be viewed to ensure that tile
changes were significant but not unrealistic
On each bucket there were five hitch heights. They were the ~ame on all the buckets due to
the tact that the height of all the buckets •.vas the ~am e.
The mass of all fo·1r buckets was Irdde exactly the same by adding weights. The~~ w·~igt.cs
were placed such that the centre of gravity ot' all the buckets was in the same piace rehtive to
the teeth and hitch position. The centre of gravity on the widest bucket was 'Tlovec! ":_'C"'~ ~:o
mm back and on the narrowest bucket about 20 mm to the front. ir was shovm earlier that a
change in the position of the centre of gravity can be offset by the hitch p0sitivn .. v.ithout
affecting the performance of the bucket much, and therefore the movement of the ce1tre of
gravity caused no concern.
The angle of attack (of the lip) on the current design is 8 degrees. The forward :Jlope -~~,-the
teeth is at an angle of 36 degrees to the top of the lip, causing an angle of attack of 44 dew·ee:.
for the teeth. The angle of attack of the lip could be changed to 6,8, l 0 and 12 degrees
respectively. This could be done easily by a bolt-on arrangement. The teeth were th~n
connected to the lip in the usual fashion. The teeth were bolted to the lip and could be
changed from the current number of 6 to either 5 or 7.
6.2 Soil selection
A lot oftime and eF.ort were spent on the selection ofthe soil. Ideally the :'>oil should have the
same physical prope ies (angle of repose, etc ) as the :'>oil on the mine and shouid have the
sdme influence on the scaled bucket as the real soil \\-ould have on the big buck~t That way
scaling etfect, would be no problem it must be remembered however that for each clitferent
soil type a truck load was needed and therefore laborotorium type activities would not be
fea~ible
Stellenbosch University http://scholar.sun.ac.za

To simulate the properties ofthe overburden accurately is an almost impossible task, since the
number of variables is vast - size distribution, angle of repose, internal friction angle, cohesion,
shear strength and moisture content, to name but a few. Obviously it is almost impossible to
do tests for the whole series of variables. Furthermore it must be remembered that the ideal
result of the whole exercise was to eventually incorporate all the knowledge obtained by the
testing in a mathematical model (that did not form part of this project however). This means
that the overburden characteristics must ideally be quantifiable.
A lot of research has been done on the cutting and excavation of rock. Nishimatsu ( 1972)
represents a theory similar to cutting of metals for rock. A formula for cutting force is
proposed and experimental work was done to establish the parameters in the equation. The
cutting was done at a constant rake angle (angle of attack), which does not hold for dragline
bucket operation.
Excavation and rippability indexes for intact rock have been established, but very little
research has been done on blasted rock except stating that good fragmentation is very
important. More ofthe research that was done on cutting of soil is discussed in section 8.
Considering all of the above, the following approaches where considered.
6.2.1 Obtaining soil from a mine
Going to a mine and grading a certain amount of overburden and scaling down the
different size distributions does not seem to be a vhble option. How much soil do you
need to grade before the size distribution is representative? Remembering that the size
distribution then is representative of the conditions of that specific spot of the specific
mine - how many times will this exercise have to be repeated?
The approach followed by an Australian company ACIRL (who do similar tests with
their scale model dragline) is to obtain soil from the mine and just remove the big
66
Stellenbosch University http://scholar.sun.ac.za

rocks. This may sound like a good approach (or sales gimmick maybe?), but when the
soil is blasted a certain amount of interlocking occurs which is rlestroyed when the soil
is being worked for the first time (Basson and Chen, 1996 ). This seems to neutralise
the effort to some extent The soil then also is not as uniform as one might have hoped
and this can result in tests not being reproducible. Results from tests performed by
-\CIRL were obtained and compared to results from the testing facility at Barlows (see
Figure 18)- it is clear that the spread in results is much less in the case of Barlows and
serves as prooftbr the selection of the soil that was finally made (see section 6.2.3).
C.8 I
o.7 I
0.6 t >- 0.5 t = :a Ill 0.4 I .a e c. 0.3
[-~------- -- ··-· . ----ACR f
1-- BARLOWS i
- ---~ ~---- _____ j
0.2
0 • 00 N W N • 00 N W • • 00 d d ~ ~ ~ ~ ~ ~
filling distance (m)
Figure i 8: Comparison between tests performed by Barlows and ACIRL
6.2.2. The Rosin Rammler distribution
Clearly a more manageable way of obtaining a fairly representative, repeatable and
quantifiable overburden sample is required, remembering that an approximation really
is the best that can be done.
67
Stellenbosch University http://scholar.sun.ac.za

The proposed model is one that is also being used by companies, like BLASTECH,
who specialises in the blasting practices on mines. That is one of the main reasons for
the selection c.f the model, as software is available with which the parameters for the
model can be found from standard photographs of muckpiles at mines, enabling the
quantification of the overburden at the mine. A so called Rosin Rammler distribution
(Van Aswegen and Cunningham, 1986) can be used to represent the data. The
formula that is used, is:
where
R =- 100-exp(-0.963·(~)") xm
R is the percentage mass retained on screen size x.
n is the uniformity index: higher numbers represent more uniform muckpiles.
x m is the mean size of the muckpile.
Thus the overburden type is '"'haracterised with two parameters. The shape of the
particles, however, needs to be considered as well. Certain rock types have very
characteristic shapes (irrespective of the size of the particles - it is a function of the
chemical composition) and it was hoped that a fixed factor could be used to account
for different rock types in the mathematical model. Heywood ( 1938) desribes a system
that could be used. He presents the following formula:
where:
(62.2.1.)
k: volume coefficient
k... volume coefficient for an equi-dimensional particle of the geometrical
shape considered ( 0. 5 average value)
68
Stellenbosch University http://scholar.sun.ac.za

width nl=---
thickness /enght
11=---width
With k, varying very little and 0.5 a good average and determining m and n by
measurement or visual inspection, the volume coefficient for each characteristic shape
can be calculated.
A typical distribution was obtained from BLASTECH (mean stze 35 mm and
uniformity index I. I). A soil comp,"lsition was then made from available sizes from a
crusher. The first reaction from most p~~ople who saw it, however, was that it was too
rocky Since there w:Is not enough fines it also tended to "drain out" causing a
variation in the conditions. According to Rowlands ( 1996) fines were very imponant
and therefore this model failed. Cunningham ( 1996) also warned that application of
the model is limited.
6.2.3. The selected option
Because of the failure of the previous models and m an attempt to find a viable
solution, meetings were held with several geologists and mining engineers from the
CSIR, none of whom thought there was a solutioa. At that point it was decided that
an extra step would have to be included in the development process. That would
consist of making design changes to a 6 cubic metre bucket. Monitoring the 6 cubic
metre bucket would give a point in between the 60 litre and the 60 cubic metre bucket,
to see what effect the scaling and the inability to scale the soil exactly, would have on
the performance of the bucket.
It was then decided to compare the soil types only qualitati. ely (for example rocky,
sandy, etc.) - one really wants a bucket that performs well over a range of soil types
and therefore not scaling the soil exactly or not being able to quantifY it might not be a
69
Stellenbosch University http://scholar.sun.ac.za

big problem - as long as a bucket was found which performed well in a divergent range
of soil types. The final selection that was made for the soil was the following:
I. 26.5 mm crushed rock: It was to simulate rocky conditions
2. 26.5 mm crusher run: It had a top size of 26.5 mm down to fines to
establish the influence of fines.
The second selection was done due to a conversation with Rowlands ( 1996) in which
he stressed that fines are important. If deemed necessary, a third soil type could be
included - it would be crushe1 sand Uust fines) and would help in determining the
influence of rocks. It would also serve to simulate digging in top soil. Digging in top
soil accounts for a small portion of the operating time and was therefore not included
initially.
70
Stellenbosch University http://scholar.sun.ac.za

7. DISCUSSION OF RESULTS
As was discussed in the introduction and section 3. 5. 2. I, the aim of the project was to
establish a geometry of the bucket that would allow it to fill in a shorter distance (in different
materials) and with lower energy consumption than the current design. The maximum
required drag force was not to increase as that could cause possible stalling of the bucket and
longer fill times due to the characteristics of the drag motors. It must also be remembered that
this was not exactly laboratory type experiments and that some variance was expected
Eventually the repeatability of the results turned out to be very good. About 120 sets of tests
were performed, with each set consisting of 5 tests that were averaged, totalling to about 600
tests for which data were acquired and evaluated.
When tl.e buckets were designed, it was kept in mind that really only tests that produce full
buckets were of interest, since that would allow comparison of different geometries while a
geometry that did not produce a full bucket was of no use as far as comparisons were
concerned. Eventually the bucket did fill in all cases (although taking long to do so in some
cases) which was consdered to be a good result in itself.
It must also be admitted that the tests as were done here are very similar to those done by
Rowlands ( 199 I). He however attempted to show which parameters influence dragline bucket
design, with no effort to optimise them. In this project four buckets instead of Rowlands' two
were used and the relative position of the teeth, hitch and centre of gravity on all the buckets
were the same, which allowed direct comparison of the same geometry on different buckets.
Rowlands (! 991 ) noted, and it is widely accepted, that the hitch height is the single most
important design parameter on the dragline bucket. Therefore all comparisons that follow are
made over the range of hitch heights. Rowlands (I 99 I) also encountered a number of cases in
which the bucket would not fill and that made any comparisons difficult. He mentioned that
the wider bucket outperformed the narrower one, but he did not comment on the increase in
maximum required drag force and how to possibly counter that. The differences between the
tests documented here and those by Rowlands ( 1991) is presented in section 5. I.
71
Stellenbosch University http://scholar.sun.ac.za
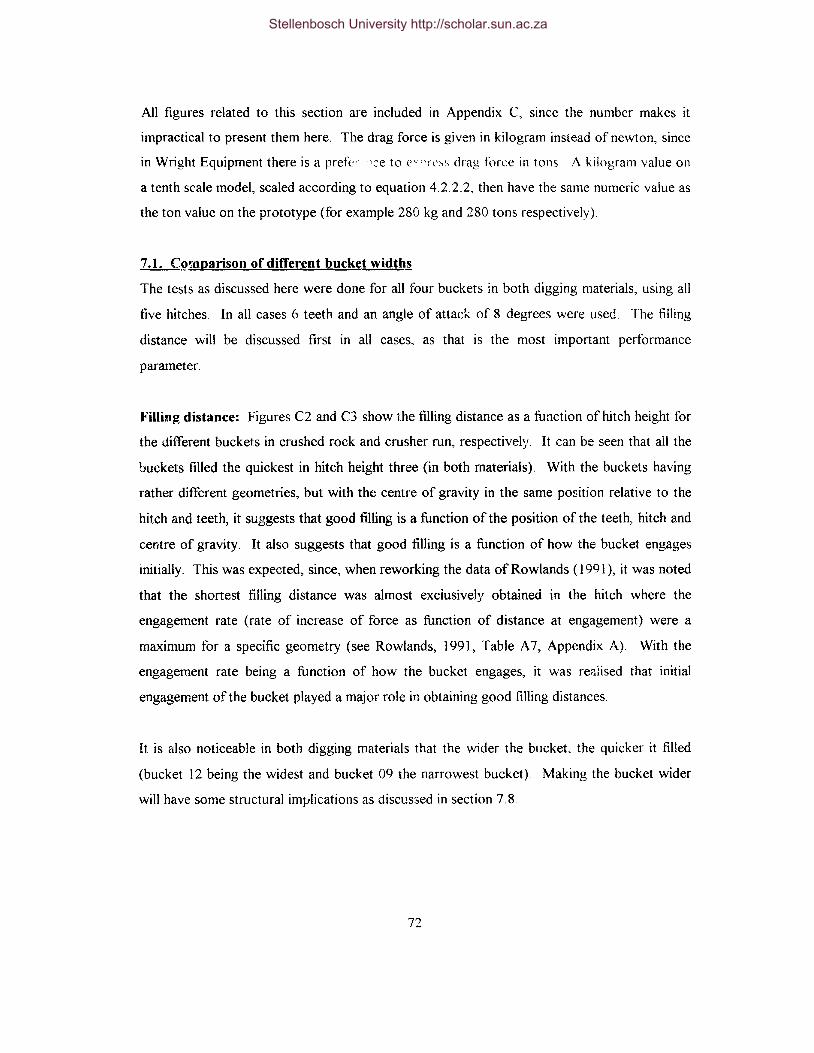
All figures related to this section are included in Appendix C, since the number makes it
impractical to present them here. The drag force is given in kilogram instead of newton, since
in Wright Equipment there is a prefe, 'Ce to C' "!L'~~ drag force in tons A kilogram value on
a tenth scale model, scaled according to equation 4.2.2.2, then have the same numeric value as
the ton value on the prototype (for example 280 kg and 280 tons respectively)
7 .I. CQmparison of different bucket widths
The tests as discussed here were done for all four buckets in both digging materials, using all
five hitches. In all cases 6 teeth and an angle of attack of 8 degrees were used. The filling
distance will be discussed first in all cases, as that is the most important performance
parameter.
Filling distance: Figures C2 and C3 show the filling distance as a function of hitch height for
the different buckets in crushed rock and crusher run, respectively. It can be seen that all the
buckets filled the quickest in hitch height three (in both materials). With the buckets having
rather different geometries, but with the centre of gravity in the same position relative to the
hitch and teeth, it suggests that good filling is a function of the position of the teeth, hitch and
centre of gravity. It also suggests that good filling is a function of how the bucket engages
initially. This was expected, since, when reworking the data of Row lands (1991 ), it was noted
that the shortest filling distance was almost exclusively obtained in the hitch where the
engagement rate (rate of increase of force as function of distance at engagement) were a
maximum for a specific geometry (see Rowlands, 1991, Table A7, Appendix A). With the
engagement rate being a function of how the bucket engages, it was re:>..lised that initial
engagement of the bucket played a major role in obtaining good filling distances.
It is also noticeable in both digging materials that the wider the bucket, the quicker it filled
(bucket 12 being the widest and bucket 09 the narrowest bucket). Making the bucket wider
will have some structural implications as discussed in section 7.8.
72
Stellenbosch University http://scholar.sun.ac.za
Maximum drag force: Figure C I shows a typical graph of the difference in filling in different
materials. The two runs are for exactly the same configuration in crushed stone and crusher
run respectively. It can be seen that the tilling distance in the crusher run (fines) IS less, but l"'
maximum drag force is higher. Considering the area under the graph it also seems as if the
filling energy is more in the case of the crusher run (fines). Noticeable as well, is the fact that
the amount of shock loading is much less in the case of the crusher run (even though the force
is higher) as was observed with measurements on real dragline buckets. This is fortunate since
the amount of shock loading in the crusher run made it difficult to obtain good values for the
maximum required drag force. With the crusher run resulting in less shock loading, good
values for the maximum required drag force could be obtained and these were the important
values, when considering stalling of the bucket, since they were the highest (see section 7 2).
Considering Figures C4 and CS which show the maximum required drag force as a function of
hitch height for the different buckets in crushed stone and crusher run respectively, it can be
seen that no trend can be picked up in the crushed stone as far as bucket width is concerned.
In the crusher run (were the good values could be obtained due to less shock loading) it can be
seen that the wider the bucket however, the higher the required drag force is. This relation is
quantified in section 7. 7. From both graphs it can be seen that the maximum required drag
force increases rapidly as the hitch height increases. This relation is also quantified in section
7. 7 and recommendations are made in section 7. 8.
Filling energy: Considering Figures C6 and C7 which show the filling c;1crgy as a function of
hitch height for the different buckets in crushed stone .and cmsher run respectively. In both
cases it can be seen that the filling energy is fairly constant over the lower three hirches (filling
distance decrease and drag force increase), and increases over hitches three to five (filling
distance and drag force increases. It can also be seen that the wider the bucket, the less
energy is required to till it.
from the above it can b'.; seen that a wider bucket outperforms a narrower bucket as far as
filling distance and energy is concerned, but that it al~o 1 equires a higher drag force to fill it,
73
Stellenbosch University http://scholar.sun.ac.za

which might cause the bucket to stall The stresses on the drag equipment will also increase,
which might lead to increases in maintenance and downtime. A compromise for this situation
is discussed in section 7.8.
7.2. Comparison of different digging materials
The tests as discussed here have been done for all four buckets in both digging materials, using
all five hitches. In all cases 6 teeth and an angle of attack of 8 degrees were used. It is the
satne results that have been discussed in the previous section, but is presented differently.
Filling distance: Figures C8 to C 1 I show the filling distance as a function of hi~ch height for
both digging materials for buckets I2, II, I 0 and 09 respectively. Apart from hitches one and
two on bucket 09 and hitch five on bucket 12, it can be seen that the filling distance in the
crusher run (fines) is consistently shorter than for the crushed stone. The optimum hitch in all
instances is however the same, which is a good result and indicates that a bucket geometry can
be selected that will work well over a range of digging conditions.
Maximum drag force: Figures C12 to Cl5 show the maximum required drag force as a
function of hitch height for both digging materials for buckets 12, 11, I 0 and 09 respectively.
It can be seen that the force is consistently higher in the case of the crusher run (fines) for all
buckets and on all hitches. This validates the use of the values as obtained in the crusher run
for purpose:; of stalling.
Filling energy: Figures C 16 to C 19 show the filling energy as a function of hitch height for
both digging materials for buckets I2, I I, 10 and 09 respectiv(:Iy. It can be c;een that the
values in the crusher run (fines) ~~-e consistently higher than the values in the crushed stone for
all the buckets and on all the hitches
From the above it can be seen that, while overburden that contain a high percentage of fines is
normally considered easy digging (probably due to the shorter tilling distance), the maximum
required drag force is actually higher than required in rocky conditions. If the rocks get big
74
Stellenbosch University http://scholar.sun.ac.za
however. it will probably be found that the required drag force increase~, even though the
amount of tines is very little. The high amuunl ut ::.hoc!-. loading cncountci cd m 1 ock;
conditions should be taken into account when designing against fatigue. It can also be seen
that a bucket geometry that works well in a range of overburden types can be selected, as long
as the fragmentation on blasting is good.
7.3. Comoarison of diffej;'"ent angles of attack
These tests were done for only two cases. Firstly it was done for bucket 10 in crushed stone,
using angles of attack of 6, 8, 1 (J and 12 degrees. The results from this test led to the fact that
fewer tests were done in the second case. The tests in the second case were done with bucket
11 and using only angles of attack of 8 (standard) and 12 in the crusher run to see whether the
same observations could be made for quite different conditions (different bucket and different
digging conditions). In all cases 6 teeth were used.
Filling distance: Figures C20 and C21 show the filling distance as a function of hitch height
for different angles of attack for bucket 1 0 in crushed stone and bucket 11 in crusher run
respectively. From figure C20 it can be seen that lowering the angle of attack from 8 to 6
degrees caused the optimum hitch height to shift from position 3 to 4. Conversely a change in
the angle of attack ftom 8 to 12 degrees caused the optimum hitch height to shift from
position 3 to 2. H is also very important to note that the optimum filling distance for all angles
of "l.ttack is about the same (even though obtained in different hitch positions). This led to the
conclusiOn that an increas~ in the angle of attack causes the optimum hitch height to shift
lower and a decrease causes the optimum hitch tc ~hift higher, but no gains are to be made on
filling distance. Therefore the only motivation for increasing the angle of attack would be to
move the hi1ch lower where the maximum required drag force is less. Once this was
established it was decided to do the tests with bucket 11, ·n crusher run, only for angles of
attack of 8 and 12 degree5 to see whether the same obser,ation could be made.
Figure C21 shows the tilling distance for bucket I I in crusher run as a tl.mction of hitch height
for angles of attack of 8 and 12 degrees. It can be seen once again that the increase in the
75
Stellenbosch University http://scholar.sun.ac.za

ln"ll' of attack C:11!'.:'d tile optimum hitch to shift d•Y ·1 nnc position without chant2-ing the
tilling distance. It can therefore be concluded that the optimum hitch hught can be shifted
down by increasing the angle of attack. The effect on the drag force will be discussed next,
because a lower hitch is associated with a lower required drag force, but the change in the
angle of attack might also have an effect in that one feels it will increase the drag force and
thereby offset the advantage that was seeked.
Maximum drag force: Figures C22 and C23 show the maximum required drag force as a
function of hitch height tor different angles of attack for bucket I 0 in crushed stone and
bucket 11 in crusher run respectively. It can be seen that the increase in angle of attack causes
the required drag force to increu.se slightly for the same hitch height, but the combination of a
higher angle of attack and lower hitch height (AA12 and HH2 vs AA8 and HH3) leaves the
filling distance unchanged, lowers the drag force by 13.8% and decreases the tllling energy by
d. 2%.
Filling energy: Figures C24 and C25 show the filling energy as a function of hitch height for
different angles of attack for bucket 1 0 in crushed stone and bucket 1 I in crusher run
respectively. It can be seen that the difference in filling energy between the different angles of
attack is small, especially in the lower hitches which is of intertst (generally the filling energy
and the maximum required drag force is less).
The above goes to show that changing the angle of attack will not have a big influence on the
productivity of the bucket as a whole, provided that the hitch is changed accordingly.
Changing only the angle of attack on a bucket will have a big influence on the productivity of
the bucket. Considering the increased loading on the lip of the bucket, which is the most
highly stressed area on the bucket as it is, the decrease in drag force obtained by a higher angle
of attack and lower hitch does not seem worthwhile. It must be remembered that Rowlauds
( 1991 ) changed the angle of att?.ck by I 0 degrees and even then it was shown in section
5 2.2.2 (Rowlands, 1991) that the hitcl1 could to some extent offset the change, which serves
to validate the test results
76
Stellenbosch University http://scholar.sun.ac.za

7.4. Comparison of diff)~•·ent numbers of teeth
The different numbers of teeth that were tested, were tested on bucket I 0 for twc aut,1e:; o~'
attack (8 and 12 degrees) and only in the crushed stone to see whether an• · trenci::.: cou irJ be
observed.
Filling distance: Figures C26 and C27 show the tilling distance as a function of hitch h-"~:ht
for different numbers of teeth on bucket 10 in crushed stone for angles of attack of r: ;,qJ 12
dPgrees respectively. It can be seen (especially for the 8 degree an~:: le of at1ack) th~1t t~u:
differences were sr:.~all. The optimum hitch height for example did not chan!,.e and neither die'
the filling distance in the case of the 8 degree angle of attack Big~_~er variance:~ on the h;;~h·.:T
angle of attack can be expected since the projected vertical area of ....:lch tooth is more a'ld an
added tooth results in a bigger change.
Maximum drag force: Figures C28 and C29 show the maximum required drag fOrce a~ a
function of hitch height for different numbers of teeth on bucket 1 0 in crushed stone for angles
of attack of 8 and 12 degrees respectively. It can be seen that the differences (Ire small. !n the
case of the 12 degree angle of attack (where adding a tooth does have a bigger difference thar
on the 8 degree angle of attack) it can be seen that the added tooth wili cause only a slight
increase in the required drag force as would be expected.
Filling energy: Figures C30 and C31 show the filling energy as a tu net ion of hitch height for
different numbers nf teeth on bucket I 0 in crushed ~1 Oll.._ tor angles of attack of 8 and 12
degrees respectively. It can be seen that the differences were small.
From the above it can b~ !'een that the int1uence of the number of teeth is small. It seems as if
an extra tooth might cause a slight increa~e in the required drag force, but on the standard 8
degree angle n:'attack this seems to be negligible small
77
Stellenbosch University http://scholar.sun.ac.za

7.5. Compar·ison of diffen•nt dntg angles
At this stage of the project a fair idea of the intluence of the ditlcrent factors has been
obtained, but it was realised that some extra tests that were not originally included in the
testing sequence, would have to be performed. It was considered essential to see what
influence a change in the mine layout would have on a bucket It was thought to establish this
by ~:hanging the drag angle (which is mort" oi·less equal to the angle ofthe slope) Buckets 10
and 12 were then tested at a new drag angle of about 30 degrees (the other tests having been
done at a drag angle of about 20 degrees) in crushed stone onlv
Filling distance: Figures C32 and C33 show the filling distance as ?. function of hitch he1ght
for two different drag angles on buckets I 0 and 12, respectively. in crushed stone It can be
seen that the filling distance for both buckets on all hitch heights are less for the higher drag
angle. This was expected since the added gravity will aid the flow of material into the bucket
It is however interesting to note that the optimum hitch height does not change for either of
the buckets. This result can not be related to digging on uneven terrain (which would be
almost impossible to model consistently), but leads to the conclusion that, while digging on
straight slopes. a bucke1 hat performs well at one drag angle will generally perform well at all
drag angles. It can also be seen tha! productivity will be higher while digging steep slopes. It
also seems as if the difference in the filling distances of the two buckets is less at the higher
drag angle. This could mean that the advantages associ:t. ~d with a wider bucket is less at
higher drag angles
Maximum drag force: Figures C34 and C35 show the maximum required drag force as a
function of hitch height for two different drag angles on buckets I 0 and ! 2. respectively, in
cru' hed stone The conclusions to be drawn trom tl e different buckets are contradictory and
no clear trends could be ascertained. The diffrenccs in drag force were small and might
suggest that the drag force is influenced weak:v by drag angle.
Filling energy: Figures C36 and C3 7 shoVv the tilling cnergv as a tl.~nction of hitch t.cight tor
two cifferent drag angles on huckets I 0 and 12. re:-.pcctively, in crushed stone It can be seen
Stellenbosch University http://scholar.sun.ac.za

that for both buckets. on all five hitches. the tilling energy was less for the higher drag angle
rhis was expected. since tilling at higher drag angles requires similar drag forces. but shorter
tilling distances.
All of the above show that. while the bucket fills ea~ier (shorter lillmg distance and lower
t-illing energy) at the higher drag angles, the optimum bucket width does not change, but the
advantage that the vvider bucket has over the narrower bucket is less. since the difference in
tilling distance is less and the tilling cycle is a smaller p(:;rcentage of the cycle as a whole The
optimum hitch height doesn't change either, which leads to the conclusiOn that one geometry
could perform well at different drag angles.
7 .6. The effect of changing the hitch position horizontally
These tests were also not originally included in the testing sequence Since it was known from
the start that the hitch height was the single most important design parameter on the dragline
bucket, it was decided to see what the difference would be of shifting the hitch forward and
backward. This was done to establish whether only hitch height or hitch position in general
was the important design parameter. These tests were only done for bucket I I, with an angle
of attack of 8 degrees and 6 teeth. in crusher run (fines). The hitch was moved 30 mm
for ,ard and 30 mm back. ln the backward position only the bottom three hitches could be
drilled because of interference from the arch, but, since it was established earlier that the lower
hitches are really the ones of interest and the optimum \A"'<; expected around hitch 3, this wa;,
thought to be good enough.
Filling distance: Figure C38 shows the etfect on the filling distance v. hen the hitch position
i~ shifted forwards and backwards. ·~ne tt:.:;;~ were done for bucket 11 in crusher run (tine
with an angle of attack of 8 degrees and 6 teeth l·:specially when considering the 30 mm
forward and the JO mm back ward positions (these were done weeks apart from the standard)
and when considering ihc value~ at the optimum hitch (hitch 3) it can be seen that the efl'ect of
shifting the hitch forward and backwards is very little ll ts also noticeable that the optimum
79
Stellenbosch University http://scholar.sun.ac.za

hitch height for all three cases is hitch height 3, which indicate that a horizontal shift in the
hitch position does not have a big effect
Maximum drag force: Figure C39 shows the effect on the maximum required drag force
when the hitch position is shifted forwards and backwa1d<: The tests \\ere done for bucket 11
in crusher run (fines), with an angle of attacK of 8 degrees and 6 teeth. It can be seen that the
differences bet•.\ci.m the forward and backward hitches are very small.
Filling energy: Figure C 40 shows the effect on the tilling energy when the hitch position is
shifted forwards and backwards. The tests were done for bucket 11 in crusher run (fines),
with an angle of attack of 8 degrees and 6 teeth. Once again it can be seen that the difference
between the forward and backward hitch position is small.
From the above it can be seen that shifting the hitch horizontally does not have a big influence
on the performance of the bucket.
7.7. Quantifying the effect of bucket width and hitch height on the maximum required
drag force
It has been seen that, in order to improve performance, the bucket should be made wider.
This could cause the bucket to stall however, since the required drag force increases with
bucket width. It has also been seen that a way of decreasing the required drag force is to
lower the hitch. Further, it was shown that changes in the angle of attack, number of teeth and
shifting of the hitch in a horizontal direction does not have a big influence on bucket
performance.
The effect or bucket width was then quantified along with the effect of bucket width on filling
distance and filling ene:-gy. Figures C41 and C42 show this effect for crushed stone ano
crusher run respectively for the different buckets, using hitch height 3. Figures C43 and C44
show this effect for crushed stone and crusher run respectively for the different buckets, using
hitch height ~· Hitches 2 and 3 were used because this is the hitches that are considered
80
Stellenbosch University http://scholar.sun.ac.za

important - short tilling distance, low tilling energy and tairly low maximum required drag
force. ln all cases the correlation coefficient is high (above 0 85), meaning that the linear
approximation is a good assu;nptio• . Note that the relationship for drag force was only
quantified in the crusher run, since it is the material in which the drag force values were t • ..:
highest and therefore c1iticaL and the case in which good values could be obtained. .o all
cases it can be seen that widening the bucket causes the t1Jiing distance and energy to
decrease. Considering Figures C42 and C44, it can be seen that for both hitch 2 and 3 an
increase in bucket width of 20% will have the effect of increa,ing the maximum required drag
force by 100 kg (th~ slope of 500 times 0.2) Figures C45 and C46 S110w the effect of hitch
height on filling distance and drag force respectively for all the buckets in crusher run
(considering only the lower three hitches as those were considered important - these
approximate linear reh~tionships therefore only hold over the three lower hitches). It can
be seen that for all the buckets the filling distance increases a& the hitch is changed from 3 to 1,
but it can also be seen that bucket 12 in hitch 2 filled quicker than bucket 10 in hitch 3, even
though hitch 2 is not the optimum hitch position for bucket 12. From Figure C46 it can also
be seen that, considering the slope of the regression lines for bucket 10, 11 and 12 (which are
all fairly close to 90), a decrease of one in hitch height will cause the required drag force to
decrease by about 90 kg. Therefore it can be seen that increasing the bucket width by 20%
will have about the opposite effect on the required drag force as lowenng the hitch by 30 mm
(300 mn. on a real bucket).
It is therefore clear that by widening the bucket and lowering the hitch, the required drag force
can be kept constant and, as was seen from Figure C45, the filling distance can be decreased.
To prove this point the values as obtained for bucket 1 0 in hitch 3 and bucket 12 in hitch 2
(which means the hitch was made 30 mm lower (300 mm on the real bucket) and the bucket
width was increased by 20%) was compared in Table 4 (Note that the drag force values for
the crushed stone were not included due to the amount of shock loading and since it was
lower than the value~ in the cru"h~r run, as was discussed in section 7 1)
81
Stellenbosch University http://scholar.sun.ac.za
Table 4 Comparing the values obtained with bucket 12 in hitch 2 with the values obtained
with bucket I 0 in hitch 3 as the standard.
crusher run (fines) crushed stone
decrease in filling distance 16% 9%
decrease in filling energy 20% 20°,~
decrease in max. dmg force -1 7°/o
The values as obtained for bucket I 0 in hitch 2 and bucket 12 in hitch I (which means the
hitch was made 30 mm lower (300 mm on the real bucket) and the bucket width was increased
by 20%) are compared in Table 5:
Table 5: Comparing the values obtained with bucket 12 in hitch 1 with the values obtained
with bucket 10 in hitch 2 as the standa,·d.
crusher run (fines) crushed stone
decrease in filling distance 13% 9%
decreasr in filling energy 21% 20%
decrease in max. drag force 7%
Both of the above cases repre~ent an increase of 20°/o in bucket width and a lowering of hitch
height of 300 mm. from two different positions. and the results are given in two digging
materials. In both cases it can be seen that performance of the bucket is improved
considerably.
7.8. Conclusions regarding the influence of geometry on dr&.zline buckets
In section 7.1 to 7. 7 it was shown that no real benetit could be obtained by changing the angle
of attack or the number of teeth. It was also shown that making the bucket wider and shorter
(obtaining the same struck volume) and lowering the hitch (to ensure that 1 he required drag
force does not increase) results in improved pertormance When comparing the WRIGHT
Bl!CKET to other buckets on the market it can be seen that it is generally a shorter and wider
bucket lt is Lelieved that this. along with the fact that it is a lightweight bucket (therefore
82
Stellenbosch University http://scholar.sun.ac.za

bigger capacity for the same suspended load) is the reason for the excellent performance of the
bucket on the mines. The increased pertonnance has been established by feedback from the
mines and was confirmed by tests that was done by Lumley and Jensen ( 1996)
There are however problems associated with the proposed change A wider bucket will result
in higher stresses on the lip. which is highly stressed as it is. The arch will also be higher
stressed - an area in which structural problems were experienced originally. The cross
sectional area o!"the lip and arch will therefore have to be increased, resulting in added weight.
which is what should be minimised on a lightweight bucket. Higher dump rope loads is also
expected with shorter buclrets because of the shorter moment arms ( Lumley and Jcnsen, 1996)
and the dump rope loads of the WRIGHT BUCKET is higher than most other buckets as it is
(Lumley and Jensen., 1996). The stability of wider buckets is also less while swinging and
nodding and overshooting at disengagement is more pronounced. Shortening the bucket will
also cause the load carrying characteristics (from disengage to dump point) to change (which
is very good for the current Wright bucket, according to Lumley and Jensen, 1991) as well as
influence the dumping characteristics. When the hoist trunnions are positioned to far back. the
bucket will dump prematurely and when they are positioned to high, the bucket will not dump
cleanly- this was found to happen when trials were done on BE buckets (Ferreira, 1997).
With a lower hitch, one would also expect more wear on the drag chains, which will result in
increased maintenance time and costs. On mines employing the extended bench mining
method, the extended bench is usually build from the material from the keycut, which is the
material that is rehandled. The keycut is one bucket width and an increase in bucket width
could result in increased rehandle on these mines, which might offset the advantages to be
gained from a wider bucket.
The advantages and disadvantages of a wider bucket can be snm .c.:iscd as follows:
• Advantages
• Shorter filling distance (I 0 to I 50, o)
• Lower energy consumption ( 20%)
83
Stellenbosch University http://scholar.sun.ac.za

• No increase in required drag force
• Disadvantages
• Higher stresses
• Higher clump rope loads
• Less stability while swinging
• Nodding ar 1 overshooting
• More wear on drag chains
It has been proven by the WRIGHT BUCKET that an increase in productivity is possible by
widening the bucket and it must be remembered that small increases in productivity re~ult in
huge t1nancial gains. In section 9 (Conclusions and Recommendations) research needed to
address the problems associated with wider buckets is discussed
84
Stellenbosch University http://scholar.sun.ac.za

8. UNDERSTANDING THE DIGGING PROCESS
This chapter is included to try and explain some of the trends that was observed The
literature concemed with digging or cutting of rock is presented here to show that, while rock
cutting (similar models to metal cutting at constant rake angle) and excavation of unblasted
rock have received attention, no work has been done on understanding the digging cycle of a
dragline.
The digging process is very complicated, since the bucket has gm 6 degrees of freedom (DOF)
and that in a non-unifom1 materiaL while the starting conditions are variable. From a numeric
modelling point of view this seems like a mammoth task to model In fact most kind~ of soil
engagement machinery (of which the dragline is probably the most complex) have defied
analysis (Reece, 1984) He also mentions that to progress one should continuously try to
understand, in quantitative ways, the action of machine elements, which is part of what was
attempted in this project.
Some researcil has been done on the cutting of rock and soil engagement machines.
Nishimatsu ~ 1972) did tests and developed a theory for the cutting of rock that is very similar
to cutting of metal during machining operations. The cutting tool had only 1 DOF, the rake
angle was constant and the material uniform. Spektor and Katz (1985) did experimental work
on frontal resistance force in the cutting of soil. It consisted of knives having 1 DOF that were
forced through soil. They found that the frontal resistance force was linearly related to tool
width as was found in this project. A number of papers attempting to assess ease of
excavation of unblasied rock (based on properties like Uniaxial Compressive Strength,
Schmidt Hardness Value, Seismic Velocity and taking into a.:count factors liKe weathering)
were found (Hadjigeorgiou and Scoble, 1990: Karpuz, 1990 and Panag1-1tou, 1990).
Bolukbasi et al, ( 199 I) describes the O&K wedge test that is used to determine the
mechanical cutting characteristics ofrocks for selection ofbucket wheel excavators.
Specific digging energy is commonly accepted as a measure of cutting efficiency or diggability
of soil ((Panagiotou, 1990), (Bolul. 1'asi et al, 1991) and (Ceylanoglu et al, 1994)).
85
Stellenbosch University http://scholar.sun.ac.za

Fragmentativn is of great importance for dragline performance. Michaud and Blanchet ( 1996)
found that better fragmentation lead to better mine productivity. but blast;ng and drilling costs
increased. The higher productivity is because of better loading and because of higher densities
associated with good fragmentation.
Howarth et al. ( 1987) did dragline bucket filling tests on a simulator having I DOF at the
University of Queensland. The work of Rowlands ( 1991) followed on that project and he
mentions that the set-up as was used by Howarth et al. ( 1987) was not representative of real
dragline operation.
8.1. Theoretical static analysis of the forces on the bucket at engagement
This section is aimed at understanding the digging performance qualitatively. As was
discussed earlier, digging perfonnance is a f • .mction of initial engagement and more specifically
of the relative position of the hitch, teeth and centre of gravity. It was Jelieved that
considering the forces on the bucket at engagement could provide some insight into bucket
perfmmance. Figure 19 shows the bucket at engagement as well as the forces on it The
magnitude and direction of the forces on the teeth will be a function of the position of the
COG, the hitch position and the tilt angle. The force diagram on the bucket was then solved
statically for different hitch positions and tilt angles. The bucket was assumed to rotate
around the tip of its cutting edge after the teeth engaged. Figure 20 shows the magnitude of
the force on the teeth and its direction (angle between centreline of teeth and force). for
different hitch positions and tilt angles. This is the force neccessary to keep th( bucket in
equilibrium.
86
Stellenbosch University http://scholar.sun.ac.za

drag force
bucket mass
•
force on teeth
component of teeth force on teeth centertine
drag angle
Figure 19: Forces on the bucket at en~gement
tilt •ngle
I I
Stellenbosch University http://scholar.sun.ac.za
150
100 'c) Q)
~ Q) 50 Ol c (U
Cl ~ 0 Q) u 0 -
-50
-100
r:·:·:· :· :· .·-:: ·:·:·:·: ·:·: ·:· :· :·:·:·: ·:··:- ·:· :·: ·:·:-·:· :· :· :·: -:- ·:· :·:-: ·: ·: I I I I I I I I I I I I I I I I I I I I I I I I I I I I I t I ~ •
I I I I I 4 I I I I I I I I I 0 I I I I I I I I I I I I I I I I I
I I I I I I I I I I I I I I I I I f I I I I I I I I I I I I I ) 1 0 I 1 I 0 ,
I I I I I C. I l I I I t I o I I I I I I I I I I I ~ I I I I I I I I 1 1 t f o I I I I I I I I I I I I I t I I I I I I I I I I I I I I I I I I I 1 t t t I •
I I I I I I I • I I I I I 0 I I I I I I I t I 0 0 I I I t t o 0 0 o t 1 I > '"' l' ... , .... , ... , '"' "' r •,. ........ -.• "\ • " • r .. r .. , ... ~. • -.. • 'f .. r • ,. •,. -,• -,- "" - , • r -,. • , .. -,- ""'- 'I - r - I!" .. , .. -. • "" • " ... r - ,. -.
I I I I I I I I I I I I I I ~ t" I I I I I I I I I I o I I I I • t I I I I 0 ,
I I I lt I I I I I I I I I t I I I I I I I I I I I I I I I I I t I I 1
:: i ~ j ~ ~ ~JJ+.tc ~ ~ i ~ ~ i ~ ~ ~ ~ j ~ ~ i i ~ ~ ~ ~ ~ i ~ ~: -~++i·i·~-~-+ i ~-~·~+++·~~~-~~~-~-+-~-~-!·:·:··~ :: i/.f::: i ~ )/:j:::::::::::::::: :-htrr·.: *+~ !J:?f i :::~ \+::r~ ~r ~ ~IT; ~ ~ ; ~ ~--~ j::::::::.:::::::·.:::::::·.:::::zr·:·.::.: ' : : : : : : : : : : : : : : : : : : : : : : : : . : : : : : : ; ' . . : : : ~
I ~ I I I t I I I I I t l I I I I I I I I I I I I I I I I I I I I f t I I I ,
·~ .. : .. ~:-~·!· ~ .. ~ .. :··:· ~-~·: .. :·:--:--: .. ! .. ! -~-z- ·:-·:· ~- !• ~ .. ~ .. :- ·:- ~- ~-~ ·~-:- --:-~- !•! -~·~ I I I I f I I I I I I I I f I I I I I I I I I • I I I I I I
I 11 I I I I I I I I I I I I I I I I t I I I I f' t I I t 1 1
I I I I I I I I t I I I I 1 I I I I I I I I I I t I I 1 1 1
I I I I I I I I I I I I I I I I I I t I I t I I I I I I I 1
Hi t c.., 1 LEI i t c h 2 1=. E~J Hi t c h 4 1 J Hi t c h 5 r 0 1 0 20 30 0 1 0 20 30 0 1 0 20 30 0 1 0 ;''"I 30 0 1 0 20 30
angle that bucket tilts (deg to DA)
--angle l.Jetween teeth force and teeth centerline
--component of teeth force on the teeth centerli ne
Figure 20 Theoretical teeth force at eng:tgement
8.2. Qualitative assessment of the influence in change .9f parameters on digging
Q!Tform~mce
From Figure 20 a number of int~resting observations can be made, even though it is ju~t an
arproxirnatior It can be seen that the force on the teeth at low hi:ch hf~ights is high, even at
low tilt angles This means that the force the digging material needs to exert on the teeth to
keep the bucket in equilibrium (to keep the back up) at that tilt angle is high. If that force can
not be exerte<J on the tcctl~. the teeth will shear the soil and the tilt angle will remain very low.
This wili result in the bucket skidding over the material a'i was ohscrved at low hitch heights.
Stellenbosch University http://scholar.sun.ac.za
From the figure it can also be seen that the force on the teeth increa~~es as the tilt angle
mcreases. It is believed that the bucket tilts forward until the force on the soil is enough for
the teeth to shear the soil Assuming that the force tD shear rocky material is more than to
shear sandy material (it is easier to push a shovel into sc>.nd than into a pile of stones), this
could be the reason \\ hy a bucket would tend to have higher maximum tilt angles in rockv
material than in sandy material It can also be seen that the force on the teeth at high hitch
neights is low for all tilt angles. Therefore, no matter how far forward the bucket t.:ts, the
force on the soil is never enough to shear it, resulting in the bucket falling forward
It is <ilso noteworthy that in the optimum hitch (hitch 3) the angle between the force on the
teeth and the teeth centreline is less than 20 degrees for all tilt angles. fhis means that 0. 94
(cos 20) times the magnitwie of the force is always available as a penetrating force and it can
be seen tLat this does not hold for the clher hitch heights.
In the tests it was faur,d that an increase in the angle of attack, resulted in ~be optimum hitch
being lower. It could be ~xplained as follows. Increasing the angle of attack results in the
re~istance force on the teeth at zero tilt angle (from where the bucket starts) to be higher,
since the frontal area is more. The material will not shear as easily and the bucket will tilt
forward and engage pos:tively ~ven when a higher force is required on the teeth to keep the
bucket in equilibrium It can be seen from Figure J 9 that a lower hitch height requires a higher
force on the teeth to keep the back of the bucket up and it can be concluded that the optimum
hitch height i::. !owe because the resistance force that can be exerted on the teeth is higher for
the higher angle of attack.
Stellenbosch University http://scholar.sun.ac.za

9. CONC'LllSIONS AND RECOMMENDATIONS
This thesis documents the experimental work that was done in developing a geometry for a
dragline bucket that would till quicker and till with lower energy consumption while the
maximum drag force does not increase. For the purposes of tests, a scale model dragline was
build, which accounts for a lot of effort going into the project as u whole. Four test buckets of
different geometries were tested. The work that was done can be seen to be an extension of
the work done by Rowlands (I 991 ). More buckets were tested, however_ and the design of
the buckets (position of centre of gravity, etc.) was done more carefully This allowed for the
observation of trends. In addition, the relationship between angle of attack and hitch position
was established. a .. d the hitch position to offset the increased drag force associated with a
wider bucket was found. The relationships between maximum drag force, filling distance and
filling energy as a function ofbucket width and hitch height were quantified in crusher run.
It was found that the most significant increase in productivity could be obtained by making the
bucket wider. This increased the required drag force. The required drag force was found to
increase rapidly with an increase in hitch height and lowering the hitch, therefore, could offset
the increase in drag force. The centre of gravity of all the buckets were in the same place
relative to the hitch and teeth. With all the buckets filling the quickest in the same hitch, it can
be concluded that the relative position of the teeth, centre of gravity and hitch determines the
filling characteristics to a high extend and also that initial engagcmem is the key to good filling
performance. Lowering the hitch to offset the increase in drag force as~ociated with a wider
bucket, would therefore result in the bucket not operating in its optimum hitch, but significant
increases in performance could still be established - about a 15% reduction in filling distance
and a 20% reduction in filling e;,ergy.
These changes does have problems associated with them A wider hucket will result in higher
stresses in the lip (which is highly stressed on any bucket) and a lowering in hitch height will
result in more wear on the drag chains and drag rope A wider bucket also tends to nod and
overshoot when it disengages and the dump rope load~ will be higher (which is already higher
on the WRIGHT BlJCKET than on most other buckets) All of the above 'vill have to be
90
Stellenbosch University http://scholar.sun.ac.za

discussed with mine engineers and maintenance managers Thereafter a 6 cubic meter bucket
should be build and tested and then changes can be made to the WRIGHT BUCKET.
The advantages and disadvantages of a wider bucket can be summarised as follows:
• Advantages
• Shorter tilling distance (I 0 to 15%)
• Lov . .:er energy consumption (20%)
• No incrt~ase in required drag force
• Disadvantages
• Higher stresses
• Higher dump rope loads
• Less stability while swinging
• Nodding and overshooting
• More wear on drag chains
Specific research will have to be done to address the problems associated with a wider bucket.
A comprehensive FEA should be done to determine the weight penalty associated with a wider
bucket. The research should also be extended to rigging design. Developing a dynamic model
of the bucket after disengagement will result in the ability to easily obtain the forces in the
different components, the carry angle of the bucket after disengagement, stability of the bucket
and the dumping performance. This will address most of the problems associated with the
nggmg.
The geometric parameters that should still be inve~tigated arc bucket height, the angle of the
bucket back to the horizontal and the outwards taper of the sides. The influence of a cut
down back should also be investigated as there exists different opinions on its effect. Tests
should also be done for different conditivns In this proJect the slope of the digging face was
flat and at an angle equal to the drag angle, since this was reproducible. This will not always
be the case A pussible way to test ditferent conditions would ue to prepare a block and
Stellenbosch University http://scholar.sun.ac.za

measure all performance variables for ev.cavating the ',\''~oh'- !1lock This ,vill result in a design
being tested over a range of conditions
Some more development that needs to be done on rigging design is on quick changeover
technology This v.ill decrease the amount uf downtime when a bucket has to be changed and
will allow for the desii:."n of buckets for a specific purpose, for example a chop-down bucket,
rock bm,:;et_ sand buckEt. etc. The weight of the rigging can also be reduced when the forces
are known and a careti!: fatigue analyses has been done. Resean.h must also be done on ways
tJ dec;·~!! .. ~ 1.:~e '.-v:Jr on the bucket, without adding weight, which will allow longer cyci ..
between bucket changes. Then there are also room for new concepts on bucket and riggn _.
design It was observed that operators tend to overdrag the bucket (dragging it even after n
has filled) rather than picking it up to far from the fairleads. The reason for this is that the
carry angle of the bucket is to low far from the fairleads, resulting in soil being lost fi·om the
mouth. In the process however, time is being lost and wear on the bucket is rugh. If a rigging
concept can be developed that will allow the carry an~k to be less dependant on the pick-up
;:.:,:~·!":-- it will cause dramatic increases in productivity
Research should also be conducted on the soil characteristics. Ideally one would like to obtain
the bucket design for a given soil, which means the soil should be quantifiable. The important
characteristics and ways to obtain them from a site should be inciuded in this study. This is
also necessary if a numeric model of the digging process is to be developed in the future. In
the auth01 s mind it would be very difficult to develop a model like that but, if it was possible
to model the c!igging process accurately, it would lead to a revolution in bucket design as
n·.1merous designs could be tested for numerous conditions at low costs
Stellenbosch University http://scholar.sun.ac.za
10. REFERENCES
Adams, J.N., !990. UK Opencast Mi'1ing Equipment in the 1980's, International Journal of
Surface Mining and Reclamation No. 4, pp. 115-118.
Aiken, G.E. and Gunnett, J.W., 1990. Overburden Removal, Surface Mining, 2nd edition,
Port City Press Inc., Baltimore, Maryland.
Anon , 1994. Dragline Productivity Center Re\'iew, Coal Research Center, Southern Illinois
University, pp 1-21.
Atkinson, T., Denby, B. and Cassapi, V.B., 1986. Problems Associated with Rock Mate_rial
Properties in Surface Mining Equipment Selection, Transactions Institution Mining and
Metal1urgy (Section A Mining Industry), pp. A80-A86.
Ash, R.L., 1990. Design ofBiasting Rounds, Surface Mining, 2nd edition, Port City Press
Inc., Baltimor~, 1\laryland, pp. 565-583.
Baafi, E.F., Mirabediny, H. and Whitchurch, K., 1995. A Simulation Model for Selecting
Suitable Digging Method for a Dragline Operation, APCOM XXV: Application of computers
and operation research in the mineral industry, pp. 345-349.
Ball, M., 1998. A Review of Blast Design Considerations in Quarrying and Opencast Mines,
Quarry Management, June, pp. 35-39.
Bandopadhyay, S. and Ramani, R. V. Digital Simulation of Dragline Deplo';ment Schemes,
16th Apcom Symposium, pp. 431-448.
Basson, E. and Chen, J.F .. 1996. Perspnal Com111unication, CSIR Mining Technology
Geomechanics Laborotory.
93
Stellenbosch University http://scholar.sun.ac.za

Bauer. A. and Crosby. W. A . 1990. B.ill.~j!lg. Surtace Mining. 2nd ediiion, Port City Press
Inc., Baltimore. Maryland. pp. 540-563.
Bauer. A and Crosby, W.A, 1990b. Drillim! Application. Swtace Mining, 2nd edition, Port
City Press I ne., Baltimore, Maryland, pp. 540-563.
Bertoldi, M.J., 1977. Preliminary Econorn_ics of Mining a Thick Coal Seam by Draglins
Shovei-Truck,and Bucket Wheel Excavator, U.S. Dept ofthe Interior, Burea ofmines,pp. 1-
27.
Bolukbasi, N., KoncaGul, 0. and Pasamehn,etoglu, A G., 1991, Material Diggability Studie~
for the Assessment of Bucket Wheel Excavatoc Mining Science and Technology, Vol. 13,
Elsevier Science Publishers B. V., Amsterdam, pp. 271-277.
Ceylanoglu, A, Karpuz, C. and Pasamehmetoglu, AG., 1994. Specific Digging Energy as a
Measure of Diggability, Proceedings of 3rd International Symposium on Mine Planning and
Equipment Selection, Balkema, Rotterdam, pp. 489-494.
Chattetjee, P.K., Rowlands, D. and Siller, KC., 1975. Simulation ofDragline Operations,
14th APCOM Symposium, pp. 584-594.
Chironis, N.P., I 978. Computer Aids Dra2:line Operator, Coal Age, March, pp. 58-64.1
Cunningha1n, C. V.B., 1996. Personal Communication, Consulting Mining Engineer, AECI
Explosives Limited.
Ferrcira, T, 1997. Per_sonal._C_Q!llJTIUnication, VR-Steel representative in Australia. Tel. 0961
41 9248 044, Fax. 0961 79 582 110
94
Stellenbosch University http://scholar.sun.ac.za

Francis. P .. I 995. Optimising __ Draglin~~rating Method~. JKMRC Student Conference, pp.
l-19.
Hadjigeorgiou, J. and Scoble, M.J., 1990. Ground Characterization for Ease ofExcavation,
Proceedings of Second International Symposium on Mine Planning and Equipment, Balkema,
Rotterdam, pp. 323-33 I.
Hendricks, C.. Davidson, J.. Scoble, M. and Cote, M., 1988. Electric Mining Shovel
Diggability Studies, Proceedings of Mine Planning and Equipment Selection, Balkema,
Rotterdam, pp. 327-333.
Heywood, H., 1938. Measurement ofthe Fineness ofPowdered Materials, Proc. Inst. Mech
Engrs., No 140, pp. 257-289.
Howarth, D. F., Just, G. D. and Runge, A., 1987. Dragline Bucket Filling Characteristics,
Transactions Institution Mining and Metallurgy, Section A, Mining, Vol. 96, pp. A 189-A 192.
Hrebar, M.J. and Dagdelen, K., 1976. Equipment Selection Using Simulation ofDragline
Stripping Methods, Proceedings of 16th Application of Computers in Mining Symposium, pp.
449-461.
Huddart, H. and Runge, I.C., 1979. Pit Design Optimized for Dragline Productivity,
Institution ofMining and Metallurgy, pp. A6-A13.
Humprey, J.D .. 1990. Th~ F_yndam~ntals of the_ Dragli_ne, Marion Division-Dresser Ind. Inc.
Marion, Ohio, USA, pp. l-28.
Jinarajan, G., 1982. Techno-Econqmic Feasi'"lili!y_qfOpencast Mining, Journal of Mines,
Metals and Fuels, Oktober, pp. 515-530.
95
Stellenbosch University http://scholar.sun.ac.za

Karpuz, C. 1990. A_Ciassit~~JiollSystem tor Excavation of \urfacLCoaLM;l!f · \1ining
Science and Technology, Vol. 11, Elsevier Science Publishers B. V., Amsterda~··. :--p. 157-163.
Kemp, K.A and Chapman, C.W., 1978. How to Make Dragline Investme'1t~ Pay Off,
International Mining show of the American Mining Congress, pp. 1-23.
Kemp, K.A. and Horvath., 1979. Computer-Based Dragline Monitoring and Performance
Reporting, International Conference on Mining and Machinery, pp. 68-73.
Knights, P. and Shanks, D., 1992. Bucket Riggingln_fluence on Dragline Productivity, The
Australian Coal Journal, Vol. 36, pp. 27-34.
Lumley, G. and Jensen, B., 1996. Assessment of Model Dragline Bucket Performance,
ADPC, Report to BEMCOSA
Michaud, P.R. and B1anchet, J.Y., 1996. Establishing a Qauntitively Relation between Post
Blast Fragmentation and Mine Productivity, Proceedings International Symposium on Rock
Fragmentation by Blasting, pp. 389-396.
Mooney, E.L. and Gibson, D.F, 1979. Dragline Sizing for Surface Coal Mines, Proceedings
of Spring Annual Conference, pp. 252-257.
Morey, P.G., 1990. Surface Coal Mines, Surface Mining, 2nd edition, Port City Press Inc ,
Baltimore, Ma1yland, pp. 495-511.
Nicholas, PC., 1978. i\.max..&..Maximize Dragline Output, Coal Age, October, pp 114-118.
Nishimatsu, Y., 1972. Jhe Me9hailics of Rock Cutting. International Journal of Rock
Mechanics and Mining Sciences, Vol. 9, Pergamon Press, pp. 261-270
96
Stellenbosch University http://scholar.sun.ac.za
Panagiotou, G N, 1988. Assessment of Open Pit Excavat9rs Diggab~roceeding~ of
Mine Planning and Equipment Selection, Balkema, Rotterdam, pp. 305-314
Pundari. N.B., 1981. Selecting and Using Large Waking Draglines for Deeper Overburdeq
Stripping, Min. Eng. (NY), Vol. 33, No. 4, pp. 377-381.
Reece, A. I{., 1984 A Rational Approach to the Design of Earth-Moving Machines, Journai
ofTerramechanics, Vol. 21, No. 1, Pergamon Press, pp. 69-79.
Rowlands, J.C., 1991. Dragline Bucket Fillin_g, PHD thesis, University ofQueensland
Row!ands,. J.C., 1996. Personal Communication, Unit 2, Sumners Rd, Sumner Park,
Queensland, 4074, Australia.
Sargent, F.R., 1990. Loading, Surface Mining, 2nd edition, Port City Press Inc., Baltimore,
Muryland. pp. 620-657.
Sauer, N., Dreyer. T.P. and Geldenhuys, G., 1986. Wiskundige Modelle in die M~mka,
Haum, Pretoria.
Sharrock, G.B., Aspinall, T.O and Scott, A., 1996. Measurement and Analysis of Draglin~
Operating Parameters for Block Excavation, International Journal Surface Mining,
Reclamation and Enviroment No. I 0, pp. 79-82.
Smit, Dries, 1996. Personal communication, Optimum Colliery Bucket Shop Foreman.
Speake, C.J., Finch, T.E. and Haley, D R .. 1977 Calcula.ting_Q_rngline Reach Requirements
for Western Surface Mines, Society of Mining Engineers, May, pp. 35-37.
97
Stellenbosch University http://scholar.sun.ac.za

Spektor. M. and Klltz. M. 1985. 1:;;2<Q~DJ11ent£tLS.tu~h: QfFrontaJ R~sj~t_~nG~_[Q~e__i_n_SQil
Cutting, Journal ofTerramechanics, Vol. 22, Pergamon Press. pp 127-133
Steidle. E.. 1979. Moderr:LDesign Developments in Qragline Excay~t_Qr~. Inter,1ational
Conference on f\1ining and Machinery. pp. \33·-1 38.
Streck. W . 198 I Qpcnc~!_Mir.ir)g_Sy~~ms in Multiple Seiim Operf!tion in the United States.
Australian I.M M, Sympt)Sil:m or1 St~ir ~viining, pp. 51-55.
Swiericzuk, TJ. 1994. Con~eptt,al Study ofDragline Rigging Effects on Bucket Operational
Performance, Undergraduate thesis, Universitv of Queensland
Van Aswegen, H. and Cunningham, C.V.B., 1986. The Estimation ofFragmentation in Blast
Muckpiles by Means of Standard Photographs, Journal of South .1\frican Institute of Mining
and Metallurgy, pp. 469-474.
Ward. W.E., 1990. Coal, Surface Mining, 2nd edition, Port City Press Inc., Baltimore,
Maryland, pp. 65-67.
Woo1;ring, K. and Sullivan, R., 1990. Mining Coal in West Virginia with a 72-Cubic Yard
Dragline, Surface Mining, 2nd edition, Port City Press Inc . Baltimore, Maryland, pp. 980-
991.
Stellenbosch University http://scholar.sun.ac.za

APPENDIX A
TABLES RELATING TO THE PRE-TEST RANKING OF VARIABLES
Stellenbosch University http://scholar.sun.ac.za

TablE.. Al:
Gravel SL 1 Gravel SL 2 Gravel LL 1 Gravel LL 2 Gravel SH 1 Gravel SH 2
Deco S1 1 !--· [';:.eo SL 2 f--Deco 1l 1 Deco 1L 2 Deco SH 1 Deco SH 2
avE.:age i---
dev stC!ndard
Table A2:
3TD Gr<lvel Ll STD Gravel 12 UQ Gravel 11 UQ Gravel L2
STD Deco 11 STD De eo L2 UQ De eo 11 UQ Deco 12
average standard dev
Dete.rmining the influence of bucket width en filling distance and specific digging energy
fil]._ing distance (m) specific digg. STD hh UQ hh STD hh UQ
enero~~~ F, ,diff FD (_ii f SlJE!
2.55 3 2.04 2 74.44 2 61.32 :2
2.5 4 2.07 3 79.24 4 66.2 3 3.1 2 2.36 1 92.84 2 72.8 1--"
1 2.74 3 2.37 2 89.12 ,.., 77.76 2 L
2.52 3 2.04 2 72.64 2 62.88 2
2.8 4 2.01 l 84.2 3 67.64 4
2.23 3 l. 84 2 78.9 2 66.42 1 2.29 3 l. 77 3 99.8 3 65.88 2 2.63 1 106.8 1 ~.49 2 2.15 1 122.94 2 90.54 1 2.53 3 2.03 2 99.34 2 69.04 1 2.66 4 J.. 97 2 109.19 3 83.59 2
2.~87 2.06 92 454 71.28: 0 . ...:3 0.18 15.!)84 9.1259
Determining the influence of teetl. length on filling distance and specific digging energy
-~· filling distance (m) .:;,pecific dlgg. energy short hh long h:J short hh long hh
2 .·ss 3 3.1 2 74.44 2 92.84 2 2.5 4 2o74 I
) 79.24 4 8Y 12 2 2.04 2 2.36 1 61.32 2 72.8 1 - . 2.07 3 2.37 2 6ti.2 3 .76 2
?..23 3 2.63 1 78.9 2 106.8 1 2.29 3 2.49 2 99.8 3 122.94 2 J.. 84 2 66.48 1 1.77 3 2.15 1 65.88 ..., 90.54 1
2.161. 1.55 74.033 93.257 0.284 0.31 12.314 17.068
Al
0.51 d.i~ (). 4 3 13.04 0.74 20.04 0.37 - ~j_ • 3 6 0.48 9.7f -c. i 9 16.5E --
! ( ~ Q v • ."l- J. 2. 42 0.52 33.92
0.34 .).;:.4 0.5 30.3
0.69 25.6
0.5236 19.8C 0.1523 9.1069
diff F:) diff SDE -0.55 -18.4 -0.24 -9.88 -0.32 -11.48 -0.3 -ll. 56
-0.4 -27.9 -0.2 -23.14
-0.38 -24.66
-0.341 -18.15 0.1161 7.2883
Stellenbosch University http://scholar.sun.ac.za

Table A3:
STD s~ 1 STD SL 2 STD LL 1 STD LL 2 STD SH 1 STD SH 2
UQ SL 1 UQ SL 2 UQ LL 1 UQ TT 2 LL
UQ SH 1 UQ SH 2
~:t:"age
standard dev
Table A4:
STL Gravel S1 -
STD Gravel S2 UQ Gravel S1 UQ Gravel S2 STD Deco S1 STD Deco S2 UQ Deco Sl UQ Deco S2
-a\·erdge stJ dev
Determining the influence of digging material on filling distance and specific digging energy
filling distance (m) specitic digg. energy Gravel hn De eo hh Gravel hh De eo hh diff FD
2.55 3 2.23 3 74.44 2 78.9 2 J.32 2.5 4 2.29 3 79.24 4 99.8 3 0. 2_l
3. 1 2 2.63 1 92.84 2 106.8 1 0.47 l_
2.74 3 2.49 2 89.12 2 122.94 2 0.2~
2.52 3 2.53 3 72.64 2 99.34 '1 -0.01 L
2.8 4 2.66 4 84.2 3 109.19 3 0.14
2.04 ~ l. 84 .., 61.32 2 66.48 1 0.2 L
2.07 J 1. 77 3 66.2 3 65.88 / 0.3 2.36 1 72.8 1 2.~7 2 2.15 1 77.76 2 90.54 1 0.22 2.04 2 2.03 2 62.88 2 69.04 1 0.01 2.01 3 1. 97 2 67.64 4 83.59 2 0.04
2.425 2.24 75.09 90.227 0.1955 0.347 0.31 10.019 19.124 0.1447
Determining the influence of angle of attack on filling distance and specific digging energy
filling distance (m) specific digg. energy ·r low hh high hh low hh high hh diff FD
2.55 3 2.52 3 74.44 2 72.64 2 0.03 2.5 4 2.8 4 79.24 4 84.2 3 -0.3
.-2.04 2 2.04 2 61.32 2 62.88 2 0 2.07 3 2.01 3 66.2 3 67.64 3 0.06 2.23 3 2.53 3 78.9 2 99.34 2 -0.3 .
') 2.29 .J 2.66 4 99.8 3 109.19 3 -0.37 1. 84 2 2.03 2 66.48 l 69.05 l -0.19 1. 77 3 1. 97 2 65.88 ~: 83.59 2 -0.2
2.161 2.32 74.033 81.066 -0.159 0.284 0.34 :C2. ]] Lj 16.333 0.1673
diff SDE -4.46
-2J.56 -13.96 ·- 33. 8 2 -26.7
-24.CJ9
-5.16 0. 32
-12.78 -6.:1.6
--15.95
-14.93 10.721
ciiff .SDE
1.8 -4.96 -1.56 - ~-. 44
-20.44 -9.39 -2.57
-17.71
-7.034 8.1308
Stellenbosch University http://scholar.sun.ac.za

Table A5: Determining the influence of position of COG on filling distance and specific digging energy
filling distance (m) specific digg. energy Bl hh B2 hh Bl hh B2 hh diff FD diff SDE
STD Gravel SL 2.55 3 2.5 4 74.44 2 79.24 4 0.05 -4.8 -STD Gravel LL 3.1 2 2.74 3 92.84 2 89.12 2 1).36 3.72 STD Gravel SH 2.52 3 2.8 4 72.64 2 84.2 3 -0.28 -11.56 UQ Gravel SL 2.04 2 2.07 3 61.32 2 66.2 3 -0.03 -4.88 UQ Gravel LL 2.36 1 2.37 2 72.8 1 77.76 2 -0.01 -4.96 UQ Gravel SH 2.04 2 2.01 3 62.88 2 67.64 4 0.03 -4.76
STD Deco SL 2.23 3 2.29 3 78.9 2 99.8 3 -0.06 -20.9 STD Deco LL 2.63 1 2.49 2 106.8 1 122.94 2 0.14 -16.14 STD Deco SH 2.53 3 2.66 4 99.34 2 109.19 3 -0.13 -9.85 UQ Deco SL 1. 84 2 1. 77 3 66.48 1 65.88 2 0.07 0. 6 UQ Deco LL 2.15 1 90.54 1 UQ Deco SH 2.03 2 l. 97 2 69.04 1 83.59 2 0.06 -14.55
average 2.352 2.32 77.953 86.342 0.0182 -8.007 standard dev 0.362 0.33 15.146 17.525 0.1604 7.3668
Stellenbosch University http://scholar.sun.ac.za

Table A6:
STD Gravel SL1 STD Gravel SL2 STD Gravel LL1 STD Gravel LL2 STD Gravel SH1 STD Gravel SH2
UQ Gravel SL1 UQ Gravel SL2 UQ Gravel LL1 UQ Gravel LL2 UQ Gravel SH1 ~ UQ Gravel SH2
STD De eo SL1 STD De eo SL2 STD De eo LL1 STD De eo LL2 STD De eo SH1 STD De eo SH2
UQ De eo SLl UQ De eo SL2 UQ De eo LL1 UQ De eo LL2 UQ De eo SH1 UQ De eo SH2
Comparison between hitch heights for minimum filling distance and maximum engagement rate
FDmin HH ERrnax HH HH same 2.55 3 11.75 3 yes 2.5 4 14.98 4 yes 3.1 2 17.98 ?. yes
2.74 3 17.14 3 yes 2.52 3 11.32 3 yes 2.8 4 10.9 4 yes
2.04 2 11.32 2 yes 2.07 3 14.98 3 yes 2.36 1 10.13 1 yes 2.37 2 18.89 2 yes 2.04 2 12.21 2 yes 2.01 3 17.98 3 yes
2.23 3 16.68 3 yes 2.29 3 25.54 4 no 2.63 1 19.86 1 yes 2.49 2 32.27 2 yes 2.53 3 18.52 3 yes 2.66 4 17.89 4 yes
1. 84 2 30.98 2 yes 1. 77 3 27.54 2 no
2.15 1 38.36 1 yes 2.03 2 13.97 2 yes 1. 97 2 25.54 2 yes
A!J
Stellenbosch University http://scholar.sun.ac.za

APPENDIX B
FIGURES RELATING TO OPTIMUM CARRY ANGLES
Stellenbosch University http://scholar.sun.ac.za

61
60
59
,...... 58 :::;.. QJ
E :::J
~ 57 I
tr ...... 56
55
54
'··
. . • t • t t r 1 t ·r··;··~···~·-r··,··~···r . .
'J--:.• •••. ;._,_ ......... '!';. •• ' ... ~· ........ ~ •• , •••••• •;- ..... , ..... --11·.-~-
'i·. ·' ; . •• *-
-·: • ·- ..: ~ •• :. •• ~ •• ~ ••• :~ •.• ~ ... : •• ~ .... : .... ~ .. - ~ ••• !.: - .. ~ ... ; •. -~· ~ ~· :~:·~;;~ ·~ ·~~~: .. ~ . . . . . t t . t . . -, t ~ t t . . . . . . . . t . . . ~ ··~ • • . . . . . . . . t . . ~~ * . . . . . 1 . . . . . . r . ··:. ~ . . . . . . . . . . . . I I . . i,'i . . . ~
·-~ -~~:~ . -~:~~- ;. ~- ..... -: ..... :- ... ~ .... ~ .. ·:· ... ~ ... ~ .. ·: ... :· ... t .. ~ ... ·:· .. ~ ~ ·• ~ :.. .. -.,~ ~ .:~ .. ~~-- ~ -l.~·.:~ -~· ~ .;-: I . l 1- I f I I I t I • I t I t I i t t <,1
. . ' -• ' ' ' ' '
•· .
-~---~---~
20 21 22 23 24 25 26 27 28 29 30 31 32 33 34 35 36 37 38 39 40 41 42 43 44 45
carry angle (deg)
-Bucket 12
-Bucket 11 --Bucket 10
-Bucket 09
Figure Bl: test buckets repose of 38
Payload volume as a function of carry angle as calculated with a 20 theoretical model degrees
for the four for an angle of
Stellenbosch University http://scholar.sun.ac.za
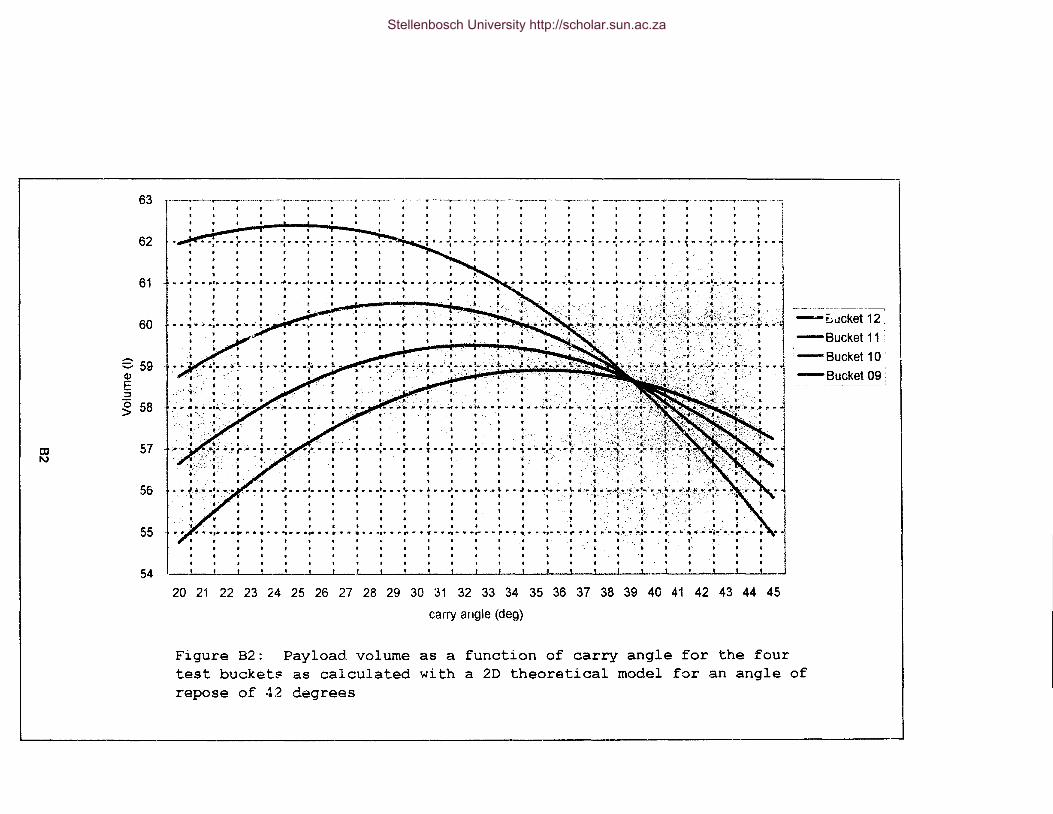
m 1\)
63 r------~--.------~.., -~r---····~.---~----- -----..----.----.......,-----····-..----....---~--'V'--....._._-----.---------------::
'
62 l
I b t I t I I I t I I I 1t I Z •• ·.- ..... - •• ; •• ; .. - ·,· •• ,· .. - .... • ..... ,· •• i ........ ••• •• ,• •••. - ,
'. • • • l k t I I {
I· I ~ J t
61 I C _ . I I t f ~ I ~ t 1 !
............. "" "" ... " ................ _ -~ •• ·,,a ·- •• --~---·· .. _ .. _· -· • .a ... ~ 1 1 ., I t I . 'I ,. I l t 1
I ~ 60 r ~- .. : ... · ~ . ,. .... ,
I . t I ,?fA -- . /:. ~59 • 1 .: I
. ~: i, .. L.L,j~;,;~xti.ii£,;~~;:Lj ---.,·ck•t 12. , I I I. I • ~-I ... -_ ; ;, '~-- :._r · ·: · t -· :· : I -Bucket 11 ;
....;.. I I t· ·•--- ·-. .; .r 1, · ,. t- / • t 1
? ---- · · ·· L.:.: ...... ~--~--i -Bucket 10' Q)
E ~
~ 58
57
56
55
54
I I 0
,I . . ' .
' . I
·i •. • t t t I I 1 , •.. ·.:·-.:,. : .. ·I· . '
• • : • • 1· • ·~· • • ,. • • ; • • ·, • • ·~· • • r • • • • ~:· • ·:· • ",!:: ... •
.. ''I
·•
~-;·;,_L -:.-_ , -~ ·- 1 -=--~~~!~~~ • ~~··-···I I J .,_,.i( I
~-] • .I • • _. • • •'• • • ' • • ~ • • •'• • • '- • • .& • • .1. • • '• • • I. • • I • • •'• • • \. "' • -' • •. J" .. •'• • • 1. " .. ~ * * .~~ .. • • • ~ •
f I I I I I t I I I t a I I I' .~' • ' t '• i . ~ & ; ' l t t I • I I·· I J .l· •. ' I I
I , 1 I ' t ' . , t ~-~- ' ( . :1. , : I I
.~ • ' • .• . • . ;t • .
• ••• • •i"' • ~ • ~ • -.. • •t- • • r • • • • ~ ••• • • r • • •· • • -.• • •.- • • r • • "'· • • • 1• •. •-r ~-.;.,~·M-..~ .. ~ .•.~· • •;. • • •.• .;,·;.··~·tli_.,.,. o. • 4!' • I I t · t I C I 1 i
.. ' . ·' . . ' . . I I J t I I
I I I I "t • I • I I 1 • • • f • ·: : : : : : I _t_____ ' ' ' -. ' '
I ! I L. I I .. _1_ __ I .. _L _____ .l_ __ !. .~ __ _]__ --~-..L_ _ _j______j_....L....._j
20 21 22 23 24 25 26 27 28 29 30 31 32 33 34 35 36 37 38 39 40 41 42 43 44 45
carry angle (deg)
Figure B2: Payload volume as a test bucket~ as calculated with repose of 42 degrees
function of carry angle for the four a 2D theoretical model for an angle of
Stellenbosch University http://scholar.sun.ac.za

tD (,.)
62.5
62
61.5
61
s 60.5 Q)
E ::I 0 60 >
59.5
59
58.5
58
r-·------ 35
.............................. a. .................................. .. 34 I
I 33 .......................... ·,· .... I -'/)
32 Q) Q) .... Cl Q)
31 "0 --Q)
c;, .......................... -c::
30 ea
~ . t 29 ~
E ::I
28 -~ 0. 0
'·\- 27 .~_
••• • ............. $ ....... l ......... ~~---~---····j:~~ • I t .
• 26
25
Bucket 12 Bucket 11 Bucket 10 Bucket 09
-Volume for 34 deg AOR --Volume for 38 deg AOR ~ = angle of repose I
-Volume for 42 deg AOR -optimum carry angle
Figure B3: Maximum payload and optimum carry angle for the four buckets for different angles of repose
Stellenbosch University http://scholar.sun.ac.za

62.0
61.0
00.0
li' Ill
! E 59.0
:I 0 >
58.0
57.0
56.0
30.0
62.5
62.0
61.5
61.0
li' Ill !! 00.5
~ 00.0 0 >
59.5
590
585
•
r ·r •
•
!·
• I
l ... --- ·r-------- -----1 •
!
y = -0.0700>( + 5.2403x - 36 028
R 2 =0.~
+ I
i
I l
-~
i l
32.0 34.0 36.0 38.0 40.0 42.0 44.0
carry angle at pick-up (deg)
Figure B4: Optimum carry angle at pick-up for Test Bucket 12 in crusher run with angle of repose between 42 and 48 degrees
•
y = -0.0784?- + 5.0484x - 19.186
R2 = 0.6296
i
i I 580
·~ • i I ---- --------------------~-------- -- ---------- -------------------- ------~~-----~J 250 270 290 310 330 35.0 370
carry angle at pick-up (deg)
Figure BS: Optimum carry angle at pick-up for Test Bucket 11 in crusher run with angle of repose between 42 and 48 degrees
i~4
Stellenbosch University http://scholar.sun.ac.za

.. ~ ~
~ :I 0 >
Cii ~ ~
~ :::1 0 >
62.0
61.0
60.0
59.0
58.0
57.0
56.0
25.0
62.0
61.0
60.0
59.0
58.0
570
. ...l.
•
- -· i -
----- . t - - -----~ --
it 1- . I
-~----i
I
27.0 29.0 31.0 33.0 35.0 370 39.0 410
carry angle at pick-up (deg)
Figure 86: Optimimum carry angle at pick-up for Test Bucket 12 in crusher run with c.ngle of repose between 42 and 48 degrees
r .. . r -· I
•
• I t .•
L
:· l ; j I 1 I 1 I I
---~---;
I I I ! i l . ------ -y---~ I l I l
·-- ~- ----4------ _J ' !
I I i
_j I
56.0 _____ L _______ L ______ _j_ _______ _L~ _____ l ____ _L ___ __.._ _ ___,
28.0 XJO 320 34.0 360 38.0 40.0 42.0
carry angle at pick-up (deg)
Figure 87: Optimum carry angle at pick-up for Test Bucket ·12 in crusher run with angle of repose betweer. ~ 1. and 48 degrees
Stellenbosch University http://scholar.sun.ac.za

APPENDIX C
FIGURES RELATING TO THE TEST DATA
Stellenbosch University http://scholar.sun.ac.za

() I-'
600
500
400
~ -Q)
e 3oo .E C)
~ '0
200
100
0
0 0.5 1 1.5
distance from start of drag (m)
Figure C1: Comparison between Drag Force and Distance in crushed rock and crusher run for tests RK106833 and CR106833
2 2.5
' .-'
:. _ ... · - --~J
Stellenbosch University http://scholar.sun.ac.za
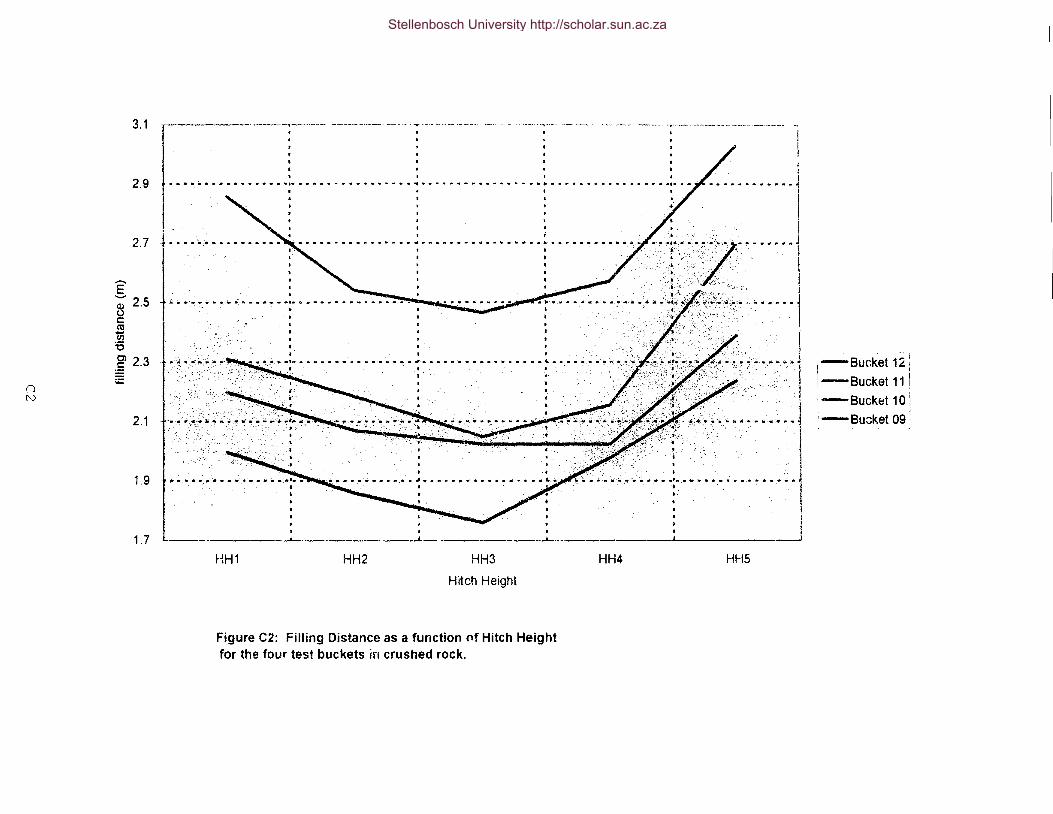
3.1
2.9
2.7
g Q) 2.5 (.) c: ro Ui :.c Cl
:§ 2.3 ;;:
n [\,)
2.1
1.9
1.7
···-----·- ---·-·-··------~-~----- -··--- -·. ·--···--..··· ··--·--·· .
1
---------T --- -- - r --- i ~ : . . . . ........... '1 : ...... : ................. ;........... I
................ ·:· ........ - . : : . . J'
I ' : : : . : ; .. ;.; ....... .. .......... : . "T: ·:}.(:· . I . (;S,~~- ... --·1
J
·• I.
I
. . I I[· . . J
• . • ·il'"'' ;, ··:'.~ ·.'rl!'f •- ;. , , , • • • • .I 'jti!iiiK '< ......... l
.... ; · .. ···~· . . :_~(·\; ... ,.. •• .· ·•i
. .. .. . . . .. •.- . j I. -~ -~- "-.~:· . • ·.·; ·c
1 .. -~ .. ·.;_ ...... · ... --~~--:·. . ~ ........ ~ .. ~
. •. ' . . I
I I
I I
I I
--------'--------.....i HH1 HH2 HH3
Hitch Height
Figure C2: Filling Distance as a function of Hitch Height for the four test buckets in crushed rock.
. r:·--: .. , __ ••...• ~ ••. ~:· .• ·• .....• u ••.
·. .. .
HH4
. ' I I j I
' HHS
l
1
-Bucket 12
!-Bucket 11
-Bucket 10
-Bu::;ket09
Stellenbosch University http://scholar.sun.ac.za

3.1
2.9
2.7
g 2.5
Q) (.) c:: C'O iii 2.3 :0 Ol
@ ;;::: 2.1
(l w
1.9
1.7
1.5
' . . .... "". " .. ; .... "." .... ". ;· ........... ; .. ~ .......... ~.... : ...... . t····· ' '~ .... . / I. : .. .. . : ... ~ ........... ~.._/ : / ~ ..... .
........ ;.......... : ~ ....... ~. '")/' ......... : .. ~ ................. : .......... Z: / I ............... : : . •.-<. "
·················:· : i~········ ·'A·-····:::~~-. ....... .. . : : .............. : ~· : ............ : ... ~ ................. : ...... ; .... T ......... . . .. . . .......... . : ~-.... ~ . ;--.
........____
HH1 HH2
. .__ ----_____ t ___ •
HH3
Hitch Height
Figure CJ: Fillir.g Distance as a function of Hitch Height for the four test buckets in crusher run
--------'··--------
HH4 Ht-')
Stellenbosch University http://scholar.sun.ac.za
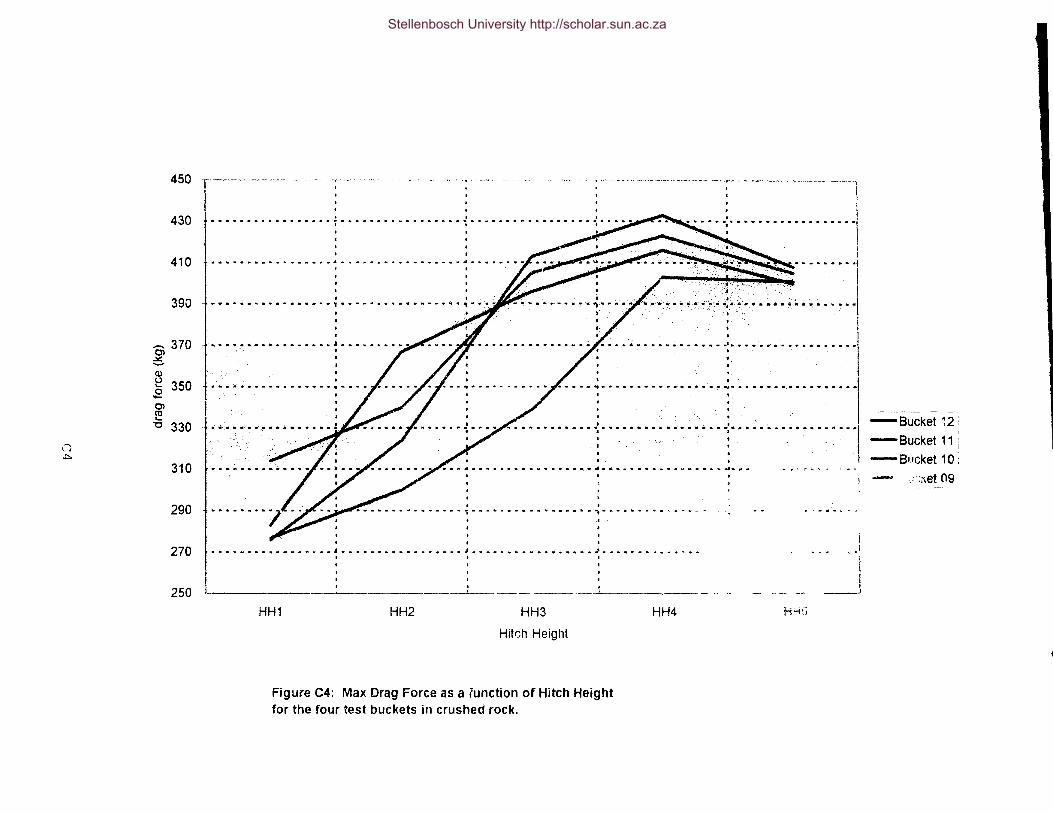
n .:::.
-a ~ Q)
450
430
410
390
370
e 350 .E Cl ~ "0 330
310
290
270
250
------ ----- -~
I ~ ' 0 I ................................................................................... ...... · .................. l . l . . . .
! ........................................................... ~~-········l !
I I • • • • • • • • • • • • • • • • • 1 • • • • • • • • • w • • • • • N ·• , • ,• ·~~~ ..:. •:· .. ·-~-··· .. ~,~-.. -~·'..,'·_•_ ~t-~~-~"' ..... -~-.~~Ill:..:_·-· ...... _. . .. . .-.
:/ .·.I I I[ . ........ - ; •.... • .. :_ •• - ....•.. - .••. - . - ., . . . • f_ • . . • • l
........................... ····-~············,···~~·-·····~··········
...••.•••. -.. { .• -•.•••..••• -•••• -: •. • • ~ •.•..•••..•.• "I . . . . I
I ............................ -.................................. .,. ..
. ' ···············~·················-.···············
...................... l ..................... J ..................... .J ......... .
HH1 HH2
. .
HH3
Hitch Height
Figure C4: Max Drag Force as a lunction of Hitch Height for the four test buckets in crushed rock.
HH4 Hi-;~j
I I ___ l
-Bucket ~2:
-Bucket 11
- Buck.et 1 0 : ._;·:"'et 09
~
Stellenbosch University http://scholar.sun.ac.za

580
530
480
Oi ~ Q.l
~ 430 0 ._ C» C1l ..... "0
n (_,.I
380
330
280
----------~---------·--------------------1
................... , ..................... ~ .. ,-I
-··-~----·-·····--···-~ . I
! i
-~-·~-~-~----4 . ................. ' ..... .
. -. . I
l
I . ' - •''
••• -.- ... - ••• ~ •••• ,•. ·.·": ••• 06 ........ ; ._:~ ••• • • •• ,... .•. •.• ~ ~· '!----~
·' . . . •
• ...... • • • • • .! • ., • • • • • • • • • • .. • • • • I • • • .. • • • .. • • .. • • • • • • J • • • iio • - • • • • .. "" ....... ~ • •' . . .
l ---_,_______ __ __.__________ ---'--· HHi HH2 HH3
Hitch Height
Figure C5: Max Drag Force as a function of Hitch Height for the four test buckets in crusher run.
HH4 HHS
I l
-bucket 12
-bucket 11
-bucket 10! I
"-~buck~ 09 j
Stellenbosch University http://scholar.sun.ac.za

6000
5500
5000
~ >. e> ~ 4500 Cl g iE
n 4000 0\
3500
3000
1·--~~----··----------· ---------~ ... ---·-·---····· ·-- ··- ·-~··-··- -~-·-·-···~···--r·-- ---~------- -------------·----------1 l
................................................................... &o .................. ..; ... .
, I ···-~-~-····-·.···j
I l
- •• "' "' .................................. "' ..... ,. - .......... £,..- .... · ..................... ifi.. ;.···-.s:.~-:-i(:;(~_ ... ·.:.':~}~:;;:,;.··~· .... -.~-.•. .;,.:·•
I
•• • •• • •• •• • • • • • • •: u • • • • n • •• • • • •' ::• • • •u' • • • • • • ~··:~~~''••"•
HH1 HH2
'
HH3
Hitch Height
Figure CS: Filling Energy as a function of Hitch Height for the four test buckets in crushed rock.
l . l . l I
HH4 HHS
.-Bucket 12'
~-Bucket 11
•-Bucket 10 I
:-Bucket 09 · ~--------
Stellenbosch University http://scholar.sun.ac.za
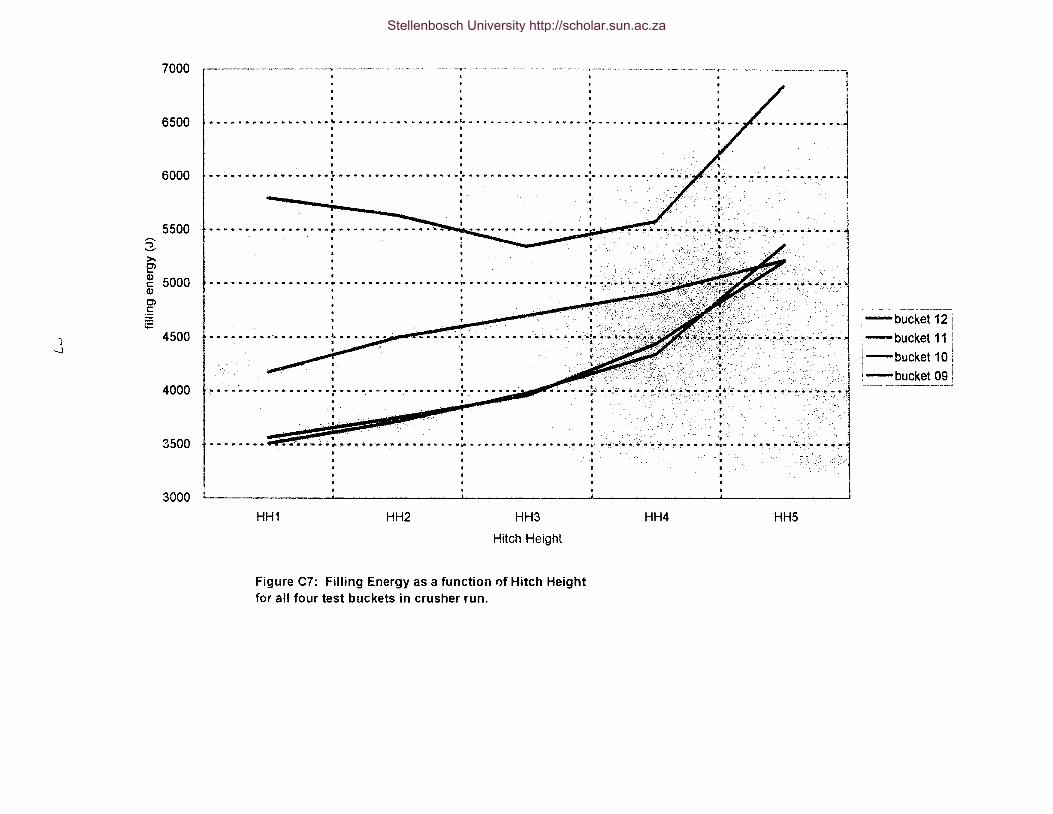
J -J
7000
6500
6000
5500 ~ >. ~ ~ 5000 Q)
C>
~ ;;:
4500
4000
3500
3000
... -................. "' .......................................... -...................... ·'· .. . . . . ·-··············-~·-··············-~·-···-··········-~·-············ . ' . '
. •.....•.......... ~ .........••••.••. ~ ..... . . : : ,... . . . . . . .
........,. .. . . • ·• • • r ~ • • ~ ~-· "• • • .. •. h. •.""e-o ••••••••••• "" ~ ._ ••• , .
. . L-~--~-~----~----- _!__ : :
HH1 HH2 HH3
Hitch Height
Figure C7: Filling Energy as a function Qf Hitch Height for all four test buckets in crusher run.
<· "· .•.. ~ .... j . I ' . . l
... ::.:': ~.:: :~ 1 .. ··. . . j - . :. . .. - .:.
'·-· <;··_· ..... :~· .":· .. ··. >~-~ ·,... •. __ ; ;.:~·-> .. '!" ....... : . .•.•.. ·.·1
. ,. .
.... ·· . . . l
....... ,,.·······r···············-··,1 HH4 HH5
;-bucket 12
-bucket 11
-bucket 10
-bucket09
Stellenbosch University http://scholar.sun.ac.za

(') CO
g (D (.) c:: CO 1ii :c Cl :§ ~
2.3 ---·~~
l
2.2 ... - -- ....... - .... - • - ., ........ - .... - - ......... - ........................ - .......... - ............... - ........ - .. .
2.1
2
1.9
1.8
1.7
1.6
1.5
i I
............................. - ....................... - ................ - .......... .Jo ........ -: ..... ·- ~--···········]
....... . , .. -....................... ~ ............................ , ...... ~..Jt·.·,. ... ~;. ~ ..... :·: ... l ! :t: T . :
·~ ' :·. ~- .......... ~ ... ~ ·l ' I .. : l ' I r. . ~. . . . l
·~:~: .... Ot::~· .'!t ..... - ........ - ..... -......... .
::~:, '-~.~-·· :;. . ·~·: . .· i . • .·. . j
•. i . . . . . : l ~ ...... ·.,~ ·:• ":". W:~_ ..... ~- ._,. .............. _ ••• i . I I '.
. I . I I . : . . ·.· ·'. : : . j'
......................... : ..... -................ ~ ... · ..... ~ ........ .;. ... :~ .. -. -.................. ~·- ............... -:-~ .· ~
HH1
I I t I
1 t I a 1 : !
HH2
I I I I
l ' ' '
HH3
Hitch Height
HH4 HH5
Figure CB: Filling Distance as a function of Hitch Height for bucket 12 m two spoils.
-crushed stone ,
-crusher run
Stellenbosch University http://scholar.sun.ac.za

n '0
2.4
2.3
2.2
I 2.1
~ c: C1l 1i) 2 ii g
iE 1.9
1.8
1.7
1.6
.-----·--··--- ·-··-------1
I j
•• - ........ - ................... - .......... J ........ -- .............. "' • - ... - ........... t ..... . ....•... l ' • • j I . . . I
' .. -. . . . . ~ ....... : ................. ~ ~ ........ · ......... ~ ....................... ·~, .~.~($~ ~ ):,.~c. ~ ~ ~ ...... 1
: 1 : .. ··tt .. ·;::.::• · ... , .. ·I ........ s ...................................... ,. ·"' .. i"' , •. ·.·, ........ ·I • '-- : : ·; .>· " ! . ·..... .. ... l
i • . . I ··... .·. . ·. :·. ··... l .;_ :"~~--·· -... -...... --~ .... " .. . ..... -........... -..... -:- ........ -.......... ~ ............. ~-...... :- .... .. . 'c'(d; .. . . I
:):-,-~--
~".1· .
. ·•·· .. ·: .•. . ~
. ·····-········---~---···-·· ....... j .. -~L ... ~ ........ ~. r:: :::::: ::::;:::I . . l ,. .
HH1 HH2
. . . J J J
HH3
Hitch Height
HH4
Figure C9: Filling Distance as a function of Hitch Height for bucket 11 in two spoils.
HH5
! I I
. -crushed stone
1-crusher run I
Stellenbosch University http://scholar.sun.ac.za

2.7
2.6
2.5
2.4
E' -~ 2.3 c: C'C 1ii =c Cl 2.2 ~
n tE t-' 0 2.1
2
1.9
1.8
--------------~ -----~---- ---~----~-- -~-- --·-v---~ -------.
•*aaMaa•~·-·••••J•••••••••••••••••'••••••••••••••••~•••••••••••··~---~~--~··
•
-------l ! ! .......... ·!
'! I
~- . . I
••••••••••••••••• • •••••••••••••• · ••• ~ •••••• ,; •••••••••• ! •••••••••••••.•• .::·.1 ..... ·- -.··· .•• ;. · ...• · .•••• -.11 I l . t ' ~ - . .
t . • . . .·_
I
... ~ . • .......
l .,.,. ... -~ .... ,
: •• -;.~;.;. ..••.. .! . I
. I 1 I
................... _ ........ "" ......... '!" ..... ~-t.• ................. -~- .......... ~- ~:-~ i-:_-:'_~
• -- •• •t• ...... - ........... 11: • • (;- ,, ............... ,., ••••••• oil •
i ••••~•-w•\••••••••••••••••~.;,•••••••~• . I I • lg "• • :..,.;._ • .;-. ~- 4: ... ~ •. - .• !
·' . . -~- . I
-., .... £A·-~ .. -.. '; ... _:~ ...... .l . '"'.:- . !' ..
'~ • t. . .
. . . . ···---~~-~~~~--~---····~1 ......... .: ...... ~ ................ ~~----~-----~-----~ ... .;.~~.: ... ~ ...... ! .... :.;. .. ~ ...... .
' I
. . I HH1 HH2 HH3
Hitch Height
F1gure C10: Filling Distance as a function of Hitch Height for bucket 10 in two spoils.
HH4 HHS
-crushed stone , -crusher run
Stellenbosch University http://scholar.sun.ac.za

3.1
3
2.9
2.8
g ~ 2.7 c: «< 1i5 :0 Cl 2.6 ~
n tE ....... ....... 2.5
24
2.3
22
~--·---~ -~---- ... ·-·-···--- -------- I !
................ ·:· ................ ·:· ................ : ................ ·:· ..... ~t,· ....... ·j I
l l i ....................... .., ....... -...................................... .. )f • M •• • •• • • •;
I.
' ~-----~~---·····J ................ ~i ••••• ; ••••• ~ •••••
I I
I >
~~~-~---···~·-················~~---~-·-~-·~
. ... • '": ·•. ~ .; .-"! ~ ·: .......... ,. • " •• - .. llr •. ~ ....... --~ •• ~I~-:~ -~-A_-;{1.~._,..
. . . t
~
l ... -~ ............. -1
. I 1
--~~---~;~·6·~~·~ l I
·. . . i •••• ·:. •••• ~ ••.•. -··l
I .. l
-·~--,~\--····-;.•_·•'•···~· ~ :- ~- .... ·i j
1. • • • • • • • • • • • • • • • .:. • • • • • • • • • • • • • • o • ~- • • o. • • -~~~-~~- ~- •. d:;·,;~. ~ .<t ... .c. •_ .. It. ~u ~;•,• ~ 0 • • • 0 • • • .i 1 I I f ' f' 1
' . l
I • • ·-· ;. l
t "' . ~ I f j I I I t i I___ • • • - ' ~
HH1 HH2 HH3
Hitch Height
Figure C11: Filling Distance as a function of Hitch Height fllr bucket 09 in two spoils.
HH4 HH5
--· ~I
. crushed stone 1
I 1
:-crusher run _j l--------~-
Stellenbosch University http://scholar.sun.ac.za

600
550
500
~ 450 ._, Q) e .E 01 e! 400 "C
n ~
r,J
350
300
250
r----------------- ~-- -- -- ----- --- -~- -- -~------------~----- --------- ------------~ --- ·--------· -----------~
I ............... -_j ................. i . . . . . . . ... --. ~ ....... l ......... -.. ~-... "ll I t f t . l
• • • ' l : : : : J • t t l . , I .
···············-~·········· .. -.. -~ ...... ~ .... --- ... + .... ·~ -~-~. ~ ..... ~ ->~ ... ~ ... -~ ...... ·I _I
' '~ .
• ., . I : '. . l . . . . . . . -. -. -........... ----... T .. -. ~ ~--~ . ~ ~ . ~ . -" -:~-)···· .. -~~. ~ -~ ... ·1
-:. ;, -~:. __ :,_->:- r· ll
......,__,..,...-;-:.:, ,~, ~A~?.~~~,;:. i 7'.; ·: • .. -~.=~~:~:~ r~~ne ! -
... · ' . : I
> .. -~
.................... ~~o-.: •.. ;. - ··-· • ~ • * • - ..... ., •• _.·. I . . ...
·• . ,
-~-; -. ~·~-- -·I .. ..... ·a'·
1 I --~- !
l I ~---~·················!············~···~···-~···~-~---··~~-··········~~---·
I r··-··-----, ___ _
HH1 HH2
---'~ !
HH3
Hitch Height
Figure C12: Max Drag Force as a function of Hitch Height for bucket 12 in two ~poils.
HH4 HH5
Stellenbosch University http://scholar.sun.ac.za

n I-'
'-N
550
500
450
Ci 6 Q)
!:: 400 0 -Cl ro ..... "'0
350
300
250
,-------~-·- ----- ---~- -----"'"--~~ ~-*·-- ------.----- --- ----- .... ------------------------"1-···
. . ... - • - ••••••• 11111 .............. - • - .......... , .... - •
l ' i !
.. • .......... -I l
........ I I ···············-~··············· M; • • • • • • • •., • • •. • • • • -:~.~~~~ oio 11 ~-~-~ •.• ~ ~ ~-- .. "'~-~--~ ~-:~_:,·~--~-~-- .. ~)
I . I
I 1
. ·.· . , -,._, I •••••••••• : ••••• - ••. ~ ,. " ·, 7 • ~ •• +~ .. : -.. ~ .. ~ ....... ·I
.. ,. •
.•.. :·
- ... • "' l 11 ....................... loo '* .... - ..... ~:-; -;.· ... -.•.. 111-~ .... - • ..;..,~
• .•- i
·- '.- .. f
~· . . .(
I •
I
.••••• - ................. - "" •••• Ill-................... - •. ;. •. •. ~ ~ ~ ~ -~~.-~ .. :~ ~. :~ :---~- - .• •."' .:.
~---------------------1 HH1 HH2
. ' I I
HH3
Hitch Height
Figure C13: Max Drag Force as a function of Hitch Height for bucket 11 in two spoils.
HH4 HHS
l
I ·-crushed stone :-crusher run
Stellenbosch University http://scholar.sun.ac.za

550
500
...... 450
~ Q,)
~ 0 -0 ~
(') "0 400 ,.... ..,.
350
300
• • • • • • • • • • • • • • • L • • • • • • • • • • • • • • •'- • • • • • • •• • • • • • • •'- • • . . .
. . . . . ............... , ............... , . ...........................................................
I : l
. -........... ·;: ..... ~ ................ • ......................... ·• ......... Ill ••• . . .
I
' L ____ _ HH1 HH2 HH3
Hitch Height
Figure C14: Max Drag Force as a function of Hitch Height for bucket 10 in two spoils.
HH4 HHS
-crushed stn.,e -crusher run
Stellenbosch University http://scholar.sun.ac.za

500
450
........ 400 ~ Q)
~ 0 -Cl Cll ....
n "0 350
f--'
'J'
300
25('
r --
I I
. . ................................................................ • 0
••••••••••••••••••••••••••••••••••• .a .......... ..
0
~"", .. : ....... . /.':. ........• ~'-....... .
. . ·•· .. • ~ • .. ,. ~fl!.~=-~·~~·'U•'!ttt~~ . ~, '
t I'~ 1
:/ . . . /;(
0 • I ... , ...... -·; . :· .. . . .... " ........ ' . . . ' .... .
/: ...............................
f ....•....••.• ................................ ; ...................... .J .............. .. 0 0 I
i i i I
I • t I ·-- ---- --------.......1.--~-----------~---·-··-----·------- ·--..L...--------- -.1.-----~·
HH1 HH2 HH3
Hilch Ht. ..,.ht
Figure C15: Max Drag Force as a function of Hitch Height for bucket 09 in two spoile ..
H.-14 HH
Stellenbosch University http://scholar.sun.ac.za

. ...-.._
:::. >-2' ~ c..Q.)
Ol .~
5500
5000
.. - -" ~:;ut,
§ 4000
3500
?OOC
............................ 4 ......... ~ •• - ...... ~.- .... - ................. ..
t • a r • a • • • • • • • ............................................... ;.,.
i
I I
I ,
f----------------j-------------~-------1
' '
i ....... -: ................. .- . I .. l ••••••••• t·············· . r
l ---------'''-- -----------
rlH1 HH2 HH3
Hitch Height
Figure C16: Filling Energy as a function of Hitch Height for bucket 12 in two spoils.
... .,. ... ~~. ....................... ~
-crushed stone -crusilP-r run
... ...................................... i I
______ __)_
HH4 HH5
Stellenbosch University http://scholar.sun.ac.za

,...., \. ,__.
5500
sooc
~ 4500 > E' Cl) c:: Cl)
Ol .s § 4000
3500
3000
r ...... ., .... - ........ "' .... .., • - ... - ..... - "' "' ..... .I. to ...... .- ...... - • - ............... .
1 .......... - .... - ...... - - ~ .................. "" ........... : ....... "' .... - ......... : ... "' ........... '"' • I
. . . . . . 0 I t
.................................... ! I .
I
. ' . •••••••••,.•e••,.••••••••••••••••••••••••••• . . .................... " ... .
I t ' .. .. • ......... "' .. • .. • .. .. ... - .11 .. .. .. •• .. .. ... .. - ........... - ••• 1
I . I I I l ___________ ---------~·----~-~----------..j _____________ _L ______________ ___l.. ______ _
HH1 HH2 HH3
Hitch Height
Figure C17: Filling Energy as a function of Hitch Height for bucket 11 in tv, . spoils.
HH4 HH5
I
________ j
-crushed sto11e
-crusher run
Stellenbosch University http://scholar.sun.ac.za
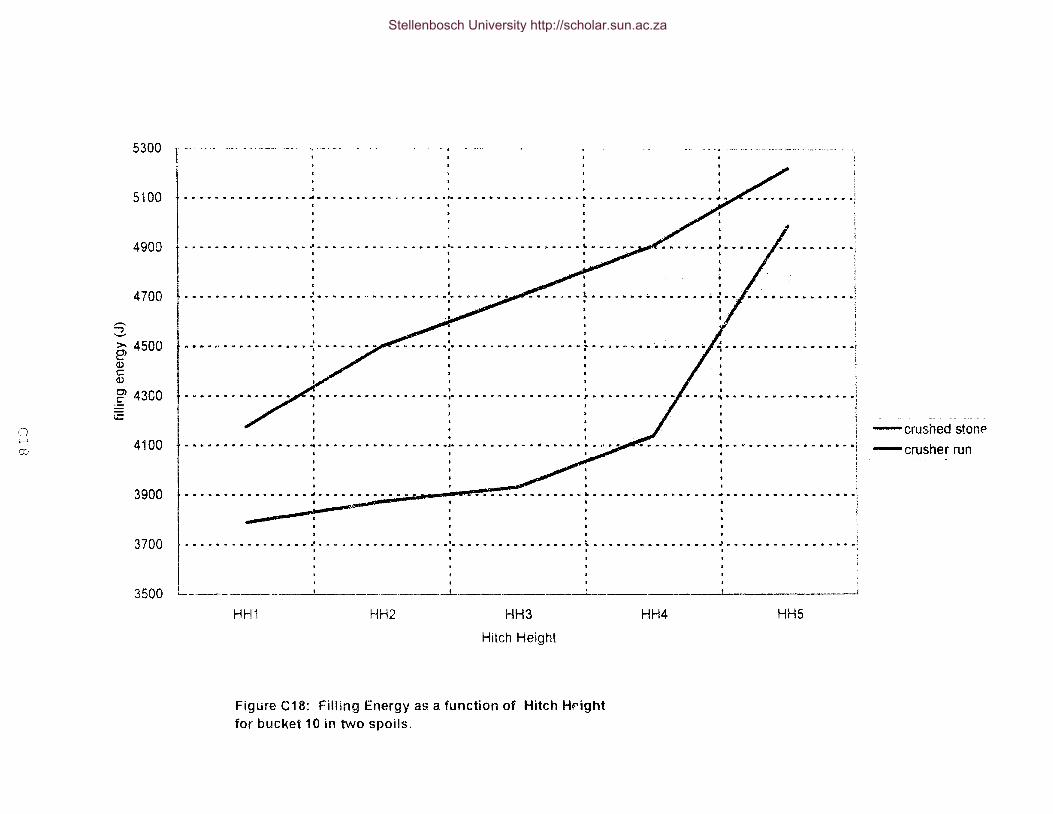
rJ ;.->
C0
5300 l --
5100 .. .. ...... t.. • .. • .. * ... - - - .. - .. .. • .. • - • .. • .. ...................... .
4900 t···············-.J ........... . I . .
.. - ., .. !
4700
s
1 0 I . . . ""' .. . . . .. . ............ • . . .. ... .. . .. . . .. ...... -... ' ........ '" . I . . .......... !. ........................... ' .. . . . -
•
._
E;; 4500 .... • • . I• -.... ""' ................... "' ......... ,. .. ; .. -................. -... , , ........................ ..
Q) c Q)
g> 4300 I
.......... • • • r .. • .. • .. • • • .. • •I' • • • .. "' • .... • * .. • • • • • • • • • • • . \;::::
4100 ................................................... .... ......................... ~ .......
3900 t r I I t
..... ,. .................... ..A .... - .. • .. .. • • .. ... .. .. •• "" ............ - .... a. ........................ - • ,., ......................... , ' . ~
7#'' I
0 I
3700 ........................ - ...... .. ........ - .......... ·- "' ......... - ........... i.. .............. - ............ J ........................... ;
3500 L_ _____________ __,_. __ ____ _i_ ____ _ __j_ _
HH1 HH2 HH3
Hitch Height
Figure C18: Filling Energy as a function of Hitch Hf'ight for bucket 10 in two spoils.
HH4 HH5
-crushed ston~
-crusher run
Stellenbosch University http://scholar.sun.ac.za
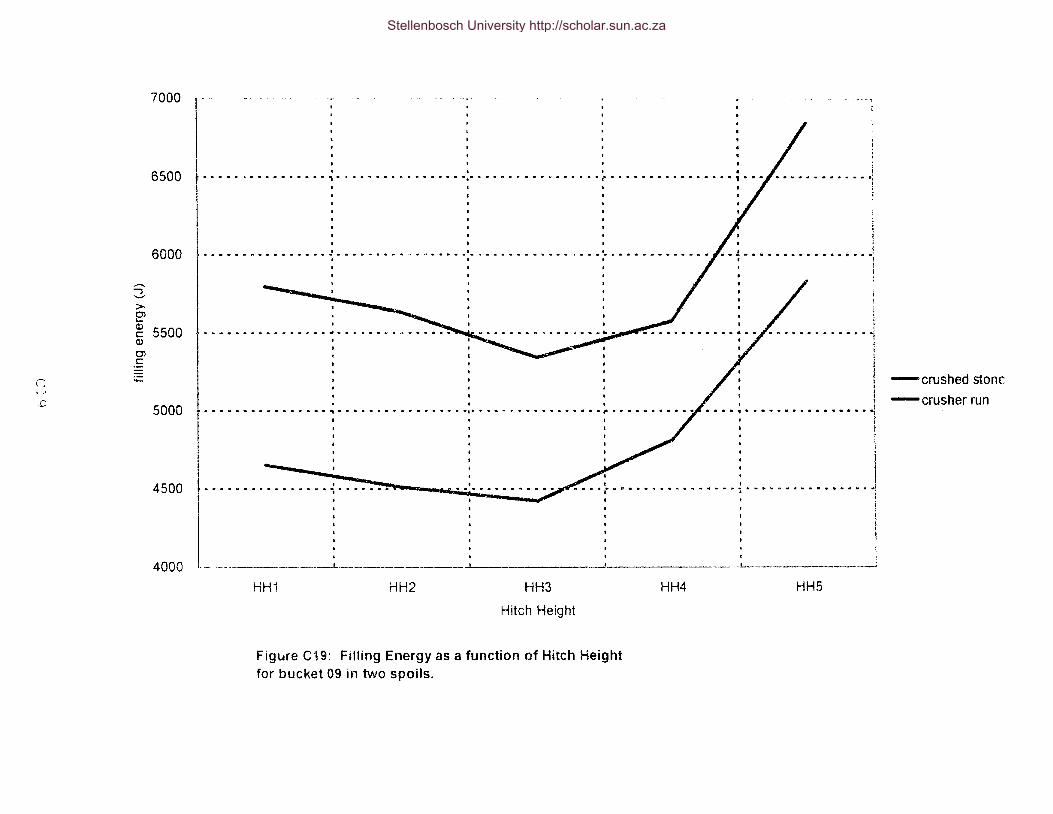
\: f-'
,_()
7000
6500
6000
s ....... >-!? ~ 5500 Cl)
Cl c:
;;::
5000
4500
4000
I.
. . f ..... . . . . . . . . . . . .. . ....................... . .. , ..... "' • ••••••••••• 1 •••
...................................... .............. •. .. .. • ........ -.......... .. . I
- ................ * ........ ..
.. - .. to .. <la 00 a .............. a ..... ~ a .. a ........ a a "' ., ., ......... e .. a D ... t> a ~~ 11 • ,. .... a 11 loo • lA ....... .
I ' . I I ...................... :······.. ~ ... ·.·········;.,;,
------------·-·--L--------~--·-
HHI HH2 HH3
Hitch Height
Figure C19: Filling Energy as a function of Hitch Height for bucket 09 in two spoils.
HH4
.. • .! - .............. ,. ... . I
.
! .................. -1 i ! !
l I -crushed stone ! -crusher run
• •••••••••••••• "j
l i l l ! ................. , I I
.-L------------~
HHS
Stellenbosch University http://scholar.sun.ac.za

2.8
2.7
2.6
E' 2.s '-"' G) (.) c:: ~ 2.4 :0 c:n = § 2.3
2.2
2.1
2
1 ................. ·r ................................................................ . I :
. ........ .
; 1 . ...................... ;"" .......................................... . ....... 'l ........ - .... - ........... - •• t ~ •• ·- •• - .......... j
. . . . .. .. . .. . .. .. . . ,. .- ...... -................ .. ................... Ill .... "' .. .......... , ...................... " • -~-r •,
. . . ,. ............ ,- ...... -.. .. . . .. . - .. ... . .. .. .. · ....... -. . . . . .. .. .. ........... i ............. •. ~ ............ ..
I
! l • .......... ;,. .. · .•. •l l !
.......... I I !
I .• ........ " " ... ·l ........ ;. . . .. ............ -...................... .
L __ _
.
_.f! :i'~"-·' ·,~;.I
'" .......... • .... .. .
I l ;
' l .... - .......................... i i ' l l l . ..... ( ••••• l. • • • • • • • • • • • • • !
/'. : 1
"" • I :-~-~ ' i I
_________ _____J__ I I ___J___ • ---------
HH1 HH2 HH3
Hitch Height
Figure C20: Fiiling Distance as a function of Hitch Height for four angles of attack for bucket 10 in crushed rock.
HH4 HHS
-AA5 1-AAB -AA10;
-AA12
Stellenbosch University http://scholar.sun.ac.za

n f'..)
G
[ Q) u c:: ro ~ "'0 Ol .!: ;,;::
2.8
2.7
2.6
2.5
2.4
2.3
2.2
2.1
2
~·- ---·- -- -·-·· ·--·---·----
1" ....... --..... . . . .. .. . .. -. - ............... ··"' .................. - .. -..... -- ....................... '"- ........ .. . ....... .
l
I . I
•;••••·······-- ... -. ... , .............. . ........... , ........................ ,. ..... . ......... 6o ..... ~
t I I •· .. • • .. .. • • • • • • • .. ... • .. .. .. •• • .. "" • • .... " • • • • .. • • • •• • • • .. • .. • .. .. - .. .. • • a ..... , • .. .. .. • .. ................. r •
' ' ' ............ ,· .. • . .. .. .. .. • • . • .. .. "' . - .. ·,... • .. - - .. • • • • • .. - • .. • ... i .. • • • .. .. • .. "' ........ "' •
...........
'~ .. ~:· I
l I i l
'• ........ .., ........ ; ! I 1
F l' -~-----~--! l
~-·······-~·-·~
L _____________ i_---------~/
·--------------'------------_____.L, ____ ~---------'
HH1 HH2 HH3
Hitch Height
Figure C20: Filling Distance as a function of Hitch Height for four angles of attack for bucket 10 in crushed rock.
HH4 HHS
-AA5
-AAB
-AA10
-AA12
Stellenbosch University http://scholar.sun.ac.za

2.4
2.3
22
2.1
-g Q) 2 (.) c ctl -fJ)
:.0 Ol 1.9
.!::: :..=
(J f'..J 1.8
1. 7
1.6
1 5
r
j ................... ~ ................. ·: .................. ~ .................. ; ....... . ll : : : • I
......... -...
................... ,
........................
I I ~ ~ I I I J
...................... • ............................ • ........................ • .. to. . :
I t • • ......... - ........................ .
1
: : : : I I
I . . . 00 ..... e a .. a •• 00 • a ... '"' a - a ,• • •• a • - ... " • a 00 •• a a .... I a a ....... e 00 .. D .. a Oo flro •• a •• a • - a .
I . • ..................... i'" • - .................. .a ••• ,. .............. ~ ~ ......... "" - ...
•ya.•··~~~·-···""••a. .....
i .................... .,., ........ f
. ! ' l
........ ~ -.................. l I ! ' ! ...................... • ........................ • ........................ :-·-- .................... ~ ...................... !
f I I i
l" ............... .
HH1
I I
I I t I I !
r • • a • W • a • • a 00 a • A • • • • .:. a • .. a a • 00
a W .. a .. a a • a • ~ 00 ..... a a a a .... a 10 .... a • 00 • & ~ * • .. • a a .... a .. • • Q. Jlo ... "' • ~
I l 1
·-----t
HH2 HH3
Hitch Height
HH4 HHS
Figure C21: Filling Distance as a function of Hitch Height for two angles of attack for bu~ket 11 in crusher run.
-AA8
-AA12
Stellenbosch University http://scholar.sun.ac.za
n j'.)
f')
450
430 ........................ • ....... - ...................... ! ............................. ·'- ........ -.- ........ .,·_. •• . ' . 410 +·············-········••»••·················
39"
- 370 0> ~ Q)
e 3so 0 -Ol ('(l
-o 330
310
290
270
250
. ., .............. ,. ...... • ................ . . .,.. • ~ ........ ,. ... ·• ....... 1 •• ;a ............. ~ ;.. -- ·~ ...... ~ .. I
l l I
....... , ••• 8 •••• - ...... "" ...... , .......................... } • l
l j : : : : : : : : : : : : : : : : : ::: : : : : : : : : : ..... "••••••••••:•••••••••••••••U••:••••••••••••••••••j•
. . ................ : .................. ~ ................. ·I
' • j .................... :· ........................... ~ ......................... i ! i
• • • • • • • • • • • • • • • • • • •• • ':. • • • • • • • > • • • • • • • •• ~ • • • • • • • • • • •••••.•• ·ll I I
: : l I t t J
.... -- .. • ..... "' ........ .,"' .............. ., ! .............. - ................. • ...... <lit ......... - ........... J ......................... .. 11 1 I I I
• • • I t ........... .
I L _________ . ______ ·----------------·----------- ------
HH1 HH2 HH3
Hitch Height
Figure C22: Max Drag Force as a function of Hitch Height for four angles of attack for bucket 10 in crushed rock.
I • i ·----·__..___ ___________ _,
HH4 HHS
.-AA6
-AAB
-AA10
-AA12
Stellenbosch University http://scholar.sun.ac.za

() : j
'...u
600 r .. -- -- _______ .. _____ ----- ---
l ................. -~ ..... . .. ---------~- -- ------·- - --·-·
I '
550
500 ................................. .
-~ 450 Q) (.) ... 0 -O'l ~ 400 "0
350
300
250
I . t ...... -.......... -~- ..
I t· ........... . ••••••••••-.'J•••e"'••••••••v••••'••••
t IJ I I '
I t I I . > ' j ... - .. .a•• ..... - .......... ,. .... ~ ....... <J .................. - ........ ~ ........... - .. - ....... : ... :a .......... - ..... ~ - •• i
: l . . ~----···-···········ll
1 I I I
1 t I I ~~ , • e • ' I I I I
., . . . . 1 • • ~ i
'·------------------' ------------- t._____ _________ __,
HH1 HH2 HH3
Hitch Height
Figure C23: M~x Drag Force as a function of Hitch Height for two angles of attack for bucket 11 in crusher run.
HH4 HHS
,--
t-AA8 i-AA12
Stellenbosch University http://scholar.sun.ac.za
n r'.) .;:,.,
5340
5140
4940
4740 5: >. Cl '-
~ 4540 Cl)
Oi
~ ;;
4340
4140
3940
• • ... • .. .. • .. "' • • • • .. . • "' • • • . • • .... • .. • • .. .. • .. • ... •· • .. • • .. .. . .. . • • • .. . .. .. .. ......... • • • .... • • • • • . • • • ., • • • • • • • • I • • .. • .... • .. •
I .•..•...• ·j ,.,.,..,,,..,.,.,.,.,.,..,,..,,.,J,.,.,.,.,..,..,.u•••••••lllo•'••••••••••••••••••\.aaa • ,. .......... .,. .... .~~.--
I j
l • - ............ ·! j
I r·······-······----:-··----···· ........... • .............. .. . ............ ;. ........... ~ ......... J
I
. . . . ., ... "" ... -.......... · ..... .. . . .......................................... "' •• <a ............ Q . ' . - .. " ... .-· . ..1
I ......... ~ ......... ·J I ' I ..... • .......... • .... • • '\ • ...... • • ........ • ..... • ,• ............... • • • • • • .. r • .. •
! . !
--~·-······-··-·····.! I ....... "" .................................... . ........... , ......... ., . ;
!
...... -........ -................ .. . l !
L . __.. . 3 7 40 ____________ ......L_ _________ ___._~·---
----· -.1 --L-___________________j
HH1 HH2 HH3
Hitch Height
Figure C24: Filling Energy as a function of Hitch Height for four angles of attack for bucket 10 in crushed rock.
HH4 HH5
--AA6
·-AA8
-AA10
-AA12
Stellenbosch University http://scholar.sun.ac.za

5400
5200
5000
4800
5: 4600 >. C'> '-
~ 440() IV
0> c
~ 4200
r: i'~ '.F 4000
3800
3601)
3400
. ······-··)I······-···· . •••••r••OIIo•••.,.,,..,..,..,. . I .. • .... . ..................... • ...... ..
" -l ... .............. ~
.................... 'Pf ................................................... 1 ........ . ... ................... .
( . .· i •••••~••••••w•••••~ .f .. 1
: I ·••••~•••••·•w••••••••·•i
. ...... ~ ............................... .. '
I
.......... • ............................ ,1 ..... . I o I
I j
l 'o 0 o • • • • • :• o • o • • o * • • • o 0 o o • • •j
. I ! . .................. :·-··················1
: . l ····-·--~----·············1 . '
'
I . .
••o••••••••••••••••••••••••••••••••""'*•*•"" . . . . ' .
~ . . . . ............................................................... , ..... I I
1- ................. : .
! .......... . ....,. I : I r • 1 I
HH1
................. "" ..................... ~ ............ - ....... , .......................... i I I f (
l
j t I )
.......................................... , ............. $1 ......... 1 • 1
. ' ' -----'------·-------·--....1- ___.______ ----- ____ ..___ _________ ___]
HH2 HH3
Hitch Height
HH4 HHS
Figure C25: Filling Energy as a function of Hitch Height for two angles of attack for bucket ·j 1 in crusher run.
,-AA8
:-AP.12
Stellenbosch University http://scholar.sun.ac.za
n i·) :::
2.7
26
2.5
I 2.4
Q) u c:: C'O Vi 2.3 :0 Ol c::
;;:: 2.2
2.1
2
1. 9
l I l ........ . i
..... . ......... - ..
.. ... . . . .. .. . .. .. .. . . . .. . - ............. .
. ........................
I
I
I
I
I !
............ , .................. .
. ;··- .....
•••••• ~ • • • • • • •••••• " ••• "!
I . . , .
I ········'i······-··"·· ... ····
•7J• .. ·--~ .
,; .. ., .....
•• a. - .............. ·'
' •. . . .. '" . .. .. .. .. . . . . . .. '"' -: . .. -... -. . .. .. . .. .. .. . . . .. ~ ....... ., -....... .. :- • • • • • • "" • • M ,. • • • .., • • •1
I t················· !
l -7 teeth ..... ; ............... ~·-·! -6teeth
j -5 teeth ' ...... -. . . . -. . . .. ,., .. . .. '· - ................... .,. ................. - ........ "' ••• .,t
\
r················-·1·· ......................... • • • • ., • • • A .. "' • • • • • .. • • • • • • • • • • ._ • • • .. • • • • • • • • • • • • • •i • • l
I I_------------.---~ __ __:__ ------------------~ ____ _..:. __________ _
HH1 HH2 HH3
Hitch Height
HH4
Figure C26: Filling Distance as a function of Hitch Height for bucket 10 in crushed roe!< with a 8 deg angle of attack and different numbers of teeth.
HHS
Stellenbosch University http://scholar.sun.ac.za

·" '' ')
'"
2.7
2.6 t • • • • • • • • • • • • • • • • • .,. • • • • • • •' • • • • • • • • •, • • • • • • • • • • • • • • • • • r • • • • • • • • • • • • • • • • • ••• • • • • • •
2.5
E' 2.4 -Q) (..) c: , V) 2.3 :a 0) c:
c 2.2
2.1
2
1.9
l ' ~,--·············· : ' . ·:· . -...... -........ ~ ..... -.. I \ : : ··········~············ ,
••••••••• \'\ •••• _: : : • .. ........... j ~ :-- ................ ~-- ... . . ..... .. . : : I . . ... ,........... :
.................. :...... : : ..... .. .......... i
I
' ............ ,. : ' ........ ~- : ................. t ............. /. ).......... :
t ~ ....... ·. . . . ....... J
• ...... • I : ......... ;............ : : I : - • - - - - • • •••••• - -~~- : j! ...... ""• ............. . • • •••• - ... - J
I l
........ ·. l ......... . . ........... .. i ....... • • ...... 1
..................... i .................. ; .................. ;.. .. . .. . i - .......... - • J
-------- ---------· __ __..!__~----·--·· ----- _ ____J.__
HH1 HH2 HH3
Hitch Height
HH4
Hgure C2i.: Filling Distance as a function of Hitch Height for bucket 10 in crushed rock with a 12 deg angle of attack and different numbers of teeth.
l l
-7teeih -6teeth -steet~
Stellenbosch University http://scholar.sun.ac.za

,...., 'J
f\J 'Xi
Oi ~ Q)
450
430
410
390
370
e 350 0 -Ol m ·--o 330
310
290
270
250
I I
I I .......................... .11 ...... - ... - .............. , ........... - •
.• .......... -...... .. . ........................... "' .................... . ··········7····--··~········~··················!
·-~~-----··· .. ················-- ........... .. • ..... - ........ ,. .. 0 ............... - ...... ,. - ....... - ....... ""u .... ~
I .................. - .. . ...•..••.•..••..... : ..•.•.....•....... I I
.. .. .. ........ - .. .. .. • .. ....... go .................. ·' - • • ........... - ...... •· ... .
I I
j l
I ~ .. - .......... -.~ .......................... 11:
. . .................. F ............................ , ........ ., •••••• -.. •••
I ' t I .. .. ... "" .. .. .. .. .. - .. .. • .. • • .. .. .. .. • .. .. .. .. .. • • .. .. • • ... • .. .. .. .. .. .. .. • .. .. .. to • • • • .. .. • • •• .. .. • • • .. • .. .. .. • .. .. .. .. ... - ...... - • "' .. - - ••
I J I l
_L__ ____ _ L ___j
HH1 HH2 HH3 HH4 HH5
Hitch Height
Figure C28: Max Drag Force as a function of Hitch Height for bucket 1G m crushed rock with a 8 deg angle of attack and different numbers of teeth.
-?teeth
-6teeth
-5teeth
Stellenbosch University http://scholar.sun.ac.za
() ['.)
\D
0) ~ Q)
450
430
410
390
370
e 35o 0 ._ Cl ~ ·o 330
310
290
270
250
---- ---------·- ··- ._, i '
. . . . . .. . . . . . . . . . .. .. .. .. -..... -................... .. . '--• 4 -~L·····-~---···········-···
........... I ...... - ....... ··- ....... - ........ ,. ......... tt ' .. . .. ......... ..
' • I ..... "' ........... - to ..... , ........... - .......... . ································-~··············-···1' . .
• l
. . I ....................................... i .•. ~.-- .......•.•. i ' ' I
f - - -- - - - - - - - - - . - . - .: ... - - . - . - - .
HH1
l f I t i
.......... - " ................................... - ................... j; ........ - ..... - ........ J.
l
' . . : : : .· ,.
....... - .......... - ' ................ - ..... - ........... , .. .,. ........... - ........ - - ...... 1 - ............... - ....... - •• ~ I l l . ~
. . . ................... • ....................... ! ...................... . . .
: : : . I.
I • t 8 I I I l f
1 : : : . t OS! .... ~ .............. ~ ............ - .. -=•· ..... - ................. - ................. - ......... • ...... f
' • I I . . . I . . . . . . a • a • .. • ...... J0 • <a • .. ,. a • oo i a • • "" 00 ...... • ....... • • -:- •• - & - a w .............. w • ~ ... • .. W - • •• D •• - •••• -~
I I t I t : : : : I t I 1 I J
HH2 HH3
Hitch Height
_J__
HH4
Figure C29: Max Drag i ·orce as a function of Hitch Height for bucket 10 in crushed rock with a 12 deg angle of attack and different numbers of teeth.
-7teeth -6teeth -5teeth
Stellenbosch University http://scholar.sun.ac.za

5100
4900
4700
4500 3 >-E> ~ 4300 Q)
Ol c
;;::
4100
3900
3700
3500
....... Ill ................ ..s• ......... - ............... - .. , .......... -.- .............. .,. ..... - ............... -.- •••• . .......... .
.............. :••••············ .. ···-·······················----················· ...
.. s. .................................... .
·······~·-·••!
I ! l
I I ";" IIIo ..... ,. .................. ,
! i
l • 1
.... & .... - ............ ·"· C> ..... -- ......... - •• '"- ..... J6 ... "' ..... -. ········:0.··········--··~·-1 I l
& l.
I -~·•.,•'••c.•••••••••••••••'"•••••••••••e•o•••J
: : I I I J
• • • • • • • • • • • • • .. .. • • .. • • • • • • • • • • • • • • • • • • "' L .. • • ., .. • .. • • • • • • • • • • •' • • • • .. • • • • .. • • • • • '"' • • \. .. "' • • • • • • • • • il' • • '* • • • • I
I. . ' : : J
I 0 0 I J . . ' ' .. _____________ : . . '
HH1 HH2 HH3
Hilch Height
HH4
Figure C3U: Filling Energy as a function of Hitch Height for bucket 1C in crushed rock with a 8 deg angle of attack and different numbers 0f teeth.
HH5
-7teeth -6taeth -5teeth
Stellenbosch University http://scholar.sun.ac.za

5100
4900
4700
4500 5: >. El ~ 4300 Cl c: ;;:
n 4100 w ~
3900
3700
3500
r
--~ . .., i i l f
.. - ........... - .................... a • - .......... r ........ - ........ - ...... , ................... - ., .... .. ............ !
. • • • • • • • • • • • • • • • • • ""'• • • '"' • • • • • oa • • • • • • • • (' • • • • • • ,. • • • • • • • • • • 1 • • • • • • • • • • •. • • • • • -:- •t• ·········~··:···j
l i
• . ! I I I •• : ..... -......... ·.-. ~-- ...... ,- .1 ................................. ,. .............. r····-··•••w•••• ... , ........ .
I I ' 1
' .......................... -~ 0 a o a ~ :· a o o o 0 0. a 0 0 M • W, ~ 0 0 00, •l t ........... ·:· ..... ' . ·/·. •·.·/' ·l
-l ~ : . 1-t · I · . ' · · ·-·· .. -;_. : ... -..... -................. -...... -..... -. -· . -... ··_ ....... ·_-.. J . I . ,· ., ··.·-
1 • ,., . ' ·.
1 e . . . .
: : .. · . . . i ' • . -,- " l
• • a .. • .. a • a • • • a a a • a a a • • J a "" a • • • a • a ., • .. a .. • • a .• .. a a a •• a a a a D • •• :· .• ~ •· a - 'l
I I ............................... to •••• ., •••••• .s ......... .
I I
' I I . I i ' l I t !_ _______ -- ___._ ___ _
HH1 HH2 HH3
Hitch Height
HH4
Figure C31: Filling Energy as a function of Hitch Height for bucket 10 in crushed rock with a 12 deg angle of attack and different numbers of teeth.
-7teeth '-6teeth -5teeth:
Stellenbosch University http://scholar.sun.ac.za
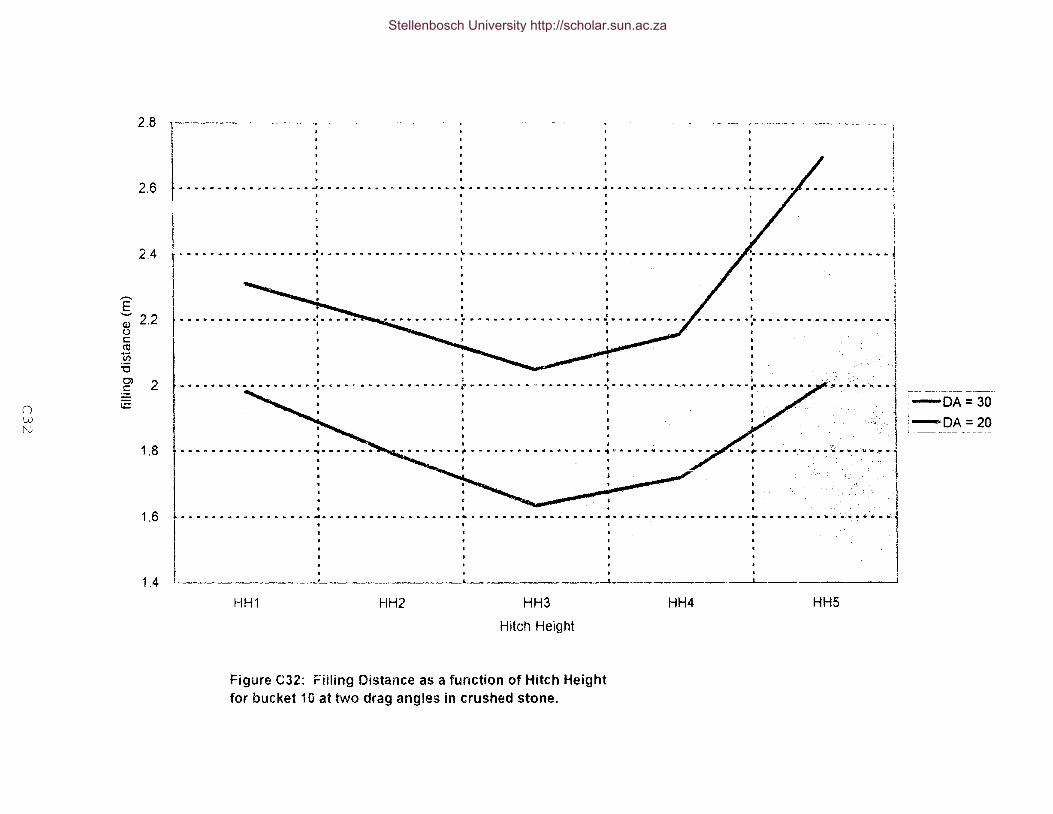
2.8
2.6
2.4
E' -; 2.2 u c::: ctl Vi :a Ol 2 c:::
() ;.=
w ['..)
1.8
1.6
1.4
r-------·---- ---
~ ................. ~ ..................•....... I . . . ......................... • ... ~---·············'-· .. ········ ... ·····-J .................... . l
' I I ., I • ................. - .... 1 • • I . • . ! . . . . . . • 1
~ .. . . I
I I i i '
....... ~ ................. J . . . ..................... ~---····································· I ---~ I l • 1 . . I ;t; t I
I l .......... • .... - ..... , ...... .,. ..................... r ............ ,.. '!> .......... '\ ........................ , ••••• • ... . ·., .. .; ... ,. ···1 j I
. . -1 ... -~ ...... _ .... ~ ;.,·; .. ·---~:~~:. -~. ·; . l
• t a , . . . ~ • ' • t • ' .
I I . f I ·
' . . . . . . . . : . .. "··.·.· .·J·
~ ..... -. -....... -. . .. .. .. . . . . . . . . . .. .. . . . . .. . . .. . ................................ -.. . . . .. . . . .. .. . .. .. . . .. . . .. " .• : •. ~ ..•••. 1 I . ' . .
• • I ' . I I : : : : l I
t I I I
I I f I
: I I I l
HH1 HH2 HH3
Hitch Height
Figure C32: Filling Distance as a function of Hitch Height for bucket 10 at two drag angles in crushed stone.
HH4 HHS
-DA=30
-DA=20
Stellenbosch University http://scholar.sun.ac.za
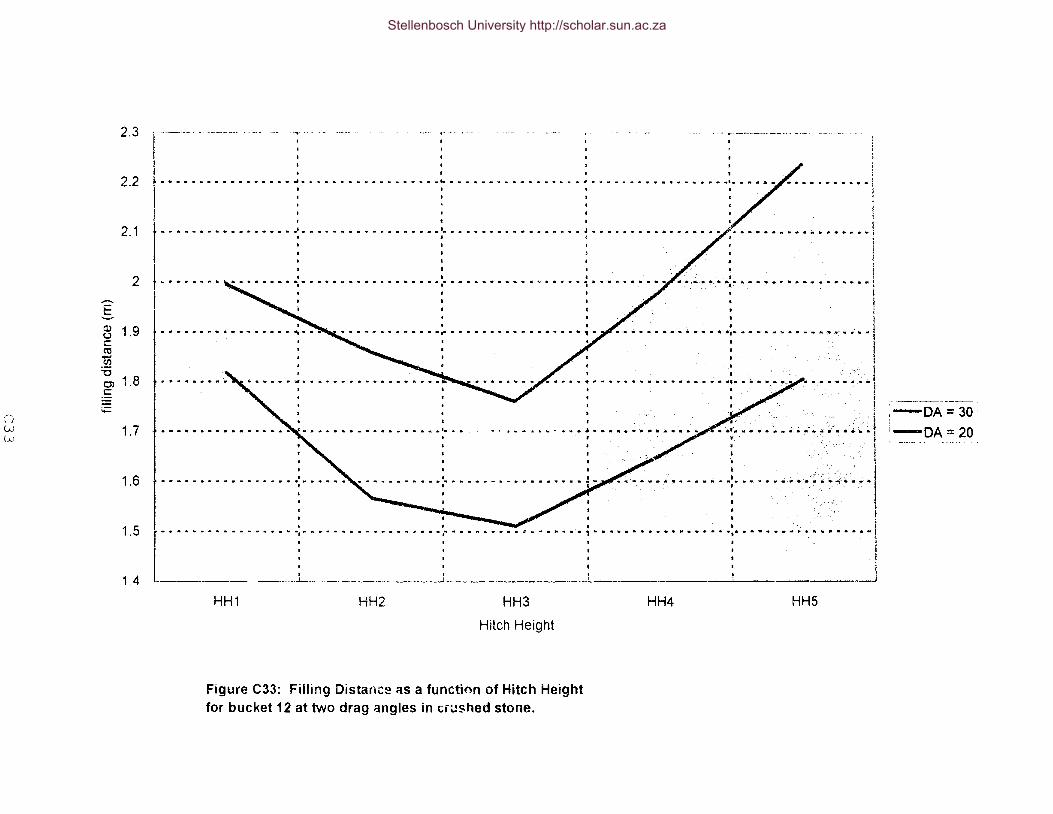
('} vJ (A)
I Cl> (.) c m --~ "0 0> c:
;;::
2.3 ~--··- . ------
2.2 ............... - ......... - ........ - - .... - ....... - ...................... ., ........... tl. ................................ - .. ,.,.. •
2.1
2
1.9
1.8
1.7
1.6
1.5
1.4
j. : : -......................... • ........................... ""''· .......................... ..
I I
t I
I I
t. : : . ' . t w•••••••'tllt.:..._••••••••,••••••••••••••••••,•••••••-••••.,.*••••i•.,._•._••••••
t ~ t t I
.......... ~--·-~.- ........... ~ .. -... -I
........................... _
I ........ "' ......................... . I
i I
........ ~ •• - - ;.. - - .... : ... - ..... - :., - ....... :"" 11<' .. ,; .... i I .•. I
I
...... :~-! !
.·· . '· >.. ~- ; i --:· '- -......... -... ~ .• -. "l
··············-~·-·····-~·'·'''~··! ' I
I l ~ t I ! t , ~ • • . l
r .............................. ~ .. , .......... ~ .. -............... •"" ................ ,;; '= ~ ......... , ...... Ill ..... - ................ - ...... ~ ........ ..
[ : : : : - I I t & • I ~ t t 11 I f
----------- ___ l__ - ' t • _j
HH1 HH2 HH3
Hitch Height
Figure C33: Filling Distar1c~ as a function of Hitch Height for bucket 12 at two drag angles in cn..:shed stone.
HH4 HHS
:-oA=3o i-oA=2o
Stellenbosch University http://scholar.sun.ac.za

430
410
390
370
0 ~ 350 Cll (.) .... 0 -g> 330 .... "0
(") w J:::, 310
290
270
250
l. ~- .: . -~~-~ ...... .: ..... . -.-.. _ ......... .. I I
.................... , ........... .
. ---·············-~---········ .
• j
I ' l
:, , .. :i .. ·, " .
i .. . . . • ... - •• - •• - ........ ,. .;. ..... ,. ...... : .... ~ .• -.~~ .•...•. it·-;. ••• ~. " ~- •: .·- ;,;·· .... ~ • - .4
' •. l :. i
. • I • ' . l
• •••••• - ••••••• -:- .......... · ....... ~. --~·.:."'.;:;-:~· .. :~''!·~~- ........ -:_·:.~~-~--.;_,.~.-·· .. ~--~ '!1.~~
. . .. .· . ' '1 •• ~ ••• - •.••. - .••.••• ~-- •••••••••• ~·.~ ••• -~ •• - ~ ;,;;;.~--~.>~.-•. : • .._..;_~~~
0 : • ••.. •.•. . : •• • • J ' •• ,j ,.. ........ " •••• - ........ "' .......... ···- ~. ;.;:·~ ..... .;. .. --~ ...... -· ... ~- ~ t.. ......... ~ ... --~ ••• :. ••.• ~~
I . • .. t. .• j . j
. l ~ . ' . ,·.··:. : T ....... --.. ------t -------.. -. --..... l ..... -. -.... -.. -.. r, ... 0 ..... , Oo .. - • ·i I • • . • ' I
................... : .................... : ................. ~- ........... ·····. ·--~ ......... .; ... ~-~· .. . . . . . I
HH1 HH2 HH3
Hitch Height
Figure C34: Max Drag Force as a function of Hitch Height for bucket 10 ;-.~ !'.vo drag angles in crushed stone.
I I i
HH4 HHS
-DA=30
-DA=20
Stellenbosch University http://scholar.sun.ac.za

450
430
410
390
-370 C)
c. Q.)
e 3so 0 .... cr ro 1-
"0 330
' ' .J J1 310
290
270
250
r- -- ·-·--. . . . .. . .. -..... ~ ............... . ' ....... · ............................... • .. .
' '
............................................................
• '. --, - . . ·t:: .. . -·' '• · .. :·. :;' :. · .. ,. .
• ...... • • • • • r ... .c .. • " • • .. "':· • • ~ --~- ._• ~~---· ~:~ "! ~ •· ~ .. •_ ~-- • .• • ·"'~<·. • , • f
.• l , • .- -=: . I
... - ............................ \. ....................... -. "" """-- ".• --~ " -"'!" -· ....... -~~ .... •··· .... ~ ' ; ' . • ' . ' j
' e a • a e • e •• a ... • ,. • e • '\ "" a • 11' • • • A • oo • a • • • •• ·~· • • a
................... .J .......... . . i
I . ).1· --......... -~- ................. [ . . .. .. . . . . . . . . -. ~ -....... ' . -"' .•.. ·i
. . . . - . .. . . .· . '
.,. • • • .-._ • a • 4. • • • • • • • • • e • • • • ar • • • llo • • • • • • • • • • • • • • • •· • ~ •.,. • • • • • • • • • • a. • • • 1111 • • • • • • • c • • ... • • • • • • • •-•··• •·• • J . /: : : : .. · .· ' .. !
····c:·····--.·-·-- .. --.
. . '
j . ,. -. ----,. . . . .. -. ~ ~ -. -... --........ -~- .......... -..... -~ .............. -.. ~ .. -.... -.. -·-. _. .... Jl . . . . t 1 t I . . J
I t I t ,. ·
.......... ~ ....... - ................... : ... - &. ....................... ""'~ .................. - ...... - ... ~ .... - ..... ~ .... ~-·,;;. ~ ;..- .. - .... J I t t I .
' 1 t I .
I t I I
. . . . I • • • • • • • • • • • • • • " • • .I • • • • • • • • • • • • • • • • • • '• • • • • • • • • • • • • • • • • • I. • • • • • • • • • • • • • • • • • A • • • • • • • • • • • • ~ • • • • .,
1 1 I l 1
~1H1 HH2 HH3
Hitch Height
Figure C35: Max Drag Force as a function of Hitch Height for bucket 12 at tw<, drag angles in crushed stone.
l
___:_ l HH4 HHS
-DA=30
-DA=20
Stellenbosch University http://scholar.sun.ac.za

n w 0\
5000
4500
5: 4000 >. e> (I) c:: (I)
0)
:§ ~ 3500
3000
2500
.... - - ......... - •• - .! ..... - ......... , ......... -· - "' .... "' .................... • ................... .. . . • ............. l
' ! i i ............................... ~ ............................. . 'ii ., ...... - - ~ '- ...... - ...... - ...... ~ •• "' ... -~ ... - ....... !
•••••..,.•••••• .. •.,•• f .. ., .. w••••••••..,••••J•.,••-..·• ....
I ! I
• ! .. -... : ... -.- ;_ .......... -I .. ,·
. i 1 !
l ...................... , .............................. . ••.••••••.•••••••••••••••••.•••..•••••••••••••••• !
l !
----------'--- __ _j__ ____ -------
HH1 HH2 HH3
Hitch Height
Figure C36; Filling Energy as a function of Hitch Height for bucket 10 at two drag angles in crushed stone.
HH4
-L ________________ _j
HH5
-·DA=30
~cA=20
Stellenbosch University http://scholar.sun.ac.za
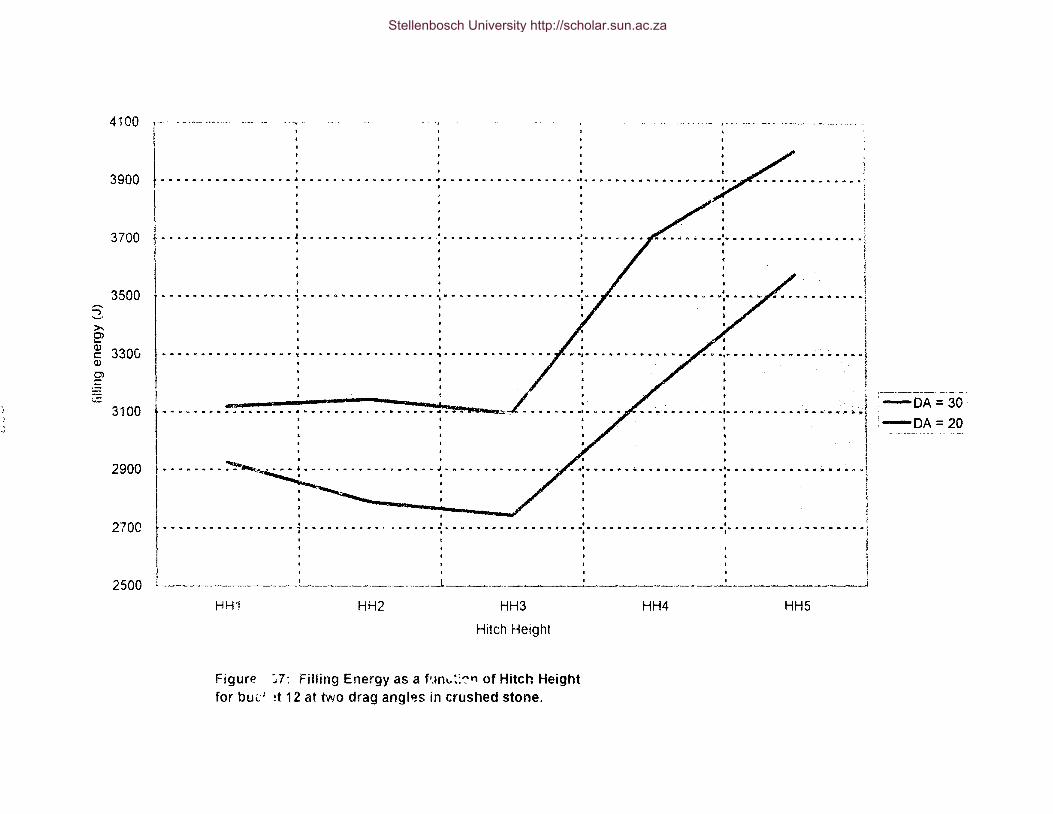
4100 ! ....
3900 ••••••••••••••••••••••a ... oo••••••••••""••••••••••••Q•••.,.
: vi I I
I I ·"·.......................... .... . .. .... -- ........ . I I
I
' ~.
3700 - .. - ....... - ....... - - J ....... - •• - ........ - • - ·". " ....................... - ... •- .......... . I I I
3500 c ..... - ........... - ....... ~ ........ A. .................. -: "' ............................ -: .. ..
s ....... >. e> ~ 330G ···-~---·········'t·····-····"'······'"'······· .. ··· <ll
:[ ;,:;::
3100 I I
t - • .............. , ... -4 ..... - ...... '* ........ - •• ., ••• - ....... ~ • • .. .._._~---
• I
I I
"• .................... ,., .................... . I
2900 ........ ~""""''~· .... ' .. ......... -. .................................. , ..
270C I ....................................... I
~----·.! ...................... · ....................... ' •. 1;11 •••• .,. I I I
I
2500 L _____________ , ----------"
H!-fl HH2 HH3
Hitch Height
Figure ":;7: Filling Energy as a f•Jn~..:::-n of Hitch Height for bul. 1 !t 12 at two drag angl~s in crushed stone.
HH4 HHS
-DA=30,
'-DA=20
Stellenbosch University http://scholar.sun.ac.za
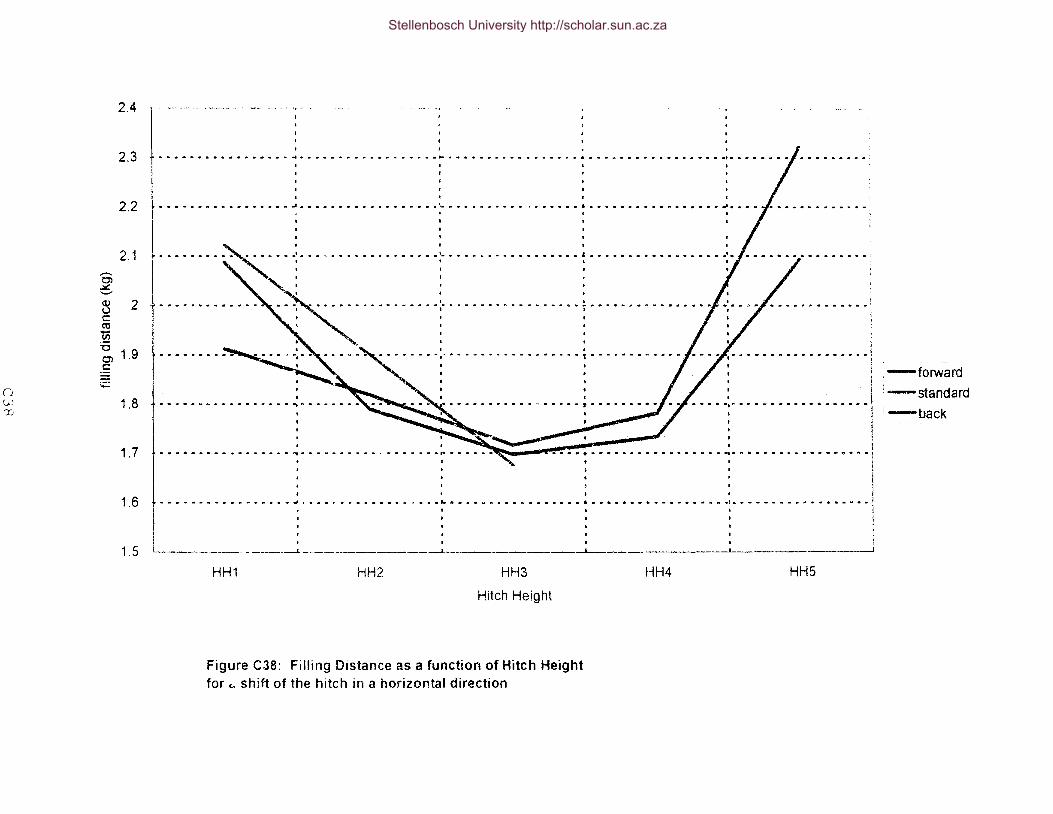
n f,J.]
CD
'Cl 6 <ll \.) c:: ro ii)
2.4
2.3
2.2
2.1
2
:0 OJ 1.9 c::
;.;::,:
1.8
1.7
1.6
1.5
······~- .......... J .......................... • ...... . . ......... , ........................... .. I
I t •
. , ......................... . ...................... -. . .
......... r. .............. qo •••••
................................................ • D <lt .... 00"". a. 00 00 ...... '"' ill .. • .... 10 ....... 00 00 '"' '"' '"'00 .. - .. ~ ... 00
.......... "' ............. -- ••• 11 ... - .... "" .. - ..................... - .................. ..
i : : -------·----- ____ ---1.. -----------------1 --'---------------L
HH1 HH2 HH3
Hitch Height
Figure C38: Filling Distance as a function of Hitch Height for .. shift of the hitch in a horizontal direction
HH4
__ ......__.~ HHS
-forward
-standard ~-back
Stellenbosch University http://scholar.sun.ac.za
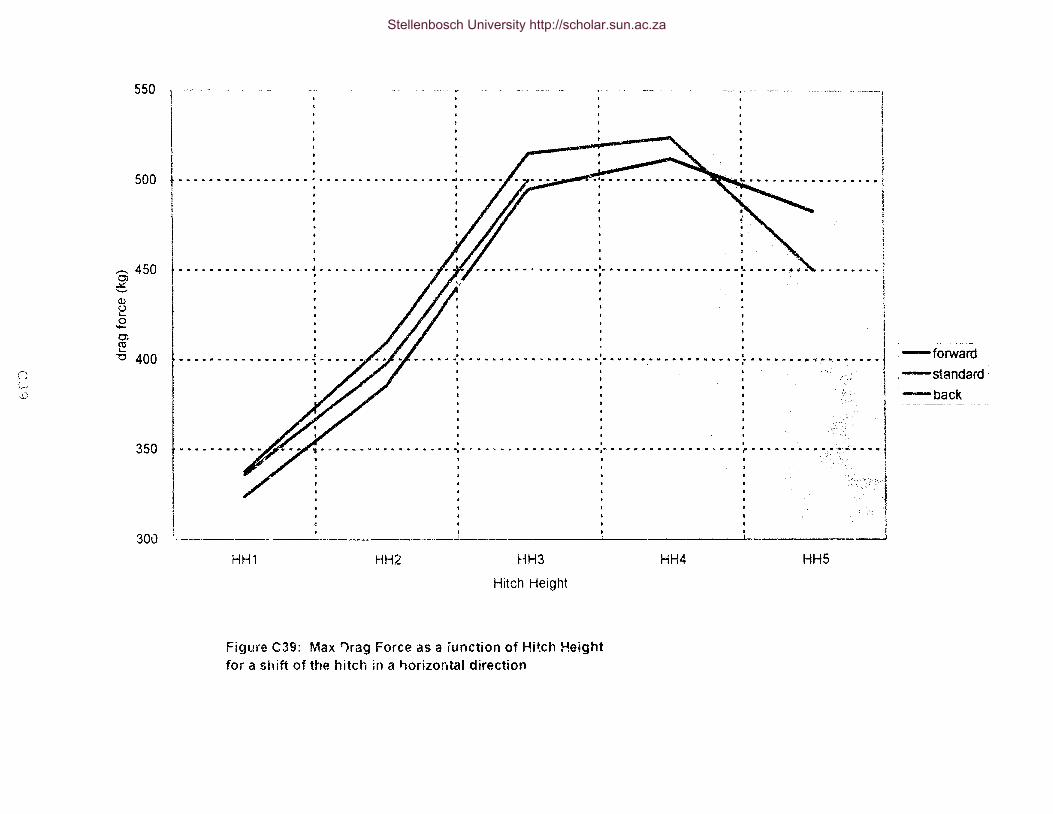
Cl w ~
o; ~ Q)
2 0 -0)
~
550
500
450
"'0 400
350
300
i t········---------1
I t-----·-----·- - - J •••
-------1 I I
! i
I ·- .......................... ~
..... ·- ......... lo •• - - ........ • ......... . ' .. .......... #
I 0 '
!
t···········------~---··· i I
•. - ............. • ...................... • ...................... J • • · .. · l
l i
- .
I· ......... . •f • • I .•• I r • • • . 1 , ...... - - ........ - ....... , .. .. . .. ~ .. . . . . . . .. .. .. . .. ......... "' - ........ - ... '- - . - ,. . - ....... - . -·~-- ~ ·-~· ... , .. "' . i I I I I l
I I I
HH1 HH2 HH3
Hitch Height
Figure C39: Max 'lrag Force as a function of Hit.ch Height for a shift of the hitch in a h.orizontal direction
., I I
·---l--___ _j
HH4 HH5
-forward
-standard -back
Stellenbosch University http://scholar.sun.ac.za
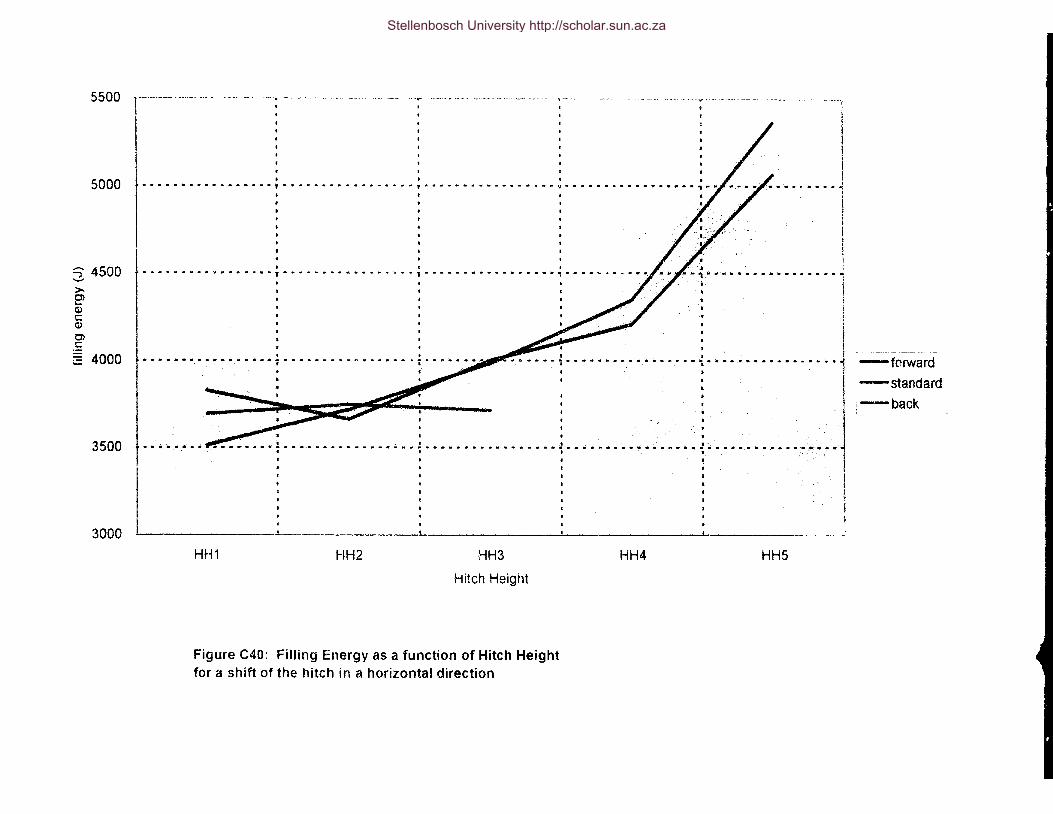
5500
5000
3 4500 >. e> Q.l c: Q)
Ol .S: § 4000
3500
3000
r--------- ----------- --------- -----. ------ ----- ------ ----·~!
I ......................................... , ........... ,. ........ "{ .................... , .. .•- -..... "1
I I I
l I l i I ......... ,. ....... , ................. , ................. , ........... _ .......... l
·················~---··· ........... .
·; . .. ' I i l
i l . ' I J ' --····;··· ... ······-·--··-~····--······ .. ·····1
l I
'J: I I I -... -- ..... :,.... --- : : : j' I I t I
Lf ········:················-~-----···········-~·-···············:········,.········1
r I 1 I l : : : : l • e a t t t • e .1 1 I I I
I I I . _)
HH1 HH2 HH3
Hitch Height
Figure C40: Filling Energy as a function of Hitch Height for a shift of the hitch in a horizontal direction
HH4 HHS
:-forward -standard
:-back
Stellenbosch University http://scholar.sun.ac.za

n .c. f-
-' ~ Q) ......
'E -:E
4.5
4
3.5
3
2.5
2
1.5
···<y-·-···- ---· ---· ---···----------~- ---
0 ............... ,. ............................. ,. ............ ~.t
0 •
filling energy y == -4 .253x + 8.2469
R2 = 0.9821
••• - ....... - - ...... r ........ a ..................... - •••• - .... ;. •.•• - •. • .. - - • -· ....... 0 • 111··_ • .;;. ... - .;.. • ~- ~--. -~:;~ .•
... - • .-: .- ~ -._. _._ ...... • • ... • • - - • - - -- • - - • .. p - ~ .. - • .. - - -- - - .... • • - .. - .. - - - • - lli! - • • • • -.. - f~ r---~-: -~- · ;.- -~ .;.· --- · - ·-- - ... - · ... · -.. r.... ; r filling distance
• y = -2.143x + 4.3254 ..
420
400
380
360
340
-- ........ -..... -... -- ...... -. --+- ... -... . R2 = 0.898~ r .,. ... · .... · .. · · · · .. · ....... ., .... [ 32o . . ' ~- .. ·. ' ·. . . . .· ... ·. . . . ·.. . ' : ... ,..:.~·:: .. ')~--~.{:.:)~;:·\!
L·-------------------------------~------------------------------J 300
0.9 1.1 1.2
Bucket Width
Figure C41: Relationships for performance parameters as function of bucket width on hitch height 3 in crushed rock.
-~ -Q) () ,_ .E 01 ~
"0 X CO ~
Stellenbosch University http://scholar.sun.ac.za

5.5
5
4.5
4 -'"") .¥ -Cl)
: 3.5 E -~
3 n ~
f'J
2.5
2
1.5
··----1
filling energy - • "' - ..... - - ........... "' ••• - .. - •••• .,. •• - .......... Ill .... - ................ ,. •• - ....... .
y = -4.872x + 9.6126
I l R2 = 0. 9048 l t .. • •.... a
I . ..... - ~ • • .................... ft .......... ·r ••••• • • ........... • ... • ..... • • •.•
• I .. ~ .... • .... - •• - "' • • • .. • ... • ............ - t' ••••••
drag force y = 505x- 43 R2 = 0.9402 . - ··-·.·: . --......... -............ -. " .. · .. • ... ~- ... ~ ~--)~· --~ .
. f . ' ~--····---~···-······-················~~·-~·-··········-,~~~
I I ......... "' 10 ••••••••• - •• - ......... - •• - • • .. • • - .. - ... "" • • ............... - .... - ••• • • • • •• ,. • • • ... & lit ... '!I'.·· .• - ~-- ~ ... -·! - - ·•·. ~:~~ ~ .,. •
filling distance
............... ~~-......... ; .... Jy = -2.318x + 4.3339 • L R2 = 0.9182
'--------- ···-----L' -------
0.9
Bucket Width
Figure C42: Relationships for perforrnance parameters as function of bucket width on hitch height 3 in crusher run
. • • • • .. • • &.1 ..................................... .... .
1.1 1.2
600
550
500 ~ -
450
400
350
Cl)
~ .E Cl ~ "0 X ea ~
Stellenbosch University http://scholar.sun.ac.za

0 .!:;,
t...._.1
5
4.5
. '+
~ 3.5 Qj --s :E 3
2.5
2
370
•••• - ;11 •••••••••••••• - ...... - .... - ........ - .......... -- ..................... ,. •• - ••• "" ................. _ ..... ~ ~ 360
filling energy I y = -4.56x + 8.5245
t _ . _ .. _ .... _ R2 = o. 9691 ;. • ~ • _ •••••••• _ ••••••••••••••••• ~ t-~ .. :-;~·~ :": .~ .. ~ ., .. ~ ~ .. .,; .,. ~ ,. 350
340 ~ -Q)
~ .E 0)
~
[ ........ -- .............. 7 ·. L ................. ,. -./·.· -....... L ....... ~~- ................ , .... 4- 330 1:1
~ ~
. . . I J
.............. - ...... ~ •••• - ..... {;I ........ - ..... ·-· .... ,·.• .... ~ :-·· • .. ~ -:~ •.·'!l_. • ......... ·• ~ •• ,; ~-.,.·:,~- •• ., .... ···,o~:.;;,.,···;. ·•·;;:·;{.;4._ 320
- I l • • I • I J . . . ·• ..... '.·,
'-~ • • • • • •••·••• • •• ••'·••-·a .... ,,.._. •A·
I filling distance
y = -2.158x + 4.4299~1~;'ii;f'~''4- 310 R2 = 0.955
1. 5 - -----------------------'- .I 3oo 1.2 1.1 1
0.9 Bucket Width
Figure C43: Relationships for performance parameters as function of bucket width on hitch height 2 in crushed rock
Stellenbosch University http://scholar.sun.ac.za

(') J:o,
.t:>
6
5.5
5
4.5
-......, ~ 4 tD -g 3.5 :E
3
2.5
2
1.5
500
................. -. . . . . .. -. . . . . . .. .. . . . .. . . . .. .. .. . . .. .. -...... -.. .. . "' ........... -..... -.... -......... ., -. ·-.... -..... · ... .. 480
filling energy .
Y = -6 416x + 11 .139 ••• ~ .•••• _ •• " ••••• - ••• - • • • - - • • • • • • • • • ·_ • • • • • • • • • max drag force .. • • "l . . . . . . . . . . .. .
R2 = 0.8544 : y = 501x- 120.~ ·.' :
R2 = 0.9552 ... •••••••••••••••••••••••••••••••*••••,.,•••• ••••••••••• .. •ot••••• ••'•·•- ..u._.;.,
460
440 ,-... 0> .::.:. -
420 Q)
e
' .................. ~ ..... ~ ... ~ .... ~ ..... ~·: ~·":~"·~'~.~:+ .E Ol al
400 .t; X al ~
..................................... .. ' . ....................................................... - ......... ~ • . -··lP ..... '"!~" 380
·,, -·,·<·: ·':;;,
r-~---~;;.~==~-~-:· ~-~--~-~-~-~-~-~~ ~--~-~-~-~-~-J" y = ~~~i ~~:~m.a~c:404 ..... ~ ...... ' .... ' .. ' . . . . . . . - R2 0 9277 I ... · ' -_ .• • • • ~ •••••••••••••••• - •• •"'f • • • • • • • • = . l:. .... :- .... -........................ ~ -~ ]"·.. ' 340 . -.
f - b •,l' . 320
-.~~·:·
360
' . ._..
0.9 1 1.1 1.2
Bucket Width
figure C44: Relationships for performance parameters as function of bucket width on hitch height 2 in crusher run
Stellenbosch University http://scholar.sun.ac.za

n .!::> (Jl
3.1
2.9 Bucket 09
y = -0.3215x + 3.2853 R2 = 0.9985
""" . ·--- ·---··-------------~
---~-·- ------···--- --------------
2.7 I
~- 2.5 s ~ c: ctl ? 3 (i5 ..... :0 Ol
:§ u:: 2.1
1.9
1.7
1.5
I t------------------------- --------- ---------------- --- -------- ------------------------- ~
I '
1------ Bucket10 F ' y = ~21~~9~;-26~ ------------~: --- • I
I l I
•
Bucket 11 i
1--- -----+ y = -0.098x + 2.0127 "-. l R2 = 0.9991
_,
1 Bucket 12 ____________ ':" y = -0.0755x + 1.826
R2 0.7301 • I i
2
Hitch Height
Figure C45: Relationship between Hitch Height and Filling distance for the> different buckets in crusher run.
!
l :
3
Stellenbosch University http://scholar.sun.ac.za

() ,t;.
0~
600
1 ----
550 "- ------------------------- --------
500 +- ------- ··--·-- ------ -·- --------
• -~ 450 -Q,)
~ .E Ol ~ 400 '0 ,
350
i
'
-·--- - - --·- -----· --·····-- -----··-···---------------, Bucket 12j J
y = 97.5x + 273.33 ----t R2 = 0.9577
Bucket 11 y = 88.5x + 2441 ~
R2 = 0.9885
Bucket 10 y = 85.5x + 223.33
R2 = 0.9929
Bucket 09 / = 56.5x + 224.33
R2 = 0.9956
300 =----""":c _______________________ ----------------r-------------------
250
2
Hitch Height
Figure C46: Relationships for the Max drag force as a function of Hitch Height for the different buckets in crusher run.
3
Stellenbosch University http://scholar.sun.ac.za

APPENDIX U
TEST DATA
Stellenbosch University http://scholar.sun.ac.za
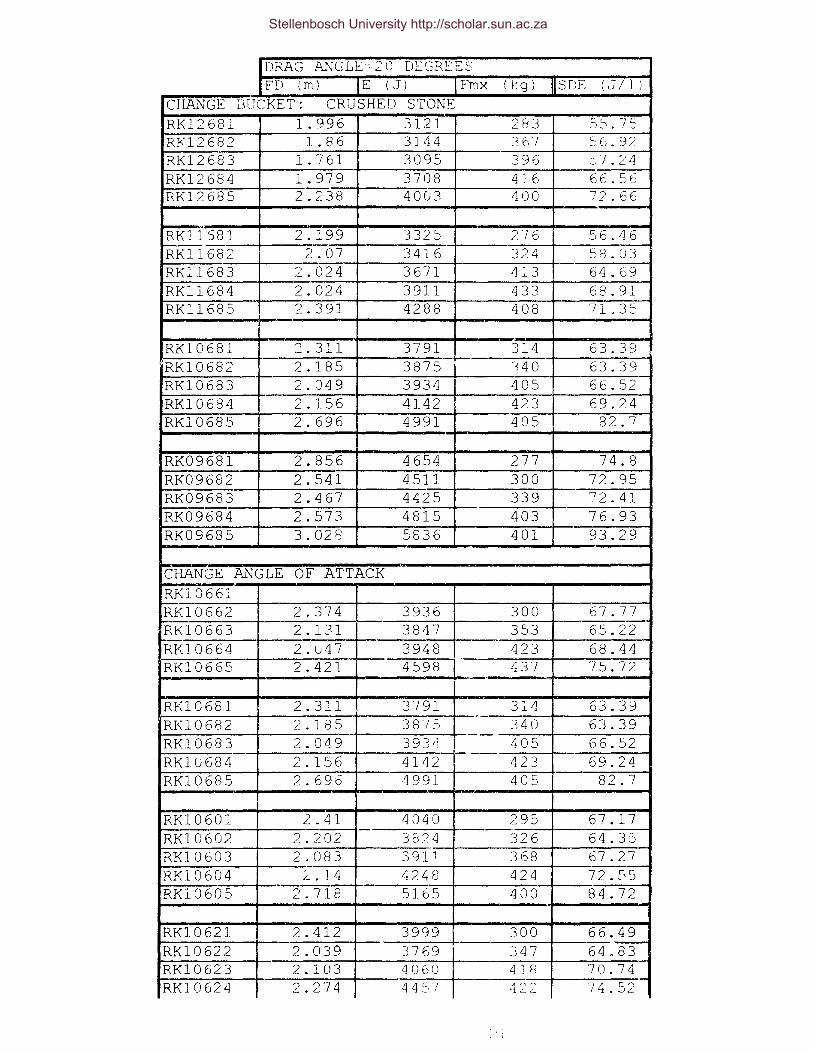
DRAG .Z\NGLE=? 0 DEGREES FD (m) E (J) Fmx (kg) liS DE ( ,J I 1J
CHA.T\JGE i.lUCKET: CRUSHED STONE RK12681 1.996 3121 283 5~·. 7 s RK12682 1.86 3144 36"/ ~~G.92
RK12683 1.761 3095 396 :.;7. :;:4
RK12684 1.979 3708 416 66.56 RK12685 2.238 4003 400 72.66
-RKl1S81 2.199 3325 276 56.4 6 RK11682 2.07 3416 324 58.03 RK11683 2.024 3671 413 64.69 RK11684 2.024 3911 433 68.91 RK11685 ?.391 4288 408 71.35 -
- --RK10681 :2.311 3791 314 63.39 RK10682 2.185 3875
1--i 4 0 63.39 ± RK10683 2.049 3934 405 66.52
RK10684 2.156 4142 423 69.24 RK10685 2.696 4991 405 :32.7 -RK09681 2.856 4654 277 74.8 RK09682 2.541 4511 300 72.95 RK09683 2.467 4425 339 ?2.41 RK09684 2.573 4815 403 76.93 RK09685 3.028 5636 401 93.29 --~\NGE ANGLE OF ATTACK ~16661
I ~-
2.374 RK10662 3936 300 67.77 1-· RK10663 2.131 3847 353 65.22 RK10664 2.u47 3948 423 68.14
~10665 2.421 4598 'l 37 75.72
!00681 2.311 3791 314 63.39 RK10682 2.185 3875 340 63.39 RK10683 2.049 3 93r! 405 66.52 RKJ.U684 2. 156 4142 423 69.24
- -RK10685 2.696 4991 405 82.7
RK10601 2.41 4040 295 67.17 --RK10602 2.202 .3tJ24 326 64.35 RK10603 2.083 39U 368 67.27 RK10604 L..14 4241:3 424 72.~5
RKl0605 2.718 5165 400 84.72
RK10621 2.412 3999 300 66.49 RK10622 2.039 3769 347 64 .8'"3' RK10623 2.103 4060 418 70.74 RK10624 2.274 .'~4r:,7 422 74.52
Stellenbosch University http://scholar.sun.ac.za

RKl 0 6.2 ~·
CHANGE NUMBER OF TEETH RK10781 2.385 3996 297 66.34 RK10782 2.099 3863 341 65.48 RK10783 2.008 3978 412 67.92 RK10784 2.194 432d 434 75.4 RK10785 2.517 5015 423 87.05
RK10721 2.203 3824 321 r") -;.r:-O.J • .c_ __ ,
RK10722 2.057 3805 360 63.59 RK10723 2.063 3805 434 ::.5.3t:: RK10724 2.285 4505 432 78.73 Ri:-(10725
RK10681 2.311 3791. 314 63.39 RK10682 2.185 3875 340 63.39
-RK10683 2.049 3934 405 66.52 RK10684 2.156 4142 423 69.24 -RK10685 2.696 4991 405 82.7
RK10621 2.412 3999 300 66.49 RK10622 2.039 3769 347 64.83 RK10623 2.103 4060 418 70.74 RK10624 2.274 4457 422 74.52 -RK10625
RK10581 2.448 3940 275 65.15 RK10582 2.144 3749 319 63.56 RK10583 2.057 3877 396 66.74 PK10584 2.139 4060 438 70.76 RK10585 2.505 4665 420 80.97
RK10521 2.434 3869 293 65.62 RK10522 2.051 3663 340 62.55 RK10523 2.041 3830 410 66.85 RK10524 2.082 4166 430 71.83 RK10525 2.648 _S091 410 85.12
DRAG J\NGLE=2 0 DEGREES FD (m) E (J) Fmx (kg) SDE (J/1)
CHANGE BUCKET: CRUSHER RUN (FINES) CR12681 1.777 3568 359 CR12682 1. 622 3755 492 CR12683 1. 62 6 3959 554 --CR12684 1.733 4442 !::)51 ---CR12685 2 . .-,95 5212 447
I 1
Stellenbosch University http://scholar.sun.ac.za

IC?11b81 1. g 13 y:, 14 338 CRllo87 l. 82 3720 4_;_0 I
-CRllG83 1. 717 3984 51~)
CR11684 L. I 82 4:?47 524 CR11685 2.323 5366 450
CR10681 2.147 4177 313 CR10682 2.05 4502 386 CR10683 1.929 4701 434 CR10684 2.038 4907 =~ (J 5 CR10685 2.439 5223 467
CR09681 2.971 5796 283
=1 (R09682 2.628 5633 333 CR09683 2.328 5344 396 CR0968J 2.315 5579 463 CR09C· 5 2.991 6848 435
CHANGE ANGLE OF ATTACK CR11621 1.856 3617 374 CR..~.J..622 1.74 3804 484 CR11623 1.77 4113 558 CR11624 2.107 5018 519
,CR11625
DRAG ANGLE = 30 DEGREES FD(m) E (J) Fmx (kg) SDE
l:ZK12681 1.819 2926 310 45.73 RK12682 1.567 2790 364 43.43 RK12683 1.512 2745 393 46.43 RK12684 1.652 3178 45U 51.21 RK12685 1.80E 3577 427 58.59
--
RK11681 RK11682 RK11683 RK11684 --RK11685
!<.:f\10681 1.982 3257 279 51.14 RK10682 1.795 31511 307 49.41 RK10683 1.635 3205 380 49:~ RK106o~ 1.72 3404 40~ 52. 64 RK1068~; 2.006 3978 393 62.14
RK09681 RK096R2 RK096f.:<3
Stellenbosch University http://scholar.sun.ac.za

~~~K~··o~9~b~·s~4~1r------~---------+---------~~~ ... LRK09685 . _ ... ..J
:cHANGE HITCH HORISONTALLY FD(m) E (J)
HOVE HITCH 30 MM FOR. WARD CR11681 2.089 3829 CR11682 1.791 3665 CR11683 1.698 4001 CR11684 1.734 4209 CR11685 2.094 5067
HITCH IN NORHAL X-POSITION CR11681 1.913 3514 CR11682 182 3720 CR11683 1.717 3984 CR11684 1.782 4347 CR11685 2.323 5366
MOVE HITCH 30 MM BACK CR11681 2.123 3695 CR11682 1.902
' 3749
CR11683 1.676 3714 Ck11684 CB-11685
Fmx (kg)
..
324 386 4 g:;, r: 1 ') ;) J. L
4F:;J -
'.' . "l
338 410 515 524 450
336 398 500
SDE
-
Stellenbosch University http://scholar.sun.ac.za

GLOSSARY
Term
angle of attack
angle of repose
bench height
blasting ratio
block length
block width
carry angle
COG
cut length
cut width
chopp;ng
drag angle
Definition
The acute angle between the forward face of the teeth and the horizontal.
It can also be defined for the lip instead of the teeth.
The acute angle between the side of a free poured pile of overburden and
the horizontal.
Heigth above coal at which dragline is positioned.
The volume (cum) of rock broken per unit weight (kg) of explosive.
Length between major digout cycles.
Width of each consecutive strip that is mined.
The acute angle between the bucket floor and honzontal.
The centre of gravity of the bucket
See block length.
See block width.
A digging method in which the bucket is dropped teeth first into the
overburden. This is an unproductive and wear intensive digging m·--thod.
The acute angle between the drag ropes and the horizontal.
Stellenbosch University http://scholar.sun.ac.za

drag force
dr·agline reach
dugout length
dumping rad;us
effective rrach
filling distance
filling energy
hitch height
key cut
panel width
payload
pit width
rehandle
The total force applied to the drag ropes to overcome the resistive forces
during digging. The drag stall force is the maximum that can be applied
by the dngline.
See dumping radius.
See block length.
The horizontal distance from the cent er of the tub to boom point.
Horizontal distance from the edge to boom point of dragline.
Distance that the bucket takes to fill measured along the drag rope.
Integral of the force @ distance graph over the filling length.
Vertical distance from bucket floor to drag hitch.
The cut that is made first in every block It is the cut furthest from the
spoil pile and is made to determine the slope and orientation of the new
high wall.
"'ee block width
The volume (or rnass) of m·erburden in the bucket after disengagement.
See block width
Overburden that has been excavated and must be moved again.
Stellenbosch University http://scholar.sun.ac.za

rigging
RSL
set length
SDE
stand-off
strip width
struck volume
swell
tilt angle
overburden
The rope and chain system that determines the orie1.cation ofthe bucket
when not engaged and that allows the bucket to be manipulated.
Rated suspended load, the maximum weight that the dragline boom are
designed to support when hanging from the boom point.
See block length.
Specific digging energy, the energy required to excavate a unit voh"ne of
overburden.
Distance from the cent er of the dragline tub to the edge.
See block width
The volume that the bucket would contain if filled completely from the
front of the lip backw::trds, without any material
Ratio ofthe densities of the prime and blasted overburden.
The acute angle between (he bucket tloor and the slope on which the
bucket is dragged.
The soil and rock that covers the coal seams.
Stellenbosch University http://scholar.sun.ac.za