the impact of privatization on economic growth and income
TRANSCRIPT
Old Dominion UniversityODU Digital Commons
School of Public Service Theses & Dissertations School of Public Service
Spring 2007
The Impact of Privatization on Economic Growthand Income Inequality in Developing CountriesSamuel AdamsOld Dominion University
Follow this and additional works at: https://digitalcommons.odu.edu/publicservice_etds
Part of the Growth and Development Commons, Inequality and Stratification Commons,International Economics Commons, International Law Commons, and the International RelationsCommons
This Dissertation is brought to you for free and open access by the School of Public Service at ODU Digital Commons. It has been accepted forinclusion in School of Public Service Theses & Dissertations by an authorized administrator of ODU Digital Commons. For more information, pleasecontact [email protected].
Recommended CitationAdams, Samuel. "The Impact of Privatization on Economic Growth and Income Inequality in Developing Countries" (2007). Doctorof Philosophy (PhD), dissertation, , Old Dominion University, DOI: 10.25777/af59-8745https://digitalcommons.odu.edu/publicservice_etds/17

THE IMPACT OF PRIVATIZATION ON ECONOMIC GROWTH AND INCOME INEQUALITY IN DEVELOPING COUNTRIES
A Dissertation Submitted to the faculty of Old Dominion University in Partial Fulfillment of the Requirement for the Degree of
DOCTOR OF PHILOSOPHY
PUBLIC ADMINISTRATION AND URBAN POLICY
OLD DOMINION UNIVERSITY May 2007
b y
SAMUEL ADAMS
Reviewed Approved by:
Berhanu Mengistu, Ph.D., (Chair)Nancy A. Bagranoff, Ph.D., Dean College of Business and Public Administration
John/Morris, Ph.DDoctoral Program Director
LL U Isa Qform Ford, Ph.D., (Member)
Reproduced with permission of the copyright owner. Further reproduction prohibited without permission.

DISSERTATION:THE IMPACT OF PRIVATIZATION ON ECONOMIC GROWTH AND INCOME INEQUALITY IN DEVELOPING COUNTRIES
by
Samuel Adams
B.Sc. September 1990, University of Science and Technology, Kumasi MBA. May 2003. Lincoln University, Missouri.
A Dissertation Submitted to the faculty of Old Dominion University In Partial Fulfillment of the Requirement for the Degree of
DOCTOR OF PHILOSOPHY
PUBLIC ADMINISTRATION AND URBAN POLICY
OLD DOMINION UNIVERSITY
Reproduced with permission of the copyright owner. Further reproduction prohibited without permission.

ACKNOWLEDGEMENTS
A dissertation is a difficult task to accomplish alone. I am grateful to have had the
support and guidance of professors, family, and friends. I am indeed grateful to
Dr. Berhanu Mengistu, the chair of my dissertation committee who provided me with
valuable insights. I could not have completed the dissertation without his counsel. I am
extremely thankful to Dr. John Lombard and Dr. John Ford who served as committee
members and continually inspired and offered valuable suggestions that helped me
throughout the period. I will always remember your support.
In addition, I am grateful to all the faculty members who in diverse ways helped
me through my journey. I also thank Dr. Ail Ardalan for his support. I appreciate the
friendship of all my colleagues, especially Tarzaw and Ralph with whom I toiled day and
night. To Eva, Kwatei, and Professor Kojo Anim, I say a big thank you for all the help
you gave me. To Auntie Oye, thank you for the opportunity you gave me to live. I have
not forgotten all that you sacrificed for me.
Finally, a special thanks to Adzo, Ewura, Kobby, Nana, Elikem, and Joshua for
your understanding and prayer. I cannot express fully my deep love for you. Adzo, once
more, thank you and God bless you. Above all, I am grateful to the Lord for His mercies,
provision, and protection that sustained me over the period.
Reproduced with permission of the copyright owner. Further reproduction prohibited without permission.
ABSTRACT
In the 1960s and 1970s academicians, economists and politicians favored state
ownership over private ownership in the production and provision of goods and
services. By the end of the 1980s, however, there was a reversal of public policy from
state domination of the production and provision of goods and services to private
ownership and operation. This was due in part to what the World Bank referred to as
“state failure”, which was characterized by inefficient service delivery, unprofitable
SOEs, high government debt, and stagnant economic growth rates. Accordingly,
privatization caught on in many countries as a policy tool to foster efficiency,
encourage investment, free public resources for investment in infrastructure and social
programs to enhance economic growth and distributional equity.
In recent years, however, privatization has come under attack. The main
criticism being that privatization results in the abuse of market power and social
welfare losses. The perception of most people in the developing countries is that
privatization usually benefits the rich at the expense of the poor in society. This study
therefore is an attempt to empirically examine the claims and counter claims of the
impact of privatization on economic growth and income distribution in developing
countries. The study sample is made up of 80 developing countries that privatized their
state-owned enterprises between 1991 and 2002. The findings of the study indicate that
privatization did not have a significant impact on economic growth, but had differential
effects on the distribution of income. The results of the study, however, suggest that
country-specific characteristics, including good governance may be more important in
promoting growth and reducing income inequality than any economic policy per se.
Reproduced with permission of the copyright owner. Further reproduction prohibited without permission.

TABLE OF CONTENTS
ABSTRACT..................................................................................................................... i
TABLE OF CONTENTS............................................................................................... ii
LIST OF TABLES..........................................................................................................iv
LIST OF FIGURES.........................................................................................................v
LIST OF APPENDICES................................................................................................ vi
CHAPTER 1.....................................................................................................................1
Introduction................................................................................................................ 1Purpose Statement......................................................................................................5Research Questions................................................................................................... 6Significance of Study................................................................ 7Overview of Study.................................................................................................... 9
CHAPTER 2
Background.............................................................................................................. 10Definition of Privatization......................................................................................10Regional Distribution of Privatization...................................................................14Sectoral Distribution of Privatization....................................................................19Extent of Government Ownership.........................................................................23
CHAPTER 3.................................................................................................................. 25
Literature Review.................................................................................................... 25Theories of Privatization.........................................................................................25Property Rights Theory...........................................................................................26Principal Agent Theory...........................................................................................28Public Choice Theory............................................................................................. 30Privatization, Economic Growth, and Income Inequality................................... 34Criticism of Theoretical Arguments......................................................................36Empirical Studies.................................................................................................... 42Firm-Level Studies.................................................................................................. 43Industry-Level Studies............................................................................................44Country-Level Studies............................................................................................47Limitations of Empirical Studies........................................................................... 50
CHAPTER 4 .................................................................................................................. 60
Methodology............................................................................................................60
ii
Reproduced with permission of the copyright owner. Further reproduction prohibited without permission.

Model Specifications.............................................................................................. 60Data...........................................................................................................................64Dependent Variables............................................................................................... 65Independent variables............................................................................................. 66Data Analysis...........................................................................................................71
CHAPTER 5.................................................................................................................. 76
Results...................................................................................................................... 76Privatization and Economic Growth Regressions.................................................76Privatization and Income Inequality Regressions.................................................83Summary of Results................................................................................................ 89Discussion of Results.............................................................................................. 92Implications of Study............................................................................................ 106Limitations and Further Research........................................................................ 110Conclusion............................................................................................................. I l l
REFERENCES............................................................................................................ 114
APPENDIX...................................................................................................................132
iii
Reproduced with permission of the copyright owner. Further reproduction prohibited without permission.

LIST OF TABLESTABLE
1. Privatization Number of Transactions and Proceeds by Region..................11
2. Summary Statistics .......................................................................................72
3. Correlation Matrix of Governance Indicators............................................ 73
4. Correlation Matrix of all Variables Used in Study........................................ 75
5. Privatization and Growth Regressions...........................................................77
6. Privatization with Individual Governance Indicator Regressions............... 80
7. Privatization Interaction Growth Regressions...............................................82
8. Privatization and income Inequality Regressions......................................... 84
9. Privatization and Income Inequality with IndividualGovernance Indicators.....................................................................................88
10. Privatization regression with Interaction Regressors.................................... 90
11. Median Gini Coefficient by Region and D ecade..........................................100
iv
Reproduced with permission of the copyright owner. Further reproduction prohibited without permission.

LIST OF FIGURES
FIGURE
1. Global Privatization Proceeds............................................................................... 12
2. Privatization Transactions 1988 - 2003 ......................................................... 13
3. Privatization Proceeds 1988 - 2003 ......................................................................14
4. Share of Privatization Transactions ................. 15
5. Privatization Proceeds by Region.........................................................................16
6. Privatization Transactions by Region....................................................................16
7. Sectoral Distribution of Privatization Proceeds, 1988 - 2003 .............................20
8. Sectoral Distribution of Privatization Transactions, 1988-2003 ........................ 21
9. Sectoral Privatization Transactions (% )............................................................... 22
10. Economic Growth in Perspective, 1970 and 2000 ................................................93
Reproduced with permission of the copyright owner. Further reproduction prohibited without permission.
v

LIST OF APPENDICES
APPENDIX
1A. Privatization Revenues and Economic Growth Rates Data 1991-2002 ................132
2 A. Privatization Revenues and Income Inequality Data 1991 - 2002 ....................... 134
3 A. Variables, Symbols, and Sources of Data Collection............................................136
4A. List of Landlocked Countries..................................................................................137
5A. Variables used in Study .......................................................................................... 138
6A. Raw Data for the Study............................................................................................ 139
Reproduced with permission of the copyright owner. Further reproduction prohibited without permission.
vi

CHAPTER 1
INTRODUCTION
In the past several years, governments all over the world have privatized state owned
enterprises (SOEs) in all sectors of their economies, including energy, infrastructure and
financial services. Until the 1980s international policy tended to favor state planning in
national development strategies. Public sector expansion was seen as a major instrument
in economic development, employment, social welfare and national security (Vernon and
Aharoni, 1981). In the developing countries especially, Cook and Kirpatrick (1988) note
that public investment can perform the role of ensuring that the conditions necessary for
industrial growth are met. The authors further argue that the need to accelerate the
process of industrialization led to public sector participation in sectors believed to have
significant linkages in the overall economy.
By the end of the 1980s, however, there was a reversal of public policy from state
domination of the production and provision of goods and services to private ownership
and operation. This was due in part to what the World Bank (1995) referred to as “state
failure” which was characterized by inefficient service delivery, unprofitable SOEs, high
government debt, and stagnant economic growth rates. A 1988 World Bank survey of 25
developing countries shows that the median contribution of their SOEs to the overall
public sector deficit was 48%, and between 1976 and 1983 the total debt of SOEs in
developing countries was estimated to be $80 billion (Cowan, 1990).
Further, Musa (1996) asserts that state run economies’ inability to absorb external
price shocks led to macroeconomic instability as evidenced by the debt crisis of the
1
Reproduced with permission of the copyright owner. Further reproduction prohibited without permission.
1980s. Consequently, privatization caught on in many countries as a policy tool to foster
efficiency, encourage investment, free public resources for investment in infrastructure
and social programs with the hope that they could lead to overall economic growth and
reduction of poverty (Nellis, 1995). Privatization was therefore pursued worldwide as a
response to the demands to the disappointing performance of government provision of
certain goods and services (Clifford, 1993). Indeed, privatization has become what Miller
(1997) describes as the new economic mantra, which will continue to exert influence on
the lives of people in countries throughout the world well into the 21st century. Likewise,
Feigenbaum and Henig (1997) claim that if any economic policy could lay claim to
popularity, at least among the world’s political elites, it would certainly be privatization.
The trend toward privatization, however, has not been without debate. The debate
over private versus public sector’s superiority in terms of efficiency has been going on
for the past four decades. The debate initially focused on how the size of the public sector
(measured by the size of government consumption) affected economic growth (Barro,
1991; Landau, 1986; Ram, 1986; Rubinson, 1977). While Rubinson (1977) and Ram
(1986) claim that government consumption has a positive effect on economic growth,
Landau (1986) and Barro (1991) make claims to the contrary. Rubinson (1977) argues
that a large government size proxied by government revenue as a percentage of GNP
positively affects economic growth by reducing dependence, especially in poor or less
developed countries. Landau (1986), on the other hand asserts that a large government
size (proxied by share of government consumption in GDP) depresses GDP per capita
income.
Reproduced with permission of the copyright owner. Further reproduction prohibited without permission.

By the end of the 1980s many studies pointed to the fact that private firms were
more efficient than SOEs. For example, Shirley and Walsh (2001) in a review of 52
empirical studies on the debate between the superiority of the SOEs and private firms
report that 32 of the studies favored private firms, 15 results were ambiguous and
superiority of SOEs were found in only five of the studies. In another review of the
literature, Villalonga (2000) reports that of the 104 studies on the private versus public
ownership issue; 55 were in favor of private ownership, 14 against, and 35 were neutral.
Megginson and Netter (2001) in their extensive review of 65 empirical studies at the firm
level, and in firms within and across countries, concluded that privately owned firms
were more efficient and profitable than otherwise comparable SOEs. The World Bank’s
(1995) Bureaucrats in Business, also indicates that government controlled firms perform
less well than the private sector in a host of activities. It appears that while the theoretical
and empirical studies were not able to completely settle the debate, the discussions seem
to have favored private ownership due to the impact of increasing government debt,
macroeconomic instability, and the declining world economy in the 1980s.
The privatization process has been ongoing for some time, and therefore it is
appropriate to empirically examine the direct impact of privatization on economic
performance. It is important to note that a few studies have examined the economic
impacts of privatization, but none of the studies controlled for regional differences
(Barnett, 2000; Cook and Uchida, 2003; Filipovic, 2005; Plane, 1997; Yoder et al., 1991).
These five studies have examined the impact of privatization on economic growth but
have reported contrasting results. While Barnett (2000) and Plane (1997) report a
significant positive effect, Cook and Uchida (2003) show a significant negative effect and
3
Reproduced with permission of the copyright owner. Further reproduction prohibited without permission.

Filipovic (2005) and Yoder et al. (1991) indicate a negative but insignificant effect of
privatization on economic growth. The inconsistent results might be due to omitted
variable bias in terms of the regional differences. Obviously, regional differences are not
associated with only geographic variables but also with social, political, and cultural
norms that determine how privatization is implemented and hence its effect on economic
growth.
This research attempts to fill this gap with respect to the privatization process as it
has impacted various regions of the developing world. Contributions to the literature on
privatization are twofold. First, as argued above, by controlling for regional blocs, the
study contributes to the understanding of how privatization has impacted the economies
of the different regions of the developing world. But even more important, it helps to
reduce any bias in the estimation of the regression coefficients. Second, the study
examines the impact of privatization on both economic growth and income distribution,
as a government’s responsibility is not only to deliver services more efficiently, but also
more equitably. Of the five studies mentioned above, only Yoder et al. (1991) examined
the impact of privatization on economic growth and other measures of economic
development, including income distribution, life expectancy at birth, literacy rate, and
infant mortality rate.
However, Yoder et al. (1991) employed a correlational analysis to study the
relationship between privatization and the development indicators and therefore could not
control for other factors (macroeconomic stability and institutional infrastructure) that
might affect economic growth and income distribution. Yoder et al. (1991) did recognize
the weakness in their methodology and recommended further studies of the impact of
4
Reproduced with permission of the copyright owner. Further reproduction prohibited without permission.

privatization on the other measures of development. Until now most studies have
responded to the first recommendation to employ more rigorous statistical methods
(Cook and Uchida, 2003; Plane, 1997), but not much on the second recommendation in
terms of analyzing the impact of privatization on the distribution of income. This
dissertation therefore is a response to Yoder et al.’s (1991) call and the perception of
many in the developing countries that privatization has benefited the rich at the expense
of the poor (Kessides, 2004; Kikeri and Sunita, 1992; Nellis, 2003). Consequently, this
study examines the impact of privatization on economic growth and income inequality in
developing countries between 1991 and 2002.
The time period (1991 - 2002) is selected because this is the period in which most
countries in the developing world engaged in ambitious privatization programs (World
Bank Privatization Database, 2005).
Purpose Statement
The objective of this study is to examine the impact of privatization on economic
performance in developing countries between 1991 and 2002. The goal is to examine the
impact of privatization on two economic development indicators: economic growth and
income inequality. The study therefore seeks to examine whether the privatization
programs implemented by most developing countries between 1991 and 2002 had a
positive effect on both output growth and distributional equity as suggested by the
advocates of privatization.
The dependent variables employed in this study are the economic growth rates
and income inequality. The economic growth rates is represented by the Gross Domestic
5
Reproduced with permission of the copyright owner. Further reproduction prohibited without permission.
Product (GDP) per capita growth rates and income inequality is represented by the ratio
of the share of going to the richest in the population and the share of income going to the
poorest in the population. The main independent variable of interest is the privatization
variable which is represented by the privatization revenues as a percentage of Gross
Domestic Product (GDP). The study will also control for other variables that are known
to affect growth (e.g., the degree of openness, fiscal and monetary policy, governance
infrastructure, and the initial level of development).
Research Questions
Considerable time has elapsed since privatization was first implemented in a number of
countries and therefore it is appropriate for the results to be evaluated at the
macroeconomic level. This is particularly important in the developing world where
privatization has been implemented as a political, economic, and social instrument for
societal transformation (Stiglitz, 1998). Although a great deal of attention has been given
to privatization in the developing world, most of the country-level studies have been
descriptive and focused on the extent of privatization (Bennell, 1997; Berthelemy,
Kaufmann, and Valfort, 2004), with only a few analyzing the empirically the impact of
privatization. Consequently, more empirical research is needed to ascertain the impact of
privatization in the various regions of the developing world. The dissertation will
contribute to the empirical research literature on privatization by examining two main
questions:
1. What is the impact of privatization on economic growth in developing countries?
2. What is the impact of privatization on income inequality in developing countries?
Reproduced with permission of the copyright owner. Further reproduction prohibited without permission.

Significance of the Study
Privatization as an economic reform policy has been in effect now for a number of years
and therefore it is appropriate to empirically examine the direct impact of privatization on
economic performance. It is important to note that only a few studies have examined the
economic impacts of privatization, but none of the studies controlled for regional
differences. Accordingly, this dissertation will examine the effects of privatization as it
has unfolded in various regions of the developing world. This is important because the
extent and quality of privatization is different for the regions of the world, and
subsequently, privatization’s effect might not be the same in all the regions. Further,
government ownership is more prevalent in some region than others, and consequently,
the impact of government intervention in the economy and corporate governance in
general may be different for the different regions (Chong and Lopez, 2003; Kikeri and
Kolo, 2005)
Finally, the different regions have different cultural, economic, and political
institutions, which may affect the way privatization is implemented, and subsequently its
effect on economic performance. An example is case studies of privatization in Latin
America and Sub-Saharan Africa. While Galiani et al. (2005) and McKenzie and
Mookherjee (2002) claim that privatization resulted in improved performance in Latin
America, Bayliss (2002a) reports otherwise in Sub-Saharan Africa. Al-Obaidan (2002)
argues that the inclusion of countries in the regression analysis that are intrinsically
different may result in unacceptable statistical bias. Clearly, developing countries in Sub-
Saharan Africa, Eastern Europe, Latin America, and Asia exhibit different socioeconomic
characteristics. Accordingly, the inclusion of developing countries with different social
7
Reproduced with permission of the copyright owner. Further reproduction prohibited without permission.

and cultural characteristics requires the regional blocs to be controlled to reduce the
problem of omitted variable bias associated with geographical differences and other
region -specific factors.
The study contributes to the literature on privatization in two main ways. First, by
controlling for regional blocs, it helps to produce consistent estimates of the effect of
privatization and contributes to the understanding of how privatization has impacted the
economies of the different regions of the world. Second, the dissertation examines the
impact of privatization on both economic growth and income distribution, as a
government’s responsibility is not only to deliver services more efficiently, but also to
provide them more equitably. The focus on income distribution is important because the
well-being of the poor has a special role in the objective function of policymakers.
Further, economic reforms that do not reduce income inequality tend to generate
discontent and ultimately are unsustainable (Eduardo and Ugo, 2002).
There is also a consensus in the economic development literature that high
inequality slows growth and promotes political instability (Baliamoume-Lutz, 2004;
Cling et al., 2006). Cling et al. (2006) also note that low income inequality strengthens
the impact of growth on poverty reduction. The study focuses on the time period between
1991 and 2002, as privatization picked up at the end of the 1980s and peaked at the end
of the 1990s for most countries (World Bank Privatization Database). Focusing on this
time period will help to identify how the extensive implementation of the privatization
policy impacted the economies of the countries concerned.
8
Reproduced with permission of the copyright owner. Further reproduction prohibited without permission.

Overview of Study
The dissertation contains five chapters. Chapter one introduces the research and provides
a general overview of the research problem. Chapter two provides a background of the
intensity and pace of privatization in developing countries between 1991 and 2002 as this
is the period in which most developing countries privatized their state-owned enterprises.
Chapter three presents a review of the literature on privatization in which the theoretical
arguments for and against privatization are offered and followed by an analysis of the
empirical literature on privatization and its limitations. Chapter four discusses the
methodology and data used in the research. This section also discusses the model
specifications that are used to address the research questions. Chapter five presents and
discusses the study’s findings, provides policy implications, limitations and suggestions
for future research, and concluding remarks.
Reproduced with permission of the copyright owner. Further reproduction prohibited without permission.
9

CHAPTER 2
BACKGROUND OF PRIVATIZATION
This chapter provides a brief discussion on the definition of privatization and recent
privatization trends, and examines the extent to which government ownership is still
prevalent in developing countries.
Definition of Privatization
Privatization is defined in many ways in the literature. It is a broad term but most simply
defined as the transfer of assets or service delivery from the government to the private
sector. Pirie (1986) identified over 22 definitions of privatization. In recent times, the
term has been used to represent three main concepts: divestiture; deregulation; and
delegation (Ghosh, 2004; Rothenberg, 1987; Savas, 2000). Divestiture refers to the
partial or full sale of an enterprise from the public to the private sector. Deregulation, also
known as liberalization, refers to the removal of restrictions on market entry and is
intended to increase the role of competition. Change of ownership may not be involved.
Delegation usually involves the government maintaining control and being responsible
for the service delivery, but the actual production activity is done by the private sector.
This means that the government usually provides the funding for the private sector to
produce the service or good. Delegation is carried out by contract, franchise, and subsidy
(grant or voucher).
The focus of the dissertation, however, is on the impact of the proceeds generated
from the sale of government owned assets on economic growth and income inequality
and, therefore the extent and trend of the of the divestiture is discussed next. It is
10
Reproduced with permission of the copyright owner. Further reproduction prohibited without permission.

important to note that the sale of government owned assets is the most popular method of
privatization in developing countries. Unless otherwise stated, all the privatization
transactions and proceeds utilized are from the World Bank Privatization Database
(2005). The World Bank Privatization database shows that between 1988 and 2003,
developing countries carried out about 9000 privatization transactions and raised nearly
$410 billion in privatization revenues (See Table 1) or 0.5% of total developing country
GDP during that period (Kikeri and Kolo, 2005).
Table 1: Privatization Numbers and Proceeds by Region, 1990-2003
REGION TRANSACTIONS PROCEEDS (US $ BNST
Middle East, North Africa 302 $18.9
South Asia 399 $15.4
East Asia/Pacific 417 $65.8
Sub-Saharan Africa 981 $11.5
Latin America, Caribbean 1,265 $195.1
East & Central Europe, Central Asia
5,634 $104.1
Totals 8,998 $410.8
Source: Nellis (2006)
11
Reproduced with permission of the copyright owner. Further reproduction prohibited without permission.
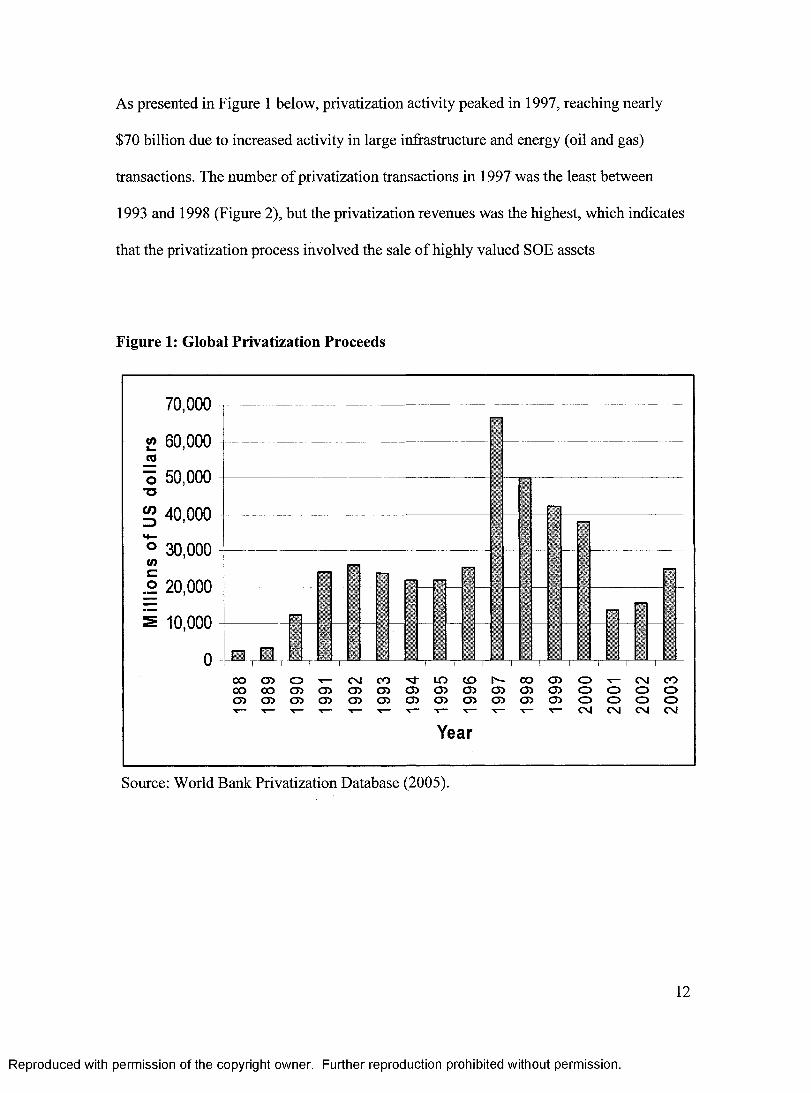
As presented in Figure 1 below, privatization activity peaked in 1997, reaching nearly
$70 billion due to increased activity in large infrastructure and energy (oil and gas)
transactions. The number of privatization transactions in 1997 was the least between
1993 and 1998 (Figure 2), but the privatization revenues was the highest, which indicates
that the privatization process involved the sale of highly valued SOE assets
Figure 1: Global Privatization Proceeds
70.000
«> 60,000 —o 50,000
T3
40.000
10,000
° 30,000 <0
.2 20,000
C O O O t - C M C O ^ U ) C D N O O O ) O t - C M C O O O O O O J C D 0 ) 0 0 ) 0 ) 0 ) 0 ) 0 ) 0 ) o o o oO C D C D C T ) 0 ) 0 ) 0 5 0 ) 0 ) 0 ) 0 ) 0 ) o o o o1— T— T— -5— 1— T— T - 1 — I - - * — T - T - N CM CM CM
Year
Source: World Bank Privatization Database (2005).
12
Reproduced with permission of the copyright owner. Further reproduction prohibited without permission.

Although privatization activity increased in all regions of the world, the greatest
increase was found in five countries: Argentina, Brazil, Mexico (all from Latin America),
China and Russia. These five countries generated privatization revenues of nearly $41
billion out of a total of $67 billion generated by developing countries in 1997.
Privatization activity, however, declined after 1997 to $50 billion in 1998, $40 billion in
1999 and 2000 and reduced drastically to a low of $14 billion in 2001. Gradual increases
in privatization were found after 2001 as the proceeds increased nearly 13% in 2002 and
38% in 2003 (Figure 1). This was due to the fact that the average size of transactions
increased over the years as countries began privatizing larger firms.
Figure 2: Privatization Transactions
2000 £ 1800
~ 1600 « 1400in= 1200 £ 1000 o 800 £ 600 g 400 = 200 Pi
Mm
co a) o t- 0 ) 0 ) 0 0 0 )0 )0 0 T - T - Csl C\J
CNJ COo o o oCM CM
Year
Source: World Bank Privatization Database (2005).
13
Reproduced with permission of the copyright owner. Further reproduction prohibited without permission.

Regional Distribution
Even though the number of transactions and the proceeds generated from privatization
increased in all regions of the developing world, proceeds were highly concentrated in
Latin America and East Asia (Figure 3). Latin America accounted for 64% of total
privatization proceeds with 39% of the total number of transactions, followed by East
Asia with 13% of the transactions and 21% of the privatization proceeds, and the rest of
the developing world accounting for 15% of the proceeds and 48% of the transactions.
Figure 3: Privatization Proceeds, 1988-2003
■ East Asia & Pacific
■ Latin Am erica & Caribbean
□ Middle East & North Africa
□ South Asia
■ Sub-Saharan Africa
Source: World Bank Privatization Database (2005).
Latin America
Latin America is the biggest privatizer in terms of both the quantity (number of
transactions) and the proceeds generated from privatization (volume of assets sold)
14
64%
Reproduced with permission of the copyright owner. Further reproduction prohibited without permission.

between 1988 and 2003. Latin America accounted for 39% of the total number of
transactions (Figure 4) and nearly $195 billion or 64% of the total privatization proceeds
(Figure 3) in developing countries between 1988 and 2003. Three countries; Argentina,
Brazil, and Mexico accounted for over 75% of the regional revenues in the 1990s
primarily from telecommunications, electricity, and energy in the 1990s.
Figure 4: Share of Privatization Transactions, 1988-2003
■ East Asia & Pacific
■ Latin America &Caribbean
□ Middle East & North Africa
□ South Asia
■ Sub-Saharan Africa
9%
Source: World Bank Privatization Database (2005).
Latin America’s share of privatization transactions and proceeds began to fall gradually
in the later part of the 1990s and fell dramatically in 2000 and afterwards (Figures 5 and
6). The decline was due to the reduction in the stock of enterprises for sale and
dwindling political desire to privatize additional sectors of the economy. Brazil, however,
continues to be among the top ten privatizers in the developing countries after 2000 and
contributes about 85% of the Latin America’s privatization proceeds (Kikeri and Kolo,
2005).
15
Reproduced with permission of the copyright owner. Further reproduction prohibited without permission.

Figure 5: Privatization Proceeds, 1988-2003
40000
w 35000
1 30000 o^ 25000
2 20000 og 15000
| 10000
00 o CM ■sj- co CO o CM00 CO CO 05 CO CO o O05 05 CO CO CO CO o OT_ T_ T_ CM CM
Year
— ♦ — East Asia &Pacific
- m - Latin America& CaribbeanMiddle East& North Africa
— H— South Asia
— * — Sub-SaharanAfrica
Source: World Bank Privatization Database (2005).
Figure 6: Number of Privatization Transactions by Region, 1988-2003
180
CO o CM M- CD CO o CM00 CO CO co CO CO o oCO CO CO CO CO CO o oT— 1— T— T“ X— T— CM CM
Year
East Asia & Pacific
* — Latin America & Caribbean
* ~ Middle East & North AfricaSouth Asia
■*— Sub-Saharan Africa
Source: World Bank Privatization Database (2005).
16
Reproduced with permission of the copyright owner. Further reproduction prohibited without permission.

East Asia and the Pacific
The World Bank Privatization Database (2005) indicates that after a slow start in the
1980s, privatization in East Asia and the Pacific picked up in the early 1990s and peaked
in 1997, with privatization revenues of $10 billion. There was a steep decline in
privatization revenues in 1998 ($1.5 billion), but this increased to $5.5billion in 1999,
and nearly $11 billion in 2000. The region raised $66 billion or 13% (Figure 4) of total
privatization proceeds from 420 transactions between 1988 and 2003. Malaysia,
Indonesia, and China were the three top privatizers during the 1990s. It should be noted
that China alone accounted for nearly 60% of the regional proceeds in the 1990s, but this
increased to nearly 80% between 2000 and 2003. China’s privatization revenues of over
$8 billion make it the top revenue earner among developing countries between 2000 and
2003, as a result of divestiture in the telecommunications, energy, and manufacturing
sectors.
South Asia
South Asia accounted for nearly $16 billion or 5% of total developing countries’
privatization proceeds from 390 transactions between 1988 and 2003 (Figure 5).
Privatization in South Asia peaked in 1994 with revenues of nearly $3 billion. India and
Pakistan accounted for 75% and 19% respectively of the South Asian privatization
proceeds. India is one of the few countries that have been consistent with its privatization
program and currently, it is one of the top ten privatizers, as generated revenues reached
over $2 billion between 2000 and 2003. Indian’s privatization proceeds were largely from
17
Reproduced with permission of the copyright owner. Further reproduction prohibited without permission.

minority share sales in banking, oil, and gas with only a few recent sales involving the
manufacturing and telecommunications sectors.
Sub-Saharan Africa
Figure 4 shows that Sub-Saharan Africa had the second largest number of transactions
(27%) after Latin America, but it generated the least proceeds from privatization (4%) in
developing countries between 1988 and 2003. This is due to the fact that most of the
SOEs sold, were low-valued firms in competitive sectors (Kayizzi-Mugerwa, 2002;
Kikeri and Kolo, 2005; Nellis, 2003). Of the over $11 billion of African privatization
revenues raised between 1990 and 2003, nearly a third was generated by a handful of
privatizations in South Africa (Nellis, 2003). Another 33% came from sales in a group of
four countries (Ghana, Nigeria, Zambia, and Ivory Coast). Some 26 African countries
have privatized under $1 billion over the same period. The privatization activity has also
been concentrated in a few sectors, including telecommunications (South Africa), mining
(Ghana and Zambia), and oil fields (Nigeria).
Middle East and North African Countries
The Middle East and North African Countries generated nearly $19 billion or 6% of total
developing country proceeds (Figure 3) from 288 transactions or 9% of developing
country transactions. Significant privatization activity was concentrated in three
countries: Egypt, Morocco, and Tunisia. These three countries accounted for nearly 90%
of total regional proceeds. Transactions in both Morocco and Egypt were mainly in
manufacturing; however, Morocco’s privatization was more diversified with transactions
18
Reproduced with permission of the copyright owner. Further reproduction prohibited without permission.
in oil refining and banking. Since the year 2000, however, the telecommunications sector
has been the main source of privatization revenues. The partial sale of Jordan Telecom
for over $500 million and the partial sale of Saudi Telecom for $4 billion have made the
telecommunications’ sector the region’s leading revenue generator since 2000.
Sectoral Distribution of Privatization
Various regions of the developing world differ not only in the level of privatization
activity, but also in the sectors privatized. Between 1988 and 1994 manufacturing and
infrastructure accounted for over 80% of privatization proceeds (16% for financial
services, 31% for manufacturing and 36% for infrastructure). After 1994, however, the
shares of manufacturing, energy, and primary sectors either declined or remained stable,
while that of financial services and infrastructure increased substantially. As a result, by
the end of 2003, the share of infrastructure proceeds accounted for nearly 50%, even as
manufacturing decreased from 31% in the early 1990s to 16% by 2003.
Infrastructure
Infrastructure related proceeds come from transport, telecommunications, water and
sewage, natural gas transmission and distribution, electricity generation, transmission,
and distribution. Between 1988 and 1994, infrastructure proceeds reached nearly $40
billion, but this increased to over $200 billion in 2003. Infrastructure’s share increased
from 36% by the end of 1994 to 50% in 2003. Figure 7 shows that since the 1990s,
infrastructure has generated the highest proportion of privatization proceeds in
developing countries, reaching its peak in 1998. Telecommunications and power make up
19
Reproduced with permission of the copyright owner. Further reproduction prohibited without permission.

the bulk of the infrastructural activity, accounting for 50% and 36% respectively between
1988 and 2003.
Figure 7: Sectoral Distribution of Privatization Proceeds, 1988 - 2003
45000 w 40000 1 35000 tj 30000§ 25000o 20000 | 15000 E 10000 S 5000
oo o CM ■M" CD OO o CMCO 05 05 05 05 05 o O05 05 05 05 05 05 o O■v— t— T— t— — CM CM
Year
- Energy
_ - Financial
..* ' Infrastructure
- Manufacturing & Services
- Other
- Primary
Source: World Bank Privatization Database (2005).
Financial Services
From a slow start in the late 1980s, proceeds from the financial sector increased in the
1990s but declined between 1994 and 1998 (Figure 7). From a little under $20 billion by
the end of 1994, proceeds rose to over $50 billion at the end of 2003. The financial sector
proceeds are generated from real estate, banking, insurance, and financial service firms,
which account for nearly 90% of the financial sector proceeds. The financial sector
revenues seem to be concentrated in a few developing countries: Mexico and Brazil in
20
Reproduced with permission of the copyright owner. Further reproduction prohibited without permission.

Latin America; China, Philippines, Indonesia, and Thailand in East Asia; Pakistan in
South Asia; and Nigeria, Uganda, and South Africa in Sub-Saharan Africa.
Manufacturing
Figure 8 shows that the most popular sector privatized in the developing countries has
been the manufacturing sector, accounting for 61% of all transactions between 1988 and
2003 (Figures 8 and 9). Manufacturing’s sharpest increase occurred between 1991 and
1994 after which it declined through the rest of the 1990s, but it is still one of the major
sectors being privatized in developing countries.
Figure 8: Number of Privatization Transactions, 1988-2003
(A£o'•£O(O0)£(0
oSi
E
900
800
700
600
500
400
300200
100
0
J \
oo o CM "S f CO o o O CMoo CD CD CD CD CD O OCD CD CD CD CD CD O OT—
YearCM CM
—♦— Energy
- ■ — Financial
Infrastructure
Manufacturing & Services
Other
—• — Primary
Source: World Bank Privatization Database (2005).
21
Reproduced with permission of the copyright owner. Further reproduction prohibited without permission.
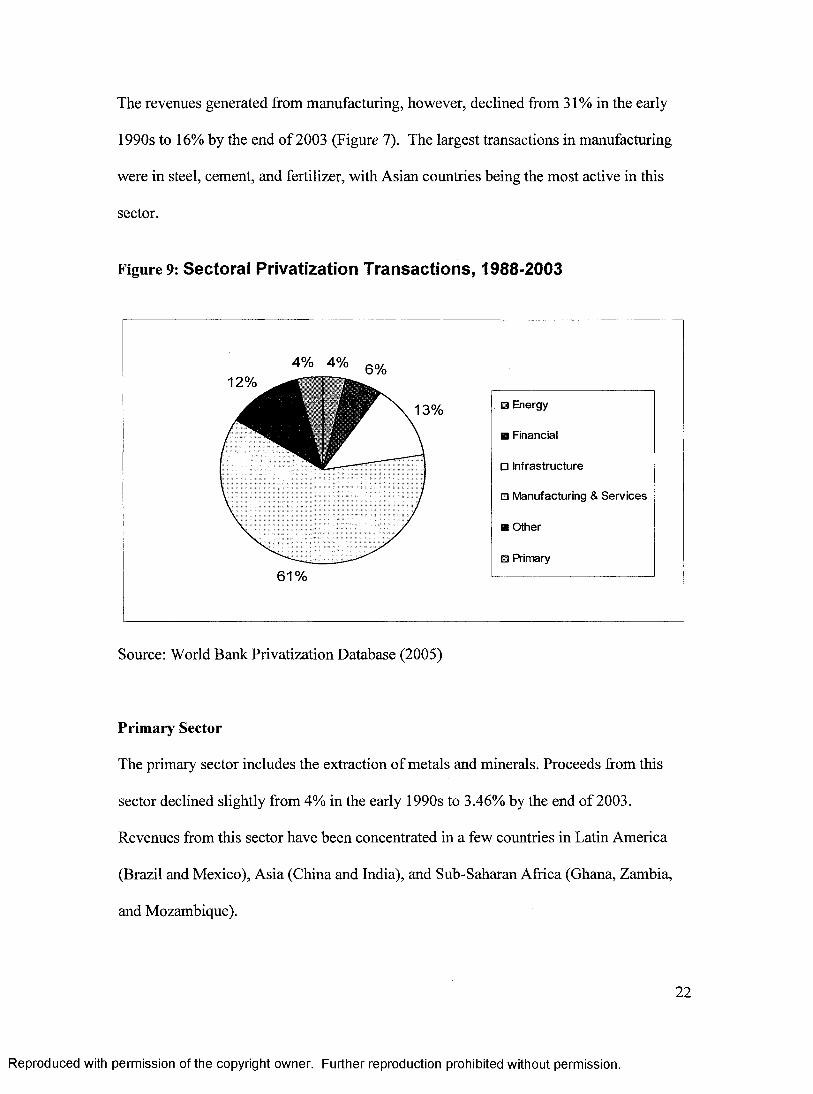
The revenues generated from manufacturing, however, declined from 31% in the early
1990s to 16% by the end of 2003 (Figure 7). The largest transactions in manufacturing
were in steel, cement, and fertilizer, with Asian countries being the most active in this
sector.
Figure 9: Sectoral Privatization Transactions, 1988-2003
■ Energy
■ Financial
□ Infrastructure
□ M anufacturing & S erv ices
■ O ther
■ Primary
Source: World Bank Privatization Database (2005)
Primary Sector
The primary sector includes the extraction of metals and minerals. Proceeds from this
sector declined slightly from 4% in the early 1990s to 3.46% by the end of 2003.
Revenues from this sector have been concentrated in a few countries in Latin America
(Brazil and Mexico), Asia (China and India), and Sub-Saharan Africa (Ghana, Zambia,
and Mozambique).
22
Reproduced with permission of the copyright owner. Further reproduction prohibited without permission.

Energy
Proceeds from the energy sector include revenues from extraction and refinement of
hydrocarbons (oil and gas and petrochemicals). Revenues from energy accounted for
12% of privatization proceeds in developing countries by 1994, but had increased slightly
to 14 % by the end of 2003. Transactions over the period were concentrated in few
countries - Argentina, Brazil, China, and South Africa
The discussion above shows that for the developing countries as a whole
privatization activity peaked at the end of 1998 and dropped off in the late 1990s but
increased slightly after 2000. Further, while many developing countries engaged in
ambitious privatization programs, proceeds are concentrated in a few countries. Brazil,
Argentina, and Mexico dominated the 1990s (Kikeri and Kolo, 2005).
Extent of Government Ownership
The high levels of privatization activity might suggest that government ownership has
declined over the years. Kikeri and Kolo (2005) note that although a systematic
assessment of SOE activity in GDP, investment, and domestic credit is difficult because
of data constraints, anecdotal evidence suggests that government involvement in
economic activity in most developing countries is still appreciable. Hence, while
privatization activity has increased all over the developing world, at the aggregate level it
appears to be small relative to the stock of SOEs.
Between 1980 and 1997, SOEs activities as a percentage of GDP decreased from
about 11 to 5 percent in middle income countries and from 15 to 3 percent in low income
countries (Sheshinski and Lopez-Calva, 1999). Chong and Lopez-de-Silanes (2003)
23
Reproduced with permission of the copyright owner. Further reproduction prohibited without permission.

observe that these averages might mask the regional variations in the size and economic
importance of the remaining state-owned production. For example, in Sub-Saharan
Africa, only a few governments have openly adopted an explicitly state-owned
divestment strategy. The African privatization effort has been significant in only a
handful of countries and state production still accounts for over 15% of GDP in the
region. Similarly, government economic role remains large in the Middle East and North
African countries with the private sector accounting on average for less than 50% of GDP
in the region (Kikeri and Kolo, 2005). In Asia, China for example, has only recently
committed to privatize all but the largest state enterprises; while in India nearly 43% of
country’s capital stock is being owned by the state (Chong and Lopez-de-Silanes, 2003).
The review of privatization trends in the developing world suggests that after nearly 15
years of privatization programs, government ownership is still prevalent in many of the
developing countries. The indication is that while privatization has reduced government
ownership in the economy of most developing countries, it has not reduced it to
insignificant levels. The next section discusses the theoretical and empirical literature
cited for and against privatization.
Reproduced with permission of the copyright owner. Further reproduction prohibited without permission.
24

CHAPTER 3
LITERATURE REVIEW
This section presents an overview of the theories of privatization, the link between
privatization and economic growth and income inequality, and finally discusses the
empirical literature on privatization.
Theories of Privatization
Though many theories have been used to support the privatization agenda, three theories
have stood out over the past several years. These are: Property Rights theory, Public
Choice theory, and Principal Agent theory. The basic assumption of the privatization
theories is that free market forces enhance efficiency in organizations. Henig (1989), for
example, notes that the privatization theories have served to advance the privatization
movement in two ways. First, they served to refurbish a laissez faire philosophy that was
politically past its prime especially in the developing world. Henig (1989) claims that by
applying economic principles to explain government behavior (failure), the privatization
theories provided a means to undercut the presumption that an expanded governmental
apparatus could best carry out the pursuit of a widely shared public goal. Second, the
theories furthered the privatization movement by redefining preexisting local government
practices, as the theories represented a coherent, pragmatic and nonpartisan philosophy
rather than the advancement of a political program to disassemble the state. Each of these
theories will now be discussed in detail.
25
Reproduced with permission of the copyright owner. Further reproduction prohibited without permission.

Property Rights Theory
The property rights literature is quite diverse, but it is characterized by a common
emphasis on the interconnectedness of ownership rights, incentives, and economic
behavior (Commander and Killick (1988). Property rights theory is therefore concerned
with maximizing the utility function of managers subject to the limits established by the
existing organization. Property rights have been defined in a variety of ways. Alchian
(1965) defines property rights as having three characteristics: exclusivity of rights to the
choice of use of a resource; exclusivity of rights to the services of a resource; and
the rights to exchange the resource at mutually aggreable terms.
On the other hand, Demetz (1967) defines a property right as an instrument of
society, which derives its significance from the fact that it helps an individual form those
expectations which he or she can reasonably hold in dealings with others. These
expectations find expression in the laws, customs, and mores of a society. An owner of
property rights possesses the consent of fellowmen to allow him or her to act in particular
ways. In accordance with this view, Starr (1988) asserts that the theory of property rights
specifies the social and economic relations that people must observe with respect to the
allocation of resources, taking into consideration both the benefits owners can enjoy and
the harm they cause to others.
Similarly, Hill and Kamer (1996) refer to property rights as the control over
assets and argued that managers have such control in that they determine the day to day
allocation of inputs and production of the firm. From an institutional theory perspective,
however, Anderson and Hill (1975) assert that property rights creation is an economic
activity very much like the production of other goods and services, which cannot be
26
Reproduced with permission of the copyright owner. Further reproduction prohibited without permission.

imposed upon the system but develop in response to incentives. For example, in the case
of the United States, Hill and Kamer (1996) explain that the property rights to water,
livestock, and land, were in response to both supply and demand conditions. When these
resources were not particularly valuable, little effort was made in defining and enforcing
rights, but when population pressure and increased demand for agricultural products
made property rights more valuable, greater effort was made in defending and enforcing
these rights. This is because property rights give individual owners “residual claims” on
the assets of private enterprise (Hanke, 1987). Residual claims refer to the ability to use
an asset, change it in form, and to transfer all or sell some of these rights (Starr, 1988).
Soto (1996) has described property rights as the ‘missing ingredient’ needed to make
markets work. This is because the creation of property rights is directly linked to the
incentive structure of the system, as well defined and enforced rights will develop more
rapidly if decision makers can capture the returns from such rights (Hill and Kamer,
1996).
The discussion above suggests that individuals tend to their property better when
there are gains to be made. As far back as 1776, Adam Smith wrote in the “Wealth of
Nations” that people are more prodigal with the wealth of others than with their own.
Accordingly, from the property rights perspective, public enterprises are expected to be
less efficient compared to private firms because public enterprises are owned by
individuals who have no residual claim (SOEs shares cannot be sold by citizens) on the
assets of the public organizations (Megginson, 2005). As Aharoni (1982, p. 69) puts it,
the “ .. . .SOE is an agent without a principal."
27
Reproduced with permission of the copyright owner. Further reproduction prohibited without permission.

The main thesis of the property rights theorists is that the state sector’s
inefficiency results from situations in which no individual or group has a clear stake in
the assets of the enterprise (Abdul, 2000). This means that in public enterprises, property
rights are neither exclusive nor transferable. In this context, the probability that the public
assets would be mismanaged might be high (Furobotn and Perjovich, 1972). This review
demonstrates that property rights theory diverges from the classical theory of the firm by
rejecting the firm as the unit of analysis, and focuses instead on the role of individual
decision makers within the organization. The more completely the rights over resources
are allocated to the decision maker, the stronger are the incentives to use and preserve
those resources efficiently. Accordingly, privatization associated with concentration of
property rights is expected to lead to improved efficiency.
Principal-Agent Theory
The fundamental argument for the superiority of the private enterprise in terms of its
efficiency is based on the fact that as residual claimants to a firm’s revenues, the owners
are motivated to behave efficiently. In the modem firm, however, there is attenuation of
property rights as in SOEs, because ownership is separated from managerial control in
most big corporations. There is therefore a principal-agent relationship under which one
or more persons (principal (s) or the body of diffuse shareholders) can engage another
person (the agent) to perform some service on their behalf which involves delegating some
decision making authority to the agent. The agency relationship therefore results in agency
costs, which consists of monitoring expenditures by the principals, bonding payments by
the agents, and residual losses (Jensen and Meckling, 1976).
28
Reproduced with permission of the copyright owner. Further reproduction prohibited without permission.

Agency theorists argue that managers in both private and SOEs are assumed to
maximize their own utility rather than that of the organization or its owners. However,
the problem is reduced in private firms through external mechanisms (corporate control)
and internal mechanisms through boards of directors and incentives for managers
(Cuervo and Villalonga, 2000; Furobotn and Pejovich, 1972; Skipke, 2001; Tandon,
1995,1997). Further, Furobotn and Pejovich (1972) claim that the extent of managers'
pursuit of their own interests will also be constrained by managers’ own cost-benefit
calculations in terms of: market valuation; managerial Incentives; and competition among
managers. This means that in so far as stock price reflects the present value of the
expected future consequences of managerial policies, it would be expected that managers
would be careful with respect to maximizing their own value rather than the firm’s value.
As a result, owners’ freedom to sell shares in a market that reflect the capitalized value of
current managerial decision tends to set limits on the power of managers to pursue their
own objective at the expense of profit maximization (Furobotn and Perjovich, 1972, p.
1150).
Further, Fama (1980), in his analysis of the agency problems, argues that the
separation of ownership from control can be an efficient form of organization relative to
organizations in which the risk-bearing and decision-making functions are combined.
Fama (1980) observes that a firm is usually disciplined by competition from other firms,
which forces the evolution of devices for efficiently monitoring the performance of the
entire team and its members. Individual participants in the firm, and in particular its
managers, face both the discipline and opportunities provided by the markets for their
services, both inside and outside the firm.
29
Reproduced with permission of the copyright owner. Further reproduction prohibited without permission.

Additionally, Agency theory indicates that because private firms have clearer
goals, it is easier for owners (principals) to hold managers (agents) accountable
(Dharwadkar et al., 2000; Vickers and Yarrow, 1988) and therefore managers perform
better in private firms than in SOEs. Shleifer and Vishny (1994) and Sheshinski and
Lopez-Calva (1999) also claim that political interference distorts the objectives and
constraints faced by public managers, which results in poor choices of production.
Similarly, La Porta and Lopez-de-Silanes (1997) describe agency conflicts as the main
source of inefficiencies of SOEs. This means that privatization will tend to raise the cost
to politicians in influencing firms, since subsidies to private firms necessary to force them
to remain inefficient are politically harder to sustain than wasted profits of the SOE
(Boycko et ah, 1996).
Public Choice Theory
Underlying the case for privatization is the view that there is government failure, in the
sense that public policy is likely to operate in ways that impede the efficient functioning
of markets (Yarrow, 1999). Government failure or the public choice argument, according
to Ghosh (2001) is the main pillar of the neoclassical counter-revolution to the
interventionist state with unlimited power. Government failure refers to the failure of
government policies to allocate resources efficiently, to redistribute them in a well-
targeted manner, and to stabilize the economy in the period of stagflation (Tanzi and
Schuknecht, 2000). The basic assumption of public choice theory is that humans are
egoistic, rational, utility maximizers (Buchanan and Tullock, 1962).
The principle of utility maximization according to the public choice perspective
dominates human behavior both in the marketplace and in politics (Abu Shair, 1997;
30
Reproduced with permission of the copyright owner. Further reproduction prohibited without permission.

Dye, 2000; Hodge, 2000). As a result, the inefficiency of state firms is attributed to
politicians and bureaucrats pursuing their own well specified objectives such as excess
labor spending which conflicts with the efficient operations of SOEs (Boycko et al.,
1996). Buchanan (1972) asserts that politicians in interfering in the economic activity are
more interested in winning votes than promoting efficiency in SOEs. This is due to the
fact that the policy environments in which firms operate are functions of the incentive
structures faced by policy makers, which depend on a range of political factors including
interest group pressure and public opinion. This means that an increasingly larger share
of government output is designed to benefit subgroups of the populace at the expense of
the general public.
Further, Niskanen (1971) asserts that utility maximizing bureaucrats receive
utility from the size of the budget they manage. Consequently, lacking the incentive of
the profit maximizing firm and with no clear objectives, the bureaucrat is likely to seek
the budget size which maximizes his utility, which, as Niskanen (1971) claims is greater
than efficient size. Niskanen’s view is in contrast to the Weberian view of bureaucrats as
“neutered eunuchs” (Niskanen, 1994). Borcherding (1977) also argues that only about
half of the increase in real government spending can be explained by changes in the
standard economic variables of relative price, relative income, and population. The other
half, he argued is attributed to the role of the bureaucracy, which in most cases
maximizes its own utility rather than the public’s interest in the decision making process.
Buchanan (1977) echoes a similar view in his assertion that bureaucrats’ interests lie in
an expanding governmental sector and especially one that expands the number of
employees. Bush and Mackay (1977) in explaining the “politics for profit” and “conflict
31
Reproduced with permission of the copyright owner. Further reproduction prohibited without permission.
of interest” of politicians and bureaucrats, argue that the maximizing behavior of
bureaucrats generates forces that cause excessive public sector growth at the expense of
efficiency.
Another argument against the SOE is the view that SOEs can be used to achieve
social objectives at the expense of efficiency of the organization. Olson (1982, p. 47),
argues that a large government sector related to a large SOE share in output is usually
associated with special interest groups that focus more on redistributing income rather
than creating it, and in ways that reduce social efficiency and output. This is clearly
indicated in Okun’s (1975, p. 48) statement that “ . ...any insistence on carving the pie into
equal slices would shrink the size of the pie.” There is therefore a trade-off between
efficiency and equity or as Okun (1975, p. 2) puts it, “ . . . .we cannot have our cake of
market efficiency and share it equally.” This is because redistributive policies that
attempt to decrease the level of inequality will invariably decrease the efficiency in
resource allocation, the savings ratio, and labor supply and thereby reduce the growth
potential (Korpi, 1985). Okun (1975, p. 91) explains his rationale against state
intervention in the market with the “leaky bucket” concept; which suggests that in the
process of the bureaucrat or politician carrying the money to the poor, some of the money
will get lost in transit. The result is that the poor will not receive all the money that is
taken from the rich. The beneficiaries of the wealth transfer by implication are the
politicians. Accordingly, what society needs, Okun (1975, p. 3) argues is not equality of
income, but rather equality of opportunity.
Okun’s (1975) analysis of the leaky bucket is similar to Olson’s (1982) view,
which suggests that irrespective of coalitions of individuals or firms to affect the
32
Reproduced with permission of the copyright owner. Further reproduction prohibited without permission.
outcomes and functioning of markets via legislative or organized collusion usually leads
to lower economic growth. This is due to the fact that only a few people benefit from the
government intervention in economic activity. Likewise, Mueller (1979) claims that
increased emphasis on distributional issues due to accumulation of special interest groups
can increase the divisiveness in a political system and consequently make societies
ungovernable. Hence, Olson (1982) suggests that special interest organizations and
collusion reduce efficiency and aggregate income in societies in which they operate and
make political life divisive. The public choice perspective therefore holds the view that
the role of the state should be reduced and service delivery where possible should be
privatized. Consequently, privatization is expected to lead to a change in the goals of the
firm and the bargaining power of the different actors in the political market and thereby
increasing the need for efficiency (Cuervo and Villalonga, 2000; Hodge, 2000).
The review of the privatization theories above suggests that SOEs are inefficient
because of the high transaction cost in protecting and enforcing property rights associated
with bureaucrats’ and politicians’ inability and in certain cases refusal or fear of losing
their support base (Abu Shair, 1997; Omran, 2004). Privatization is therefore expected to
improve the performance of the firm by changing the mechanisms through which
different institutional arrangements affect the incentives for managing enterprises
(Laffont and Tirole, 1991). Consequently, privatization is expected to lead to allocative
and productive efficiency and hence increased output in the economy.
33
Reproduced with permission of the copyright owner. Further reproduction prohibited without permission.
Privatization, Economic Growth, and Income Inequality
There are many ways in which privatization may exert a positive effect on economic
growth and income inequality. Three of these ways are discussed below. First, if
privatization was sufficiently extensive and had efficiency inducing effects, the
contribution of improved performance could be detected at the macroeconomic level
(Cook and Uchida, 2003). As noted by Bennett et al. (2004), if the positive effects of
privatization on the financial performance and productivity of firms that are predicted by
microeconomic theory are realized, these effects should have a macroeconomic lag
leading to an increase in economic growth. This is because market specialization and the
resulting efficiency of resource use is the basis of economic growth (Olbeter, 1994).
Likewise, Berg and Berg (1997) argue that in the presence of competition,
enterprise efficiency associated with privatization is expected to lead to increased
efficiency in the entire economy through competitive markets and better allocation of
resources across different firms and sectors of the economy. This is because competition
has the potential to radically change the economy in such a way that some firms will
grow exponentially while others wither away and some services will fail while others
thrive. According to Olbeter (1994), competition forces firms to continually innovate,
improve efficiency, and provide high quality service. The result is that consumers
economy-wide will benefit from less expensive, higher quality, and more innovative
services.
Second, the allocative and productive efficiency associated with privatization will
help to reduce public sector debt and free public resources for investment in
infrastructure and social programs to promote economic growth and reduce poverty
34
Reproduced with permission of the copyright owner. Further reproduction prohibited without permission.
(Nellis, 1994). Aghion and Schankerman (1999), for example, argue that the increased
financial performance and productivity of firms might result in greater revenue for the
government and its ability to spend on infrastructure, which would have a potential
positive impact on aggregate productivity. The fiscal impact of privatization may also
have favorable distributive consequences by aiding macroeconomic stabilization and
allowing a shift in spending away from expensive debt service obligations towards
increased social spending targeted more directly at the poor (Mckenzie and Mookherjee,
2002). Similarly, Ramanadham (1988) notes that revenues generated from privatization
can be invested in infrastructural development and basic industries, which have
significant distributional outcomes.
Finally, the privatization process may lead to increased investment and
stimulation of economic growth for the entire economy (Berg and Berg, 1997). Davis et
al. (2000) indicate that markets and investors regard privatization as a positive signal of
the political likelihood that a government will stick with its overall reform program, and
therefore privatization may be associated with high rates of foreign direct investment
(FDI). The FDI literature indicate that developing countries experienced a sharp increase
in the average ratio of FDI to total investment during the 1990s, which was due mainly to
large scale privatization programs especially in infrastructure (Kirkpatrick, Parker, and
Zhang, 2006; Palmade and Anayiolas, 2004).
Foreign investment has positive spillovers to the entire economy in terms of
improved technology, superior marketing and management skills, and access to
international production networks (Kobrin, 2005; Kumar and Pradhan, 2002; Narula and
Portelli, 2004; Sylwester, 2005). More than 50 years ago, Lewis (1948) argued that the
35
Reproduced with permission of the copyright owner. Further reproduction prohibited without permission.

export of capital to developing countries promotes growth by creating industries,
transferring technology, and fostering a modem perspective in the local economy.
Accordingly, privatization that brings in foreign direct investment could potentially have
multiple positive effects on the growth of developing countries (Filipovic, 2005). The
discussion above suggests the following hypotheses:
HI: Privatization is positively correlated with economic growth.
H2: Privatization is positively correlated with income distribution.
Criticisms of the Theoretical Arguments
There are many criticisms against the privatization theories. First, is the fact that basing
the privatization idea solely on economic efficiency leads the discussion to what
Ikenberry (1990, p. 106) describes as “economic reductionism.” In contrast to the
privatization theories outlined above, Avishur (2000), Kayizzi-Mugerwa (2003), and
Laffont and Meleu (1999) have argued for a positive theory of privatization to explain the
rationale for the privatization process. These authors argue that governments in most
developing countries divest their SOEs only when it is politically desirable for them to do
so.
The positive theory perspective indicates that privatization occurs only when
politicians can fetch enough shares in the newly created firms to compensate for the
private benefits they were deriving from the SOEs. Banerjee and Munger (2004) claim
that the privatization decision is based on the “net political benefits” defined as the
difference between the benefits and costs of divestiture from the perspective of the
36
Reproduced with permission of the copyright owner. Further reproduction prohibited without permission.

political elites. Privatization therefore occurs only when the present value of political
benefits from the efficiency gains are higher than the cost of redistribution (Clarke and
Cull, 2002). This argument is further echoed by Bomer (2004) who argues that the
success of privatization is dependent on efficient incentives of the political leadership.
Dinavo (1995) and Ramamurti (2000), for example, suggest that politics play the
most significant role in deciding whether to privatize or not to privatize. Biais and Perotti
(2002) claim that in most countries privatization process has taken place in a
“Machiavellian fashion”, a strategic policy to maintain power. Similarly, Stephan III
(1996) argues that rent-seeking and political patronages were the prime motivating
factors for privatization and other reforms in the former soviet type economies.
The discussion above indicates that in implementing privatization policy,
governments may have interests other than productive efficiency especially in the context
of the developing world. Starr (1988) asserts that privatization must not be seen only as a
technical instrument of policy to achieve productive efficiency but also as a political
measure of symbolic consequence. This argument is supported by Henig’s (1989) claim
that the exclusive focus on economic forces obscures the intensely political nature of the
privatization process. Henig (1989) argues that privatization initiatives are political
because they redistribute costs and benefits among diverse and competing groups in
society.
Second, there is theoretical and empirical evidence that show that efficiency is an
outcome of the market structure rather than a change of ownership per se. Mansoor
(1988) claims that significant efficiency gains from privatization are more likely to come
from measures to increase competition than an ownership change, and that ownership is
37
Reproduced with permission of the copyright owner. Further reproduction prohibited without permission.

neither necessary nor sufficient for efficiency gains. Similarly, Shapiro and Willig (1990)
and Tandon (1995) argue that without competition there will be no difference between
the private and public enterprises. This view is supported by Mendez and Glomm (2004),
who examined theoretically how privatization and deregulation of production of
intermediate products influence capital accumulation. The authors used three model
specifications in the analysis: public monopoly under government control, private
monopoly, and one where there is competition. The authors report that the benefits of
state-to-market transitions are mostly due to increased competition on the deregulated
market and that privatization of state enterprises by itself is not likely to generate
significant changes in the economy. More importantly, Mendez and Glomm (2004) show
that the model predicts that for high enough levels of public investment, a public
monopoly would be preferred to a private monopoly in terms of the resulting aggregate
income level.
Mendez and Glomm’s (2004) finding is consistent with Mansoor’s (1988)
argument that the transfer of a public monopoly to the private sector with its monopoly
power kept intact may lead to a worsening of the budgetary position. Likewise, Kay and
Thompson (1986), in a study of the privatization process in the United Kingdom claim
that private firms are not necessarily intrinsically more efficient but that market pressures
are more effective at weeding out poorly performing firms in the private sector than in
the public sector. Kay and Thompson (1986) observe that there are efficient and
inefficient private enterprises as there are in the public sector. However, they argue that if
the product market is competitive, lower efficiency is penalized by small market share
38
Reproduced with permission of the copyright owner. Further reproduction prohibited without permission.

and low profits. At the same time if capital market is effective, this in turn leads to a
withdrawal from the industry by unsuccessful firms.
Consequently, market disciplines do more to improve the private sector than the
public sector, which indicates that it is not ownership, but rather the interaction of
ownership and competition that promotes efficiency. This argument is supported
empirically by Savas’ (1977) study of refuse collection in the United States, which shows
that where competition was introduced between public and private suppliers, the
difference in costs between the two sectors was largely eliminated in a short period of
time.
Other studies also show that in some particular industries (e.g.,
telecommunications), when there is no competition or the necessary regulatory
framework, privatization may have a negative effect on performance (Wallsten, 2001).
As noted by Brett (1988), the virtues of the market in enforcing efficiency do not stem
from the fact that ownership is private but from the fact that resource allocation is
competitive. Cuervo and Villalonga (2000) also claim that though the privatization
theories indicate privatization is expected to lead to improved efficiency, on average the
variance across real world empirical tests is substantial. They explain that the variance is
due to the fact that in imperfectly competitive environments, efficiency appears to depend
more on competition and regulation than on ownership. Shapiro and Willig (1990), on the
other hand, note that the form of ownership may matter only when there is some private
noncontractible information involved.
Thirdly, other authors (Adam et al., 1992; Cook and Kirkpatrick, 2003) argue that
because of market failures, SOEs may produce socially efficient results, which maximize
39
Reproduced with permission of the copyright owner. Further reproduction prohibited without permission.
social welfare, where private managers will maximize private profits and welfare.
Likewise, Shirley and Walsh (2001) note that in developing nations and transition
economies, monopolies abound because of pervasive market failures, lack of information
and high entry costs. Further, SOEs can be used to pursue other social objectives beyond
that of addressing market failures, including: reducing income inequality; increasing
employment; and promoting regional development (Cook and Kirkpatrick, 2003).
On the other hand, Vemon-Wortzel and Wortzel (1989) assert that SOEs’
problems do not arise from ownership but from the lack of clear goals and objectives as
well as inappropriate control, motivation, and reward systems. Similarly, Brett (1988)
claims that the failure of the state to control its own servants should not be seen as an
economic problem to be solved by privatization, but rather as a political problem to be
resolved by improving the political and administrative mechanisms which have failed.
Further, Cowan (1990), argues that the turn to privatization is a reflection of a change in
the value structure of western democracies that is not necessarily transferable to
developing countries.
Finally, many other authors indicate that the probity and competence of
government is a crucial factor in ensuring the success of privatization (Meredith, 2005;
Parker and Kirkpatrick, 2005). Consequently, some of these authors promote the idea of
reform or revitalization of SOEs rather than privatization especially in the developing
countries where there is lack of well established institutional infrastructure, weak private
sector, poor public sector government, corruption and cronyism. Likewise, Flarris and
Lye (2001) argue that given the large costs associated with privatization, reforms may be
more desirable than privatization. Revitalization or reform of SOEs is based on the
40
Reproduced with permission of the copyright owner. Further reproduction prohibited without permission.
assumption that privatization is only appropriate when there is competition and
institutional capacity to regulate markets. Further, the revitalization perspective indicates
that since performance is more a function of institutional design and resource allocation
process than of ownership, it will be more appropriate to make SOEs more autonomous
and subjective to competitive pressures and market discipline (Aharoni, 1986).
The success of revitalization is dependent on the ability to immunize SOEs from
political interferences by choosing the right managers, giving them the right incentives,
and allowing them to influence results and achieve them. Aharoni (1986), however, notes
that the suggested reforms may indeed be applicable in more established democracies.
Similar to Aharoni’s (1986) view is Cook and Kirkpatrick’s (1988) argument that since
both privatization and the opening up of the public sector to domestic and international
competition have not achieved their stated objectives, the best alternative to public sector
efficiency and performance would be a focus on improvements in the internal
management of the public sector.
The discussion above suggests that the question to be asked is not whether the
private sector is more efficient than the public sector or vice versa. Rather, the issue that
needs to be addressed is identifying which of the two sectors (private or public) is more
appropriate in the production of a particular service and where necessary for the private
and public sectors to be involved in partnerships to produce and deliver goods and
services. As Savas (2000) has noted, the problem is not public versus private ownership,
but rather, monopoly versus competition. Similarly, Brett (1988) asserts that if indeed
monopoly is the central problem, then progress can only be made by trying to develop
methods to deal with the problem wherever it exists whether in the public or private
41
Reproduced with permission of the copyright owner. Further reproduction prohibited without permission.

sectors. Brett (1988) argues that if careful analysis is not done to take into account valid
insights of both paradigms (private and government ownership), the debate will be
continually shifting from one paradigm to the other. Further, Brett (1988, p.63) states:
What is needed therefore is a fundamental re-evaluation of the discipline of public administration, long associated with the mechanistic and formalistic development of the classical Weberian principles of formally rational bureaucratic organization. Instead we need a radical analysis of the way in which public authority can be organized in order to eliminate the barriers behind which officialdom has always been able to hide, to ensure that they are rewarded for performance and not simply for occupying positions and doing what they are told. And to guarantee that they will not use the monopoly power derived from the state to exclude creative alternatives which might threaten their ability to go on doing things that they find most easy and comfortable.
Finally, Starr (1988) asserts that the choice is not public or private but rather
which of the many possible mixed public-private structures works best. Obviously, we
cannot simply make a choice between state and market, because, separating the two
produces not only inadequate social science, but disastrous policy presentation in the real
world (Brett, 1988). Accordingly, portraying privatization primarily as an economic
process that is implemented in response to fiscal constraints fails to acknowledge the
considerable range of alternatives open to government actors to revitalize SOEs and the
economy as a whole. In the next section, we discuss the privatization empirical literature.
Empirical Studies
The privatization empirical literature can be divided into three main groups: firm-level,
industry-level, and country-level studies. Each will now be discussed in detail.
42
Reproduced with permission of the copyright owner. Further reproduction prohibited without permission.

Firm-Level studies
The firm-level impact of privatization is the most studied (Boubakari and Cosset, 1998,
1999; Boubakari et al., 2001; Megginson et al., 1994; Megginson and Netter, 2001).
Megginson et al. (1994) compared the pre and post financial operating performance of 61
firms from 18 countries between 1961 and 990. The authors report that privatization
resulted in increased profitability, real sales and operating efficiency. More importantly,
the authors report an increase in median and mean employment rates. However, the
authors did not find significant improvements for non-OECD countries. The main
limitation of the study is its small sample size involving only six developing countries.
Further, as Boubakari and Cosset (1998) noted, most of the firms had their headquarters
in a developed country, and hence the sample of firms studied is not representative of the
developing world.
In a later review of the privatization literature on transition economies, OECD
countries and non-transition developing economies, Megginson and Netter (2001) report
that privatization has significant positive effects on firm-level performance. The study
finds privatization’s effect on employment to be ambiguous. Boubakari and Cosset’s
(1998) study was a departure from that of Megginson et al.’s (1994) in that all the firms
were headquartered in a developing country. Boubakari and Cosset’s (1998) study
included 79 firms from 21 developing countries between the years of 1980 and 1992. The
authors report that newly privatized firms exhibit significant increases in profitability,
total dividends, operating efficiency and employment levels.
Interestingly, the authors also showed that privatization yields greater benefits for
companies operating in developing countries with high per capita income than those with
43
Reproduced with permission of the copyright owner. Further reproduction prohibited without permission.

low per capita income. In contrast to Boubakari and Cosset (1998), the Boubakari and
Cosset’s (1999) study of 16 privatized firms in five African countries indicate that
although profitability and operational performance improved after privatization,
efficiency as well as output (measured by real sales) decreased slightly but not
significantly while capital expenditures rose significantly after privatization.
On the other hand, recent firm-level empirical studies in the developing countries
indicate that the change of ownership per se may not be the prime indicator of improved
performance. For example, Boubakari et al. (2001) in studying the impact of 201
privatized firms from 32 developing countries reported that improved efficiency of firms
was associated with countries in which their stock markets and property rights were
highly developed. This finding supports the view that allocative efficiency is more a
function of market structure rather than ownership (Cook and Kirkpatrick, 1988).
Industry-Level Studies
Water and telecommunications sectors are the two most studied industries in the
developing world. Li and Xu (2002) claim that in 1980 less than 2% of the
telecommunications firms in 167 countries were privatized, but the number of privatized
telecommunications firms increased to nearly 42% in the 1990s. Li and Xu (2002) further
assert that the telecommunications industry in most countries is the fastest growing
industry because it offers positive externalities to other industries. This is primarily due to
reduction in the transaction cost for businesses.
The significance of the telecommunications industry in promoting economic
growth was studied in detail by Roller and Waverman (2001). The authors jointly
44
Reproduced with permission of the copyright owner. Further reproduction prohibited without permission.
estimated a micromodel for telecommunications investment with a macro production
function and report that there is a significant positive causal link between
telecommunication infrastructure and economic growth. The impact of privatization of
the telecommunications sector, however, is mixed. While Ros (1999) asserts that
privatization of telecommunications infrastructure is positively correlated with network
expansion, Wallsten found the opposite in a 2001 study.
Ros’ (1999) study is based on data for 110 developing and developed countries
between 1986 and 1995. Using panel data with fixed-effects estimation technique to
control for unobserved effects in their model, the authors found that privatization was
positively correlated with network expansion. The study indicates that where there was at
least 50% private ownership in the telecom firm, teledensity levels (service coverage) and
output growth rates improved significantly. Though both competition and privatization
raise efficiency, Ros (1999) asserts that privatization by itself, is sufficient to generate
efficiency gains in network expansion. An interesting finding of this study was the lack
of evidence that privatization increases network expansion or efficiency in countries with
per capita income of less than $10, 000. However, it is questionable as to whether Ros’
(1999) study can be generalized to all developing countries as only three countries in the
study’s sample have a per capita income in excess of $10, 000 (Table 6A in Appendix).
Unlike Ros’ (1999) study, the Wallsten (2001) study focused on
telecommunications firms from developing countries (14 African and 16 Latin American
countries) between 1984 and 1997. Using panel data and fixed-effects regression
techniques, the author found privatization to be negatively correlated with mainline
penetration and connection capacity. However, privatization in the midst of competition
45
Reproduced with permission of the copyright owner. Further reproduction prohibited without permission.

and regulatory framework was positively correlated with the number of per capita
mainline phones, payphones, connection capacity and a decrease in the price of local
calls.
Like telecommunications privatization, the impact of privatization of water
provision has also been mixed. While Galiani et al. (2005) claim that privatization of
water services resulted in improved performance, Bayliss (2002a) reports otherwise.
Galiani et al. (2005) studied the privatization of water services in Argentina in the 1990s
and found that privatization improved performance. The performance measure employed
was the number of deaths caused by water borne diseases, which fell by 8%, an effect
that was largest (26%) in the poorest areas. A robust check on their finding revealed that
while privatization was associated with significant reductions in deaths from infectious
and parasitic diseases, it was uncorrelated with deaths from causes unrelated to water
conditions.
On the other hand, Bayliss (2002a), in analyzing the impact of privatization of
water services in 13 Sub-Saharan African countries reports that there was no significant
improvement in performance. In Kenya and South Africa for example, privatization
contracts were terminated because of irregularities which came to light following protests
from civil society. Bayliss (2002a), however, notes that the lack of significant
improvements after privatization in the region could be attributed to the macroeconomic
instability and the poor institutional and regulatory conditions.
Like the firm-level studies, the results of the industry-level studies seem to
suggest that that the change of ownership per se (in the absence of competition) from the
46
Reproduced with permission of the copyright owner. Further reproduction prohibited without permission.

public to private sector does not necessarily lead to improved efficiency as indicated by
property rights, agency, and public choice theories.
Country-Level Studies
The empirical studies that examine the economy-wide effects of privatization as in the
firm and industry levels have been inconclusive. For example, Barnett (2000), Davis et
al. (2000) and Plane (1997) claim that privatization has a significant positive impact on
economic growth, while Cook and Uchida (2003), Filipovic (2005), and Yoder et al.
(1991) make claims to the contrary.
Barnett (2000) studied the relationship between privatization and measures of
fiscal and macroeconomic performance. The study involved 18 countries, 12 of which
were developing countries. The results show privatization to be positively correlated with
an improvement in macroeconomic performance, which was manifested in higher GDP
growth and lower unemployment. Further, a privatization of 1% of GDP was associated
with an increase in the real GDP growth rate of 0.4% - 0.5%. Similar to the Barnett
(2000) study, Plane (1997) employed Probit and Tobit estimation techniques to study 35
developing countries between 1984 and 1992 and found a significant positive effect for
privatization on economic growth. The findings of the study indicate that the positive
economic effect was stronger when privatization was accompanied by institutional
reforms. On average institutional reform increased economic growth from 0.8% to 1.5%
between the sub-periods 1984-1988 and 1988-1992.
On the contrary, Cook and Uchida (2003) found a negative correlation between
privatization and economic growth for 63 developing countries. They used the total
47
Reproduced with permission of the copyright owner. Further reproduction prohibited without permission.
proceeds from privatization between 1988 and 1997 as a share of Gross Domestic
Product. Controlling for variables that might interfere with the impact of privatization
(e.g., the size of government budget deficit and World Bank loans) the authors report a
negative, but fragile partial correlation between privatization and economic growth.
However, a robust negative correlation was found for 61 countries, when two outliers
(Malaysia and Singapore) were excluded from the study sample. Similarly, Filipovic
(2005) reports a negative but insignificant correlation between privatization and
economic growth in a study of 92 developing countries between 1990 and 2000. This
result is similar to that reported by Yoder et al. (1991) who found a negative correlation
between privatization and the economic development indicators. However, the Yoder et
al. (1991) study differs from Cook and Uchida (2003) and the other studies, as it focused
on economic development rather than economic growth.
Yoder et al.’s (1991) study is the only study that the author is aware of that deals
specifically with the issue of privatization and economic development (dealing with
social and economic indicators). Their study was based on the premise that privatization
studies must go beyond economic growth or the use of Gross Domestic Product (GDP) or
Gross National Product (GNP) in assessing development. Consequently, they employed a
comprehensive index of development, including GNP per capita income, life expectancy
at birth, literacy rate, infant mortality rate, income distributions and GNP growth rates.
Their study involved 45 countries (17 from Sub - Saharan Africa) in a cross sectional
design using the private sector level of participation in 1980 or 1981 as the independent
variable and development index (GNP per capita income, life expectancy at birth, literacy
48
Reproduced with permission of the copyright owner. Further reproduction prohibited without permission.

rate, infant mortality rate, income distributions and GNP growth rates) for 1986 as the
dependent variable.
The authors divided the 45 countries into three income groupings: low-
income (GNP of less than $450), lower-middle income (GNP between $451-1800), and
upper middle income (GNP between $1801-7500), and found that the development
indicators were highly correlated with income groupings. Further, the authors show that
there was no statistically significant relationship between the size of the private sector
and any of the development indicators. However, the study had many methodological
limitations, including the use of private sector participation as a measure of privatization
and the use of simple correlation design that does not take into account other factors that
may affect the growth process. The authors did acknowledge these shortcomings and
recommended the need for further research.
Clarke and Wallsten (2002) undertook a cross-country study that examined the
impact of privatization on social welfare. Clarke and Wallsten (2002) used household
data from around the world to examine the performance of public utilities in meeting
universal service obligations and the impacts of reform. They found that state monopolies
everywhere except in Eastern Europe failed to provide service to the poor and rural
households. Further, they argue that privatization did not harm the poor and rural
consumers, rather and in many cases privatization has led to improved access to utility
services. Clarke and Wallsten (2002) argue that even in cases where there were negative
distributional consequences, these were generally outweighed by increased access and
better regulatory systems or subsidies aimed at protecting the less favored.
49
Reproduced with permission of the copyright owner. Further reproduction prohibited without permission.

Like the firm-level and industry-level studies, recent cross-country empirical
studies in the developing countries indicate that the change of ownership per se may not
be the prime indicator of improved performance (Boubakari and Cosset, 2004;
Ramamurti, 1999; Zinnes et al., 2001). Zinnes et al. (2001), in their analysis of the impact
of privatization on economic growth in the transition economies of Eastern Europe make
the argument that change of ownership is not enough to ensure the success of
privatization. More importantly, Zinnes et al. (2001) indicate that the mere change of
ownership from the public to private sector may have a negative impact on the transition
economies. The study concludes that only when there is “deep privatization”
(privatization associated with institutional reforms) will improved performance be
assured. Similarly, Boubakari et al. (2005) on studying the impact of privatized firms in
developing countries, report that improved efficiency of firms was associated with
countries in which their stock markets were highly developed and also where property
rights were highly developed.
The empirical studies outlined above as with the previous theoretical review
indicate that there is no consensus as to the impact of privatization on economic
development. The next section discusses the limitations of the various studies.
Limitations of the Empirical Literature
Two main problems can be identified with the studies reviewed: methodology and
measures used in the study (Berthelemy et al., 2004, Bortolotti et al., 2003; Bortolotti and
Pinotti, 2003; Cook and Uchida, 2001) and the inclusion of all developing countries in
50
Reproduced with permission of the copyright owner. Further reproduction prohibited without permission.

the regression analysis (Barnett, 2000; Plane 1997, Filipovic, 2005). These limitations
will now be discussed in detail.
Inclusion of all Developing Countries in the Regression Analysis without Controlling for Regional Blocs
The empirical evidence cited for the positive impact of privatization has been that which
pertains generally to the developing world as a whole (Barnett, 2000; Plane 1997).
However, Al-Obaidan (2002) argues that the inclusion of countries in the regression
analysis that are intrinsically different may result in unacceptable statistical bias. Clearly,
developing countries in Sub-Saharan Africa, Eastern Europe, Latin America and Asia
exhibit different socioeconomic characteristics. In principle, regression analysis
necessitates observations that are drawn from a distinct population (Harberger, 1987).
Blonigen and Wang (2005), for example, in the analysis of FDI on economic growth,
argued that it is inappropriate to pool together countries of different socioeconomic
conditions and that the positive correlation between FDI and growth may have arisen
because most of the studies did not control for regional differences. Accordingly, the
inclusion of developing countries with different social and cultural characteristics
requires the regional blocs to be controlled to reduce the problem of omitted variable bias
associated with geographical differences and other region -specific factors. Controlling
for the regional blocs to identify the impact of privatization on countries from different
regions of the developing world is one of the main contributions of this study.
51
Reproduced with permission of the copyright owner. Further reproduction prohibited without permission.
Measures Used in studying Privatization and Economic Development
The inconsistencies of the impact of privatization on economic performance may be
attributed to the numerous methodologies and the abundance of measures used to
represent privatization and measures of performance. Plane (1997) noted that the problem
with inconsistent empirical results is due to the lack of a conceptual framework - thus,
the concept of privatization is not clearly defined. While Savas (2000) defines
privatization broadly as relying more on private institutions of society and less on
government to satisfy people’s needs, Plane (1997) defines it as the full transfer of
government’s property rights to private shareholders. As noted earlier, Pirie (1986)
identified more than 22 different definitions of privatization.
Associated with the definition is the problem of measurement validity with respect
to the measure used for privatization in assessing its impact. For example, Barnett (2000),
Bortolotti et al. (2003), Bortolotti and Pinotti (2003), and Cook and Uchida (2003) used
privatization revenue or proceeds as a percentage of GDP as a measure of privatization to
control for the effect of country size. However, Berthelemy et al. (2004) argue that the
use of privatization proceeds share in GDP is not the most appropriate measure for
assessing the fiscal impact of privatization. This is because the GDP figures overshadow
the privatization statistics and also the resulting ratio does not take into account the size
of the budget. Berthelemy et al. (2004) therefore suggest the use of the average annual
sales during the active period of privatization as a percentage of government revenue
(excluding grants). Further, while Barnett (2000) and Filipovic (2005) used OLS
regression techniques, Plane (1997) used Probit and Logit estimation techniques, and
Cook and Uchida (2003) employed the Extreme Bound Analysis (EBA).
52
Reproduced with permission of the copyright owner. Further reproduction prohibited without permission.

From a different perspective, Yoder et al. (1991) claim that the best measure for
privatization is the level of private sector participation in the economy (private sector
spending) as a percentage of Gross National Product (GNP). This is measured by the
inverse of the level of public sector spending as a percentage of GNP (1 - public sector
spending as a percentage of GNP). Yoder et al.’s (1991) measure of privatization has
inherent problems as it equates the private sector activity to privatization, which in reality
is not the case since the private sector measures the overall private sector activity in the
economy as opposed to the activity of the newly privatized firms. Though many
arguments have been made in favor of the various measures used, most of the current
literature on privatization used the privatization proceeds share in GDP and will be used
to assess the impact of privatization on economic growth and income inequality.
The other limitation in the study of privatization is the lack of consensus on what
is to be measured. Most of the studies reviewed equate economic development to
economic growth, which is represented by the GDP per capita income. The economic
growth measure (income per capita) is a purely income based measure which does not
take into account the extent to which the basic needs of the population are met (Meier and
Rauch, 2000). The emphasis on economic growth therefore results in a tendency to
overstate the positive outcomes of most policy changes, including privatization. This, in
turn, may lead to a disconnect between changes in individual wealth and the state’s fiscal
health (Reese and Fasenfest, 1997). As noted by Beauregard (1994, p. 271), economic
development must go beyond mere increases in income to the “ .. .enhancement of the
capacity of local citizens to act and innovate.” Malizia and Feser (2000) also made this
53
Reproduced with permission of the copyright owner. Further reproduction prohibited without permission.

point in their claim that wealth and job creation must not benefit only corporate
shareholders, but also local workers and community residents.
From a more comprehensive perspective, Lewis (1984) defines economic
development as the study of economic structure and behavior of the poor, while Sen
(1988), Chenery and Srinivasan (1988), Hirschman (1958), Kindleberger (1965), and
Stiglitz (1998) describe economic development as the transformation of society. Sen
(1988) explains economic development as the enhancement of individuals’ lives,
standard of living, common safety and each person’s happiness. Chenery and Srinivasan
(1988) explain the transformation to mean the reduction of poverty, improvements in
health and education of the population, an increase in productive capacity as well as an
increase in per capita income.
Kindleberger (1965) asserts that while growth means more output and more
efficiency, economic development goes beyond these to imply changes in the structure of
inputs and in the allocation of the inputs. Stiglitz (1998) sums up the whole idea of
development as a transformation of society that it involves a movement from traditional
ways of thinking and dealing with health and education to more modem ways. He further
states:
The changes that are associated with development provide individuals and societies with more control over their own destiny. Development enriches the lives of individuals by widening their horizons and reducing their sense of isolation. It reduces the afflictions brought on by disease and poverty, not only increasing life spans, but improving the quality of life (p.5).
Obviously, if privatization is to be seen as a policy to improve not only the
efficiency of firms but also the living conditions of the citizenry, then the preferred
54
Reproduced with permission of the copyright owner. Further reproduction prohibited without permission.

measure to assess its impact must be one that takes into consideration both economic and
social factors. Undoubtedly, if government policies are intended to identify program
improvements, then a broader examination of the policy impacts, distributional
implications, and differential social and economic effects must be undertaken (Loftman,
1995). Murphy et al. (1989) claim that most episodes of economic growth are due to high
incomes generated by any leading sector being broadly distributed that it materializes as
demand for a broad range of domestic manufacturers. As noted by Vernon (1988),
privatization may be seen as a philosophical or economic issue in developed countries,
but for most developing and transitional economies, privatization has development
imperatives.
Privatization is therefore not only an economic tool, but also has social and
political implications. Consequently, economic development, which is a measure of the
income growth and how one’s basic needs are met, is a more appropriate measure for
assessing the impact of privatization. This is because a government’s responsibility is not
only to be efficient in the delivery of service, but also to be equitable. As argued by Seers
(1969), economic development must not only create jobs but also reduce both absolute
poverty and income inequality. From a policy perspective, Hunt (1997, p. 86) states that
“ ... .income distribution is the simplest and most effective device for gaining a general
sense of a society’s prospects” and thus tells more about the state of an economy than any
other single indicator. Hence, politicians in making policy decisions are generally
concerned about both income growth and distribution implications.
Similarly, Buress (1996) argues that government policy makers have multiple
goals other than output growth and claims that the exclusive use of GNP is based on a
55
Reproduced with permission of the copyright owner. Further reproduction prohibited without permission.

“one dollar one vote” philosophy, which he said is inconsistent with the “one person one
vote” principle of democracy. According to the former Managing Director (Michael
Camdessus) of the International Monetary Fund (IMF), the primary policy objective in
the developing countries must be growth. He states that “When I refer to growth, I mean,
high quality growth, not just growth for the privileged few, leaving the poor with nothing
but empty promises” (Camdessus, 1998, p.235).
In recent times both the World Bank and IMF have all realized the importance of
considering the effects of policy on income growth, poverty, and income distribution.
This is demonstrated by the World Bank’s shift from Structural Adjustment Programs to
Poverty Reduction Strategies, while the IMF has replaced its Enhanced Structural
Adjustment Facilities (ESAFs) with the Poverty Reduction and Growth Facilities
(Bayliss, 2000b). The increasing importance of income inequality can be seen in the
current World Development Report (2006) main theme: Equity and Development. The
World Development Report (2006) emphasizes the important role of equity in economic
development and especially in poverty reduction. The report notes:
We argue that an equity lens enhances the poverty reduction agenda. The poor generally have less voice, less income, and less access to services than other people. When societies become more equitable in ways that lead to greater opportunities for all, the poor stand to benefit from a “dual dividend.” First expanded opportunities benefit the poor directly through greater participation in the development process. Second, the development process itself may become more successful and resilient as greater equity leads to better institutions, more effective conflict management, and a better use of resources in society, including those of the poor. Resulting increases in economic growth rates in poor countries will, in turn contribute to a reduction in global inequities (p.9).
56
Reproduced with permission of the copyright owner. Further reproduction prohibited without permission.

The report further demonstrates that despite there being a short-run trade-off
between equity and deficiency, equity is necessary for economic growth and long-term
development. This long term complementarily stems from the fact that with imperfect
markets, inequalities in power and wealth translate into unequal opportunities, which
leads to wasted productive potential and an inefficient allocation of resources. Even
more important is the report’s observation that income inequality which leads to unequal
power leads to the formation of institutions that perpetuate inequalities in power, status,
and health- and that typically are also bad for investment, innovation, and risk taking that
underpins long-term growth.
Because of the emphasis being placed on income distribution by the World Bank,
IMF, and other donor organizations, the evaluation of the impact of policy reforms on the
ordinary citizen has gained currency in the privatization literature (Birdsall and Nellis,
2002; Gupta et al., 1999; Mackenzie and Mookherjee, 2002; Zinnes et al., 2001). These
studies indicate that the criteria used for evaluating privatization focuses on profitability,
labor productivity, and firm growth, which do not give any information on the impact of
privatization on the citizens. Mackenzie and Mookherjee (2002) assert that market
evaluation that focuses on increase in profitability may come at the expense of customers,
workers and other social groups as a result of increased prices, lower levels of
employment, longer work hours and the neglect of environmental effects. Birdsall and
Nellis (2002) in a review of privatization literature that had focused on some measures of
welfare (employment and prices) report that privatization in general had worsened the
distribution of assets and income at least in the short term. The study, however, was
57
Reproduced with permission of the copyright owner. Further reproduction prohibited without permission.

limited to Latin-American countries and therefore the findings cannot be freely
generalized.
Gupta et al. (1999) reviewed various methods of privatization in transition
economies as well as other selected countries. The authors found that privatization
promotes economic efficiency and growth, thereby reinforcing macroeconomic
adjustment. However, privatization also led to job losses, higher prices for consumers and
dramatic widening of the income distribution, especially in transition economies. The
basic premise of these authors is that politics trumps economics and hence redistributive
issues are of major concern in policy making.
What these studies reveal as noted by Cling et al. (2006) is the fact that equity is
an intrinsic part of development, where development is seen as extending beyond the
merely economic (level of GDP per capita) to encompass respect for human rights, of
which equal opportunities and the absence of absolute poverty are an integral part. None
of the country-level studies have so far concentrated on studying both the broader
economic and social impacts of privatization in developing countries during the active
years of privatization. This is the specific gap that this dissertation proposes to fill.
The central theme of this study is that the impacts of policy reforms and for that
matter privatization, has both economic and social consequences and hence these
outcomes (economic growth and income inequality) need to be evaluated. In extending
the literature to the distributional impact, the authors are quick to point out that it does
not wholly resolve the issue of the determinants of economic development. However, in
doing so, it adds to our understanding of the development process and how it is affected
by policies such as privatization. Accordingly, this dissertation does not question the
58
Reproduced with permission of the copyright owner. Further reproduction prohibited without permission.

relevance of the output growth measure, but argues that taking only an aggregated view
of incomes does not tell the whole story of economic development.
Further, the focus on income distribution is especially important given the nature
of the current backlash in many countries against further privatization. The backlash is
nurtured by the widespread view that the effects of privatization have been to enrich the
already rich and powerful, and sometimes corrupt at the expense of the poor (Nellis and
Birdsall, 2005). Obviously, identifying the validity of the effects of privatization on the
ordinary citizen is important because high levels of income inequality may not only slow
growth but also promote political instability (Baliamoume-Lutz, 2004). In accordance
with the discussion above, this study examines the impact of privatization on both
economic growth and income inequality in developing countries. The methodology and
data used in the analyses are discussed in the next section.
Reproduced with permission of the copyright owner. Further reproduction prohibited without permission.
59

CHAPTER 4
METHODLOGY
The unit of analysis for the study is at the country level. The study employs a cross -
sectional design in an effort to examine the impact of privatization on economic growth
and income inequality. The sample consists of developing countries that the World Bank
Privatization Database provides data on their privatization program between 1991 and
2002. The study employs ordinary least regression analysis with interaction regressors to
examine the impact of privatization on economic growth and income inequality in
developing countries. The data are annual observations for a sample of 80 developing
countries. There is no consistent time series data on the privatization variable for the
sample of countries studied and therefore we follow the usual practice in previous
research using cross-country regressions with respect to economic growth and
privatization. The averages of the variables over the period of the study are used to help
reduce the noise in the annual data (Cook and Uchida, 2003; Filipovic, 2005; Gyimah-
Brempong and Camacho, 2006; Plane, 1997). The models for the empirical analyses for
the study are discussed below.
Model Specification
The main goal of this study is to examine the impact of privatization on economic growth
and income inequality. The empirical analysis for the study is based on prior privatization
and economic growth literature (Barnett, 2000; Cook and Uchida, 2003; Plane, 1997;
60
Reproduced with permission of the copyright owner. Further reproduction prohibited without permission.

Filipovic, 2005). The basic regression analysis for the cross section of 80 countries is
specified below. The study adopts the basic growth equation as has been used in earlier
privatization studies and postulates that:
Y = ao + aiB + a2Z + a3M + u (1)
where Y is the average Real GDP per capita growth rate; djS are the coefficients to be
estimated. B is a set of variables including; the stock of human capital (SEC), degree of
openness of the economy (OPEN), initial level of development (LGCAP), population
growth rate (POP), rate of inflation (INF), and foreign direct investment (FDI). M is the
economic policy being studied, which in this case is the privatization variable (PR). Z is a
set of additional variables that are included to capture the country conditions, which
literature suggests have an impact on economic growth. The country conditions are
proxied by the institutional or governance infrastructure and geographical conditions
(whether or not a country is landlocked) and u is the stochastic error term.
To examine whether the impact of privatization in developing countries is
sensitive to the type of countries included in the sample or regional differences, we
control for the regional blocs. The regression model for controlling for the regional
groups is specified as follows:
Y = a 0 + a i B + a 2 Z + a 3 P R + a 4Di+u (2)
61
Reproduced with permission of the copyright owner. Further reproduction prohibited without permission.

D is a dummy for regional groups: Sub- Saharan Africa (SSA), Latin America (LA), Asia
(AS), and Middle Eastern and North African Countries (MENA), where:
LA = [ 1 if Latin American country; 0 otherwise]
SSA = [ 1 if Sub-Saharan African country; 0 otherwise]
AS = [1 if Asian country; 0 otherwise]
To prevent perfect collinearity (where one of the regressors is an exact linear function of
the other regressors) problems, only three of the categories or regional groupings are
entered in the regression equation at a time. Thus, for J number of categories, the number
of categories to be entered in the regression equation is J-l. The group left out is called
the reference group (Stock and Watson, 2003). The reference or comparison group is the
group of countries in the sample that are members of MENA. The coefficient for a
dummy variable measures the difference in values between the region in question and the
reference group.
Further, to capture possible regional differences in the growth effect of
privatization, we include the cross product of the privatization and the regional dummies
(PR Dj) in the regression, which is specified as follows:
Y = a o + aiB + a 2Z + a3PR+ a 4 Dj + a5PR Dj + u (3)
The impact of privatization on the reference group will be indicated by the coefficient for
PR, whereas the coefficient for the interaction term PRD; captures the difference in the
impact of privatization between the region in question and the reference group.
62
Reproduced with permission of the copyright owner. Further reproduction prohibited without permission.
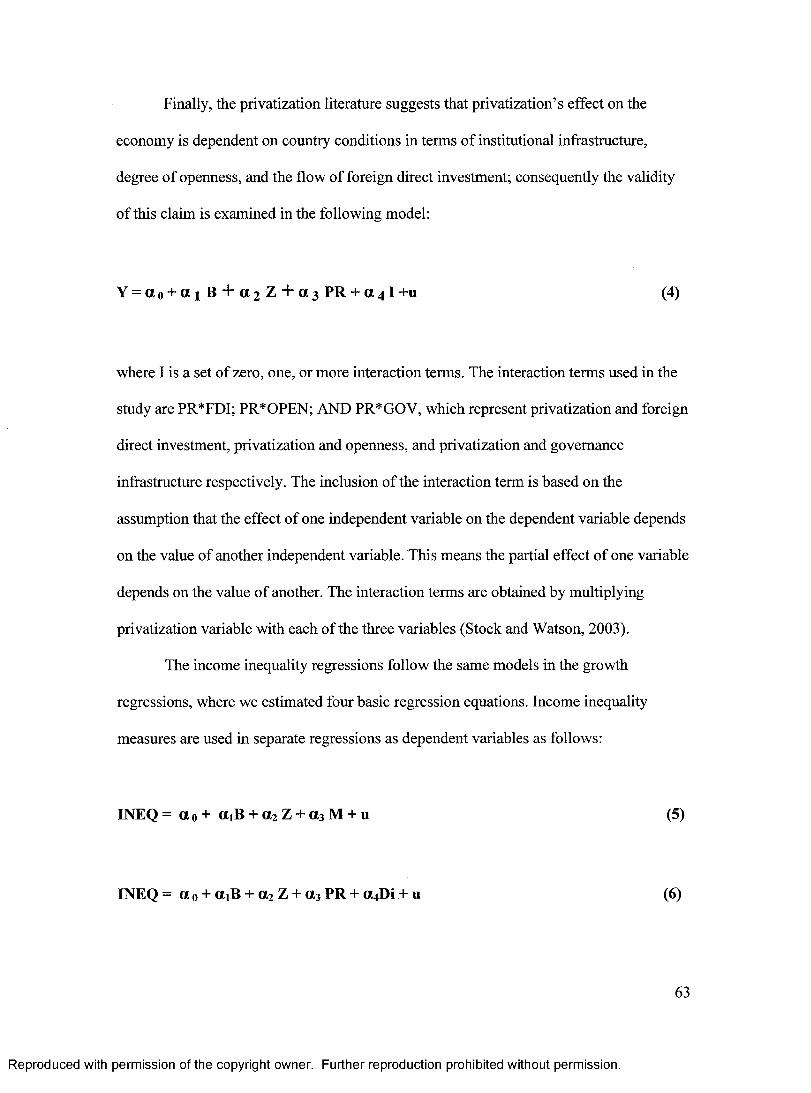
Finally, the privatization literature suggests that privatization’s effect on the
economy is dependent on country conditions in terms of institutional infrastructure,
degree of openness, and the flow of foreign direct investment; consequently the validity
of this claim is examined in the following model:
Y = a 0 + a i B + a 2 Z + a 3 P R + a 4 l + u (4)
where I is a set of zero, one, or more interaction terms. The interaction terms used in the
study are PR*FDI; PR*OPEN; AND PR*GOV, which represent privatization and foreign
direct investment, privatization and openness, and privatization and governance
infrastructure respectively. The inclusion of the interaction term is based on the
assumption that the effect of one independent variable on the dependent variable depends
on the value of another independent variable. This means the partial effect of one variable
depends on the value of another. The interaction terms are obtained by multiplying
privatization variable with each of the three variables (Stock and Watson, 2003).
The income inequality regressions follow the same models in the growth
regressions, where we estimated four basic regression equations. Income inequality
measures are used in separate regressions as dependent variables as follows:
INEQ = a 0+ «iB + a2 Z + a3 M + u (5)
INEQ = a 0 + aiB + a2Z + a 3 PR + a4Di + u (6)
63
Reproduced with permission of the copyright owner. Further reproduction prohibited without permission.
INEQ = a 0+ aiB + a 2Z + a 3 PR + a 4Di + a 5PRDi + u
INEQ = a 0 + aiB + a 2 Z + a 3 PR + a 4l + u
(7)
(8)
where INEQ refers to the income inequality measures (INEQ 10% and INEQ 20%),
which will be used as dependent variables in separate regressions. The other notations (a,
B, PR, Z, I, PR*Di, and u) have similar explanations as those in the growth
regressions. However, we include an additional variable; the square of the level of
development measure as one of the B variables to capture the fact that the relationship
between income inequality and level of development is curvilinear rather than linear.
This argument follows the traditional Kuznets’ (1955) hypothesis which indicates that
income inequality initially increases with development, but in the long run it decreases.
Data
The study analyzed the impact of privatization on economic growth and income
inequality in 80 developing countries using data from 1991-2002. Though the World
Bank Privatization Database (2005) provides privatization transactions and proceeds
between 1988 and 2003, this study focuses on the period between 1991 and 2002, as this
is the period in which most privatization activity occurred in developing countries. Table
1A and 2A in the Appendix gives the privatization, economic growth rates, and income
inequality data respectively. The data are annual observations for a sample of 80
developing countries: 33 from SSA; 22 from Latin America; 12 from Asia; and 13 from
North Africa and the Middle East. Because of data limitations, not all countries had
consistent data over the period of the study. The data set has complete observations for
64
Reproduced with permission of the copyright owner. Further reproduction prohibited without permission.

75 countries for the growth regressions and 60 countries for income inequality
regressions.
The variables, symbols, and sources of data collection are summarized in Table
3 A in the Appendix). The list of landlocked countries is given in Table 4A and the
complete data used in the analyses are given in Tables 5 A and 6A of the Appendix. The
variables used in the study are described next.
Dependent Variables
Economic growth and income inequality are the dependent variables for this research and
are used in separate regressions. Economic growth is proxied by the per capita rate of
growth of real GDP during the study period (1991-2002). The use of real GDP per capita
is important because it is inflation adjusted and consequently reflects the real value of
goods and services compared to using the GDP per capita. With respect to income
inequality, two main measures have been used: the Gini index and the share of income
groups of individuals from their population share.
Though, both measures have limitations (Muller, 1984), the Gini provides a
summary measure over the entire range of the populations and may therefore be
insensitive to the degree of inequality in particular ranges (Ahluwalia, 1974). Allison
(1978) argues that the Gini tends to be most sensitive to transfers around the middle of
the distribution and the least sensitive to transfers among the very rich or the very poor.
Consequently, we use the ratio of the income share of the richest 20% and the poorest
20% of population (INEQ20%) and the ratio of the share of income going to the richest
and poorest 10% of the population (INEQ 10%). These measures of inequality explain
65
Reproduced with permission of the copyright owner. Further reproduction prohibited without permission.
how the lower and upper end income populations benefit from privatization. A positive
coefficient on these measures indicates increasing inequality and a negative coefficient
explains otherwise
Independent Variables
The choice of explanatory variables was informed by prior literature (Barnett, 2000;
Cook and Uchida, 2003; Filipovic, 2005; Plane, 1997). Privatization revenues as a
percentage of GDP; log of the initial real GDP per capita (LGDCAP), square of LGCAP
(LGCAPSQ), log of the inflation rate, population growth rate, trade share in GDP;
secondary school enrollment, geographical location, governance infrastructure or
institutional quality and FDI share in GDP. The initial level of development and the rate
of inflation variables were transformed (log transformation) because the raw data were
highly skewed.
The main independent variable of interest is privatization, which is proxied by the
total privatization revenues (1991-2002) as a percentage of average GDP (1991-2002).
The use of the aggregate privatization revenue over the study period is based on the
assumption that the effect of privatization is not instantaneous and that the benefits of
privatization for a given year will depend on the overall level of privatization that has
taken place (Filipovic, 2005). The period between 1991 and 2002 was chosen because
most reports on privatization in the developing countries show that privatization picked
up at the end of the 1980s and peaked at the end of the 1990s (World Bank Privatization
Database, 2005). Consequently, focusing on this time period will help to provide more
information as to the impacts of privatization in developing countries. From the
66
Reproduced with permission of the copyright owner. Further reproduction prohibited without permission.
efficiency gains associated with privatization as explained by the property rights, public
choice, and agency theories, a positive effect of privatization is expected on both
economic growth and income distribution.
The LGCAP controls for the initial level of development at the beginning of
privatization. Some other studies have used GDP per capita as the measure of level of
development; however, this has a comparability problem in cross-country regressions.
Since it involves the use of official exchange rate in converting GDP measured in
domestic currency to GDP measured in dollars, and consequently it does not reflect the
real purchasing power of different countries (Tsai, 1995). The use of real GDP per capita,
which is inflation adjusted, therefore helps to overcome this problem. Further, a log
transformation is employed because of the wide variations in GDP per capita of the
various developing countries. For example, the lowest GDP per capita for the group of
countries studied is Tanzania with a real GDP per capita of $494.12 and Saudi Arabia
with the highest GDP per capita of $16,368.92. The descriptive statistics show a standard
deviation of $3074.23, which is nearly ten times the value of the GDP per capita of
Tanzania.
LGCAPSQ is an additional variable that is included in the income inequality
regressions as the level of development and income inequality is hypothesized to exhibit
a curvilinear relationship (Ahluwalia, 1976; Kuznets, 1955; Sylwester, 2005; Tsai, 1995).
Income inequality is therefore expected to increase initially but over time, continual
growth will lead to a reduction in income inequality. We therefore expect LGCAP to be
positive and LGCAPSQ to be negatively correlated with income inequality. Human
capital is proxied by the secondary school enrollment, which captures the degree of
67
Reproduced with permission of the copyright owner. Further reproduction prohibited without permission.

human capital improvement beyond the basic level of education (Ahluwalia, 1976). It is
expected the human capital variable will have positive effects on both economic growth
and income distribution (Makki and Somarwu, 2004).
The trade (exports plus imports) share as a percentage of GDP is a proxy for the
degree of openness of a country’s economy. The globalization literature suggests that
openness promotes growth, however, openness also increases income disparities between
countries. Consequently we expect the openness to exert a positive effect on economic
growth and a negative effect on the distribution of income. Population growth rate
controls for the fact that the benefits of an economic policy may be diluted by high
population growth rates (Bomschier et al., 1978). The ratio of FDI to GDP is included on
the assumption that FDI may play a significant role in generating positive spillover
effects in terms of new technologies and management skills that contribute to growth
(Sylwester, 2005). Many studies, however, indicate that FDI is negatively correlated with
the distribution of income (Dixon and Boswell, 1996a, 1996b; Beer, 1999).
Consequently, we expect a positive effect of FDI on growth and a negative effect on the
distribution of income respectively.
The inflation rate over the study period is included to capture the consistency of
monetary and fiscal policies, as large structural fiscal imbalances may lead to debt
monetization and higher inflation rates. Major international institutions focus on
controlling inflation as a mechanism for boosting long economic Growth. Romer and
Romer (1998) claim that inflation may hurt the poor more than the rich, because the rich
have other financial instruments that they use to hedge themselves against the negative
68
Reproduced with permission of the copyright owner. Further reproduction prohibited without permission.

effects of inflation. Consequently, we expect inflation to be negatively correlated with
economic growth and positively correlated with income inequality.
Geography has gained a lot of prominence in recent growth literature (Acemoglu
et al., 2003; Crafts and Venables, 2001; Henderson et al., 2000; Redding and Venables,
2004; Sachs, 2003). These authors argue that the direct effects of geographical location
explain a large portion of the variance in the income per capita across countries. Redding
and Venables (2004), for example, claim that remoteness of markets and sources of
supply explain why many developing countries have not benefited from the globalization
process. The geographical variables that have been used in cross-country growth
regressions include climate zone, disease ecology, and whether or not a country is
landlocked. In this study, a landlocked measure is employed, which is a dummy variable
showing whether or not a country has a coastline or has access to the sea or ocean.
Obviously, lack of territorial access to the sea, remoteness and isolation from world
markets will lead to high transit costs and impose constraints on the overall socio
economic development of the landlocked country. Being landlocked is therefore expected
to have a negative effect on economic growth and a positive effect on income inequality.
The list of landlocked countries is given in Table 4 A of the appendix.
An additional variable that measures the level of institutional quality or
governance infrastructure is included in the regression analysis as most authors argue that
good institutions promote growth (Olson et al., 2000; Rodrik et al., 2004). The concept of
governance is not concise and many authors define the term in various ways. In this study
we employ the governance definition by the World Bank (1992). Governance is defined
as the process by which authority is exercised in the management of a country’s
69
Reproduced with permission of the copyright owner. Further reproduction prohibited without permission.

economic and social resources and the capacity of government to design, formulate, and
implement policies. Good governance is therefore expected to promote economic growth
and reduce income inequality.
Kaufmann et al.’s (2005) six governance indicators were used as proxies for
governance or institutional quality for two main reasons. First, the indicators are
aggregates of many indices and therefore measurement error may be less as compared to
individual indicators. Second, there are data points for many countries compared to the
governance ratings by other agencies like the International Country Risk Guide or
Business Environmental Risk Intelligence. It is important to note that we used the newest
version of Kaufmann et al.’s (2005) governance indicators as they replace the older
versions (1999; 2003).
The scores of the six governance indicators lie between -2.5 and 2.5, with higher
scores corresponding to better governance. The six Kaufmann et al.’s (2005) governance
indicators are defined below:
• Voice and Accountability (VOICE) measures the extent to which citizens of a
country are able to participate in the election of their governments.
• Political stability (POLST) measures the absence of violence and the likelihood
that a government in power will not be overthrown by unconstitutional means and
or by violence.
• Government effectiveness (GOVEFF) is a measure of the quality of the public
service-quality of the bureaucracy, competency of civil servants, independence of
civil service from political and governments commitment to its policies.
70
Reproduced with permission of the copyright owner. Further reproduction prohibited without permission.
• Regulatory quality (REG) focuses on the extent of market friendly policies like
price control or banking supervision, and also perceptions of the burdens imposed
by excessive regulation.
• Rule of Law (RULE) indicator measures the extent to which citizens have
confidence in and abide by the rules of society.
• Control of corruption (CORR) measures perceptions of corruption, defined as the
exercise of public or state power for private gain.
Data Analysis
Table 2 presents summary statistics for the main economic variables of interest. The
summary statistics indicate that the growth rates for the various countries varied between
-3.22 for (Zimbabwe) and 9.78 (Qatar) between 1991 and 2002. The highest and lowest
privatizers in terms of the privatization proceeds as a percentage of GDP for the period
are both in Sub-Saharan Africa (Zambia and Sao Tome and Principe). The average
privatization proceeds as a percentage of GDP for the four regions are as follows: Sub-
Saharan (3.64); Latin America (5.29); Asia (2.18); and Middle Eastern and North African
countries (2.96). The inflation rate and initial GDP per capita show wide variations,
which therefore required their being transformed (log transformation) to reduce any bias
that the large differences might create. There is also wide variation in the corruption
index, which ranged from -2.12 for Angola to 2.65 for Chile. The sample therefore is
made up of countries that are perceived to have good institutional infrastructure as well as
those with poor institutional infrastructure. The values quoted for the governance index
71
Reproduced with permission of the copyright owner. Further reproduction prohibited without permission.

are the principal component values, which explain why Chile’s value is higher than the
2.5 maximum as reported by Kaufmann et al. (2005).
Table 2: Summary Statistics
Variable Number of
observations
Minimum Maximum Mean Std Dev
Rate of inflation 80 .17 891 38.85 131.22
Log INF 80 -.77 2.95 1.03 .57
Growth 80 -3.22 9.78 3.31 2.33
Privatization
revenues in GDP80 . 0 0 24.26 3.84 4.98
Income Inequality
(1 0 %)60 6.60 105.00 27.15 21.97
Income Inequality
(2 0 %)60 4.30 57.60 13.15 9.45
Population 80 .44 7.35 1.95 .89
Foreign Direct
Investment77 -1.60 14.94 2.73 2.84
Trade share in
GDP80 21.83 204.54 71.74 35.29
Log GDP per
capita77 2.69 4.21 3.38 .36
Square of LGCAP 77 7.26 17.76 11.57 2.48
Secondary school
enrollment80 5.55 97.82 46.97 25.87
Governance 71 -2 . 1 2 2.65 -.049 .933
The initial correlation matrix for the governance indicators shows that they are
highly correlated with each other at the 1% level, with a coefficient between 0.403 and
72
Reproduced with permission of the copyright owner. Further reproduction prohibited without permission.

0.898 (Table 3). This means that all of the six indicators cannot be used in the same
regression, because of multicollinearity problems. Consequently, following Globerman
and Shapiro (2003), a summary measure that is utilized was from their first principal
component, denoted as GOV. The individual indicators are also used in separate
regressions to check for the robustness of the relationship between governance and
economic growth and income inequality.
Table 3: Correlation Matrix for Governance Indicators
VOICE POLST GOVEFF REG
VOICE 1 .0 0
POLST .530 1 .0 0
GOVEFF .403 .698 1 .0 0
REG .604 .569 .752 1 .0 0
LAW .425 .674 .898 .737
CORR .440 .671 .883 .678
LAW CORR
1.00
.898 1.00
Table 4 displays the correlation matrix for the variables. The correlation matrix shows
that privatization is negatively correlated with economic growth, while it is positively
correlated with both measures of income inequality. In both cases, however, the
coefficients do not reach the level of significance. The governance variable is negatively
correlated with economic growth and positively correlated with income inequality. Like
the privatization variable, none of the governance coefficients were significant. This
73
Reproduced with permission of the copyright owner. Further reproduction prohibited without permission.

might be an example of a situation where a strong relationship between the two variables
can only be revealed after controlling for other variables in the regression equation
(Gyimah-Brempong, 2002). Population growth rate is positive and significantly
correlated with economic growth, but negative and insignificantly correlated with both
income inequality measures. On other hand, FDI is positive and significantly correlated
with both income inequality measures but positive and insignificantly correlated with
economic growth. The landlocked variable is negatively correlated with economic growth
and positively correlated with income inequality, but the coefficients are not significant.
In the next chapter, the results of the ordinary least regression estimation of the
models specified above are presented and discussed.
Reproduced with permission of the copyright owner. Further reproduction prohibited without permission.
74
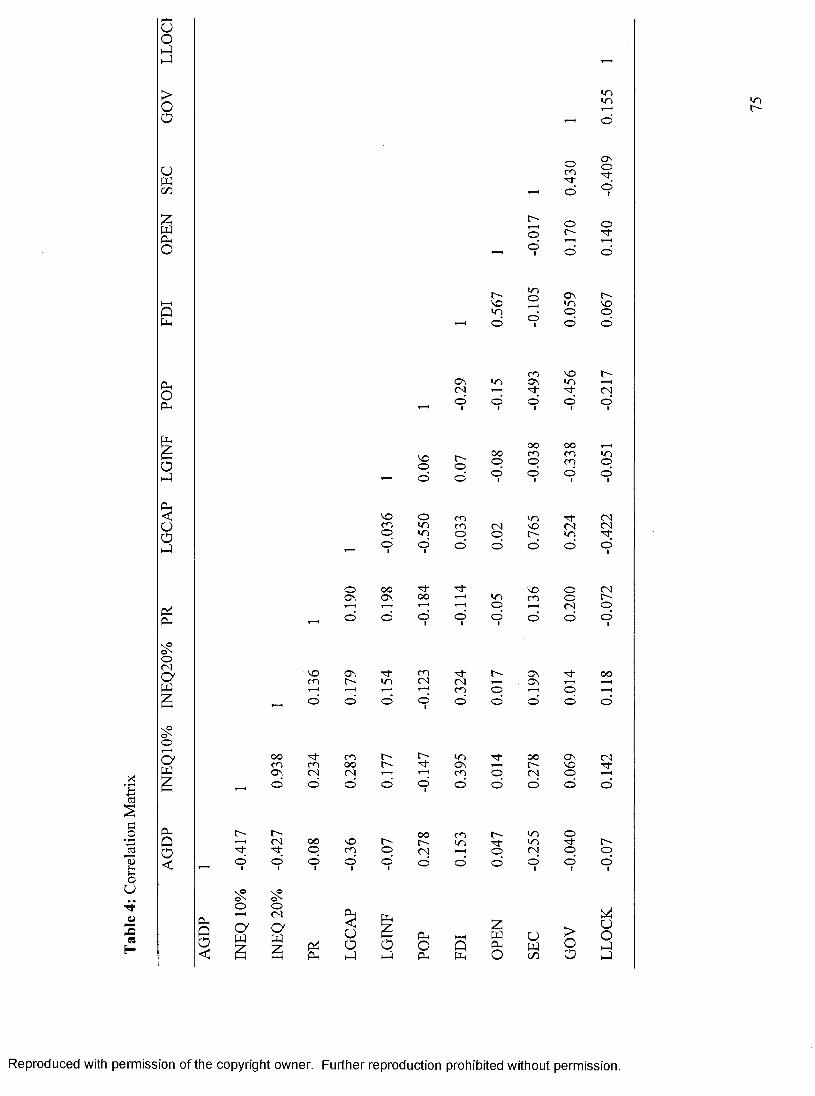
Tabl
e 4:
Corre
latio
n M
atrix
LL
OC
IG
OV
— 0.15
5
SEC
0.43
0 OVo•^r©t
OP
EN
-0.0
17 o
©
o
o
MQ
O«nGOO ovino
r -ooto 1—H o o1 © o
POP ov
CMIT) CO
0 \Tj-voin r -
CM
1—H o ’1 o1 o1 o ’■ o ’1
LG
INF
_NOoo 0.
07
-0.0
8
-0.0
38
-0.3
38
-0.0
51
LG
CA
P
VOCOooGOgo
c or oO CMO
inor -
CMinCMCM"Vt
o1 o1 o o o o Oi
PR
oo vr-H
ooOV1—H
Tj"0 0 T—H....< VOo
oc n
ooCM
CMr -o
o o o1 o1 ot O o ©1
OCMaw
VOmi—l
ovt > GO
H
c o<N1—H
r tCMCO
C"*-1—Io
OVOV
T f
ooo
§ o o o o1 O o o © ©
0 s-OO 'w
0 0c oon
c oCM
c oooCM
oC-"t—4 1“ H
GOONc o o
oor -CM
OvOoCM
§ —o O O o o1 o o O © ©
AG
DP
1—H’mJ"
c -cm 0 0o VO
COt >o
ooc^*CM
COGO
t "
oin in CM
oTl-o C-"o
o1
o1 o1 o1 ©1 o o o o1 ©1 ©1
AG
DP
INEQ
10
%
INEQ
20
%
PR LG
CA
P
LG
INF
POP
FDI
OP
EN
SEC
GO
V
LL
OC
K
Reproduced with permission of the copyright owner. Further reproduction prohibited without permission.

CHAPTER 5
RESULTS
This section presents and discusses the results of the study, the implications of the
findings, directions for future research, and offers concluding remarks.
Privatization and Economic Growth Regressions
The study employed Ordinary Least Squares (OLS) with interaction regressors to
examine the impact of privatization on economic growth and income inequality. The
privatization and growth regression results are reported in Table 5. Privatization is
negative but insignificantly correlated with economic growth (Columnl). This finding is
different from most of the studies reviewed in this study. While Plane (1997) and Barnett
(2 0 0 0 ) find a significant positive correlation between privatization and economic growth,
Cook and Uchida (2003) report a significant negative effect of privatization on economic
growth.
Consequently, to examine whether the negative insignificant effect of
privatization on economic growth is due to a specification error or the omission of
region-specific factors, the regional groupings are controlled for and the results are
reported in Column 2. The coefficient of the privatization variable remains unchanged
indicating that the negative effect is not due to a possible mis-specification associated
76
Reproduced with permission of the copyright owner. Further reproduction prohibited without permission.
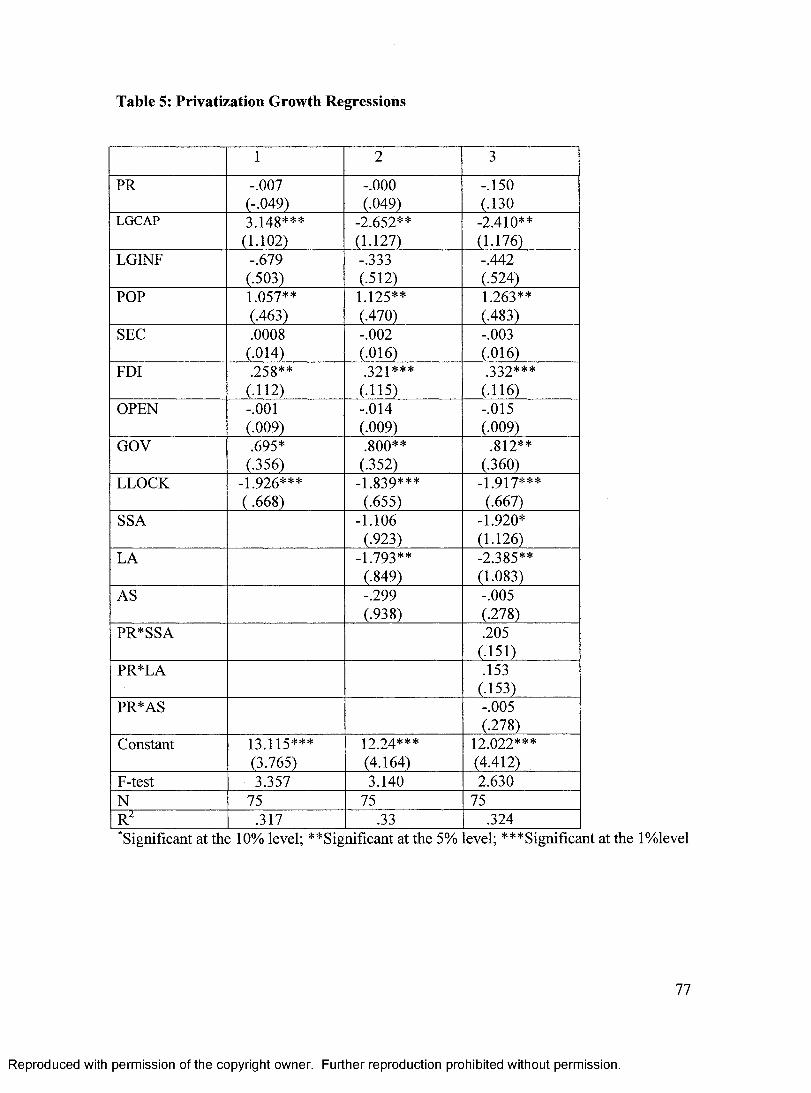
Table 5: Privatization Growth Regressions
1 2 3
PR -.007(-.049)
- .0 0 0
(.049)-.150(.130
LGCAP 3.148***(1 .1 0 2 )
-2.652**(1.127)
-2.410**(1.176)
LGINF -.679(.503)
-.333(.512)
-.442(.524)
POP 1.057**(.463)
1.125**(.470)
1.263**(.483)
SEC .0008(.014)
- .0 0 2
(.016)-.003(.016)
FDI .258**(.1 1 2 )
321***(.115)
332***(.116)
OPEN - .0 0 1
(.009)-.014(.009)
-.015(.009)
GOV .695*(.356)
.800**(.352)
.812**(.360)
LLOCK -1.926*** ( . 6 6 8 )
-1.839***(.655)
-1 917*** (.667)
SSA -1.106(.923)
-1.920*(1.126)
LA -1.793**(.849)
-2.385**(1.083)
AS -.299(.938)
-.005(.278)
PR*SSA .205(.151)
PR* LA .153(.153)
PR* AS -.005(.278)
Constant 13.115***(3.765)
12.24***(4.164)
1 2 .0 2 2 ***(4.412)
F-test 3.357 3.140 2.630N 75 75 75Rz .317 .33 .324Significant at the 10% level; ** Significant at the 5% evel; ***Significant at the l%level
77
Reproduced with permission of the copyright owner. Further reproduction prohibited without permission.

with regional differences. Column 2 shows that all the regional dummies have a negative
correlation with growth; however, the coefficient on the Latin American dummy is
significant at the 5% level.
The interaction of privatization with the regional dummies shows that
privatization is positively correlated with economic growth in Sub-Saharan Africa and
Latin America but negatively correlated with growth in Asia (Column 3). However, in all
cases the effect is not significant. Further, the privatization variable (PR) which captures
privatization’s effect on the reference group (MENA countries) is negative but
insignificant. Two main conclusions can be drawn from these findings. First, there is no
difference in the effect of privatization in Sub-Saharan Africa, Latin America and the
Middle East and North African countries on one hand, and Asia and Middle East and
North African countries on the other. Second, privatization did not have a significant
impact on economic growth in the developing countries studied between 1991 and 2002.
The initial real GDP per capita is negative and significantly correlated with
growth in all the model specifications (Columns 1 through 3), which supports the
hypothesis that countries at a lower of level of development grow faster and over time
catch up with countries at a higher level of development (Barro, 1991; Datta and
Agarwal, 2004). The human capital variable (SEC) is positively correlated with economic
growth (Column 1), but on the inclusion of the regional dummies, the SEC coefficient
becomes negative. The inflation variable (LGINF) is negative but insignificantly
correlated with economic growth, with and without the regional controls. Population
growth rate is positive and significantly correlated with growth (with and without the
regional dummies at the 5% level. This finding suggests that the population growth rate
78
Reproduced with permission of the copyright owner. Further reproduction prohibited without permission.

contributed to growth of the developing countries between 1991 and 2002. Foreign direct
investment is positive and significantly correlated with growth (Column 1) at the 5%
level and at the 1% level when the regional blocs are controlled for (Column 2).
Openness is negative but insignificantly correlated with growth in both
regressions with and without the regional groupings. Thus, openness did not have a
significant effect on growth over the study period. The landlocked variable is negative
and significantly correlated with economic growth at the 1% level (Column 1). This
means that being landlocked is associated with a penalty of -1.92, or 2% lower growth
rates than those countries that are not landlocked. When the regional blocs are controlled
for, the coefficient on the landlocked variable is still significant at the 1% level (Columns
2 and 3), which means that the negative growth effect of being landlocked is not sensitive
to regional location. Further, the study’s results indicate that after controlling for
institutions, being landlocked still has a significant negative effect on economic growth.
This result contradicts Rodrik et al.’s (2004) and Easterly and Levine’s (2002) assertion
that after controlling for institutions, geography does not have an effect on growth.
However, Bosker and Garretsen (2006), Redding and Venables (2004) and Sachs (2003)
report results that are similar to this study’s findings.
The governance variable is positive and significantly correlated with growth at the
10% level (Column 1), but when the regional blocs are controlled for, the significance
improves to the 5% level (Columns 2 and 3). To check for the robustness of the
relationship between governance and economic growth, we use the individual indicators
rather than the composite measure of governance and the results are reported in Table 6 .
The results show that three indicators; government effectiveness (Column 6 ), rule of law
79
Reproduced with permission of the copyright owner. Further reproduction prohibited without permission.

Table 6: Growth Regression with Individual Governance Indicators
4 5 6 7 8 9PR .014
(.050)-.003(.049)
-.012(.048)
.002(.053)
.014(.049)
-.008(.047)
LRGCAP -2.515**(1.118)
-2.603**(1.075)
-3 149*** (1.066)
-2.769**(1.139)
-3.439***(1.097)
-3.13***(1.081)
LGINF - 1.0 2 1 **(.485)
-.825(.496)
-.470(.511)
-.936(.505)
-.471(.511)
-.684(.481)
POP .778(.468)
.973(.465)
1.077**(.449)
.815*(.456)
1.190(.462)**
1.114**(.453)
SEC .002(.009)
-.001(.015)
-.007(.014)
.001(.015)
.019(.014)
.003(.014)
FDI .265(.115)
.266**(.113)
.245**( .110)
.260**(.115)
.272**(.109)
.244**(-110)
OPEN -.009(.009)
-.012(.009)
-.009(.009)
-.009(.009)
.011(.009)
-.009(.009)
LANLOC -1.812**(.694)
-1.865***(.675)
1.811***(.654)
-1.869***(.685)
-1.985***(.656)
1.846***(.653)
VOICE -.096(.408)
POLST .521(.57)
GOVEFF 1.488***(.585)
REG .318(.539)
LAW 1.549**(.613)
CORR 1.514**(.594)
Constant 11.415**(3.897)
11 684*** (3.733)
13.288***(3.676)
12.315***(3.958)
14.173***(3.757)
13.862***(3.722)
F-Test 2.781 3.100 3.767 2.826 3.756 3.771N 75 75 75 75 75 75R2 .278 .300 .343 .281 .342 .343Significant at the 10% level; ** Significant at the 5% level; ***Significant at t le l%level
80
Reproduced with permission of the copyright owner. Further reproduction prohibited without permission.

(Column 8 ), and corruption (Column 9) are all significant at the 5% level.
The cross product results are reported in Table 7. The inclusion of PR*FDI,
PR* OPEN, and PR* GOV, which represent the interaction of privatization with foreign
direct investment, openness, and governance respectively do not lead to appreciable
changes in the results. A few of the results, however, are worth examining further. First,
the same variables (level of development, population growth, foreign direct investment,
landlocked and governance variables) are significant in most of the regressions. Second,
the inclusion of the interaction variables did not affect the model fit, ranging from .325 to
0.351. Third, PR*GOV and PR*FDI are positively correlated with economic growth,
while PR* OPEN is negatively correlated with economic growth. In all cases, however,
the coefficients are not statistically significant. When the interaction regressors were
entered two at a time, though the cross product variables were not significantly correlated
with growth, the PR variable changed from negative and insignificant to positive and
insignificant.
It is important to note that we did not include the PR* FDI and PR* OPEN in the
same regression equation because the two variables are highly correlated, with a
coefficient of 0.759. Also the correlation matrix shows a correlation between PR and
PR*OPEN (coefficient of .779) and PR*FDI (coefficient of 0.824) and therefore in
Column 16, the cross products are entered without the privatization variable. The results
show that both interaction regressors are not significantly correlated with economic
growth.
81
Reproduced with permission of the copyright owner. Further reproduction prohibited without permission.

Table 7: Privatization Interaction Growth Regressions
10 11 13 14 15 16PR -.065 .103 -.065 .077 -.087
( .121) (.098) ( .121) ( .102) (-123)LGCAP -3.030*** -3.306*** -3.030*** -3.408*** -3.162 -3.307***
(1.131) (1.103) (1.131) ( 1.110) (1.136) (1.113)LGINF -.569 -.748 -.569 -.736 -.557 -.722
(.547) (.503) (.547) (.504) (.547) (.493)POP 1.090** .854* 1.090** .852 1.068** 1.038
(.470) (.496) (.470) (.486) (.470) (.466)SEC -.001 .001 -.001 .001 -.001 -.001
(.014) (.014) (.140) (.014) (.015) (.014)FDI .258** .354** .259** .347 .270** .257**
(.114) (.133) (•111) (.134) (.114) ( .112)OPEN -.015 -.010 -.012 -.012 -.017 -.011
(.012 ) (.009) (.009) (.009) (-102) (.009)GOV .689* .661* .571 .558 .564 .561
(.358) (.355) (.374) (.373) (.376) (.375)LANLOC -1.964*** 1.692** -1 9 1 4 *** -1.703** -1 9 5 3 *** -1 913***
(.675) (.6 88 ) (.667) (.689) (.674) (.669)PR* FDI .001
(.0 02 ).001
(.002 ).000
(.00 1 )PR* OPEN -.003
(. 030)-.035(.030)
PR* GOV .099 .093 .100 .090(.092) (.085) (.093) (.091)
Constant 12.789*** 13.732*** 13 7 9 7 *** 14.260*** 13.464*** 13.774***(3.837) (3.774) (3.814) (3.823) (3.882) (3.843)
F-Test 3.015 3.225 3.144 3.002 2.855 3.114N 75 75 75 75 75 75R2 .320 .335 .329 .229 .216 .222‘Significant at the 10% level; ** Significant at the 5% level; ***Significant at the l%level
82
Reproduced with permission of the copyright owner. Further reproduction prohibited without permission.

Privatization and Income Inequality Regressions
Table 8 reports the results of the privatization and income inequality regressions. Before
analyzing the results, it is important to note that the hypothesis of a curvilinear
relationship between income inequality and the level of development was first tested.
This is necessary because it allows for the identification as to whether or not to include
the power term of LGCAP (LGCAPSQ), which is the initial level of development
squared variable. This test therefore helps to reduce any bias or error that might be due to
misspecification of the functional form of the model. The results show the initial level of
development (LGCAP) and LGCAPSQ are negative and positively correlated with
income inequality respectively, but insignificant in both cases (Columns 17 and 21). This
suggests that there is no evidence for the Kuznets curve or a curvilinear relationship
between the level of development and income inequality. As noted in Columns 17 and
2 1 , when the two variables are included, both are insignificant, however, when the
LGCAP alone is used it is significant at the 1% level (Columns 18 and 22).
Consequently, in the subsequent regressions, the power term (square of the initial level of
development variable or LGCAPSQ) is not included in the regression analysis. Thus, we
drop the power term without threatening the internal validity of our results (Stock and
Watson, 2003).
Privatization is positive but insignificantly correlated with income inequality
(Columns 18 and 22). Controlling for regional groupings does not change the coefficient
on the privatization variable (Columns 19 and 23) and therefore the positive coefficient
on privatization is not an artifact related to geographical differences in the sample of
83
Reproduced with permission of the copyright owner. Further reproduction prohibited without permission.

Reproduced with
permission
of the copyright owner.
Further reproduction prohibited
without permission.
Table 8: Privatization and Income Inequality Regressions
INEQ 10% INEQ 20%17 18 19 20 21 2 2 23 24
PR .653(.467)
.629(.472)
.538(.431)
.190**(1.168)
.134(.233)
.128(.231)
.062(.218)
.187(.594)
LGCAP -200.787(168.798)
37 7 3 5 *** (12.352)
29.817(13.140)
28.468*13.8260
-52.408(84.023
11.157*(6.062)
9.977(6.633)
8.541(7.036)
LRGCAPSQ 35.952(25.376)
9.581(12.631)
LGINF 1 .021(5.672)
2.094(5.678)
-1.964(5.329)
-1.832(5.584)
.871(2.824)
1.157(2.786)
-.149(2.702)
.352(2.842)
POP 8.196(5.240)
7.241(5.249)
5.099(5.221)
5.435(5.374)
1.882(.684)
1.627(2.576)
1.306(2.647)
1 .1 2 2(2.735)
SEC .0 2 0(.147)
.005(.148)
.161(.150)
.151(.152)
.008(.073)
-.0004(.072)
.091(.076)
.093(.077)
FDI 5.400***(1.374)
5,244***(1.383
4.230***(1.320)
4.357***(1.331)
1.840**(.684)
] 7 9 9 **(.679)
1.512**(.669)
1.553**(.677)
OPEN -1.03(.106)
-.135(1.05)
-.040(.098)
-.014(1.331)
-.033(.053)
-.041(.052)
-.006(.050)
.009(.052)
GOV -8.044*(3.878)
-6.423*(3.724)
-8.268**(3.413)
-7.270**(3.539)
-2.9239(1.930)
-2.401(1.836)
-3.140*(1.730)
-2 .8 8 8(1.801)
LLOCKED 11.917**(6.429)
13 3 3 7 ** (6.415)
10.773*(5.797)
11.649*(5.865)
3.894(3.200)
4.272(3.148)
3.1252.940)
3.512(2.985)
SSA 23.492**(9.454)
24.802**(11.950)
11.617**(4.793)
13.892**(6.081)
LA 23.830***(8.172)
17.368(10.813)
8.345*(4.143)
7.120(5.503)
AS 5.411(8.735)
3.904(12.953
2.141(4.429)
1.705(6.591)
PR* SSA -.404 -.552
84
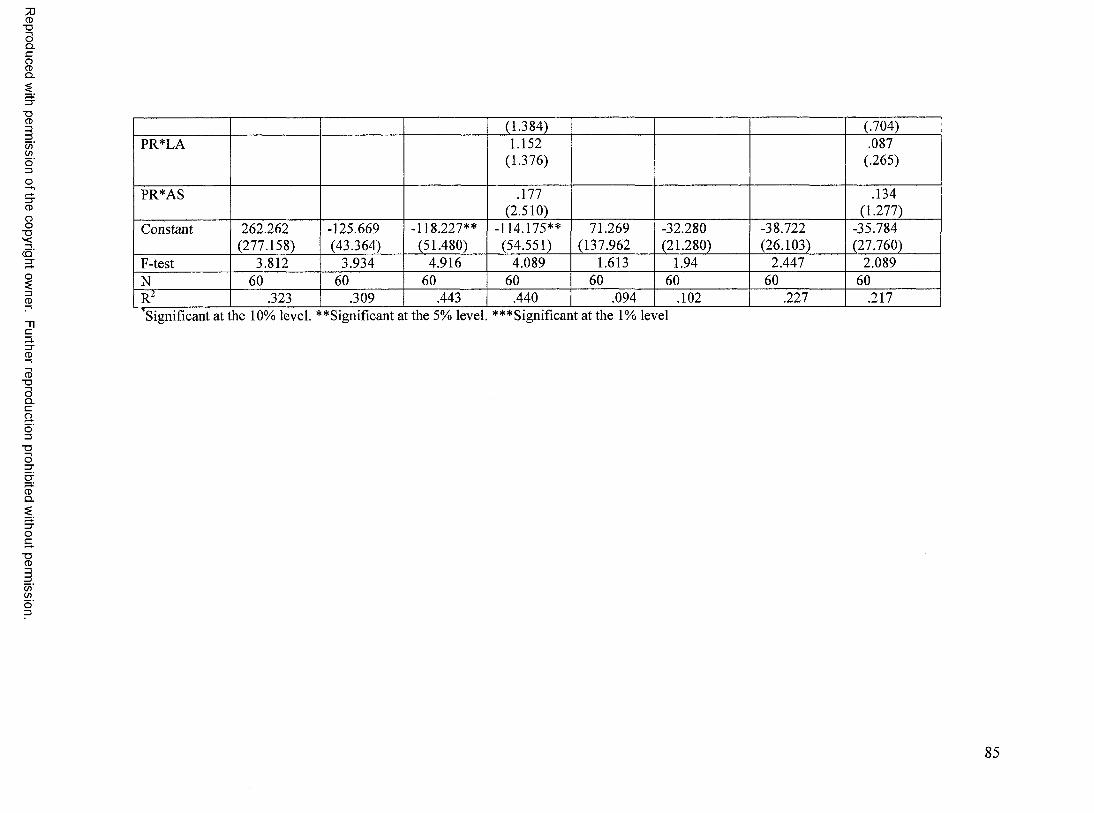
Reproduced with
permission
of the copyright owner.
Further reproduction prohibited
without permission.
(1.384) (.704)PR*LA 1.152
(1.376).087
(.265)
PR*AS .177(2.510)
.134(1.277)
Constant 262.262(277.158)
-125.669(43.364)
-118.227**(51.480)
-114.175**(54.551)
71.269(137.962
-32.280(21.280)
-38.722(26.103)
-35.784(27.760)
F-test 3.812 3.934 4.916 4.089 1.613 1.94 2.447 2.089N 60 60 60 60 60 60 60 60R2 .323 .309 .443 .440 .094 .1 0 2 .227 .217Significant at the 10% level. **Significant at the 5% level. ***Significant at the 1% level
85

countries studied. The coefficients of the Sub-Saharan Africa and Latin America
dummies are significant and positive at the 5% and 1% levels respectively for the INEQ
10% measure. However, the Sub-Saharan Africa and Latin American dummies are
significant at the 5% and 10% level for the INEQ 20% measure, while the Asia dummy is
positive but insignificant for both the INEQ 10% and INEQ 20% regressions (Columns
19 and 23).
To examine whether privatization may have differential impacts in the various
regions of the developing world, the cross product of the privatization variable and
regional dummies were analyzed with respect to income inequality. The results show a
negative effect of privatization on both measures of inequality in Sub-Saharan Africa, but
a positive effect of privatization in Latin America and Asia (Columns 19 and 23). In all
cases, however, the coefficients are not significant. The results indicate that there is no
significant difference in privatization’s effect in the four regions studied, but even more
importantly, privatization did not have a significant impact in any of the developing
countries studied between 1991 and 2002.
FDI is significant and positively correlated with income inequality in all the
model specifications, generally at the 5% level in the INEQ 20% regressions and at the
1% level in the INEQ 10% regressions. This means that the richest in the population grew
richer while the poorest grew poorer. This study’s result like those of Alderson and
Nielsen (1999), Beer (1999), and Reuveny and Li (2003) support the dependency (or
world systems) perspective that indicates that foreign capital penetration contributes
negatively to the distribution of income in developing countries.
86
Reproduced with permission of the copyright owner. Further reproduction prohibited without permission.

Inflation is positively correlated with income inequality, but the coefficient
becomes negative when the regional controls are included in the regression. In both
cases, however, the coefficients are not significant. Openness is negative but
insignificantly correlated with income inequality in all the model specifications with and
without the regional controls. The landlocked variable is positive and significantly
correlated with the INEQ 10% measure, but positive and insignificantly correlated with
the INEQ 20% measure. Controlling for the regional blocs gives similar results.
The governance variable is negative and significantly correlated with inequality in
all the model specifications; both the INEQ 10% and INEQ 20% measures and also with
and without the regional controls (Columns 18 through 24). The effect of the individual
governance indicators on income inequality are reported in Table 9. Only the INEQ 10%
regressions are reported here. The results show that the same variables are significant as
in the principal component regressions (Landlocked, Initial GDP per capita, and FDI).
All the governance indicators are negatively correlated with the income inequality
measure but only the rule of law and government effectiveness variables are significant at
the 5% level. The landlocked variable is significant at the 10% in four of six regressions
(Columns 25 through 28), and significant at the 5% level in the Rule of Law regressions
(Column 29), but insignificant in the corruption regression (Column 30). FDI was
significant at the 1% level in all the model specifications, and the LGCAP was positive
and significant at the 5% level in 2 regressions (Columns 25 and 26) and positive and
significant at the 1% level in four regressions (Columns 27 through 30). The model fit or
Readjusted also increased from a value of 0.266 for the voice and accountability
regression to 0.346 for the government effectiveness regression.
87
Reproduced with permission of the copyright owner. Further reproduction prohibited without permission.

Table 9: Inequality Regression with individual Governance Indicators
INEQ 10% INEQ 20%25 26 27 28 29 30
PR .518(.482)
.560(.475)
.637(.457)
.630(.497)
.692(.464)
.500(.469)
LGCAP 32.496**(13.053)
32.542**(12.127)
6.63***(11.759
35.960***(12.994)
37.294***(11.917)
36.512***(12.285)
LGINF 3.977(5.742)
3.704(5.658)
-.298(5.698)
3.010(5.818)
.263(5.298)
2.806(5.644)
POP 8.732(5.328)
7.712(5.321)
6.137(5.148)
9.108*(5.313)
4.900(5.351)
7.039(5.308)
SEC -.015(-151)
-.006(.149)
.029(.144)
-.006(.151)
.019(.145)
-.013(.148)
FDI 4.930***(1.412)
5.294***(1.424)
5 3 1 7 ***(1.343)
5 1 3 3 *** (1.424)
4.901***(1.344)
5 29*** (1.382)
OPEN -.153(.108)
-.125(.109)
-.141(.1 0 2 )
-.155(.107)
-.128(.103)
-.147(.105)
LANLOC 12.970*(6.763)
12.928*(6.504)
11.449*(6.267
13.121*(6.558)
13.864**(6.298)
12.684(6.440)
VOICE -.124(4.517)
POLST -4.858(4.066)
GOVEFF -14.990**(6.160)
REG -4.410(5.444)
LAW -14.168**(6.278)
CORR -9.615(6.088)
Constant -108.47***(47.108)
-111.92**(41.420)
-121.96***(41.420)
-121.82***(46.186)
- 123 7 7 *** (41.906)
-122.62*** ( 43.308)
N 60 60 60 60 60 60R2 .266 .289 .346 .278 .336 .303F-test 3.406 3.662 4.467 3.523 4.318 3.853‘Significant at the 10% level; **Significant at the 5% level; ***Significant at the l%level
88
Reproduced with permission of the copyright owner. Further reproduction prohibited without permission.

The cross product results are qualitatively similar to the non-interaction regression
results in terms of the variables that are significant (Table 10). However, a few
differences emerge. First, the privatization and openness cross product (PR* OPEN) is
positive and significantly correlated with income inequality (in both the INEQ 10% and
INEQ 20%) at the 1% level (Columns 31, 34, 36, and 39). The inclusion of the
privatization and Foreign direct investment (PR*FDI) and privatization and governance
(PR* GOV) interaction variables do not result in any appreciable changes in results,
however, the model fit reduced from a high of .422 to .287 in the INEQ 10% regressions
and from .211 to .092 in the INEQ 20% regressions. The PR*OPEN and PR*FDI were
not entered in the same regression equations, because the two variables are highly
collinear, with a coefficient of .766.
Summary of Regression Results
The main findings of the study are as follows:
• Privatization is negative but insignificantly correlated with economic growth in developing countries.
• Privatization is negatively correlated with income inequality in Sub-Saharan Africa and Asia but positively correlated with income inequality in Latin America. However, in all cases, the coefficients were not significant. However, Sub-Saharan Africa and Latin America experienced greater levels of income inequality than Asia and the Middle Eastern and North African countries.
• FDI is positive and significantly correlated with both economic growth and income inequality.
• Landlocked is negative and significantly correlated with economic growth, but positive and significantly correlated with income inequality.
• Good governance is positive and significantly correlated with growth but negative and significantly correlated with income inequality.
89
Reproduced with permission of the copyright owner. Further reproduction prohibited without permission.
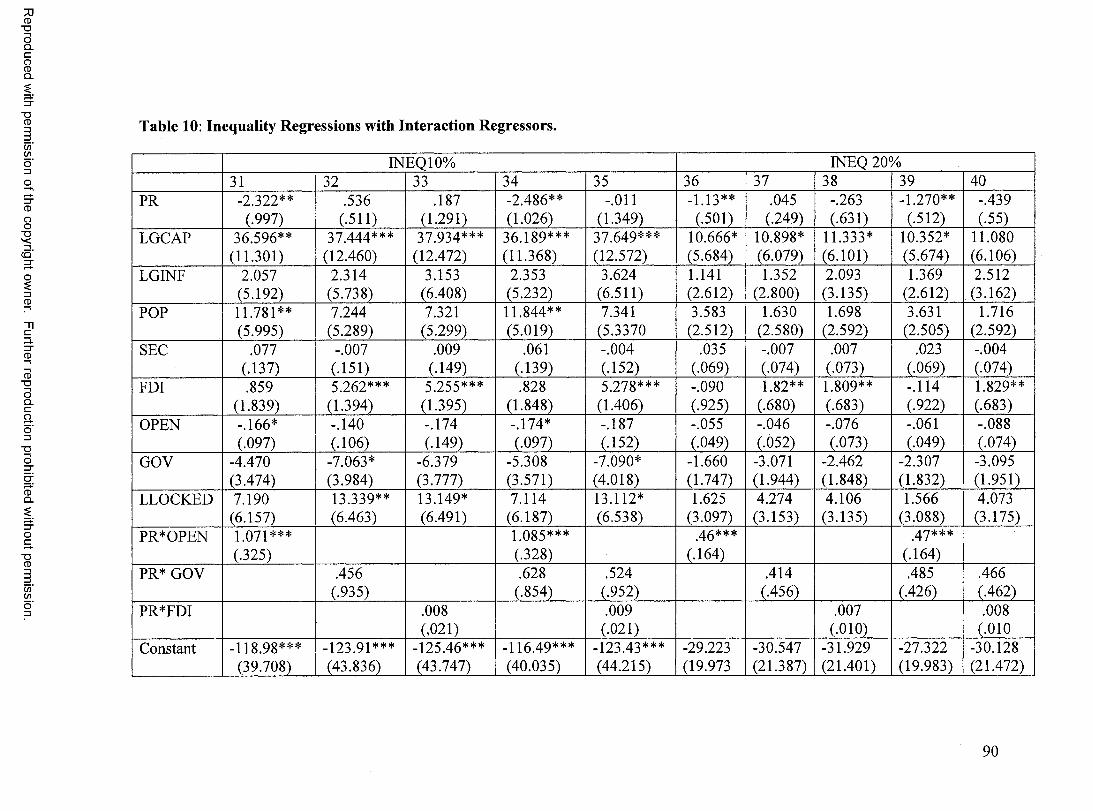
Reproduced with
permission
of the copyright owner.
Further reproduction prohibited
without permission.
Table 10: Inequality Regressions with Interaction Regressors.
INEQ 10% INEQ 20%31 32 33 34 35 36 37 38 39 40
PR -2.322**(.997)
.536(.511)
.187(1.291)
-2.486**(1.026)
-.011(1.349)
-1.13**(.501)
.045(.249)
-.263(.631)
-1.270**(.512)
-.439(.55)
LGCAP 36.596**(11.301)
3 7 .4 4 4 ***(12.460)
37 9 3 4 *** (12.472)
36.189***(11.368)
37.649***(12.572)
1 0 .6 6 6 *(5.684)
10.898*(6.079)
11.333*(6 .1 0 1 )
10.352*(5.674)
11.080(6.106)
LGINF 2.057(5.192)
2.314(5.738)
3.153(6.408)
2.353(5.232)
3.624(6.511)
1.141(2.612)
1.352(2.800)
2.093(3.135)
1.369(2.612)
2.512(3.162)
POP 11.781**(5.995)
7.244(5.289)
7.321(5.299)
11.844**(5.019)
7.341(5.3370
3.583(2.512)
1.630(2.580)
1.698(2.592)
3.631(2.505)
1.716(2.592)
SEC .077(.137)
-.007(.151)
.009(.149)
.061(.139)
-.004(.152)
.035(.069)
-.007(.074)
.007(.073)
.023(.069)
-.004(.074)
FDI .859(1.839)
5.262***(1.394)
5.255***(1.395)
.828(1.848)
5.278***(1.406)
-.090(.925)
1.82**(.680)
1.809**(.683)
-.114(.922)
1.829**(.683)
OPEN -.166*(.097)
-.140(.106)
-.174(.149)
-.174*(.097)
-.187(.152)
-.055(.049)
-.046(.052)
-.076(.073)
-.061(.049)
-.088(.074)
GOV -4.470(3.474)
-7.063*(3.984)
-6.379(3.777)
-5.308(3.571)
-7.090*(4.018)
-1.660(1.747)
-3.071(1.944)
-2.462(1.848)
-2.307(1.832)
-3.095(1.951)
LLOCKED 7.190(6.157)
13.339**(6.463)
13.149*(6.491)
7.114(6.187)
13.112*(6.538)
1.625(3.097)
4.274(3.153)
4.106(3.135)
1.566(3.088)
4.073(3.175)
PR* OPEN 1 071*** (.325)
1.085***(.328)
4g***(.164) (.164)
PR* GOV .456(.935)
.628(.854)
.524(.952)
.414(.456)
.485(.426)
.466(.462)
PR*FDI .008(,0 2 1 )
.009(.0 2 1 )
.007(.0 1 0 )
.008( .0 1 0
Constant -118.98***(39.708)
-123.91***(43.836)
-125.46***(43.747)
-116.49***(40.035)
-123.43***(44.215)
-29.223(19.973
-30.547(21.387)
-31.929(21.401)
-27.322(19.983)
-30.128(21.472)
90

Reproduced with
permission
of the copyright owner.
Further reproduction prohibited
without permission.
F-test 5.312 3.512 3.493 4.833 3.158 2.576 1.645 1.595 2.474 1.543N 60 60 60 60 60 60 60 60 60 60R2 .422 .299 .297 .417 .287 .2 1 1 .099 .092 .216 .092
Significant at the 10% level. ** Significant at the 5% level. ***Significant at the 1% level
91

DISCUSSION
Privatization and Economic Growth
The study’s results indicate that privatization did not have a significant effect on
economic growth with or without the regional group. Inclusion of the regional dummies,
however, shows that only the Latin American dummy has a negative and significant
coefficient. This means that Latin American countries experienced the slower rate of
growth compared to Middle Eastern and North African countries between 1991 and 2002
The result also indicates the growth rates of Sub-Saharan Africa and Asia were not
significantly different from the Middle Eastern and North African countries over the
study period. This means that Latin America experienced the greatest distortions in its
growth rates over the study period.
The study’s findings support the World Bank (2005) report “Economic Growth in
the 1990s: Learning from a Decade o f Reform ” that indicates that growth in the 1990s was
far below what was predicted. As noted in the Figure 10, the decline in the growth rate
was steepest in Latin America, and Sub-Saharan Africa did not experience any
appreciable growth. Though the growth rates across the developing countries were far
from expected, the 1990s was not a disaster for economic development. From the
standpoint of global poverty, the report claims that the most recent two decades proved to
be the most favorable that the world has ever experienced. This was due to rapid and
sustained growth in China, and a few other Asian countries including India, and Vietnam.
The overall effect is the absolute reduction in the number of people living in extreme
poverty, as China and India alone make up nearly one quarter of the World’s population.
92
Reproduced with permission of the copyright owner. Further reproduction prohibited without permission.

Figure 10: Economic Growth in Perspective, 1970 - 2000
SSA
MENASA
1975 1980 1990 2000
Source: World Bank (2005): Developing Countries GDP shown as a percentage of GDP
per capita of the OECD GDP per capita (total regional GDP over total population).
The study’s findings therefore provide evidence to the World Bank (2005) report, which
suggests that despite significant policy reform, improvements in the political and external
environments, continued foreign aid, and a decade into the transition, many countries had
still not caught up to their 1990 levels of output. For example, in Sub-Saharan Africa,
successes were few—with Uganda, Ghana, Tanzania, and Mozambique the most
commonly cited instances. However, the report also notes that the economies of these
countries still remained fragile after more than a decade of policy reforms. In Latin
93
Reproduced with permission of the copyright owner. Further reproduction prohibited without permission.

America, the report indicates that despite the dismantling of the state-led, populist, and
protectionist policy regimes, GDP per capita was lower in the 1990s than it was between
1950 and 1980. Interestingly, the report shows that in Vietnam, China, and India, where
there were deviations from the full package of reforms (e.g., privatization and trade
liberalization), growth was more substantial. China and India increased their reliance on
market forces, but their policies remained highly unconventional. With high levels of
trade protection, lack of privatization, extensive industrial policies, and lax fiscal and
financial policies through the 1990s, these two economies hardly looked like exemplars
of the Washington Consensus. Rodrik (2006) sums up his impressions of the 1990s as
follows:
The one thing that is generally agreed on about the consequences of these reforms is that things have not worked out the way they were intended. Even their ardent supporters now concede that growth has been below expectations in Latin America (and the “transition crisis” deeper and more sustained than expected in former socialist economies. Not only were success stories in Sub- Saharan Africa few and far in between, but the market oriented reforms of the 1990s proved ill-suited to deal with the growing public health emergency in which the continent became embroiled(p.2 ).
Similarly, a World Bank official, Kessides (2004), claims that privatization has been
oversimplified, oversold, and more importantly, it has been disappointing. He further
states:
For much of the 1990s privatization was heralded as elixir that would transform ailing lethargic state enterprises into sources of creative productivity and dynamism serving the public interests. National leaders burdened by large budget deficits and stagnating
94
Reproduced with permission of the copyright owner. Further reproduction prohibited without permission.

economies were outspoken on the need to foster private initiative as a means of promoting prosperity and enhancing the economic opportunities of al citizens. International financial institutions offered advice and promoted this movement in countries that received their aid. ... Recently, the alleged failures of privatization, improper restructuring, and overly rapid deregulation have led to street riots, skeptical press coverage, and mounting criticism of international financial institutions (pp. 52-53).
The statements above support the finding of the study that privatization did not have a
significant impact on economic growth of developing countries between 1991 and 2002.
The human capital variable was not significant in any of the model specifications.
This result contradicts many other studies that indicate human capital has a significant
positive effect on economic growth (Borenzstein et al., 1998; Makki and Somarwu,
2004). It is important to note, however, that Sylwester (2005), in study of 29 developing
countries finds a positive but insignificant effect of the human capital variable. On the
other hand, Nyatepe-Coo (1998) in a study of selected developing countries reports a
negative significant relationship between human capital and economic growth. The
difference in results could be due to the proxy used for human capital as there is no
consensus as to which is the best proxy for human capital. For example, Nyatepe- Coo
(1998) used the percentage of working age population enrolled in secondary education,
while Sylwester (2005) used the average number of years of schooling obtained by the
adult population and this study employed the gross secondary school enrolment.
The inflation variable is negative but never significant in any of the model
specifications. The study therefore does not find support for the finding that inflation has
a deleterious effect on growth (Romer and Romer, 1998). Easterly and Levine (2002),
however, report similar findings which indicate that macroeconomic policies (inflation
95
Reproduced with permission of the copyright owner. Further reproduction prohibited without permission.
and trade openness) do not explain economic development after controlling for
institutions.
The significant positive correlation between FDI and economic growth in both
regressions with and without the regional dummies provide support for the modernization
perspective that suggests that FDI contributes positively to economic growth. The
mechanisms through which this happens include: augmenting domestic investment, labor,
marketing, and managerial skills; technological spillovers to local manufacturing firms;
and increasing tax revenue for government (Baliamoume-Lutz, 2004; Le Vu and Suruga,
2005; Sylwester, 2005; Zhang, 2001).
The negative correlation between the openness and economic growth contradicts
other studies that report that integration into the world economy promotes growth (Dollar
and Kraay, 2002; Sarel, 1997). Like Easterly and Levine (2002), however, Rodrik (2006)
argues that the evidence that macroeconomic policies; price distortions, financial policies,
and trade openness have predictable, robust, and systematic effects on national growth
rates is quite weak. Rodrik (2006) notes that though fiscal deficits or autarkic trade
policies can stifle economic growth; moderate amounts of each are associated with
widely varying economic outcomes.
Similarly, Zagha et al. (2006) claim that the effect of trade reform is dependent
on country conditions and how the process of liberalization is implemented. They note
that some countries increased exports by reducing import tariffs, while others did so by
creating export processing zones; or offering exporters incentives, including duty rebates;
or making the exchange rate more competitive; or improving trade-related infrastructure,
with export liberalization preceding import liberalization. Zagha et al. (2006) assert that
96
Reproduced with permission of the copyright owner. Further reproduction prohibited without permission.

in some cases, trade liberalization coincided with deteriorating export incentives (for
example, exchange rate appreciation, as was the case in several South American
countries), while in others export incentives were strengthened. Zagha et al. (2006) argue
that trade reforms stimulate growth and help reduce poverty only when export incentives
improve, but not when they deteriorate. Consequently, they suggest that trade is an
opportunity, not a guarantee, and that it is overly naive to expect that simply opening
one’s economy or reducing tariffs would automatically increase growth.
The landlocked variable is negatively correlated with economic growth both in
regressions with and without the regional dummies, suggesting a negative growth effect
on a country being landlocked. Bosker and Garretsen (2006), for example, show that of
the geographic variables, being landlocked plays the most significant role in explaining
world income differences. Also, the United Nations Report (2005) on landlocked
countries indicates that the remoteness of countries from major world markets is the
principal reason why landlocked developing countries have not been successful in
mitigating their geographical handicap as compared to the developed landlocked
countries in Europe. This is because major developed markets surround landlocked
developed countries of Europe and their seaborne trade accounts for a relatively small
part of their external trade. Their export is mainly high value added products and their
distance from the seaport is relatively short. Further, the report notes that high transport
costs facing landlocked countries is a far more restrictive barrier to trade for these
countries than tariffs. According to the United Nations Conference on Trade and
Development [UNCTAD] (2006) estimates based on the IMF balance of payments
statistics show that on average landlocked developing countries spent almost two times
97
Reproduced with permission of the copyright owner. Further reproduction prohibited without permission.
more of their export earnings for the payment of transport and insurance services than the
average of developed economies.
The positive and significant coefficient of the governance variable in all the
model specifications is consistent with the studies of Kottaridi (2005), Ndulu and
O’Connell (1999), and Rodrik et al. (2004) that indicate that good governance is
important for economic growth. This is because good governance facilitates the
development of market supporting institutions and the formalization of property rights,
which help in the efficient allocation of resources (North, 1996; Soto, 1996). North
(1996) argues that institutions are not only important in establishing efficient markets, but
may indeed be the single most important determinant of economic performance. Soto
(1996) describes institutions as the missing ingredient needed to spur growth in
developing countries. Soto (1996) also claims that the difference between rich and poor
countries is that rich countries have good institutions and poor countries generally have
bad institutions.
The robustness check of the effect of governance on economic growth with
individual governance indicators provides further evidence especially for the important
role of government effectiveness, rule of law, and control of corruption in promoting
economic growth. This finding shows the importance of countries being able to limit the
state’s power, enforce contracts, and protect investors to increase the growth rate of their
economies (Shirley, 2003).
The cross product regressions show that none of the interaction variables are
significantly correlated with economic growth. The study therefore does not find support
for the argument that privatization’s effect on the economy is dependent on other factors
98
Reproduced with permission of the copyright owner. Further reproduction prohibited without permission.

like foreign direct investment, the degree of openness, and the governance environment.
This result, however, does not necessarily mean that the institutional environment or the
degree of openness is not important, but rather that they might not have reached the
necessary threshold (to complement the privatization process) to have a significant
impact on economic growth. As most of the literature on the determinants of privatization
in developing countries indicate, privatization policy is much more likely to be crisis-
driven and last ditch effort to turn the economy around, rather than a carefully chosen
policy with explicit long-term goals to achieve economic development (Banerjee and
Munger, 2004; Ramamurti, 2000). Accordingly, it is not surprising that most of these
countries have not established the necessary institutional environment needed for
privatization to succeed (Kikeri, 1992; Parker and Kirkpatrick, 2005).
Privatization and Income Inequality
The results show that even after controlling for regional blocks privatization did not have
a significant effect on income inequality in the developing countries studied. However,
the results also show positive and significant coefficient for the Sub - Sahara African (at
5% level) and Latin American dummies (at the 1% level), while the Asian dummy had a
negative but insignificant coefficient. These results suggest that while Sub - Sahara
African and Latin American countries exhibited greater levels of inequality than the
Middle Eastern and North African countries, there was no significant difference in
income inequality between the Middle Eastern and Northern African and the Asian
countries between 1991 and 2002. The implication is that Latin America and Sub-
Saharan Africa experienced greater levels of inequality than Middle Eastern and Northern
99
Reproduced with permission of the copyright owner. Further reproduction prohibited without permission.

African and the Asian countries. This finding is not surprising, as Latin America is
known to have the greatest level of income inequality in the world, with Sub-Saharan
African countries following at a close second.
Table 11 shows the income inequality for the various regions over the past four
decades, and it provides support for the findings of the study on income inequality.
Morley (2001) explains Latin America’s high inequality to be due to three main factors:
Table 11: Median Gini Coefficients by Region and Decade
REGION 1960s 1970s 1980s 1990s
Eastern Europe 25.1 24.6 25.0 28.9
South Asia 36.2 33.9 35.0 31.9
OECD and High 35.0 34.8 33.2 28.9
Income Countries
Middle East and 41.4 41.9 40.5 38.0
North Africa
East Asia and 37.4 39.9 38.7 38.1
Pacific
Sub-Saharan Africa 49.9 48.2 43.5 46.9
Latin America 53.2 49.1 49.7 49.3
Source: Deninger and Squire, 1996
100
Reproduced with permission of the copyright owner. Further reproduction prohibited without permission.

highly unequal distribution of education; decrease in the relative wage of unskilled labor
from the 1980s through the 1990s; and the fact that the rich in Latin America are much
richer relative to the remainder of the population than all the other regions of the world.
Further, the cross product of the privatization and the regional dummy variables
results also show that privatization did not have a significant impact on income inequality
in any of the regions. The big question then is if privatization does not have a significant
effect on income inequality, why is there so much discontent and demonstrations in most
countries against privatization, especially in Latin America and Africa (Kayizzi-
Mugerwa, 2002; McKenzie and Mookerjee, 2002)? Quoting fiom Latinbarometer
surveys, Kessides (2004) reports that disapproval ratings for privatization were higher in
2002 than in 2000, and those in 2000 were higher than in 1998. In 2002, nearly 90% of
the Argentines and 80% of Chileans polled disapproved of privatization.
There are many responses to the question raised above. Kessides (2004), for
example, gives two main reasons for the inconsistency between what the theoretical and
empirical literature suggest on one hand and the reality on the other. First, it is possible
that due to data limitations and perhaps even methodological flaws, statistical models do
not accurately measure the true welfare impact of these reforms. Second, it is also
possible that public perceptions are subject to systematic bias. This disillusionment,
Kessides (2004) argues, has been driven by employee layoffs, price increases, perceived
long delays in benefits, and the negative distributional impacts of privatization.
On the other hand, Nellis (2006) argues that privatization’s benefits for consumers
at large tend to be dispersed among amorphous, unorganized segments of the public,
while the average benefits are small for each affected consumer. Mass benefits occur in
101
Reproduced with permission of the copyright owner. Further reproduction prohibited without permission.

the medium term, or at least they accrue to a significant size in the medium term. In other
words, while the benefits of privatization are dispersed, in contrast, the costs are
concentrated and affect a visible, vocal and urbanized few. These include; dismissed
workers represented by powerful public sector unions, bureaucrats in supervisory
ministries that lose their authority, and middle-and upper-income consumers about to lose
a service long-furnished at a subsidized price. Nellis (2006, p. 18-19) asserts that though
the sum of their welfare losses may be much less than the aggregate gain, these actors
possess “voice” and access to power and they can and do make their needs and views
known. Further, it is easier to mobilize protest against losses, and generate sympathy for
the losers, than to engender gratitude for gains. Even more important as Nellis (2006)
argues, is the fact that the affected workers and consumers take steps to protect their
interests, portraying the loss as a threat to society and not simply to their group’s utility.
FDI is positively correlated with income inequality in all the model specifications.
The study therefore does not find support for Tsai’s (1995) assertion that the positive
effect of FDI on income inequality may be due to the most studies not controlling for
regional groups. The negative impact of FDI on the distribution of income may be
associated with convergence of the foreign investors’ and host country elite’s wealth
creation ambition, which is a barrier to the trickle-down effect of industrialization
predicted by the modernization theories (Beer, 1999). A typical case is when
multinational corporations (MNCs) pressure governments to cut welfare expenditures and
curb labor unions to reduce their wages, which invariably hurts the lower income classes
(Nafziger, 1997). Further, Nafziger (1997) claims that MNCs exacerbate income
inequalities by generating jobs, patronage and producing goods that primarily benefit the
102
Reproduced with permission of the copyright owner. Further reproduction prohibited without permission.
richest 20% of the population. On the other hand, foreign investment might create an
industrial structure in which monopoly is predominant, leading to what Bornschier and
Chase-Dunn (1985) describe as ‘underutilization of productive forces.’ The
underutilization of productive forces results in stagnant economic growth, high
unemployment levels, and a subsequent increase in income inequality.
The study’s finding of a positive but insignificant effect of inflation on income
inequality contradicts most other studies that find inflation hurts the poor the most (Bulir,
2001; Easterly and Fischer, 2001; Romer and Romer, 1998). Easterly and Fischer (2001),
for example, argue that inflation may indeed hurt the poor more because the rich are more
likely to have access to financial instruments that hedge in some way against inflation. A
few other studies, however, support this study’s finding on inflation. For example, Sarel
(1997) in a study of 45 developed and developing countries reports that inflation does not
have an effect on income inequality. Similarly, Blank and Blinder (1986) argue that there
is little or no evidence that inflation is the cruelest tax. Cardoso (1992) also asserts that
inflation tax does not affect those already below the poverty line.
Openness is negative but never significant in any of the model specifications. The
implication is that integration into the world economy does not have a significant impact
on income disparities as reported by Behrman et al. (2001) and Dollar and Kraay (2002).
On the other hand, (Tsai, 1995) argues that openness to international competition could
discipline domestic monopolistic or oligopolistic activities, leading to efficient allocation
of resources and a subsequent decrease in income inequality. The study’s finding on
openness, however, does not support any of these assertions. As noted by Zagha et al.
(2006), the effect of trade reform is dependent on country conditions and the way the
103
Reproduced with permission of the copyright owner. Further reproduction prohibited without permission.

process of liberalization is implemented. Consequently, it is difficult to make accurate
predictions about the effect of openness on the economy.
The positive and significant effect of the landlocked variable on income
inequality (INEQ 10%) means that being landlocked has the greatest negative effect on
the most poor in the population, and this effect is independent of the regional location.
The challenge posed to landlocked countries has in recent times been given attention by
the United Nations, which for sometime now has promoted strategies to help reduce
poverty and income inequality in landlocked countries, especially in its Decade for the
Eradication of Poverty (1997-2006) program.
In furtherance of the goal to reduce poverty and income inequality in landlocked
countries, the United Nations in 2003 convened in Almaty (Kazakhstan) an international
ministerial conference to enhance transit transport cooperation between landlocked and
transit developing countries. In 2004, at the 58th General Assembly Session, the United
Nations adopted the Almaty Program of Action that deals with infrastructural
development and maintenance, transit policy issues, trade facilitation measures, and
technical assistance to developing countries and especially landlocked countries. The
adoption of the resolution was in recognition of the fact that apart from poor
infrastructure, weak institutional and productive capacities, small domestic markets and
more importantly remoteness from world markets plague most of the landlocked
countries. These factors make the landlocked countries highly susceptible or vulnerable
to external shocks (United Nations, 2004; United Nations Conference on Trade and
Development [UNCTAD], 2006).
104
Reproduced with permission of the copyright owner. Further reproduction prohibited without permission.

The governance variable is negative and significantly correlated with income
inequality in the regressions with and without regional controls. This finding supports the
view that good governance, which is an indication of responsive, noncorrupted, and
efficient government, has a positive impact on income distribution. Thus, good
governance or institutions affect both the size of the national social pie and how it is
distributed. As noted by Acemoglu et al. (2003), institutions not only affect the economic
prospects of nations but are also central to the distribution of income among various
individuals and groups in society. Likewise, Lopez (2003) claims that good governance
would ensure that rent seeking by privileged groups is avoided or at the least reduced and
also ensures that government bureaucracies concentrate on enhancing the opportunities
and possibilities of the poor.
The privatization and income inequality regression cross product results show that
only the privatization and openness interaction variable is significant and positively
correlated with income inequality. This means that privatization is expected to worsen
income disparities in more open economies. The reason for this finding might be due to
the fact that most developing countries opened their economies to investors to purchase
SOE without a special reference to the distributional implications of the privatization
process. In recognition of this problem, Kikeri and Sunita (1992) assert that governments
must pay special attention to developing social safety nets in terms of severance
packages, unemployment benefits and redeployment programs to help offset any negative
effects of privatization on workers. Similarly, Kessides (2004) claims that the full gains
of privatization in terms of its economic and social benefits are dependent on both
competition and regulation. The implications of the study’s findings are discussed next.
105
Reproduced with permission of the copyright owner. Further reproduction prohibited without permission.

Implications
The main finding of this study is that privatization policy did not have a significant
impact on economic growth and income inequality in the developing world between 1991
and 2002. Also, the study finds that geography, institutional infrastructure, and FDI are
important factors that explain the disparities in economic growth and income disparities
in developing countries. These findings have important policy implications. First, the
results of this study and others (Cook and Uchida, 2003; Filipovic, 2005; Yoder et al.,
1991) indicate that privatization policy needs to be reconsidered as to its real benefits in
the developing world.
Second, policy makers should focus on economy-wide reforms that promote
institutional development and macroeconomic stability to stimulate economic
development. As noted by Cook and Uchida (2003), the lack of appropriate governmental
reforms might be the cause for an insignificant impact of privatization on economic
growth. Further, Romer and Romer (1998), claim that policies that lead to lower rates of
inflation may lead to high growth rates and subsequent well-being of the poor.
Accordingly, if as Zinnes et al. (2001) suggest; change of ownership alone is not
sufficient to ensure economic efficiency, then the lesson for developing countries is to
develop the necessary competition and regulatory framework to enhance the success of
privatization.
Obviously, without the necessary regulatory framework, privatization will only
result in public monopolies being replaced with private ones. This point is supported by
most of the studies reviewed above, which indicate that privatization’s impact is heavily
influenced by country conditions, in particular the quality of regulation (Eduardo and
106
Reproduced with permission of the copyright owner. Further reproduction prohibited without permission.

Ugo, 2002). Eduardo and Ugo (2002) observe that distributional equity gains from
privatization are driven by the effectiveness of regulation. Similarly, Chisari et al. (1999)
argue that how serious a government is about fair distribution of privatization benefits is
reflected in how serious it is about regulation.
Third, of all the explanatory variables examined, only governance infrastructure
has a significant positive impact on both economic growth and income distribution,
which shows the importance of country-specific characteristics and even more important,
government leadership in establishing the necessary institutional infrastructure to secure
economic development. It is important to note that when the individual governance
indicators were used, it is only the government effectiveness and rule of law variables
that had a significant effect on both economic growth and income distribution. The rule
of law variable was significant at the 5%level in both cases, while the government
effectiveness variable was significant at the 1% level in the growth regressions and 5%
level in the inequality regressions.
Evidently, the challenge for the developing world is not just ensuring economic
efficiency, but also how to correct the impression that even where there have been
positive gains; entrepreneurs, business elites, and the well connected in society have
benefited at the expense of the poor. Improving the governance infrastructure therefore
might be the first and most important step in meeting this challenge. This is because good
governance will reduce rent-seeking opportunities associated with non-transparent
divestiture process. It is indeed an interesting coincidence as Abdul (2000) has noted that
the World Bank’s Privatization: the lessons o f experience and Governance and
Development were both issued in 1992. The Bank’s argument in the governance report is
107
Reproduced with permission of the copyright owner. Further reproduction prohibited without permission.

that failures of its programs were frequently connected to the quality of government or
‘government failure’ (Yarrow, 1999).
This link between privatization and good governance results from a reversal of an
approach which involved complete mistrust of the state to one which accepts that state
bears the responsibility for the creation of an appropriate institutional framework (Abdul,
2000). In 1995, the World Bank released another report, titled Bureaucrats in Business,
the underlying argument of this report was that privatization and state sector reforms
were dependent on country conditions especially the presence of suitable regulation. The
biggest lesson from this study is that in promoting the market economy, the issue is not
just reducing the role of the state or by-pass government, but even more important how to
make government more accountable (Zagha et al., 2006). As noted by the World Bank
Report (2005), privatization is not just about finding “better owners” than government
but changing governance to separate the commercial from the political, as government
can use a wide range of policies to influence a firm’s decision.
Finally, in the midst of the inconsistency of the results of the privatization studies
and the general agreement that the institutional environment matters, it will be important
to take note of the Nobel laureate Joseph Stiglitz’ suggestion for a slow and more
deliberate privatization as opposed to the current crisis driven and international donor
organization’s emphasis on privatization as a conditionality for giving loans to
developing countries. In support of this viewpoint, the World Bank (2005) reports that
pragmatic and incremental approaches to process of privatization might be more
effective. The report further notes that there is no universally appropriate reform model,
and that privatization is not necessary or indispensable for every country. This means that
108
Reproduced with permission of the copyright owner. Further reproduction prohibited without permission.

privatization programs need to be explicit in terms of the country-specific conditions;
institutional, social, and political characteristics. The World Bank’s (2005) observation
however is not new. In 1992, the World Bank, in its Policy Research Bulletin made a
similar statement as follows:
Privatization is not a blanket solution for the problems of poorly performing SOEs. It cannot in and of itself make totally for the lack of competition, for weak capital markets, or for the absence of an appropriate regulatory framework. But where the market is basically competitive, or when a modicum of regulatory capacity is present, private ownership yields substantial benefits.
Likewise, Zagha et al. (2006) claim that whereas the mere emphasis on trade or
private sector reforms can lead to efficiency gains, they will not put the economy on a
sustained growth path unless they also strengthen production incentives and address
market or government failures that undercut the efforts to accumulate capital and boost
productivity. Reforms should therefore not focus on just the efficient use of resources,
but also on the expansion of capacity and growth. Zagha et al. (2006) further indicate that
countries that are successful at reforms are those that take into consideration the local
domestic capacity and conditions in consideration and as such are designed in concert
with structural policies that enable the domestic economy to restructure and spread the
cost of adjustment in a manner that minimizes output losses.
In fact, this is the idea suggested by the World Bank Report (2005) that better
policies can bring efficiency gains and may increase incentives for investment, but
without accounting to a growth strategy. This observation by the World Bank' (2005) is
based on the premise that efficiency gains will not necessarily induce the behavior of
109
Reproduced with permission of the copyright owner. Further reproduction prohibited without permission.

private investors and public sector that is needed to put an economy on a sustained
growth path. Obviously, the incentives needed to expand productive capacity differ from
those that are needed to use the capacity better. Certainly, what matters for growth is less
the degree to which policies approximate the ideal than the extent to which a
development strategy is able to mobilize the creative forces of society and achieve higher
levels of productivity (Zagha, 2006). Accordingly, the challenge for developing countries
is how to improve and add on to their physical and human capital by both the private and
public sectors to enhance productivity.
Limitations and Directions for Future Research
A few limitations of the study are worth noting. First, the lack of consistent data limited
the analysis to a maximum of 75 countries in the growth regressions and 60 countries in
the income inequality regressions out of the 80 countries studied. Second, the study
examined the impact of total privatization and did not address the impact of different
methods of privatization on economic development. A few studies have reported
differential effects of the various methods of privatization on economic growth (Bennett
et al., 2004; Earle, 2002). Third, the type of industries privatized may also have an effect
on economic performance. Many studies on privatization of infrastructure, finance, and
manufacturing firms indicate differences in the industry effect of privatization. The lack
of consistent data on the revenues generated from the various methods of privatization
and industries did not allow us to control for these factors. The World Bank’s
privatization database reports the types of industries privatized, but not the amount
generated from each sector, consequently, we are unable to control for any bias that
110
Reproduced with permission of the copyright owner. Further reproduction prohibited without permission.
might be due to differences in the type of industry privatized. Finally, the effect of
privatization is dependent on what the privatization proceeds are used for; it may be used
to retire debt, saved, transferred to budget or used in capital expenditures. The validity of
the findings of the study is therefore limited to the extent that the aforementioned factors
impact the growth process.
The implications and limitations of this study point to new directions for research.
First, there is the need for studies on the impact of different methods of privatization and
the sectors privatized on economic development. Second, longitudinal studies would need
to be conducted to identify the dynamic effects of privatization in the different regions of
the world as data becomes available. Third, the inconsistency in results suggests the need
for more bottom-up studies to complement the global studies. Forth, the policy
environment, in particular the roles played by competition and its regulation needs to be
examined if the relation between privatization and economic development is to be better
understood. Finally, a comprehensive analysis of the triad (growth, income distribution,
and poverty) is needed to give direction to policy makers as to the best strategy to
promote growth, reduce poverty levels and subsequently reduce income disparities.
Conclusion
The study examined the impact of privatization on economic growth and income
inequality in various regions of the developing world between 1991 and 2002. The study
finds that privatization did not play a significant role in promoting economic growth and
reducing income inequalities in developing countries. Though, the study is one of the first
to control for regional groupings in analyzing the impact of privatization in the
111
Reproduced with permission of the copyright owner. Further reproduction prohibited without permission.

developing world, the results reported do not support the hypothesis that privatization
boosted economic growth in developing countries between 1991 and 2002.
The results of the study, however, indicate that country conditions including good
governance infrastructure is more likely to promote growth and contribute to a reduction
in income inequality, which suggests that country-specific characteristics may be more
important in promoting growth and reducing income inequality than any economic policy
per se. Obviously, the quality of government determines the quality and the success of
economic decision making. As far back as 1992, the World Bank’s report ‘Privatization:
The lessons o f experience,’’ indicated that the failures of most its programs were
frequently connected to the quality of government. Similarly, Ramamurti (1999) asserts
that the problem in many of the developing countries has not been the political reluctance
or commitment, but the absence of an adequate infrastructure to support privatization in
situations where local buyers have lacked finance and expertise and government have had
to extend protection and subsidies. These issues suggest that the privatization process
needs to be gradual to give developing countries the opportunity to learn and develop the
requisite institutional infrastructure to ensure the success of policy reforms being
implemented by most countries in the region.
The inconsistencies in the results of the various studies and findings of this study
require a careful analysis of privatization as it has unfolded in the various regions of the
world. The future in research with data permitting is to examine how the various sectors
privatized, the methods of privatization, and the type of ownership (local or foreign)
impact the economy as a whole. In the end, however, the debate should not just focus on
the superiority of the private firm over SOEs or vice versa, but more important, how to
112
Reproduced with permission of the copyright owner. Further reproduction prohibited without permission.

create the necessary market supporting institutional environment needed to promote
economic growth and reduce income inequality. This should shift the debate from a focus
on mere government failure or mistrust of the state to one which acknowledges that the
state bears the responsibility for the creation and maintenance of appropriate institutional
framework. Clearly, the biggest challenge for developing countries is not merely how to
reduce the role of the state but even more important to make it more accountable.
Accordingly, this study argues that privatization and deregulation can have potentially
significant positive impact on both economic growth and distributional equity, but this
potential effect is dependent on the establishment of effective institutions. We conclude
by stating that both the country conditions and market conditions matter in the success of
economic reforms of which privatization is a major component.
Reproduced with permission of the copyright owner. Further reproduction prohibited without permission.
113

References
Abdul, P. (2000). Privatization in Developing Countries: The Governance Issue.2000(1) Law, Social Justice and Global Development (LGD) http://www2.warwick.ac.uk/fac/soc/law/eli/lgd/2001 1/palaiwala/
Abu, Shair, O.J.A. R. (1997). Privatization and Development. New York: St. Martins Press Inc.
Acemoglu, D., Jackson, S. & Robinson, J. (2003). Reversal of Fortune. Geography and Institutions in the Making of the Modem World Income Distribution. Quarterly Journal o f Economics, 118, 1231-1294.
Adam, C., William, C. & M. Percy. (1992). Adjusting Privatization: Case Studies from Developing Countries. London: James Currey Ltd.
Adam, S. (1776). The Wealth of Nations. In Hanke, S.H., 1987, Privatization and Development (p.48). California: Institute for Contemporary Studies Press
Aghion, P. & Schankerman, M. (1999), Competition, Entry, and the SocialReturns to Infrastructure in Transition Economies. Center or Economic Policy
Research. DP 2052. London
Aharoni, Y. (1982.). State Owned Enterprise: ‘An Agent Without a principal’, In P.Leroy Jones (Ed.) Public Enterprises in Less Developed Countries (pp. 67-76). Cambridge: Cambridge University Press.
Aharoni, Y. (1986). The evolution and Management o f State Owned Enterprises. Cambridge: Ballinger Publishing Company.
Ahluwalia, M. S. 1993 (1974). Income Inequality: Some Dimensions of theProblem. In Seligson Mitchell A. and John T. Passe-Smith (Eds.), Development
and Underdevelopment: The Political Economy o f Inequality (pp. 31-39).Boulder: Lynne Reiner Publishers
Ahluwalia, M. S. (1976). Inequality, Poverty, and Development’ Journal o f Development Economics, 3, 307—342.
Alchian, A. (1965). Property Rights. The Concise Encyclopedia of Economics. The Library of Economics and Liberty.http://www.econlib.org/LIBRARY/Enc/PropertvRights.html
Al-Obaidan, A. M. (2002). Efficiency Effect of privatization in Developing Countries. Applied Economics, 34, 111-118.
Alderson, S. A. & Nielsen, F. (1999). Income Inequality, Development, and Dependence:
114
Reproduced with permission of the copyright owner. Further reproduction prohibited without permission.

American Sociological Review, 64, 617-628.Alesina, A. & Perotti, R. (1996). Income Distribution, Political Instability, and
Investment’ European Economic Review, 40(6), 1203-1228.
Alfaro, L., Chanda A., Kamli - Ozcan S. & Sayek S. (2004). FDI and EconomicGrowth: The Role of the Financial Markets. Journal o f International Economics, 64, 89-112.
Allison, P. D. (1978). Measures of Inequality. American Journal o f Sociology, 43(6), 865-880.
Anderson, T. & Hill, P.J. (1975). The Evolution of Property Rights: A Study of the American West. Journal o f law and Economics, 18(1), 163-179.
Avishur, A. (2000). A Positive Theory of Privatization. Journal o f Applied Economics, 3(1), 1-55
Barro, R. (1991). Economic Growth in a Cross Section of Countries. The Quarterly Journal o f Economics, 106, 407-443
Banerjee, G. S. & Munger, M. C. (2004). Move to Markets? An Empirical Analysis of Privatization in Developing Countries. Journal o f International Development, 16, 213-240.
Baliamoune-Lutz, M. (2004). Does FDI contribute to Economic Growth? Business Eonomics, 39(2), 49-56
Barnett, S. (2000). Evidence on the Fiscal and Macroeconomic Impact of Privatization, IMF Working Paper, July, Washington, D.C.: IMF.
Bayliss, K. (2002a). Water Privatization in SSA: Progress, Problems, and PolicyImplications. Paper presented at the Development Studies Association Annual Conference, University of Greenwich, 9th November 2002.
Bayliss, K. (2002b). Privatization and Poverty: The Distributional Impact of Utility Privatization. Center on Regulation and Competition. Working Paper No. 16. Manchester: Institute for Development Policy Management
Beauregard, R. A. (1993).Constituting Economic Development: A TheoreticalPerspective. InBingham, R. D. & Mier, R. (Eds.), Theories o f Local Economic Development: Perspectives From Across the Disciplines.Newbury Park. Sage Publications, Inc.
Beer, L. (1999). Income Inequality and Transnational Corporate Penetration. Journal o f World Systems Research, 5, 1-25
Behrman, J., Birdsall N., & Szekely, M. (2001). Economic Policy and wage
115
Reproduced with permission of the copyright owner. Further reproduction prohibited without permission.

Differentials in Latin America. Penn Institute for Economic Research Working Paper 01-048
Bennell, P. (1997). Privatization in Sub-Saharan Africa: Progress and Prospects during the 1990s. World Development, 25 (11), 1785-1803.
Bennett, J., Estrin, S. & Urga, G. (2004). Methods of Privatization andEconomic Growth in Transition Economies. FEEM Working Paper No 105.04. Milano, Italy.
Berthelemy, J., Kauffmann, C. Valfort, Marie -Anne, & Wegner Lucia. (2004).Privatization in Sub-Saharan Africa: Where Do We Stand? Paris: OECD Publication.
Biais, B. & Perotti, E. (2002). Machiavellian Privatization. “American Economic Review, 92, 240-258.
Birdsall, N. & Nellis, J. (2002). Winners and Losers: Assessing the DistributionalImpact o f Privatization. Center for Global Development Working Paper No. 6.
Birdsall, N. & Nellis, J. (20025). Reality Check: The distributional impact ofPrivatization in developing countries. Washington DC Center for Global Development
Blank, R. & Blinder, A. (1986). Macroeconomics, Income Distribution, and Poverty.In Sheldon Danziger and Daniel Weinberg (eds.), Fighting Poverty: What Works and What Doesn’t (pp. 180-208). Cambridge MA: Harvard University Press
Blonigen, B. A. & Wang, M. G. (2003). Inappropriate Pooling together of Wealthy and Poor Countries in FDI Empirical Studies. In H. T, Moran, M. E. Graham and M. Blomstrom (Eds.), Does Foreign Direct Investment Promote Development (pp. 221-244.)? Washington, DC. Institute for International Economics.
Borcherding Thomas, E. (1977). The Sources of Growth of growth of PublicExpenditures in the United States, 1902 - 1970. In Borcherding Thomas, E. (Ed.)
Budgets and Bureaucrats: The Sources o f Growth (pp. 20-45). Durham. Duke University Press.
Borcherding, Thomas, E. (Ed.) (1977). Budgets and Bureaucrats: The Sources o f Growth Durham. Duke University Press.
Borensztein, E., J., De Gregorio, J. W. & Lee, J. W. (1998). How Does Foreign DirectInvestment Affect Economic Growth? Journal o f International Economics, 45(1), 115-135
Bomschier, Volker, Chase-Dunn, C. & Rubinson, R. (1978). Cross-National
116
Reproduced with permission of the copyright owner. Further reproduction prohibited without permission.

Evidence of the Effects of Foreign Investment on Economic Growth,’ American Journal o f Sociology, 84(3), 651-683.
Bomschier, V. & Chase-Dunn, C. (1985). Transnational Corporations and Underdevelopment, New York: Praeger
Bomer, K. (2004). The Political Economy o f Privatization: Why do governments want Reforms? The Fondazione Eni Enrico Mattei Note di Lavoro 106. Rome.
Bortolotti, B. & Pinotti, P. (2003). The Political Economy of Privatization. The Fondazione Eni Enrico Mattei Note di Lavoro 45. 2003.
Bortolotti, B., Fantini, M., & Siniscalco, D. (2003). Privatization Around the World: Evidence from Panel Data. Journal o f Public Economics, 88, 305-332.
Bosker, M. & Garretsen, H. (2006). Geography Rules Too! Economic Development and the Geography of Institutions. CESIFO Working Paper No. 1769. Munich.
Boubakari, N. & Cosset J. (1998). The financial and Operating Performance of NewlyPrivatized Firms: Evidence from Developing Countries, Journal o f Finance, Vol. 53,1081-1110
Boubakari, N. &Cosset, J. (1999). Does Privatization meet the Expectations? Evidence from African Countries. Plenary on Privatization and Corporate Governance. African Economic Research Consortium Biannual Research, December 4-9,1999. Nairobi Kenya.
Boubakari, N., Cosset, J., & Ghedhami, O. (2001). Liberalization, CorporateGovernance, and the performance o f newly Privatized Firms. Michigan: William
Davidson Institute Working Paper Number 419.
Boubakari, N., Cosset, J., & Ghedhami, O. (2005). Liberalization, CorporateGovernance, and the Performance of Newly Privatized Firms. Journal o f Corporate Finance, 11, 767-790
Boycko, Maxim, Shleifer, Andrei, & Vishny, Robert, W. (1996). A Theory of Privatization. The Economic Journal 106, 309-19.
Brett, E.A. (1988). States, Markets, and Private Power: Problems and possibilities. InP. Cook and C. Kirkpatrick (eds.) Privatization in Less Developed Countries, pp. 47-67. Sussex: Wheatsheaf Books.
Buchanan, J. M. (1977). Why Do Governments Grow? In Borcherding Thomas,E. (Ed.) 1977. Budgets and Bureaucrats: The Sources o f Growth. Durham. Duke University Press, p.3 - 18.
Buchanan, J. M. {\9TZ).The Theory o f Public Choice. Ann Arbor: University of
117
Reproduced with permission of the copyright owner. Further reproduction prohibited without permission.

Michigan Press
Buchanan, J. & Tullock, G. (1962). The Calculus o f Consent, Logical Foundations o f Constitutional Democracy. Ann Arbor: University of Michigan Press.
Bulir, A. (2001) Income inequality: Does Inflation Matter? IMF Staff Papers, 48(1), 139-159.
Buress, D. (1996). Social Welfare Functions in Benefit - Cost Analysis: The ROPIApproach. Workshop on Manufacturing Organization: Learning from Evaluation Practices and Results. Atlanta, September, 1996.
Bush, W. C. & Mackay Robert, J. (1977). Private Versus Public Sector Growth. InBorcherding Thomas, E. (Ed.) 1977. Budgets and Bureaucrats: The Sources o f Growth (pp. 187-188). Durham. Duke University Press.
Camdessus, M. (1998). Income Distribution and Sustainable Growth: ThePerspective from the IMF at Fifty. In Tanzi Vito & Ke - Young Chu 1998.
Income Distribution and in High Income Growth (p. 1-4). Cambridge, The MIT Press.
Cardoso, E. (1992). Inflation and Poverty. National Bureau of Economic Research Working Paper No. 4006. Cambridge, Massachusetts.
Castater, N. M. (2003). Privatization as a means to Societal TransformationAn Empirical Analysis of Privatization in Central and Eastern Europe and the Former Soviet Union. PhD Dissertation. University of North Carolina. Chapel Hill
Chenery, H. & Srinivasan, T. N. (Eds) (1988). Handbook o f Development Economics. Amsterdam. Elsevier Science Publishers.
Chisari, O., Estache, A., & Romero, C. (1999). Winners and Losers from UtilityPrivatization in Argentina: Lessons from a General Equilibrium Model,’ Working Paper 3. Centro de Estudios Economicos de la Regulation. Buenos Aires.
Chong, A. & Lopez-de-Silanes, F. (2003). The Truth about Privatization in LatinAmerica. Inter-American Development Working Paper No. R-486. Washington, D.C.
Clarke, G. (1995). More Evidence on Income Distribution and Growth. Journal o f Development Economics, 47(2), 403-427
Clarke, G. K. & Cull, R. (2002). Political and Economic Determinants of theLikelihood of Privatizing Argentine Banks. Journal o f Law and Economics, 45, 165-198.
118
Reproduced with permission of the copyright owner. Further reproduction prohibited without permission.

Clarke, G. & Wallsten, S. (2002). Universal (ly bad) Service: Providing Infrastructure Service to Rural and Poor Urban Consumers. Policy Research Working Paper 2868. World Bank, Washington, D.C
Clifford, V. (1993). Implementing Privatization Policy in DevelopingCountries: A Selected Review, USAID’s Implementing Policy Change Working Paper No. 3.
Cling, J. P., Cogneau, D., Loup, J., Nuadet, D. J. Razafmdrakoto, M., & RoubaudF. (2006). Development, a Question of Opportunity? A Critique of the 2006 World Development Report: Equity and Development. Development Policy Review, 24, 455-476
Commander, S. & Killick, T. (1988). Privatization in developing countries: ASurvey of the Issues, in P. Cook and C. Kirkpatrick (eds.) Privatization in Less
Developed Countries (pp. 91-124). Sussex: Wheatsheaf Books.
Cowan, L. (1990). Privatization in the Developing World. New York: Greenwood Press.
Cook, P. & Kirkpatrick, C. (Eds.) (1988). Privatization in Less Developed Countries. New York: St. Martins Press,
Cook, P. & Kirkpatrick, C. (2003). Assessing the Impact of Privatization in Developing Countries. In D. Parker and D. Seal (Eds.), Handbook on
Privatization (pp. 209-219). Cheltenham: International Edward Elgar Publishing Limited.
Cook, P. & Uchida, Y. (2003). Privatization and Economic Growth in Developing Countries. Journal o f Development Studies, 39(6), 121-154.
Crafts, N. & Venables, A. H. (2001). Globalization in History: A GeographicalPerspective. Center for Economic Policy Research Working Paper No 3079. London.
Cuervo, A. & Villalonga, B. (2000). Explaining the Variance in the Performance Effects of Privatization. Academy o f Management Review, 25(3), 581—594.
Datta, A. & Agarwal, S. Telecommunications and Economic Growth: A Panel DataApproach. Applied Economics, 36,1649 - 1655
Davis, J., R. Ossowski, T. R. & Barnett, S. (2000). Fiscal and macroeconomicImpacts of Privatization Occasional Paper 194. Washington: International Monetary fund.
119
Reproduced with permission of the copyright owner. Further reproduction prohibited without permission.

Demsetz, H. (1967). Towards a Theory of Property Rights. American Economic Review, 57(2), 347-359.
Deninger, K. & Squire, L. (1996). A New Data Set Measuring Income Inequality.World Bank Economic Review, 10(3), 565-591.
Dharwadkar, R., Gerard, G., & Brandes, P. (2000). Privatization in Emerging Economies: An Agency Theory perspective. Academy o f Management Review, 25(3),650-675.
Dinavo, J. (1995). Privatization in Developing Countries. Its impact on Economic Development and Democracy. Westport, Connecticut: Praeger Publishers.
Dixon, W. J. & Boswell, T. (1996a). Dependency, Articulation, andDenominator Effect: Another Look at the Foreign Capital Penetration. American Journal o f Sociology, 102(2), 543-562.
Dixon, W. J. & Boswell, T. (1996b). Differential Productivity, NegativeExternalities and Foreign Capital Dependency: Reply to Firebaugh. American
Journal o f Sociology, 102(2), 576-584.
Dollar, D. & Kraay, A. (2002). Growth is Good for the Poor. Journal o f Economic Growth, 7(3), 195-225.
Dye Thomas. (2002). Understanding Public Policy. New Jersey: Prentice Education, Inc.
Earle, J. (2002). Privatization methods and productivity Effects in RomanianIndustrial Enterprises. Journal o f Comparative Economics, 30, 657-682.
Easterly, W. & Fischer, S. (2001). Inflation and the Poor Journal o f Money,Credit, and Banking, 33(2), 160-178.
Easterly, W. & Levine, R. (2002). Tropics, germs, Crops: How EndowmentsInfluence Economic Development. National Bureau of Economic Research Working Paper 9106. Cambridge, MA.
Eduardo, L. & Ugo, P. (2002). Structural Reforms in Latin America Under Scrutiny:Paper Presented at the seminar ‘Reforming Reforms’, held at the Annual meetings of the Board of Governors, Inter American Development Bank, Fortaleza, Brazil.
Fama, E. (1980). Agency Problems and the Theory of the Firm. Journal o f Political Economy, 88(2), 288-307.
Feingenbaum, H. & Henig, J. (1997). Privatization and Political Theory.Journal o f International Affairs, 50(2), 338-355).
120
Reproduced with permission of the copyright owner. Further reproduction prohibited without permission.
Fershtman, C. (1990). The Interdependence between Ownership Status and Market Structure: The case of Privatization. Economica, New Series, 57, 319-328.
Furubotn, E.G. & Pejovich, S. (1972). Property Rights and Economic Theory: A Survey of Recent Literature. Journal o f Economic Literature 10, 1137-1162.
Filipovic, A. (2005). Impact of privatization on Economic Growth. Issues in Political Economy, Volume 14, August 2005.
Galiani, S., Gertler, P. & Schargrodsky, E. (2005). Water for Life. TheImpact of Privatization of water Services on Child Mortality. Journal o f Political Economy, 113(1), 83-120.
Ghosh, S. (2001). Move to Markets. An Empirical Analysis of privatization inDeveloping Countries. Ph.D. Dissertation. University of North Carolina at Chapel Hill.
Glaeser E., La Porta, R., Lopez-de-Silanes, F. & Shleifer, A. (2004). Do Institutions Cause Growth? Journal o f Economic Growth, 9, 271-303
Globerman, S. & Shapiro, D. (2003). Governance Infrastructure and US foreign Direct Investment. Journal o f International Business Studies, 34(1), 1-19
Gupta, S., Schiller, C., & Ma, H. (1999). Privatization, Social Impact, and Social Nets. New York: International Monetary Fund Working Paper 68.
Gyimah-Brempong, K. (2002). Corruption, Economic Growth, and Income Inequality in Africa. Economics of Governance, 3,183-209.
Gyimah-Brempong, K. & Camacho, M. S. (2006). Corruption, Growth, and Income Distribution: Are there Regional Differences? Economics of Governance,7, 245-269.
Hanke, S.H. (1987). Privatization and Development. California: Institute for Contemporary Studies Press.
Harberger, A. (1987). Growth of the Public Sector in our Time. Address Presented at the Annual Meeting of Argentine Bankers Association, Buenos Aires.
Harris, M. & Lye J. N. (2001). The Fiscal Consequences of Privatization: AustralianEvidence on Privatization by Public Share Float. Review o f International Applied Economics, 15(3), 287-303.
Heald, D. (1988). The Relevance of UK Privatization for LDCs. In P. Cook and C. Kirkpatrick (Eds.), Privatization in Less Developed Countries (pp. 68-90).Sussex: Wheatsheaf Books
Hemming, R. & Mansoor, A. M. (1987). Privatization and public enterprises. IMF
121
Reproduced with permission of the copyright owner. Further reproduction prohibited without permission.

Working paper, WP/87/9, 25 February, Fiscal Affairs department.
Henderson, V., Shalizi, Z. & Venables, A. (2000). Geography and Development. Policy Research Working Paper 2456. Washington, DC. World Bank.
Henig, J. R. (1989). Privatization in the US: Theory and Practice. Political Science Quarterly, 104(4), 649-670.
Hill, P. & Kamer, M. (1996). Spontaneous Privatization in TransitionEconomies. In L. Terry & J. P. Hill (Eds), The Privatization Process: A Worldwide Perspective (pp. 81-96). Maryland: Rowman & Littlefield Publishers, Inc.
Hirschman, A. (1958). The Strategy of Economic Development. New Haven. Yale University Press.
Human Development Report. (2005). Monitoring Human Development: Enlarging People's Choices. United Nations Development Program, New York.
Hunt, D. (1997). The Potential of Telecommunications: Income Distribution in Mercosur Vital Speeches o f the Day, 64, 85-88.
Hodge, G. A. (2000). Privatization: An International Overview o f Performance . Oxford: Westview Press.
Ikenberry, J. (1990).The International Spread of Privatization: Inducements, Learning, and Policy Bandwagoning. In E. N. Suleiman and J. Waterbury (Eds.), The Political Economy o f Public Sector Reform and Privatization (pp. 88-110). Boulder: Westview Press.
Jensen, M. & Meckling, W. H. (1976). Theory of the Firm: Managerial Behavior, Agency Costs, and Ownership Structure. Journal o f Financial Economics, 3(4), 305-360
Kaufmann, D., Kraay, A., & Mastruzzi Massimo. (2005). Governance Matters IV: Governance Indicators for 1996-2004. Washington, D. C.: Policy Research Working Paper Series No. 3630.
Kay, J. A. & Thompson D. J. (1986). Privatization: A Policy in Search of a Rationale. Economic Journal, 96, 18-32.
Kayizzi-Mugerwa, K. S. (2002). Privatization in Sub—Saharan Africa: On FactorsAffecting Implementation. World Institute of Development Economic Research Discussion Paper No. 2002/12, Helsinki.
Kayizzi-Mugerwa, K. S. (Ed.) (2003). Reforming Africa’s Institutions: Ownership, Incentives and Capabilities. New York: United Nations University Press.
122
Reproduced with permission of the copyright owner. Further reproduction prohibited without permission.

Kessides, K. I. (2004). Reforming Infrastructure: Privatization, Regulation,And Competition. Wahington, DC. World Bank
Kikeri, S. (1992). Privatization: The Lessons of Experience. Washington, D.C:World Bank
Kikeri, S. & Kolo, A. (2005). Privatization: Trends and Recent Development World Bank Policy Research Working Paper 3765 Washington DC.
Kindleberger, P.C. (1965). Economic Development. New York. McGraw-Hill Book Company.
Kirkpatrick, C. & Parker, D. (2003). Regulatory Impact Assessment: Developing Its Potential for use in Developing Countries. Center on Regulation and Competition Working Paper Series No. 56. Manchester
Kirkpatrick, C., Parker, D., & Zhang, Y. (2006).Foreign Direct Investment inInfrastructure in Developing Countries: Does Regulation make a Difference? Transnational Corporations, 15(1): 143-171
Kobrin, S. (2005). The Determinants of Liberalization of FDI Policy in DevelopingCountries: A cross-sectional analysis, 1991-2001. Transnational Corporations, 14(1): 67-103.
Korpi, W. (1985). Power Resources Approaches vs. Action and Conflict. OnCausal and International Explanations of Power. Sociological Theory, 3(2):30-45.
Kottaridi, C. (2005). FDI, Growth and the Role of Governance: Changing the Rules of The Game. Contributions to Political Economy, 24, 79-98.
Kumar, N. & Pradhan, J.P. (2002). Foreign Direct Investment, Externalities, andEconomic Growth in Developing Countries: Some Empirical Explorations and Implications for WTO negotiations on Investment. Research and Information System Discussion Paper Number 27/2002. New Delhi, India.
Kuznets, S. (1955). Economic Growth and Income Inequality.” American Economic Review, 45(1), 1-28.
Laffont, J. J & Tirole, J. (1991). Privatization and Incentives. Journal o f Law and Economics, 7, 84-105
Laffont, J. J. & Meleu, M. (1999). A Positive Theory of Privatization for Sub - Saharan African. Journal o f African Economies, 8, 30-67.
Landau, D. (1986). Government and Economic Growth in the Less DevelopedCountries: An Empirical Study for 1960-1980. Economic Development and Cultural Change, 35(1), 35-75.
123
Reproduced with permission of the copyright owner. Further reproduction prohibited without permission.

La Porta, R. & Lopez- de - Silanes, F. (1997). The Benefits of Privatization: Evidence From Mexico. National Bureau of Economic Research: Working Paper 6215.
Le Vu, M. & Suruga, T. (2005). Foreign Direct Investment, PublicExpenditure and Economic Growth: The Empirical Evidence for the Period 1970- 2001. Applied Economic Letters, 12, 45—49.
Lewis, C. (1948). Debtor and Creditor Nations: 1938 - 1944. The Brookings Institution: Washington, D.C.
Lewis, W.A. (1984). The State of Development Theory. American Economic Review, 74, 1- 10.
Li, W. & Xu, L.C. (2002). The Political Economy of Privatization and Competition: Cross- Country Evidence from the Telecommunications Sector, Journal o f Comparative Economics, 30, 439-462.
Loftman, P. (1995). The Politics of Evaluation Research: A Case Study of Birmingham’s Prestige projects. In L. A. Reese & D. Fasenfest. What Works Best? Values and the Evaluation of Local Economic Development Policy. Economic Development Quarterly, 11, 195- 208.
Lopez, H. (2003). Macroeconomics and Inequality. The World Bank ResearchWorkshop: Macroeconomic Challenges Inflow Income Countries. October 23- 24, 2003. Washington, DC
Makki, S. & Somwaru, A. (2004). Impact of Foreign Direct Investment andTrade on Economic Growth: Evidence from Developing Countries. American Journal o f Agricultural Economics, 86(3), 795-801
Malizia, E. E. & Feser, E. (2000). Undererstanding Local Economic Development.New Jersey: Center for Urban Policy Research.
Mansoor, Ali (1988). The Fiscal Impact of Privatization. In P. Cook and C. Kirkpatrick (Eds.), Privatization in Less Developed Countries (pp. 180-192). Sussex: Wheatsheaf Books
McKenzie, D. & Mookherjee, D. (2002). Distributive Impact o f Privatization inLatin America: An Overview o f Evidence from Four Countries, ’ Inter - American Development Bank Research Project and Universidad de las Americas - Puebla.
Megginson, W. L., Nash, R. C., & Randenborgh, M. V. (1994). The Financial andOperating Performance of Newly privatized Firms. An International Empirical Analysis. Journal o f Finance, 49(2), 403-52.
Megginson, W. & Netter, J. (2001). From State to Market: A Survey of Empirical Studies. Journal o f Economic Literature, 39(2), 321-389.
124
Reproduced with permission of the copyright owner. Further reproduction prohibited without permission.

Megginson, W. L. (2005). The Financial Economics o f Privatization. Oxford: Oxford University Press.
Meier, G. M. & Rauch, J. E. (2000). Leading Issues in Economic Development.Oxford: Oxford University Press
Mendez, F. & Glomm, G. (2005). Privatization, Deregulation, andCapital Accumulation. (July 9, 20051. http://ssm.eom/abstract-766984
Meredith, M. (2005). The Fate o f Africa: From the Hopes o f Freedom to the Heart o f Despair. New York: Public Affairs.
Miller, A. N. (1997). Ideological Motivations of Privatization in Great Britain versus Developing Countries. Journal o f International affairs, 50 (2), 391-399
Morley, S. (2001). The income Distribution Problem in Latin America and the Caribbean. Economic Commission for Latin America and the Caribbean:Santiago, Chile.
Mueller, D. C. (1979). Public Choice. Cambridge. Cambridge University Press.
Muller, E. (1993). Financial Dependence in the Capitalist World Economy and the Distribution Within States. In A. M. Seligson & J. T. Passe-Smith (Eds.), Development and Underdevelopment: The Political Economy o f Inequality (pp.267-293). Boulder: Lynne Reiner Publishers,
Musa, K. (1996). Privatization of Public Enterprises in the LDCs. In D. Campbell & B. Hollywood (Eds.), International Privatization. London: Kluwer.
Murphy, K. M., Shleifer, A., & Vishny, R. (1989). Income Distribution, Market Size, and Industrialization. The Quarterly Journal O f Economics, 104, 537-564.
Nafziger, W. (1997). The Economics o f Developing Countries. Englewood Cliffs, NJ: Prentice Hall.
Narula, R. & Portelli, B. (2004). Foreign Divestment and Economic Development:Opportunities and Limitations from a Developing Country Perspective. MERIT -
Information Research Memorandum Series 2004 - 009. Maastricht, The Netherlands.
Ndulu, B. J. & O’Connell, S. A. (1999). Governance and Growth in Sub - Saharan Africa. Journal o f Economic Perspectives. 13(3), 41-66.
Nyatepe-Coo, A. (1998). Foreign Direct Investment and Economic Growth in SelectedLDCs 1963-1992. In A. Levy-Livermore (Ed), Handbook on the Globalization o f the World Economy (pp. 87-100). Massachusetts: Edward Elgar Publisihing Inc.
125
Reproduced with permission of the copyright owner. Further reproduction prohibited without permission.

Nellis, J. (2006). Privatization- A Summary Assessment. Center for Global Development Working Paper 87. Washington DC.
Nellis, J. (2003). Privatization in Africa: What is happened? What is to be done? Center for Global Development, Working Paper Number 25.Washington, DC.
Nellis, J. (1995). Is Privatization Necessary? Viewpoint, Finance and private Sector Development, World Bank.
Nellis J. (1994): Is Privatization Necessary? Public Policy for the Private Sector FPD No. &. Washington DC. The World Bank
Niskanen, W. A. Jr. (1971). Bureaucracy and Representative Government. Chicago: Aldine
Niskanen, W. A. Jr. (1994). Bureaucracy and Public Economics. Aldershot. Edward Elgar Publishing Limited.
North, D. (1996). Privatization, Incentives and Economic Performance. In T. Anderson & P. Hill (Eds.), The Privatization Process: A worldwide perspective (pp. 25-37). Maryland: Rowman & Littlefield Publishers, Inc.
Okun, A. (1975). Equality and Efficiency: The Big Tradeoff Washington DC.Brookings Institution.
Olbeter E. (1994). Opening the global market for telecommunications. Issues in Science and Technology, 11(2), 57-65.
Olson, M. (1982). The Rise and Fall o f Nations: Economic Growth, Stagflation, and Social Rigidities. New Haven. Yale University.
Olson, M. Jr., Naveen, S. & Anand V. Swamy. (2000). Governance and Growth:A Simple Hypothesis Explaining cross-Country Differences in productivity Growth. Public Choice, 102, 341-364.
Omran, M. (2004). The Performance of State - Owned Enterprises and Newly Privatized Firms: Does Privatization Really Matter? World Development, 32 (6 ), 1019-1041.
Palmade, V. & Anayiolas, A. (2004). FDI Trends. Public Policy Note Number 273 Washington, DC. World Bank.
Parker, D. & Kirkpatrick, C. (2005). Privatization in Developing Countries: AReview of the Evidence and the Policy Lessons. Journal o f Development Studies, 41 (4), 513-541
126
Reproduced with permission of the copyright owner. Further reproduction prohibited without permission.

Pirie, M. (1986). Dismantling the State: The Theory and Practice o f Privatization.Texas: The National Center for Policy Analysis
Plane, P. (1997). Privatization and Economic Growth: An Empirical Investigationfrom a Sample of Developing Market Economies. Applied Economics 29(2), 161-179.
Ramamaurti, R. (1999). Why Haven’t Developing Countries privatized Deeper and Faster? World Development, 27(1), 137-155.
Ramamurti, R. (2000). A Multilevel Model of privatization in Emerging Economies. Academy o f Management, 25, 525-550.
Ramanadham, V. V. (1988). Public Enterprises and Income Distribution. London. Routlege.
Redding, S. & Venables, A. (2004). Economic Geography and Institutional Inequality. Journal o f International Economics, 62, 53-82.
Reese, L. A. & Fasenfest, D. (1997). What Works Best? Values and the Evaluation of Local Economic Development Policy. Economic Development Quarterly, 1 1 ,195- 208.
Reuveny, R. & Li, Q. (2003). Economic Openness, Democracy, and IncomeInequality: An Empirical Analysis. Comparative Political Studies, 36(5),575-601
Rodrik, D. (2006). Goodbye Washington Consensus, Hello Washington Confusion. http ://k.sshome. harvard. edu/~drodr i k/
_Rodrik, D., Arvind, S. & Trebbi, F. (2004). Institutions Rule: The Supremacy ofInstitutions over Integration and Geography in Economic Development. Journal o f Economic Growth, 9(2), 131-165.
Rodrik, Dani (2004). Rethinking Growth Policies in the Developing World. Paper Prepared for the Luca d’ Agliano Lecture in Development Economics (October, 8 ). Torino, Italy.
Roller, L. H. & Waverman, L. (2001). Telecommunications Infrastructure and Economic Development. The American Economic Review, 91, 909-923.
Romer, C. & Romer, D. (1998). Monetary Policy and the Well - Being o f the Poor. National Bureau of Economic Research Working Paper No. 6793. Cambridge, Massachusetts.
Ros, A. (1999). Does Ownership or Competition matter? The Effects of
127
Reproduced with permission of the copyright owner. Further reproduction prohibited without permission.

Telecommunications Reform on Network Expansion. Journal o f Regulatory Economics, 15(1), 65-92
Rothenberg, P. J. (1987). Privatization of Public Sector Services in Theory and Practice. Journal of Policy Analysis and Management, 6(4), 523-540.
Rubinson, R. (1977). Dependence, Government Revenue and Economic Growth1955-1970. Studies in Comparative International Development, 12(1), 3-28.
Sachs, J. (2003). Institutions Don’t Rule: Direct Effects of Geography on PerCapita Income. National Bureau of Economic Research Working Paper No.
9490. Cambridge, MA.
Sarel, M. (1997). How Macroeconomic factors Affect Income Distribution: The Cross-Country Evidence. New York: IMF Working Papers 152.
Savas, E. S. (1977). Policy Analysis for a Local Government: Public versus Private Refuse Collection. Policy Analysis, 3(1), 49-74.
Savas, E. S. (2000). Privatization and Public Private Partnerships. New York: Chatham House Publishers.
Seers, Dudley. (1969). The Meaning of Development. ”In E. Malizia and E. Feser 1999 Understanding Local Economic Development (p. 13). New Jersey: Center for Urban Policy Research
Sen, A. (1988). The Concept of Development. In Chenery, H & Srinivasn, T.N.(EDS.), Handbook o f Development Economics (pp. 10-24). Amsterdam. Elsevier Science Publishers.
Shapiro, C. & Willig, D. (1990). Economic Rationales for the Scope of Privatization.In E.N. Suleiman and J. Waterbury (Eds.), The Political Economy o f Public Sector Reform and Privatization (pp. 55-87). Boulder: Westview Press.
Sheshinki, E., & Lopez - Calva, L. F. (1999). Privatization and Its benefits: Theory and Evidence. Harvard Institute for International Development: Development Discussion Papers No. 698.
Shirley, M. (2003). Institutions and Development: A Statement of the problem. Unpublished Paper. The Ronald Coase Institute, Chevy Chase, MD.
Shirley, M. & Walsh, P. (2001). Public vs. Private Ownership: The Current State o f the Debate. Policy Research Working Paper No 2420. Washington, DC World Bank
Shleifer, Andrei. (1998). State versus Private ownership,’ Journal o f Economic Perspectives. 12(4), 133-150.
128
Reproduced with permission of the copyright owner. Further reproduction prohibited without permission.

Shleifer, A. & Vishny, R. (1994). Politicians and Firms. The Quarterly Journal o f Economics, 46, 995-1025.
Schipke, A. (2001). Why Do Governments Divest? The Macroeconomics o f Privatization. Berlin: Springer.
Soto, Hernando de. (1996). The Missing Ingredient What Poor Countries will to need to Make their markets work. In T. Anderson & P. Hill (Eds.), The Privatization Process: A worldwide perspective (pp. 19-24). Maryland: Rowman & Littlefield Publishers, Inc
Starr, P. (1988). The Meaning of Privatization,’ Yale Law and Policy Review, 6 , 6-41.
Stephan III, B. P. (1996). Towards a Positive Theory of Privatization-Lessons from Soviet Type Economies. International Review o f Law and Economics, 16,173-193.
Stiglitz, J. (1998). Towards a New Paradigm for Development. United NationsConference on Trade and Development. 9th Raul Prebisch Lecture. October 1998.
Stiglitz, J. (1998). The Role of Government in the Contemporary World. In TanziVito & Ke-young Chu (Eds.), Income Distribution and High Quality Growth (p.21 - 54). Cambridge: MIT Press.
Stock, J. H. & Watson, Mark W. (2003). Introduction to Econometrics. United States: Pearson Education, Inc.
Sylwester, Kevin. (2005). Foreign Direct Investment, Growth, and Income Inequality in Less Developed Countries. “International Review o f Applied Economics, 19(3), 289-300.
Tandon, P. (1997). Efficiency of Privatized Firms: Evidence and Implications.Economic and Political Weekly, 32(50), 3199-3212.
Tandon, P. (1995). Welfare Effects of Privatization: Some Evidence from Mexico:Boston University International Law Journal, 13 (2), 329-349
Tanzi, V. & Schuknecht, L. (2000). Public Spending in the 20th Century: A Global Perspective. Cambridge Cambridge University Press.
Tsai, P. L., (1995). Foreign Direct Investment and Income Inequality: Further Evidence. World Development, 23, 469-483.
United Nations (2004). Implementation of the First United nations Decade for theEradication of Poverty (1997-2006). 58th General Assembly Session Agenda Item 58 Resolution 11: A/58/488. United Nations. New York.
129
Reproduced with permission of the copyright owner. Further reproduction prohibited without permission.

United Nations Conference on Trade and Development (2006). Recognition of the Problems of Land Locked Developing Countries
http://www.imctad.org/Teniplates/Page.asp?
United Nations (2005). United Nations Office of the High Representative for the Least Developed Countries, Landlocked Developing Countries, and Small Island
Developing States.http://www.un.org/special-rep/ohrlls/ohrlls/default.htm
United Nations University / World Institute for Development Economics Research,World Income Inequality (WIDER) Database (2000). httn://www.wider.unu.edu/wiid/wiid-introduction.htm
Vemon-Wortzel, H. & Wortzel, H. L. (1989). Privatization not the only Answer,’World Development, 17(5), 633-641.
Vickers, J. & Yarrow, G. (1988). Privatization: An Economic Analysis. Cambridge, Mass. M IT Press.
Vernon, R. & Aharaoni, Y. (Eds.) (1981). State-Owned Enterprises in the Western Economies. New York: St. Martin’s Press.
Vernon, R. (ed.) (1988). The Promise o f Privatization: A Challenge for US Economic Policy. New York: Council on Foreign Relations.
Vernon, H. J., Shalizi, Z. & Venables, A. J. (2000). Geography and Development. Policy Research Working Paper No. 2456. World Bank. Washington, DC.
Villalonga, B. (2000). Privatization and Efficiency: Differentiating Ownership Effects from Political, Organizational, and Dynamic Effects. Journal o f Economic
Behavior and Organization, 42, 43-74.Villalonga, B. (2000). Privatization and Efficiency: Differentiating Ownership effects
Political, Organizational, and Dynamic effects. Journal o f Economic Behavior and Organizations, 4(1), 43-74.
Wallsten, S. J. (2001). An Econometric Analysis of Telecom Competition, Privatization and Regulation in Africa and Latin America. Journal o f Industrial Economics, 59:(1), 1-19.
World Bank Privatization Database, http://rru.worldbank.org/privatization (accessed 01 February 2006)
World Bank (2005). Economic Growth in the 1990s: Learning from a Decade o f Reform. World Bank: Washington, DC.
World Bank. (1995). Bureaucrats in Business: The Economics and Politics o f Government Ownership. Oxford University Press, New York.
130
Reproduced with permission of the copyright owner. Further reproduction prohibited without permission.

World Bank (1992). Privatization: The Lessons of Experience. World Bank Policy Research Bulletin, August -October; Volume 3, Number 4.
World Bank (1992). Governance and Development. World Bank: Washington, DC.
World Bank (2006). World Development Report: Equity and Development. Washington, DC. World Bank.
World Economic Outlook (WEO) Database September 2000. http://www.imf.org Accessed on 04/04/2006.
Yarrow, George (1999). Why Bureaucrats are still in Business? World Development, 27(1), 111-132
Yoder, R., Borkholder, P. & Friesen, B. D. (1991). Privatization and Development: The Empirical Evidence. Journal o f Developing Areas, 25, 425-434.
Zagha, R., Nankani, G. & Gill, I. (2006). Rethinking Growth. Finance and Development, 43(1), 7-11
Zinnes, C., Yair, E. & Sachs, J. (2001). The Gains from Privatization in Transition Economies: Is Change of Ownership Enough? New York: IMF Staff papers,
Volume 48 Special Issue.
Zhang, K. H. (2001). Does Foreign Direct Investment Promote Economic Growth? Evidence from East Asia and Latin America. Contemporary Economic Policy, 19(2), 175-185.
Reproduced with permission of the copyright owner. Further reproduction prohibited without permission.
131

Appendix
Table 1A : Privatization Revenues and Economic Growth Rate Data 1991—2002
Countries PR/GDP AGDP Countries PR/GDP
Angola 0.08 6.88 Ecuador 0.82 1.32
Benin 1.38 5.18 El Salvador 11.49 3.08
Burkina Faso 0.45 5.18 Grenada 1.62 4.48
Burundi 0.45 1.65 Guatemala 6.90 3.45
Cameroon 4.04 4.73 Guyana 2.42 1.57
Chad 0.06 5.82 Haiti 0.46 1.13
Congo Rep. 0.12 2.52 Honduras 1.29 2.67
Cote d’Ivoire 5.34 2.15 Jamaica 4.83 0.77
Eritrea 0.31 3.02 Mexico 11.56 3.87
Ethiopia 4.24 4.57 Nicaragua 0.01 4.48
Gabon 0.06 0.30 Panama 7.77 2.6
Ghana 14.74 4.28 Paraguay 0.28 0.95
Guinea 1.34 4.05 Peru 15.43 2.33
Kenya 2.74 1.25 Uruguay 0.08 -1.43
Lesotho 6.88 2.62 Venezuela 7.02 0.05
Madagascar 1.25 2.30 Algeria 0.03 2.8
Malawi 1.44 2.18 Bahrain 0.14 4.4
Mali 1.76 5.47 Egypt 5.51 4.57
Mauritania 5.19 4.28 Iran 0.02 4.45
Mauritius 6.74 5.4 Jordan 9.39 3.78
Mozambique 6.74 9.28 Lebanon 0.77 1.83
Niger 1.49 3.58 Morocco 16.58 2.88
132
AGDP
Reproduced with permission of the copyright owner. Further reproduction prohibited without permission.

Table 1A : Privatization Revenues and Economic Growth Rate Data 1991- 2002
Countries PR/GDP AGDP Countries PR/GDP
Nigeria 3.23 1.75 Oman 3.09 4.07
Sao Tome and Qatar
Principe 0.00 3.00 0.00 9.78
Senegal 8.47 5.33 Saudi Arabia 0.00 1.90
Sierra Leone 0.25 -1.78 Tunisia 2.70 4.97
South Africa United Arab
2.42 2.27 Emirates 0.32 4.22
Sudan 0.09 7.32 Yemen Rep. 0.01 4.87
Tanzania 4.96 4.53 Bangladesh 0.18 5.00
Togo 0.99 1.48 India 2.9 5.33
Uganda 4.71 5.62 Nepal 0.01 4.08
Zambia 24.26 2.65 Pakistan 4.43 3.58
Zimbabwe 3.99 -3.22 Sri Lanka 5.88 3.95
Argentina 14.53 -2.12 China 4.00 7.75
Bolivia 0.05 2.62 Fiji 0.11 2.28
Brazil 20.59 1.95 Lao PDR 0.04 5.78
Chile Papua New
0.23 3.03 Guinea 5.42 -0.52
Colombia 4.46 0.85 Philippines 6.09 3.27
Costa Rica 0.02 4.82 Thailand 2.94 0.4
Dominican Rep 4.71 6.18 Vietnam 0.04 5.28
Sources: World Bank Privatization Database; Human Development Report, 2005; World
Economic Outlook (2004) and Global Development Network Growth Database
133
AGDP
Reproduced with permission of the copyright owner. Further reproduction prohibited without permission.

Reproduced with
permission
of the copyright owner.
Further reproduction prohibited
without permission.
Table 2A: Privatization Revenues, and Income Inequality Data 1991- 2002
Countries INEQ 10% INEQ 20% Countries INEQ 10%
Burkina Faso 26.20 13.60 Ecuador 44.90 17.30
Burundi 19.30 9.50 El Salvador 47.40 19.80
Congo Rep. 15.70 9.10 Guatemala 55.10 24.40
Cote d’Ivoire 16.60 9.70 Honduras 49.10 21.50
Ethiopia 6.60 4.30 Jamaica 11.40 6.90
Ghana 14.10 8.40 Mexico 45.00 19.30
Guinea 12.30 7.30 Nicaragua 15.50 8.80
Kenya 13.60 8.20 Panama 62.30 24.70
Lesotho 105.00 44.20 Paraguay 73.40 27.80
Madagascar 19.20 11.00 Peru 49.90 18.40
Malawi 22.70 11.60 Uruguay 18.90 10.40
Mali 23.10 12.20 Venezuela 62.90 17.90
Mauritania 12.00 7.40 Bahrain 9.60 6.10
Mozambique 12.50 7.20 Egypt 8.00 5.10
134
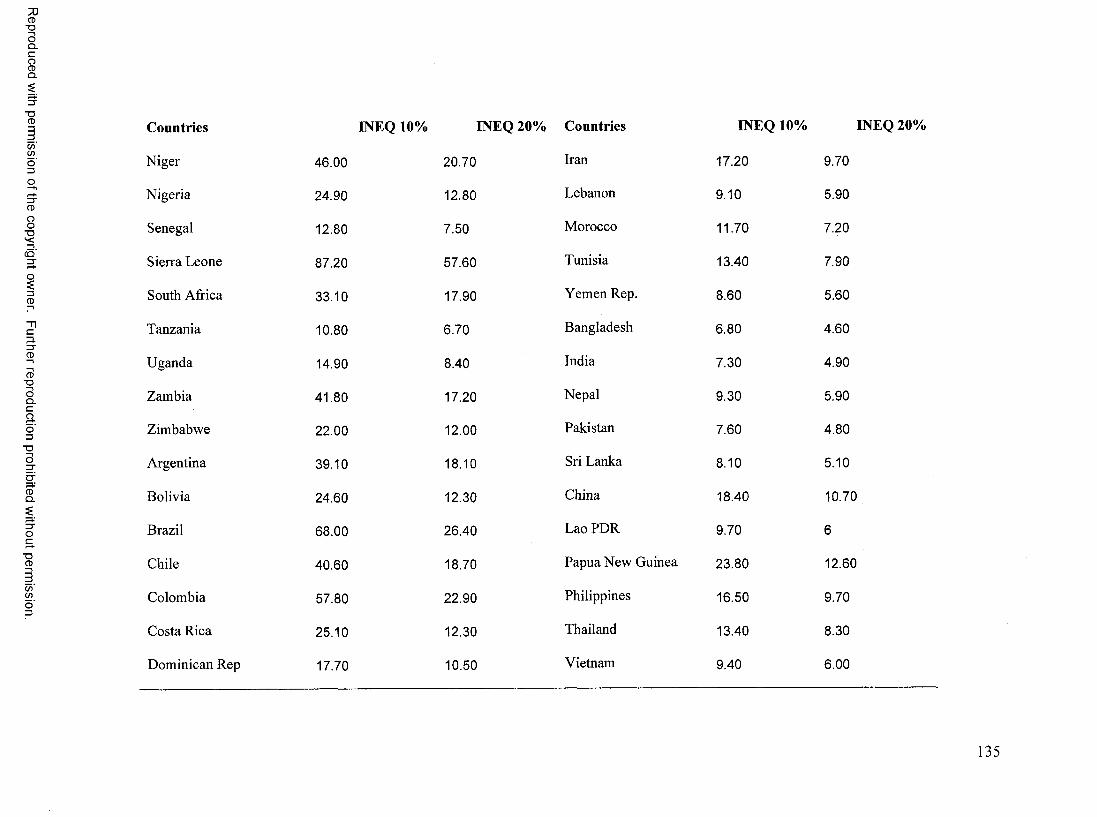
Reproduced with
permission
of the copyright owner.
Further reproduction prohibited
without permission.
Countries
Niger
Nigeria
Senegal
Sierra Leone
South Africa
Tanzania
Uganda
Zambia
Zimbabwe
Argentina
Bolivia
Brazil
Chile
Colombia
Costa Rica
Dominican Rep
INEQ 10%
46.00
24.90
12.80
87.20
33.10
10.80
14.90
41.80
22.00
39.10
24.60
68.00
40.60
57.80
25.10
17.70
INEQ 20%
20.70
12.80
7.50
57.60
17.90
6.70
8.40
17.20
12.00
18.10
12.30
26.40
18.70
22.90
12.30
10.50
Countries
Iran
Lebanon
Morocco
Tunisia
Yemen Rep.
Bangladesh
India
Nepal
Pakistan
Sri Lanka
China
Lao PDR
Papua New Guinea
Philippines
Thailand
Vietnam
INEQ 10%
17.20
9.10
11.70
13.40
8.60
6.80
7.30
9.30
7.60
8.10
18.40
9.70
23.80
16.50
13.40
9.40
INEQ 20%
9.70
5.90
7.20
7.90
5.60
4.60
4.90
5.90
4.80
5.10
10.70
6
12.60
9.70
8.30
6.00
135

Table 3A: Variables, Symbols, and Sources of Data Collection
Variable Symbol Source of Data
Privatization Revenues PR World Bank Privatization Database andasa percentage of GDP
World Economic Outlook (2004)
INFLATION INF World Economic Outlook (2004)FDI share in GDP FDI/GDP Global Development Network Growth
Database And UNCTAD FDI database online
Real GDP growth rate GROWTH World Economic Outlook (2004) and Global Development Network Growth Database
Real GDP per capita RGCAP World Economic Outlook (2004) and Global Development Network Growth Database
Governance GOV Kaufmann et al. (2005)
Trade share as a OPEN Global Development Network Growthpercentage of GDP DatabaseSecondary School SEC. Global Development Network Growthenrolment DatabaseShare of income of richest and poorest 2 0 % of population.
INEQ20% Human Development Report, 2005
Share of income of richest and poorest 1 0 % of population.
INEQ 10% Human Development Report, 2005
Population growth rate POP Global Development Network Growth Database
Landlocked LLOCK http://www.un.org/special-rep/ohrlls/lldc/list.htm
136
Reproduced with permission of the copyright owner. Further reproduction prohibited without permission.

Table 4A: List of Landlocked Countries.
Landlocked country Region
Bolivia Latin America
Burkina Faso Sub-Saharan Africa
Burundi Sub-Saharan Africa
Chad Sub-Saharan Africa
Ethiopia Sub-Saharan Africa
Laos Republic Sub-Saharan Africa
Lesotho Sub -Saharan Africa
Malawi Sub -Saharan Africa
Mali Sub -Saharan Africa
Nepal Asia
Niger Sub -Saharan Africa
Paraguay Latin America
Uganda Sub -Saharan Africa
Zambia Sub -Saharan Africa
Zimbabwe Sub -Saharan Africa
Reproduced with permission of the copyright owner. Further reproduction prohibited without permission.

Table 5A: Variables Used in StudyINF9102 Inflation 1991-2002
ARGDP9102 Average Real GDP Growth 1991- 2002
PR19102 Privatization Revenues as a percentage of GDP 1991-2002
INEQ 10% Ratio of the richest and poorest 10% of population
INEQ20% Ratio of the richest and poorest 10% of population
POP9102 Average population growth rate 1991- 2002
FDI9102 Average FDI 1991 - 2002
INIGCAP91 Initial Real GDP per capita 1991
LIRGNICAP91 Log of the Initial Real GDP per capita
LGCAPSQ Square of LIRGNICAP91
PRIFDI Privatization and FDI interaction
PRIOPEN Privatization ad Openness interaction
PRIGOV Privatization ad Governance interaction
SSA Dummy Sub -Saharan Africa
LA Dummy for Latin America
AS Dummy for Asia
MENA Middle East and North African countries
PRSSA Privatization Sub-Saharan Africa interaction
PRLA Privatization Latin American interaction
PRAS Privatization Asian interaction
FAC1_2 Governance 1996 - 2002
Voice Voice and Accountability
POLST Political Instability
GOVEFF Government Effectiveness
EEG Regulatory Quality
Rule Rule of Law
CORR Corruption
LLOCK Dummy for Landlocked
Reproduced with permission of the copyright owner. Further reproduction prohibited without permission.
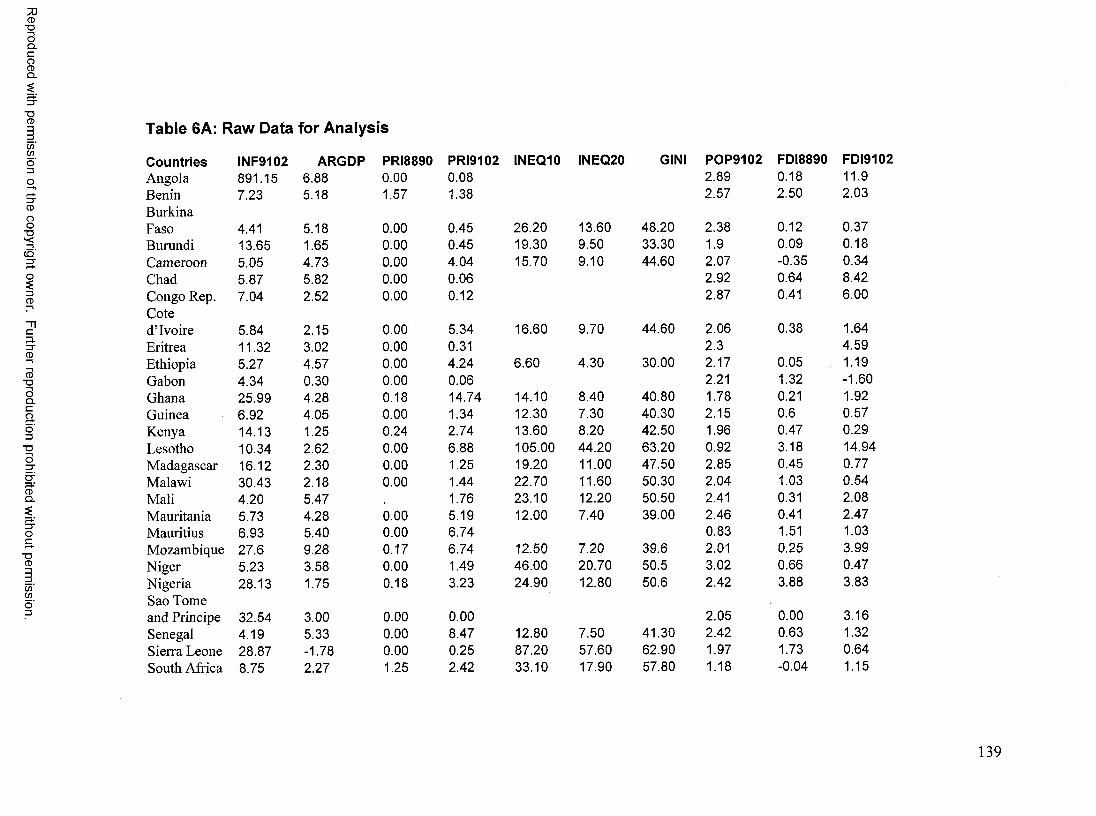
Reproduced with
permission
of the copyright owner.
Further reproduction prohibited
without permission.
Table 6A: Raw Data for Analysis
Countries INF9102 ARGDP PRI8890 PRI91Angola 891.15 6.88 0.00 0.08Benin 7.23 5.18 1.57 1.38BurkinaFaso 4.41 5.18 0.00 0.45Burundi 13.65 1.65 0.00 0.45Cameroon 5.05 4.73 0.00 4.04Chad 5.87 5.82 0.00 0.06Congo Rep. 7.04 2.52 0.00 0.12Coted’Ivoire 5.84 2.15 0.00 5.34Eritrea 11.32 3.02 0.00 0.31Ethiopia 5.27 4.57 0.00 4.24Gabon 4.34 0.30 0.00 0.06Ghana 25.99 4.28 0.18 14.74Guinea 6.92 4.05 0.00 1.34Kenya 14.13 1.25 0.24 2.74Lesotho 10.34 2.62 0.00 6.88Madagascar 16.12 2.30 0.00 1.25Malawi 30.43 2.18 0.00 1.44Mali 4.20 5.47 1.76Mauritania 5.73 4.28 0.00 5.19Mauritius 6.93 5.40 0.00 6.74Mozambique 27.6 9.28 0.17 6.74Niger 5.23 3.58 0.00 1.49Nigeria 28.13 1.75 0.18 3.23Sao Tomeand Principe 32.54 3.00 0.00 0.00Senegal 4.19 5.33 0.00 8.47Sierra Leone 28.87 -1.78 0.00 0.25South Africa 8.75 2.27 1.25 2.42
INEQ10 INEQ20 GINI
26.20 13.60 48.2019.30 9.50 33.3015.70 9.10 44.60
16.60 9.70 44.60
6.60 4.30 30.00
14.10 8.40 40.8012.30 7.30 40.3013.60 8.20 42.50105.00 44.20 63.2019.20 11.00 47.5022.70 11.60 50.3023.10 12.20 50.5012.00 7.40 39.00
12.50 7.20 39.646.00 20.70 50.524.90 12.80 50.6
12.80 7.50 41.3087.20 57.60 62.9033.10 17.90 57.80
POP9102 FDI8890 FDI91022.89 0.18 11.92.57 2.50 2.03
2.38 0.12 0.371.9 0.09 0.182.07 -0.35 0.342.92 0.64 8.422.87 0.41 6.00
2.06 0.38 1.642.3 4.592.17 0.05 1.192.21 1.32 -1.601.78 0.21 1.922.15 0.6 0.571.96 0.47 0.290.92 3.18 14.942.85 0.45 0.772.04 1.03 0.542.41 0.31 2.082.46 0.41 2.470.83 1.51 1.032.01 0.25 3.993.02 0.66 0.472.42 3.88 3.83
2.05 0.00 3.162.42 0.63 1.321.97 1.73 0.641.18 -0.04 1.15
139
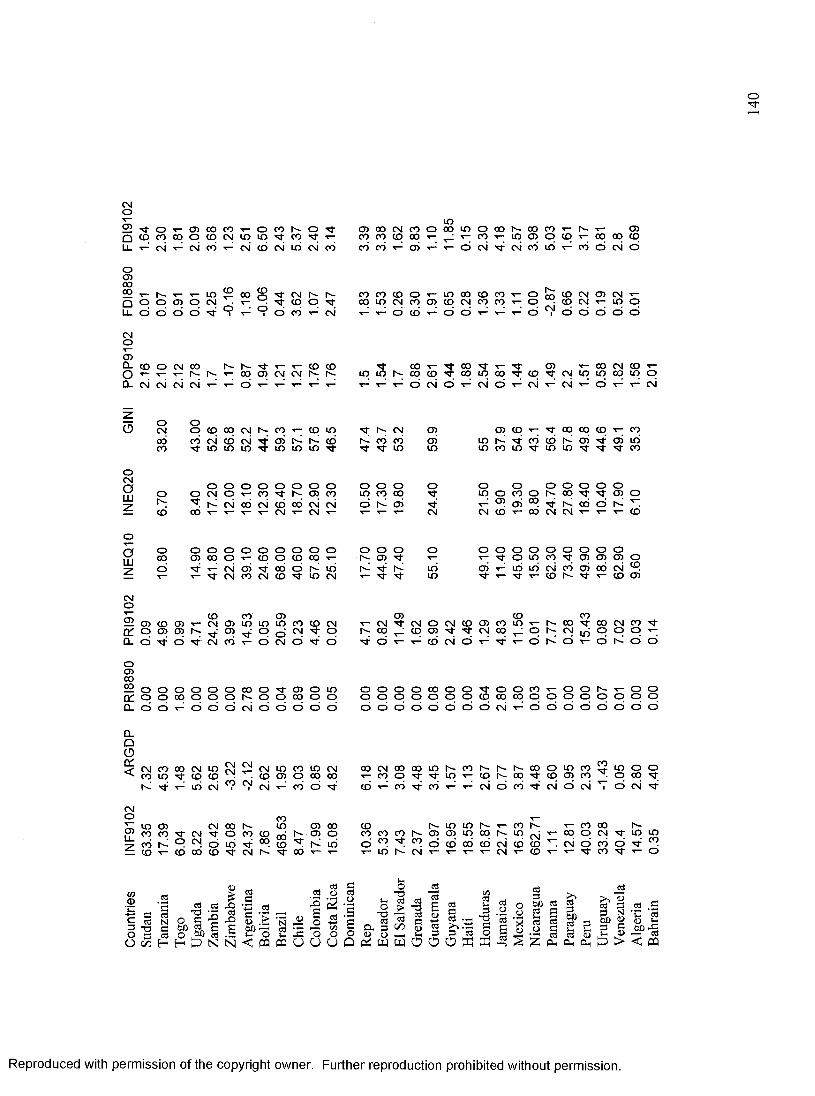
ox t
CMOX—CD xt* o c d 00 CO o CO Is - o x r CD 00 CM CO o
m00 LO
Q CO CO CO o CO CM in in x t CO x t CO CO cq CO x— x—
L L CM x-^ CM CO x - 1 CM cd CM in CM cd cd cd x - 1 c d x L x— O
OCO
CO N CO COin cd o co
CM M- CM CO in COCOo
o0500CO
oIs-o CD o
inCM
CO 00 COo x t
x tCMCO
Is-o
h -Xl*
COCO
COin
COCM
oCO
x— CD
inCO
00CM
COCO
coCO
X - o X - o
Is-00 CO
COCMCM
CDX—
o cd cd cd x to 1 x - 1
o1 cd cd x - 1 CM x— X““ cd CD x—: cd cd X - X- " x- 1 cd CM
1 cd cd cd
CMo
CLo CO o CM 0 0Is- Is-
Is - Is -0 0
x tCD
X“CM CM
COIs -
COIs- in
X tLO Is -
0 00 0 5
x tx f
o o0 0
x tLO 0 0
x tx t CD
CDx t CM
x—LO
0 0in
CL c \i CM CM CM T— ■*” cd T_ T_ XT" T—T“ r ~ T _ T_ cd CM cd CM cd T _ CM T _ CM x-* cd
GIN
I
oCM
oo CO 0 0 CM Is- co X— CD in X t Is- CM CD CD CD x t 0 0 0 0 cp
0 0CO
cdx t
CMin
cdin
CMin
x tx t
CDin m
1 ^in
cdx t
h -x t
cdx t
cdin
cdin
inin CO
x fin
COxT
cdin in
CDx t
x tx t
oCMaLU
aLUz:
or-cd
oCO
O O O o O O O O o o O oO CM o x— CO x t Is- CD CO m CO 00 x rx t Is-* CM CO CM CD oo CM CM cd Is- CD x tcd T— ’r_* T—T—CM CM CM
o O o o o O o O o o o o oCD 00 o x— cp O CO CO x— Is- CD x t X—
XT X— CM CD x t 00 cd 1^ in i^ x t r - inx t CM CO CM CD M - LO CM X— M - x t in
o O o O o om O CO O Is- OO 'M*■'L o> CD 00 x t 00 cdCM CD T~ cd CM CM X— X—
o oM;
oo
oin
oCO
oxfr
oCD
oCD
CD’M*
in in CMCD
cdIs-
CDM"
CO
CMo
CD CD CD CDCOCM CD
COLO LO
CDLO CO CD CM CM
CDx t CM O CM CD CD CO
CDin X— r^ 00
COx r 00
OL O CD CD Is- CD O o CM M; o Is- 00 x— CO CD CM 00 O r- CM id oCL cd M* cd M- CM cd cd CM cd x ^ cd cd x - 1 CD CM cd x— x r x - cd cd cd
oo>0000 O o o o o o 00 o xj- CD o in o o o o 00 o o x r o o CO o o Is-O ' o o oo o o o h - o o 00 o o o o o o o o o CD 00 00 o o o o oCL cd cd x - cd cd cd CM cd cd cd cd cd cd cd cd cd cd cd cd cd CM X” cd cd cd cd cd
CLo0a:< CM CO oo CM in CM
CMCM CM in CO m CM oo CM 00 00 in Is - CO Is- Is- r - 00 o m CO
CO in x r CD CD CD CD o 00 00 X— CO o x r x f in x — co Is- 00 x t CD CD COh-i x t X -’ in CM CO1 CM1 CM X” cd c d Xj- CD x - 1 c d x f cd X— x L CM cd cd x t CM cd CM
COXT
CMo
inCO
CDCO x t CM
CMx t
00O
Is-co CD
COin00CD
Is -CDCD
00o
CDCO CO CO Is-
Is-<D
LOCD
inin
Is-00 Is -
COLO CM
CD00
coo
00CM
cd r-^ O CM cd in X t 00 X t r-i in cd CO x r co cd CD 00 CD CM CD CM cd cdCO CD 00 CD xl* CM r-^ M- 00 X— x — x — in CM X— x — x— x— CM CD x— x - x t CO
O)a)C § 2O S3O cn
OS oj
° I -2 !?S > §
o£
40cjs
(gL-> cd§ : s*>3
S §ocs
n U M f f l . S 3 J - . ^ n i - i ^ O — h >-* !-» w w S 3 i - H V!!*H p N N < ( a c Q U U U Q p 5 W W O O O W f f i “ S ^COO
O -TO aOh 53<i> O
J -OT3cd
*2:13oo3 .OS
C/3Cd
IGO
cdG ^ bD cda a
&§>cdcdCL
&6o
Reproduced with permission of the copyright owner. Further reproduction prohibited without permission.
Ven
ezue
la
40.4
0.05
0.01 7
.02
62.90
17
.90
49.1
1.82
0.52
2.8
Alg
eria
14
.57
2.80
0.00 0
.03
9.60
6.10
35.3
1.56
0.01
0.69
Bahr
ain
0.35
4.40
0.00
0.14
2.01

Reproduced with
permission
of the copyright owner.
Further reproduction prohibited
without permission.
CountriesEgyptIranJordanLebanonMoroccoOmanQatarSaudiArabiaTunisiaUnitedArabEmiratesYemenRep.BangladeshIndiaNepalPakistanSri LankaChinaFijiLao PDRPapua NewGuineaPhilippinesThailandVietnam
INF91027.8822.583.2417.953.650.172.38
0.634.14
3.53
32.575.138.23 8.63 8.26 10.086.24 3.4229.53
9.777.943.9914.76
ARGDP4.574.453.78 1.83 2.88 4.079.78
1.904.97
4.22
4.875.005.334.083.583.957.752.285.78
-0.523.27 0.405.28
PRI88900.000.000.000.000.000.000.00
0.000.14
0.00
0.000.010.000.000.030.300.000.000.00
0.000.210.150.00
PRI91025.510.029.390.7716.583.090.00
0.002.70
0.32
0.010.182.900.014.435.884.000.110.04
5.426.092.940.04
INEQ10 INEQ20 GINI 8.00 5.10 34.417.20 9.70 439.10 5.90 36.4
11.70 7.20 39.5
13.40 7.90 39.80
8.60 5.60 33.406.80 4.60 31.807.30 4.90 32.509.30 5.90 36.707.60 4.80 33.008.10 5.10 33.2018.40 10.70 44.70
9.70 6.00 37.00
23.8 12.60 50.9016.50 9.70 46.1013.40 8.30 43.209.40 6.00 37.00
POP9102 FDI8890 FDI91021.82 2.75 1.111.56 -0.09 0.082.76 0.43 1.821.28 0.09 0.841.60 0.58 2.312.39 1.30 0.582.14
2.781.10 0.66 2.53
7.35 -2.71 2.00
3.03 0.00 2.721.74 0.01 0.181.55 0.06 0.492.26 0.76 0.282.41 0.54 0.861.46 0.49 1.240.67 1.00 4.260.77 3.30 2.302.32 3.88 5.10
2.33 4.98 3.002.06 1.66 1.910.7 2.37 2.491.16 0.96 6.45
141

Reproduced with
permission
of the copyright owner.
Further reproduction prohibited
without permission.
Country OPEN9102Angola 148.92Benin 43.77Burkina Faso 35.17Burundi 26.69Cameroon 52.29Chad 55.78Congo Rep. 133.84Cote d ’Ivoire 74.36Eritrea 101.56Ethiopia 43.09Gabon 90.83Ghana 91.96Guinea 48.96Kenya 60.87Lesotho 134.19Madagascar 53.49Malawi 64.46Mali 64.38Mauritania 96.24Mauritius 127.37Mozambique 49.59Niger 41.08Nigeria 79.74Sao Tome andPrincipe 117.47Senegal 68.05Sierra Leone 43.47South Africa 53.07Sudan 25.58Tanzania 41.82Togo 77.4Uganda 35.11
INIGCAP91 LIRGNIGCAP1882.48 3.271023.53 3.01892.79 2.95833.90 2.922135.25 3.331083.12 3.032092.38 3.322091.39 3.32
511.01 2.719104.97 3.961191.28 3.082452.98 3.391311.74 3.121267.98 3.10898.82 2.95654.58 2.82754.13 2 . 8 8
1385.4 3.149489.48 3.98940.66 2.97935.59 2.971065.86 3.03
1453.22 3.161482.53 3.171154.31 3.067599.92 3.881039.00 3.02494.12 2.691271.12 3.10695.43 2.84
PRIFDI PRIOPEN PRIGOV SSA LAMERICA MENA11.91 0.95 -0.17 0 0 0
60.40 2.80 0.53 0 0 0
15.83 0.17 -0.05 0 0 0
1 2 . 0 1 0.08 -0.76 0 0 0
211.25 1.37 -4.03 0 0 0
3.35 0.51 -0.05 0 0 0
16.06 0.72 -0.19 0 0 0
397.08 8.76 -2.4 0 0 0
31.48 1.42 -0 . 0 1 0 0 0
182.7 5.05 -1.9 0 0 0
5.45 -0 . 1 0 -0 . 0 2 0 0 0
1355.49 28.30 3.6 0 0 0
65.61 0.76 -0.98 0 0 0
166.78 0.79 -2.47 0 0 0
923.23 102.79 3.11 0 0 0
6 6 . 8 6 0.96 -0 . 0 2 0 0 0
92.82 0.78 0 . 1 0 0 0 0
113.31 3.66 -0 . 6 8 0 0 0
499.49 12.82 0 . 0 2 0 0 0
858.47 6.94 1 1 . 8 6 0 0 0
334.24 26.89 -1.45 0 0 0
61.21 0.70 -1.06 0 0 0
257.56 12.37 -4.96 0 0 0
0 . 0 0 0 . 0 0 0 . 0 0 0 0 0
576.38 11.18 0.04 0 0 0
10.87 0.16 -0.38 0 0 0
128.43 2.78 2.51 0 0 0
2.3 0.15 -0.19 0 0 0
207.43 11.41 -4.26 0 0 0
76.63 1.79 -0.38 0 0 0
165.37 9.84 -2.18 0 0 0
142
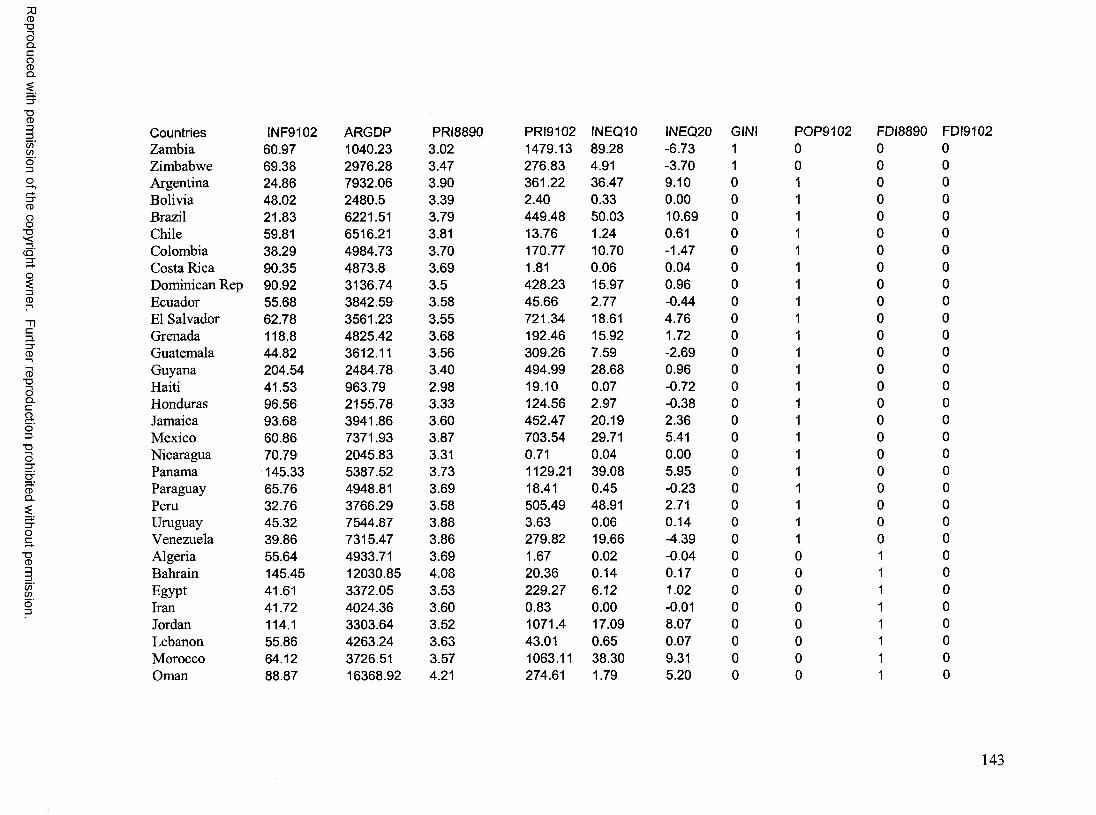
Reproduced
with perm
ission of the
copyright owner.
Further reproduction prohibited
without perm
ission.
Countries INF9102 ARGDP PRI8890Zambia 60.97 1040.23 3.02Zimbabwe 69.38 2976.28 3.47Argentina 24.86 7932.06 3.90Bolivia 48.02 2480.5 3.39Brazil 21.83 6221.51 3.79Chile 59.81 6516.21 3.81Colombia 38.29 4984.73 3.70Costa Rica 90.35 4873.8 3.69Dominican Rep 90.92 3136.74 3.5Ecuador 55.68 3842.59 3.58El Salvador 62.78 3561.23 3.55Grenada 118.8 4825.42 3.68Guatemala 44.82 3612.11 3.56Guyana 204.54 2484.78 3.40Haiti 41.53 963.79 2.98Honduras 96.56 2155.78 3.33Jamaica 93.68 3941.86 3.60Mexico 60.86 7371.93 3.87Nicaragua 70.79 2045.83 3.31Panama 145.33 5387.52 3.73Paraguay 65.76 4948.81 3.69Peru 32.76 3766.29 3.58Uruguay 45.32 7544.87 3.88Venezuela 39.86 7315.47 3.86Algeria 55.64 4933.71 3.69Bahrain 145.45 12030.85 4.08Egypt 41.61 3372.05 3.53Iran 41.72 4024.36 3.60Jordan 114.1 3303.64 3.52Lebanon 55.86 4263.24 3.63Morocco 64.12 3726.51 3.57Oman 88.87 16368.92 4.21
P R 0 102 INEQ10 INEQ201479.13 89.28 -6.73276.83 4.91 -3.70361.22 36.47 9.102.40 0.33 0.00449.48 50.03 10.6913.76 1.24 0.61170.77 10.70 -1.471.81 0.06 0.04428.23 15.97 0.9645.66 2.77 -0.44721.34 18.61 4.76192.46 15.92 1.72309.26 7.59 -2.69494.99 28.68 0.9619.10 0.07 -0.72124.56 2.97 -0.38452.47 20.19 2.36703.54 29.71 5.410.71 0.04 0.001129.21 39.08 5.9518.41 0.45 -0.23505.49 48.91 2.713.63 0.06 0.14279.82 19.66 -4.391.67 0.02 -0.0420.36 0.14 0.17229.27 6.12 1.020.83 0.00 -0.011071.4 17.09 8.0743.01 0.65 0.071063.11 38.30 9.31274.61 1.79 5.20
POP 9102 FDI8890 FDI91020 0 00 0 01 0 01 0 01 0 01 0 01 0 01 0 01 0 01 0 01 0 01 0 01 0 01 0 01 0 01 0 01 0 01 0 01 0 01 0 01 0 01 0 01 0 01 0 00 1 00 1 00 1 00 1 00 1 00 1 00 1 00 1 0
GINI11000000000000000000000000000000
143

Reproduced with
permission
of the copyright owner.
Further reproduction prohibited
without permission.
Countries INF9102 ARGDPQatar 77.74Saudi Arabia 63.52 12862.99 4.11Tunisia 91.03 5025.46 3.70United ArabEmirates 78.05Yemen Rep. 136.5 927.75 2.97Bangladesh 32.38 1293.23 3.11India 25.98 1665.63 3.22Nepal 69.43 1139.11 3.06Pakistan 55.47 1798.27 3.25Sri Lanka 35.83 2593.53 3.41China 80.69 1977.23 3.30Fiji 44.91 5013.84 3.70Lao PDR 67.87 1107.22 3.04Papua NewGuinea 93.63 2983.59 3.47Philippines 102.76 2949.8 3.47Thailand 108.25 5166.63 3.71Vietnam 103.64 1129.78 3.05
PRI8890 PRI9102 INEQ10 INEQ200.00 0.00 0.000.00 0.00 0.00245.78 6.83 2.67
24.98 0.64 0.521.37 0.03 -0.015.83 0.03 -0.0975.34 1.42 0.770.69 0.00 0245.73 3.81 -3.71210.68 7.29 0.37322.76 17.04 0.114.94 0.25 0.052.71 0.20 -0.04
507.47 16.26 2.16625.81 11.63 -2.71318.26 7.32 2.434.15 0.26 -0.02
GINI POP9102 FDI8890 FDI91020 1 00 1 00 1 0
0 1 00 1 00 0 10 0 10 0 10 0 10 0 10 0 10 0 10 0 1
0 0 10 0 10 0 10 0 1
000
00
00000000
0000
144

Reproduced
with perm
ission of the
copyright owner.
Further reproduction prohibited
without perm
ission.
Country LGDCPSQAngola 10.72Benin 9.06BurkinaFaso 8.71Burundi 8.53Cameroon 11.09Chad 9.21Congo Rep. 11.03Coted’Ivoire 11.03EritreaEthiopia 7.34Gabon 15.68Ghana 9.46Guinea 11.49Kenya 9.72Lesotho 9.63Madagascar 8.72Malawi 7.93Mali 8.28Mauritania 9.87Mauritius 15.82Mozambique 8.84Niger 8.83Nigeria 9.17Sao Tomeand Principe 10.00Senegal 10.06Sierra Leone 9.38South Africa 15.06Sudan 9.10Tanzania 7.26
VOICE POLST-1.37 -2.020.46 0.59
-0.32 -0.14-1.42 -1.95-0.95 -0.68-0.86 -1.12-1.23 -1.51
-0.85 -0.65-1.41 -0.03-0.86 -0.72-0.42 -0.14-0.22 0.02-1.11 -1.19-0.67 -0.83-0.04 0.590.21 0.050.29 0.31-0.21 -0.17-0.77 0.30.97 1.18-0.34 0.12-0.41 -0.2-1.09 -1.41
0.76 0.56-0.15 -0.68-1.26 -1.790.83 -0.53-1.71 -2.28-1.12 -0.49
GOVEFF-1.42-0.15
-0.39-1.18-0.67-0.53-1.25
-0.47- 0.22-0.44-0.70-0.03-0.60-0.74-0.08-0.46-0.60-0.40-0.060.59-0.63-0.90-1.17
-0.69-0.03-0.900.38-1.44-0.91
REG9602 RULE9602-1.49 -1.47-0.11 -0.29
-0.16 -0.55-1.18 -0.85-0.43 -1.09-0.47 -0.70-0.94 -1.23
-0.17 -0.75-0.38 -0.19-0.62 -0.33-0.23 -0.41-0.01 -0.1-0.17 -0.91-0.33 -0.94-0.36 -0.14-0.23 -0.700.03 -0.63-0.46 -0.87-0.35 -0.50.47 0.85-0.21 -0.4-0.56 -0.89-0.75 -1.22
-0.57 -0.73-0.25 -0.25-1.05 -0.970.31 0.24-1.21 -1.29-0.37 -0.92
CORR FAC1_2-1.16 -2.12504-0.42 0.38617
-0.34 -0.10767-1.01 -1.68504-1.07 -0.9971-0.78 -0.80173-0.95 -1.60165
-0.37 -0.449080.15 -0.02814-0.37 -0.44856-0.85 -0.40368-0.41 0.24414-0.38 -0.7313-1.03 -0.899970.05 0.45144-0.28 -0.01906-0.38 0.06915-0.61 -0.38661-0.25 0.003060.44 1.75939-0.64 -0.21518-0.77 -0.7102-1.15 -1.53556
-0.35 0.0023-0.35 0.00505-0.99 -1.508550.49 1.03916-0.99 -2.06254-0.68 -0.85849
PRSSA0.081.38
0.450.454.040.060.12
5.34 0.314.24 0.0614.741.342.74 6.881.25 1.44 1.76 5.196.746.74 1.49 3.23
0.008.470.252.420.094.96
145

Reproduced
with perm
ission of the
copyright owner.
Further reproduction prohibited
without perm
ission.
Country LGDCPSQTogo 9.64Uganda 8.08Zambia 9.10Zimbabwe 12.07Argentina 15.21Bolivia 11.52Brazil 14.39Chile 14.55Colombia 13.67Costa Rica 13.6DominicanRep 12.23Ecuador 12.85El Salvador 12.61Grenada 13.57Guatemala 12.66Guyana 11.53Haiti 8.90Honduras 11.11Jamaica 12.93Mexico 14.96Nicaragua 10.96Panama 13.92Paraguay 13.65Peru 12.79Uruguay 15.04Venezuela 14.93Algeria 13.64Bahrain 16.65Egypt 12.45Iran 12.99Jordan 12.38
VOICE POLST-0.43 -0.04-0.74 -1.24-0.23 -0.26-0.88 -0.830.39 0.190.17 -0.160.42 -0.060.81 0.81-0.36 -1.621.27 1.07
0.15 0.040.03 -0.720.03 0.220.94 0.56-0.43 -0.840.86 -0.17-0.75 -0.89-0.10 -0.10.61 0.140.01 -0.18-0.06 -0.130.51 0.42-0.45 -0.59-0.35 -0.630.88 0.84-0.13 -0.65-1.22 -2.19-1.02 -0.03-0.81 -0.26-0.93 -0.37-0.24 0.08
GOVEFF-0.59-0.25- 0.68-0.820.18-0.37-0.161.30-0.140.47
-0.39-0.85-0.26-0.08-0.47- 0.22-1.41-0.61-0.290.17-0.64-0.17-1.08-0.150.63-0.89-0.780.60-0.09-0.310.39
REG9602 RULE9602-0.18 -0.430.16 -0.580.09 -0.41-1.13 -0.590.33 -0.040.57 -0.540.28 -0.211.40 1.270.26 -0.650.85 0.75
0.19 -0.30-0.16 -0.600.84 -0.380.19 0.310.31 -0.740.03 -0.13-1.08 -1.380.07 -0.770.47 -0.270.62 -0.300.04 -0.770.84 0.04-0.26 -0.810.58 -0.470.88 0.57-0.26 -0.80-0.81 -0.710.91 0.86-0.11 0.17-1.43 -0.570.36 0.42
CORR FAC1_2-0.98 -0.38486-0.73 -0.4618-0.82 -0.27728-0.59 -0.92812-0.37 0.62608-0.69 0.08899-0.01 0.519341.39 2.6539-0.49 -0.328650.86 1.99252
-0.39 0.20305-0.86 -0.53347-0.42 0.414120.29 1.06034-0.73 -0.38973-0.35 0.39854-1.13 -1.56873-0.78 -0.29713-0.30 0.48814-0.33 0.46779-0.56 -0.23245-0.34 0.76631-0.92 -0.81315-0.14 0.175810.61 1.76678-0.76 -0.62528-0.59 -1.243040.46 1.1854-0.15 0.18515-0.6 -0.739090.07 0.85956
PRSSA0.994.7124.263.99000000
000000000000000000000
146

Reproduced
with perm
ission of the
copyright owner.
Further reproduction prohibited
without perm
ission.
CountryLebanonMoroccoOmanQatarSaudi ArabiaTunisiaUnited ArabEmiratesYemen Rep.BangladeshIndiaNepalPakistanSri LankaChinaFijiLao PDRPapua NewGuineaPhilippinesThailandVietnam
LGDCPSQ VOICE
12.75 -0.4817.76 -0.64
-0.7316.89 -1.3113.70 -0.75
-0.628.81 -0.789.68 -0.3510.38 0.349.34 -0.1310.59 -1.0611.65 -0.2310.86 -1.3913.69 0.029.27 -1.38
12.07 0.3012.04 0.0613.79 0.149.32 -1.46
POLST GOVEFF
-0.08 0.080.93 0.921.15 0.780.03 -0.100.44 0.81
0.96 0.63-1.19 -0.64-0.54 -0.52-0.63 -0.12-0.93 -0.62-1.02 -0.54-1.56 -0.260.09 0.190.48 -0.070.43 -0.40
-0.27 0.11-0.69 -0.620.29 0.270.47 -0.22
REG9602 RULE9602
0.14 0.270.62 1.110.33 1.06-0.03 0.670.23 0.31
0.74 1.11-0.54 -0.96-0.46 -0.70-0.17 0.11-0.36 -0.35-0.53 -0.620.39 0.06-0.19 -0.32-0.50 -0.34-1.21 -1.10
0.39 -0.30-0.58 -0.500.44 0.38-0.62 -0.62
CORR FAC1_20.09714
0.11 0.561770.69 1.683730.60 1.529530.16 0.439190.30 0.98751
0.71 1.6345-0.55 -0.85916-0.61 -0.48765-0.27 0.26531-0.45 -0.358-0.83 -0.8369-0.17 0.06236-0.21 0.026910.30 0.42996-0.85 -0.89478
-0.40 0.398-0.64 -0.44563-0.29 0.82509-0.66 -0.43948
PRSSA000000
0000000000
0000

Reproduced with
permission
of the copyright owner.
Further reproduction prohibited
without permission.
Country PRLAAngola 0 0BeninBurkina
0 0
Faso 0 0Burundi 0 0Cameroon 0 0Chad 0 0Congo Rep. Cote
0 0
d’Ivoire 0 0Eritrea 0 0Ethiopia 0 0Gabon 0 0Ghana 0 0Guinea 0 0Kenya 0 0Lesotho 0 0Madagascar 0 0Malawi 0 0Mali 0 0Mauritania 0 0Mauritius 0 0Mozambique 0 0Niger 0 0Nigeria Sao Tome
0 0
and Principe 0 0Senegal 0 0Sierra Leone 0 0South Africa 0 0Sudan 0 0Tanzania 0 0
PRME PRAS SEC8890 SEC91020 12.23 15.360 11.30 17.46
0 6.83 9.380 5.07 7.190 26.93 28.380 7.20 10.110 56.33 47.69
0 21.27 23.070 22.720 14.83 15.870 53.370 37.97 36.630 9.90 11.830 24.37 28.920 25.57 30.230 18.43 15.750 7.00 22.320 6.07 9.670 14.40 17.580 52.07 67.290 7.60 8.250 6.23 6.420 25.20 29.80
0 38.600 15.97 16.310 17.43 26.150 71.00 88.080 23.75 24.660 4.53 5.55
148

Reproduced
with perm
ission of the
copyright owner.
Further reproduction prohibited
without perm
ission.
CountryTogo 0Uganda 0Zambia 0Zimbabwe 0Argentina 14.53Bolivia 0.05Brazil 20.59Chile 0.23Colombia 4.46Costa Rica 0.02DominicanRep 4.71Ecuador 0.82El Salvador 11.49Grenada 1.62Guatemala 6.90Guyana 2.42Haiti 0.46Honduras 1.29Jamaica 4.83Mexico 11.56Nicaragua 0.01Panama 7.77Paraguay 0.28Peru 15.43Uruguay 0.08Venezuela 7.02Algeria 0Bahrain 0Egypt 0Iran 0Jordan 0
PRLA0000000000
00000000000000000.030.145.510.029.39
PRME PRAS SEC8890 SEC91020 23.43 28.610 13.33 14.260 23.00 25.480 50.4 45.800 70.30 87.460 36.10 79.790 38.30 74.890 74.57 72.750 49.40 63.580 40.73 51.40
0 53.890 56.53 55.160 71.80 79.650 27.87 40.940 62.760 30.070 82.70 66.800 20.60 93.640 32.670 64.03 78.740 36.93 44.490 61.43 67.290 30.40 47.360 66.30 74.560 78.73 89.250 35.20 47.380 61.97 65.070 97.00 97.820 54.43 66.370 88.020 53.00 73.97
149
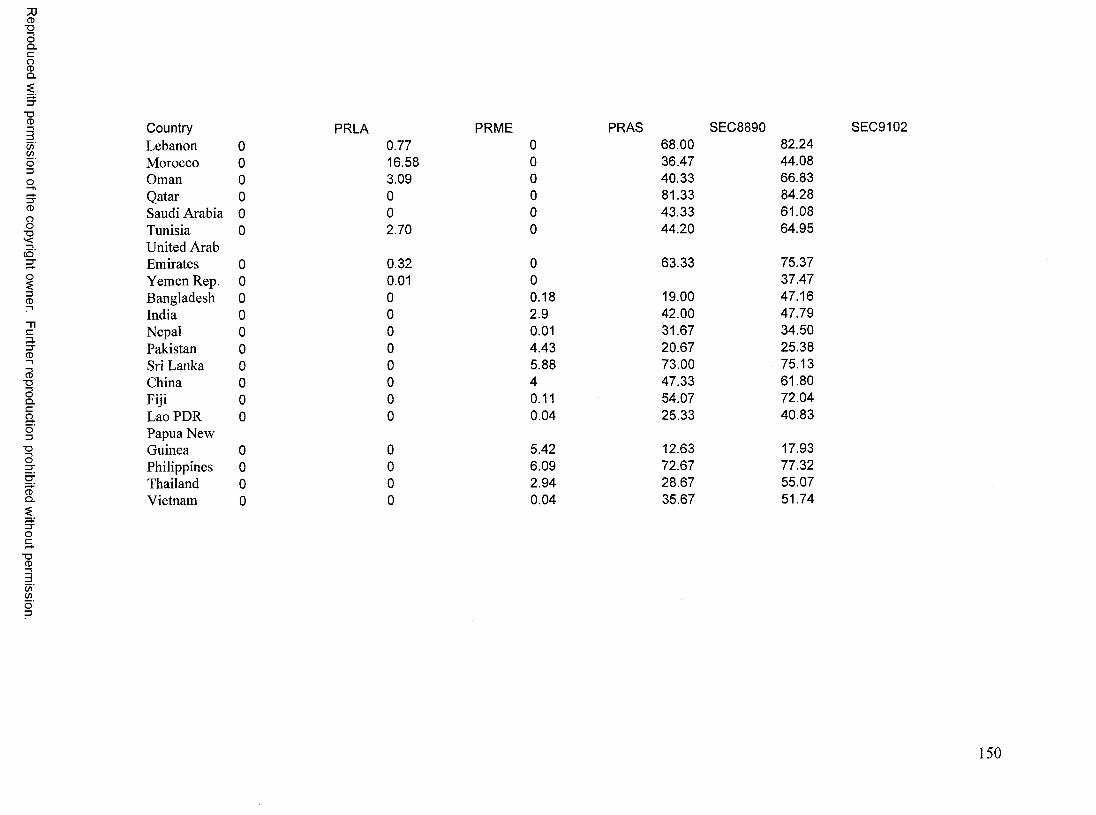
Reproduced
with perm
ission of the
copyright owner.
Further reproduction prohibited
without perm
ission.
Country PRLALebanon 0 0.77Morocco 0 16.58Oman 0 3.09Qatar 0 0Saudi Arabia 0 0Tunisia 0 2.70United ArabEmirates 0 0.32Yemen Rep. 0 0.01Bangladesh 0 0India 0 0Nepal 0 0Pakistan 0 0Sri Lanka 0 0China 0 0Fiji 0 0Lao PDR 0 0Papua NewGuinea 0 0Philippines 0 0Thailand 0 0Vietnam 0 0
PRME PRAS SEC8890 SEC91020 68.00 82.240 36.47 44.080 40.33 66.830 81.33 84.280 43.33 61.080 44.20 64.95
0 63.33 75.370 37.470.18 19.00 47.162.9 42.00 47.790.01 31.67 34.504.43 20.67 25.385.88 73.00 75.134 47.33 61.800.11 54.07 72.040.04 25.33 40.83
5.42 12.63 17.936.09 72.67 77.322.94 28.67 55.070.04 35.67 51.74
150

SAMUEL ADAMS
VITA
EDUCATION
Doctor of Philosophy (Public Administration and Urban Policy), Old Dominion University-V irginia
Master of Business Administration, Lincoln University - Missouri Bachelor of Science (Biochemistry), University of Science and Technology - Ghana
EMPLOYMENT
Managing Director, Osby Medical Services Associate Director, Eddy Ataf and Dickson Company Limited Managing Director, Samuel Adams’ Enterprises Science tutor, Amasaman Secondary School
Reproduced with permission of the copyright owner. Further reproduction prohibited without permission.