mass privatization, state capacity, and economic growth in post
TRANSCRIPT

Mass Privatization, StateCapacity, and Economic Growthin Post-Communist Countries
The Harvard community has made thisarticle openly available. Please share howthis access benefits you. Your story matters
Citation Hamm, Patrick, Lawrence P. King, and David Stuckler. 2012.Mass privatization, state capacity, and economic growth in post-communist countries. American Sociological Review 77(2): 295-324.
Published Version doi:10.1177/0003122412441354
Citable link http://nrs.harvard.edu/urn-3:HUL.InstRepos:9637880
Terms of Use This article was downloaded from Harvard University’s DASHrepository, and is made available under the terms and conditionsapplicable to Other Posted Material, as set forth at http://nrs.harvard.edu/urn-3:HUL.InstRepos:dash.current.terms-of-use#LAA

Mass Privatization, State Capacity and Economic Growth in Post-Communist Countries* Patrick Hamm, Ph.D.** Harvard University Lawrence P. King, Ph.D. University of Cambridge David Stuckler, MPH, Ph.D. University of Cambridge Word count: 13,534 Running head: Mass Privatization, State Capacity and Economic Growth in Post-Communist Countries Key words: mass privatization, state capacity, post-communism, economic performance Corresponding author: Patrick Hamm Harvard Academy – WCFIA Room E104, Mailbox #18 1727 Cambridge Street Cambridge, MA 02138 Phone: (617) 248-0945 Email: [email protected] * We would like to thank Silke Aisenbrey, Glenn Firebaugh, Casiano Hacker-Cordon, Marcus Kurtz, Peter Marsden, Karl Ulrich Mayer, Andrew Schrank, Caleb Southworth, and Iván Szelényi for their comments and suggestions on various drafts of this paper. Direct correspondence to Patrick Hamm, Harvard Academy for International and Area Studies, Weatherhead Center for International Affairs, Room E104, Mailbox #18, 1727 Cambridge Street, Cambridge, MA 02138. Email: [email protected]. **Authors’ names are listed in alphabetical order to reflect equal contributions.

1
2
Mass Privatization, State Capacity and Economic Growth in Post-Communist Countries ABSTRACT Why did the transition from socialism to capitalism result in improved growth in some countries and significant economic decline in others? Three main arguments have been advanced: (1) successful countries rapidly implemented neoliberal policies; (2) failures were not due to policies but to poor institutional environments; and (3) policies were counterproductive because they damaged the state. We present a state-centered theory, and empirically demonstrate for the first time one of several possible mechanisms linking neoliberal policies to poor economic performance: mass privatization programs, where implemented, created a massive fiscal shock for post-communist governments, thereby undermining the development of private sector governance institutions and severely exacerbating the transformational recession. We perform cross-national panel regressions for a sample of 30 post-communist countries between 1990 and 2000, and find that mass privatization programs negatively affected economic growth, state capacity, and property rights protection. These findings are corroborated with firm-level data from a representative survey of managers in 3,890 companies operating in 24 post-communist countries. We show that within countries which implemented mass-privatized programs, newly privatized firms were substantially less likely to engage in industrial restructuring but considerably more likely to use barter and accumulate tax arrears than their state-owned counterparts.

3
Between 1989 and 1991, the Soviet empire disintegrated. Western-trained neoliberal economists
provided the blueprint for constructing capitalism amidst the ruins of state socialism, advocating
“shock therapy”: rapid privatization, liberalization of prices and trade, and fiscal and monetary
austerity (UNDP 1999). Although sociologists and economists critiqued these policies and their
pace (e.g. Stark 1992; Burawoy and Krotov 1992; Kornai 1990, 1995), a group of neoclassical
economists at Harvard believed that they were necessary; this perspective was also dominant
among economists working for international financial institutions (Cohen 2001; Wedel 2001).1
As Lawrence Summers put it, “Despite economists’ reputation for never being able to agree on
anything, there is a striking degree of unanimity in the advice that has been provided to the
nations of Eastern Europe and the former Soviet Union. ... [P]rivatization, stabilization, and
liberalization ... must all be completed as soon as possible” (1994: 252-253). Most post-
communist countries implemented versions of the shock therapy package. Of the three major
policies, privatization proved to be the most difficult to implement and yielded the greatest
variance in outcomes.
Despite initial optimism, economic performance was disastrous in most post-communist
countries, as shown in Figure 1. Between 1990 and 1996, per capita income in Russia and most
of the former Soviet Union (FSU) fell by over 30% (Rosefielde 2001) – slightly less than the
decline in the United States during the Great Depression (see Online Supplement A for a
graphical comparison). Yet, not all countries fared as poorly. Estonia’s economy, which recorded
an initial 20.2% drop in GDP between 1990 and 1994, fully recovered by 1997 and, by 2000,
achieved 29.3% higher per capita income levels than in 1990. Poland, Hungary, Czech Republic,
Slovakia, and Slovenia experienced the lowest declines in per capita incomes, bottoming out at
roughly 10% in 1992. By 1994, these countries surpassed pre-transition income levels, and for

4
the next six years, experienced balanced growth (recording a 39.8% increase in per capita
income between 1990 and 2000).
[Insert Figure 1 here]
To evaluate the competing explanations of this variation, we first review the initial theories
of transition and the leading ‘post-mortem’ explanations of the post-communist economic
depression. We then outline the neo-Weberian theory from which we derive our own hypotheses.
In the subsequent sections, we report the results of our country- and firm-level analyses and
discuss the implications of our findings for sociological theory and public policy.
INITIAL THEORIES OF ECONOMIC TRANSITION
Neoliberal policy recommendations were grounded in the notion that economic development
could be achieved by relying on the power of market forces and private property, unleashed by a
radical curtailment of the state. Neoliberals argued that rapid liberalization of prices and trade,
alongside privatization and macroeconomic stabilization, would set free economic restructuring,
leading to growth and convergence with the West (Sachs 1994: 25). The European Bank for
Reconstruction and Development’s (EBRD) 1999 Transition Report summarizes the consensus
of foreign advisors and post-communist elites at the start of the transition: “Private ownership
would ensure profit-oriented corporate governance, while liberalization of trade and prices would
set free the competitive market forces that reward profitable activities. Firms would have
therefore both internal and external incentives to restructure” (1999: 167).
Economically, neoliberal reforms were expected to combine the advantage of “true prices”
with “a fully private incentive structure,” thus promoting enterprise restructuring (EBRD 1999:
167; see also Lipton and Sachs 1990a; Sachs 1992a, 1996; Fischer and Gelb 1991; Kosolowski
5
1992; Blanchard et al. 1993: 10-11; Carlin, van Reenen, and Wolfe 1994: 72; Frydman, Gray and
Rapaczynski 1996). Neoliberals also advanced a rationale of political expediency: they believed
that a period of “extraordinary politics” following the collapse of communism gave elites a brief
window of opportunity to implement reforms, after which managers and workers of state-owned
enterprises might seek to halt, or even roll back, privatization and liberalization efforts in order
to prevent lay-offs (Lipton and Sachs 1990b: 298; see also Blanchard et al. 1991: xiv; Frydman,
Rapaczynski, and Turkowitz 1997: 84). As Sachs noted at the time, “The need to accelerate
privatization is the paramount economic policy issue facing Eastern Europe. If there is no
breakthrough in the privatization of large enterprises in the near future, the entire process could
be stalled for years to come. Privatization is urgent and politically vulnerable” (Sachs 1992b:
71). Similarly, Ira Lieberman, senior official at the World Bank’s mass privatization advisory
program, stated that “There was a concern by Russian reformers, above all, that the communists
might soon take control again; their desire, therefore was to move as rapidly as possible, i.e., to
create ‘facts on the ground’ that made a market economy irreversible” (Lieberman, Kessides and
Gobbo 2008: 61).
The need for rapid privatization posed considerable challenges. While economists and
policymakers had long understood how to stabilize and liberalize economies (by raising interest
rates, limiting monetary emissions, freeing prices, and opening up trade), the attempt to privatize
an entire economy within a few years was unprecedented, and doing so without an existing class
of private investors seemed almost impossible. According to three senior World Bank
bureaucrats involved in the implementation of mass privatization, “It quickly became apparent
that the ‘Classical privatisation’ model practiced in the UK and New Zealand and emulated by
other countries such as Mexico and Argentina would simply not work in the region. ... [T]here

6
were too many state-owned companies … that needed to be privatised rapidly. Implementing
privatisation on a case-by-case basis over many years risked missing the ‘window of
opportunity’ for real structural change” (Lieberman et al. 2008: 12).
One attractive option was privatization to foreign owners. It was determined, however, that
foreign capital would be rejected by many local elites due to economic nationalism, and that
foreigners would not purchase vast swathes of unprofitable and technologically obsolete Soviet
firms. Employee Share Ownership Programs were another quick method of privatization which
concentrated individual employee-owned shares and protected them from take-over attempts by
outside investors, but they were considered unacceptable since entrenched labor interests might
discourage foreign investment and prevent restructuring (Ellerman 2003). Management and
Employee Buyouts could be equally fast, but were rejected as a standalone option. To be viable
from a neoliberal policy standpoint, individual shares would have to be transferable, and sale to
outside owners encouraged, so that capital markets could develop.
Thus, with foreign investment unlikely and exclusive insider ownership undesirable, the
policy solution was called “mass” privatization and would give firm insiders and citizens
vouchers that were redeemable for shares at nominal cost (or in many cases, free of charge).
Whole sectors of the economy could be rapidly privatized using these vouchers.2 While most
countries adopted several different privatization strategies, as described in Online Supplement B,
mass privatization was by far the most innovative method, and was implemented by
approximately half of the post-communist world to varying degrees (see Online Supplement C).
Would privatization, implemented prior to restructuring and in the absence of capitalist
institutions, be adequate to generate growth? Would there not be governance problems,
information deficits, and potential market failures? The neoliberal answer resembled a political

7
Coase theorem: “Privatization … offers an enormous political benefit for the creation of
institutions supporting private property because it creates the very private owners who then begin
lobbying the government … to create market-supporting institutions… [Such] institutions would
follow private property rather than the other way around” (Shleifer and Vishny 1998; 10-11; our
emphasis).
Although neoliberal ideas dominated transition policy formation, they were criticized from
the beginning by “gradualist” voices emphasizing the importance of state-guided institutional
reform (e.g. Murrell 1992; Burawoy and Krotov 1992; Stark 1992). The gradualist position held
that in the absence of a supportive institutional environment, radical reforms would be
damaging: privatization might lead to asset-stripping rather than investment, and rapid reforms
might create economic winners who subsequently engage in predatory behavior. China’s
trajectory is frequently cited as evidence for the benefits of gradual reform (e.g. Burawoy 1996).
Shock therapy advocates won the policy debate in most countries. However, instead of
improved performance throughout the post-communist region, there ensued great economic
decline followed by considerable divergence in subsequent recovery. How did scholars explain
this variation in outcomes?
THE POST-MORTEM LITERATURE – MAIN EXPLANATIONS OF POST-COMMUNIST ECONOMIC
PERFORMANCE
Both gradualists and shock therapy advocates claimed that the facts vindicated their original
positions. The shock therapists, however, made one important concession: institutions and other
“initial conditions” mattered more than they had previously acknowledged. As Milton Friedman
put it when reflecting on post-communist Russia, “It turns out that the rule of law is probably

8
more basic than privatization. Privatization is meaningless if you don’t have the rule of law.
What does it mean to privatize if you do not have security of property, if you can’t use your
property as you want to?” (Friedman 2002: xviii). Shock therapy advocates now agreed with
gradualists that various “initial conditions” played a role in explaining the variation in economic
performance. That is, some countries were predisposed to restructuring their economies more
effectively and achieving competitiveness on globalized markets because of their particular
historical and cultural legacies.
Proposition 1: Faster and more extensive privatization led to better performance
Despite this concession, shock therapists continued to assert that faster and more extensive
reforms lead to better performance, and therefore claimed that their initial theories were not in
need of fundamental revision. Instead, they argued that variation in performance could be
explained by a combination of initial conditions and insufficient implementation of reforms. The
seminal statement of this position can be found in the EBRD’s 1999 Transition Report: Ten
Years of Transition, which became part of a growing body of empirical studies supporting these
claims (see also De Melo and Gelb 1996; Sachs 1996; De Melo, Denizer, and Gelb 1996; De
Melo et al. 2001). This view emphasized corruption as a key factor in undermining reforms,
especially in the case of Russia (e.g. Åslund 1999). Although it was acknowledged that “the
benefits of privatization are larger in countries with an effective legal framework and secure
property rights” (IMF 2000: 105), the shock therapists never considered privatization
detrimental, and argued that countries are “better off after the flawed privatizations they carried
out than they would have been had they avoided or delayed divestiture” (Nellis 2008: 81).
Supporting this position, two econometric analyses claim that voucher privatization has been

9
beneficial to growth (Bennet et al. 2004; 2007). In sum, the original proponents of shock therapy
would advocate the same strategy again: “No country has suffered from too radical reforms.
Things have gone wrong because the move to the market was not radical enough” (Åslund 2002:
445).
Proposition 2: Privatization failed to create necessary governance institutions
Gradualist scholars felt equally vindicated. Nobel laureate Joseph Stiglitz’s seminal paper
“Whither Reform? – Ten Year of the Transition” (2000), for example, argued that prioritizing
privatization over establishing a proper institutional framework promoted widespread corruption.
Due to information asymmetries and lack of an effective governance framework, the new private
owners had both incentive and opportunity to pursue rent-seeking and asset-stripping; Stiglitz
claimed that these tendencies were exacerbated by the liberalization of capital accounts, which
facilitated transferring money abroad. Strict monetary policy further encouraged predatory
behavior, as high interest rates prevented new firm owners from attracting the capital needed for
restructuring. Unless accompanied by adequate institutional reforms, privatization would
therefore lead to lower economic growth.
Other gradualists claimed that rapid liberalization generated supply shocks in “structurally
distorted” industries that had received subsidies and protection under socialism (Popov 2007).
Rapidly eliminating subsidies and deregulating prices left firms in these sectors with insufficient
time to restructure, thus driving them out of business or into the barter economy. Because some
investment capital would have been generated by the savings of these non-competitive firms had
they remained protected, overall investment levels plummeted. Slower liberalization would have
limited this decline, thus mitigating the severity of the economic downturn (Popov 2007).

10
Several sociologists have advanced similar arguments, substituting the term “state” for
“institutions.” Burawoy (1996) and Nee (2000) argued that the state’s bureaucratic capacity was
a crucial factor in determining economic success or failure. Burawoy (1996), in a seminal article
comparing the transitions of China and Russia, argued that Russia performed poorly because
neoliberal reforms damaged the state right when the economy was being privatized, thereby
creating the perverse combination of private property with soft budget-constraints. This resulted
in “economic involution,” a process in which firm managers failed to utilize state subsidies to
increase production, opting instead to pursue asset-stripping and transfer wealth out of the
economy. In China, conversely, the state was able to decentralize property relations to the local
administrative level, thereby hardening budget constraints (Walder 1995). Nee (2000) advances
the broader argument that China’s evolutionary transition strategy permitted reformers to utilize
preexisting state structures to build a market economy, whereas Russia’s attempt to
simultaneously reform economic and political institutions deprived policymakers of their
governance tools.
Proposition 3: Initial conditions, rather than reform paths, were main determinants of economic
outcomes
One group of authors claimed that the only relevant factor in explaining performance was the
respective starting point of different countries (Stuart and Panayotopoulos 1999; Popov 2000;
Ganev 2007). Popov (2000), for example, argued that democracy without the rule of law creates
massive opportunities for corruption, thereby undermining subsequent reform efforts. Fish
(2005) contended that Russia’s natural resource wealth, coupled with its weak legislature and
delayed economic reforms, further spurred corruption and prevented the emergence of viable
11
governance institutions. Other scholars have emphasized the importance of social structural
factors, particularly the power of the former nomenklatura. In countries where the nomenklatura
were sufficiently powerful, they were able to convert their social and political capital into private
economic wealth (Eyal et al. 1998; King 2003), and in the process, deliberately destroy the
institutions that prevent economic crimes (Ganev 2007). The outcome was a form of capitalism
driven by agents with an inappropriate habitus: since their wealth had largely been obtained by
illegal means and might be subject to future dispossession, former nomenklatura were
incentivized to transfer capital abroad instead of investing it in their enterprises.
A variant of the social structural perspective stresses the importance of alliances between
firm managers and foreign capital in facilitating successful firm restructuring (King 2000; 2001a;
2001b; 2002). Countries that managed to attract sufficient foreign direct investment (FDI) were
able to compensate for the depressive effects of shock therapy. Subsequent work combined this
assessment with the view that neoliberal policies were detrimental, arguing that countries in
which the nomenklatura struck a bargain with enterprise managers (e.g. Russia) effectively
discouraged FDI, and ultimately experienced de-industrialization (King 2003; King and Szelényi
2005). In other countries (mostly in Central Europe), an alliance of technocrats and dissidents
was able to block the nomenklatura’s bid to gain ownership of the means of production, and
instead created the political and social conditions for large-scale foreign investment (King 2002;
King and Szelényi 2005; King and Sznajder 2006). This perspective argues that FDI, combined
with state-guided enterprise restructuring, accounts for the success stories of post-communist
development. While these social structural explanations have substantial merit, they nonetheless
cannot account for differences in performance among countries with similar social structural
conditions. In particular, they cannot explain intra-FSU or intra-CEE variation.

12
A STATE-CENTERED THEORY OF TRANSITION
In this paper, we advance a neo-Weberian theory of post-communist economic collapse that
focuses on the bureaucratic character and capacity of the state. For Weber, modern rational
capitalism was characterized not only by capitalist property relations (private ownership of the
major means of production), but also by the presence of a strong bureaucratic state (Weber
1958a: 81; Weber 1958b: 221). In this view, modern states hold the monopoly on legitimate
violence within their territories, a monopoly on issuing money, and a monopoly on taxing the
population. The bureaucratic nature of modern states is created by the separation of the office
from the officeholder and the use of formal rules in decision-making (Weber 1978). Therefore,
the rights of the office as well as the material goods it commands cannot be used at the discretion
of the officeholder, especially not for their personal gain. Weber believed that bureaucracies
functioned well when they had an educated staff with an esprit de corps and sufficient material
resources. When we speak of a “strong” state in this paper, we then mean a state that has what
Mann termed “infrastructural power” (1986): the ability to penetrate society and realize its
objectives.
A bureaucratic state is essential to modern capitalism because in its absence, individual
capitalists might resort to “political capitalism” – the use of personal relationships with state
officials to create extra-market opportunities for profitable activity (Weber 1966: 246-247; 1978:
164-166). In this scenario, sustained innovation and specialization are neglected, as capitalists
circumvent market competition by pursuing “political accumulation” and strengthening their ties
to government officials instead of carrying out productive investments. In addition, Weber
recognized the essential role of strong nation-states in supporting capitalist growth by protecting

13
and nurturing infant industries. Many other authors have emphasized the importance of states in
providing fertile conditions for economic growth through the creation and maintenance of
institutions, including an adequate legal and regulatory framework, counter-cyclical demand
stimulation, reliable information diffusion, a skilled and healthy workforce, and new technology
development (for a review see Block and Evans 2005).
Our theoretical account is directly at odds with neoliberal explanations, since we argue that
the closer a given country’s policies approximated the neoliberal goal of mass privatization, the
worse its subsequent economic performance. This explanation is consistent with the
institutionalist and corruption-centered perspectives, but goes beyond them by arguing that mass
privatization itself damaged existing state institutions and increased corruption. We contribute to
the (sociological) statist and social structural accounts by identifying an important mechanism
responsible for the deleterious outcomes experienced by many transition societies: mass
privatization leading to declining state revenues.
Countries which pursued mass privatization severely damaged their state capacity in two
ways. First, privatization eliminated the profits of state-owned enterprises as a source of state
revenue. Second, it created enterprises lacking strategic owners, which prompted severe agency
problems, increasing the risk of firm failure, recourse to the non-monetary economy, and non-
payment of taxes. The combined impact on the state’s budget led to a fiscal crisis, which
weakened the development of the very institutions needed for governing the private sector, and
undermined morale among the post-Soviet bureaucracy. Declining state capacity – fiscally and
bureaucratically – promoted corruption and weak institutions, both of which contributed
significantly to poor economic outcomes. The result was a vicious cycle of mutual reinforcement

14
between a failing state and a failing economy. We contrast this theoretical logic with the
neoliberal account in Figure 2.
[Insert Figure 2 here]
HYPOTHESES
Our theoretical framework implies that mass privatization programs exert both direct and indirect
effects on post-communist state capacity. In the following section, we develop specific
hypotheses concerning each causal pathway and contrast them with competing predictions.
The Direct Effects of Mass Privatization on State Capacity
We argue that a post-socialist country’s choice to rapidly privatize its enterprise holdings
immediately reduced that state’s financial capacity, due to the high budgetary dependence on the
earnings of state-owned firms. Advocates of neoliberal policies did not expect this fiscal shock to
be particularly devastating for two reasons. First, it was believed that socialist states had been
engaging in “value-subtracting” behavior by expending vast amounts of resources to prop up
inefficient firms producing unneeded goods (Gaddy and Ickes 2002). Radical privatization
therefore had the potential to generate huge savings for the state. Second, rising tax revenues
from the superior growth of de novo private firms and the improving performance of privatized
state enterprises were expected to compensate for revenue shortfalls.
Indirect Effects of Mass Privatization on State Capacity
In order to avoid a state fiscal crisis as a result of mass privatization, the enterprise sector
would have to grow and be taxed effectively. We argue that mass privatization accomplished

15
precisely the opposite: worse enterprise performance coupled with a declining capacity of the
state to tax firms.
Mass privatization programs, by design, led to greatly dispersed firm ownership. The new
owners had only limited incentive to monitor firms, and more importantly, lacked the capacity to
exercise control over managers and employees (Ellerman 1998). McDermott (2002)
demonstrated that in the Czech Republic mass privatization greatly complicated corporate
governance, causing assets to go unutilized because of ambiguous ownership situations, which
discouraged foreigners from investing.3 Well-functioning regulatory and credit rating agencies or
an independent business press may have mitigated the violation of shareholder rights, yet these
institutions did not exist.
In most cases, newly mass privatized firms were cut off from state subsidies. Unlike firms
privatized to strategic owners, however, they did not have access to resources such as investment
capital, new managerial talent, and marketing networks, which would have been crucial for
restructuring overstaffed and inefficient Soviet-era factories into globally competitive firms
(King 2003). Faced with this situation, owners, managers, and workers, unable to work
cooperatively for the betterment of their firms, tended to pursue short-term parasitic strategies to
accumulate wealth, such as asset stripping. Thus, firms that were oftentimes already
technologically obsolete now faced substantial external shocks and major internal problems.
One way in which firms responded to these multiple crises was by reviving the practice of
barter, which had evolved under the planning system to rectify deficiencies in the central
allocation of resources (Kornai 1980). Failing post-communist firms retreated to non-market
mechanisms of exchange. They bartered and tolerated arrears from their customers, in turn
failing to pay their suppliers and creating chains of inter-enterprise debt. They produced goods

16
for the black market to avoid taxation, oftentimes falling behind on tax payments for legally
produced goods. Some firms even started using non-official money printed up by local
governments. In effect, firms began to flout the government’s monopoly on the creation of
money and the taxation of the economy (Woodruff 2000). We refer to these micro-strategies as
“non-market” restructuring, which we distinguish from market-oriented strategies of developing
new product lines, gaining quality accreditations, and increasing sales. These latter are typical of
firms in Western capitalism and generate more economic value for future taxation than non-
market activities. Furthermore, non-market transactions are much harder to tax than normal
monetary transactions. Firm-level responses to mass privatization thus further strained the state’s
resources.
The resulting fiscal crisis meant that the state was increasingly unable to pay its own staff.
Undercompensated government bureaucrats were easily corrupted, providing favors and
advantages to businessmen in exchange for bribes or other unofficial payments (Pappe 2000;
Reddaway and Glinski 2001). In “patrimonial capitalism”, as Szelényi and his collaborators
called it, personal ties between economic and political actors replace bureaucratic organization
(Eyal et al. 1998; King 2002; King 2003; King and Szelényi 2005).
Based on the above considerations, we specify the following:
H1: Mass privatization reduces state capacity.
H2: Mass privatization reduces economic growth.
H3: Mass privatized firms are more likely to use non-monetary exchanges and owe the
government tax arrears.
H4: Mass privatized firms are less likely to have pursued market-oriented restructuring than
state-owned firms.

17
All hypotheses are single-tailed. In each case, the null hypothesis is specified as mass
privatization having no effect on the response variable.
METHODS
Our analysis uses a multi-level approach, incorporating both country- and firm-level data.
This enables us to address fallacies that could arise both from the analysis of national-level data
(overlooking mechanisms) and individual-level data (overlooking system-wide processes).
Simultaneously, it allows us to model the causal mechanisms by which the effects of
privatization on firms affect the state, and the effects of privatization on the state affect firms.
Cross-national data: On the national level, we report time-series and cross-sectional models
using data on the social, economic, and political development of 26 post-communist countries,
drawn from the World Bank World Development Indicators Database (2008 edition). In addition,
we generated a novel measure of mass privatization based on historical records, including those
reported in the Transition Report series (EBRD 1994-2005). Table 1 summarizes the variables
used in the cross-national models. We first analyze the entire sample of countries (Tables 3 and
4). However, given the historical differences between the satellite countries and the core
republics of the FSU, we also provide separate analyses for the non-FSU and FSU blocks of
countries (see Online Supplement E). We restricted our study to the period between 1990 and
2000. The starting point is justifiable in view of missing data for many countries in 1989 (several
post-Soviet countries also did not yet exist). By the late 1990s, the transitional recession was
over in all countries of the post-communist world, and a new set of political and economic
dynamics had emerged to create what Szelényi and Wilk (2009) termed the “Second Transition”
(involving the reform of social institutions such as the education and health sectors). Moreover,

18
while there has been substantial path-dependence in the region, this dependence is not absolute,
and both political and economic developments are increasingly driven by other factors – for
instance, the change in relative prices following Russia’s sovereign debt default and devaluation
in 1998, the strong rise in oil and other commodity prices from the late 1990s onwards, or the
most recent global financial meltdown, which affected the post-communist economies very
unevenly. We therefore end our time series in 2000 (although extending it did not affect our
statistical findings).
Two variables require further discussion: our measures of privatization and of state capacity.
Almost all existing analyses of privatization in the post-communist world use the EBRD’s
indices of privatization progress. While we show that our results are robust to the use of these
variables, we note that the EBRD measures are of limited analytical value since they do not
distinguish between different privatization methods. Moreover, as demonstrated by Stuckler,
King and Patton (2009), the residuals of a regression of these indicators on growth are non-
random, and are predicted by prior economic growth (implying that EBRD bureaucrats coded
economically successful countries as being more effective privatizers than they actually were).
Therefore, in addition to investigating the commonly used EBRD indices, we construct a
measure to reflect as accurately as possible the actual implementation of large-scale mass
privatization programs, by specifying whether a given country implemented a mass privatization
program covering at least 25% of its large enterprise sector.4 Ideally, we would have used data
on the rate of privatization for each country, as both the number of existing firms (denominator)
and the number of privatized firms (numerator) were changing. However, inconsistencies in
government reporting of privatization and firm data to the international financial institutions
made the calculation of such a rate impossible for many countries. According to staff members at

19
the EBRD, the texts of its Transition Report series provide the entirety of the organization’s data
on privatization, reporting the public and private sector shares in several different ways: total
assets of firms, total number of firms, and percent of total employment. All of these measures
have advantages and disadvantages, but they are not commensurate. Online Supplement C
reports our own best estimates of post-communist privatization, along with our coding decisions
for each country. We confirmed the coding of our variable with the senior official overseeing
mass privatization implementation at the World Bank, Ira Lieberman, who agreed with our
coding of countries’ privatization programs with the possible exception of Romania.
Constructing valid and reliable measures of the bureaucratic nature of the state or of state
capacity is notoriously difficult. We use a variety of subjective measures of state capacity
aggregated from firm-level survey data (perception of government efficiency, property rights
enforcement and contract security, and prevalence of corruption), as well as an objective
measure for the time-series analysis (total government spending). Comparative studies frequently
measure state capacity by expressing government spending as a percentage of GDP. This is
sensible, but it assumes that there are no significant changes in the denominator during the period
under investigation; given the significant economic contraction experienced by most countries in
the post-communist world, this approach is not reasonable for the purpose of our study. In
Russia, for instance, changes in the ratio of government spending to GDP were driven partially
by deliberate attempts to reduce the size of government, but primarily by the rise of the shadow
economy and the inability of the state to collect taxes (Popov 2004: 2). Given these
complications, we followed existing literature in measuring state fiscal capacity by considering
changes in total government spending over the course of the transition.

20
Firm-level data: Our firm-level data are taken from the World Bank/EBRD Business
Environment and Enterprise Performance Survey (BEEPS) of 4,106 large and medium firms in
26 transition economies. Conducted between 1999 and 2000, it examines key aspects of
governance and institutional support provided by the state; areas covered by the survey include
business regulation and taxation, the legal and judicial system, infrastructure, and financial
services (World Bank 2011). Specifically, BEEPS assesses how “the growth of firms, including
their decisions to invest and to innovate, and the growth of firms’ revenues and productivity are
affected by the functioning of government institutions, financial markets, and physical
infrastructure (ibid.). The survey is based on face-to-face interviews with firm managers and
owners. It was designed to generate comparative measurements in areas such as corruption, state
capture, lobbying, and quality of the business environment, and also reports a series of specific
firm characteristics and performance measures. One strength of the survey in measuring
corruption is its emphasis on the experience of service-users and managers, rather than the
perceptions of experts and households. (The latter two have been found to generate a significant
positive growth bias in studies of economic performance [see Kurtz and Schrank 2007, Knack
2007]). The survey includes about 125 randomly sampled firms from each country, with larger
samples for Poland and Ukraine (over 200 firms), and an even larger sample for Russia (over
500). Of the firms surveyed, 16% were privatized, 14 % were state-owned, and the remaining
70% were new private firms (World Bank 2011). Serbia and Turkey were excluded from our
study, leaving a sample of 3,891 firms, of which 3,550 had complete data on the factors of
interest.
If a firm was privatized in a country that we coded as having implemented a mass
privatization program and this firm reported no foreign investment, we treat it as having been

21
privatized via mass privatization. This creates a conservative bias in the variable, as many such
firms were not in fact privatized by this method in mass-privatizing countries (see Online
Supplements B and C). Firms privatized by other methods likely suffered from much less severe
principal-agent problems (e.g. if they were privatized directly to firm insiders), or at least had
access to new capital and markets (e.g. if they were acquired by a strategic owner) (King 2001b).
Tables 1 and 2 describe the variables used in the cross-national and firm-level regressions; all
equations and further details about our modeling framework are provided in Online Supplement
D.
[Insert Tables 1 and 2 here]
RESULTS OF THE CROSS-NATIONAL ANALYSIS
Table 3 shows the results of our regressions of three subjective indicators of a strong
bureaucratic state on mass privatization and several controls (transition policies, resource wealth,
military conflict, demographic factors, membership in the FSU and initial transition conditions).
We found that the aggregated survey respondents from countries undertaking mass privatization
were more likely to believe that the government was inefficient (Model 1), would not protect
property rights or contracts (Model 2), and would be more prone to rely on unofficial payments
to public officials (Model 3).
[Insert Table 3 here]
Comparing Satellite and Core countries of the Former Soviet Union
Table 4 reports our regression results for the full sample of countries over time. We can see
that countries which underwent mass privatization, ceteris paribus, exhibited about 20% lower
government spending than those that did not (Models 5-6). Countries which liberalized prices
also displayed substantially lower levels of government spending. Because government spending

22
is a component of GDP, we would expect that GDP declined by the amount attributable to mass
privatization multiplied by the fraction of government spending in GDP. We found that mass-
privatizing countries experienced, on average, a greater than 16% decrease in GDP per capita
(Models 8-9). Price liberalization had a similar-sized negative effect, corroborating a finding by
Popov (2007).
[Insert Table 4 here]
Online Supplement E (Table E1) presents the results of our regressions of government
spending on mass privatization using the split sample. We find that in FSU countries mass
privatization was associated with a 22.8% drop in real government spending per capita during
the 1992-2000 period (Model 12). Not surprisingly, oil is linked to greater government spending
(capturing the spike in oil prices during the late 1990s). Similarly, greater democratization
implied an average increase in government spending per capita of 4.82% among FSU countries
(p = 0.008) but had no effect among non-FSU countries (β = -4.31, p = 0.39). We found no
statistically significant effect for mass privatization in the non-FSU countries once controls were
implemented (Model 15). Price liberalization, however, did have a negative effect in this region.
Given that the average increase in the EBRD liberalization score for non-FSU countries was 1.97
(range 0-4), this is substantial.
Online Supplement E further presents the results of our random-effects regressions of real
GDP per capita on mass privatization (Table E2). We find that privatization was associated with
a 13.1% drop in real GDP per capita (Model 18), supporting the notion that mass privatization
negatively affected growth through a reduction in state fiscal capacity, without a simultaneous
compensation in benefits to investment, consumption, or exports. When holding constant trends
in government spending, thus effectively blocking the mass privatization-state capacity-growth
23
channel, we found no effect of mass privatization on growth among FSU countries (β=-5.01,
p=0.24; full results not reported).
Robustness Checks
We performed a series of robustness checks on our cross-national findings. First, we
removed potential outliers according to a liberal definition of standard deviations in the residuals
of greater than |2| (dropping Armenia in 1992, 1993, and 2000; Azerbaijan in 1992; Georgia in
1991 and 1994; and Tajikistan in 1991), finding that the coefficients for mass privatization
increased (β=-17.2, p<0.001). Second, we introduced a set of country dummies, which left our
coefficients for mass privatization unchanged. Third, we replicated our cross-national results
using the EBRD index of privatization, producing results consistent with the findings reported in
Online Supplement F, Table F1. In light of these robustness checks, the cross-national evidence
supports our neo-Weberian theory linking mass privatization to declines in state capacity and
growth.
RESULTS OF THE FIRM-LEVEL ANALYSIS
For the micro-analysis we adopt the modeling strategy used in King and Sznajder (2006). We
consider multiple indicators of firm performance and control for variables commonly used in
firm-level analysis, all of which are summarized in Table 2.
Table 5 presents our firm-level results. Enterprises privatized to domestic owners in countries
that implemented mass privatization programs were 78% more likely to engage in barter than
state-owned firms (Model 22), and 56% more likely to have overdue taxes (Model 30). They
were also 41% less likely to have invested (Model 24), 36% less likely to have increased sales
(Model 26), 58% less likely to have hired new employees (Model 28), 36% less likely to have

24
developed a new product line (Model 32), and 26% less likely to have upgraded existing
products (Model 34). Conversely, foreign-invested firms were 62% less likely to have engaged
in barter (Model 22), and 53% less likely to have owed taxes (Model 30). Our micro-level
findings are thus consistent with the results from the cross-national analysis, indicating that
adverse outcomes were significantly more prevalent among the firms we treat as having been
mass privatized, whereas privatization to foreign owners (likely strategic investors) had positive
effects on firm performance.
[Insert Table 5 here]
The Political Economy of Mass Privatization and Potential Endogeneity
It is conceivable that our country- and firm-level results are misleading because of a “sick
patient” effect. That is, countries with weak states might have chosen mass privatization because
they lacked the capacity to implement any other method of privatization. If these countries were
going to suffer negative consequences regardless of their privatization strategy, the detrimental
effects we attribute to mass privatization might simply be the result of an underlying lack of state
capacity and thus be unrelated to the method of privatization.
We assessed the possibility of a “sick-patient” effect by reviewing the existing literature on
the political economy of mass privatization. The leading historical accounts of property reform in
the post-socialist world, as well as a large body of single-country case-study research, indicate
that privatization strategies were politically motivated outcomes of conflicts among elites and,
sometimes, other interest groups. Significantly, the choice to mass privatize was not
predetermined by a weak state or any other structural feature (for Russia see Klebnikov 2000;
Medvedev 2000; Reddaway and Glinski 2001). A glance at the regional diversity of privatization

25
strategies supports this claim, as mass privatization was adopted by countries in every region of
the post-communist world, from the authoritarian states of Central Asia, to the “managed
democracies” of the European FSU, to the liberal democracies of Central Europe.
While space does not permit a detailed discussion of the political economy of mass
privatization for all cases, we cite analyses for ten post-socialist countries that implemented mass
privatization programs, which consistently suggest that privatization was driven by political
motives (including ethnic, fiscal, anti-Russian, and interest group politics). We also provide a
detailed discussion of the Russian case, given that country’s regional importance and former
political centrality. These materials can be found in Online Supplement G.
Thus, the majority of scholars familiar with privatization strategies in the post-communist
world agree that mass privatization was chosen not because the state lacked the capacity to
implement alternative methods, but because of political motives – in particular, the desire to
break the power of anti-reform coalitions and make the transition irreversible.5 Indeed, it surely
would have been easier to leave large enterprises under state ownership indefinitely, until an
acceptable strategic owner emerged, as governments did in Belarus, Slovenia, Uzbekistan and
Poland.
Although policy choices do partially depend on initial circumstances, notions of historical
causality in which such decisions are strictly determined by structural forces fell out of
sociological favor decades ago. Virtually the entire field of political and historical sociology has
strongly rejected structural analysis that has no place for contingency and agency in explaining
historical outcomes (see e.g. Moore Jr. 1978; Zeitlin 1984; for a review of trends in historical
sociology, see Clemens 2007). Therefore, positing that a certain radical and innovative

26
privatization program which was controversial and fiercely contested was inevitable strikes us as
implausible.
Nonetheless, we investigated this possibility statistically by testing whether a range of
commonly used “initial conditions”, including four measures of state capacity, are associated
with the adoption of mass privatization programs (see Online Supplement H, Table H1). The
only statistically significant finding relates to government transparency and points in the opposite
direction (i.e. more transparent states were more likely to adopt mass privatization programs).
Next, we turned to evaluating a series of common hypotheses proposed in the literature to
explain underlying causes of why some countries adopted mass privatization but others did not:
regional diffusion, ethnic politicking, and pressure from international creditors. As shown in the
probit model reproduced in Online Supplement H (Table H2), countries were more likely to
pursue mass privatization if they were members of the FSU (about three times more likely – a
regional diffusion effect); displayed greater degrees of ethno-linguistic fractionalization (both
undermining civil society resistance and incentivizing domestic elites to use mass privatization to
oust ethnic Russians from privileged managerial positions); had greater levels of democratic
participation (used to legitimate the new regime and to consolidate democracy); and had
borrowed from the IMF in the previous year (pressure from external actors).
Overall, these findings are consistent with our understanding of privatization as a political
decision, driven by domestic reformers aiming to legitimate new regimes or weaken political
opponents, and in part facilitated by foreign actors.
Based on these models we construct a new variable assessing the “hazard of implementing
mass privatization”. This approach captures both the observable factors which increased the
likelihood of pursuing this policy (described above), as well as unobservable factors (obtained

27
from the error term). In a second step, we added this control to our main equations for estimating
the effect of mass privatization on GDP. As shown in Online Supplement I, the effect we
recorded was even larger than our original estimates (-42.7%, p<0.001), indicating that those
factors which predisposed countries to implement mass privatization would have been associated
with higher GDP if mass privatization had not been implemented.
In sum, we found there to be neither historical nor statistical evidence indicating a greater
propensity among weak states to adopt mass privatization as a property reform strategy. Even if
this hypothesis were true, our findings would still demonstrate that mass privatization
contributed to a further weakening of state capacity via enterprise failure and reduced tax
revenue. Even if weak states had been more likely to rely on mass privatization, choosing this
method inflicted further damage on their state capacity (as can be inferred from our firm-level
findings).
Political Economy of Firm Selection for Privatization
There is also potential for a selection bias acting at the firm-level. Countries implementing
mass privatization programs may have selectively privatized weak and underperforming firms.
As a result, any effect associated with privatization may simply reflect that bias. To address this
possibility, we review evidence showing that: i) valid information on firm performance was
unavailable, making firm selection based on performance very unlikely; ii) as a corollary,
comparative firm-level data on pre-privatization conditions do not exist across countries; iii) to
the extent firm selection may have occurred, there is evidence that firms were chosen on a
sector-wide basis rather than firm-specific one; and iv) in the limited cases where within-sector
firm selection occurred, better performing firms tended to be privatized first.

28
First, to our knowledge, no firm-level dataset in existence contains the information on pre-
privatization conditions needed to address the issue of potential endogeneity of firm selection on
a cross-national basis. For the theoretical and empirical reasons described below, we also believe
that it would be very difficult, if not altogether impossible, to construct such a dataset.
In theory, to capture initial firm conditions, one must accurately assess the value of fixed
capital for individual firms, which could be used to predict a firm’s competitiveness in a
liberalized market. In practice, however, accurate and detailed firm-by-firm data did not exist
prior to privatization, as socialist central planners were generally not well-informed about the
resources of individual enterprises (see Szelényi, Beckett and King 1994 for a review of the
literature). Bauer (1983) describes the “plan bargain” – a system of organizational arrangements
in which managers had economic incentives to stockpile resources and conceal information from
central planners (see the seminal work of Kornai 1980). In the period leading up to privatization,
the partial marketization of the perestroika reforms engendered further information asymmetries,
as managers began to set up separate corporate vehicles for the purpose of asset-stripping (e.g.
Medvedev 2000; Ganev 2007). In some cases, managers and firm insiders undervalued firms by
falsifying records, permitting them to buy the firm via privatization at a bargain price. Given this
combination of factors, it is thus highly unlikely that states would have been able to use detailed
information on firm performance as a criterion for firm selection. The Czech Center for Coupon
Privatization, for example, published information on the firms to be included in mass
privatization with the explicit caveat that “much of the data [are] of dubious quality and may not
be relevant in a rapidly changing economic situation” (Shafik 1995: 1144).
The greatest obstacle to constructing a suitable dataset, however, is the inherent difficulty in
using market economy performance evaluation criteria to measure the performance of firms prior

29
to privatization. Although accounting records of late-socialist state enterprises included metrics
of revenues, costs, profit, and productivity, these data cannot be analyzed through the
“performance” lens used to evaluate firms in a free-market economy. As Held and Hill (1989)
note in a study of the Soviet economy, “[s]tate-owned firms realise a money surplus only when
the relation between the state-decreed purchase and sales prices allows for it. They are not free to
employ the techniques of competition vis-à-vis sellers and buyers” (31).
Given these inherent limitations in the available data, few existing firm-level studies have
attempted to statistically address potential endogeneity of performance-based selection for
privatization. Djankov and Murrell (2002), who conducted a meta-analysis of the existing
research on privatization and firm restructuring, report that half of the more than one hundred
studies surveyed do not mention the issue of endogeneity at all. Hanousek et al. (2007) – who
represent, to our knowledge, the first dataset designed to control for endogeneity, using firm-
level initial (pre-privatization) conditions in a study of the Czech Republic – also note in their
literature review that many studies “have not been able to control adequately for endogeneity of
ownership [firms not being selected for privatization at random]”, and that of those which do,
“many treat the issue in a relatively haphazard way” (2-3).
Since we cannot address firm selection statistically, endogeneity remains a logical
possibility, albeit we believe an unlikely one. Mass privatization, by design, did not occur on a
case-by-case basis but instead followed a sectoral strategy. As Lieberman (1997) explains in the
introduction to a World Bank volume on the experience of mass privatization in transition
economies:
Mass privatization is largely a systems approach to privatization. ... The programs usually start with a selection process – for example, all medium-size and large enterprises in the tradables sector except very large or ‘strategic’ enterprises … (2).

30
Studies evaluating the determinants of privatization confirm that mass privatization was typically
carried out on a sectoral basis. In a study of Russian mass privatization, for example, Nureev and
Runov (2002) compare lists of enterprises not subject to voucher privatization (by industry) at
different points in time and infer from changes in these lists a desire of officials to privatize the
most “delicate” enterprises last (i.e. assets in the oil, energy, chemical and petrochemical,
aviation, and nuclear sectors).6 To the extent that sequencing occurred, a bias would have thus
operated across sectors (e.g. privatizing agriculture early, but delaying manufacturing), for
which we are able to control in our analysis by using firm-sector dummy variables.
To the extent there was variation in privatization within sectors, existing research
indicates suggests that “better” firms were privatized first. That is, some countries selectively
delayed privatization of the largest, most interlinked state-owned enterprises (considered “too big
to fail”) but rapidly privatized smaller and more dynamic firms (King 2000). Gupta et al. (2008),
in a recent analysis of government priorities and firm sequencing in the Czech mass privatization
program, report “strong evidence that the Czech government privatized first firms that were more
profitable” (204). Szentpéteri and Telegdy (2010) report similar results in a study of Romanian
mass privatization, though they note that an overarching objective of the government in selecting
firms was employment preservation, outweighing even potential efficiency gains from
privatization. To our knowledge, no existing research or data have suggested that the firms with
the least potential were selectively privatized under mass privatization programs.
As a final robustness check, we used the statistical method of constructing a measure of the
“hazard of privatization” described above but applied to the firm-level. Again, we use a two-step
procedure: first we estimate the probability that a firm was privatized based on a set of observed
characteristics of the firm, including its performance. Then, we use this model to combine both

31
observed and unobserved characteristics into a new variable, the hazard of privatization, and
incorporate it into the models assessing the relationship between privatization and firm
performance. As shown in Online Supplement J, none of our earlier results were qualitatively
altered and, in the case of barter, became stronger, as those firms with greater underlying hazard
of privatization were found to have lower risks of negative outcomes. This finding is consistent
with existing scholarship on firm selection and further suggests that any unobserved firm-
selection bias was in the opposite direction of our hypothesis.
DISCUSSION AND LIMITATIONS
Based on country- and firm-level evidence, our analysis indicates that mass privatization
negatively affected state capacity via two central mechanisms. Mass privatization directly
weakened the state’s revenue base, and that this decline was not offset by enterprise growth
because, as we demonstrate, mass privatization also had negative effects on the business
environment. While the available data on state capacity are limited, we employed six different
measures in our analysis. Using cross-national longitudinal data, we show that mass privatization
created a fiscal shock to the state that significantly diminished government revenues and
spending. We also determined on the basis of firm-level data that mass privatization negatively
affected state capacity in three areas: government inefficiency, unofficial payments/bribery, and
weakened protection of property rights. Finally, we present evidence that privatized firms were
more likely to rely on barter and accumulate tax arrears, both of which indicate a weakened
capacity of the state to maintain control of its own fiscal and monetary system.
These findings contrast with the neoliberal prediction that mass privatization would both
promote firm restructuring and combat weak corporate governance, ultimately leading to

32
stronger growth. They are, however, consistent with the leading post-mortem explanations (by
both economists and sociologists) insofar as weak institutions and poor governance were major
causes of the post-communist economic recession. Our model goes beyond this understanding by
showing that the capacity of post-communist states, itself contingent on domestic policy choices,
played a crucial role in determining subsequent economic performance. Thus, while we agree
with sociological work emphasizing the centrality of the state, we are isolating the fiscal effects
of mass privatization as a key mechanism producing poor economic and political performance.
Our results also support the gradualist and statist critiques of rapid liberalization, as well as
social structural analyses emphasizing the importance of FDI. Though not a central focus of this
paper, in many of our models, the EBRD liberalization index had a large negative effect on both
government spending and GDP growth. There also seems to be some evidence for the beneficial
effects of FDI in the micro-data: foreign-invested firms bartered less and paid their taxes more
promptly than domestic-owned companies. Including FDI as a percent of GDP into the
regression models had no effect (results not reported), as foreign investment was simply not
prevalent enough in mass-privatizing countries to make a difference. Indeed, mass privatization
was viewed by its designers as an alternative to waiting for foreign investors, who were expected
to be hesitant to invest in gigantic Soviet-era combines during a time of considerable political
and economic uncertainty. Thus, the decision to mass privatize was at the same time a decision
not to rely on FDI.
One limitation of our study is that, while we have documented the effects of mass
privatization on a variety of measures of state capacity at the national and firm levels, we did not
further model the causal chain to demonstrate the effect of state capacity on economic growth
(beyond a direct effect on lower government spending, which, by design, is a substantial

33
component of GDP). However, as noted above, there has been a growing recognition among
both social scientists and policy-makers that state capacity is a crucial determinant of, and
precondition for, balanced economic growth – a trend also reflected in recent policy reports of
the World Bank (1997, 2002). Additionally, corroborating our firm-level insights, our macro-
level path analysis supports the hypothesis that the effect of mass privatization on growth
operated principally through a reduction in state capacity (as measured by per capita spending);
there is also preliminary evidence from this region that government spending has had
economically stimulating effects (see endnote).7 Although we used six indicators of state
capacity, the enterprise- and country-level measures are limited (especially the fiscal indicators).
Further studies should attempt to better assess bureaucratic capacity and its variations across
countries and over time.
Still, it is conceivable that there exists a potential unobserved “third” factor that accounts for
the observed link between mass privatization and weakened state capacity. If this hypothesis
were correct, however, this factor would arguably constitute no more than a distant determinant
on the causal chain. Given that mass privatization was implemented across sub-regions with
divergent historical trajectories, it is unlikely that a single underlying factor simultaneously
affected state capacity and the privatization strategy chosen by different post-socialist
governments. Our models and a detailed comparative review of the historical cases indicate that
domestic intra-elite competition, ethnic politics, and regional diffusion all played significant
roles in determining the method of privatization. At the firm-level, there is also potential for
selection based on performance, leading to spurious estimates of the effects of privatization.
However, just as data were unavailable to policy-makers in assessing pre-privatization
performance and market values of firms (and thus unlikely to have been a major component of

34
selection), so, too, is this information not accessible to researchers today. Where information was
available, its validity is dubious, as managers and firm insiders with vested interests made
deliberate attempts to falsify records and undervalue firms in order to purchase them at bargain
prices. Moreover, mass privatization programs were designed to privatize entire sectors
(Lieberman 1997) (which we control for using firm-sector dummy variables); to the extent that
within-sector selection occurred, better-performing firms tended to be privatized earlier in the
process. Nevertheless, as with nearly any statistical analysis, there is a possibility that both our
cross-national time series and our firm-level results are subject to endogeneity – in the former
case due to spurious causality (ecological fallacy), and in the latter case due to selection biases.
Future research should attempt to refine our understanding of the political economy of mass
privatization and, in particular, the issue of firm selection. While we do not suggest mass
privatization was the only factor reducing state capacity, we are confident overall that we have
demonstrated that it was a key factor undermining state capacity and, as a result, economic
growth.
Finally, two unusual country cases merit a brief discussion. The most important outlier of the
post-communist world, that is, the country that implemented mass privatization according to our
definition but nonetheless had good overall performance and managed to attract a large amount
of FDI, is the Czech Republic. The Czech Republic was the second-richest country in the region,
owed little external debt, had a long and celebrated history of industrial production stemming
from its time as the economic powerhouse of the Austro-Hungarian Empire, had a ready-made
pre-communist legal tradition of contract and property rights, and a privileged location bordering
Germany. Still, by 1999, the Czech Republic recorded the worst scores on the protection of
property rights, government effectiveness, and the rate of growth within Central and Eastern

35
Europe. Case-study data moreover demonstrates that companies privatized through vouchers
experienced substantial governance problems (King 2001a, 2001b; McDermott 2002), and many
voucher-privatized firms were in fact renationalized before ultimately being sold to foreign
investors.
Another, perhaps less obvious, outlier is China. Although some Chinese reformers did
consider mass privatization as a policy option in the period leading up to 1989, systematic efforts
to privatize the country’s medium- and large-scale state enterprises did not begin until about
1995. We opted to exclude China from our analysis of mass privatization programs but including
it would have invariably strengthened our statistical findings, given our coding method and the
fact that China has been the fastest-growing economy in the world and is widely acknowledged
to have a better-performing state than most other post-Soviet countries (see Burawoy 1996).
Nonetheless, we include a brief overview of Chinese privatization in Online Supplement G, as
we believe that it constitutes an illustrative comparative case.
CONCLUSION
As our findings show, mass privatization programs directly undermined state fiscal
capability. They also damaged the enterprise sector, and thus indirectly contributed to a further
weakening of the bureaucratic capacity of the state and its ability to support the institutions
necessary for a functioning capitalist economy. Rather than accelerating the formation of private
property and securing a smooth transition to Western-style capitalism, as was intended by
advocates of mass privatization, these programs precipitated state withdrawal and pushed
countries in the direction of “crony” or “political” capitalism. A large and growing body of
empirical evidence shows that a different type of capitalism, emphasizing patron-client ties and a

36
non-bureaucratic state, emerged in parts of the FSU and Eastern Europe. Meanwhile, countries
that proceeded more gradually in creating a private sector, such as Poland and Slovenia, are now
much closer to the Western capitalist ideal, with a relative separation of politics and economics
(for details, see the literature review in King and Szelényi 2005). To be sure, we are not claiming
that mass privatization is the only path to post-communist patrimonialism (Bulgaria, for instance,
constitutes a clear case of patrimonial capitalism but did not implement a mass privatization
program). Yet by contributing to a fiscal crisis and creating severe governance problems, mass
privatization certainly provided a fertile ground for activities conducive to patrimonialism
(funneling of assets, official corruption, solicitation of kick-backs, privatizing of the means of
administration, etc.).
Of course, there was widespread horizontal corruption during the Soviet era (e.g. gifts or
informal payments made to service providers), which occurred as a rational response to the
shortage economy. Prior to privatization, however, it was extremely rare to see vertical
corruption, such as bribing of police officers (see Reddaway and Glinski 2001). Post-transition,
the state and the enterprise sector became riddled with patron-client relationships (see King and
Szelenyi [2005] and Ganev [2007] for a review). Further, while reliable comparative data on
corruption levels is hard to obtain (given the unobservable nature of successful corruption),
Popov (2004) finds that various proxy measures (e.g. unofficial payments, barter, homicide and
crime rates) have recorded dramatic increases since the beginning of the transition. Our analysis
begins to explain how this further deterioration in governance occurred.
Our results do not indicate that mass privatization was the only determinant of post-
communist economic performance. We are, however, claiming that it explains a substantial
amount of the variation in performance. Future analysis might arrive at a more differentiated
37
picture by employing improved measures of other types of transition policies (e.g. price and
trade liberalization). Undoubtedly, external factors, such as relative prices, are causally important
as well. Finally, as sociologists we never doubted that “initial conditions” are important, and our
Hausman-Taylor tests indicate that we have statistically accounted for the most relevant ones in
our models that were disaggregated into former Soviet core and satellite countries.
Our findings have several theoretical and policy implications. For sociological theory, our
analysis supports the position that states and markets are not antagonistic entities as maintained
by the neoliberal perspective (Block 1994; Evans 1995; Fligstein 2001; Block and Evans 2005).
It also supports the traditional sociological thesis of the importance of a bureaucratic state for
successful capitalist development (e.g., Weber 1978; Evans 1995; Evans and Rauch 1999).
Regarding public policy, our analysis suggests that when designing major economic reforms,
particularly in the area of private sector development, safe-guarding government revenues and
state capacity ought to be a high priority. Counting on a future burst of productivity from a
“restructured” private economy to compensate for declining tax revenues appears a risky
proposition, given the post-communist experience.
Our analysis cannot resolve whether neoliberal predictions about privatization in Eastern
Europe were logically faulty per se or whether their implementation – the privatization process –
crucially modified its outcomes. Two central predictions of the theory of mass privatization as a
property reform strategy, that the state’s fiscal shock would be compensated by i) savings from
overcoming inefficient planning and ii) additional revenues raised from the superior growth of de
novo private firms, are not borne out in available data. As Kogut and Spicer’s (2002) qualitative
study of mass privatization in Russia and the Czech Republic found, privatization had adverse

38
effects on governance and restructuring. Our data corroborate this finding across the region and
further show that tax collection was more difficult among newly privatized firms.
Privatization is likely to remain a salient issue in coming years. As three senior World Bank
officials note in a recent volume on privatization in transition economies, “What still amazes
many of us who worked on privatization throughout this period in the transition countries is how
quickly the transformation happened. However, there is more to do with respect to privatization
in many countries in the region and transition economies elsewhere in the world” (Lieberman et
al. 2008: 59). As recently as 2008, Egypt considered implementing a mass privatization program,
distributing public company shares to some 40 million Egyptian citizens (Saif and Choucair
2008). Similar policies had been contemplated in Syria and Tunisia prior to the 2011 Arab
Spring, with the EBRD being invited to consult on the process. Whenever such large-scale
economic restructurings take place, there is potential for unintended consequences that can
fundamentally alter the program’s implementation and outcomes. Only if we carefully measure
the economic, political and social consequences of past reform strategies will we be able to avoid
repeating their mistakes in the future.

REFERENCES Arakelyan, Vazgen. 2005. “Privatization as a Means to Property Distribution in the Republic of
Armenia and in the Russian Federation.” Ph.D. Dissertation, Faculty of Economics and Administration, University of Tampere, Finland.
Åslund, Anders. 1999. “Why Has Russia’s Economic Transformation Been So Arduous?” Paper
presented at the Annual World Bank Conference on Development Economics, Washington, D.C., April 1999.
_____. 2002. Building Capitalism: The Transformation of the Former Soviet Bloc. Cambridge:
Cambridge University Press. Barnes, Andrew S. 2006. Owning Russia: The Struggle over Factories, Farms, and Power.
Ithaca: Cornell University Press. Bauer, Tamás P. 1983. “The Hungarian Alternative to Soviet-Type Planning.” Journal of
Comparative Economics 7: 304-316. Bell, Stuart. 1997. “Country Studies: Georgia.” Pp. 197-200 in Between State and Market: Mass
Privatization in Transition Economies, edited by Ira W. Lieberman, Stilpon S. Nestor, and Raj M. Desai. Washington, D.C.: World Bank.
Bennett, John, Saul Estrin, James Maw, and Giovanni Urga. 2004. “Privatization Methods and
Economic Growth in Transition Economies.” Discussion Paper 4291. Center for Economic and Policy Research.
Bennett, John, Saul Estrin, and Giovanni Urga. 2007. “Methods of Privatization and Economic
Growth in Transition Economies.” Economics of Transition 15: 661-683. Blanchard, Olivier, Rudiger Dornbusch, Paul Krugman, Richard Layard, and Lawrence
Summers. 1991. Reform in Eastern Europe. Cambridge: MIT Press. Blanchard, Oliver, Maxim Boycko, Marek Dabrowski, Rudiger Dornbusch, Richard Layard, and
Andrei Shleifer. 1993. Post-communist Reform: Pain and Progress. Cambridge: MIT Press. Block, Fred. 1994. “The Role of State in the Economy.” Pp. 691-711 in Handbook of Economic
Sociology, edited by Richard Swedberg and Neil Smelser. Princeton: Princeton University Press.
Block, Fred, and Peter Evans. 2005. “The State and the Economy.” Pp. 505-526 in Handbook of
Economic Sociology (second edition), edited by Richard Swedberg and Neil Smelser. Princeton: Princeton University Press.
Burawoy, Michael. 1996. “The State and Economic Involution: Russia through a China Lens.”
World Development 24: 1105-1122.

40
Burawoy, Michael, and Pavel Krotov. 1992. “The Soviet Transition from Socialism to Capitalism: Worker Control and Economic Bargaining.” American Sociological Review 57: 16-38.
Carlin, Wendy, John van Reenen, and Toby Wolfe. 1994. “Enterprise Restructuring in the
Transition: An Analytical Survey of the Case Study Evidence from Central and Eastern Europe.” Working Paper No. 14. London: European Bank for Reconstruction and Development.
Clemens, Elisabeth S. 2007. “Toward a Historicized Sociology: Theorizing Events, Processes,
and Emergence.” Annual Review of Sociology 33:527-49. Cohen, Stephen F. 2001. Failed Crusade: America and the Tragedy of Post-Communist Russia.
New York: W.W. Norton. De Melo, Martha, and Alan Gelb. 1996. “A Comparative Analysis of Twenty-Eight Transition
Economies in Europe and Asia.” Post-Soviet Geography and Economics 37: 265-285. De Melo, Martha, Cevdet Denizer, Alan Gelb. 1996. From Plan to Market: Patterns of
Transition. Washington, D.C.: World Bank. De Melo, Martha, Cevdet Denizer, Alan Gelb, and Stoyan Tenev. 2001. “Circumstances and
Choice: The Role of Initial Conditions and Policies in Transition Economies.” The World Bank Economic Review 15: 1-31.
Djankov, Simeon and Peter Murrell. 2002. “Enterprise Restructuring in Transition: A
Quantitative Survey.” Journal of Economic Literature 40: 739-792. EBRD [European Bank for Reconstruction and Development]. 1994-2005. Transition Report,
various editions. London: EBRD. Ellerman, David. 1998. “Voucher Privatization with Investment Funds: An Institutional
Analysis.” World Bank Policy Research Working Paper No. 1924. _____. 2003. “On the Russian Privatization Debate.” Challenge 46: 6-28. Evans, Peter B. 1995. Embedded Autonomy: States and Industrial Transformation. Princeton:
Princeton University Press. Evans, Peter B., and James E. Rauch. 1999.”Bureaucracy and Growth: A Cross-National
Analysis of the Effects of ‘Weberian’ State Structures on Economic Growth.” American Sociological Review 64: 748-765.
Eyal, Gil, Ivan Szelényi, and Eleanor Townsley. 1998. Making Capitalism without Capitalists.
New York: Verso.

41
Fischer, Stanley, and Alan Gelb. 1991. “The Process of Socialist Economic Transformation.” Journal of Economic Perspectives 4: 91-106.
Fish, M. Steven. 2005. Democracy Derailed in Russia: The Failure of Open Politics. Cambridge:
Cambridge University Press. Fligstein, Neil. 2001. The Architecture of Markets: An Economic Sociology of Twenty-first-
Century Capitalist Societies. Princeton: Princeton University Press. Friedman, Milton. 2002. “Economic Freedom behind the Scenes.” Pp. xvii-xxi in Economic
Freedom of the World: 2002 Annual Report, edited by James Gwartney and Robert Lawson, with Chris Edwards, Walter Park, Veronique de Rugy, and Smitha Wagh. Vancouver: Fraser Institute.
Frydman, Roman, Cheryl Gray, and Andrzej Rapaczynski. 1996. Corporate Governance in
Central Europe and Russia. Budapest: Central European University Press. Frydman, Roman, Andrzej Rapaczynski, and Joel Turkowitz. 1997. “Transition to a Private
Property Regime in the Czech Republic and Hungary.” Pp. 41–102 in Economies in Transition: Comparing Asia and Eastern Europe, edited by Wing Thye Woo, Stephen Parker, and Jeffrey D. Sachs. Cambridge: MIT Press.
Gaddy, Clifford G. and Barry W. Ickes. 2002. Russia’s Virtual Economy. Washington, D.C.:
Brookings Institution Press. Ganev, Venelin I. 2007. Preying on the State: The Transformation of Bulgaria after 1989.
Ithaca: Cornell University Press. Gupta, Nandini, Jhon C. Ham, and Jan Svejnar. 2008. “Priorities and sequencing in privatization:
Evidence from Czech firm panel data.” European Economic Review 52: 183-208. Gutsu, Vladimir. 1996. “Note on Privatization in Moldova.” Pp. 344-353 in Economic Transition
in Russia and the New states of Eurasia, edited by Bartlomiej Kaminski. Armonk: M.E. Sharpe.
Hanley, Eric, Lawrence P. King, and János István Tóth. 2002. “The State, International Agencies,
and Property Transformation in Postcommunist Hungary.” American Journal of Sociology 108:129-167.
Hanousek, Jan, Evžen Kočenda, and Jan Svejnar. 2007. “Origin and concentration: Corporate
ownership, control and performance in firms after privatization.” Economics of Transition 15: 1-31.
Held, Karl and Audrey Hill. 1989. From 1917 to Perestroika: The Victory of Morality over
Socialism. Munich: Resultate Gesellschaft fuer Druck und Verlag.

42
IMF [International Monetary Fund]. 2000. World Economic Outlook, October 2000: Focus on Transition Economies. Washington, D.C.: IMF.
Jermakowicz, Władysław W. and Julian Pańków. 1995. “Privatization in the Kyrgyz Republic.”
Russian and East European Finance and Trade 31: 31-72. King, Lawrence P. 2000. “Foreign Direct Investment and Transition.” European Journal of
Sociology. 41: 189-224. –––––. 2001a. “Making Markets: A Comparative Study of Postcommunist
Managerial Strategies in Central Europe.” Theory and Society 30: 494-538. _____. 2001b. The Basic Features of Post-Communist Capitalism: Firms in Hungary, the Czech
Republic, and Slovakia. Westport CT: Praeger Press. –––––. 2002. “Post-communist Divergence: A Comparative Analysis of Russian and Polish
Capitalism.” Studies in Comparative International Development 37: 3-34. –––––. 2003. “Shock Privatization: The Effects of Rapid Large Scale Privatization on Enterprise
Restructuring.” Politics and Society 31: 3-34. _____. 2007. “Does Neoliberalism Work? Comparing Economic and Sociological Explanations
of Postcommunist Performance.” Economic Sociology: The European Electronic Newsletter 8: 10-17.
King, Lawrence P., and Iván Szelényi. 2005. “Post-Communist Economic Systems.” Pp. 206-
229 in Handbook of Economic Sociology (second edition), edited by Neil J. Smelser and Richard Swedberg. Princeton: Princeton University Press.
King, Lawrence P., and Aleksandra Sznajder. 2006. “The State-Led Transition to Liberal
Capitalism: Neoliberal, Organizational, World Systems and Social Structural Explanations of Poland’s Economic Success.” American Journal of Sociology 12: 751-801.
Klebnikov, Paul. 2000. Godfather of the Kremlin: The Decline of Russia in the Age of Gangster
Capitalism. New York: Harcourt, Inc. Knack, Stephen. 2007. “Measuring Corruption: A Critique of Indicators in Eastern Europe and
Central Asia.” Journal of Public Policy 27: 255-291. Kogut, Bruce and Andrew Spicer. 2002. “Capital Market Development and Mass Privatization
are Logical Contradictions: Lessons from the Czech Republic and Russia.” Industrial and Corporate Change 11: 1-37.
Kogut, Bruce and Andrew Spicer. 2005. “Taking Account of Accountability: Academics,
Transition Economics and Russia.” INSEAD Working Paper.

43
Kornai, János. 1980. Economics of Shortage. New York: Elsevier North-Holland. –––––. 1990. The Road to a Free Economy: Shifting from a Socialist System. New York: W.W.
Norton. –––––. 1995. Highway and Byways: Studies on Reform and Post-Communist Transition.
Cambridge: MIT Press. Kosolowski, Rey. 1992. “Market Institutions, East European Reform, and Economic Theory.”
Journal of Economic Issues 26: 673-705. Kurtz, Marcus J., and Andrew Schrank. 2007. “Growth and Governance: Models, Measures, and
Mechanisms.” Journal of Politics 69:538 - 554. Lieberman, Ira W. 1997. “Introduction: Mass Privatization in Comparative Perspective.” Pp. 1-
15 in Between State and Market: Mass Privatization in Transition Economies, edited by Ira W. Lieberman, Stilpon S. Nestor, and Raj M. Desai. Washington, D.C.: World Bank.
Lieberman, Ira W., Stilpon S. Nestor, and Raj M. Desai. 1997. Between State and Market: Mass
Privatization in Transition Economies. Washington, D.C.: World Bank. Lieberman, Ira W., Joannis Kessides and Mario Gobbo. 2008. “An Overview of Privatization in
Transition Economies.” Pp. 9-80 in Privatization in Transition Economies: The Ongoing Story, edited by Ira W. Lieberman and Daniel J. Kopf. Amsterdam; Boston: Elsevier.
Lipton, David, and Jeffrey Sachs. 1990a. “Creating a Market Economy in Eastern Europe: The
Case of Poland.” Brookings Papers on Economic Activity 1: 75-133. –––––. 1990b. “Privatization in Eastern Europe: The Case of Poland.” Brookings Papers on
Economic Activity 2: 293-333. Mann, Michael. 1986. The Sources of Social Power. Cambridge: Cambridge University Press. McDermott, Gerald. 2002. Embedded Politics: Industrial Networks and Institution Building in
Post-Communism. Ann Arbor: University of Michigan Press. Medvedev, Roy A. 2000. Post-Soviet Russia: A Journey through the Yeltsin Era. New York:
Columbia University Press. Moore, Barrington, Jr. 1978. Injustice: The Social Bases of Obedience and Revolt. White Plains:
M.E. Sharpe. Murrell, Peter. 1992. “Evolution in Economics and in the Economic Reform of the Centrally
Planned Economies.” Pp. 35-53 in The Emergence of Market Economies in Eastern Europe, edited by Christopher Clague and Gordon C. Rausser. Cambridge: Blackwell.

44
Mygind, Niels. 1999. "Privatization, Governance and Restructuring of Enterprises in the Baltics." CEES Working Paper No. 30. Copenhagen: Copenhagen Business School.
Nee, Victor. 2000. “The Role of the State in Making a Market Economy.” Journal of
Institutional and Theoretical Economics 156: 64-88. Nellis, John. 2008. “Leaps of Faith: Launching the Privatization Process in Transition.” Pp. 81-
136 in Privatization in Transition Economies: The Ongoing Story, edited by Ira W. Lieberman and Daniel J. Kopf. Amsterdam: Elsevier.
Nureev, R.M. and A.B. Runov. 2002. “Rossiya: Neizbejna li deprivatizaciya.” Voprosi
Economiki 6: 1-31. Pappe, Yakov. 2000. Oligarchi: Ekonomicheskaya Chronika 1992-2000 (Oligarchs: An
Economic Chronicle 1992-2000). Moscow: VSE. Pivovarsky, Alexander. 2001. How does privatization work? Ownership Concentration and
Enterprise Performance in Ukraine. Washington, D.C.: International Monetary Fund. Popov, Vladimir. 2000. “Shock Therapy Versus Gradualism: The End of the Debate (Explaining
the Magnitude of Transformational Recession).” Comparative Economic Studies 42: 1-57. _____. 2004. “The State in the New Russia (1992-2004): From Collapse to Gradual Revival?”
PONARS Policy Memo 342. –––––. 2007. “Shock Therapy versus Gradualism Reconsidered: Lessons from Transition
Economies after 15 Years of Reforms.” Comparative Economic Studies 49: 1-31. Reddaway, Peter, and Dmitri Glinski. 2001. The Tragedy of Russia’s Reforms: Market
Bolshevism against Democracy. Washington: United States Institute of Peace Press. Rosefielde, Steven. 2001. “Premature Deaths: Russia’s Radical Economic Transition in Soviet
Perspective.” Europe-Asia Studies 53:1159-76. Sachs, Jeffrey. 1992a. “The Economic Transformation of Eastern Europe: The Case of Poland.”
Economics of Planning 25: 5-19. Sachs, Jeffrey. 1992b. “Accelerating Privatization in Eastern Europe: The Case of Poland.” New
European Law Review 1:71-89. –––––. 1994. Understanding Shock Therapy. London: Social Market Foundation. –––––. 1996. “Transitions at mid-decade: Economic transition in Central and Eastern Europe.”
AEA Papers and Proceedings 86:128-133.

45
Saif, Ibrahim and Farah Choucair. 2008. “Egypt's Privatization Initiative Raises Questions.” Arab Reform Bulletin, December 5, 2008.
Shafik, Nemat. 1995. “Making a market: Mass privatization in the Czech and Slovak Republics.”
World Development 23:1143-1156. Shen, Raphael. 1997. The Restructuring of Romania's Economy: A Paradigm of Flexibility and
Adaptability. Westport: Praeger. Shleifer, Andrei and Robert W. Vishny. 1998. The Grabbing Hand: Government Pathologies
and Their Cures. Cambridge: Harvard University Press. Spicer, Andrew , Gerald A. McDermott, and Bruce Kogut. 2000. "Entrepreneurship and
Privatization in Central Europe: The Tenuous Balance between Destruction and Creation." The Academy of Management Review 25:630-649.
Stark, David. 1992. “Path Dependence and Privatization Strategies in East Central Europe.” East
European Politics and Societies 6:17-51. Stiglitz, Joseph E. 2000. “Whither Reform: Ten Years of the Transition.” Proceedings of the
World Bank annual Conference on Development Economics (1999). Washington, D.C.: World Bank.
Stuart, Robert C., and Christina M. Panayotopoulos. 1999. “Decline and Recovery in Transition
Economies: The Impact of Initial Conditions.” Post-Soviet Geography and Economics 40: 267-280.
Stuckler, David, Lawrence King and Greg Patton. 2009. “The Social Construction of Successful
Market Reforms.” Working Paper no. 199. Political Economy Research Institute, University of Massachusetts, Amherst
Summers, Lawrence. 1994. “Comment.” Pp. 252-255 in The Transition in Eastern Europe.
Volume 1: Country Studies, edited by Oliver Blanchard, Kenneth Froot, and Jeffrey Sachs. Chicago: University of Chicago Press.
Szentpéteri, Ádám and Álmos Telegdy. 2010. “Political selection of firms into privatization
programs. Evidence from Romanian comprehensive data.” Economics and Politics 22: 298-328.
Szelényi, Iván, Katherine Beckett, and Lawrence P. King. 1994. “The Socialist Economic
System.” Pp. 234-251 in The Handbook of Economic Sociology, edited by Neil J. Smelser and Richard Swedberg. Princeton: Princeton University Press.
Szelényi, Iván and Katarzyna Wilk. 2010. “From Socialist Workfare to Capitalist Welfare State.”
Pp. 565-586 in The Oxford Handbook of Comparative Institutional Analysis, edited by Glenn
46
Morgan, John Campbell, Colin Crouch, Ove Kai Pedersen, and Richard Whitley. Oxford: Oxford University Press.
Terterov, Marat, and Jonathan Reuvid. 2005. Doing Business with Lithuania. London: GMB
Publishing. UNDP [United Nations Development Programme]. 1999. Transition 1999 - Europe and CIS
Human Development Report. New York: UNDP RBEC. Walder, Andrew G. 1995. “Local Governments as Industrial Firms: An Organizational Analysis
of China’s Transitional Economy.” American Journal of Sociology 101: 263-301. Weber, Max. 1958a. “Politics as Vocation.” Pp. 77-128 in For Max Weber: Essays in Sociology,
edited by Hans Gerth and C. Wright Mills. New York: Oxford University Press. –––––. 1958b. “Bureaucracy.” Pp. 196-244 in For Max Weber: Essays in Sociology, edited by
Hans Gerth and C. Wright Mills. New York: Oxford University Press. –––––. 1966. General Economic History. Translated by Frank H. Knight. New York: Collier
Books. –––––. 1978. Economy and Society. Edited by Guenther Roth and Claus Wittich. Berkeley:
University of California Press. Wedel, Janine R. 2001. Collision and Collusion: The Strange Case of Western Aid to Eastern
Europe. New York: Palgrave. Woodruff, David. 1999. Money Unmade: Barter and the Fate of Russian Capitalism. Ithaca:
Cornell University Press. World Bank. 1997. The State in a Changing World. Washington, D.C.: World Bank and Oxford
University Press. _____. 2002. Building Institutions for Markets. Washington, D.C.: World Bank and Oxford
University Press. World Bank and EBRD. 2000. The Business Environment and Enterprise Performance Survey
(BEEPS). Available online at: <http://info.worldbank.org/governance/beeps/> (August 10, 2004).
–––––. 2011. “Nuts and Bolts of the BEEPS Survey.” Official survey description. Available
online at: < http://www.worldbank.org/html/prddr/trans/aprmayjun03/boxpg15.htm> (March 9, 2011).
Zeitlin, Maurice. 1984. The Civil Wars in Chile. Princeton: Princeton University Press.

47
Zhandossov, Damir. 2011. “Privatization in Kazakhstan during the Transition to Capitalism.” M.Phil. Thesis, Department of Development Studies, University of Cambridge.
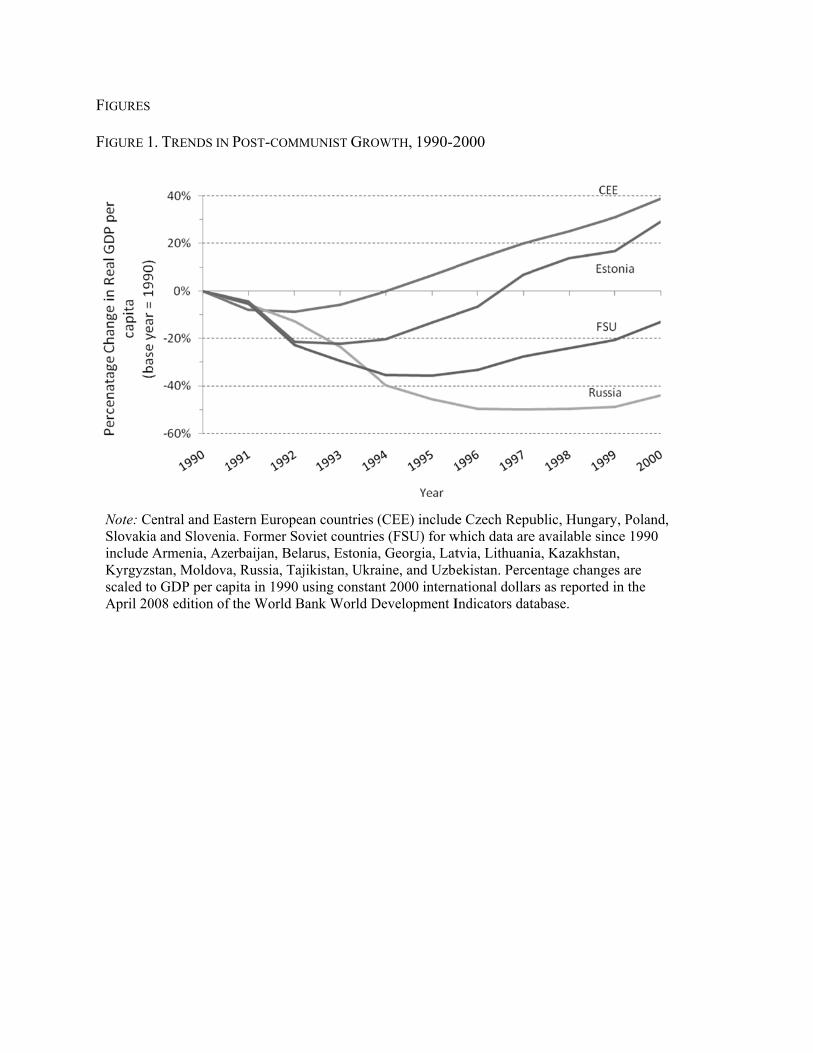
FIGURES FIGURE 1
Note: CeSlovakiainclude Kyrgyzsscaled toApril 20
1. TRENDS IN
entral and Eaa and SloveniArmenia, Azestan, Moldovao GDP per ca008 edition of
N POST-COMM
stern Europeaia. Former Soerbaijan, Belaa, Russia, Taj
apita in 1990 uf the World B
MUNIST GROW
an countries (oviet countriesarus, Estonia,jikistan, Ukrausing constanank World D
WTH, 1990-2
(CEE) includes (FSU) for w, Georgia, Lataine, and Uzbent 2000 intern
Development I
2000
e Czech Repuwhich data aretvia, Lithuaniekistan. Perce
national dollarIndicators dat
ublic, Hungare available sinia, Kazakhstaentage changers as reportedtabase.
ry, Poland, nce 1990 an, es are
d in the

FIGURE 2. EFFECTS OF MASS PRIVATIZATION ON FIRMS, THE STATE AND GROWTH Neoclassical-Neoliberal Framework State-Centered Framework
Economic Expansion
Enterprise Restructuring
Mass Privatization
Less State Intervention
Enterprise Failure
Weak State Capacity
Mass Privatization
Economic Involution

50
TABLE 1 VARIABLES USED IN CROSS-NATIONAL REGRESSIONS
Variable Description Source
Response variables
Government efficiency How would you rate the efficiency of the government in delivering services? (q48b), reverse coded
BEEPS
Weak contracts To what degree do you agree with this statement? “I am confident that the legal system will uphold my contract and property rights in business disputes”. (q23a)
BEEPS
Unofficial payments On average, what percent of revenues do firms like yours typically pay per annum in unofficial payments to public officials? (q27)
BEEPS
Real government spending Government spending in constant 2000 dollars, expressed as a percentage of 1992 spending
WDI
Real GDP per capita GDP per capita in constant 2000 dollars, expressed as a percentage of 1990 GDP per capita
WDI
Explanatory variables
Mass privatization Dummy variable indicating mass privatization programs covering at least 25% of large enterprises (see Online Supplement C for coding)
Authors’ coding
Price liberalization EBRD index of price liberalization EBRD
Democratization Cumulative civil liberties and political rights score
Freedom House
Oil Presence of oil Authors’ coding
War Military or ethnic conflict Authors’ coding
Urbanization Urban population as a percentage of total population
WDI
Education Tertiary education gross enrollment rate WDI
Former Soviet Union Dummy indicating whether a country was part of the Former Soviet Union
Authors’ coding
Initial GDP per capita Level of GDP in 1990 WDI
Note: EBRD is the European Bank for Reconstruction and Development; WDI is the World Bank World Development Indicators database (2005 and 2008 editions); BEEPS is the World Bank/EBRD Business Environment and Enterprise Performance Survey, 1999-2000.

51
TABLE 2
VARIABLES USED IN FIRM-LEVEL LOGISTIC REGRESSIONS Variable Description / Survey Question Coding
Dependent variables
Barter What share of your firm’s sales are now conducted in barter, offsets or bills of exchange (money surrogates)? (q67a)
0 = No Barter
1 = Barter
Investment Increased
By what percentage has your investment increased/decreased over the past three years? (q50c/q50d)
0 = Investment Decreased/Stayed the Same
1 = Investment Increased
Sales Increased By what percentage have your sales increased/decreased over the past three years? (q50c/q50d)
0 = Sales Decreased/Stayed the Same
1 = Sales Increased
Employment Increased
By what percentage has your employment increased/decreased over the past three years? (q50c/q50d)
0 = Employment Decreased or Stayed the Same
1 = Employment Increased
Overdue taxes Is the amount of payments overdue (by more than 90 days) by your company to government taxes substantial, manageable, modest or non-existent? (q53a)
0 = non-existent
1 = substantial. manageable, or modest
New Product development
Has your company undertaken the successful development of major new product line in the last three years? (q54)
0 = No
1 = Yes
Product upgrade Has your company undertaken the successful upgrading of existing product line in the last three years? (q54)
0 = No
1 = Yes
Explanatory variables
Privatized Dummy variable indicating firm was established by privatization of a state-owned firm (q7).
0=not privatized
1=privatized
Foreign Dummy variable indicating foreign ownership 0 = <100% foreign ownership
1 = 100% foreign ownership

52
TABLE 2 (CONTINUED) VARIABLES USED IN FIRM-LEVEL LOGISTIC REGRESSIONS
Variable Description / Survey Question Coding Sector Dummies Dummy for firm sector, including agriculture,
manufacturing, mining, construction, trade, retail, transport, finance, power and other sectors.
0/1
Firm age In what year was your firm founded? (q6) Age
Technology Dummy for whether firm has internet access (qS.17)
0 = No access
1= Access
Size Scale of full-time employees, ranging from 1 (1-9) to 7 (500 or more) (qS.5)
Number
Size2 Squared scale of full-time employees, ranging from 1 (1-9) to 7 (500 or more)
Large Dummy for >200 employees 0 = <200 employees
1 = ≥200 employees
Firm trades with the state sector
Does your company trade with the state sector 0 = No
1 = Yes
Firm receives subsidies
Does your enterprise receive subsidies (including tolerance of tax arrears) from local or national government (q65a)
0 = No
1 = Yes
New General Manager
Dummy for whether there had been a change in the general manager within the last three years (q8).
0 = No
1 = Yes
Domestic monopoly
Dummy for whether firm has 100% of market share (q61)
0 = <100% market share
1 = 100% market share
Source: World Bank/EBRD Business Enterprise and Environment Performance Survey, 1999/2000.

53
TABLE 3 EFFECT OF MASS PRIVATIZATION ON SUBJECTIVE MEASURES OF STATE CAPACITY
(1) (2) (3) Govt. inefficiency Poor Property Rights Unofficial payments
Mass privatization 0.19* [0.035,0.34]
0.27** [0.098,0.45]
0.073* [0.010,0.14]
Price liberalization -0.0026 [-0.15,0.15]
-0.063 [-0.31,0.18]
0.066 [-0.039,0.17]
Democratization -0.016 [-0.052,0.020]
0.014 [-0.048,0.077]
0.012 [-0.015,0.039]
Presence of oil 0.055 [-0.12,0.23]
0.0051 [-0.25,0.26]
-0.098 [-0.27,0.070]
Military conflict -0.0017 [-0.033,0.029]
-0.019 [-0.058,0.020]
0.0048 [-0.040,0.049]
Urbanization 0.0015 [-0.0033,0.0063]
0.0013 [-0.0067,0.0093]
-0.0029 [-0.0076,0.0017]
Education -0.0026 [-0.0100,0.0047]
0.0021 [-0.0058,0.0099]
-0.0035 [-0.0087,0.0018]
Former Soviet Union -0.063 [-0.27,0.15]
-0.077 [-0.30,0.15]
0.099 [-0.0062,0.20]
Initial GDP per capita -0.000027 [-0.00011,0.000051]
-0.0000065 [-0.000092,0.000079]
0.000013 [-0.000027,0.000052]
Constant 0.78 [-0.24,1.81]
0.43 [-1.43,2.28]
0.19 [-0.53,0.92]
Observations 23 23 23 R2 0.644 0.663 0.589 Note: 95% confidence intervals in brackets * p<0.05, ** p<0.01, *** p<0.001

TABLE 4 EFFECT OF MASS PRIVATIZATION ON REAL GOVERNMENT SPENDING PER CAPITA AND REAL GDP
PER CAPITA, 1990-2000 (FULL SAMPLE) Government spending GDP per capita (4) (5) (6) (7) (8) (9)
Mass privatization -25.0** (7.61)
-19.9** (6.93)
-21.1* (8.78)
-13.3** (4.12)
-14.9*** (4.14)
-16.3***
(4.36) Price liberalization
-13.3*** (3.59)
-7.82* (3.97)
-6.28** (2.15)
-7.56***
(2.29) Democratization
-2.76 (1.89)
-0.80 (2.12)
-1.29 (0.87)
-0.011 (0.93)
Oil
-14.4 (11.1)
14.1 (17.3)
-1.81 (7.15)
-0.62 (12.4)
War
6.68 (12.3)
-5.46 (13.2)
-6.66 (4.14)
-11.7 (6.19)
Urbanization
0.18 (0.47)
-0.48 (0.50)
0.20 (0.29)
-0.14 (0.39)
Education
1.62*** (0.36)
2.04*** (0.42)
1.10*** (0.15)
0.98*** (0.27)
Initial GDP per capita
0.0016 (0.0037)
0.0021 (0.0025)
0.00086 (0.0015)
0.0036**
(0.0013) Country-year trends No No Yes No No Yes
Nation-years 242 242 242 253 253 253 Nations 24 24 24 25 25 25 R2 0.036 0.397 0.723 0.117 0.365 0.782 Note: Robust standard errors in parentheses are clustered by country to reflect non-independence of sampling; random effects models presented, controls for country-specific fixed effects do not change the coefficient on mass privatization (Hausman-Taylor χ2(1) = 1.18, p=0.28). Real government spending per capita is expressed as a percentage of 1992 government spending. Real GDP per capita is expressed as a percentage of 1990 GDP. * p<0.05, ** p<0.01, *** p<0.001

55
TABLE 5 FIRM-LEVEL LOGISTIC REGRESSIONS RESULTS
Barter Investment Sales Employment (22) (23) (24) (25) (26) (27) (28) (29) MP Non-MP MP Non-MP MP Non-MP MP Non-MP Privatization 1.78***
(0.26) 1.09
(0.18) 0.59***
(0.071) 0.86
(0.10) 0.64***
(0.070) 0.82
(0.13) 0.42***
(0.051) 0.39*** (0.10)
FDI 0.38*** (0.11)
0.83 (0.31)
0.96 (0.22)
1.43 (0.60)
1.74* (0.49)
1.03 (0.42)
1.86 (0.92)
1.50 (0.60)
Agriculture 4.32*** (1.06)
0.61 (0.18)
1.17 (0.50)
0.65 (0.24)
1.99 (0.85)
1.04 (0.37)
0.97 (0.24)
0.78 (0.22)
Manufacturing 1.85* (0.48)
0.96 (0.26)
1.76 (0.67)
0.74 (0.21)
1.89 (0.78)
0.87 (0.22)
1.93 (0.65)
1.15 (0.19)
Mining 1.67 (0.85)
1.54 (1.37)
0.93 (0.88)
0.23 (0.24)
0.95 (0.54)
0.087 (0.11)
1.22 (0.91)
—
Construction 3.24*** (1.00)
0.90 (0.19)
1.17 (0.58)
0.66 (0.23)
1.49 (0.63)
0.83 (0.33)
1.79** (0.39)
1.09 (0.29)
Trade 1.91* (0.48)
0.75 (0.28)
1.70 (0.51)
0.83 (0.26)
2.16* (0.67)
1.25 (0.41)
1.92* (0.54)
1.48 (0.47)
Retail 0.86 (0.20)
0.57* (0.15)
2.01 (0.81)
0.51 (0.18)
1.83 (0.72)
0.71 (0.22)
1.86 (0.60)
1.00 (0.20)
Finance 0.26 (0.22)
0.16*** (0.072)
1.93 (0.67)
0.60 (0.33)
1.88 (1.33)
1.20 (0.88)
2.61** (0.88)
2.88** (1.02)
Power/Energy 1.01 (0.65)
0.28 (0.29)
0.52 (0.73)
0.70 (0.64)
0.77 (0.74)
0.59 (0.55)
0.61 (0.79)
1.21 (0.78)
Other sector 0.96 (0.36)
0.63 (0.24)
1.58 (0.70)
0.71 (0.25)
1.81 (0.65)
0.97 (0.34)
1.69 (0.62)
1.49 (0.40)
Firm age 1.00 (0.004
4)
1.02* (0.0071)
0.99 (0.0054)
1.00 (0.0027)
0.99 (0.0030)
0.99** (0.0031)
0.99* (0.0047)
0.99* (0.0040)
Technology 0.89 (0.094)
1.71* (0.46)
2.26*** (0.49)
2.07*** (0.41)
2.43*** (0.44)
1.90*** (0.36)
2.34*** (0.29)
2.27*** (0.43)
Size 2.58* (1.03)
1.46 (0.40)
1.10 (0.23)
1.27 (0.34)
1.13 (0.32)
1.32 (0.34)
2.21* (0.73)
2.08 (0.80)
Size2 0.92 (0.041)
0.97 (0.033)
1.00 (0.027)
0.97 (0.028)
1.00 (0.035)
0.98 (0.030)
0.92 (0.037)
0.90* (0.045)
Large 0.93 (0.25)
0.90 (0.32)
0.91 (0.20)
1.20 (0.30)
0.87 (0.19)
1.15 (0.29)
0.96 (0.25)
1.44 (0.41)
Firm subsidy 1.61* (0.37)
0.91 (0.26)
1.36 (0.29)
0.97 (0.17)
1.22 (0.18)
0.91 (0.15)
0.93 (0.18)
0.84 (0.14)
State trade 2.53*** (0.34)
2.34*** (0.31)
1.10 (0.23)
1.19 (0.18)
1.34** (0.15)
1.22 (0.23)
1.30* (0.16)
1.31 (0.26)
New GM 1.68* (0.34)
1.19 (0.18)
0.86 (0.11)
0.90 (0.20)
0.98 (0.14)
0.92 (0.12)
0.93 (0.096)
0.93 (0.16)
Dom. monopoly
0.80 (0.20)
0.74 (0.13)
0.69 (0.19)
0.93 (0.21)
0.70 (0.17)
0.89 (0.18)
0.85 (0.17)
0.93 (0.16)
Observations 1823 1684 1834 1664 1836 1680 1836 1653 Note: Exponentiated coefficients; standard errors in parentheses. * p < 0.05, ** p < 0.01, *** p < 0.001

56
TABLE 5 (CONTINUED) FIRM-LEVEL LOGISTIC REGRESSIONS RESULTS
Overdue taxes Prod. development Prod. upgrade (30) (31) (32) (33) (34) (35) MP Non-MP MP Non-MP MP Non-MP
Privatization 1.56** (0.22)
1.39** (0.17)
0.64** (0.087)
0.93 (0.20)
0.74* (0.100)
0.86 (0.11)
FDI 0.47* (0.15)
1.70 (0.61)
1.14 (0.32)
1.42 (0.49)
1.16 (0.31)
0.87 (0.31)
Agriculture 3.13** (1.17)
0.91 (0.28)
2.44 (1.16)
2.28* (0.88)
0.93 (0.29)
0.71 (0.26)
Manufacturing 1.41 (0.31)
1.29 (0.44)
4.75*** (1.78)
2.49** (0.74)
4.07*** (1.12)
2.35*** (0.57)
Mining 2.93 (3.08)
3.18 (2.87)
2.42 (1.74)
0.95 (0.90)
1.67 (0.87)
0.41 (0.39)
Construction 1.43 (0.37)
1.67 (0.54)
1.80 (0.85)
1.07 (0.41)
1.24 (0.36)
0.98 (0.29)
Trade 1.27 (0.29)
1.32 (0.33)
3.04* (1.45)
1.37 (0.36)
1.21 (0.38)
0.80 (0.21)
Retail 1.60 (0.50)
0.67 (0.22)
2.01 (0.84)
1.14 (0.28)
1.33 (0.43)
1.12 (0.28)
Finance 0.40 (0.43)
0.93 (0.34)
2.14 (0.95)
1.94 (1.00)
2.06 (0.88)
1.15 (0.66)
Power/Energy 1.27 (1.16)
1.41 (1.58)
1.74 (0.82)
3.10 (2.23)
2.16 (1.39)
1.97 (2.37)
Other sector 0.86 (0.19)
1.17 (0.49)
1.96 (0.92)
1.46 (0.30)
1.31 (0.38)
1.21 (0.20)
Firm age 1.00 (0.0039)
1.01* (0.0039)
0.99* (0.0043)
1.00 (0.0037)
1.00 (0.0027)
1.00 (0.0036)
Technology 0.82 (0.086)
0.70 (0.18)
1.68*** (0.26)
1.57* (0.31)
2.11*** (0.32)
1.86*** (0.30)
Size 1.00 (0.33)
1.81* (0.46)
1.03 (0.29)
0.90 (0.17)
1.51 (0.45)
0.76 (0.27)
Size2 1.05 (0.052)
0.92* (0.031)
1.01 (0.037)
1.03 (0.026)
0.96 (0.038)
1.06 (0.042)
Large 0.43 (0.22)
1.45 (0.47)
1.01 (0.31)
0.73 (0.23)
1.50 (0.54)
0.52*** (0.095)
Firm subsidy 1.17 (0.35)
1.85** (0.36)
1.21 (0.35)
1.04 (0.25)
1.36 (0.44)
0.86 (0.14)
State trade 1.33* (0.18)
0.86 (0.17)
1.28 (0.17)
1.33 (0.23)
1.04 (0.14)
1.27 (0.25)
New GM 1.45 (0.41)
1.38* (0.22)
1.23 (0.16)
0.77 (0.13)
0.77 (0.15)
0.87 (0.083)
Dom. monopoly 1.08 (0.19)
1.30 (0.36)
0.58** (0.098)
0.94 (0.18)
0.68 (0.17)
0.73 (0.13)
Observations 1804 1672 1839 1711 1839 1711 Note: Exponentiated coefficients; standard errors in parentheses. * p < 0.05, ** p < 0.01, *** p < 0.001

ONLINE S
ONLINE SPOST-COM
SUPPLEMENT
SUPPLEMENT
MMUNIST RE
TS
T A: COMPAR
ECESSION RING THE MA
57
AGNITUDE OFF THE GREATT DEPRESSIO
ON AND THE

58
ONLINE SUPPLEMENT B: METHODS OF PRIVATIZATION There were eight different ways in which this privatization was actually accomplished. All countries employed a combination of these methods.
(1) VOUCHERS OR COUPONS. These were programs that offered adult citizens “vouchers” or
“coupons”, which could then be used to purchase enterprises during privatization auctions. Their face value was much greater than their cost to the public. This was the dominant method of privatization in Russia and constitutes the subject of this empirical analysis.
(2) COMPETITIVE AUCTIONS. These typically occurred after a period of active restructuring. Some form of foreign ownership was often a natural outcome of this method (since they would be expected to win a large percentage of fair auctions because of their capital and experience). This was the modal form employed in Hungary and Poland (see King and Sznajder 2006).
(3) NON-COMPETITIVE AUCTIONS. In many instances, politically connected businessmen were able to privatize enterprises via rigged auctions. In such cases, the price paid for the enterprise was incredibly low. This was the modal form of Russia’s raw materials sector in the now infamous “Loans for Shares” program in which the crown-jewels of the Russian economy, its oil and metals firms, were privatized by oligarchs in exchange for media and political support for Boris Yeltsin’s 1996 re-election bid (see King and Treskow 2006 for details).
(4) MANAGEMENT AND EMPLOYEE BUYOUTS (MEBO). Perhaps the most common form of privatization, management and employee buyouts were accomplished in a variety of ways, but almost always involved substantial discounts to enterprise insiders. In most cases, management or some outside owners would centralize the shares of the workers by slowly buying them up. Sometimes they would use lease-to-own arrangements, in which managers and employees would lease the enterprise from the state until they paid an amount that made them its owners.
(5) EMPLOYEE-SHARE OWNERSHIP PROGRAMS (ESOP). These are employee shared ownership schemes in which the employees gain ownership of the firm. Unlike ordinary management and employee buyouts, however, there is a legal devise that centralizes the ownership and voting of the workers. This is crucial, since it guarantees actual worker control. These were very rare throughout the post-communist world, and were largely prohibited in Russia.
(6) FOREIGN INVESTMENT. Foreign investment can take the form of portfolio purchases, whereby a company is listed on a foreign stock exchange as an initial public offering (IPO). Most foreign investment in post-socialist countries took the form of direct investment (FDI), where a foreign firm purchased and controlled a company. It was typically the outcome of “fair” auctions, but was also accomplished in other ways. There could be a formal or informal preference for FDI (such as in Estonia, where FDI was sought as a hedge against Russian domination). In some cases, FDI operated via closed tenders, where the process is non-transparent and negotiated directly between the government and foreign buyers. FDI was the dominant privatization method in Hungary

59
and CEE more generally. FDI can also take the form of joint ventures with state owned enterprises (as is common in China).
(7) CROSS-OWNERSHIP. Here, firms are allowed to purchase the shares of other firms, which in turn purchase the shares of their new owners. The result is a system of cross-institutional ownership where a group of firms own themselves. This in practice means the upper management of these firms controls them through outside owners. This was observed in the Czech Republic (King 2001a, 2001b).
(8) RESTITUTION. In some cases the legal title of some enterprises that had been nationalized by the Communist regime was returned to their original family of ownership. Another variant was to give vouchers to compensate for nationalized property that could be used to purchase other stocks. Overall, restitution vouchers accounted only for a small percentage of state assets included in privatization (King 2007).
(9) GREENFIELD PRIVATIZATION. This strategy consists of delaying privatization while creating the conditions for greenfield investment and preparing the exit of inefficient firms. In essence, it allows a private economy to emerge in the presence of an increasingly marketized state sector, until the country “grows out of the plan”. This is the dominant method in China.

60
ONLINE SUPPLEMENT C: BEST ESTIMATE OF EXTENT OF MASS PRIVATIZATION PROGRAM Country Mass privatization scheme Coding Albania Never implemented No Armenia 75% medium and large enterprises Yes Azerbaijan Less than 10% of firms by assets No Belarus Never implemented No Bulgaria Never implemented No Croatia Very small program (225,000 people) in residual state
holdings in 15% of enterprises No
Czech Republic 33% of assets of all firms Yes Estonia Never implemented No Georgia 50% of medium and large enterprises Yes Hungary Never implemented No Kazakhstan 60% of large enterprises Yes Kyrgyz Rep 50% of medium and large enterprises Yes Latvia About 40% of large or medium enterprises Yes Lithuania About 45% of all enterprise assets Yes Macedonia Never implemented No Moldova 40-50% of assets Yes Poland About 10% of assets No Romania About 38% of medium and large enterprises Yes Russia More than 80% of the industrial workforce Yes Slovakia About 10-15% (all while part of Czechoslovakia) No Slovenia Never implemented No Tajikistan Never implemented No Turkmenistan Never implemented No Ukraine About 44% of medium and large enterprises Yes Uzbekistan Never implemented No
Source: Country descriptions, all years of Transition Report (EBRD 1994-2005). Note: Mass privatization = privatization by vouchers alone or in combination with management and employee buyouts (see Online Supplement B for descriptions).

ONLINE SUPPLEMENT D. CROSS-NATIONAL AND FIRM-LEVEL MODELS AND METHODS
Cross-National
We first tested the effects of mass privatization on a series of state capacity indicators at the
country level using cross-sectional survey data. Our basic model is as follows:
STATECAP i = α + β1PRIVi + β2LIBi + β3DEM i + β4OILi + β5WAR i + β6URBANi +
β7HIGHEDi + β8FSUi + β9INITGDPi + εi
STATECAP refers to our subjective state capacity indicators; PRIV is our measure of
privatization; LIB is the EBRD index of price liberalization; DEM is the Freedom House index
of democratization; OIL is the dummy for the presence of oil; URBAN is the rate of
urbanization; HIGHED is the tertiary education enrollment rate; WAR is a dummy for the
occurrence of military or ethnic conflict; INITGDP is the level of GDP at the start of transition;
and ε is the error term.
Our basic models for the time-series analysis are as follows:
(1) GOVSPEND1990 i,t = α + β1PRIVi,t + β2LIBi,t + β3DEMi,t + β4OILi,t + β5WARi,t + β6URBANi,t
+ β7HIGHEDi,t + β8INITGDPi,t + εi,t
(2) GDP1990i,t = α + β1PRIVi,t + β2LIBi,t + β3DEMi,t + β4OILi,t + β5WARi,t + β6URBANi,t +
β7HIGHEDi,t + β8INITGDPi,t + εi,t
Here, i refers to country and t refers to year. GDP1990 [GOVSPEND1990] is the current year’s
GDP in constant 2000 US dollars [government spending in constant 2000 dollars], expressed as a
percentage of the 1990 level of GDP per capita [the 1992 level of government spending]; PRIV
is our measure of privatization; LIB is the EBRD index of price liberalization; DEM is the
Freedom House index of democratization; OIL is the dummy for the present of oil; URBAN is
the rate of urbanization; HIGHED is the tertiary education enrollment rate; WAR is a dummy for

62
the occurrence of military or ethnic conflict; INITGDP is the level of GDP at the start of
transition; and ε is the error term. Models were estimated using random effects, as Hausman-
Taylor tests indicated that unobserved country-fixed effects added no significant explanatory
power (or affected coefficient estimates) after taking the main factors of the model into account.
Our approach uses a weighted average of variation within countries (assessing outcomes before
and after the effects of mass privatization), and between countries (evaluating longer-term
divergences between post-communist countries during the transition). Standard errors were
clustered by country to reflect non-independence of sampling, and to make statistical inferences
unbiased to serial correlation in the data.
Firm-Level
We employ the following basic model:
Firm Performance i = α + β1PRIVi + β2FDI i + β3-20 [controls] i + εi
PRIV is a dummy variable indicating if the firm ws established by privatization of a state-owned
firm. FDI is a dummy variable indicating full foreign ownership. Models are also adjusted for
two broad sets of controls: sector dummies (including agriculture, manufacturing, mining,
construction, trade, retail, transport, finance, power, and other sectors), and firm and market
characteristics (including firm age, access to technology, firm size, state trade, and presence of a
domestic monopoly). Table 2 further describes the explanatory and response variables used in
our model.

ONLINE SUPPLEMENT E
TABLE E1 EFFECT OF MASS PRIVATIZATION ON REAL GOVERNMENT SPENDING PER CAPITA, 1990-2000 (SPLIT
SAMPLE) FSU non-FSU (10) (11) (12) (13) (14) (15)
Mass privatization -27.0** (8.98)
-19.8*** (5.00)
-22.8** (7.59)
-14.4*
(5.79) -0.58 (17.5)
4.09 (21.7)
Price liberalization -
-11.1** (3.91)
-3.07 (5.25)
-
-9.63** (2.97)
-6.38 (3.96)
Democratization -
6.95*** (1.68)
4.82** (1.83)
-
-4.51 (3.93)
-4.31 (4.99)
Oil -
1.90 (13.9)
126.9***
(30.4) -
n/a n/a
War -
31.2*** (8.09)
4.83 (13.1)
-
-29.8 (20.3)
-24.7 (20.6)
Urbanization -
-0.074 (0.83)
11.6** (4.37)
-
-0.65 (0.53)
3.30 (4.37)
Education -
1.70*** (0.44)
1.91** (0.65)
-
1.13* (0.45)
1.12 (1.17)
Initial GDP per capita -
0.0010 (0.0086)
-0.53** (0.18)
-
0.0061 (0.0041)
-1.30 (1.59)
Country-year trends No No Yes No No Yes
Nation-years 147 147 147 95 95 95 Nations 15 15 15 9 9 9 R2 0.004 0.472 0.779 0.047 0.369 0.607 Note: Robust standard errors in parentheses are clustered by country to reflect non-independence of sampling; random effects models presented, controls for country-specific fixed effects do not change the coefficient on mass privatization (Hausman-Taylor χ2(1) = 1.18, p=0.28). Real government spending per capita is expressed as a percentage of 1992 government spending. * p<0.05, ** p<0.01, *** p<0.001
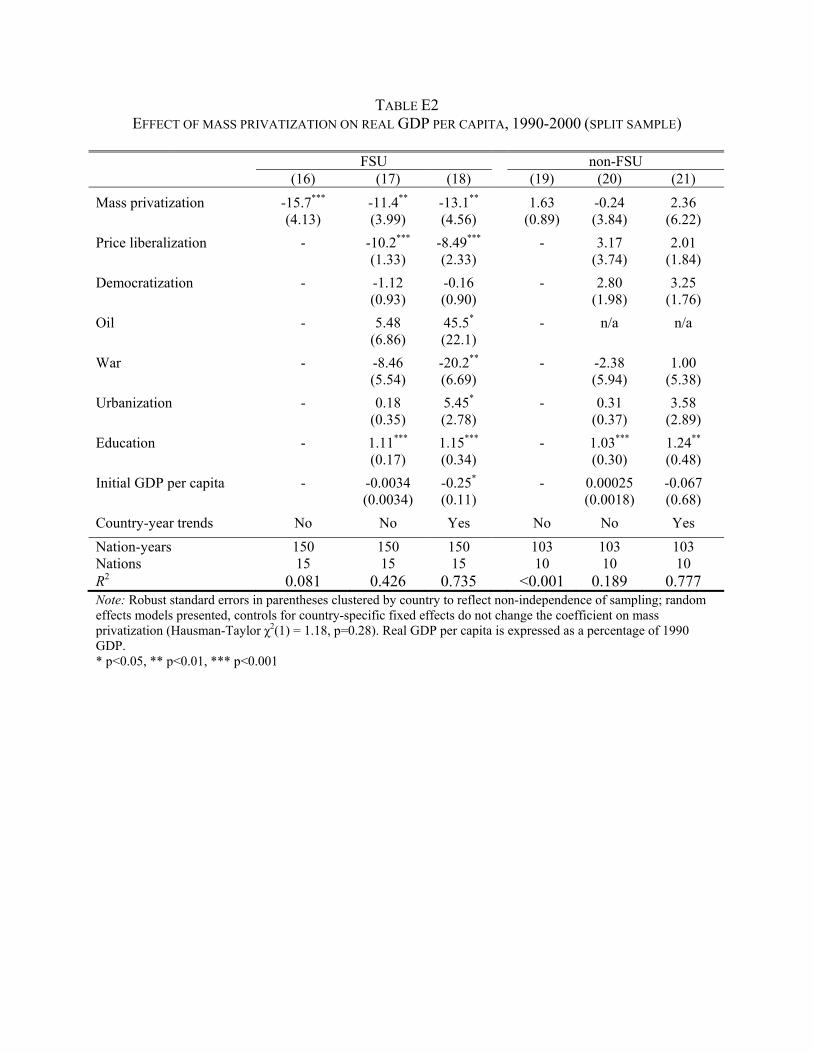
TABLE E2 EFFECT OF MASS PRIVATIZATION ON REAL GDP PER CAPITA, 1990-2000 (SPLIT SAMPLE)
FSU non-FSU (16) (17) (18) (19) (20) (21)
Mass privatization -15.7*** (4.13)
-11.4** (3.99)
-13.1** (4.56)
1.63 (0.89)
-0.24 (3.84)
2.36 (6.22)
Price liberalization -
-10.2*** (1.33)
-8.49***
(2.33) -
3.17
(3.74) 2.01
(1.84)
Democratization -
-1.12 (0.93)
-0.16 (0.90)
-
2.80 (1.98)
3.25 (1.76)
Oil -
5.48 (6.86)
45.5* (22.1)
-
n/a n/a
War -
-8.46 (5.54)
-20.2** (6.69)
-
-2.38 (5.94)
1.00 (5.38)
Urbanization - 0.18 (0.35)
5.45* (2.78)
-
0.31 (0.37)
3.58 (2.89)
Education - 1.11*** (0.17)
1.15*** (0.34)
-
1.03*** (0.30)
1.24** (0.48)
Initial GDP per capita -
-0.0034 (0.0034)
-0.25* (0.11)
-
0.00025 (0.0018)
-0.067 (0.68)
Country-year trends No No Yes No No Yes
Nation-years 150 150 150 103 103 103 Nations 15 15 15 10 10 10 R2 0.081 0.426 0.735 <0.001 0.189 0.777 Note: Robust standard errors in parentheses clustered by country to reflect non-independence of sampling; random effects models presented, controls for country-specific fixed effects do not change the coefficient on mass privatization (Hausman-Taylor χ2(1) = 1.18, p=0.28). Real GDP per capita is expressed as a percentage of 1990 GDP. * p<0.05, ** p<0.01, *** p<0.001

ONLINE SUPPLEMENT F: REPLICATION USING EBRD AVERAGE PRIVATIZATION INDEX
As a robustness check to our basic findings, we also evaluated the effects of the EBRD’s subjective indices on progress in privatization drawn from the EBRD Transition Indicator database. These EBRD indicators range from 1 (planned) to 4.3 (advanced market). Because their small- and large-scale indices are so highly correlated (r >0.97 in most countries) as to be statistically indistinguishable, following Godoy and Stiglitz (2006) we used an average of these indices to reduce measurement errors.
TABLE F1 EFFECT OF MASS PRIVATIZATION ON REAL GDP PER CAPITA, 1990-2000
FSU non-FSU (1) (2) (3) (4) (5) (6) EBRD average privatization index
-7.91** (2.33)
-4.88 (2.50)
-6.82* (2.48)
4.89 (2.52)
-3.91 (2.78)
-5.14 (3.34)
Price liberalization -
-9.39*** (1.52)
-11.0***
(2.01) -
1.41
(1.62) -0.46 (1.57)
Democratization -
1.68 (1.21)
2.51* (1.07)
-
2.67 (1.37)
3.08 (1.83)
War -
-5.90 (8.03)
4.70 (7.51)
-
1.39 (2.58)
-5.02 (2.22)
Urbanization -
-0.24 (1.86)
-0.12 (2.25)
-
4.21 (1.96)
-0.14 (5.57)
Education -
1.11*** (0.19)
1.11** (0.30)
-
1.30** (0.28)
0.36 (0.59)
Country-year trends No No Yes No No Yes
Nation-years 150 150 150 103 103 103 Nations 15 15 15 10 10 10 R2-within 0.254 0.582 0.751 0.130 0.611 0.805 Note: Robust standard errors in parentheses clustered by country to reflect non-independence of sampling; fixed effects models presented, as unobserved country fixed effects cannot be assumed to be exogenous to the mass privatization-growth relationship (Hausman-Taylor χ2(1) = 46.89, p<0.0001). These fixed effects correct for the effects of oil and initial GDP. Real GDP per capita is expressed as a percentage of 1990 GDP. * p<0.05, ** p<0.01, *** p<0.001

66
ONLINE SUPPLEMENT G: POLITICAL ECONOMY OF MASS PRIVATIZATION The following studies of the ten post-socialist countries which implemented mass privatization programs consistently suggest that privatization policy was driven by political motives of various kinds (including ethnic, fiscal, anti-Russian, and interest group politics). A separate, detailed discussion of the Russian case is provided below; for illustrative purposes, we also include a short overview of China’s alternative path to property reform.
Armenia: Arakelyan (2005: 195-288); Roth-Alecandro (1997) Czech Republic: Schwartz (2006: 85-156); Desai and Plockovà (1997) Georgia: Bell (1997); Silagadze and Beridze (1996: 354-356) Kazakhstan: Olcott 2010: (136-143); Haghayeghi (1997: 321-328); Lorch and Karlova (1997) Kyrgyzstan: Abazov (1999: 207-210); Fine (1997); Jermakowicz and Pańków (1995) Latvia: Mygind (1999) Lithuania: Morkunaite (1999); Lee (1997); Samonis (1995) Moldova: Gutsu (1996); Stolojan (1997) Romania: Shen (1997: 121-138); Earle and Telegdy (1998); Tardy (1997) Ukraine: Åslund (2009: 78-83); Drum (1997)
Privatization in the Russian Federation Privatization in Russia was the political project of an alliance of domestic elites and foreign policy advisors. In July 1991, the government issued preliminary privatization laws, and then charged the State Committee for Management of State Property (GKI) under the chairmanship of Anatoli Chubais with developing a national privatization strategy (Shleifer and Treisman 2001: 22-23). The GKI was advised by a team of Western economists and received considerable financial support from international donors such as USAID (Cohen 2001; Wedel 2001). The voucher privatization program developed by the GKI and advanced by the Yeltsin government encountered significant political resistance, however; the debate initially focused on whether privatization should proceed at all, and subsequently on the form the privatization program would take (Barnes 2006: 70-75).
The mass privatization program ultimately adopted by the Russian parliament was the outcome of a political compromise, in which the reformers allied themselves with the firm managers, while simultaneously mobilizing popular support for the voucher program (Barnes 2006: 74-75). Mass privatization was thus a purposeful project of the Russian authorities. This point is further supported by Reddaway and Glinski (2001) who highlight that “counterfactual opportunities” (5) remained available in the form of alternative privatization models proposed by the domestic political opposition. In the fall of 1992, the Yeltsin government’s future course of action was contingent on its “choice of allies in society at large and coalition partners” (13), and it opted for the “commercialized nomenklatura” and its “sympathizers in the West” (13).
The economic objective of mass privatization was neither the practical implementation of neoliberal ideology (i.e. the creation of private owners who rationally maximize their self-interest), nor a mere populist measure to produce a “millions of owners rather than a handful of millionaires” by distributing company shares to all citizens. Rather, in the words of Anatoli Chubais:

67
A number of people would be unsatisfied with the outcome, but the fundamental problem was, will [privatization] happen or not? From an economic point of view, voucher privatization – the voucher itself was not the best way to achieve privatization. More to the point, it was clear that the voucher was a substitute for money, and if you issue a voucher, you will not get money from privatization by selling state properties, but that was the price. It was the only way to make it doable. ... No one said that the goal of voucher privatization was to restructure private property, to restructure companies, to attract investments, to speed up economic growth, or to increase the standard of living because it was clear that the process would require several stages. Voucher privatization was just asset distribution, leading to the next stage of property concentration, resulting in new investments, finally leading to enterprise restructuring. There are at least four or five stages (quoted in Desai [2006: 89]; our emphasis).
The central political objective of mass privatization was to make the reform process and the distribution of assets to private owners irreversible, and thereby quell ongoing resistance from anti-reform political factions, especially in the Congress of People’s Deputies, which was dominated by the communists in late 1992 when mass privatization was launched (Barnes 2006; Desai 2006; Lieberman, Nestor, and Desai 1997; Boycko, Shleifer and Vishny 1995). Chubais, the main architect of the program, confirmed this assessment in an interview in 1999:
INTERVIEWER: You emerged as a reformer explicitly in 1992 with your privatization program, voucher privatization in particular, and I believe that this move was motivated by ideological considerations. You wanted Russian industry removed from state ownership and control, converting industrial units into joint stock companies with diversified ownership. Would you agree with that view? CHUBAIS: Absolutely. (Desai 2006: 88)
Privatization in the People’s Republic of China
China, as Naughton (1994) points out, represents the unusual case of an economy “that has made a transition to a primarily market economy, but in which publicly owned enterprises still produce the bulk of manufacturing output” (266). Indeed, by 1995, the state-owned sector (excluding collectively-owned firms) still accounted for 34% of China’s gross industrial output, down from 78% in 1978 (NBS 1996, Table 12-3). During the same period, the contribution of de novo private firms and of rural collective enterprises grew from virtually zero to nearly 50%.
Plans for a systematic privatization of the state enterprises were first considered in 1994, when a reform and restructuring program under the slogan of “grasping the large and letting go the small” (zhuada fangxiao) was announced by the Chinese government (Cao, Qian, and Weingast 1999). By 1996, most small state and collective enterprises had been given up by contracting them out, by leasing or selling them, and, increasingly, by letting them go bankrupt (CASS 1996: 18-19). Privatization of large firms proceeded at a more gradual pace, as reformers emphasized the construction of globally competitive firms over the privatization of individual plants (or even segments thereof). Instead of outright divestment, the Chinese government pursued a strategy of ownership diversification by restructuring state enterprises as joint-stock companies with a corporate shareholding structure. During this process, only a tiny fraction of large state firms were actually transferred into the hands of private individuals, while the bulk of large firm ownership has gradually spread among a variety of public institutions (Nolan and

68
Wang 1999, 190-191). By now, some state enterprises have even carried out limited initial public offerings on domestic and global stock exchanges.
Necessitated by the restructuring of the state-owned sector and the growth of the private sector economy, a variety of new ownership categories were introduced to the Chinese statistical reporting system in 1998 (shareholding enterprises, joint-stock corporations, private businesses, etc.). Many enterprises that had been previously labeled state-owned were re-classified under the new system, thus impeding the comparability of subsequent statistics. The OECD estimated on the basis of government statistics that the total state sector share in the economy (including firms owned through state-holding companies and other forms of indirect ownership) was 29.7% in 2006 (OECD 2009: 6). Thus, even today, China differs significantly from the successor economies of the FSU, where state ownership typically occurs only in sectors that represent national security interests (e.g. energy, defense).

ONLINE SUPPLEMENT H: POLITICAL ECONOMY OF MASS PRIVATIZATION (TESTING INITIAL
CONDITIONS, ETHNIC POLITICKING, EXTERNAL INFLUENCES, AND SOCIAL STRUCTURAL CHANGES)
TABLE H1 INITIAL CONDITIONS AND MASS PRIVATIZATION Mass privatization
Transparency 0.28* (0.12)
Rule of law -0.045 (0.058)
Quality of bureaucracy -0.23 (0.19)
Civil society 0.019 (0.096)
Defense spending 0.054 (0.037)
Industrial distortion -0.026 (0.028)
Trade distortion -0.0097 (0.016)
Black market 0.0076 (0.0087)
Years of central planning -0.037 (0.028)
Oil 0.26 (0.49)
FSU 0.57 (1.00)
Constant -
Observations 22 Note: The first four institutional indices measure transparency of policymaking and accountability of the executive, quality of law enforcement, quality of the local bureaucracy, civil liberties, political rights and the influence of civic organizations based on Campos and Nugent (1999). See Godoy and Stiglitz (2006) for additional details. Black market exchange measures the difference between black market exchange rates and official exchange rates in 1990. Defense spending is defense expenditure as a percentage of GDP in the late 1980s. Industrial distortion is the sum of distortions in agriculture, industry and services sectors. Distortion was measured as the deviation from the share of GDP in these sectors versus the average share for market economies with comparable GDP per capita in purchasing-power-parity. Trade distortion is the distortion from expected trade/GDP in market economies minus the sum of external trade/GDP, external trade within FSU as a share of GDP and external trade with socialist countries as a share of GDP. Both trade and industry distortion measures were calculated by Popov (2000) for 1990.
* p < 0.05, ** p < 0.01, *** p < 0.001
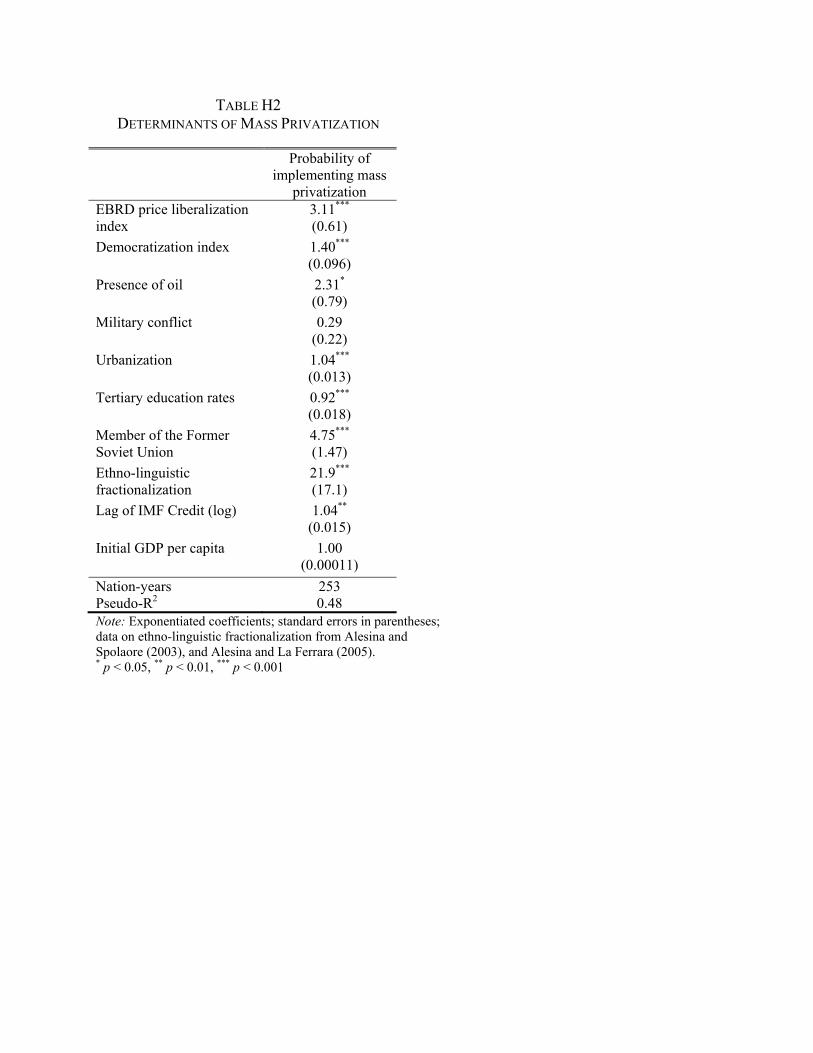
TABLE H2 DETERMINANTS OF MASS PRIVATIZATION
Probability of implementing mass
privatization EBRD price liberalization index
3.11*** (0.61)
Democratization index 1.40*** (0.096)
Presence of oil 2.31* (0.79)
Military conflict 0.29 (0.22)
Urbanization 1.04*** (0.013)
Tertiary education rates 0.92*** (0.018)
Member of the Former Soviet Union
4.75*** (1.47)
Ethno-linguistic fractionalization
21.9*** (17.1)
Lag of IMF Credit (log) 1.04** (0.015)
Initial GDP per capita 1.00 (0.00011)
Nation-years 253 Pseudo-R2 0.48 Note: Exponentiated coefficients; standard errors in parentheses; data on ethno-linguistic fractionalization from Alesina and Spolaore (2003), and Alesina and La Ferrara (2005). * p < 0.05, ** p < 0.01, *** p < 0.001

71
ONLINE SUPPLEMENT I: COUNTRY-LEVEL ENDOGENEITY
TABLE I1 ENDOGENEITY-ADJUSTED CROSS-NATIONAL ESTIMATES
GDP Government
spending Mass privatization -42.7***
(4.21) -12.3 (9.63)
Hazard of mass privatization
20.2*** (2.69)
-1.97 (5.43)
Nation-years 253 242 Note: Bootstrapped standard errors in parentheses based on 50 replications. * p < 0.05, ** p < 0.01, *** p < 0.001

ONLINE SUPPLEMENT J: FIRM-LEVEL ENDOGENEITY
TABLE J1 REPLICATION OF TABLE 5 (ADJUSTED FOR ENDOGENOUS FIRM SELECTION)
Barter Investment Sales Employment MP Non-MP MP Non-MP MP Non-MP MP Non-MP Privatization 2.41***
(0.45) 1.21
(0.27) 0.73
(0.13)0.58** (0.10)
0.84 (0.16)
1.09 (0.26)
0.58** (0.10)
0.76 (0.17)
Hazard of privatization
0.64*** (0.068)
0.91 (0.11)
1.14 (0.12)
1.26* (0.13)
1.05 (0.11)
0.93 (0.13)
1.26* (0.13)
1.07 (0.14)
Observations 1823 1684 1834 1836 1836 1680 1836 1661 Note: Exponentiated coefficients; standard errors in parentheses. Treatment effects models estimated using a two-step modelling framework: (1) Firm Performance i = α + β1PRIVi + β2FDI i + β3-20 [controls] i + β21σi + εi (2) Firm Privatizationo = Ф( α + β1PRIVi + β2FDI i + β3-20 [controls] i + εi) Here the σ is the inverse-mills ratio, the hazard of privatization, constructed from the first-stage probit model. * p < 0.05, ** p < 0.01, *** p < 0.001
TABLE J1 (CONTINUED) Overdue Taxes Product Upgrade Product Development MP Non-MP MP Non-MP MP Non-MP Privatization 1.07
(0.19) 1.08
(0.22) 0.71*
(0.13)1.08
(0.24) 0.77
(0.13) 1.06
(0.22) Hazard of privatization 1.02
(0.11) 0.99
(0.12) 1.19
(0.12)0.94
(0.12) 1.11
(0.11) 0.96
(0.12) Observations 1804 1672 1839 1711 1839 1711 Note: Exponentiated coefficients; standard errors in parentheses * p < 0.05, ** p < 0.01, *** p < 0.001

ONLINE SUPPLEMENT REFERENCES Abazov, Rafis. 1999. “Policy of Economic Transition in Kyrgyzstan.” Central Asian Survey 18:
197-223. Alesina, Alberto and Enrico Spolaore. 2003. The Size of Nations. Cambridge: MIT Press. Alesina, Alberto, and Eliana La Ferrara. 2005. “Ethnic Diversity and Economic Performance.”
Journal of Economic Literature 43: 762-800. Arakelyan, Vazgen. 2005. “Privatization as a Means to Property Distribution in Republic of
Armenia and in the Russian Federation.” PhD Dissertation, Faculty of Economics and Administration, University of Tampere, Finland.
Åslund, Anders. 2009. How Ukraine Became a Market Economy and Democracy. Washington,
D.C.: Peterson Institute for International Economics. Barnes, Andrew S. 2006. Owning Russia: The Struggle over Factories, Farms, and Power.
Ithaca: Cornell University Press. Bell, Stuart. 1997. “Country Studies: Georgia.” Pp. 197-200 in Between State and Market: Mass
Privatization in Transition Economies, edited by Ira W. Lieberman, Stilpon S. Nestor, and Raj M. Desai. Washington, D.C.: World Bank.
Boycko, Maxim, Andrei Shleifer, and Robert Vishny. 1995. Privatizing Russia. Cambridge: MIT
Press. Campos, Nauro F. and Jeffrey B. Nugent. 1999. "Development Performance and the Institutions
of Governance: Evidence from East Asia and Latin America." World Development 27: 439-452.
Cao, Yuanzheng, Yingyi Qian, and Barry Weingast. 1999. “From Federalism, Chinese Style, to
Privatization, Chinese Style.” Economics of Transition 7: 103-131. CASS [Chinese Academy of Social Sciences]. 1996. “A research report on planning for the
reform of state-owned enterprises before 2010.” Social Sciences in China, Vol. 17, No. 40:5-18.
Cohen, Stephen F. 2001. Failed Crusade: America and the Tragedy of Post-Communist Russia.
New York: W.W. Norton. Desai, Padma. 2006. Conversations on Russia: Reform from Yeltsin to Putin. New York: Oxford
University Press. Desai, Raj. M and Vladĕna Plockovà. 1997. “Country Studies: The Czech Republic.” Pp. 190-
196 in Between State and Market: Mass Privatization in Transition Economies, edited by Ira W. Lieberman, Stilpon S. Nestor, and Raj M. Desai. Washington, D.C.: World Bank.

74
Drum, Bernard. 1997. “Country Studies: Ukraine.” Pp. 242-247 in Between State and Market:
Mass Privatization in Transition Economies, edited by Ira W. Lieberman, Stilpon S. Nestor, and Raj M. Desai. Washington, D.C.: World Bank.
Earle, John S. and Álmos Telegdy. 1998. “The Results of ‘Mass Privatization’ in Romania: A
First Empirical Study.” Economics of Transition 6: 313-332. EBRD [European Bank for Reconstruction and Development]. 1994-2005. Transition Report,
various editions. London: EBRD. Fine, Gary J. 1997. “Country Studies: The Kyrgyz Republic.” Pp. 209-212 in Between State and
Market: Mass Privatization in Transition Economies, edited by Ira W. Lieberman, Stilpon S. Nestor, and Raj M. Desai. Washington, D.C.: World Bank.
Godoy, Sergio, and Joseph E. Stiglitz. 2006. “Growth, Initial Conditions, Law and Speed of
Privatization in Transition Countries: 11 Years Later.” NBER Working Paper No. 11992. Cambridge: National Bureau of Economic Research.
Gutsu, Vladimir. 1996. “Note on Privatization in Moldova.” Pp. 344-353 in Economic Transition
in Russia and the New states of Eurasia, edited by Bartlomiej Kaminski. Armonk: M.E. Sharpe.
Haghayeghi, Mehrdad. 1997. “Politics of privatization in Kazakhstan.” Central Asian Survey 16:
321-337. Jermakowicz, Władysław W. and Julian Pańków. 1995. “Privatization in the Kyrgyz Republic.”
Russian and East European Finance and Trade 31: 31-72. King, Lawrence P. 2001a. “Making Markets: A Comparative Study of Postcommunist
Managerial Strategies in Central Europe.” Theory and Society 30: 494-538. _____. 2001b. The Basic Features of Post-Communist Capitalism: Firms in Hungary, the Czech
Republic, and Slovakia. Westport CT: Praeger Press. King, Lawrence P., and Aleksandra Sznajder. 2006. “The State-Led Transition to Liberal
Capitalism: Neoliberal, Organizational, World Systems and Social Structural Explanations of Poland’s Economic Success.” American Journal of Sociology 12: 751-801.
King, Lawrence P., and Jakob Treskow. 2006. “Understanding Russian Oil.” Canadian Foreign
Policy 13: 77-92. Lieberman, Ira W., Stilpon S. Nestor, and Raj M. Desai. 1997. Between State and Market: Mass
Privatization in Transition Economies. Washington, D.C.: World Bank.

75
Lee, Barbara. 1997. “Country Studies: Lithuania.” Pp. 213-215 in Between State and Market: Mass Privatization in Transition Economies, edited by Ira W. Lieberman, Stilpon S. Nestor, and Raj M. Desai. Washington, D.C.: World Bank.
Lorch, Klaus and Enna E. Karlova. 1997. “Country Studies: Kazakhstan.” Pp. 201-208 in
Between State and Market: Mass Privatization in Transition Economies, edited by Ira W. Lieberman, Stilpon S. Nestor, and Raj M. Desai. Washington, D.C.: World Bank.
Morkunaite, Rasa. 1999. “Concentration of Capital in the Process of Voucher Privatization in
Lithuania. Pp. 260-268 in Reconstituting the Market: The Political Economy of Microeconomic Transformation, edit by Paul. G. Hare, Judy Batt, and Saul Estrin. Amsterdam: Harwood Academic.
Mygind, Niels. 1999. "Privatization, Governance and Restructuring of Enterprises in the
Baltics." CEES Working Paper No. 30. Copenhagen: Copenhagen Business School. Naughton, Barry. 1994. “Chinese Institutional Innovation and Privatization from Below.” The
American Economic Review 84: 266-270. NBS [National Bureau of Statistics of the People's Republic of China]. 1996. China Statistical
Yearbook 1996. Beijing: China Statistical Press. Nolan, Peter and Wang Xiaoqiang. 1999. “Beyond Privatization: Institutional Innovation and
Growth in China’s Large State-Owned Enterprises.” World Development, Vol. 27, No. 1: 169-200.
OECD [Organisation for Economic Co-operation and Development]. 2009. “State Owned
Enterprises in China: Reviewing the Evidence.” Occasional Paper (January 26, 2009), OECD Working Group on Privatisation and Corporate Governance of State Owned Assets. Available online at: <http://www.oecd.org/dataoecd/14/30/42095493.pdf> (August 15, 2011).
Olcott, Martha Brill. 2010. Kazakhstan: Unfulfilled Promise. Washington, D.C.: Carnegie
Endowment for International Peace. Popov, Vladimir. 2000. “Shock Therapy Versus Gradualism: The End of the Debate (Explaining
the Magnitude of Transformational Recession).” Comparative Economic Studies 42: 1-57. Reddaway, Peter, and Dmitri Glinski. 2001. The Tragedy of Russia's Reforms: Market
Bolshevism against Democracy. Washington, D.C.: US Institute of Peace Press. Roth-Alecandro, Melinda. 1997. “Country Studies: Armenia.” Pp. 181-183 in Between State and
Market: Mass Privatization in Transition Economies, edited by Ira W. Lieberman, Stilpon S. Nestor, and Raj M. Desai. Washington, D.C.: World Bank.

76
Samonis, Valdas. 1995. “Transforming the Lithuanian Economy: From Moscow to Vilnius and from Plan to Market.” Studies and Analyses, No. 42. Warsaw: Center for Social and Economic Research.
Schwartz, Andrew. 2006. The Politics of Greed: How Privatization Structured Politics in
Central and Eastern Europe. Lanham: Rowman and Littlefield. Shen, Raphael. 1997. The Restructuring of Romania's Economy: A Paradigm of Flexibility and
Adaptability. Westport: Praeger. Shleifer, Andrei, and Daniel Treisman. 2001. Without a Map: Political Tactics and Economic
Reform in Russia. Cambridge: MIT Press. Silagadze, Avtandil and Teimuraz Beridze. 1996. “Note on Privatization in Georgia.” Pp. 354-
356 in Economic Transition in Russia and the New states of Eurasia, edited by Bartlomiej Kaminski. Armonk: M.E. Sharpe.
Stolojan, Theodor. 1997. “Country Studies: Moldova.” Pp. 216-218 in Between State and
Market: Mass Privatization in Transition Economies, edited by Ira W. Lieberman, Stilpon S. Nestor, and Raj M. Desai. Washington, D.C.: World Bank.
Tardy, Patrick. 1997. “Country Studies: Romania.” Pp. 223-229 in Between State and Market:
Mass Privatization in Transition Economies, edited by Ira W. Lieberman, Stilpon S. Nestor, and Raj M. Desai. Washington, D.C.: World Bank.
Wedel, Janine R. 2001. Collision and Collusion: The Strange Case of Western Aid to Eastern
Europe. New York: Palgrave.

77
ENDNOTES 1 Using a network analysis of citation patterns, Kogut and Spicer (2005) demonstrate how a small subset of contributions to the debate over transition policies, primarily by Harvard economists and staff members at the World Bank and IMF, served to shape and legitimate the neoliberal policy package. 2 As two of the principal advisors described the program’s differences from prior (Western) instances of privatization: “We are advocating the rapid conversion of state enterprises into corporate form and the distribution of tranches of shares to various groups in the population, including workers, commercial banks, pension funds, and mutual funds. This strategy differs substantially from the standard methods of privatisation that have been used in the West: the sale of shares in an initial public offering and private placements to investor groups. The free distribution of shares helps to sidestep the difficult, costly, and time-consuming process of enterprise valuation, as well as the scarcity of financial capital in private hands in Eastern Europe. More importantly, corporatization combined with the free distribution of shares can occur quickly. Rapid privatisation is needed to combat the inevitable social, political, and economic problems associated with the lack of corporate governance” (Lipton and Sachs 1990b: 333). 3 McDermott (2002) is part of a small group of scholars who criticized mass privatization for its potential to obstruct governance. Ellerman (1998; 2003) was the first to provide a theoretical argument for expecting a governance disaster following mass privatization due to inevitable principal-agent problems. Spicer, McDermott, and Kogut (2000) reported supporting evidence from several sectoral case studies in Hungary, Czech Republic and Slovakia, while Kogut and Spicer (2002) provided extensive elite interview data from the Czech Republic and Russia, showing that mass privatization created governance patterns that inhibited investment due to uncertainty over asset ownership. King showed further case study evidence for the Czech Republic (2001b) and Russia (2003), linking firm failure to the diffused ownership structures resulting from mass privatization. Our own theory can be seen as an extension of this body of work, offering systematic quantitative support for the basic proposition, and extending the theory to emphasize the fiscal effects of mass privatization. 4 For a country to be coded as having implemented a mass privatization program, the government had to have formally declared such a program. In some countries, there were announcements but the actual program was never implemented, or not implemented among large enterprises (e.g. in the case of Polish mass privatization [see King and Sznajder 2006]). In practice, all mass privatization programs that were implemented combined vouchers with different management and employee ownership programs (see King 2001a, 2001b, 2002, 2003; Hanley, King, and Toth 2002; King and Sznajder 2006). 5 In fact, existing scholarship indicates that state capacity was generally much higher prior to the transition to capitalism. As Ganev (2007) points out, “a consensus has coalesced around the viewpoint that the transformative processes ... precipitated a rapid and radical weakening of state structures” (1). Popov (2004) summarizes the available statistical evidence for Russia, demonstrating that state capacity collapsed during the transition. While there had been some

78
variation in state capacity during the late socialist period, we do not believe that it can account for the sharp divergence in subsequent performance. To the extent that variation existed, we expect to capture it in our statistical analysis controlling for initial GDP and level of education. 6 For country-specific evidence suggesting that firm selection for mass privatization was largely sector-based, please refer to Arakelyan (2005) for Armenia, Shafik (1995) for the Czech Republic, Bell (1997) for Georgia, Zhandossov (2011) for Kazakhstan, Jermakowicz and Pańków (1995) for Kyrgyzstan, Mygind (1999) for Latvia, Terterov and Reuvid (2005) for Lithuania, Gutsu (1996) for Moldova, Shen (1997) for Romania, and Pivovarsky (2001) for Ukraine. 7 This relationship is best investigated by calculating the “Keynesian multiplier” (i.e. the additional growth associated with $1 of government spending). Government spending is considered a stimulus when $1 of additional government spending is associated with >$1 of economic growth. When evaluating this relationship cross-nationally using our fixed-effects model, the coefficient describing this relationship is 1.55, indicating that each $1 of government spending is associated with a $1.55 increase in overall growth. Stated alternatively, after subtracting government spending from GDP, each $1 of government spending is associated with a $0.55 increase in investment, consumption and/or net exports.