economic growth, income inequality and subjective … · economic growth, income inequality and ......
TRANSCRIPT
Economic Growth, Income Inequality and Subjective Well-being: Evidence from China
Xiaogang Wu Center for Applied Social and Economic Research (CASER)
The Hong Kong University of Science and Technology Clear Water Bay, Kowloon
Hong Kong SAR
Jun Li Institute of Sociology
Shanghai Academy of Social Sciences
Population Studies Center Research Report 13-796 July 2013
An early version of this paper was presented at the Annual Meeting of the Population Association of America, San Francisco, May 3rd -5th, 2012. The authors would like to thank the session organizer Richard A. Easterlin and discussant Rachel Margolis, as well as the other participants, Yu Xie and Kevin Tam, for comments and suggestions. The research was supported by a general research fund (644208) from the Research Grants Council of Hong Kong. Direct all correspondence to Xiaogang Wu, Center for Applied Social and Economic Research (CASER), The Hong Kong University of Science and Technology, Clear Water Bay, Kowloon, Hong Kong SAR (Email: [email protected]).

Economic Growth, Income Inequality and Subjective Well-being in China 2
ABSTRACT
This paper examines the subjective consequence of rising income inequality amidst the rapid economic growth in China. Based on the data from a national representative survey conducted in 2005, we employ multi-level models to show that, while personal income improves life satisfaction, the effect decreases with the level of local economic development; moreover, the rate of local economic growth has a positive effect, but local income inequality has a negative effect, on individuals’ life satisfaction. Our findings help to clarify the mixed results in previous studies and point to the importance of both economic and social policies in improving people’s subjective well-being in China’s transitional economy.
Economic Growth, Income Inequality and Subjective Well-being in China 3
INTRODUCTION
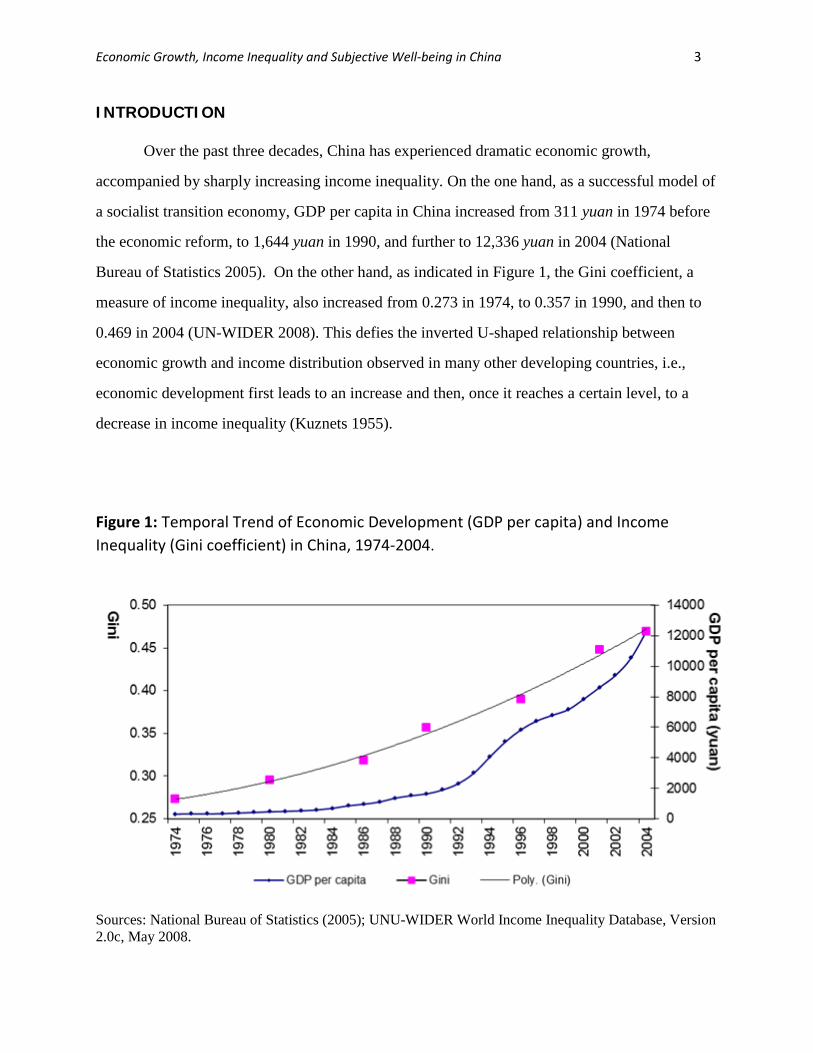
Over the past three decades, China has experienced dramatic economic growth,
accompanied by sharply increasing income inequality. On the one hand, as a successful model of
a socialist transition economy, GDP per capita in China increased from 311 yuan in 1974 before
the economic reform, to 1,644 yuan in 1990, and further to 12,336 yuan in 2004 (National
Bureau of Statistics 2005). On the other hand, as indicated in Figure 1, the Gini coefficient, a
measure of income inequality, also increased from 0.273 in 1974, to 0.357 in 1990, and then to
0.469 in 2004 (UN-WIDER 2008). This defies the inverted U-shaped relationship between
economic growth and income distribution observed in many other developing countries, i.e.,
economic development first leads to an increase and then, once it reaches a certain level, to a
decrease in income inequality (Kuznets 1955).
Figure 1: Temporal Trend of Economic Development (GDP per capita) and Income Inequality (Gini coefficient) in China, 1974-2004.
Sources: National Bureau of Statistics (2005); UNU-WIDER World Income Inequality Database, Version 2.0c, May 2008.
Economic Growth, Income Inequality and Subjective Well-being in China 4
With reference to the past socialist egalitarianism, the sharp increase in income inequality
has caused widespread social discontent that policy makers in China simply cannot ignore (Wu
2009). For instance, the two rounds of World Values Surveys of China conducted in 1990 and
2000 reveal that the proportion of population who considered themselves “very happy” fell by
more than a half from 28 percent to 12 percent; if measured on a 10-point scale, the satisfaction
score fell from an average of 7.3 to 6.5 over the two-year period (Brockmann et al. 2009). A
more recent analysis shows that the distribution of life satisfaction in China has become
increasingly unequal, with the worsening life satisfaction mainly from those left behind the
country’s economic prosperity (Easterlin et al. 2012).
Hence, China is confronted with problems of rising income inequality and falling
subjective well-being despite its ever growing economy. As argued by Appleton and Song
(2008), different manifestations of social discontent in China, such as demonstrations, strikes,
civil disorder, and criminality, reflect individuals’ dissatisfaction with life. As such, the
subjective dimension is important in understanding the mechanism of how inequality affects
social stability, especially in a society like China which is undergoing dramatic social and
economic transformation.
In this paper, we aim to examine the level of life satisfaction among individuals and its
relationship with income inequality and other macro-socioeconomic factors in China, based on
the analysis of a national representative household survey conducted in 2005. The paper is
structured as follows. We first introduce the concept of subjective well-being and review the
theoretical and empirical literature on its economic determinant, in China and elsewhere. We
then present the substantive questions and research hypotheses of this paper, followed by a
description of the data, variables, analytical strategies, and modeling techniques. Empirical
analyses and findings from both conventional regression and multi-level models on the life
satisfaction of individuals are then reported. Finally, we summarize the results and discuss the
social and political implications of our findings for China.
Economic Growth, Income Inequality and Subjective Well-being in China 5
THEORETICAL PERSPECTIVE AND EMPIRICAL FINDINGS
It has been a long held belief that economic development would necessarily lead to
improvements in human welfare in a society, as the people’s material living conditions, such as
food, housing, education, and medical care, are closely tied to the economic resources at their
disposal and to the resources available to the government for the provision of public goods (e.g.,
Kotaporpi and Laamanen 2010). Therefore, the governments of many developing countries,
including China, have made concerted efforts to promote economic growth in hopes of
upgrading their people’s livelihood and enhancing public support. A huge emphasis on GDP
growth, however, does not always yield the desired result, because exceptional GDP growth is
often accompanied by other socioeconomic trends that could very well decrease human welfare.
Economic development is not an end in itself; rather it is the means to increasing the well-being
of the people, including both the objective conditions and the subjective evaluation of the
development and their impact on human life. The latter has been receiving more and more
attention from social scientists and policy makers in recent years (Neckman and Torche 2007;
Van de Werhorst and Salverda 2012).
While life satisfaction is regarded as a global cognitive judgment of one’s life and often
employed to measure one’s subjective well-being, happiness refers to an affective or emotional
state, which is sensitive to sudden changes in mood (Diener and Lucas 2000; Diener and Ng
2010; Wong et al. 2006). Given the fact that the term “happiness” has gained much popularity in
the literature on social consequences of economic development, in this paper, we use “subjective
well-being”, “happiness”, and “life satisfaction” interchangeably, although what we are really
referring to is subjective well-being. We employ overall life satisfaction to measure a
respondent’s subjective well-being, following the standard practice in this specific research area
(e.g., Easterlin 2001), although one’s subjective well-being can be further disaggregated into
satisfaction with different life domains and the accuracy of the measurement can be further
studied and discussed (see Kahneman and Krueger 2006).
Economic Growth, Income Inequality and Subjective Well-being in China 6
Previous literature has largely focused on the relationship between economic conditions
and subjective well-being (i.e., wealth and happiness) at either individual or national level (see
the review by Dolan et al. 2008). Among all socio-economic characteristics, absolute income, be
it at the personal or household level, is consistently and positively associated with an individual’s
reported happiness (Blanchflower and Oswald 2004; opt. cit. Easterlin 2001; Frijters et. al. 2004;
Kahneman et al. 2006). Data from 19 European countries reveal that an increase in income from
the lowest to a middle income group increases life satisfaction scores by 0.71 points, which is
comparable to the rise in life satisfaction scores driven by a marginal improvement in
respondents’ health (Caporale et. al. 2009). Similar results have been repeatedly found in OECD
countries from 1975 to 1997 (Di Tella and MacCulloch 2008). Further analysis suggests a non-
linear relationship between absolute income and subjective well-being: the positive relationship
between happiness and absolute income only holds for the lower end of the income distribution
up to a threshold, beyond which the gains in happiness level off as absolute income continues to
rise. The attenuation at higher income levels does not occur when happiness is regressed on the
logarithm of income rather than absolute income (Easterlin 2001).
While it has been well established that the significantly strong and positive relationship
between income and happiness persists across individuals, the relationship does not change over
the life cycle, even if income increases with age (Diener et. al. 1999; Easterlin 1974, 2001;
Firebaugh and Tach 2012; Yang 2008). Moreover, using time-series data, Easterlin (1995)
reported that, the average subjective well-being for many countries has remained roughly
constant over time, even though per capita income has risen substantially over the observed
period. Di Tella et. al. (2003) also showed that the effect of GDP per capita on happiness wears
off over time in a country panel. This contradiction concerning the lack of a relationship between
wealth and happiness from a life cycle or longitudinal perspective is regarded as the “Easterlin
Paradox.”
According to Easterlin (1974, 2001), the paradox arises because people quickly get used
to what they have and their aspirations increase with their income as they get older, and so the
favorable effect of rising income on happiness disappears and subjective well-being reaches
equilibrium. The processes of adapting to income rise and adjusting one’s aspirations and
expectations are suggested to be governed by social comparisons (Hagerty 2000; Haller and
Hadler 2006). Individuals evaluate their level of income relative to that of a reference group
rather than, or in addition to, absolute income and adjust their expectations accordingly. In this
relative income hypothesis, comparison is based on evaluation of their economic situation or
Economic Growth, Income Inequality and Subjective Well-being in China 7
income level against a reference value (Clark et. al. 2008; Firebaugh and Schroeder 2009; Tao
and Chiu 2009; Diener and Lucas 2000).
The discussions above suggest that happiness is a positive function of income and a
negative function of aspirations. When both income and aspiration rise, their countervailing
effects lead to the stability of the subjective well-being of individuals. Furthermore, happiness or
life satisfaction carries a strong relative component. When people compare their income levels
with those of others, they could end up experiencing a state of relative deprivation, or put simply
a negative feeling, if they find out that they earn less than others. In this sense, income inequality
in the immediate environment, similar to reference income and subjective perceptions about
one’s own socio-economic status at the individual level, not only determines one’s level of
happiness, but could also generate feelings of relative deprivation (Zhao 2012).
Nonetheless, empirical findings on the relationship between income inequality and
subjective well-being are mixed. According to Runciman’s relative deprivation theory (1966),
high inequality generates a sense of relative deprivation and reduces one’s happiness. Empirical
findings from different countries have lent some support to this claim (Alesina et al. 2004; Fahey
and Smyth 2004; Morawetz et al. 1977; Oshio and Kobayashi 2010; Schwarze and Härpfer
2007). Based on the analysis of the data from over 70 countries over the period from 1980 to
2004, Verme (2011) showed that income inequality, measured by Gini coefficients, negatively
and significantly affects the subjective well-being of individuals, even after controlling for the
effects of explanatory variables in different forms and from different sources.
In contrast, other scholars have reported an insignificant or even a positive relationship
between income inequality and happiness in Russia (Senik 2004), Latin America (Graham and
Felton 2006), Japan (Ohtake and Tomioka 2004), and UK (Clark 2003). In China, Knight and
Gunatilaka (2010) showed that rural residents in counties with higher Gini coefficients tend to be
happier than those in counties with lower Gini coefficients. Jiang, Lu and Sato (2012) found that
inequality (as measured by city-level Gini coefficients) positively correlates with happiness in
urban China. Both suggested a different mechanism through which income inequality may affect
individuals’ satisfaction, known as the tunnel effect theory (Hirschman and Rothschild 1973).
Differing from the relative deprivation theory, the tunnel effect theory argues that a
greater degree of income inequality can be interpreted as a sign of better prospects for economic
developments and greater availability of employment opportunities (Marshall and Firth 1999).
This “demonstration effect” occurring in people’s immediate living environment in turn raises
their level of life satisfaction.

Economic Growth, Income Inequality and Subjective Well-being in China 8
Hence, based on different assumptions on how people perceive income inequality, the relative deprivation theory and the tunnel effect theory predict the opposite relationships between income inequality and subjective wellbeing. While it is true that happiness or life satisfaction is the product of relative comparison, be it with peers, or with future opportunities, whether the comparison leads to economic pessimism or optimism is largely contingent upon macro-economic conditions, such as the level of economic development and the rate of economic growth (Frey and Stutzer 2000, 2002). The widening income gap in China has been associated with a rapidly growing economy. We believe it is the latter, rather than income inequality per se, that creates enormous economic opportunities and chances for upward mobility, thus shaping individuals’ perception of inequality and life satisfaction (Clark and Senik 2010; Marshall and Firth 1999).
Previous research on this topic for China has either completely ignored the contextual economic factors or employed poor measures of these factors at a highly aggregated level. For instance, while Zhao (2012) claims to examines how economic inequality affects subjective wellbeing in China’s transitional economy, the four measures employed in the analyses - individuals’ income, housing, durable goods consumption, and social welfare benefits, are no more than indicators of individuals’ socioeconomic positions, rather than socioeconomic inequality in the place where the respondent lives. 1 In a comparative study of social determinants of happiness in China and United States, Lam and Liu (2013) employed no more than individual-level independent variables in their analyses thus suffer the same problem in the sense that they have mixed the issue of socioeconomic inequality in happiness with the impact of socioeconomic inequality on individuals’ happiness. Among the literature that addressed the latter, Lu and Wang (2011) found a negative impact of income inequality, proxied by provincial Gini coefficients, on people’s subjective wellbeing, but such measures are too crude at the provincial levels to gauge the inequality in the immediate living environment that could induce the social comparison and relative deprivation. Moreover, they demonstrated that income inequality negatively affects the subjective well-being through increasing provincial crime rate, which did not help to reconcile the inconsistent findings on the positive association between income inequality and life satisfaction that support the tunnel effect theory they discussed. While Knight and Gunatilaka (2010) employed county-level Gini coefficients and reported evidence supporting the tunnel effort theory, the Gini coefficients were calculated based on income
1 Take income as an example, what Zhao (2012) indeed has examined is the effect of absolute income on subjective wellbeing, whereas economic inequality, as previously discussed, seems to be more relevant to how relative income and social comparison affect the subjective wellbeing.
Economic Growth, Income Inequality and Subjective Well-being in China 9
reported by the individuals in the sample they analyzed, an approach also adopted by Jiang, Lu and Sato (2012) in their analyses of the data from Chinese 26 cities, which reported similar findings.2
More crucially, none of the other macro-economic variables such as the level and growth rate of economic development has been explicitly taken into account in these analyses mentioned above. Moreover, even though in the data individuals are nested in geographic jurisdictions (county, city, or province), for which economic development and income inequality are measured, all studies except for Zhao (2012) employed either conventional OLS regression models or ordered logit (probit) models, without paying adequate attention to the regional heterogeneity and the interaction effect between individual and contextual variables. To gain a comprehensive understanding of how individuals’ subjective well-being is determined by both their own characteristics and the socioeconomic contexts, multi-level models seem to be more appropriate (see Pittau et al. 2010; Qi 2012).
RESEARCH QUESTIONS AND HYPOTHESES
Our research question in this paper is quite straightforward. We aim to examine the effects of individuals’ income and local economic factors on their life satisfaction in China, paying special attention to the rising income inequality over the past decades. Empirical results from different countries have consistently shown that individuals’ personal income affects their subjective well-being, after controlling for other demographic characteristics. Therefore, we start to test the first hypothesis:
Hypothesis 1: Individuals with higher income tend to report higher levels of life satisfaction.
Despite the finding of a positive relationship between personal income and life satisfaction by many researchers, various studies based on time-series data have shown that the average subjective well-being for many countries has remained roughly constant even though per capita income has risen substantially over time. In other words, people in more developed countries do not necessarily report higher levels of life satisfaction than people in less developed countries. The “Easterlin Paradox” is likely to be applicable in China, a country with vast regional variations in economic development. Therefore, the second hypothesis we will test is:
2 It should be noted that the positive association between the Gini coefficients at 26 cities and individuals’ happiness is found after controlling for inequality between urban residents and rural migrants in the cities (measured by income ratio between the two groups).
Economic Growth, Income Inequality and Subjective Well-being in China 10
Hypothesis 2: Local economic development does not have a significant effect on people’s life satisfaction.
As discussed in the previous session, individuals evaluate their level of income relative to that of a reference group, typically in a local context, and adjust their expectations accordingly. With the development of the local economy and the rise in living standards, people tend to quickly get used to what they have, especially those with relatively higher income. Such adaptation processes are said to be governed by social comparisons. Based on the analysis of the data from 70 regions in 15 European countries for the period between 1992 and 2002, Pittau et. al. (2010) showed that personal income matters more in poor regions than in rich regions. In other words, while personal income is always positively correlated with life satisfaction, its effect is weaker in rich regions than in poor regions. Therefore, we expect similar results to be found across different regions in China and pose our third hypothesis:
Hypothesis 3. The effect of personal income on life satisfaction diminishes in regions with higher levels of economic development, measured by GDP per capita.
The above hypothesis suggests that personal income is a relative term in determining people’s life satisfaction. The role of relative income can be further tested by examining the effect of income inequality on the subjective well-being of individuals. As Brockmann et. al. (2009) argued, a rapidly increasing income inequality in China may generate a group of “frustrated achievers,” who experience a deterioration in their relative income position despite considerable income gains in absolute terms, thus leading to a fall in their life satisfaction. Even urban residents with higher education who could be seen largely as the winners of the economic transition tend to be more critical toward income inequality (Jiang et. al. 2012; Li and Wu 2012). Therefore, higher income inequality tends to negatively affect people’s subjective wellbeing, which leads to the following hypothesis:
Hypothesis 4. Income inequality, measured by local Gini coefficients, tends to reduce an individual’s life satisfaction.
Finally, since the income inequality in China has been increasing with the rapid economic
growth since the 1990s, the negative impact of income inequality on subjective well-being may
be offset by the perceived opportunities for mobility in the future (Xie et. al. 2012). Indeed, as
Wu (2009) argued, while actual income inequality in China has been higher than in many other
countries, respondents tend to think that income inequality is fair and are more tolerant of
existing income inequality because they perceive greater opportunities for social mobility. Some
Economic Growth, Income Inequality and Subjective Well-being in China 11
scholars interpret the positive association between income inequality and life satisfaction
observed in rural China (Knight and Gunatilaka 2010) and urban China (Jiang et. al. 2012) as
evidence supporting the tunnel effect theory. If this is the case, the rate of economic growth or
the level of economic prospects would be a better and more direct measure of economic
opportunities than would income inequality, especially for newly developed and transition
economies (Clark and Senik 2010). This leads to our final hypothesis:
Hypothesis 5. The rate of local economic growth has a positive effect on an individual’s life satisfaction.
To examine the subjective well-being of individuals in China and study the effects of
both personal characteristics and regional contexts on the overall life satisfaction, we analyze the
data from the Chinese General Social Survey (CGSS) in 2005, combined with the statistical data
at the prefectural level from China’s National Bureau of Statistics. In this sense, our research, by
design, is similar to various cross-country analyses that integrate micro data from international
comparable surveys data with national statistics (e.g., Di Tella and MacCulloch 2008; Haller and
Hadler 2006; Qi 2012; Zagorski et. al. 2010).
DATA, VARIABLES, AND ANALYTICAL STRATEGY
The Chinese General Social Survey is an annual survey of a national representative
sample of the adult population aged 18 or above in both rural and urban China (except for Tibet),
using a multi-stage stratified random sampling method. First, 125 principal sampling units are
selected from 2,798 county or county-level districts, stratified by region, rural and urban
populations, and education level. Then, four second-level sampling units in each selected
principal unit, two third-level sampling units in each selected second-level unit, and ten
households in each selected third-level unit are chosen. One eligible person aged 18 or above is
randomly selected from each sampled household to serve as the survey respondent. In the CGSS
conducted in 2005, a total of 10,372 interviews were completed in which 6,098 and 4,274 were
from urban and rural areas respectively (for details, see Bian and Li 2012).
The survey collected objective data about the socio-economic and demographic
characteristics of respondents and subjective data concerning their overall life satisfaction.
Overall life satisfaction is classified into five levels (1=very dissatisfied, 2=dissatisfied, 3=so-so,
4=satisfied, and 5=very satisfied). We use it as the dependent variable in the analysis.
Economic Growth, Income Inequality and Subjective Well-being in China 12
There are three sets of explanatory variables. The first includes the economic and socio-
demographic characteristics of individuals. Personal income refers to the monthly income
obtained by respondents from all employment and non-employment sources. Gender, age, years
of schooling, marital status, employment status, and residential status are included in the models
as statistical controls, despite the fact that they have been shown to be responsible for only a
small part of the variance in life satisfaction (Diener et al. 1999; Liao et al. 2005).
Gender is coded as a dummy (male=1), whereas age and years of schooling are
continuous variables. To capture the curvilinear relationship between age and life satisfaction,
we include a square term of age in the equations. Marital status is coded into three categories:
1=married, 2=divorced/widowed, 3=single; employment status is classified into 5 categories:
1=full-time, 2=part-time/temporary, 3=retired, 4=unemployed, and 5=never worked. We
combined the hukou status and residence place to classify residential status into three types:
1=rural residents, 2=rural migrants in cities, and 3=urban residents. They are included in the
models as a set of dummy variables.
The contextual variables refer to the characteristics of prefectures where the respondents
lived at the time of the survey. Prefecture-level data are drawn from two sources. First, to
measure the level and growth rate of economic development, we collect respectively information
on GDP per capita and annual growth rate of GDP in 2005 in each prefecture from the China
City Statistical Yearbook (National Bureau of Statistics 2006). Second, we compute the Gini
coefficient for each prefecture-level jurisdiction based on the data from the one percent
population survey of China in 2005, also known as the 2005 mini-census.3 Individual records
from CGSS are then matched to the three contextual variables. We restrict our sample to those
aged between 18 and 69, and after matching with prefecture-level data, we are left with 7,938
individuals residing in 91 prefectures with complete information for multivariate analyses in this
paper.
Descriptive statistics of all dependent, explanatory, and control variables are presented in
Table 1. As shown in the table, overall, the Chinese are satisfied with their life: 5.39 percent
reported being “very satisfied”, 40.92 percent “satisfied”, 45.32 percent “so-so”, 7.39 percent
“dissatisfied”, and only 0.98 percent “very dissatisfied.” Of the sample to be analyzed, 69.42
3 The 2005 mini-census, conducted by the National Bureau of Statistics (NBS), surveyed 5.43 million households in 77,000 residential blocks of 61,000 rural villages and urban neighborhoods from 21,000 townships (xiangzhen) or streets (jiedao) across China (Feng 2006).

Economic Growth, Income Inequality and Subjective Well-being in China 13
percent hold full-time employment and 6.74 percent a part-time/temporary job. These people
have, on average, received 8.18 years of schooling and earn 710.58 yuan per month. They come
from 91 prefectural jurisdictions across the country, with average GDP per capita of 21,220.18
yuan, and an annual GDP growth rate of 13.77 percent. The average Gini coefficient of the 91
prefectures is 0.39.
Table 1: Summary Statistics for All Variables, China 2005
Level 1: individual (N=7938) Life satisfaction Very dissatisfied 0.98 Dissatisfied 7.39 So-so 45.32 Satisfied 40.92 Very satisfied 5.39 Marital status Married 88.70 Divorced/Widowed 4.15 Single 7.15 Employment status Full time 69.42 Part time/Temporary 6.74 Retired 10.78 Unemployed 8.58 Never worked 4.48 Residential status Rural residents 47.71 Rural migrants 5.38 Urban residents 46.91 Male 0.47 (0.50) Age 43.14 (12.43) Years of schooling 8.18 (4.38) Monthly income (yuan) 710.58 (1251.09) Level 2: prefecture (N=91) GDP per capita (yuan) 21220.18 (16224.54) GDP growth rate (%) 13.77 (3.66) Gini 0.39 (0.04)
Notes: Percentages for categorical variables and means for continuous variables are reported; numbers in parentheses are standard deviations. Statistics are based on weighted data.
Economic Growth, Income Inequality and Subjective Well-being in China 14
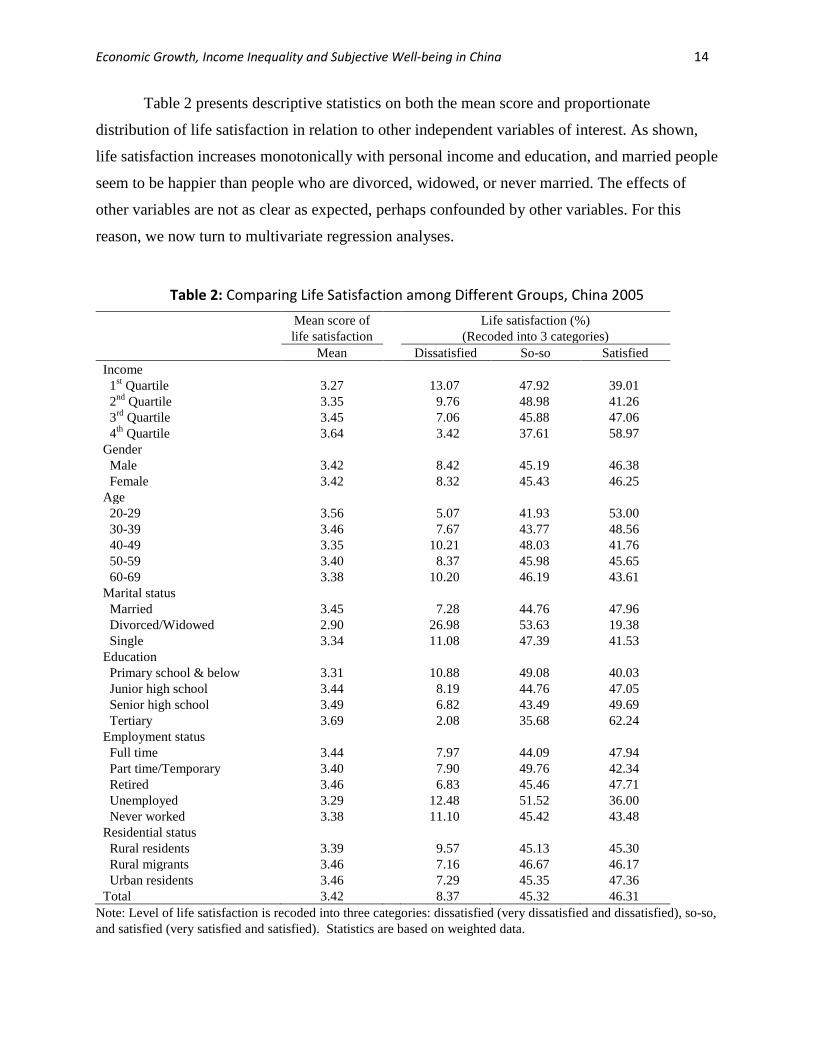
Table 2 presents descriptive statistics on both the mean score and proportionate
distribution of life satisfaction in relation to other independent variables of interest. As shown,
life satisfaction increases monotonically with personal income and education, and married people
seem to be happier than people who are divorced, widowed, or never married. The effects of
other variables are not as clear as expected, perhaps confounded by other variables. For this
reason, we now turn to multivariate regression analyses.
Table 2: Comparing Life Satisfaction among Different Groups, China 2005
Mean score of life satisfaction
Life satisfaction (%) (Recoded into 3 categories)
Mean Dissatisfied So-so Satisfied Income 1st Quartile 3.27 13.07 47.92 39.01 2nd Quartile 3.35 9.76 48.98 41.26 3rd Quartile 3.45 7.06 45.88 47.06 4th Quartile 3.64 3.42 37.61 58.97 Gender Male 3.42 8.42 45.19 46.38 Female 3.42 8.32 45.43 46.25 Age 20-29 3.56 5.07 41.93 53.00 30-39 3.46 7.67 43.77 48.56 40-49 3.35 10.21 48.03 41.76 50-59 3.40 8.37 45.98 45.65 60-69 3.38 10.20 46.19 43.61 Marital status Married 3.45 7.28 44.76 47.96 Divorced/Widowed 2.90 26.98 53.63 19.38 Single 3.34 11.08 47.39 41.53 Education Primary school & below 3.31 10.88 49.08 40.03 Junior high school 3.44 8.19 44.76 47.05 Senior high school 3.49 6.82 43.49 49.69 Tertiary 3.69 2.08 35.68 62.24 Employment status Full time 3.44 7.97 44.09 47.94 Part time/Temporary 3.40 7.90 49.76 42.34 Retired 3.46 6.83 45.46 47.71 Unemployed 3.29 12.48 51.52 36.00 Never worked 3.38 11.10 45.42 43.48 Residential status Rural residents 3.39 9.57 45.13 45.30 Rural migrants 3.46 7.16 46.67 46.17 Urban residents 3.46 7.29 45.35 47.36 Total 3.42 8.37 45.32 46.31
Note: Level of life satisfaction is recoded into three categories: dissatisfied (very dissatisfied and dissatisfied), so-so, and satisfied (very satisfied and satisfied). Statistics are based on weighted data.
Economic Growth, Income Inequality and Subjective Well-being in China 15
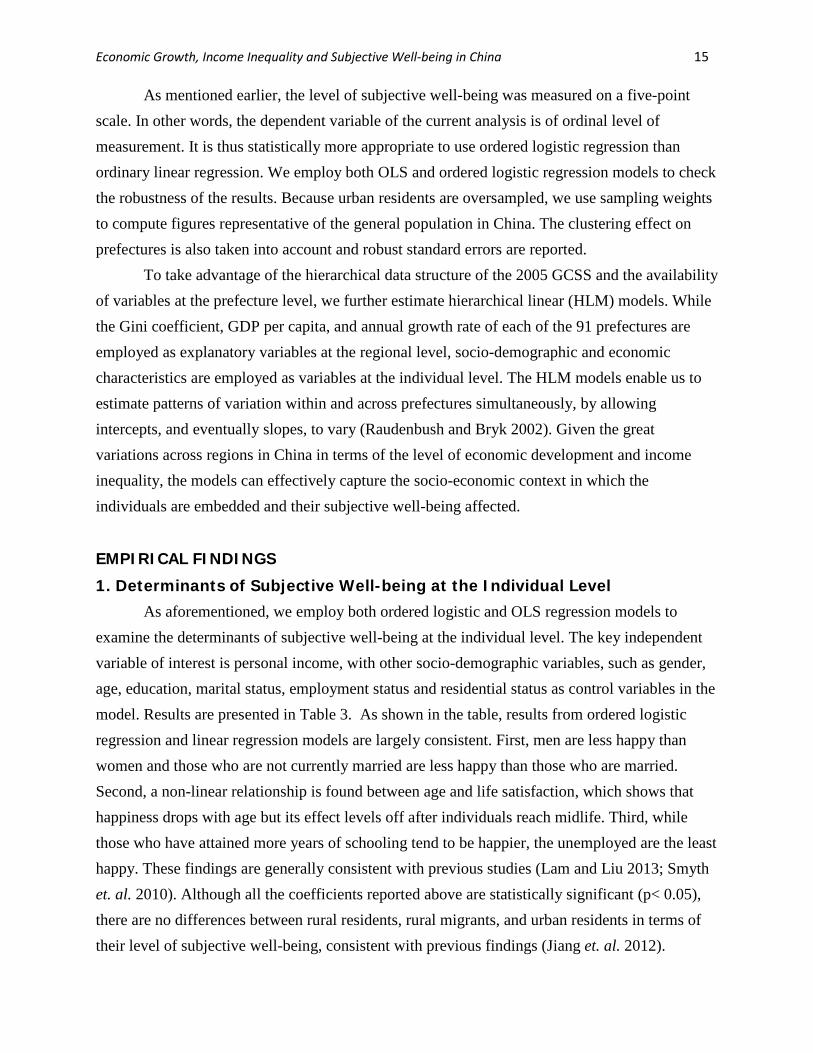
As mentioned earlier, the level of subjective well-being was measured on a five-point scale. In other words, the dependent variable of the current analysis is of ordinal level of measurement. It is thus statistically more appropriate to use ordered logistic regression than ordinary linear regression. We employ both OLS and ordered logistic regression models to check the robustness of the results. Because urban residents are oversampled, we use sampling weights to compute figures representative of the general population in China. The clustering effect on prefectures is also taken into account and robust standard errors are reported.
To take advantage of the hierarchical data structure of the 2005 GCSS and the availability of variables at the prefecture level, we further estimate hierarchical linear (HLM) models. While the Gini coefficient, GDP per capita, and annual growth rate of each of the 91 prefectures are employed as explanatory variables at the regional level, socio-demographic and economic characteristics are employed as variables at the individual level. The HLM models enable us to estimate patterns of variation within and across prefectures simultaneously, by allowing intercepts, and eventually slopes, to vary (Raudenbush and Bryk 2002). Given the great variations across regions in China in terms of the level of economic development and income inequality, the models can effectively capture the socio-economic context in which the individuals are embedded and their subjective well-being affected.
EMPIRICAL FINDINGS
1. Determinants of Subjective Well-being at the Individual Level As aforementioned, we employ both ordered logistic and OLS regression models to
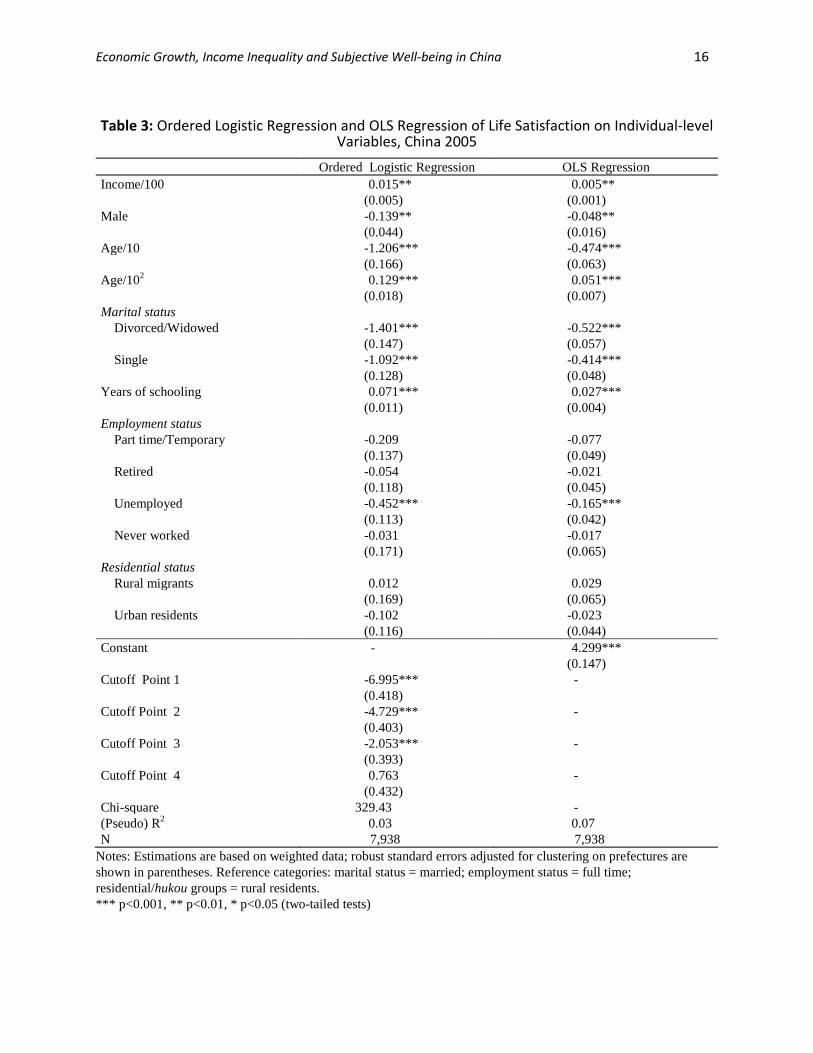
examine the determinants of subjective well-being at the individual level. The key independent variable of interest is personal income, with other socio-demographic variables, such as gender, age, education, marital status, employment status and residential status as control variables in the model. Results are presented in Table 3. As shown in the table, results from ordered logistic regression and linear regression models are largely consistent. First, men are less happy than women and those who are not currently married are less happy than those who are married. Second, a non-linear relationship is found between age and life satisfaction, which shows that happiness drops with age but its effect levels off after individuals reach midlife. Third, while those who have attained more years of schooling tend to be happier, the unemployed are the least happy. These findings are generally consistent with previous studies (Lam and Liu 2013; Smyth et. al. 2010). Although all the coefficients reported above are statistically significant (p< 0.05), there are no differences between rural residents, rural migrants, and urban residents in terms of their level of subjective well-being, consistent with previous findings (Jiang et. al. 2012).
Economic Growth, Income Inequality and Subjective Well-being in China 16
Table 3: Ordered Logistic Regression and OLS Regression of Life Satisfaction on Individual-level Variables, China 2005
Ordered Logistic Regression OLS Regression Income/100 0.015** 0.005** (0.005) (0.001) Male -0.139** -0.048** (0.044) (0.016) Age/10 -1.206*** -0.474*** (0.166) (0.063) Age/102 0.129*** 0.051*** (0.018) (0.007) Marital status Divorced/Widowed -1.401*** -0.522*** (0.147) (0.057) Single -1.092*** -0.414*** (0.128) (0.048) Years of schooling 0.071*** 0.027*** (0.011) (0.004) Employment status Part time/Temporary -0.209 -0.077 (0.137) (0.049) Retired -0.054 -0.021 (0.118) (0.045) Unemployed -0.452*** -0.165*** (0.113) (0.042) Never worked -0.031 -0.017 (0.171) (0.065) Residential status Rural migrants 0.012 0.029 (0.169) (0.065) Urban residents -0.102 -0.023 (0.116) (0.044) Constant - 4.299*** (0.147) Cutoff Point 1 -6.995*** - (0.418) Cutoff Point 2 -4.729*** - (0.403) Cutoff Point 3 -2.053*** - (0.393) Cutoff Point 4 0.763 - (0.432) Chi-square 329.43 - (Pseudo) R2 0.03 0.07 N 7,938 7,938
Notes: Estimations are based on weighted data; robust standard errors adjusted for clustering on prefectures are shown in parentheses. Reference categories: marital status = married; employment status = full time; residential/hukou groups = rural residents. *** p<0.001, ** p<0.01, * p<0.05 (two-tailed tests)
Economic Growth, Income Inequality and Subjective Well-being in China 17
Our central interest is the effect of the economic factor on happiness (life satisfaction).
Consistent with previous findings in different countries, the effect of personal income on the
level of life satisfaction, after controlling for other factors, is significant and positive, lending
support to Hypothesis 1. 4
As similar results are found between ordered logistic regression models and OLS
regression models, we use continuous measures of life satisfaction in the estimation of
hierarchical linear models to account for the contextual effect on the subjective well-being of
individuals.
2. Economic Inequality and Subjective Well-being: a Multi-level Analysis
In HLM models, we keep the individual variables used in Table 3 as the determinants of
life satisfaction at the first level and prefectural GDP per capita, the Gini coefficient, and then
GDP growth rate as contextual variables at the second level. We also take into account the cross-
level interaction effects between personal income and prefectural GDP per capita. Results are
presented in Table 4.
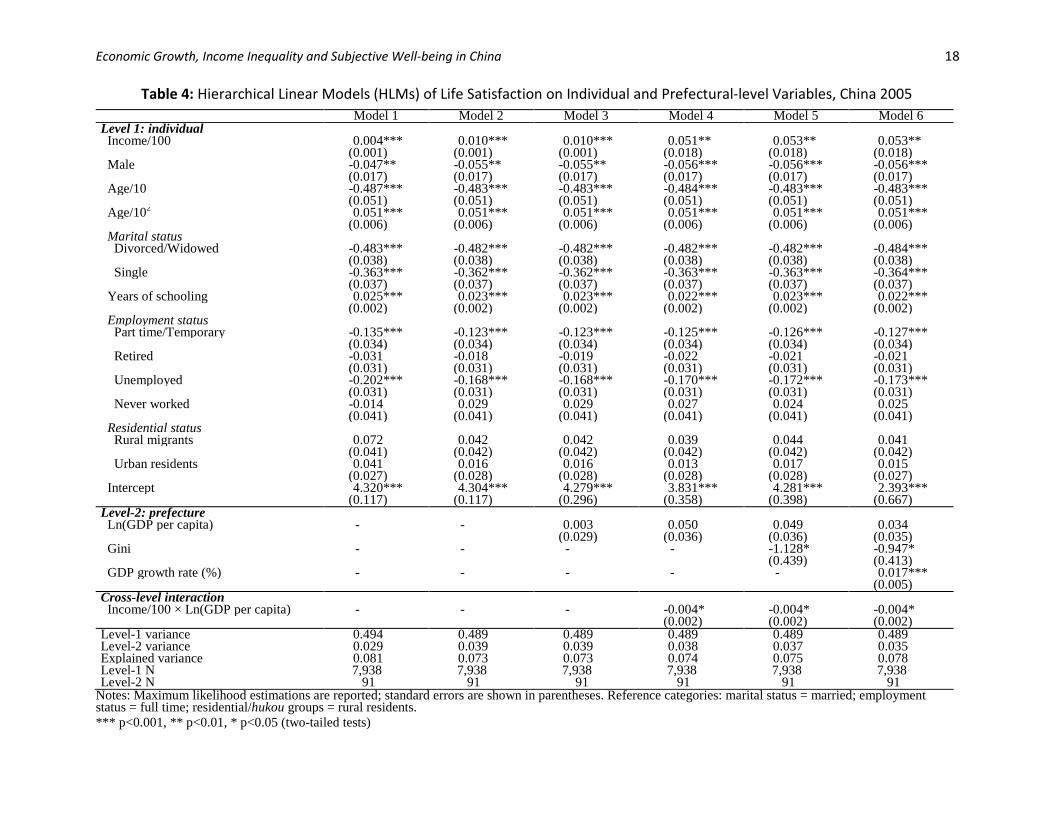
To begin with, Model 1 and Model 2 of Table 4 are the baseline models with only
individual characteristics included. Model 1 is the random-intercept model whereas Model 2 is
the random coefficient model, i.e., the one in which the coefficient of individual income is set as
random at the prefectural level. The likelihood ratio test shows that the random coefficient model
fits the data better than the random intercept model. In other words, the estimated coefficient of
individual income indeed varies across prefecture. This justifies the introduction of the second-
level (prefecture) variables into the models. We perform this exercise step by step: GDP per
capita (logged) in Model 3, the interaction effect between personal income and GDP per capita in
Model 4 , the Gini coefficient in Model 5, and finally GDP growth rate in Model 6,
corresponding to each hypothesis we aim to test.
4 Consistent with previous findings on the impact of absolute personal income on happiness (Easterlin 2001), we found a curvilinear relationship between the two variables in our data. As we aim to examine the cross-level interaction between personal income and regional context in the subsequent analyses, we omitted the presentation of the estimated results to simplify the interpretation of the coefficients in the hierarchical linear models.
Economic Growth, Income Inequality and Subjective Well-being in China 18
Table 4: Hierarchical Linear Models (HLMs) of Life Satisfaction on Individual and Prefectural-level Variables, China 2005 Model 1 Model 2 Model 3 Model 4 Model 5 Model 6 Level 1: individual Income/100 0.004*** 0.010*** 0.010*** 0.051** 0.053** 0.053** (0.001) (0.001) (0.001) (0.018) (0.018) (0.018) Male -0.047** -0.055** -0.055** -0.056*** -0.056*** -0.056*** (0.017) (0.017) (0.017) (0.017) (0.017) (0.017) Age/10 -0.487*** -0.483*** -0.483*** -0.484*** -0.483*** -0.483*** (0.051) (0.051) (0.051) (0.051) (0.051) (0.051) Age/102 0.051*** 0.051*** 0.051*** 0.051*** 0.051*** 0.051*** (0.006) (0.006) (0.006) (0.006) (0.006) (0.006) Marital status Divorced/Widowed -0.483*** -0.482*** -0.482*** -0.482*** -0.482*** -0.484*** (0.038) (0.038) (0.038) (0.038) (0.038) (0.038) Single -0.363*** -0.362*** -0.362*** -0.363*** -0.363*** -0.364*** (0.037) (0.037) (0.037) (0.037) (0.037) (0.037) Years of schooling 0.025*** 0.023*** 0.023*** 0.022*** 0.023*** 0.022*** (0.002) (0.002) (0.002) (0.002) (0.002) (0.002) Employment status Part time/Temporary -0.135*** -0.123*** -0.123*** -0.125*** -0.126*** -0.127*** (0.034) (0.034) (0.034) (0.034) (0.034) (0.034) Retired -0.031 -0.018 -0.019 -0.022 -0.021 -0.021 (0.031) (0.031) (0.031) (0.031) (0.031) (0.031) Unemployed -0.202*** -0.168*** -0.168*** -0.170*** -0.172*** -0.173*** (0.031) (0.031) (0.031) (0.031) (0.031) (0.031) Never worked -0.014 0.029 0.029 0.027 0.024 0.025 (0.041) (0.041) (0.041) (0.041) (0.041) (0.041) Residential status Rural migrants 0.072 0.042 0.042 0.039 0.044 0.041 (0.041) (0.042) (0.042) (0.042) (0.042) (0.042) Urban residents 0.041 0.016 0.016 0.013 0.017 0.015 (0.027) (0.028) (0.028) (0.028) (0.028) (0.027) Intercept 4.320*** 4.304*** 4.279*** 3.831*** 4.281*** 2.393*** (0.117) (0.117) (0.296) (0.358) (0.398) (0.667) Level-2: prefecture
Ln(GDP per capita) - - 0.003 0.050 0.049 0.034 (0.029) (0.036) (0.036) (0.035) Gini - - - - -1.128* -0.947* (0.439) (0.413) GDP growth rate (%) - - - - - 0.017*** (0.005) Cross-level interaction Income/100 × Ln(GDP per capita) - - - -0.004* -0.004* -0.004* (0.002) (0.002) (0.002) Level-1 variance 0.494 0.489 0.489 0.489 0.489 0.489 Level-2 variance 0.029 0.039 0.039 0.038 0.037 0.035 Explained variance 0.081 0.073 0.073 0.074 0.075 0.078 Level-1 N 7,938 7,938 7,938 7,938 7,938 7,938 Level-2 N 91 91 91 91 91 91
Notes: Maximum likelihood estimations are reported; standard errors are shown in parentheses. Reference categories: marital status = married; employment status = full time; residential/hukou groups = rural residents. *** p<0.001, ** p<0.01, * p<0.05 (two-tailed tests)
Economic Growth, Income Inequality and Subjective Well-being in China 19
After controlling for all relevant variables at the individual level, while living in a
prefecture with a higher level of GDP per capita increases one’s level of life satisfaction, this
positive effect, on average, is not statistically significant. This is consistent with Hypothesis 2
and the Easterlin Paradox seems to be applicable to China as well. It is argued that personal
income is a relative term in a local context. While people living in a more developed region tend
to have higher income on average than people living in a less developed region, they would also
have higher expectations and compare themselves with higher income earners. Therefore, we
introduce the interaction effect between level-1 (personal income) and level-2 (logged GDP per
capita) variables into the subsequent models.
After the introduction of the interaction term in Model 4, while personal income shows a
significantly positive effect on one’s level of life satisfaction (p<.01), the interaction term is
negative and statistically significant (p<.05), suggesting that personal income matters less for
those living in prefectures with a higher level of GDP per capita. In other words, personal
income is a stronger predictor for subjective well-being in poorer prefectures than in richer ones.
These observations might be related to the proposition of post-materialism, which argues that life
satisfaction in rich regions is more related to non-materialistic issues while life satisfaction in
poor regions is derived simply from being able to make ends meet. An alternative explanation is
that, in richer regions, wealthy people spend more time on materialistic pursuits or activities (e.g.,
work, selfish spending) that do not generate positive affect and thus offset the positive effect of
income. Poorer regions afford fewer opportunities for such pursuits or activities; income in these
regions thus is more able to increase happiness, probably through having more leisure to spend
with families or more prosocial spending (Kahneman et. al. 2006; Mogilner 2010; Aknin et al.
2013). The evidence also provides a further elaboration of the “Easterlin Paradox” at the regional
level within China, lending support to Hypothesis 3.
In Model 5, we introduce the variable that interests us most, the prefectural Gini
coefficient, to examine the impact of local income inequality on people’s life satisfaction. As
Hypothesis 4 predicts, results show that local income inequality significantly reduces the level of
happiness (p<.05), even after controlling for personal income, local GDP per capita and their
interaction term.
Furthermore, as pointed out earlier, it is the annual GDP growth rate, rather than the level
of economic development as measured by GDP per capita, or the Gini coefficient, that is directly
related to mobility chances and therefore an individual’s life satisfaction. We thus add the
Economic Growth, Income Inequality and Subjective Well-being in China 20
variable in Model 6. Confirming Hypothesis 5, we find that individuals living in a prefecture
with a higher annual GDP growth rate report significantly greater levels of life satisfaction. The
effect is statistically significant (p<.001). Even after controlling for the effect of economic
optimism (the tunnel effect), the negative impact of income inequality on subjective well-being
remains.
SUMMARY AND DISCUSSIONS
In this paper, we aim to specifically examine the subjective consequence of rising income
inequality in China amidst the economic boom that has continued for decades. Based on the data
from a national representative survey in 2005 and prefecture-level statistics in China, we employ
multi-level models to show how subjective well-being is affected by individual characteristics
and the local context, and propose five hypotheses, with particular attention paid to the role of
economic factors.
At the individual level, we show that personal income affects life satisfaction in a
positive way, namely, individuals with higher income tend to report higher levels of life
satisfaction. However, this effect is largely mediated by the process of social comparisons,
highlighting the fact that subjective well-being carries a relative component. In other words, it is
how one’s income compares with peers in the immediate social environment instead of absolute
income that determines one’s subjective well-being. Thus we turn our attention to the role of the
local socioeconomic context, such as economic development, growth rate, and income inequality,
in affecting life satisfaction
At the prefectural level, after controlling for all other factors, we found that GDP per
capita has no effect on individuals’ subjective wellbeing. It appears that, after decades of
continuing economic growth, the living standard in China has improved so much so that the
“Easterlin Paradox” has inevitably emerged. Further analysis shows that the interaction between
personal income and local GDP per capita is significantly negative. In other words, higher
personal income matters more in determining one’s subjective wellbeing in poorer areas than in
richer ones. This finding provides evidence to support social comparison theory that offers
explanation for the “Easterlin Paradox.”
The sharply rising income inequality amidst the rapid economic development, on the
other hand, is associated with lower levels of subjective well-being, as indicated by the
significantly negative coefficient for the local Gini index, even after controlling for GDP per
Economic Growth, Income Inequality and Subjective Well-being in China 21
capita. Moreover, the rate of economic growth in the immediate living environment, which is
often associated with rising inequality in the Chinese context, signals the economic prospects of
individuals, boosts their confidence in the future and positively affects their life satisfaction.
Previous studies have failed to take the rate of economic growth or any related macro-
economic factors into account when examining the effect of income inequality on the life
satisfaction of individuals and have therefore yielded mixed results. Controlling for factors at
both individual and aggregate levels, including the rate of GDP growth, we find that a higher
Gini coefficient leads to a reduction in individuals’ happiness. China’s political leaders have
been warned that a negative relationship between income inequality and the subjective well-
being of individuals will lead to public discontent and social instability in the country. Our
analysis provides some evidence to support this view. Echoing the widening gap between rich
and poor, exacerbating environmental degradation, and escalating social conflicts in China, there
have been calls for a policy shift from emphasizing GDP growth to improving people’s
livelihood. For instance, Guangdong Province, under the leadership of Wang Yang, then the
Party Secretary, has launched the “Happy Guangdong” project since 2011, aiming to alleviate
social and political conflicts and boost people’s life quality and subjective wellbeing via a series
of social and economic policies in the Province’s 12th Five-Year Plan (2011-2015) (Page 2011).
From a policy point of view, early studies have shown that progressive taxation that
redistributes income and wealth is positively associated with increased levels of subjective well-
being (Oishi et. al. 2012), and expenditure on public health care also contributes to the
improvement of life satisfaction (e.g., Kotakorp and Laamanen 2010). Further research needs to
be done to assess of the impact of government specific redistributive policies on people’s
subjective wellbeing in China.
Economic Growth, Income Inequality and Subjective Well-being in China 22
REFERENCES
Aknin, Lara B., Christopher P. Barrington-Leigh, Elizabeth W. Dunn, John F. Helliwell, Justine Burns, Robert Biswas-Diener, Imelda Kemeza, Paul Nyende, Claire E. Ashton-James, and Michael I. Norton. 2013. “Prosocial Spending and Well-being: Cross-cultural Evidence for a Psychological Universal.” Journal of Personality and Social Psychology 104(4):635-52.
Alesina, Alberto, Rafael Di Tella, and Robert MacCulloch. 2004. “Inequality and Happiness: Are
Europeans and Americans Different?” Journal of Public Economics 88: 2009-2042. Appleton, Simon and Lina Song. 2008. “Life Satisfaction in Urban China: Components and
Determinants.” World Development 36: 2325-2340. Bian, Yanjie, and Lulu Li 2012. “The Chinese General Social Survey (2003-2008): Sample Designs and
Data Evaluation.” Chinese Sociological Review 45(1):70-97. Blanchflower, David G. and Andrew J. Oswald 2004. “Well-being over Time in Britain and the USA.”
Journal of Public Economics 88(8): 1359-1386. Brockmann, Hilke, Jan Delhey, Christian Welzel, and Hao Yuan. 2009. “The China Puzzle: Falling
Happiness in a Rising Economy.” Journal of Happiness Studies 10: 387-405. Caporale, Guglielmo M., Yannis Georgellis, Nicholas Tsitsianis, and Ya Ping Yin. 2009. “Income and
Happiness across Europe: Do Reference Values Matter?” Journal of Economic Psychology 30: 42-51.
Clark, Andrew E. 2003. “Inequality Aversion and Income Mobility: A Direct Test.” Delta Working
Papers 11. Clark, Andrew E., Paul Frijters, and Michael A. Shields. 2008. “Relative Income, Happiness, and Utility:
An Explanation for the Easterlin Paradox and Other Puzzles.” Journal of Economic Literature 46(1): 95-144.
Clark, Andrew E. and Claudia Senik 2010. “Will GDP Growth Increase Happiness in Developing
Countries?” Working Paper http://www.cepremap.ens.fr/depot/docweb/docweb1024.pdf Di Tella, Rafael and Robert MacCulloch. 2008. “Gross National Happiness as an Answer to the Easterlin
Paradox?” Journal of Development Economics 86: 22-42. Di Tella, Rafael, Robert MacCulloch, and Andrew J. Oswald. 2003. “The Macroeconomics of
Happiness.” Review of Economics and Statistics 85: 809-827. Diener, Ed and Weiting Ng. 2010. “Wealth and Happiness across the World: Material Prosperity Predicts
Life Evaluation, whereas Psychosocial Prosperity Predicts Positive Feeling.” Journal of Personality and Social Psychology 99: 52-61.
Diener, Ed, Eunkook M. Suh, Richard E. Lucas, and Heidi L. Smith. 1999. “Subjective Well-Being:
Three Decades of Progress.” Psychological Bulletin 125: 276-302. Diener, Ed and Richard E. Lucas. 2000. “Explaining Differences in Societal Levels of Happiness:
Relative Standards, Need Fulfillment, Culture, and Evaluation Theory.” Journal of Happiness Studies 1: 41-78.
Economic Growth, Income Inequality and Subjective Well-being in China 23
Dolan, Paul, Tessa Peasgood, and Mathew White. 2008. “Do We Really Know What Makes Us Happy? A Review of the Economic Literature on the Factors Associated with Subjective Well-being.” Journal of Economic Psychology 29(1): 94-122.
Easterlin, Richard A. 1974. “Does Economic Growth Improve the Human Lot? Some Empirical
Evidence.” In P.A. David and M. W. Reder (Eds.), Nations and Households in Economic Growth. New York: Academic Press.
________. 1995. “Will Raising the Incomes of All Increase the Happiness of All?” Journal of
Economic Behavior and Organizations 27: 35-47. ________. 2001. “Income and Happiness: Towards a Unified Theory.” Economic Journal 111: 465-484. Easterlin, Richard A., Robson Morgan, Malgorzata Switek, and Fei Wang 2012. “China’s life satisfaction,
1990–2010” Proceeding of the National Academy of Sciences of the United States of America. http://www.pnas.org/content/early/2012/05/09/1205672109
Fahey, TONY and Emer Smyth 2004. “Do Subjective Indicators Measure Welfare? Evidence from 33
European Societies.” European Societies 6(1):5-27. Feng, Nailin. 2006. “Lessons Learnt From the 2005 One-percent Population Survey of China and Initial
Plans for 2010 Round of Census.” Paper presented at the 11th Meeting of the Heads of National Statistical Offices of East Asia Countries, 6-8 Nov.
Firebaugh, Glenn and Mathhew B. Schroeder 2009. “Does Your Neighbor’s Income Affect Your
Happiness?” American Journal of Sociology 115(3): 805-831. Firebaugh, Glenn and Laura Tach 2012. “Income, Age, and Happiness in America.” Pp. 267-287 in
Social Trends in American Life: Findings from the General Social Survey since 1972. Edited by Peter. Marsden. Princeton, NJ: Princeton University Press:
Frey, Bruno S. and Alois Stutzer. 2000. “Happiness, Economy, and Institutions.” Economic Journal 110:
918-938. ________. 2002. Happiness and Economics: How the Economy and Institutions Affect Human Well-
being. Princeton: Princeton University Press. Frijters, Paul, John P. Haisken-DeNew, and Michael A. Shields. 2004. “Money Does Matter! Evidence
from Increasing Real Income and Life Satisfaction in East Germany Following Reunification.” The American Economic Review 94(3): 730-740.
Graham, Carol and Andrew Felton. 2006. “Inequality and Happiness: Insights from Latin America.”
Journal of Economic Inequality 4: 107-122. Hagerty, Michael R. 2000. “Social Comparisons of Income in One’s Community: Evidence from
National Surveys of Income and Happiness.” Journal of Personality and Social Psychology 78: 764-771.
Haller, Max and Markus Hadler 2006. “How Social Relations and Structures can Produce Happiness and
Unhappiness: An International Comparative Analysis.” Social Indicators Research 75(2): 169-216. Hirschman, Albert O. and Michael Rothschild. 1973. “The Changing Tolerance for Income Inequality in
the Course of Economic Development.” The Quarterly Journal of Economics 87: 544-566.
Economic Growth, Income Inequality and Subjective Well-being in China 24
Jiang, Shiqing, Ming Lu and Hiroshi Sato. 2012. “Identity, Inequality, and Happiness: Evidence from
Urban China.” World Development 40(6):1190-1200. Kahneman, Daniel and Alan B. Krueger 2006. “Developments in the Measurement of Subjective Well-
Being.” The Journal of Economic Perspectives 20(1): 3-24. Kahneman, Daniel, Alan B. Krueger, D. Schkade, N. Schwarz, A. Stone. 2006 “Would You Be Happier If
You Were Richer? A Focusing Illusion.” Science 312: 1908-1910 Kuznets, Simon. 1955. “Economic Growth and Income Inequality.” American Economic Review 45: 1-
28. Knight, John and Ramani Gunatilaka. 2010. “The Rural-Urban Divide in China: Income but Not
Happiness?” Journal of Development Studies 46: 506-534. Kotakorpi, Kaisa and Jani-Petri Laamanen. 2010. “Welfare State and Life Satisfaction: Evidence from
Public Health Care.” Economica 77(307): 565-583. Lam, Kit-Chun Joanna, Pak-Wai Liu 2013. “Socio-Economic Inequalities in Happiness in China and
U.S.” Social Indicator Research [published on line]. Available at http://link.springer.com/article/10.1007%2Fs11205-013-0283-1
Li, Jun and Xiaogang Wu. 2012. “Income Inequality and Distributive Justice: An Empirical Analysis of
Urban Residents’ View of Equity in Transitional China.” Social Sciences in China 3 [in Chinese]. Liao, Pei-shan, Yang-chih Fu, and Chin-chun Yi. 2005. “Perceived Quality of Life in Taiwan and Hong
Kong: An Intra-Culture Comparison.” Journal of Happiness Studies 6: 63-67. Lu, Yuanping and Tao Wang 2011. “Income Inequality, Social Crime, and Citizens’ Happiness.” China
Economic Quarterly 10(4): 1437-57 [in Chinese] Marshall, Gordon and David Firth. 1999. “Social Mobility and Personal Satisfaction: Evidence from Ten
Countries.” The British Journal of Sociology 50(1): 28-48. Mogilner, C. 2010. “The Pursuit of Happiness: Time, Money, and Social Connection.” Psychological
Science 21(9): 1348-1354. Morawetz, David, Ety Atia, Gabi Bin-Nun, Lazaros Felous, Yuda Gariplerden, Ella Harris, Sami Soustiel,
George Tombros, and Yossi Zarfaty. 1977. “Income Distribution and Self-Rated Happiness: Some Empirical Evidence.” Economic Journal 87: 511-522.
National Bureau of Statistics.2005. Comprehensive Statistical Data and Materials on 55 years of new
China, Beijing: China Statistical Publishing House, also available at http://www.stats.gov.cn/tjsj/ndsj/
National Bureau of Statistics. 2006. 2005 China City Statistical Yearbook. Beijing: China Statistics
Press [in Chinese]. Neckman, Kathryn M. and Florencia Torche. 2007. “Inequality: Cause and Consequences.” Annual
Review of Sociology 33:335-57
Economic Growth, Income Inequality and Subjective Well-being in China 25
Ohtake, Fumio and Jun Tomioka. 2004. “Happiness and Income Inequality in Japan.” A paper presented at International Forum for Macroeconomic Issues, ESRI Collaboration Project, February 2004.
Oishi, Shigehiro, Ulrich Schimmack, and Ed Diener 2012. “Progressive Taxation and the Subjective
Well-Being of Nations.” Psychological Science 23(1):86-92 Oshio, Takashi and Miki Kobayashi. 2010. “Income Inequality, Perceived Happiness, and Self-rated
Health: Evidence from Nationwide Surveys in Japan.” Social Science & Medicine 70: 1358-1366. Page, Jeremy. 2011. “Unease in ‘Happy Guangdong’: Disgruntled Migrants Dent Image Party Chief
Wants to Project in China's Manufacturing Center.” The Wall Street Journal June 18, 2011. http://online.wsj.com/article/SB10001424052702303499204576389453425121490.html access on May 10, 2013.
Pittau, M. Grazia, Roberto Zelli, and Andrew Gelman. 2010. “Economic Disparities and Life
Satisfaction in European Regions.” Social Indicators Research 96: 339-361. Qi, Yaqiang. 2012. “The Impact of Income Inequality on Self-rated General Health: Evidence from a
Cross-national Study.” Research in Social Stratification and Mobility 30:451-71 Raudenbush, Stephen W. and Anthony S. Bryk. 2002. Hierarchical Linear Models: Applications and
Data Analysis Methods. Thousand Oaks, CA: Sage Publications. Runciman, Walter G. 1966. Relative Deprivation and Social Justice: A Study of Attitudes to Social
Inequality in Twentieth Century Britain. Berkeley and Los Angeles: University of California Press. Schwarze, Johannes and Marco Härpfer 2007. “Are People Inequality Averse, and Do They Prefer
Redistribution by the State? Evidence from German Longitudinal Data on Life Satisfaction.” Journal of Socio-Economics 36(2): 233-249.
Senik, Claudia. 2004. “When Information Dominates Comparison: Learning from Russian Subjective
Panel Data.” Journal of Public Economics 88: 2099-2123. Smyth, Russel, Ingrid Nielsen, and Qingguo Zhai. 2010. “Personal Well-being in Urban China.” Social
Indicators Research 95: 231-251. Tao, Hung-lin and Shih-yung Chiu. 2009. “The Effects of Relative Income and Absolute Income on
Happiness.” Review of Development Economics 13: 164-174. UNU-WIDER. 2008. World Income Inequality Database, Version 2.0c, May 2008.
http://www.wider.unu.edu/wiid/wiid.htm Van de Werfhorst, Herman G. and Wiemer Salverda. 2012. “Consequences of Economic Inequality:
Introduction to a Special Issue.” Research in Social Stratification and Mobility 30: 377-387. Verme, Paolo. 2011. “Life Satisfaction and Income Inequality.” Review of Income and Wealth 57: 111-
137. Wong, Chack Kie, Ka Ying Wong, and Bong Ho Mok. 2006. “Subjective Well-being, Societal
Condition and Social Policy – The Case Study of a Rich Chinese Society.” Social Indicators Research 78: 405-428.
Economic Growth, Income Inequality and Subjective Well-being in China 26
Wu, Xiaogang. 2009. “Income Inequality and Distributive Justice: A Comparative Analysis of Mainland China and Hong Kong.” The China Quarterly 200: 1033-1052.
Xie, Yu, Arland Thornton, Guangzhou Wang, and Qing Lai 2012. “Societal Projection: Beliefs
Concerning the Relationship between Development and Inequality in China.” Social Science Research 41(2012): 1069-1084.
Yang, Yang. 2008. “Social Inequalities in Happiness in the United States, 1972 to 2004: An Age-Period-
Cohort Analysis.” American Sociological Review 73: 204-226.
Zagorski, Krzysztof, Jonathan Kelley and Mariah D. Evans 2010. “Economic Development and Happiness: Evidence from 32 Nations.” Polish Sociological Review 169:3-20.
Zhao, Wei. 2012. “Economic Inequality, Status Perceptions, and Subjective Well-Being in China’s
Transitional Economy.” Research in Social Stratification and Mobility 30:433-450.
