the impact of age pension elgibility age on retirement and...
TRANSCRIPT

The Impact of Age Pension Elgibility Age on Retirementand Program Dependence:
Evidence from an Australian Experiment
Kadir Atalay, Garry Barrett
University of Sydney
July 2012
Kadir Atalay (University of Sydney) APA experiment July 2012 1 / 24

Motivation
Population ageing and sustainability of social security systems.
- Life expectancy at age 65 in OECD countries increased by 4 to 5 years.- Decrease in the number of working age individuals
Australian Seniors
77% people aged 65+ years receive public income support
- main income source for large majority
- rely on it for long periods (> 13 years on average)
Context of Population Aging: 13% population aged 65+ today;projected to be 25% by 2047
⇒Net Effect: Large fiscal gap, pressure on social security programs.⇒Governments implement different structural reforms
Kadir Atalay (University of Sydney) APA experiment July 2012 2 / 24
Motivation
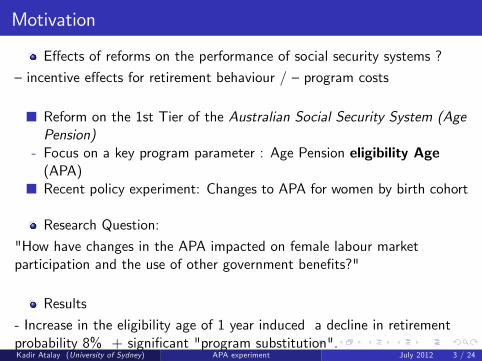
Effects of reforms on the performance of social security systems ?
— incentive effects for retirement behaviour / —program costs
Reform on the 1st Tier of the Australian Social Security System (AgePension)
- Focus on a key program parameter : Age Pension eligibility Age(APA)Recent policy experiment: Changes to APA for women by birth cohort
Research Question:
"How have changes in the APA impacted on female labour marketparticipation and the use of other government benefits?"
Results
- Increase in the eligibility age of 1 year induced a decline in retirementprobability 8% + significant "program substitution".Kadir Atalay (University of Sydney) APA experiment July 2012 3 / 24

Structure of Presentation
Outline
1 Literature
2 Outline of Australian Retirement Income System
2.1 Australian Program Reform
3 Data and Empirical Methods
3.1 Recent Trends3.2 Empirical Methods
4 Results
4.1 Labour Force Participation4.2 Government Program Substitution
5 Conclusion
Kadir Atalay (University of Sydney) APA experiment July 2012 4 / 24

Literature
Reduced Form:
Mitchell and Field (1982), Hurd (1990)
Structural Modeling:
Gustman and Steinmeier (1998, 1986) Rust and Phelan (1997)
Option Value Approach:
Stock and Wise (1990a, 1990b): path of wealth accrual
‘Natural Experiments’:
Krueger and Pinschke (1992) ‘Notch Generation’Mastrobuoni (2009) -US ; Hanel and Riphahn (2009)- SwitzerlandStaubli and Zweimuller (2011) - Austria
Kadir Atalay (University of Sydney) APA experiment July 2012 5 / 24

Australian System
Summary of Retirement Income SystemAustralia
Structure Schemes1st Tier Targeted Age Pension
2nd Tier Private DC SG
3rd Tier VoluntarySuper
(OECD classification.)
Distinctive features of Aust retirement income system- means-tested Age Pension (non-contributory scheme)- mandated private retirement saving
Kadir Atalay (University of Sydney) APA experiment July 2012 6 / 24

1st Tier Structure -Age Pension
1st Tier Age Pension⇒ alleviation of poverty among the aged
Aust: Age Pension targeted (since 1909) via income and assets test
- Non-contributory scheme:The benefit levels are not tied to work history, receipt of benefitonly tied to age
- Full benefit: A$570 ($950) per fortnight for singles (couples); 25% ofaverage male earnings + indexed
Kadir Atalay (University of Sydney) APA experiment July 2012 7 / 24

Age Pension
70% of elderly receive some benefit from Age Pension. 2/3 of themreceive the maximum
Associated Benefits : subsidies for Medical Care, Pharmaceuticals,Rent, Utilities, Transport.
Work Disincentive
Very few Australians work beyond Age Pension eligibility age
LFPR for 55 to 59 year old men is 77%; 65-69 year old men is 7%.
Kadir Atalay (University of Sydney) APA experiment July 2012 8 / 24

The Experiment
Eligibility AgeBorn Women Men Effective on
Before 1 July 1935 60 65 Before 1 July 1995
From 1 July 1935 to 31 December 1936 60.5 65 1Jul97
From 1 January 1937 to 30 June 1938 61 65 1Jul99
From 1 July 1938 to 31 December 1939 61.5 65 1Jul01
From 1 January 1940 to 30 June 1941 62 65 1Jul03
From 1 July 1941 to 31 December 1942 62.5 65 1Jul05
From 1 January 1943 to 30 June 1944 63 65 1Jul07
From 1 July 1944 to 31 December 1945 63.5 65 1Jul09
From 1 January 1946 to 30 June 1947 64 65 1Jul11
From 1 July 1947 to 31 December 1948 64.5 65 1Jul13
From 1 January 1949 to 30 June 1952 65 65 1Jul15
Variation in APA for women and in comparison to the constant APA for men,provides an ideal natural experiment for examining the impact of the APA policyparameter on the labour force behaviour of older individuals.
Kadir Atalay (University of Sydney) APA experiment July 2012 9 / 24
Framework
Theoretical model: LCM and wealth effectUnique feature of Age Pension- where benefits are not a function ofprior "contributory" earnings nor the accrual of additional benefitswith delayed retirement.
⇒ Pure wealth effect ( no accrual effect)
+ Norms, "Target Retirement Age"
+Side effects (Program Substitution)
Kadir Atalay (University of Sydney) APA experiment July 2012 10 / 24

Data
ABS Income and Housing Costs Surveys: 1994/95-2009/10
- 11 pooled cross-sections, 17 calender years
Sample:
- Age 60-64 years (age available in single years)- gender, marital status, LF Status, education, income sources, cohortmeans for experience / LF attachment, home ownership
Kadir Atalay (University of Sydney) APA experiment July 2012 11 / 24
Summary Stats
Summary Stats
ALL HOUSEHOLDS
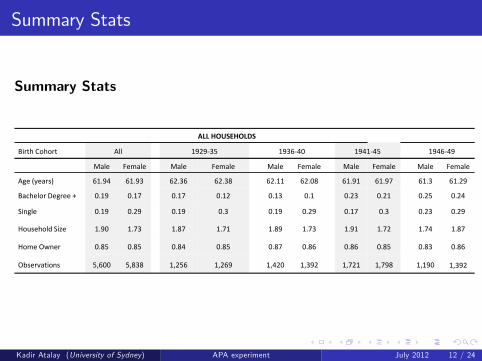
Birth Cohort All 192935 193640 194145 194649
Male Female Male Female Male Female Male Female Male Female
Age (years) 61.94 61.93 62.36 62.38 62.11 62.08 61.91 61.97 61.3 61.29
Bachelor Degree + 0.19 0.17 0.17 0.12 0.13 0.1 0.23 0.21 0.25 0.24
Single 0.19 0.29 0.19 0.3 0.19 0.29 0.17 0.3 0.23 0.29
Household Size 1.90 1.73 1.87 1.71 1.89 1.73 1.91 1.72 1.74 1.87
Home Owner 0.85 0.85 0.84 0.85 0.87 0.86 0.86 0.85 0.83 0.86
Observations 5,600 5,838 1,256 1,269 1,420 1,392 1,721 1,798 1,190 1,392
Kadir Atalay (University of Sydney) APA experiment July 2012 12 / 24

Data Properties
Men
Women
10
20
30
40
50
60
70
1980 1985 1990 1995 2000 2005 2010Year
Income and Housing Cost Surveys
Aggregate Series
Labour Market Participation
Kadir Atalay (University of Sydney) APA experiment July 2012 13 / 24

Data Properties
Cohort Participation Rates, for Men and Women
Age53 55 57 59 61 63 65
Men
Women
193640 192935
192935
194145
194650
194650
193640
194145
0.8
0.6
0.4
0.2
0
Kadir Atalay (University of Sydney) APA experiment July 2012 14 / 24

Data Properties
Single Men Single Women
Married
Age
Men
Women
193640
193640192935
192935
193640
193640
192935
192935194145
194145
194145194145
194650
194650
194650
56 58 60 62 64 56 58 60 62 64
53 55 57 59 61 63 65
192935
192935
192935
192935
193640
193640
193640
193640
194145
194145
194650
194650
194650
194650
194650
194650
0 0
0
.2 .2
.2
.4 .4
.4
.6 .6
.6
.8 .8
.8
Cohort Participation Rates, for Singles /Married
Kadir Atalay (University of Sydney) APA experiment July 2012 15 / 24

Empirics
Empirics: ‘natural experiment’method
- transparent source of variation in benefit eligibility
Model Specification:
Difference-in-Difference framework
Born Before01/07/1935
Born After01/07/1935
Control Group(MEN)
Lcb Lca
Treatment Group(WOMEN)
Ltb Lta
APA reform effect = (Lta − Ltb)− (Lca − Lcb)
LFPi = βxi + α0Femalei + α1Cohorti + δ (Femalei × Cohorti )Kadir Atalay (University of Sydney) APA experiment July 2012 16 / 24

Results (1)
Regression Adjusted Difference in Difference Estimate of APA Reform Impact , Single TreatmentFull Sample Full Sample Aged 5564
(1) (2) (3) (4)After Cohort 0.03** 0.06* 0.03 0.03*
(Born After July 1935) [0.02] [0.03] [0.03] [0.02]Treatment Group 0.29*** 0.29*** 0.05 0.29***
(Females) [0.01] [0.02] [0.08] [0.02]Treatment Effect 0.08*** 0.08*** 0.03* 0.09***
(Treatment After Cohort Interaction) [0.02] [0.02] [0.02] [0.02]Observations 11,438
Single Sample Single Sample Aged 5564(5) (6) (7) (8)
After Cohort 0.01 0.15 0.09 0.01(Born After July 1935) [0.04] [0.08] [0.06] [0.04]
Treatment Group 0.22*** 0.15*** 0.09 0.22***(Females) [0.04] [0.06] [0.11] [0.04]
Treatment Effect 0.14*** 0.12*** 0.06* 0.14***(Treatment After Cohort Interaction) [.05] [.05] [0.03] [0.04]
2,813 6,504Constructed Variable (Average CohortParticipation Rates betwen age 40 to 45 years)
ü
Year Effects ü üNotes:1. All regressions include controls for age, educational attainment, marital status, state of residence and household size, home ownership.2Construcred Variable is the avarage cohort participation rates between 40 to 45 years (ABS 6202)
Note: Less educated, older individuals are less likely to participate.Kadir Atalay (University of Sydney) APA experiment July 2012 17 / 24

Results (2)
Additional Experiments
Multiple Treatments (5 Treatment Dummies)- bigger response in younger cohorts.- response is common to all ages (not peak on thresholds).Liquidity constraintHome ownersHigh educatedRobustnessSimple Pre/Post cohort differences (Mastrobuoni 2010)
⇒ Increase in the eligibility age of 1 year induced a decline in retirementprobability 8% (Smaller in magnitude than the recent US studies)
Kadir Atalay (University of Sydney) APA experiment July 2012 18 / 24

Program Substitution
Female Government Program Substitution
Any Government Program Excluding Age Pension
Age PensionDisability Support Pension
192935193640
194145
53 55 57 59 61 63 65Age
194145
53 55 57 59 61 63 65Age
53 55 57 59 61 63 65Age
53 55 57 59 61 63 65Age
.1
.3
.5
.7 .7
.5
.3
.1
.1
.3
.5
.7.3
.2
.1
0
192935193640
194145193640
192935
192935
193640
194145
Kadir Atalay (University of Sydney) APA experiment July 2012 19 / 24

Program Substitution
GovPPi = βxi + α1(CohortT ∗i = 1) + δAgeiCohorti [(CohortT∗i = 1)× agei ]
δAgeiCohorti measures the change in the program participation rate betweenthe treated cohorts and non-treated cohorts at a specific age.- Examine men and women separatelyResults
-Cohort differences for women-Younger cohorts more likely to benefit from gov programs other thanAge Pension-Effects are more pronounced at the ages which the APA reformdirectly affected.-Average treatment effect of the APA reform on disability supportparticipation is approximately 10 percentage points
-No cohort differences for menKadir Atalay (University of Sydney) APA experiment July 2012 20 / 24

Conclusions
APA increase for women provides an exogenous source of variation inbenefit eligibility
Results
- impact on women’s own LFS (smaller in magnitude than recent USresults)
- impact on program participation
Currently considering:
Range of additional outcomes (partner’s LFS)- Male Participation as Function of Partner’s Retirement Status
(Wealth & Shared Leisure Effects)- Preliminary results- Older men are responding to the higher likelihood of older wives toparticipation in the labour forceEmbedding in structural model: simulate future changes(+ different policy scenarios)
Kadir Atalay (University of Sydney) APA experiment July 2012 21 / 24

Preliminary Results
Couples: Male Participation as Function of Partner’s Retirement Status
Income v Shared Leisure Effects
Empirical Model:
RHi = αHRWi + XHi βH1 + XWi βH2 + e
Hi
RWi = ZWi γW + XWi βW1 + XHi βW2 + e
Wi
Kadir Atalay (University of Sydney) APA experiment July 2012 22 / 24
Preliminary Results
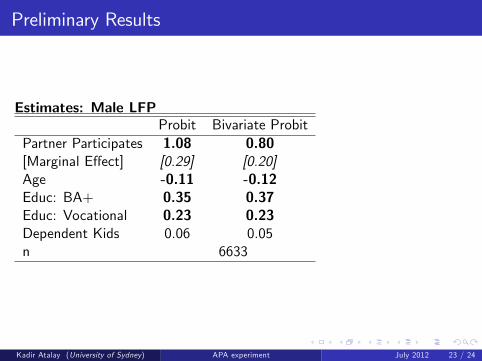
Estimates: Male LFPProbit Bivariate Probit
Partner Participates 1.08 0.80[Marginal Effect] [0.29] [0.20]Age -0.11 -0.12Educ: BA+ 0.35 0.37Educ: Vocational 0.23 0.23Dependent Kids 0.06 0.05n 6633
Kadir Atalay (University of Sydney) APA experiment July 2012 23 / 24

Results (2)Regression Adjusted Difference in Difference Treatment Effects by Age
(1) Full Sample (2) Single (3) Full Sample
AC1 (eligibility age 60.5 to 61) 0.006 0.057 0.013[0.024] [0.059] [0.022]
AC2 (eligibility age 61.5 to 62) 0.016 0.017 0.033*[0.023] [0.047] [0.019]
AC3(eligibility age 62.5 to 63) 0.04* 0.033 0.057***[0.021] [0.049] [0.02]
AC4(eligibility age 63.5 to 64) 0.059*** 0.012 0.078***[0.021] [0.045] [0.017]
AC5 (eligibility age 64.5 to 65) 0.046* 0.022 0.085***[0.024] [0.052] [0.02]
Female (TG) 0.289*** 0.218*** 0.254***[0.02] [0.051] [0.015]
Treatment EffectsAC1 x TG 0.037** 0.071* AC1 x TG x (Age 60) 0.011
[0.018] [0.042] [0.045]AC1 x TG x (Age 61) 0.081*
[0.48]AC1 x TG x (Age 62) 0.036
[0.52]AC1 x TG x (Age 63) 0.005
[0.046]AC1 x TG x (Age 64) 0.060
[0.053]AC2 x TG 0.071** 0.104 AC2 x TG x (Age 60) 0.016
[0.029] [0.061] [0.021]AC2 x TG x (Age 61) 0.04
[0.043]AC2 x TG x (Age 62) 0.061*
[0.034]AC2 x TG x (Age 63) 0.016
[0.029]AC2 x TG x (Age 64) 0.092**
[0.041]AC3 x TG 0.032* 0.131** AC3 x TG x (Age 60) 0.005
[0.019] [0.062] [0.012]AC3 x TG x (Age 61) 0.082**
[0.032]AC3 x TG x (Age 62) 0.034
[0.023]AC3 x TG x (Age 63) 0.056
[0.041]AC3 x TG x (Age 64) 0.123**
[0.034]AC4 x TG 0.109*** 0.190*** AC4 x TG x (Age 60) 0.136**
[0.028] [0.057] [0.058]AC4 x TG x (Age 61) 0.11**
[0.045]AC4 x TG x (Age 62) 0.17**
[0.056]AC4 x TG x (Age 63) 0.12**
[0.34]AC5 x TG 0.133*** 0.169*** AC5x TG x ( Age 60) 0.075
[0.033] [0.05] [0.034]AC5x TG x ( Age 61) 0.108*
[0.076]AC5x TG x ( Age 62) 0.098*
[0.056]Observations 11438 2813 11438Notes:1. All regressions include controls for age, educational attainment, marital status, state of residence and household size.
Kadir Atalay (University of Sydney) APA experiment July 2012 24 / 24