the hong kong university of science and technology department of mathematics presented by hui kin...
TRANSCRIPT

The Hong Kong University of Science and TechnologyThe Hong Kong University of Science and Technology
Department of MathematicsDepartment of Mathematics
Presented by
HUI Kin Yip RonaldHUI Kin Yip Ronald

Low Level Wind Field AnalysisLow Level Wind Field Analysis AroundAround
an International Airportan International Airport

ContentsContents
Introduction and BackgroundIntroduction and BackgroundMethodologyMethodologyLLWAS modelLLWAS modelIdeal CasesIdeal Cases
Gust Front modelGust Front model Microburst modelMicroburst model
Real CasesReal CasesConclusionsConclusions

What is Windshear?What is Windshear?Any change of wind speed and/or directionAny change of wind speed and/or directionCan appear Can appear suddenlysuddenly in thunderstorms in thunderstormsAssociated with Associated with gust frontsgust fronts and and microburstsmicrobursts
Why is windshear so dangerous?Why is windshear so dangerous?Dangerous when an aircraft near the groundDangerous when an aircraft near the groundUnbalanced forces appeared suddenlyUnbalanced forces appeared suddenlyDifficult to predictDifficult to predictHard for a pilot to make correctionsHard for a pilot to make corrections

CRASH!!!
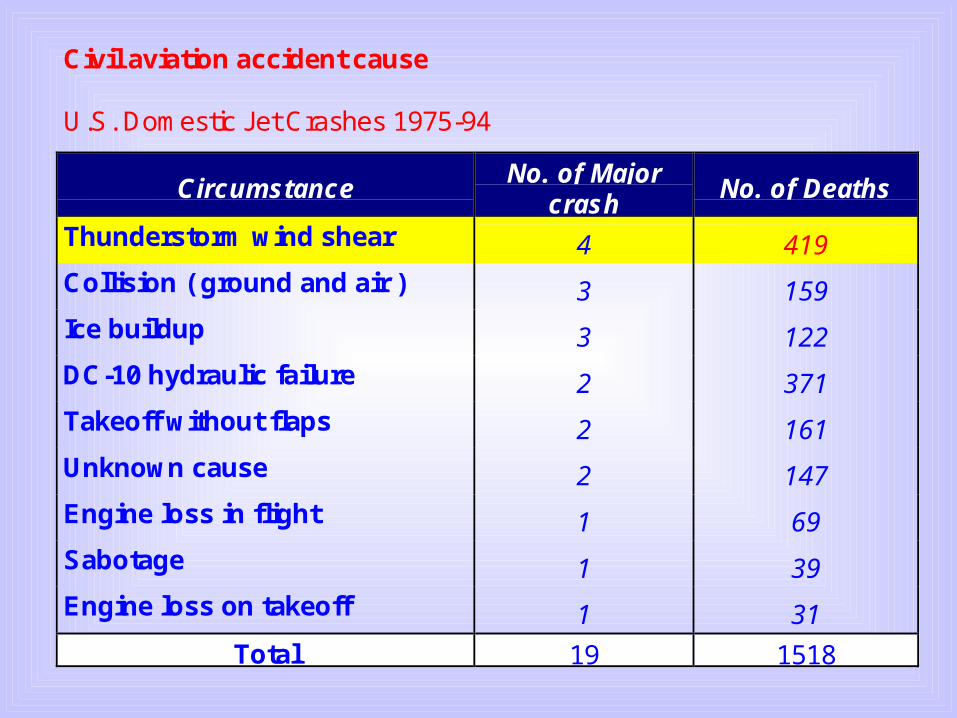
Civil aviation accident cause
U.S. Domestic Jet Crashes 1975-94
CircumstanceNo. of Major
crashNo. of Deaths
Thunderstorm wind shear 4 419
Collision ( ground and air ) 3 159
Ice buildup 3 122
DC-10 hydraulic failure 2 371
Takeoff without flaps 2 161
Unknown cause 2 147
Engine loss in flight 1 69
Sabotage 1 39
Engine loss on takeoff 1 31
Total 19 1518

ObjectivesObjectives
Study the model of a windshear Study the model of a windshear alerting system and test in real time alerting system and test in real time situation by studying the wind field situation by studying the wind field modelmodel
Design a windshear warning systemDesign a windshear warning systemDetect the occurrence of strong Detect the occurrence of strong
windshearwindshearReal case test of system on the Bai-Real case test of system on the Bai-
yun International Airport in yun International Airport in Guangzhou, ChinaGuangzhou, China

MethodologyMethodology
Use Use Automatic Automatic Weather Weather Station Station (AWS)(AWS)
It is low-cost, easy to maintain and It is low-cost, easy to maintain and easy to install at any placeseasy to install at any places


Introduction and History of LLWASIntroduction and History of LLWAS
LLWAS = Low Level Windshear LLWAS = Low Level Windshear Alerting SystemAlerting System
Developed in 1970s by the US Developed in 1970s by the US GovernmentGovernment
Developed under the Joint Airport Developed under the Joint Airport Weather Studies (JAWS)Weather Studies (JAWS)
Started at Denver, Colorado in 1982Started at Denver, Colorado in 1982Most commonly used method for Most commonly used method for
detecting windshear in US nowadaysdetecting windshear in US nowadaysIt is not well-tested in Asia-Pacific regionIt is not well-tested in Asia-Pacific region
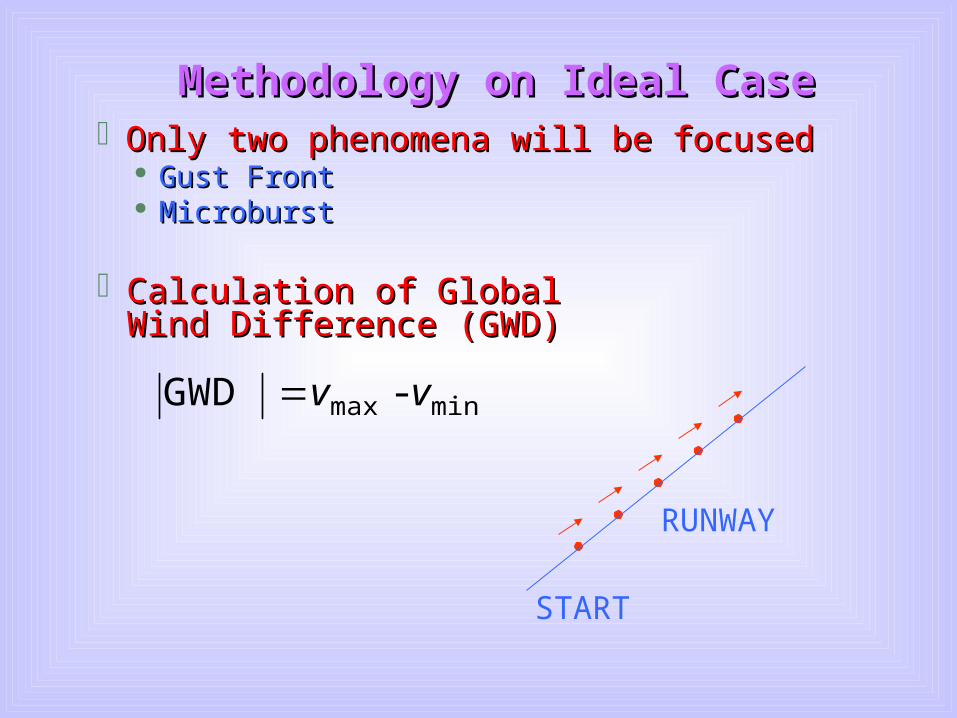
Methodology on Ideal CaseMethodology on Ideal CaseOnly two phenomena will be focusedOnly two phenomena will be focused
Gust FrontGust Front MicroburstMicroburst
minmax-GWD vv
Calculation of Global Calculation of Global Wind Difference (GWD)Wind Difference (GWD)
RUNWAY
START

““A leading edge of a mesoscale pressure A leading edge of a mesoscale pressure dome followed by a surge of gusty dome followed by a surge of gusty winds on or near the ground” winds on or near the ground” (Wakimoto, 1982)(Wakimoto, 1982)
Typical length = 12 km (along front) Typical length = 12 km (along front) and 0.5 km (across front)and 0.5 km (across front)
Propagation speed = 5 to 20 m/s (Uyeda Propagation speed = 5 to 20 m/s (Uyeda and Zrnic, 1985)and Zrnic, 1985)
Gust FrontGust Front

Assumptions:Assumptions: Wind speed at Wind speed at
head = 0 m/shead = 0 m/s Wind speed in the Wind speed in the
front = 10 m/sfront = 10 m/s Wind speed is Wind speed is
increasing linearly increasing linearly for 400 mfor 400 m
The front is The front is propagating in a propagating in a constant directionconstant direction
Gust Front ModelGust Front Model
Background wind Background wind speed is addedspeed is added

Skew angleSkew angle of a g of a gust front is the angust front is the angle between the runle between the runway and the path way and the path of the gustof the gust
Different skew anDifferent skew angles of the gust frogles of the gust fronts are appliednts are applied
GWD values of GWD values of different gust different gust locations are locations are calculated in both calculated in both casescases
ComparisonsComparisons
Gust head
Gust head
Gust head
Direction of gust
Runway

Gust Front with 0° skew angleGust Front with 0° skew angle

Gust Front with 30° skew angleGust Front with 30° skew angle

Gust Front with 90° skew angleGust Front with 90° skew angle

Facts:Facts: Errors apeared near the ends of the runway Errors apeared near the ends of the runway
when the skew angle is smallwhen the skew angle is small Errors near the centre of the runway increaErrors near the centre of the runway increa
ses with the skew angleses with the skew angle Maximum error Maximum error 3 m/s 3 m/s
Conclusion:Conclusion: Reasonable estimate for the gust passing Reasonable estimate for the gust passing
through the runway nearly from one end to through the runway nearly from one end to anotheranother
ResultsResults

““An outward-moving airflow induced An outward-moving airflow induced by the evaporatively cooled downdraft by the evaporatively cooled downdraft from a thunderstorm or heavy rain.”from a thunderstorm or heavy rain.”
MicroburstMicroburst
Typical Typical duration duration = 10 min= 10 min
Typical Typical radius = radius = 2 to 3 km2 to 3 km

A simplified mathematical microburst model A simplified mathematical microburst model from Wilson and Flueck (1986) is usedfrom Wilson and Flueck (1986) is used
Assumptions:Assumptions: it satisfies the mass continuity equationit satisfies the mass continuity equation it exhibits realistic radial outflow at ground levelit exhibits realistic radial outflow at ground level it is symmetric about its centreit is symmetric about its centre it is radially symmetric about the originit is radially symmetric about the origin
Microburst ModelMicroburst Model
Background wind speed is addedBackground wind speed is added

Microburst ModelMicroburst Model


8 different locatio8 different locationsns Locations of the Locations of the
microbursts are microbursts are lying on a line lying on a line perpendicular to perpendicular to the runwaythe runway
10 different size o10 different size of the microburstsf the microbursts Radius of Radius of
microburst = 1.8 microburst = 1.8 to 3.8 kmto 3.8 km
ComparisonsComparisons


Facts:Facts: Both 16-AWS and 18-AWS networks give reasonaBoth 16-AWS and 18-AWS networks give reasona
ble descirptions to the ideal situationble descirptions to the ideal situation However, 16-AWS gives a relatively better resultHowever, 16-AWS gives a relatively better result
ResultsResults
Conclusion:Conclusion: Resonable estimate for idealiResonable estimate for idealizedzed microbursts microbursts

Availability of the Real DataAvailability of the Real Data
Operation Period:Operation Period: 2727thth June 1998 to 26 June 1998 to 26thth October 1998 October 1998 a total of 122 daysa total of 122 days
Daily Data Monitoring is appliedDaily Data Monitoring is appliedData is collected in different time intervalsData is collected in different time intervals
BY1,3,5,6,7,8: every ONE secondBY1,3,5,6,7,8: every ONE second BY2,4 : every FIVE secondsBY2,4 : every FIVE seconds
Time averaging is used to remove high Time averaging is used to remove high frequency fluctuations with periods shorter frequency fluctuations with periods shorter than 1 minute (e.g. jet wash)than 1 minute (e.g. jet wash)

ONE minute

Case SelectionCase Selection
All data was averaged by every minuteAll data was averaged by every minuteGWD is found in each minuteGWD is found in each minuteCriteria for case study:Criteria for case study:
Failure PeriodsFailure Periods Testing PeriodsTesting Periods Thunderstorm and rainy DaysThunderstorm and rainy Days High wind speed PeriodsHigh wind speed Periods
METAR information is usedMETAR information is used


Case SelectionCase Selection
CaseCase DateDate METAR info METAR info GWD GWD No. of No. of AWSAWS
II 07010701 TS, RA, 11 TS, RA, 11 8.10 8.10 55IIII 07120712 TS, RA, 7 TS, RA, 7 9.22 9.22 88IIIIII 07140714 TS, RA, 4 TS, RA, 4 7.74 7.74 88IVIV 07220722 N/A N/A 7.41 7.41 66VV 09110911 TS, RA, 5 TS, RA, 5 7.21 7.21 77VIVI 09130913 NIL, 5 NIL, 5 7.20 7.20 77VIIVII 10071007 NIL, 5 NIL, 5 11.3911.39 77VIIIVIII 10131013 NIL, 1 NIL, 1 9.68 9.68 77

MethodologyMethodology
Divergence (DIV) along the runway is Divergence (DIV) along the runway is usedused
)()(21
)(DIV 11
iii xvxvx
Windshear is associated with a pair of Windshear is associated with a pair of convergence and divergence zonesconvergence and divergence zones
If the pair is moving, it is gust-front likeIf the pair is moving, it is gust-front likeIf the pair is nearly stationary, it is more If the pair is nearly stationary, it is more
likely a microburstlikely a microburst


Case I: 980701Case I: 980701
14:40 15:20


ResultsResults
There is a pair of There is a pair of movingmoving divergence and divergence and convergence zones from 14:52 to 15:00convergence zones from 14:52 to 15:00
It had gust-front featuresIt had gust-front featuresFigures about this caseFigures about this case
GWD GWD 8.10 m/s 8.10 m/s Length of Gust Length of Gust 195.65 m 195.65 m Duration Duration 10 minutes 10 minutes Skew angle Skew angle 10.49° 10.49°

Case VII: 981007Case VII: 981007
02:30 03:00


ResultsResults
There is a pair of There is a pair of nearly stationarynearly stationary divergence and convergence zonesdivergence and convergence zones
It had microburst featuresIt had microburst featuresFigures about this caseFigures about this case
GWD GWD 11.39 m/s 11.39 m/s Radius of Microburst Radius of Microburst 1.5 km 1.5 km Duration Duration 8 minutes 8 minutes

ConclusionsConclusionsOur mathematical model can describe and Our mathematical model can describe and
detect the occurrence of windshear in both detect the occurrence of windshear in both idealized and real casesidealized and real cases
It registers a few cases of interesting It registers a few cases of interesting meteorological phenomena which had meteorological phenomena which had similar (but weaker) characteristicssimilar (but weaker) characteristics
Its setup price is relatively cheap, but it is Its setup price is relatively cheap, but it is reliable and easy to installreliable and easy to install
A denser AWS network (with more A denser AWS network (with more AWS) can improve the skill of the systemAWS) can improve the skill of the system
It is suitable detecting windshear for It is suitable detecting windshear for airports in the Asia-Pacific Regionairports in the Asia-Pacific Region

AcknowledgementsAcknowledgements
Department of Mathematics, HKUSTDepartment of Mathematics, HKUSTCivil Aviation Administration of China Civil Aviation Administration of China
(CAAC)(CAAC)Center for Coastal and Atmospheric Center for Coastal and Atmospheric
Research (CCAR), HKUSTResearch (CCAR), HKUST''Operational Windshear Warning System Operational Windshear Warning System
(OWWS)' consultancy project(OWWS)' consultancy projectYour participationYour participation

Thank YouThank You