the global trade collapse and its effects on...
TRANSCRIPT

Dipartimento di Scienze Politiche – Relazioni
Internazionali
Cattedra di International Economics
THE GLOBAL TRADE COLLAPSE AND ITS EFFECTS ON THE INTERNATIONAL
ECONOMY
RELATORE Prof. Giuseppe De Arcangelis
CORRELATORE Prof. Arlo Poletti
CANDIDATO Matr. 625492
ANNO ACCADEMICO
2015 / 2016

2
3
TABLE OF CONTENTS
Introduction
Chapter one - The Financial Crisis and the Great Recession that triggered the
Global Trade Collapse
• An Increasing Financial Fragility: Liberalization, Globalization, Innovation, and
Leverage
• The Subprime Crisis
• The spread of the Crisis and the Great Recession that triggered the Global Trade
Collapse
Chapter two - The Global Trade Collapse, causes and dynamics
• An Unprecedented Experience: Figures and Data
• Global Trade Collapse: negative demand-shock, trade-credit crunch and high
trade costs
• The link between the banking Crisis and the Great Trade Collapse
Chapter three - The amplifier of the Crisis: the Role of the International Supply
Chain
• Understanding the International Supply Chain
• The International Supply Chain as a Transmission Channel of the Financial
Shock
• The International Supply Chain as a Transmission Channel of the Negative-
demand Shock
4
Chapter four - The Recovery and the Effects of Global Trade Collapse on the
International Economy
• The Effects of the Crisis on the International Economy
• Lessons from the Global Trade Collapse: the Threat of Trade Imbalances
• The Importance of Trade Policies and of Governments’ behavior: prospects
Appendix 1: Case study, Intermac
Conclusion
Bibliography
5
INTRODUCTION
During the first years of the third millennium international economy was undergoing
an impressive and extra-ordinary growth rate. However, under a quiet surface, it was
characterized by both real economy and financial severe imbalances. Suddenly, in fact, in
2008 world GDP and international trade flows dropped sharply, and continued falling for at
least one year. The aim of this dissertation is to shed light on these macro economic
movements: where did the Global Trade Collapse originate? And what are its effects on the
international economy?
Hence, since the Great Recession that produced the international trade collapse was
ultimately triggered by the financial crisis of 2007-2008, the first chapter focuses on the
four different but connected processes that undermined the basis of the international finance
structure and that brought to the Subprime crisis. First, starting from the first years of the
eighties a wave of financial liberalization and deregulation spread all over the world,
starting from the United Kingdom and the United States. Second, as Martin Wolf pointed
out: funding, banking and holdings of the new assets, undertook a process of globalization1.
One of the consequences of this process was that the current account deficit of most of the
countries was funded, and thus sustained, through international bank financing, extremely
increasing the level of interdependency. Moreover, starting from 2000, with the creation of
the financial instrument of derivatives most of the commercial banks stopped holding the 1 M. Wolf, The Shifts and the Shocks, Penguin, Great Britain, 2015.

6
instruments of credit they issued, lowering the quality of mortgages. Third, a series of legal,
technical and organizational innovations, as the establishment of the shadow banking
system and the creation of derivatives resulted in faster but less transparent transactions.
Lastly, overall «leverage of non-financial borrowers, such as house buyers, who borrowed
more relative to the value of houses; leverage embedded in new instruments, particularly
derivatives; and leverage inside the financial sector itself, […] became extraordinarily high
in many institutions»2.
After a period of rising inflation in the first years of 2000, the outburst of subprime
bubble in the United States, via a phenomenon of general mortgage insolvency, triggered
the great financial crisis in the 2007. Due to the strict connection between two of the most
important financial centers, Wall Street and the City (the London Stock Exchange) the
shock was easily transmitted in Europe. The transmission happened through two main
channels: first, via the newly created financial instruments (as CBO and CDS) that were
held by many of the most important European banks; second, the turmoil of the financial
and banking system caused the so called sudden stop or credit crunch. When the movement
of capital was frozen and liquidity dried-up, those European countries that were heavily
reliant on capital inflow in order to finance their huge current account deficits found
themselves on the brink of bankruptcy. The outcome of both the financial and sovereign-
debt crisis was the Great Recession: world GDP impressively dropped by almost 30% in
20093 reflecting a sharp fall in investment and consumption and causing a huge depression
in the most-hit economies, reflected by an extremely high level of unemployment.
On the other hand the second chapter sheds light on the phenomenon of the Global
Trade Collapse itself and on its causes. Through data and figures it shows how the Great
Recession ruthlessly hit international trade flows. Each country’s volume of exports and
imports, in fact, dropped by more than 20% in the period between the end of 2008 and the
second quarter of 20094. Even though the world economy had already experienced various
severe crises (e.g. the Great Depression, the Oil Crises) none of then was so sudden, so
2 M. Wolf, The Shifts and the Shocks, cit. p. 131. 3 Baldwin, R., 2011, The Great Trade Collapse: Causes, Consequences and Prospects, A VoxEU.org Publication. 4 Ibid.

7
severe and so synchronized as the one of 20085. For this reason this phenomenon is know in
the economic and academic world as the Global Trade Collapse. More precisely the
negative-demand shock that affected primarily durable/manufactured goods, a trade-specific
credit crunch and a rise in trade cost deeply undermined international trade. Furthermore, in
a more direct manner, exporters that were heavily reliant on external finance had been
negatively affected by the banking crisis.
Moreover, as the third chapter demonstrates, the existence of international supply
chains significantly amplified the effect of the financial crisis and of the Great Recession.
The fragmentation of the various stages of the production chains across the world, in fact,
means that trade flows are based not only of final goods but also on intermediates. Hence,
on the one hand, if as a result of the credit crunch a firm’s request for credit is denied, the
company will be forced to scale down its production, adversely affecting both its suppliers
and clients across the world. On the other hand, as the O’Rourke Barbie doll example
brilliantly explains, «(e)very time the US buys one fewer Barbie doll, trade declines not
only by the value of the finished doll, but by the value of all the intermediate trade flows
that went into creating it»6. Hence, an «adverse external shocks may affect firms not only
through final demand (a sudden decline in exports), but also through a disruption of the
flow of inputs received from their suppliers»7.
To conclude, the last chapter describes the recovery process and the effects of the
Global Trade Collapse on the structures of international economy. Broadly speaking, the
recovery of global trade was relatively rapid, according to the European Commission data,
in fact, the volume of world trade reached its pre-crisis level already in the mid of 20108
even though, the reprise has slow down in the second quarter of 2011 as a consequence of
the European sovereign-debt crisis, of the Japanese Tōhoku earthquake of March the 11th
5 Ibid. 6 O’Rourke, K. Collapsing trade in a Barbie world, The Irish Economy, July 18 2009. [Available online from: http://www.irisheconomy.ie/index.php/2009/06/18/collapsing-trade-in-a-barbie-world/] 7 Escaith, H. & Gonguet, F., (2011) International Supply Chains as Real Transmission Channels of Financial Shocks, The Capco Institute Journal of Financial Transformation, cit. p. 84. 8 European Commission, Economic and Financial Affairs (2012) Volume 11 – Issue 2 Quarterly Report on the euro area, July 2012. [Available online from: http://ec.europa.eu/economy_finance/publications/qr_euro_area/2012/pdf/qrea2_section_1_en.pdf]

8
2011 that caused a drop in the level of production of that country, and of the uncertainty
concerning US fiscal policy. Overall, it is relevant to notice that since diverse region were
hit differently also recovery processes were developed with different paces. Some countries,
as the US, or regions, as the European Union, has been hit by both the financial crisis and
the real/trade crisis, hence they have experienced a relatively slow recovery. Conversely,
many emerging countries were affected only by the negative-demand shock and thus saw a
relatively rapid reprise. However, Global Trade Collapse has left lasting marks on the
international economy. First of all, on the demand-side there has been a regional shift in
favor of emerging markets in terms of income growth and, thus, import demand9 .
Conversely, on the supply-side both trade elasticities and the international production
structures are changing: international supply chains, for instance, have undertaken a process
of consolidation as a result of the shock10. Lastly, on the financial side, bank intermediate
trade financing is still suffering the effect of the crisis11 thus slowing the recovery process.
Global trade’s growth rate is today far below the level it would have been in absence
of the Great Recession12. Nevertheless, it is crucial to take into account that the high growth
rate experienced by world trade and world GDP between 2002 and 2008 was also the
outcome of a, extra-ordinary buoyant context which was characterized «by a global
liquidity glut and excessive consumption in several advanced countries»13. Hence, it is
likely that, at least in the medium term, trade will grow with the trend growth observed in
the 90s14.
9 European Commission, Economic and Financial Affairs (2012) Volume 11 – Issue 2 Quarterly Report on the euro area, July 2012, cit. 10 Ibid. 11 Ibid. 12 European Commission, Economic and Financial Affairs (2012) Volume 11 – Issue 2 Quarterly Report on the euro area, July 2012, cit. 13 Ivi p. 9. 14 Ibid.

9
CAPITOLO PRIMO
THE FINANCIAL CRISIS AND THE GREAT RECESSION THAT
TRIGGERED THE GLOBAL TRADE COLLAPSE
1.1 An Increasing Financial Instability: Liberalization, Globalization, Innovation, and
Leverage
Some of the features of the financial system itself had been among the causes of the
outbreak of the financial crisis of the 2007-2008 that triggered the following global trade
collapse. More precisely, the process of financial liberalization, the mounting globalization,
the introduction of some legal, technical, and organizational innovations, and the role
played by the increased leveraged are essential in explaining the deep downturn of the first
decade of the third millennium15.
1.1.1 Financial Liberalization
As far as the financial liberalization is concerned, it is important to underline a
premise: there is a strong connection that this process had, and have, with the trend of
15 M. Wolf, The Shifts and the Shocks, Penguin, Great Britain, 2015.

10
deregulation. Strictly speaking, the more financial markets were liberalized, the more they
escaped the control and the regulation of the official authorities. This had been a constant
trend, from the beginning of 1980s until today, of the evolution of this system. The turning
point of this story took place at the beginning of the 70s when the Bretton Woods system
collapsed: its breakdown meant the end of fixed exchange rate and, thus, for many, the end
of international economic stability. The recognition by the most important players of the
international monetary system of the impossibility to re-establish a second Bretton Woods,
is representative of the shift towards a new economic system. Subsequently, starting from
the 80s almost all the fields of economy experienced a very long-lasting period of
liberalization. It was an actual revolution which began in the cultural sphere and then spread
throughout many sectors of the society. This new attitude was embodied by two of the most
influencing world leaders: Margaret Thatcher and Ronald Reagan, respectively elected in
the 1979 in Great Britain and in the 1981 in the United States. They were supporters of a
new theory called new-liberalism which was built on the concept according to which the
best way to allocate resources was to let the market play freely, with an high degree of
laissez-faire16: the less restrictions the better. Lastly, the fall of the Soviet Union in the
December of 1991 strengthened the idea that state-controlled economy was neither
successful nor sustainable.
In the meanwhile, Milton Friedman’s monetarism, an innovative approach to
economic policies, made its appearance in the economic field. This new theory broke
definitely the link between the value of money and gold: he argued that the strength of a
certain currency should be measured by its capacity to buy goods and services in
comparison with another currency17. In other words, the value of the currency depends on
its demand and supply, as for every other good. Hence, following this theory, because
inflation is strictly connected with the devaluation of a currency it is important to keep it
under control by tying liquidity (the mass of money M1) with the index that measures the
magnitude of an economy, GDP (Gross Domestic Product)18. A growing economy, for
instance, can face a monetary expansion and still avoiding inflation.
16 Ibid. 17 G. Di Gaspare, Teoria e Critica della Globalizzazione Finanziaria, CEDAM, Italy, 2013. 18 Ibid.

11
Demonstrating the success of this new theory, the movements of capital
liberalization, which can be considered the event that better represents monetarism, was
established by one of the most crucial protocols of the WTO agreement and functioned as
the engine of financial liberalization. The rationale behind these opening measures has its
roots in what international players believed to be the expected gains of financial
liberalization. First of all, according to the neoclassical growth model, capital should flow
from capital-rich countries (where there is low return due to decreasing marginal
productivity of capital, MPK) to capital-poor countries (where, for the same reasons, the
return on capital is higher)19.
Capital Flows towards capita-poor country after financial opening
Figure 1, Opening to capital movements in capital poor country. Source: Lecture at Sciences Po by Professor Ludovic
Subran (2015)
19 Krugman, P. R. & Maurice Obstfeld, 2008, International Economics: Theory and Policy, Addison-Wesley, 8th
edition, Prentice Hall.

12
More specifically, as Figure 1 shows, these measures should have allowed a faster
transition to the so-called steady state, a condition in which the return on capital in poor
countries equalizes word interest rate. Hence, these movements should have allowed
increased investment (and higher GDP growth rate) in capital poor countries and higher
returns on capital owned by investors in developed countries. Moreover, capital movement
liberalization should have triggered intertemporal trade gains, that could be defined as
exchange of goods and services for claims to future goods and services (i.e. international
borrowing/lending)20. Lastly, financial liberalization should have fostered international risk
sharing; in other words, according to the portfolio theory, more diversification opportunities
permit investors to lessen the risk of their portfolio for the same expected return or increase
their return for the same level of risk21.
With the introduction in the United States of the Depository Institutions Deregulation
and Monetary Control Act (DIDMCA), approved in the 1980, the financial world took
another step toward deregulation22. This federal financial statute opened the financial
markets to the investment of commercial banks and thus attracted an enormous flow of
capital. Nevertheless, the London Stock Exchange (LSE) experienced probably the greatest
deregulation shocks with the approval of the Financial Service Act (FSA) in the 1986,
which, for its innovative contents was called «the Big Bang»23. It opened the door to self-
regulating organizations (SROs), it abolished any judicial control over derivatives, and it
made it possible for the banks to operate in the Stock Exchange24. Paradoxically, after the
crisis of October the 19th 1987, a new wave of deregulation took place: many financial
players believed that the high transparency of the negotiation magnified the panic effect
and, moreover, from their perspective, the fact that those negotiation were concentrated in
one single official market made it possible the rise of a big pressure on financial transition.
Hence, the solution was found in less transparency and in the rise of the so-called
over the counter market (a financial market placed out of the control of the official
20 Ibid. 21 Ibid. 22 Depository Institutions Deregulation And Monetary Control Act of 1980 Federal Reserve Bank of Boston. 23 G. Di Gaspare, Teoria e Critica della Globalizzazione Finanziaria, cit. 24 Financial Service Act 1986, it was repealed and replaced by Financial Services and Markets Act of 2000 that, however, did not abolish nor changed the rules about derivatives.

13
authorities) and of offshore finance25. The management of the dot.com bubble of 2003
showed to the public the new approach adopted by the U.S. Central Bank, FED; it was
Greenspan himself, former president of the Federal Reserve, who recognized that instead of
trying to avoid and contain a potential bubble the regulators had chosen to elaborate some
measures to reduce its impact: it was a strategy focused on limiting the impact rather than
on avoiding the crisis in the first place.
1.1.2 Globalization
As far as globalization is concerned, according to Martin Wolf, there are three ways
in which finance experienced this process of high interconnection: funding, banking and
holdings of the new assets, went global26. First of all, it is important to define the one of the
crucial features of national accounting: the current account. This value, which could be
defined as a record of all international transactions concerning goods, services and income,
will be fundamental in order to explore the concept of global funding and for the
development of this thesis. The current account (CA) is given by the Trade balance (the
difference between exports and imports) plus the Net Income Factor income from abroad
plus Net Unilateral Transfers27.
CA = TB (EXP – IMP) + NIFA + NUT
If a given State has a positive current account it means that is a net creditor; on the
other hand, if the current account is negative that given State is a net debtor. Thus, a State
that runs a current account deficit should finance its debt through the Financial Account.
More specifically, if a country in year t runs a Current Account deficit, its NIFA deteriorates
(NIFA < 0 ), that means that its debt increases.
CA (t) = NIFA (t) – NIFA (t-1) à flow
NIFA (t) = CA (t) + NIFA (t-1) à stock
25 G. Di Gaspare, Teoria e Critica della Globalizzazione Finanziaria, cit. 26 M. Wolf, The Shifts and the Shocks, cit. 27 Feenstra, R. C. & Taylor, A. M., 2014, International Economics, 3rd Edition, Worth Publishers.
14
Hence, regarding the first aspect of financial globalization, by arguing that «funding
went global»28, Martin Wolf underlines the fact that the current account deficit of most of
the countries was funded, and thus sustained, through international bank financing. In fact «
[t]he import of capital into the UK, funding the rapid growth of credit, in part took the for of
foreign purchases of UK credit securities, in particular retail mortgage-backed securities
(RMBS)»29. The fact that funding went global in addition with the rise of a highly
interconnected and interdependent network, which were direct consequences of
globalization and financial liberalization, meant that any kind of massive shock would be
easily transferred worldwide.
This is even truer because of the second feature of globalization: the banking system
itself became global during the last decade. The trading activities between investment banks
grew sharply in the years preceding the outbreak of the crisis, and, in fact «between the late
1990s anf 2008, the consolidated foreign claims of UK headquartered banks […] rose from
less than $500bn to $4tn, or about 150 per cent of GDP»30. Lastly, the third aspect of
globalization, which is relevant in explaining the fragility of the financial system, is the fact
that the newly created (risky) assets were held by banks and investors practically in every
part the world. In other words, what after the crisis would have been called toxic assets had
contaminated almost all the most important financial institutions and banks of the world.
This outcome was not just the product of the financial globalization that increased the
level of interconnection, it was also the result of a process of profound modification of the
nature of banks themselves: the shift from the originate to hold system to the originate to
distribute model 31. Before the repeal of the Glass Steagall Act in the US in 1999,
commercial banks were used to hold their credit until it was extinguished and, thus, an
important consequence of this behavior was the fact that the procedure to obtain a loan was
very long and accurate32. The profile and the guarantees of a customer asking for a
mortgage, for instance, were deeply analyzed before he/she was conceded the loan.
However, after the repeal of the Glass Steagall Act, starting from the first years of 2000, 28 M. Wolf, The Shifts and the Shocks, cit. p. 126. 29 Ibid. 30 Ibid. 31 G. Di Gaspare, Teoria e Critica della Globalizzazione Finanziaria, cit. 32 Ibid.
15
most of the commercial banks slowly began to modify their core business. They stopped
holding the instruments of credit they have issued, began to extract them by the loans and
sell them under the form of derivatives33 in order to enhance their disposable liquidity34.
This process could also be called an externalization of debt and it had a strong impact over
bank’s behavior and attitude.
This shift is at the basis of the subprime crisis and, thus, it is fundamental to
underline its consequences. A crucial result of the abandonment of the originate to hold
model was the fact that the rationale behind the scrupulous examination of the profile of the
customer asking for a mortgage became way more weaker. Strictly speaking, if before the
shift a bank would have been careful in grating a loan because it would have impacted on
the strength of its internal assets, after the move towards the externalization of the
customer’s debt there was no incentive to operate in such a meticulous manner. This meant
standardized and superficial procedures that did not take into account the detail of the single
individual. Long story short, to move outside the bank the risk of insolvency meant less
carefulness.
During this period the data relative to the subscription of mortgage experienced a
sensitive increase, also due to the role played by mortgage brokers who developed a selling
system with a widespread coverage. The apex, in a negative way, of this conduct was
represented by the birth of the so-called ninja mortgage, a sub category of subprime
mortgage35. Ninja is the acronym of No Income, No Job, and No Asset, hence very low
credential for a customer that is supposed to pay back the loan. Nevertheless, this was no
longer a problem for the bank, or the credit agency, grating a loan since the institute would
have extracted the pending debt and would have sold it to another institute, which would
use it to produce an innovative financial instrument. It is clear that a derivative based on
such kind of mortgage would be a highly risky asset because the risk of default is very
plausible. Hence, this is one of the most destabilizing consequences of the shift from the
originate to hold model to the originate to distribute system. According to Martin Wolf, 33 What derivatives are and what role they played in the crisis will be discussed in the following part about Innovation. 34 Ibid. 35 Betting the Earth [online]. Dissent, No. 28, Summer 2008 - 2009: 6-9. Availability: <http://search.informit.com.au/documentSummary;dn=531480593191928;res=IELLCC> ISSN: 1443-2102. [cited 10 Mar 16].

16
many financial actors and policy makers were convinced of the fact that this new model
would have almost automatically distributed the riskiest assets in the hands of the most
expert investors36. However, what happened was exactly the opposite complex derivatives
were sold to customers that were ignoring the actual content of the instrument: a clear case
of asymmetric information where the seller knew much more than the buyers. The problem,
as will be explained in the following lines, came about when the holders of those derivatives
started realizing that.
1.1.3 Legal, Technical and Organizational Innovations
The fourth cause of financial fragility has its roots in a series of innovations that
changed the way in which financial markets worked. There are three categories of
transformation: a more general one concerning information and communications system, an
organizational transformation of the banking system, and a strictly financial one regarding
the creation and pricing of derivatives (namely MBO, CDO, CDS). Moreover, as a more
general consideration it is important to notice that, as Martin Wolf pointed out, sometimes
the concept of innovation itself is a cause of fragility since progress and changes brings
about something we are not used to, something unknown with which we have to learn to
deal37.
As far as information and communication technology is concerned, starting from the
second half of the 1980s, the telematics interconnection became more and more globalized.
Thanks to this revolution the financial market was fully integrated and connected in a
worldwide networks that is operative twenty-four hour per day. Since that moment, the flow
of investments is restless and is moving quickly towards the most remunerative assets and
markets. The extremely high frequency of operations increases the number of commission
and, hence, the gains that traders get from any transactions. This transformation had a huge
impact on the attitude of financial actors since there was a shift from long-term investments
to short term speculation; accurate examination of investments was no longer necessary38.
This change of mentality was also magnified by the augmented flow of capital triggered by 36 M. Wolf, The Shifts and the Shocks, cit. 37 Ibid. 38 G. Di Gaspare, Teoria e Critica della Globalizzazione Finanziaria, cit.

17
the financial market liberalization that allowed banks to directly invest money39. Thus, this
was the highly interconnected environment in which all the other financial innovations took
place.
The organizational mutation of the banking system can be summarized in the concept
of shadow banking introduced by Paul McCulley who «defined it as “the whole alphabet
soup of levered up non-bank investment conduits, vehicles, and structures”»40. It is a
parallel, immaterial financial system which escapes the control and the regulations of
official authorities and that is completely under the control of private agents, the so-called
market maker, that establish the rule and the procedure of the game. Nevertheless, as Martin
Wolf underlines, the problem was that this innovative system was vulnerable to the same
risks of the traditional ones, but without having a lender of last resort and a buffer system
able to contain an eventual crisis, which, moreover, would have been magnified by the lack
of transparency and the extreme connection of the net41.
Moreover, this system was extremely opaque for an external actor and thus also for
official authorities and policy makers. The lack of regulation made the conflict of interests a
constant feature of this scenario where it could also happen that two entities of the same
institute (under different juridical label) sold and then bought the same tranches of
derivatives just for augmenting their market value. A clear example of how this system was
developed was the alliance between the London Stock Exchange (which had been privatized
at the beginning of 2000s) and Lehman Brothers investment bank, that gave birth to a
alternative financial platform called Bajkal42. This name was not chosen causally since it is
the name of deepest lake of the world placed in Siberia43: the lake was taken as a metaphor
of the depth and the obscurity of the platform. The dimension of this new system was
massive and, in fact, it «became bigger than the traditional system, in the early 2000s, and
remained so until after 2008, even though the traditional system also grew substantially»44.
39 Ibid. 40 M. Wolf, The Shifts and the Shocks, cit. p. 128. 41 M. Wolf, The Shifts and the Shocks, cit. 42 G. Di Gaspare, Teoria e Critica della Globalizzazione Finanziaria, cit. 43 Ibid. 44 M. Wolf, The Shifts and the Shocks, cit. p. 130.

18
1.1.4 Derivatives
On the other hand, the more strictly financial innovation was about the creation and
the process of pricing derivatives. These financial instruments are at the very basis of the
crisis that shook most of the financial institutions and the world in 2007-2008 and that was
transmitted to the real economy of trade causing the Great Collapse. Thus, it is essential to
understand what they are and what role they played in the crisis.
First of all it is important to remember that the kind of derivatives that are analyzed
here are the ones which are based on mortgage and that are thus connected to the United
States’ real estate sector. Starting from the end of the 1990s and the beginning of 2000s, in
relations with the rise of the real estate sector, new figures began to make their appearance:
they were mortgage broker and mortgage banker or lender which were specialized in
mortgage loan and worked for investment banks or even commercial banks. In the first
phase, once these institutes had conceded the loan through a standardized and fast
procedure, the mortgage loans were assembled into collections on the basis of riskiness of
insolvency45. The higher the risk, the higher the interest rate in the asset. This first type of
basic derivatives was called Mortgage Backed Securities, MBS, because they originated
from credit instrument extracted by mortgages46.
Hence, in the second phase, credit institutes and commercial banks sold different
tranches of MBS to investment banks that securitized a mix of different MBS into a
financial instrument that the investors could buy. These securities, which are made of
various MBS or ABS (diversified for riskiness and geographical area), are the so-called
Collateralized Debt Obligation, CDO. When CDOs were further divided and re-assembled
to create a more hybrid instrument this was called CDO squared. This procedure resulted in
a benefit for both commercial banks and investment banks: on the one hand, the former gain
immediate liquidity and the externalization of risk of insolvency; on the other hand the latter
were provided with a financial instrument they could sold. 45 G. Di Gaspare, Teoria e Critica della Globalizzazione Finanziaria, cit. 46 Commercial banks did not sell only MBS but also ABS, Asset Backed Securities, which did not depend on mortgages but on different kind of asset.

19
The demand for this new financial instruments rose sharply up to the point where it
could not be matched by the supply of CDOs47. The solution devised to avoid the rise of
prices, and thus a speculative bubble, was the creation of the so-called naked or synthetic
CDO48. This new category of derivatives was completely different from the previous one
because they have no kind of connection with an underlying mortgage (nor another asset);
their value was established with respect to other CDO which belonged to the first generation
and, thus, they worked as a sort of index following the value of the relative CDO. The last
innovation concerning derivatives was the creation of the so-called Credit Default Swaps,
CDS. They had been devised to worked as insurance in order to cover the risk deriving from
the possibility of default of other CDOs.
As Martin Wolf pointed out, these financial innovations represent one of the greatest
causes of financial fragility49 because the more complex became the world of derivatives the
less those financial instrument were connected to the real economy. Once the first tranches
of MBS or ABS left the institute that issued the mortgage loans, those instruments entered
in a chain of hybridization and, at the end of the process, the result was a complex
instrument whose value and risk was calculated via complex algorithm. The point is that no
one, at the end, was able to go back to the original value and the actual risk of the
instrument. Here emerges another important aspect of this intellectual innovation: the
pricing of derivatives. The procedure of pricing derivatives is developed during the
construction of the derivatives itself and it ends up with the elaboration of the notional
value. It is a process made by an informatics system and in which the human operator take
part only marginally. Every single asset has its relative value which has been established by
the rating agencies, even though this did not work as a guarantee because, as Joseph Stiglitz
pointed out, rating agency used the same wrong model which the investment banks used as
a benchmark50. More specifically the model used by the agencies to rate the single MBS,
assumed the stable and normal functioning of the market, or considered just the standard
deviations, and it did not take into account systemic crisis and shocks. It is the software
47 G. Di Gaspare, Teoria e Critica della Globalizzazione Finanziaria, cit. 48 Ibid. 49 M. Wolf, The Shifts and the Shocks, cit. 50 G. Di Gaspare, Teoria e Critica della Globalizzazione Finanziaria, cit.

20
itself that select the various assets (MBS or ABS) that will compose the final derivative. At
the end of the assembling process the software issues, together with the financial instrument
ready to be trade, the so-called notional vale of the derivatives. It is one of the most
important data because it incorporates both the value of the initial asset and the production
cost51. Moreover, it is interesting to notice that in order to obtain the notional value the
software uses the statistical average in a way that almost eliminates the risk of systemic
crisis since its aim is to eliminate potential aberrations.
The notional value represent the starting price of these innovative financial
instruments and offers a measure to weight the total value of derivatives in the financial
word. «According to the Bank for International Settlements, between June 1998 and June
2008 the notional value of outstanding over-the-counter derivatives exploded from $72tn to
$673tn (whereupon it stagnated), the latter being just under eleven times global gross
product»52.
1.1.5 Leverage
The last cause of fragility is leverage, which, according to Martin Wolf, caused
instability in three different extents: «leverage of non-financial borrowers, such as house
buyers, who borrowed more relative to the value of houses; leverage embedded in new
instruments, particularly derivatives; and leverage inside the financial sector itself, which
became extraordinarily high in many institutions»53.
As far as the first group in concerned, for instance, the environment of laxity
represented one of the cause of the high level of indebtedness. In other words, the fact that
the banks conceded mortgage loans in such a not scrupulous way and with such a low
interest rates encouraged this attitude of their customers. Moreover, the derivatives
themselves, as CDOs for instance, are intrinsically based on the concept of leverage54.
Moreover, not only the models used to estimate the value of derivatives were wrong, as
51 Ibid. 52 M. Wolf, The Shifts and the Shocks, cit. p. 128. 53 Ivi p. 131. 54 M. Wolf, The Shifts and the Shocks, cit. p. 131.
21
mentioned above, but also the models for the risk management adopted by the great
investment banks were fallacious55. Those were used to calculate the leverage ratio that
more than doubled, during the first years of 2000, creating a financial scenario which was
very vulnerable to crisis56. The point is that regulators used the same models used by the
players of the game and, hence, they could not forecast the big shock too.
1.2 The Subprime crisis
1.2.1 Premises
It is important to take into consideration, as a starting point, the fact that the delicate
castle built on derivatives based of mortgages had been devised to work only in the absence
of general crisis of insolvency. There existed CDOs (and their different declinations as
CDO squared and synthetic CDOs) and CDSs emitted by, among the others, the great
insurance company American International Group, AIG. These two kinds of derivatives, if
held together by the same investors, should have worked on the basis of the same idea
behind the concept of diversification of portfolio. However, the model and this system
based on buffers could have worked only if the rate of insolvency would have been under its
physiological limit57. If, on the other hand, there exists a case of general insolvency, which
is translated in a liquidity crisis, then all system tumbles down and the CDSs fail to cover
the loss of all the investors. This is exactly what happened after the Subprime Bubble
exploded in the 2007.
Moreover, it is essential not to forget that, as will be explained more in detail in the
following chapters, even though the huge crisis of 2007-2008 had been triggered by the
subprime bubble, it definitely took place in a world economy which was characterized by
critic imbalances. The enormous current account deficit of many high-income countries,
together with the high level of private debt, for instance, made the economic stability of
55 M. Wolf, The Shifts and the Shocks, cit. 56 Ibid. 57 G. Di Gaspare, Teoria e Critica della Globalizzazione Finanziaria, cit.
22
those countries very vulnerable to any shocks58. The point is that the world economy had
been developed in such a way that it could no be sustained any longer and the crisis that
shocked the financial markets worldwide was just the incident that triggered the fall.
1.2.2 Legal Changes
In the year 2002 two crucial event changed the U.S. market: first, under the George
W. Bush presidency, the United States congress passed a law which modified the
Community Reinvestment Act, CRA, in order to make it easier the access to credit by
lowering the interest rate and parameters needed in order to obtain a loan59. Second, Fannie
Mae (Federal National Mortgage Association) and Freddie Mac (Federal Home Loan
Mortgage Corporation), extended the guarantee to cover also the subprime mortgages60.
The years following this date, in fact, showed a rapid increase of subprime mortgages and in
the first half of the third millennium the volume of loan in the real estate sector reached a
level which was very close to the American GDP61. This expansionary policy caused an
increase in the demand of houses that, consequently, resulted in a rise of nominal prices in
the real estate sector, which almost doubled between the 2000 and 2005. Thus, in a vicious
cycle, the propensity to indebtedness raised too, nourishing in this way the derivatives
market.
1.2.3 Rising inflation and the Turmoil in the Real Estate Sector
In the meanwhile, even though the real inflation was raising, also thanks to the
overnight interest rate establish by the FED the indices were unable to grasp its real value
due to the fact that the house prices was excluded from the basket used as a benchmark to
estimate the level of inflation62. However, starting from 2007, the prices of the houses
started to decline steadily, together with the demand. Once the rising trend of the real estate
sector was reversed, people who had subscribed a mortgage started trying to sell their
58 M. Wolf, The Shifts and the Shocks, cit. 59 Ibid. 60 Ibid. 61 Ibid. 62 Ibid.

23
property to avoid losses deriving from the devaluation of their houses63. What happened was
a sort of bank run applied to the real estate sector, a fatal domino effect that caused the
explosion of a massive bubble. In addition to this, from 2003 to 2007 the FED interest rate
rose from 1% to 5.25% in order to keep the inflation under control and to fight the fall of
value of the dollar; the rise of interest rate by the Central Bank had a strong impact on the
payment of loans because many of them were adjustable rate mortgages64.
The cumulative effect of falling prices and demand in the real estate sector, and the
increase of interest rate caused a wave of insolvency which quickly became a liquidity
crisis. In other words, more and more people stop paying their mortgage (mainly subprime
mortgages) thus interrupting the cash flow that pumped liquidity in the financial market of
derivatives. As mentioned above, the extremely high level of hybridization of CDOs,
squared CDOs, and synthetic CDOs made it very difficult, if not impossible, to forecast
which asset would have been more vulnerable because investors themselves did not know
how their assets were composed. In addition, the highly mixed structure of derivatives was
one of the main causes of the transmission of the shock to many investors. Lastly, the fact
that the rating agencies and the regulators were using exactly the same model for the risk
management allowed the crisis to erupt almost unpredictably. The uncertainty about the
content, and thus the potential illiquidity, of each derivatives and the falling prices of the
assets caused the collapse of the quotation of derivatives in a negative reinforcing cycle.
Many of the most important commercial and investment banks had invested in the new
financial instrument and, hence, as a consequence of reciprocal suspicion, the interbank
interest rate rise sensibly magnifying the credit crunch phenomenon65.
The two Government Sponsored Enterprises (GSE), Fannie Mae and Freddy Mac
(which in the half of 2008 held almost three-quarters of the US loans) where supposed to
work as a buffer in case of default but, on contrary, they did not achieve their goal because
they could not cover all the losses and eventually they ended up nationalized66 since it was
63 M. Wolf, The Shifts and the Shocks, cit. 64 G. Di Gaspare, Teoria e Critica della Globalizzazione Finanziaria, cit. 65 M. Wolf, The Shifts and the Shocks, cit. 66 More specifically Fannie Mae and Freddie Mac were taken into conservatorship by the US government.

24
the only way to avoid a further contagion67. The two enterprises were not the only ones
saved: with a massive and effective maneuver the colossus American International Group,
AIG, was rescued by the US government by «taking 79.9 per cent equity stake and lending
it $85bn on September 16»68. AIG was a vital actor in the scenario since it was the biggest
American insurance company and, moreover, during the first years of 2000 it had issued
tons and tons of CDSs and thus was strictly connected with many investment banks, as
Goldman Sachs, for instance. There was the fear that if AIG collapsed if would have further
transmitted the shock to the latter.
As a result of these government’s operations it was possible to stop the falling prices
of the real estate sector, thus avoiding further mortgage defaults 69 . Moreover, the
modification by the Congress at the beginning of the 1990s of article 33 of the Federal
Reserve Act70, made it possible for the Federal Reserve the injection of liquidity that was
necessary to avoid the collapse of the main investment banks that fell under the category too
big to fail. Nevertheless, there were also casualties that were not bailed out, like the fifth
world investment bank, Lehman Brothers that declared bankruptcy on September the 15th.
Even though, on the one hand, the FED’s decision to not intervene remains controversial, on
the other hand it is recognized that it was very difficult to have an accurate estimate about
the balance sheet and the liabilities of the giant of investment banking.
As it is also acknowledged that the collapse of LB triggered a panic crisis in the
financial market. However, it is possible that the FED, knowing the strong relationship
between LB and European investors and stakeholders71, did not want to press too heavily
the American taxpayers and that it wanted to boost the intervention of the other central
banks, namely the European Central Bank the Bank of England72.
67 G. Di Gaspare, Teoria e Critica della Globalizzazione Finanziaria, cit. 68 M. Wolf, The Shifts and the Shocks, cit. p. 21. 69 G. Di Gaspare, Teoria e Critica della Globalizzazione Finanziaria, cit. 70 Federal Reserve Act, Board of Governors of the Federal Reserve system, [Available online from: http://www.federalreserve.gov/aboutthefed/section14.htm] 71 Lehman Brother was part of the financial pool Bajkal together the London Stock Exchange, as mentioned above. 72 G. Di Gaspare, Teoria e Critica della Globalizzazione Finanziaria, cit.
25
1.2.4 The Spread of the Financial Crisis and the Credit Crunch
The crisis was not confined to the American institutions and banks, obviously, and
also the British government was called to make rapid intervention: «On 17 September, with
government encouragement, Lloyds TSB announced a £12.2bn takeover of Halifax Bank of
Scotland (HBOS) […] (o)n 29 September the government decided to nationalize Bradford
& Bingley, the biggest lender in the UK’s “buy-to-let” market»73. The crisis then rapidly
spread throughout the Eurozone and reached the rest of the world, as will be explained in
the next paragraph. Here it is essential to underline the concept that the crisis started at the
heart of the financial system, in two of the most important financial centers, New York and
London, then, in a bunch of weeks it was transmitted to the rest of the world.
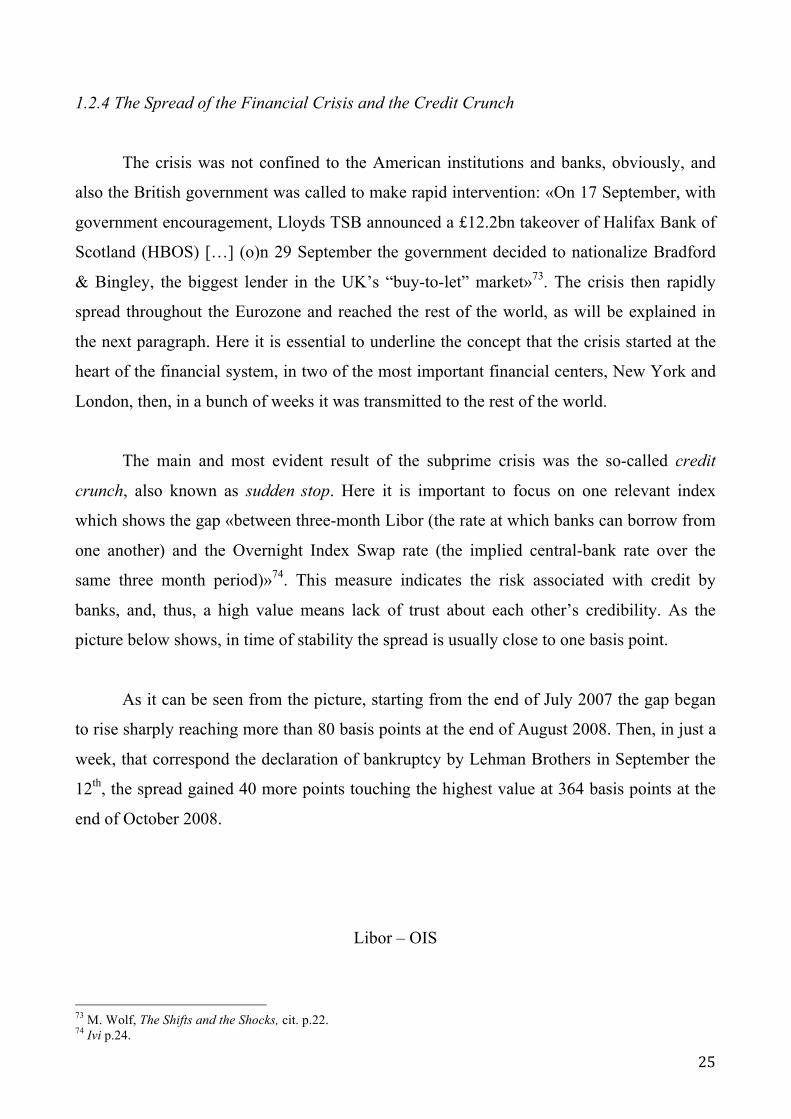
The main and most evident result of the subprime crisis was the so-called credit
crunch, also known as sudden stop. Here it is important to focus on one relevant index
which shows the gap «between three-month Libor (the rate at which banks can borrow from
one another) and the Overnight Index Swap rate (the implied central-bank rate over the
same three month period)»74. This measure indicates the risk associated with credit by
banks, and, thus, a high value means lack of trust about each other’s credibility. As the
picture below shows, in time of stability the spread is usually close to one basis point.
As it can be seen from the picture, starting from the end of July 2007 the gap began
to rise sharply reaching more than 80 basis points at the end of August 2008. Then, in just a
week, that correspond the declaration of bankruptcy by Lehman Brothers in September the
12th, the spread gained 40 more points touching the highest value at 364 basis points at the
end of October 2008.
Libor – OIS
73 M. Wolf, The Shifts and the Shocks, cit. p.22. 74 Ivi p.24.

26
Figure 2, Libor – Overnight Index Swap, source: Martin Wolf (2015) Figure 1, p.24.
The financial crisis of 2007-2008 was an event that changed, and that continues
changing, the structure of the global markets in so far as the Martin Wolf wrote in an article
in the Financial Times of 25 March 2008: «Remember Friday March 14 2008: it was the
day the dream of global free-market capitalism died. For three decades we have moved
towards market-driven financial systems. By its decision to rescue Bear Stearns, the Federal
Reserve, the institution responsible for monetary policy in the US, chief protagonist of free-
market capitalism, declared this era over. It showed in deeds its agreement with the remark
by Joseph Ackermann, chief executive of Deutsche Bank, that “I no longer believe in the
market’s self-healing power”. Deregulation has reached its limits»75.
To conclude, the subprime crisis that badly hit the real estate sector at the beginning
of 2007 was transmitted through the financial market via the newly created instrument of
derivatives. The fact that not only single small investors but also investment and
commercial banks held this kind of asset caused an enormous loss which was called the
credit crunch and severely hit the real economy in what will be called the Great Recession.
75 Ivi pp. 20-21.

27
1.3 The Spread of the Crisis and the Great Recession that triggered the Global Trade
Collapse
As a general consideration it is necessary to underline the fact that even though
financial markets should be used to decrease risk and smooth consumption, under certain
circumstances they are also blamed for making countries more vulnerable to financial
crisis76. In other words, it is acknowledged that financial openness can facilitate the
transmission of shocks from one country to another. In addition, the more countries are
integrated, the more we see co-movement of their financial activity, which is reflected in the
correlation of financial returns, for instance.
Even though a financial crisis can spread through various channels of transmission,
as the portfolio rebalancing channel77 or the Foreign Direct Investment channel78, the
banking/lending channel had played the most significant role in transferring the shock from
the U.S. financial market to the European and global one79. Strictly speaking, commercial
and investment banks experiencing losses in their own markets usually reduce lending
abroad and/or cut funds to their foreign affiliates. When the story is about global banks that
are connected with the world network, there could be an international dry-up of liquidity.
1.3.1 From the Financial Crisis to the Economic Crisis
Thanks to the various transmission channels, the financial crisis of 2007-2008
quickly became an economic crisis that hit (in different ways and with various degree)
almost every region of the world. Nevertheless, as will be described in this paragraph, even
though every country experienced the effects of this turmoil, the Western world, and
precisely Europe, was the region that was the most heavily stroke. Moreover, the Eurozone
represents the second world economy in the world, right after the United States and, for this
76 Krugman, P. R. & Maurice Obstfeld, 2008, International Economics: Theory and Policy, Addison-Wesley, 8th edition, Prentice Hall. 77 The investor who suffers losses in his/her own market usually repatriates funds from abroad, and this has also the effect of lowering the asset prices in the foreign country. 78 Multinational Corporations taking losses in their own markets usually cut investments abroad, thus lowering capital inflow, labor supply and, in general, real activity. 79 Krugman, P. R. & Maurice Obstfeld, 2008, International Economics: Theory and Policy, cit.

28
reason, the sovereign debt crisis, which was triggered but not caused by the financial
earthquake, that shook the Old Continent destabilized the entire world economy80. In other
words, the impact the financial crisis had on the Eurozone amplified the magnitude of the
shock hence sparking a serious global catastrophe: according to Martin Wolf, in fact, «the
crisis of the Eurozone changed what would, in any case, have been an enormous shock, into
a far more serious global crisis»81. These are the reasons why this paragraph will be mainly
focused on the events that took place in the Eurozone, even though it will also briefly cover
what happened in the rest of the world.
In order to better understand the effects of the crisis in the Eurozone it is crucial to
analyze the pre-crisis economic background the characterized Europe. As Martin Wolf
pointed out, in fact, the vast Current Account imbalances of the European States was one of
the main features that made this scenario very unstable and vulnerable to any kind of crisis,
let alone a systemic one82. According to the author, the infamous sudden stop of capital
flows to Europe, caused by the financial crash in the United Stated and in Great Britain,
caused the end of private financing and made this fundamental asymmetry no longer
sustainable83.
Before the event that took place in the U.S. in the mid of 2007, many European
Southern States, like Italy and Spain, for instance, but also Ireland, were recipient of
enormous flows of private capital that came mainly from the rest of Europe and that was
primarily invested in public debt84. The rationale behind this movement of capital was the
quest for higher returns: the capital came from countries where the rate of saving was high,
and thus where the demand of capital and its return were low, and were directed to States
that were characterized by low saving rate and higher demand of capital, hence greater
profits85. Furthermore, it is quite interesting to notice that before the Greek crisis in 2009,
80 M. Wolf, The Shifts and the Shocks, cit. 81 M. Wolf, The Shifts and the Shocks, cit. p.87. 82 Ibid. 83 Ibid. 84 Feenstra, R. C. & Taylor, A. M., 2014, International Economics, 3rd Edition, Worth Publishers. 85 M. Wolf, The Shifts and the Shocks, cit.

29
investors usually treated the bonds of different European States as almost equally risky, or
better, equally safe86.
Spreads of German Bund Yields
Figure 3, Spreads over German Bund Yields, source: Martin Wolf (2015) Figure 6, p.48.
The result was that, as Figure 2 unmistakably shows, before the advent of the crisis,
the spread between German bund yields and Greek bund yields was almost zero, meaning
that they were equally treated by investors. The reasons were mainly two: first, investors did
not estimate correctly the macroeconomic fundamentals of the countries that issued the
bond; second, there was a general belief that the European Union could easily deploy a
safety net for these countries in case of troubles87. Moreover, it was also a consequence of
the regulation «established by the Basel Committee on Banking Supervision […] Basel I,
the first of these regulations, […] allowed banks to treat government debts as risk free and
therefore to fund such debt with zero equity»88.
This huge capital flow was vital for Southern Europe’s Countries in order to sustain
their enormous current account deficit. As already mentioned in the first paragraph, to run a
86 Ibid. 87 Ibid. 88 M. Wolf, The Shifts and the Shocks, cit. p.47
30
current account deficit means that the total amount of spending is higher than the total
income. This outcome could be the result of many variables. On the one hand, current
account deficit could be the result of too low private saving which generally generates asset
bubbles as in the case of the real estate sector in Spain or in Ireland. On the other hand, it
could depend on too high public borrowing as a consequence of excessive public spending
(in relation to the tax revenue) or the excess of the quantity of imports over exports (a
negative Trade Balance). Moreover, the current account position could be viewed also as a
measure reflecting the level of competitiveness of a certain economy: a surplus country is
characterized by a rising attractiveness while, on contrary, a debtor country presents a lower
degree of competitiveness89.
By competitiveness it is meant, for instance, the cost of labor (nominal wages): in a
stable economy as Germany the nominal wages had been stable in the period preceding the
outbreak of the crisis while, on the other hand, in countries affected by bubbles, as Spain for
example, the cost of labor had been rising90. In addition, relatively higher nominal wages
were also the results of the low flexibility of the market, caused mainly by the legislative
structure). Lastly, as far as competitiveness is concerned, it is important to underline that
highly competitive country that ran current account surpluses experienced the expansion of
the manufacturing-export sector while the least competitive ones saw the growth of
domestic oriented industries91.
As Figure 3 demonstrates, even before the outbreak of the financial crisis many
European States (mainly Southern and Baltic States) ran massive current account deficit and
thus they were heavily reliant on foreign capital inflow in order to finance their debt. In
other words, accumulating massive current account deficit automatically leads to a negative
Net International Investment Position, NIIP, with the rest of the world, which, in this case,
is largely represented by other European States. If Greece is a debtor country it means it
runs also a negative NIIP and thus the value of the foreign asset it holds is less than the
domestic assets held by foreigners.
89 Ibid. 90 Ibid. 91 Ibid.

31
Current Accunt Surplusses and Deficit in the Eurozone
Figure 4, Current Account surpluses and deficit in the Eurozone, source: IMF Website.
Strictly speaking this dynamics results in capital inflows: the higher the deficit the
more capital is needed to finance it92. As some argue93, it should have been the role of the
European Central Bank to primarily defend and pursue financial stability but, however, it
was more concentrated on targeting the inflation. The huge asymmetry caused by the
current account imbalances made it possible the surge of speculative bubbles in the recipient
countries and an increasing exposure of the creditors.
The common currency introduced in the scenario of the European Union, in fact, was
also devised with the objective of facilitating these movements of capital. The introduction
of the euro overcame the problem of the risk linked to the exchange rate and, thus, favored
the transfer of capital from countries that were characterized by an excessive rate of savings
(and where the return on capital was relatively low) to countries where there was an higher
demand for investments94. This is the reason why the most indebted countries were the most
hit by the sudden stop caused by the financial crisis. However, as Martin Wolf pointed out, 92 Krugman, P. R. & Maurice Obstfeld, 2008, International Economics: Theory and Policy, cit. 93 Feenstra, R. C. & Taylor, A. M., 2014, International Economics, cit. 94 M. Wolf, The Shifts and the Shocks, cit.

32
the problem was that due to weak economic fundamentals and to structural fragilities, who
received the funds (the countries which ran the deficit) were not able to efficiently manage
the incoming resources95. For instance: «In Greece, much of the borrowing was by a fiscally
irresponsible government that was later found to be falsifying its account»96.
1.3.2 The Sovereign Debt Crisis
Being this the economic background of the Eurozone, after the outbreak of the
financial crisis in the U.S. in the 2007, it was just a question of timing for the sudden stop of
capital to trigger the sovereign debt crisis in the Old Continent. Nevertheless, before the
autumn of 2009, many European leaders believed that, even though many of their home
country’s banks were involved, it was mainly an Anglo-Saxon crisis and that it would have
been confined in the financial realm97. The turning point for the Eurozone was represented
by the occurrence of the Greek crisis, which began to make itself felt at the beginning of
October 2009. As Martin Wolf sustains, «What made the Greek fiscal position so bad was
not that its spending was extraordinarily high by the Eurozone standards, but rather that its
revenue was so low, given the country’s high spending. Thus, in 2009, the ratio of Greek
public spending to GDP was 54 per cent, according to the IMF»98.
Starting from that moment, the gap between the yields of German bund and the yields
on Greek (and other debtor countries as Italy, Spain and Portugal) bonds began to widen.
This shift was due to the fact that the yields on one country’s bond is strictly connected to
the degree of risk associated to that country: if one country’s economy has been severely hit
by the crisis the possibility that the Government could be insolvent, which is translated in
the prospect of losses for the investor, is higher than before the turmoil. Hence, higher risk
means higher yields and, in a vicious cycle, for the State it is even more expensive to
finance its debt. In fact, as could be depicted from Figure 2 above, after the Greek crisis the
spread between Greek bond over German bund reached almost 300 basis points99. On the
brink of bankruptcy, Greece called for external help, which came from the intervention of 95 Ibid. 96 Feenstra, R. C. & Taylor, A. M., 2014, International Economics, cit. p.843. 97 M. Wolf, The Shifts and the Shocks, cit. 98 Ivi p. 46. 99 M. Wolf, The Shifts and the Shocks, cit.

33
the so-called troika: the European Union, the European Central Bank, ECB, and the
International Monetary Fund, IMF, in April 2010100. The funds provided through the
intervention would have been dependent on the adoption of strong measures to be adopted
by the government in order to save the Greek disrupted economy: cut in the public spending
in the short run and structural reform in the long run.
However, Greece was not the only victim of the financial earthquake: Italy, Spain,
Portugal and Ireland (the so-called PIIGS) were in danger too. Ireland, whose economy had
been experiencing a real estate bubble, was the next and it was followed by Portugal, which,
on contrary, was not affected by an asset bubble but by many years of economic stagnation
and low level of growth101. In order to sustain those economies and to avoid a disaster that
would have endangered the whole European Union, the European Financial Stability
Mechanism, EFSM, (a fund financed by the Member States) and the European Financial
Stability Facility, EFSF, were established. They were financed through the support of the
other European Member States and through an innovative tool of the European Central
Banks: for the first time this institution intervened to help countries by buying their
government bonds102. Moreover, «funds of up to €60 billion from the EU budget provided a
theoretical credit line of up to €500 billion. A further sum of €250 billion was pledged by
the IMF»103. The announcement of these measures of intervention itself was enough to
temporarily heal the panic and to slow the rise of the spread, at least for a period of one
year, after which it began to rise again.
Even though Greece, Portugal and Ireland are three important European economies
their magnitude is not as much as heavy as the economies of the two countries hit in 2011:
Italy and Spain. The collapse of these two big countries would have endangered the stability
of all the European Union and, moreover, due to their size it would have been impossible
for the troika to save them as it had been done with the other States. As can be seen from
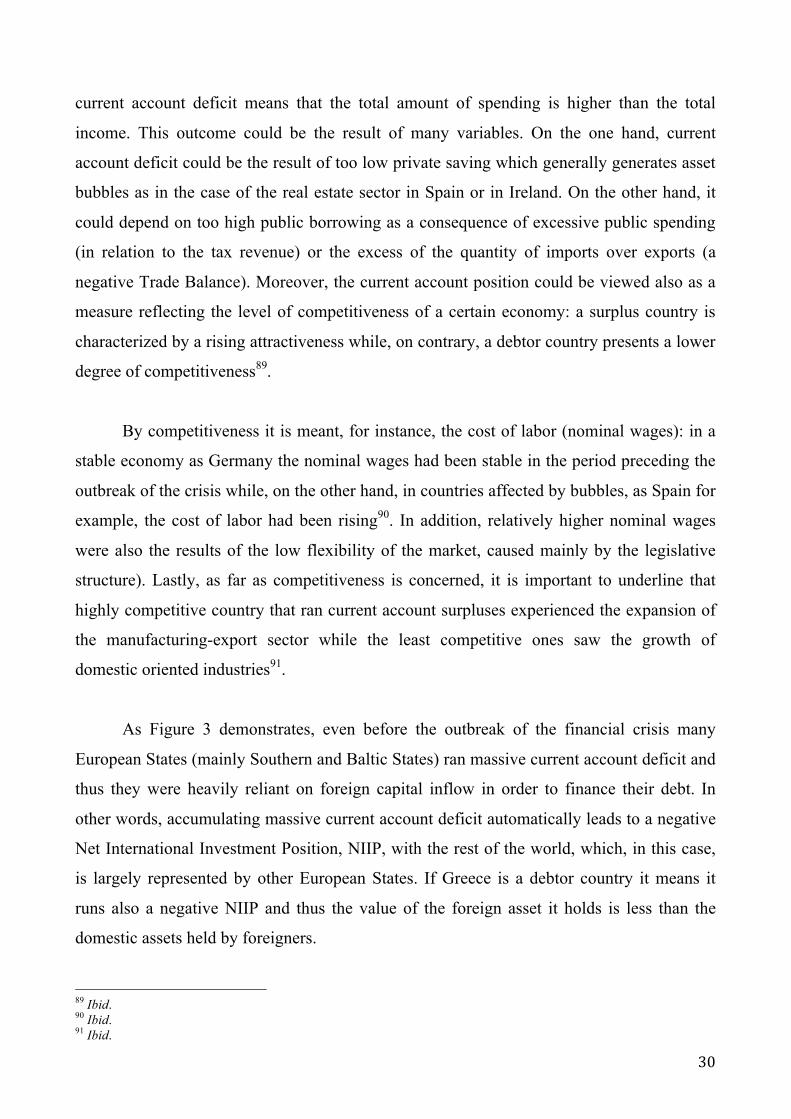
Figure 4, the spread between the yields of Italian and Spanish bond on the yields on German
100 Feenstra, R. C. & Taylor, A. M., 2014, International Economics, cit. 101 M. Wolf, The Shifts and the Shocks, cit. 102 Feenstra, R. C. & Taylor, A. M., 2014, International Economics, cit. 103 Ivi p.847.
34
bund started widening in the after May 2008 but the alarming gap took place starting from
2011.
Figure 5, EU Bond Yields, Source: The European Central Bank website (2013).
The issues of the management of the crisis in Italy, Spain, and Greece generated
domestic and European political tensions and struggles that questioned the unity of Europe.
The different European leaders advocated, and advocates, contrasting solution for the crisis
and the leverage are used on the basis of the balance of political and economic power.
Germany, as the greatest creditor has a strong say in any decision, for instance, and
proposes the strong line of austerity. This State, in fact, strongly opposes the idea of moral
hazard: this term indicated the behavior assumed by those individuals, or those States in this
case, who, knowing that they will not have to pay for their recklessness, will adopt an
irresponsible conduct104.
Cyprus was the fourth105 European country that asked and obtained external aid to
fight the crisis: in May 2013 the Extended Fund Facility was established106. This was not an
independent fund, but on the other hand it was parte of the newly created the European 104 M. Wolf, The Shifts and the Shocks, cit. 105 After Greece, Ireland and Portugal. 106 M. Wolf, The Shifts and the Shocks, cit.

35
Stability Mechanism, ESM, which replaced both the European Financial Stability
Mechanism and the European Financial Stability Facility. The Cyprus case is a very
interesting one because the way in which this country was helped presented two innovative
features: first, as far as the banking system is concerned, it was the first intervention that
resulted in losses on creditors and depositors; second, it was imposed a capital control over
the movement of euro across the border of the country107. The point is that the way in which
the Cypriot crisis was managed represented a watershed in the perception of the market
player. Cyprus demonstrated that «some euros were more equal than others»108, as Martin
Wolf pointed out quoting a metaphor used by George Orwell in his famous opera The
Animal Farm. In other words, investors began to understand that an euro deposit backed by
a strong sovereign state with a healthy economy was stronger, or better, safer than an euro
deposit backed by a weaker State: this simple change of mindset could have caused a series
of bank runs that would have further hindered the already catastrophic situation109.
1.3.3 The Management of the Crisis
The pressure on the banking system, especially those of the country most heavily hit
by the crisis, was becoming unsustainable and, moreover, the strong link of interdependency
between sovereign states and the former made investors very suspicious110. In order to avoid
any further deterioration of the situation, the European Central Bank decided to intervene at
the end of 2011 through a long-term refinancing operation, LTRO111. However, the side
effect of this program, that was supposed to ease the pressure on vulnerable systems, was
that many domestic banks used the funds coming from the ECB to buy sovereign debt, thus
further exacerbating the linkages with governments and irritating the investors. In this
scenario of increased instability and disorientation, in September 2012 the president of the
European Central Bank, Mario Draghi, delivered what would have become a famous speech
that radically changed the perception of the investors and of the European citizens. Here are
some important and significant part of his discourse: «The first message I would like to
send, is that the euro is much, much stronger, the euro area is much, much stronger than 107 Ibid. 108 M. Wolf, The Shifts and the Shocks, cit. p. 50. 109 M. Wolf, The Shifts and the Shocks, cit. 110 Ibid. 111 Ibid.
36
people acknowledge today. […] you see that as far as inflation, employment, productivity,
the euro area has done either like or better than US or Japan»112. Then he continued,
focusing specifically on the crisis: « When people talk about the fragility of the euro […]
and perhaps the crisis of the euro, very often non-euro area member states or leaders,
underestimate the amount of political capital that is being invested in the euro. […] Within
our mandate, the ECB is ready to do whatever it takes to preserve the euro. And believe me,
it will be enough»113. Due to this last sentence this speech delivered in London will become
famous as the whatever-it-takes speech. In addition, in in that occasion the president Mario
Draghi publicly launched the Outright Monetary Transaction program, OMT: it was
devised to buy their own sovereign bonds from suffering Member States 114. There result
was an augmented trust in the European institutions role: the ECB had committed itself and
had guaranteed the solvency of the Member States, thus lowering the risk of bank runs. The
confirm of this shift can be noticed also in Figure 2 and Figure 4 above: after September
2012 the gap between the yields of Southern European States’ bond and the yields on
German Bunds started decreasing, even though they did not reached the pre-crisis level.
What have began as a financial banking and sovereign debt crisis then, was quickly
transmitted to the real economy «through the so-called financial accelerator mechanism»115:
the dry-up of liquidity in the banking system and the decrease of capital inflow caused the
so-called credit crunch, that resulted in the fall of investment due extremely high cost of
capital. This dynamic triggered The Great Recession. And the Western economies,
especially the European Union, were the ones that suffered more because, as will be better
explained in the following lines, even though the rest of the world was hit too, it took less
time for other regions to return to the pre-crisis level of growth. Nevertheless, it is important
to examine the European recession, since it was precisely this downturn that magnified the
global crisis116. Thus, as far as the Eurozone is concerned, the fear of default of sovereign
states, the extremely high interest rates imposed by banks, and the impaired functioning of
112 Verbatim of the remarks made by Mario Draghi, The European Central Bank Website [Available online from: https://www.ecb.europa.eu/press/key/date/2012/html/sp120726.en.html]. 113 Ibid. 114 Feenstra, R. C. & Taylor, A. M., 2014, International Economics, cit. 115 Ibid. 116 M. Wolf, The Shifts and the Shocks, cit.
37
the monetary transmission channels frozen the economic systems117. The main effects of the
Great Recession were the following ones: economic recession and the stagnation which is
demonstrated by the fall of real GDP in many European Countries; the rapid increase of
unemployment rate (in all the region but mainly in Italy, Spain and Greece); the sharp
decrease of imports as a channel of transmission of the crisis to other region.
1.3.4 The Great Recession
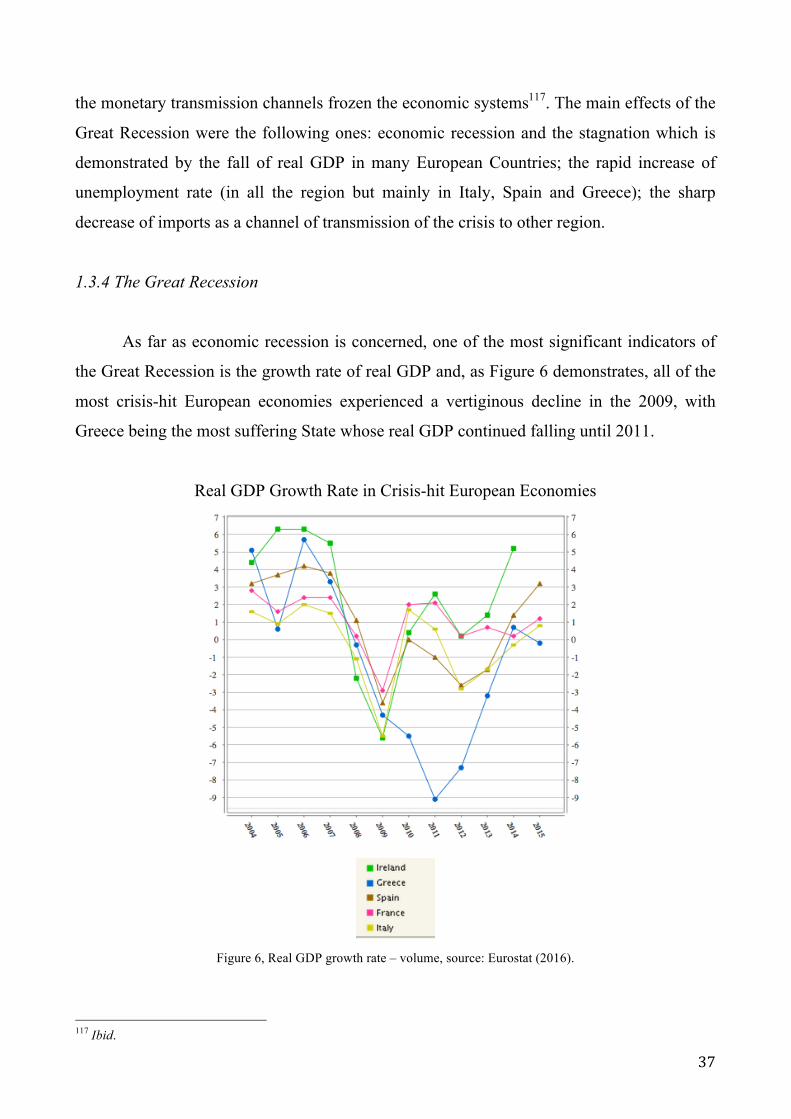
As far as economic recession is concerned, one of the most significant indicators of
the Great Recession is the growth rate of real GDP and, as Figure 6 demonstrates, all of the
most crisis-hit European economies experienced a vertiginous decline in the 2009, with
Greece being the most suffering State whose real GDP continued falling until 2011.
Real GDP Growth Rate in Crisis-hit European Economies
Figure 6, Real GDP growth rate – volume, source: Eurostat (2016).
117 Ibid.

38
The fall in GDP was due to the fact that the level of consumption in many countries
had reached, during the years, unsustainable levels118. The boom preceding the crisis had
pumped up prices, including wages, that made peripheral countries uncompetitive and that
could no longer be maintained once the artificially high demand started to fall
vertiginously119. Together with demand also prices started falling: house prices, asset prices,
firm values, the level of consumption and thus demand. Long story short, what this graph
shows is that the whole economy contracted.
As far as the falling unemployment rate is concerned, this rate is strictly connected to
the output level. Generally, as output fall the level of employment drop too due to lower
labor demand. As Figure 5 clearly shows, it was an authentic global crisis since not only
the European Union, but also the U.S. and Japan, experienced a huge increase of the
unemployment rate between the 2008 and 2010.
Unemployment Rate
Figure 5, Unemployment rate EU-28, EA19, US and Japan, seasonally adjusted January 2000 – January 2016, source:
Eurostat.
118 Feenstra, R. C. & Taylor, A. M., 2014, International Economics, cit. 119 Ibid.

39
As can be depicted from the graph, the unemployment rate was falling throughput the
world before the outbreak of the crisis in 2007. Then, starting from the first quarter of 2008,
we can see a steep increase in the rate, especially in the U.S. that, during the period between
2008 and 2009 reached the higher European level of unemployment. It is interesting to
notice the difference between the U.S. and Europe: after the end of 2009, in fact, the rate of
unemployment in the U.S. began to decrease while, on the other hand the one of EU
continued rising until the first quarter of 2014.
Lastly, as Figure 6 shows there was a decrease in imports between 2008 and 2009.
Development of International Trade Eu-28, 2004-2014
Figure 6, Development of international trade eu-28, 2004-2014
Source: Eurostat.
This fall was the main way in which the Recession was transmitted to other regions
of the world via a fall of their exports120. Since this topic is strictly connected with Global
Trade, it will be deeply analyzed in the following chapters, nevertheless, in order to have in
mind a broad picture it is important to contextualize it in the framework of the Great
Recession that is discussed in this paragraph. So, the fall in the volume of imports was part
of a general drop of consumption that resulted from both the credit crunch and the
extremely high unemployment rate. On one side, the steep drop of capital inflow made it
impossible to finance increasing volume of imports. On the other side, the phenomenon of
unemployment meant less disposable income for household, and thus, less consumption121.
120 Ibid. 121 Feenstra, R. C. & Taylor, A. M., 2014, International Economics, cit.
40
This was even truer for durable goods (refrigerators, cars, washing machines) that are
mainly imported products. Furthermore, these results were also magnified by the fact that
creditors states, led by Germany, the greatest creditor, had imposed the adoption of
important reforms and austerity programs in order to cut structural fiscal deficit to crisis-hit
States as conditions to obtain external aid122. In other words, even though fundamental
changes were necessary for those economies, the timing of their adoption was questionable.
Finally, in order to have a complete picture of the world economy, it is important to
underline that the rest of the world the effects of the crisis were way less catastrophic, or, at
least more concentrated in time 123 . More precisely, even though emerging market
experienced a fall in export in the years following the crisis, due to a fall in import of high-
income countries, their growth rate rapidly resumed. They had less connection with the
financial system and their banks did not hold the same volume of toxic assets124. It was the
case of Asia (Japan excluded) where the effect of the crisis were mitigated with an increase
in public spending; but it was also the case of South American, with the exception of
Mexico that was more connected to the American economy125.
To summarize and conclude, first the subprime bubble in the real estate sector in the
United States triggered the great financial crisis in the 2007: it was a system that could not
be sustained any more and when its basis tumbled it all fell apart. Due to the strict
connection between two of the most important financial centers, Wall Street and the City
(the London Stock Exchange) the shock was easily transmitted in Europe. The transmission
happened through two main channels: first, the newly created financial instruments (as CBO
and CDS) that were held by many of the most important European banks, lost most of their
value and where denominated toxic asset; second, the turmoil of the financial and banking
system caused the so called sudden stop or credit crunch. When the movement of capital
was frozen and liquidity dried-up, those European country that were heavily reliant on
capital inflow in order to finance their huge current account deficits found themselves on the
brink of bankruptcy. Moreover, as Wolf underlines, «the difficulties of Greece and the rest
122 M. Wolf, The Shifts and the Shocks, cit. 123 Feenstra, R. C. & Taylor, A. M., 2014, International Economics, cit. 124 Ibid. 125 Ibid.

41
of the vulnerable countries were take to be representative of the threats confronting high-
income countries outside the Eurozone. This […] justified the premature swing towards
austerity across the high-income countries in 2010 that has surely slowed the recovery»126.
Hence a shock that started as a financial crisis was transmitted to the real economy causing
the so-called Great Recession. Instability, uncertainty and fear do not obviously favor the
growth of trade and welfare. The end of liquidity, the so-called credit, crunch and the
austerity policies further slowed the growth of GDP and trade.
126 M. Wolf, The Shifts and the Shocks, cit., p.87.

42
CHAPTER TWO
THE GLOBAL TRADE COLLAPSE: CAUSES AND DYNAMICS
2.1 An Unprecedented Experience: Figures and Data
In a broad perspective, the Global Trade Collapse triggered by the financial crisis of
2007-2008 is one of the faces, the international one, of the Great Recession. Between the
third quarter of 2008 and the second quarter of 2009 international trade flows dramatically
collapsed: «world trade fell by 30 percent in nominal terms, and 18 percent in real
terms»127. But what happened in detail and what are the features of this destabilizing
phenomenon? What we mean with the expression “trade collapse”?
A comparison with the previous crises that affected the world economy together with
an accurate exam of figures, data, and graphs provided by the most recent literature about
the world crisis represents an effective way to understand the magnitude and the dynamics
of this event. Thus, the first paragraph of this chapter comprises an overview of the world
trade downturn’s feature in the years following the financial turmoil of 2007; the second
and the third paragraphs deal with the explanation of the causes and of the channels of
transmission that are at the basis of this downturn.
127 Chen, N. & Juvenal, L. (2016), Quality and the Great Trade Collapse, IMF Working Paper 16/30.

43
2.1.1 Comparison with Previous Crisis
Richard Baldwin, editor of the book The Great Trade Collapse: Causes,
Consequences and Prospects, defined this crucial event with three words: «sudden, severe
and synchronized»128. Nevertheless, it is not the first time in economic history that such a
destabilizing phenomenon shook international stability since the worldwide economy
experienced four main crises in the last century:
1. The Great Depression that started in the autumn of the 1929, triggered by the
stock-exchange crisis
2. The oil crisis of the early seventies, caused by the turmoil in the Middle East
that resulted in an increase of oil prices
3. The recession of 1982-1983 that was, from a certain perspective, the collateral
effect of the policies adopted by the neo-liberal leaders in order to fight the
increasing inflation
4. The so-called dot com bubble (named in this way since the crisis concerned the
drop in equity value in the internet sector) of 2001-2002
However, none of the above-mentioned crises was simultaneously so sudden, so
severe, and so synchronized as the one of 2008129. More specifically, the most recent crisis
was not the greatest one by the quantitative criterion of the absolute volume of trade
collapse but, on contrary, its peculiarity lies in the qualitative aspect. Strictly speaking the
Great Depression, for instance, was larger in terms of drop in the volume of world trade, but
the Trade Collapse of 2008 was sharper, it was an unique phenomenon: this is demonstrated
by the fact that «It took 24 months in the Great Depression for world trade to fall as far as it
fell in the 9 months from November 2008»130. While Figure 1 clearly shows the slump in
merchandise export from 1950 to 2012, Figure 2 shows a significant difference between the
2008 trade collapse and the Great Depression.
128 Baldwin, R., 2011, The Great Trade Collapse: Causes, Consequences and Prospects, A VoxEU.org Publication. 129 Ibid. 130 Baldwin, R., 2011, The Great Trade Collapse: Causes, Consequences and Prospects, cit. p.2.
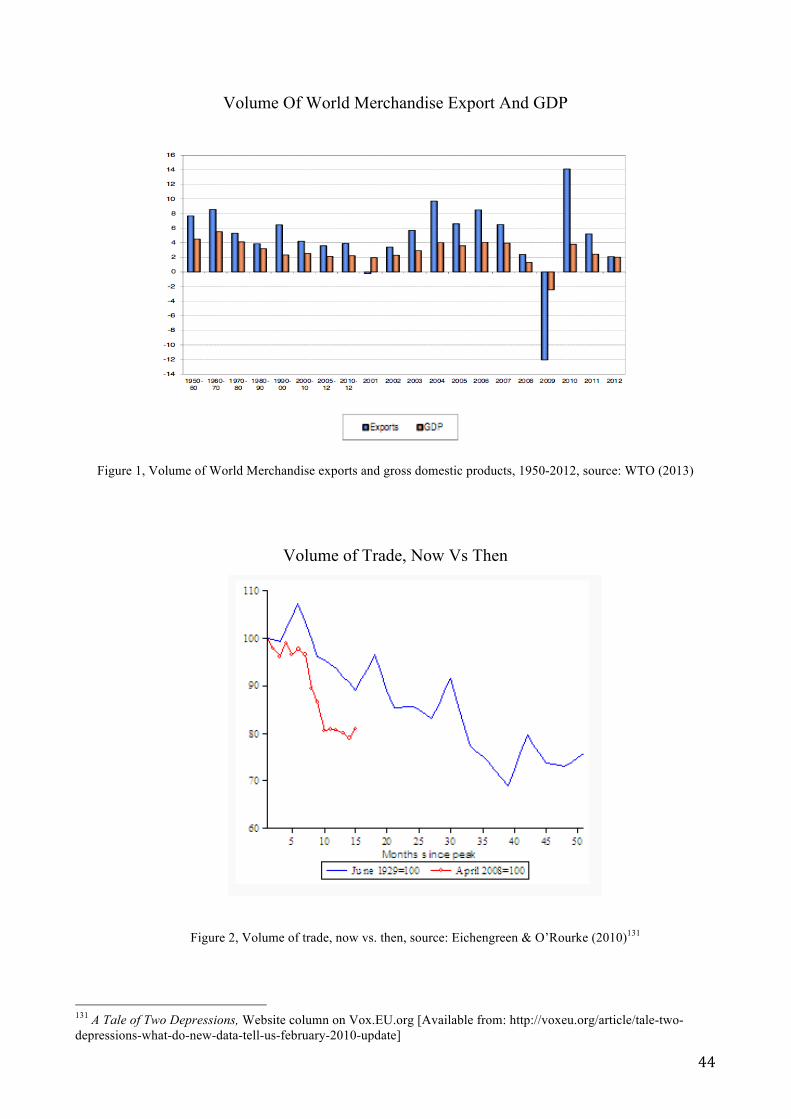
44
Volume Of World Merchandise Export And GDP
Figure 1, Volume of World Merchandise exports and gross domestic products, 1950-2012, source: WTO (2013)
Volume of Trade, Now Vs Then
Figure 2, Volume of trade, now vs. then, source: Eichengreen & O’Rourke (2010)131
131 A Tale of Two Depressions, Website column on Vox.EU.org [Available from: http://voxeu.org/article/tale-two-depressions-what-do-new-data-tell-us-february-2010-update]

45
Comparing the two world-trade crises of 1929 and 2008 is useful to fully
comprehend the peculiarities of the current scenario. Surprisingly, according to professor
Kevin O’Rourke, there are more differences than similarities between the Great Depression
and the Current Crisis. As far as correspondences are concerned, what these two events have
in common is the fact that they had been transmitted through trade flows, capital flows and
commodity prices132.
On the other hand, as mentioned above, world trade fell much more rapidly in the
first year of the current crisis, mainly due to a greater elasticity of trade with respect to
production. The higher elasticity, as O’Rourke pointed out, is explained by the growth of
vertical specialization (which will be the focus of the next chapter) and by the difficulty to
obtain trade finance during the credit crunch133 . Lastly, one of the most important
differences has its roots in the international monetary system: flexible exchange rates
fostered a greater willingness to run budget deficit in the current crisis while in the ‘30s
those countries that did not abandoned the Gold Standard (e.g. France) could not use the
tool of expansionary monetary policy134. This explains why these countries retreated to
protectionism: in the ‘30s, for instance, some, very few, maintained free trade (e.g. the
United Kingdom) and some retreated to protectionism (e.g. the United States). However, it
is important to remember that, even nowadays, countries with currency boards or with
substantial foreign-currency denominated debt or countries pegging their currency to others
cannot use freely monetary policies.
2.1.2 Explaining the Gap between the fall of World Trade and the fall of GDP
Moving on to the features of Global Trade Collapse, it is interesting to notice the
huge gap between the fall of world trade and the fall of world GDP. The research question
is: why the difference between the drop of global trade and the decline of world GDP was
so huge? This dynamic is not a prerogative of the current crisis but, on contrary, as Caroline
Freund pointed out, it characterized also the previous economic crisis mentioned above: the
132 Findlay R. & H. O'Rourke K. H., 2007, Power and Plenty: Trade, War, and the World Economy in the Second Millennium, Princeton University Press. 133 Ibid. 134 Ibid.
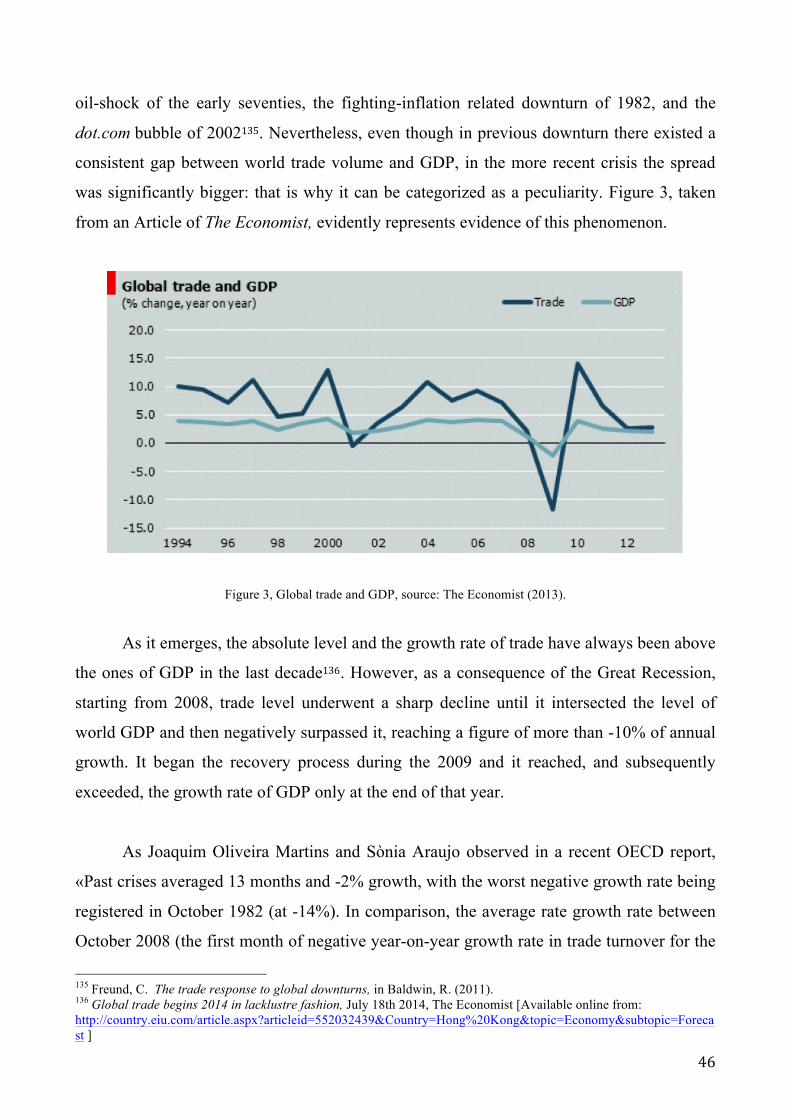
46
oil-shock of the early seventies, the fighting-inflation related downturn of 1982, and the
dot.com bubble of 2002135. Nevertheless, even though in previous downturn there existed a
consistent gap between world trade volume and GDP, in the more recent crisis the spread
was significantly bigger: that is why it can be categorized as a peculiarity. Figure 3, taken
from an Article of The Economist, evidently represents evidence of this phenomenon.
Figure 3, Global trade and GDP, source: The Economist (2013).
As it emerges, the absolute level and the growth rate of trade have always been above
the ones of GDP in the last decade136. However, as a consequence of the Great Recession,
starting from 2008, trade level underwent a sharp decline until it intersected the level of
world GDP and then negatively surpassed it, reaching a figure of more than -10% of annual
growth. It began the recovery process during the 2009 and it reached, and subsequently
exceeded, the growth rate of GDP only at the end of that year.
As Joaquim Oliveira Martins and Sònia Araujo observed in a recent OECD report,
«Past crises averaged 13 months and -2% growth, with the worst negative growth rate being
registered in October 1982 (at -14%). In comparison, the average rate growth rate between
October 2008 (the first month of negative year-on-year growth rate in trade turnover for the
135 Freund, C. The trade response to global downturns, in Baldwin, R. (2011). 136 Global trade begins 2014 in lacklustre fashion, July 18th 2014, The Economist [Available online from: http://country.eiu.com/article.aspx?articleid=552032439&Country=Hong%20Kong&topic=Economy&subtopic=Forecast ]

47
23 OECD economies) and June 2009 was -25%. Such drops in nominal trade values are
considered rare events. Of the 534 months from January 1965 to June 2009, trade growth
was negative in only one-sixth of the months»137. Figure 4 below unmistakably reflects this
reality. As can be depicted from the graph, the Great Recession was deeper and more
prolonged than the others.
Trade, Year-On-Year Growth Rates, January 1965 To June 2009138
Figure 4, Trade’s Growth rate from January 1965 to June 2009. Source: Baldwin (2011) Figure 1, p. 101.
Nevertheless aggregate figures could be misleading because if we take into
consideration the data relative to individual countries, we discover that for each economy a
collapse of such magnitude was not that unique. What has been extraordinary and
unprecedented for the world economy as a whole was not completely new for individual
countries. Here are some data used by Oliveira Martins and Araujo to support this thesis:
«In July 1993 France’s total trade decreased by 23% relative to its value in July 1992. In the
same year, trade declined by more than 20% in January and in July in Italy, and in
Germany, with Italy registering four more months of negative trade growth below 20%. In
Japan, trade dropped by approximately 25% relative to the same month in the previous year
[…]. In the US, trade dropped by 34% and 24% in January 1965 and 1969, respectively»139.
137 Martins, J.O. & Araujo, S., The Great Synchronisation: tracking the trade collapse with high-frequency data, in Baldwin (2011), p. 102. 138 Ibid. 139 Martins, J.O. & Araujo, S., The Great Synchronisation: tracking the trade collapse with high-frequency data, in Baldwin (2011), pp. 102-103.

48
Figure 5, represents in a graph these figures relative to France, Italy, Germany, Japan and
the US.
Trade Downturns For Selected OECD Economies
Figure 5, Trade Downturn for selected OECD countries, source: Araujo, S. & Martins O. J. (2009)140
Thus, as these figures suggest, individual countries experienced, throughout the last
decades, a series of economic downturns that are comparable (or even bigger), in a
quantitative term, to the aggregate fall of world trade of 2008-2009. Then, why can we
define this case as an unprecedented phenomenon? The answer, according to the authors141,
is: due to synchronicity.
140 Araujo, S. & Martins O. J. (2009), The Great Synchronization: what do high-frequency data statistics tell us about the trade collapse?, VoxEu.org, 8 July 2009 [Available from: http://voxeu.org/article/great-synchronisation-trade-crisis-2008-2009] 141 Ibid.

49
2.1.3 The Synchronicity Effect
What made such an astounding plummet possible was the fact that trade dropped
simultaneously in most of the OECD countries: this phenomenon is called the synchronicity
effect. It was the fact that so many countries experienced a decline in the growth rate of
trade at exactly the same time that made the Great Recession so severe and so gigantic.
Synchronicity explains the world trade collapse. As Baldwin underlines: «All 104 nations
on which the WTO reports data experienced a drop in both import and export during the
second half of 2008 and the first half of 2009. […] World trade in almost every product
category was positive in 2008Q2, almost all were negative in 2008 Q4 and all were negative
in 2009Q1»142. Those data are distinctly illustrated in Figure 6 below in which the graph
represents the volume of exports and imports (the trade flows) of ten nations and of the
European Union (composed by 27 Member States at the time is which this chart was
elaborated), a group of States that accounts for about 75% of world trade143.
Figure 6, Quarter-on-quarter Growth, Exports & Imports 11 Major Traders, Source: Baldwin (2011) Figure 3, p.3.
142 Baldwin, R., 2011, The Great Trade Collapse: Causes, Consequences and Prospects, cit. 143 Ibid.

50
Each country’s volume of exports and imports dropped by more than 20% in the
period between the end of 2008 and the second quarter of 2009.
Some authors144 refers to this phenomenon as the Great Synchronization since,
according to the data «(d)rops in exports growth of more than 10% occurred in more than
90% of the OECD countries in seven out of the nine months since the beginning of the
‘trade crisis’ (Oct 2008 – June 2009). On the import side, all OECD countries have
registered negative growth values of more than 10% since January through to June
2009»145. Figure 7 and 8 below portrays the Great Synchronization in the fall of both
exports and imports. Each line represents the percentage of OECD countries that
experienced a monthly year-on-year growth rate of trade that is: a) negative; b) under -5%;
under 10%, respectively146.
Import Growth Rates
Figure 7, The Great Synchronization: percentage of countries with negative import value growth, source: Araujo, S. &
Martins O. J. (2009)
144 Araujo, S. & Martins O. J. (2009), The Great Synchronization: what do high-frequency data statistics tell us about the trade collapse? Cit. 145 Martins, J.O. & Araujo, S., The Great Synchronization: tracking the trade collapse with high-frequency data, in Baldwin (2011), pp. 102-103. 146 Araujo, S. & Martins O. J. (2009), The Great Synchronization: what do high-frequency data statistics tell us about the trade collapse? Cit.

51
Export Growth Rates
Figure 8, The Great Synchronization: percentage of countries with negative export value growth, source: Araujo, S. &
Martins O. J. (2009)
According to Araújo and Martins, the ultimate cause of synchronization is
globalization itself147. As a result of a process that has began centuries ago with the British
Industrial Revolution, which radically improved productivity and drastically cut transport
costs, the world economy is now fully integrated. Globalization brought countries closer
than they were and global trade extraordinarily increased. Nevertheless, the fact that all the
major traders of the world economy were highly integrated with each other cause a negative
domino effect: the economic recession in one country meant the fall of the volume of
consumption and production and, thus, less imports; this, in turn, was translated in a fall in
export for its trading partner. Hence, trade flow can be considered one of the most relevant a
channel of transmission of the shock.
In addition, there existed a synchronicity not only in terms of volume of trade flows,
but also in terms of the kinds of products that experienced a drop148. Specifically, both the
trade and the value of agricultural goods, processed foods, manufacturers, minerals, and oil,
experienced a steep fall starting from the third quarter of 2008. Nevertheless, it is important
to take into consideration that the trade collapse did not affect the different sectors of 147 Ibid. 148 Ibid.
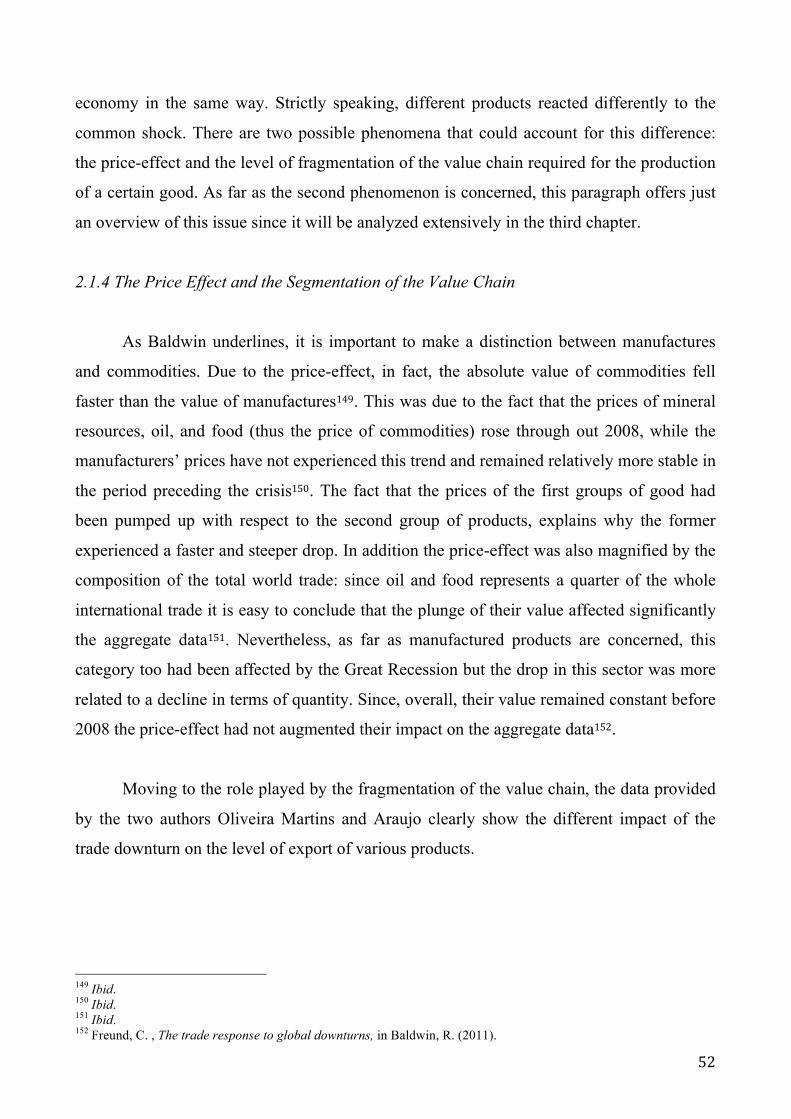
52
economy in the same way. Strictly speaking, different products reacted differently to the
common shock. There are two possible phenomena that could account for this difference:
the price-effect and the level of fragmentation of the value chain required for the production
of a certain good. As far as the second phenomenon is concerned, this paragraph offers just
an overview of this issue since it will be analyzed extensively in the third chapter.
2.1.4 The Price Effect and the Segmentation of the Value Chain
As Baldwin underlines, it is important to make a distinction between manufactures
and commodities. Due to the price-effect, in fact, the absolute value of commodities fell
faster than the value of manufactures149. This was due to the fact that the prices of mineral
resources, oil, and food (thus the price of commodities) rose through out 2008, while the
manufacturers’ prices have not experienced this trend and remained relatively more stable in
the period preceding the crisis150. The fact that the prices of the first groups of good had
been pumped up with respect to the second group of products, explains why the former
experienced a faster and steeper drop. In addition the price-effect was also magnified by the
composition of the total world trade: since oil and food represents a quarter of the whole
international trade it is easy to conclude that the plunge of their value affected significantly
the aggregate data151. Nevertheless, as far as manufactured products are concerned, this
category too had been affected by the Great Recession but the drop in this sector was more
related to a decline in terms of quantity. Since, overall, their value remained constant before
2008 the price-effect had not augmented their impact on the aggregate data152.
Moving to the role played by the fragmentation of the value chain, the data provided
by the two authors Oliveira Martins and Araujo clearly show the different impact of the
trade downturn on the level of export of various products.
149 Ibid. 150 Ibid. 151 Ibid. 152 Freund, C. , The trade response to global downturns, in Baldwin, R. (2011).
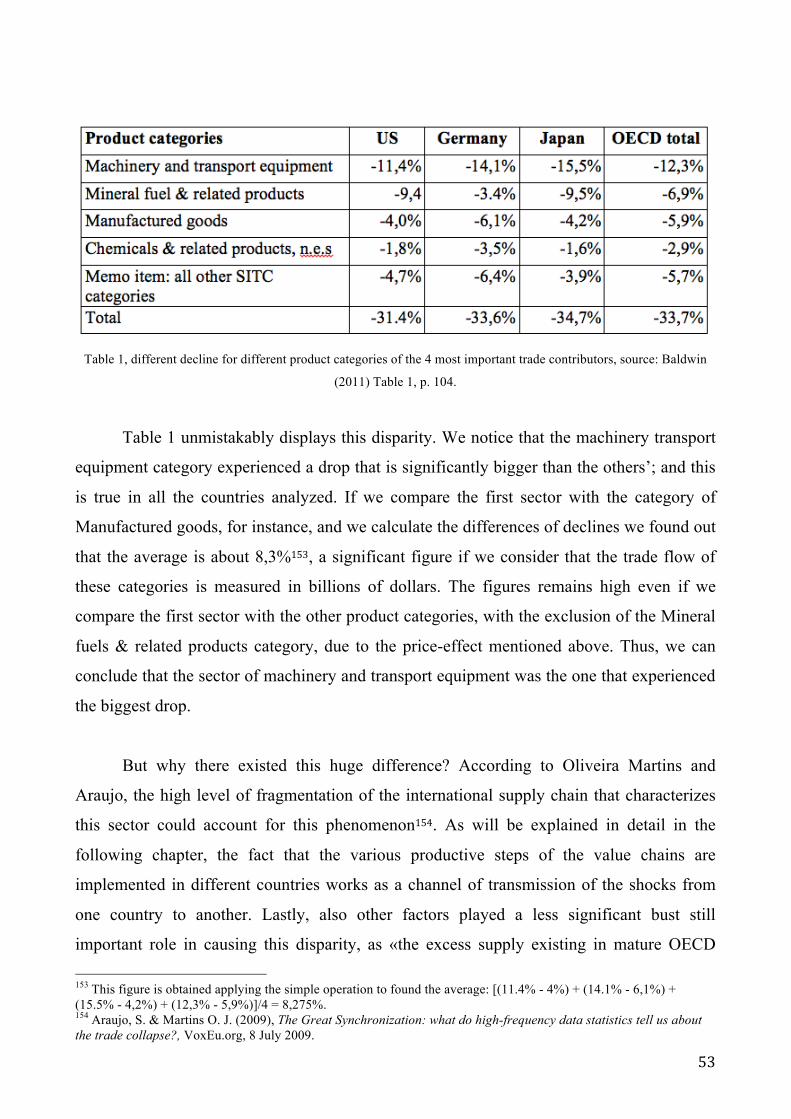
53
Table 1, different decline for different product categories of the 4 most important trade contributors, source: Baldwin
(2011) Table 1, p. 104.
Table 1 unmistakably displays this disparity. We notice that the machinery transport
equipment category experienced a drop that is significantly bigger than the others’; and this
is true in all the countries analyzed. If we compare the first sector with the category of
Manufactured goods, for instance, and we calculate the differences of declines we found out
that the average is about 8,3%153, a significant figure if we consider that the trade flow of
these categories is measured in billions of dollars. The figures remains high even if we
compare the first sector with the other product categories, with the exclusion of the Mineral
fuels & related products category, due to the price-effect mentioned above. Thus, we can
conclude that the sector of machinery and transport equipment was the one that experienced
the biggest drop.
But why there existed this huge difference? According to Oliveira Martins and
Araujo, the high level of fragmentation of the international supply chain that characterizes
this sector could account for this phenomenon154. As will be explained in detail in the
following chapter, the fact that the various productive steps of the value chains are
implemented in different countries works as a channel of transmission of the shocks from
one country to another. Lastly, also other factors played a less significant bust still
important role in causing this disparity, as «the excess supply existing in mature OECD 153 This figure is obtained applying the simple operation to found the average: [(11.4% - 4%) + (14.1% - 6,1%) + (15.5% - 4,2%) + (12,3% - 5,9%)]/4 = 8,275%. 154 Araujo, S. & Martins O. J. (2009), The Great Synchronization: what do high-frequency data statistics tell us about the trade collapse?, VoxEu.org, 8 July 2009.

54
automobile markets, as well as the end of a technological product cycle in the automotive
industry»155.
2.2 The causes of Global Trade Collapse: negative demand-shock downturn, trade-credit
crunch and high trade costs
This section explores the functional connections between the credit crunch that
resulted from the financial downturn and the collapse of international trade flows of 2008-
2009. As far as the channels of transmission are concerned, today the economic literature is
producing an emerging consensus about the causes of this collapse: a negative demand-
shock downturn, a trade-credit crunch, and high trade costs. Each of these will be examined
in the following lines.
2.2.1 The Negative-demand Shock pt.1: Durables goods
For what concerns the negative demand-shock, according to Richard Baldwin, this
international trade downturn «operated through the drop in the production and export of
manufactured goods due to a decline in the general level of consumption and demand156.
According to the author, what made the difference with the previous crises was the Lehman
Brothers accident: the fact that one of the five most important investment banks was not
bailed out created in the market the belief that the situation was becoming more and more
out of control157. It was the occurrence of this single event that created the so-called «fear
factor»158, that triggered the “wait and see” behavior of consumers and investors that froze
the market and thus trade. This was due to the fact that the behavior of consumers depends
not only on the actual economic conditions but also on the consumers’ perception of the
economic environment. This explains why Baldwin judged the LB disaster as a pivotal
moment, because even though there was no structural change in the world economy before
and after the collapse of the bank, what this event changed was the perception of markets 155 Martins, J.O. & Araujo, S., The Great Synchronization: tracking the trade collapse with high-frequency data, in Baldwin (2011), p. 105. 156 Ibid. 157 Ibid. 158 Baldwin, R., 2011, The Great Trade Collapse: Causes, Consequences and Prospects, cit. p. 10.

55
and consumers that decided to adopt the “wait and see” strategy159. Hence, fear and
uncertainty froze domestic and international market. More precisely « the crisis has had an
heterogeneous effects on traded goods differentiated by quality»160. In other words, in time
of economic downturn, consumers began to postpone the purchase of durable and high
quality goods (e.g. cars, refrigerators, machineries). For this reason, and as the chart (Figure
9) below demonstrates, the consumption, and thus demand, of durables is more volatile than
demand of non-durable goods (fuel, food, packaging, personal products).
Growth rate of Consumption
Figure 9, Growth rate of consumption of durables and non-durables. Source: Reserve Bank of Australia161
The darker line represents the growth rate of consumption of non-durable goods and,
as it can be easily depicted, it remains relatively stable during time. On contrary, the lighter
line denotes the rate of growth of durables/postponeables that, compared with its
counterpart, is extremely more volatile. In addition, the sector of high-quality goods has
been hit too since these products «are typically more income elastic than lower quality
goods [thus] trade in higher quality goods fell to a larger extent during the crisis»162. This
thesis is confirmed by Chen and Juvenal analysis of Argentinian wine trade flows reported
159 Baldwin, R., 2011, The Great Trade Collapse: Causes, Consequences and Prospects, cit. p. 10. 160 Chen, N. & Juvenal, L. (2016), Quality and the Great Trade Collapse, cit. p.3 161 Black, S. & Cusbert T., ( 2010) Durable Goods and the Business Cycle, Reserve Bank of Australia [Available from: http://www.rba.gov.au/publications/bulletin/2010/sep/2.html] 162 Chen, N. & Juvenal, L. (2016), Quality and the Great Trade Collapse, cit. p.3.

56
in the IMF working paper Quality and the Great Trade Collapse: «Higher quality wine
export to the US and the UK fell to a large extent during the crisis. In nominal terms […], a
unit increase in quality reduced export growth from its pre-crisis level by 11.2 percentage
points for the US […], and by 7.3 percentage points fore the UK. »163.
The immediate result of the “wait and see” behavior, was a drop in the volume of
trade in durables, but the collateral effects that spread from this initial drop was even wider:
the fall in the demand, and thus production, of the related intermediate inputs164. Using an
example could be useful to grasp the dynamic behind this process. The standard durable
good used in many explanations is the car since it could be defined as an item that produces
utility for a prolonged-medium time and that is not fully exhausted in one use. When the
economy is stagnating or worse it is declining and there are not buoyant perspectives of
growth usually people postpone the purchase of durables. Thus, using the example of the
car, even though it could be out of fashion, even though its performance could be lower than
before, even though new, more efficient versions are released in the market, the consumer
tends to delay the purchase of a new automobile. In addition, a declining demand of cars
does not affect only the car industry but also steel, plastic and electronic industries, for
instance. And, eventually, even companies producing machineries for the processing of
these materials will be hurt. The same logic applies to washing-machines, refrigerators,
mobile-phones. Hence, a profound drop in demand of durable goods has a wide-range
negative spillover. In fact, as the two authors Francois and Woertz pointed out, «the
recession has been hardest on heavy manufacturing – machinery, vehicles, and related raw
materials. This has translated into a deep manufacturing recession, and a correspondently
deep drop in trade»165.
The four graphs below (Figure 10) clearly shows the steep decline in automobile
production in four different OECD countries in the period of the crisis.
163 Chen, N. & Juvenal, L. (2016), Quality and the Great Trade Collapse, cit. p.21. 164 Ibid. 165 Francois, J. F. & Woerz, J., Follow the bouncing ball – trade and the great recession redux, in Baldwin (2011).

57
GDP and Automobiles Production Growth
Figure 10, GDP and automobiles production growth, quarter-on-quarter growth rates. Source: OECD166
Following the Great Recession that started in 2008 the automobile industry was
badly hit by the drop in demand of durables. In the U.S. the rate of production growth
passed -2.5%, while in Japan it reached -3.5%; the decline was less severe in the two
European countries, France and Germany but still production declined by more than 2% and
1.5%, respectively.
Moreover, it is interesting to notice that the negative-demand shock that affected
mainly the durable goods category played a pivotal role in explaining why world trade
dropped more than GDP. The connection is given by the so-called compositional effect:
«postponeables make up a narrow slice of world GDP, but a very large slice of world trade.
[…] the common cause of GDP and trade collapse – a sudden drop in the demand for
postponeables – operated with full force on trade but diminished force on GDP due to the
compositional difference. The large demand shock applied to the near-totality of trade while
only applying to a thin portion of GDP»167. In other words, as the chart below shows,
international trade is principally based on the movement of durables/manufactured goods.
166 The Autombile Industry in and Beyond the Crisis, OECD [Available online from: https://www.oecd.org/eco/outlook/44089863.pdf] 167 Baldwin, R., 2011, The Great Trade Collapse: Causes, Consequences and Prospects, cit. p. 7.
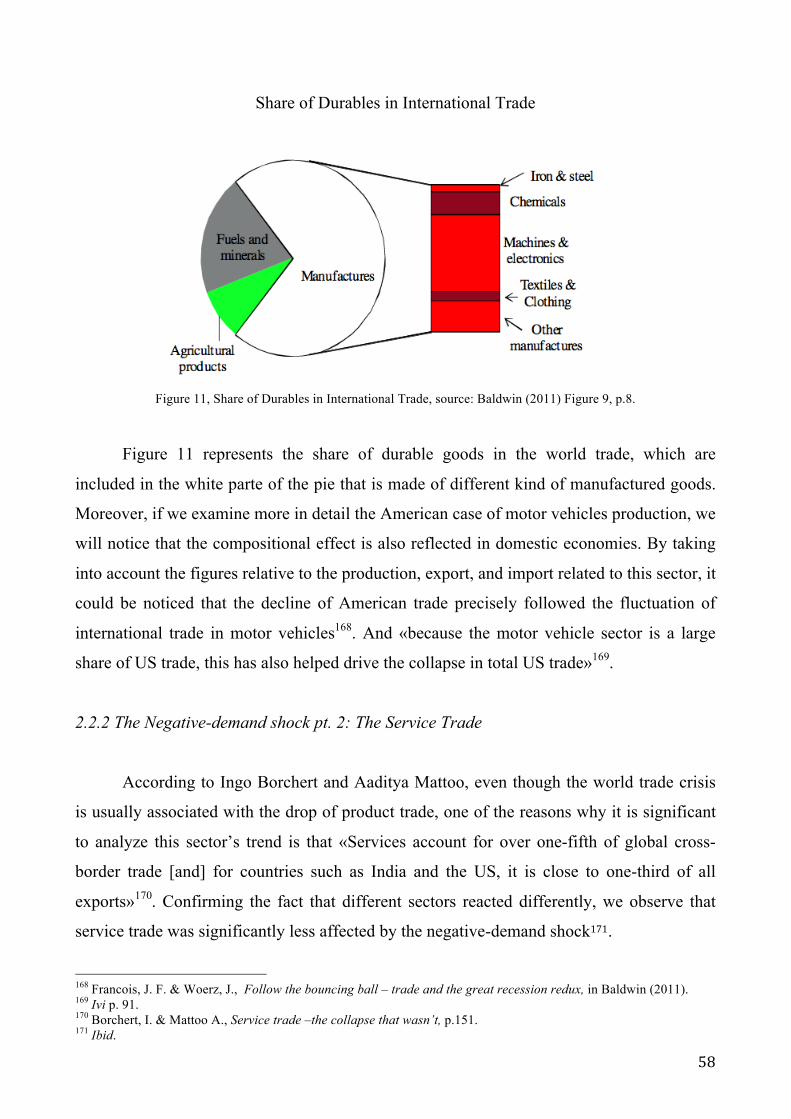
58
Share of Durables in International Trade
Figure 11, Share of Durables in International Trade, source: Baldwin (2011) Figure 9, p.8.
Figure 11 represents the share of durable goods in the world trade, which are
included in the white parte of the pie that is made of different kind of manufactured goods.
Moreover, if we examine more in detail the American case of motor vehicles production, we
will notice that the compositional effect is also reflected in domestic economies. By taking
into account the figures relative to the production, export, and import related to this sector, it
could be noticed that the decline of American trade precisely followed the fluctuation of
international trade in motor vehicles168. And «because the motor vehicle sector is a large
share of US trade, this has also helped drive the collapse in total US trade»169.
2.2.2 The Negative-demand shock pt. 2: The Service Trade
According to Ingo Borchert and Aaditya Mattoo, even though the world trade crisis
is usually associated with the drop of product trade, one of the reasons why it is significant
to analyze this sector’s trend is that «Services account for over one-fifth of global cross-
border trade [and] for countries such as India and the US, it is close to one-third of all
exports»170. Confirming the fact that different sectors reacted differently, we observe that
service trade was significantly less affected by the negative-demand shock171.
168 Francois, J. F. & Woerz, J., Follow the bouncing ball – trade and the great recession redux, in Baldwin (2011). 169 Ivi p. 91. 170 Borchert, I. & Mattoo A., Service trade –the collapse that wasn’t, p.151. 171 Ibid.

59
The Resilience of Service Trade In The U.S.
Figure 12, US Monthly Imports and Exports of Goods and Services, January 2006 – February 2009, source: Borcher &
Mattoo (2009) Figure 1, p. 2172.
Figure 12 shows the relative stability of service trade in the United States: the two
upper lines correspond to the value of the imports and exports of goods, respectively, while
the others represent the value of services imports and exports. As can be depicted from the
graph, the absolute level of trade in goods has always been significantly higher than the
value of trade in services. However, what is noteworthy is the relative percentage of drop of
the two sectors: during the recent crisis the level of trade in goods experienced a steeper and
more prolonged decline in comparison with the latter, as the different slope of the curves
demonstrate. Starting from July 2008, both the lines of imports and exports presented a
negative and steep slope, until at least January 2009. On the other hand, the slope of service
trade remained considerably more stable (flat in this case) also during the worst period of
the crisis. Moreover, this trend is not just a prerogative of the American scenario: also data
relative to the other OECD countries and Indonesia, Brazil, Russia, South African and India
«does not contradict the picture of relative resilience of services trade emerging from US
data»173.
172 Borchert, I. & Mattoo A (2009) The crisis Resilience of Service Trade, World Bank Policy Research Working Paper, No. 4917. 173 Borchert, I. & Mattoo A., Service trade – the collapse that wasn’t, p.153.

60
Nevertheless, the service sector is not perfectly homogeneous and not all the different
sub-categories reacted in the same way to the external shock. As the authors pointed out,
«Within services, trade in goods-related transport services and crisis-related financial
services shrank, as did expenditure on tourism abroad. But trade in a range of business,
professional, and technical services remained largely unscathed»174. The two following
graphs (Figure 13 and 14) represent the heterogeneity of growth rate of imports and exports
of different types of services in the United States.
Figure 13, US growth rate of import services, source: Baldwin (2011) Figure 1, p. 152.
Figure 14, US growth rate of import services, source: Baldwin (2011) Figure 2, p.152.
From these two charts it is possible to see the disparity of percentage declines in the
various sub-categories of services. Interestingly, travel and transport services (which are
goods-related services) dropped almost as much as trade in goods (both in imports and
174 Ivi p.151.

61
exports), and transport service fared the worst, relative to the other categories. More
precisely: «international transport shrank by 39% (on an annual basis) between peak and
through»175. It is easy to comprehend the rationale behind this pattern: since a huge share of
transport service is strongly connected to the trade of physical products (e.g. shipping
service), a decline import and exports of goods resulted in a decline of services related to
this sector. Overall, the sub-category of Other
Private Services, OPS, was the one that suffered the
crisis less since it «declined by only 7% on both the
import and the export sides»176. This group includes
financial services, Insurance, Telecommunication
services, Business and Professional services (with
percentage showed by the graph in Figure 15). It was
precisely this class of services that made it possible
the resilience of services during the crisis balancing
the steep drop of goods-related services177.
There are two prerogatives of the sector that help explaining service trade stability:
on the one hand, service are less dependent on external finance; on the other, this sector is
less prone to demand-side shocks178. For what concern the first characteristic, the reason of
lower dependence on finance is that «in stark contrast to the manufacturing sector,
tightening credit conditions are not constraining the production and export of services»179
for three reasons:
1. Many services are sold, purchased and distributed via the internet and thus there
is no need for trade finance;
2. The fact that usually in this sector payments are made in advance contributes to
lower the dependency tie from external finance;
175 Borchert, I. & Mattoo A., Service trade – the collapse that wasn’t, p.152. 176 Ivi. 177 Bochert, I. & Mattoo, A. (2009), The Crisis-Resilience of Services Trade, World Bank Policy Research Working Paper, No. 4917, April 2009. 178 Ibid. 179 Ibid.

62
3. In most instances service sector’s industries tend to have a low level of debt
because « working capital is predominantly financed by retained earnings or, for
start-ups, through venture capital»180.
On the other hand, as far as vulnerability to demand-side shocks is concerned, there
are three main explanations for this peculiarity:
1. In contrast with goods, and especially durable goods, services are not storable
and, thus, they are less prone to demand contraction;
2. The use of certain services by firms is less discretionary (a business can postpone
the purchase of a new machinery while it can not avoid the processing of claims);
3. Interpersonal business relationships that are behind service trade seem to be
particularly long and stable.
2.2.3 The Trade-credit Crunch
The second and the third causes of the Global Trade Collapse are strictly related with
each other and are: the trade-credit crunch and the rise in trade costs. However it is
important to underline that these forces played only a marginal level in the explanation of
Global Trade Collapse since the ultimate reason was that «trade fell because firms sold less
of products that they were already selling»181. Nevertheless, knowing how the different
forces operated is important to deeply understand the steep drop in international trade and
the pace of the subsequent recovery. First it is important to establish what it is meant by
trade financing. Strictly speaking, the term refers to the way in which exporters fund their
activity. To have a perception of the magnitude of this flow it is sufficient to say that, in
2008, «(w)orld wide, firms exported about $16 trillion of goods»182. As the Figure 16 below
shows, the range of different instruments of trade financing goes from the least secure (the
riskiest for the exporter) to the safest tool (the least risky to the exporter). By another term,
the various instruments of trade finance are nothing more than the different forms of
payment.
180 Bochert, I. & Mattoo, A. (2009), The Crisis-Resilience of Services Trade,p. 16. 181 Baldwin, R., 2011, The Great Trade Collapse: Causes, Consequences and Prospects, cit. 182 Mora, J. & Powers, W., Did trade credit problems deepen the great trade collapse? in Baldwin (2011) cit. p.116.
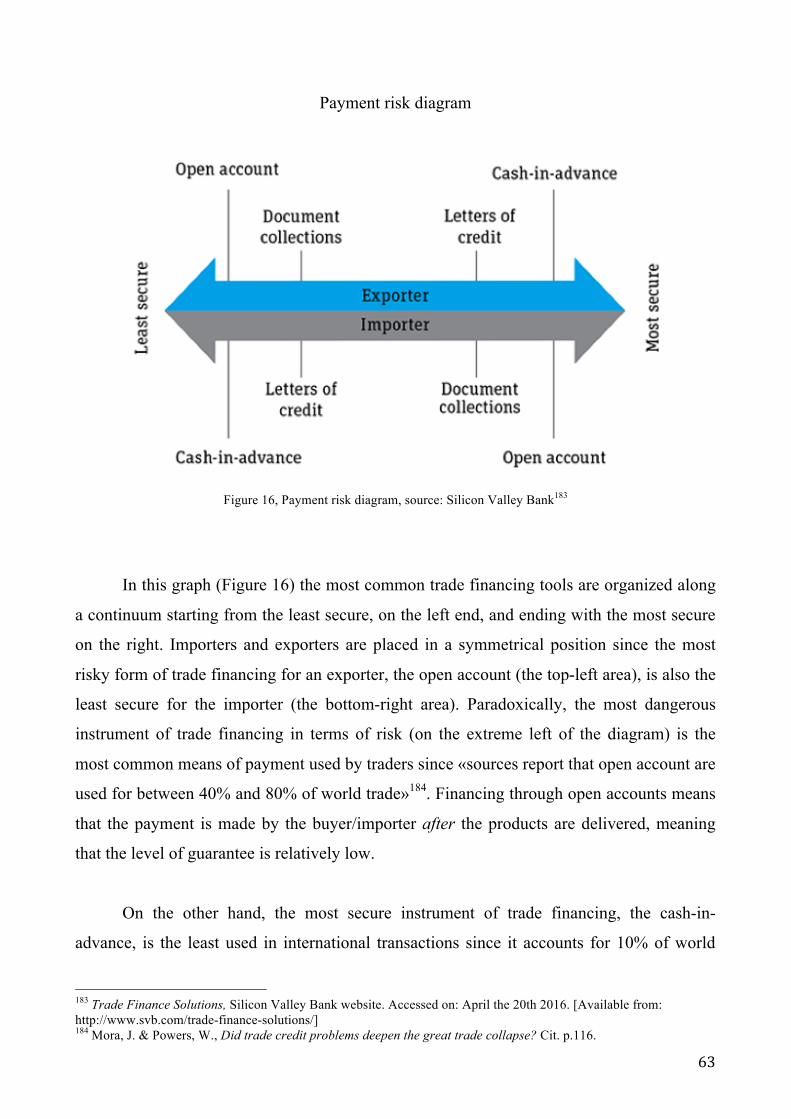
63
Payment risk diagram
Figure 16, Payment risk diagram, source: Silicon Valley Bank183
In this graph (Figure 16) the most common trade financing tools are organized along
a continuum starting from the least secure, on the left end, and ending with the most secure
on the right. Importers and exporters are placed in a symmetrical position since the most
risky form of trade financing for an exporter, the open account (the top-left area), is also the
least secure for the importer (the bottom-right area). Paradoxically, the most dangerous
instrument of trade financing in terms of risk (on the extreme left of the diagram) is the
most common means of payment used by traders since «sources report that open account are
used for between 40% and 80% of world trade»184. Financing through open accounts means
that the payment is made by the buyer/importer after the products are delivered, meaning
that the level of guarantee is relatively low.
On the other hand, the most secure instrument of trade financing, the cash-in-
advance, is the least used in international transactions since it accounts for 10% of world
183 Trade Finance Solutions, Silicon Valley Bank website. Accessed on: April the 20th 2016. [Available from: http://www.svb.com/trade-finance-solutions/] 184 Mora, J. & Powers, W., Did trade credit problems deepen the great trade collapse? Cit. p.116.

64
trade185. When parties decide to use this tool the importer pays for the goods before they are
delivered. The other intermediates instruments are the letters of credit and its counterpart,
the documentary collections, that together represent the remaining share of world trade and
that involve banking activities. The former is «a transaction in which a bank assumes the
non-payment risk by committing to pay the exporter after goods have been shipped or
delivered»186. This is a stronger form of guarantee for the exporter since in this way he
hedge him/herself against the risk of non-payment. In addition, if we consider trade
financing from a broader perspective also working-capital loans provided by banks can be
considered a form of trade financing. These loans are necessary when a producer/exporters
needs funds to buy the intermediate inputs necessary to produce the final products ordered
by the importer, since the payment made by the importer is not immediate. Lastly,
independently from the form of trade financing used, the exporter could decide to protect its
investment by buying an insurance to lower the risk187.
After having explained what are the most diffused forms of trade financing, it is now
important to understand the effects of global credit crunch on them. In order to analyze the
impact of limited credit availability on trade flow the authors Mora and Powers started from
a simple, logic consideration: since «all exports must be financed, if only by exporter
itself»188 thus «the global reduction in trade financing must match the global reduction in
exports»189. Hence, in order to measure the degree of the impact of credit-crunch on trade
financing it is useful to compare the drop in credit available to trade with the global trade
collapse. The more they are related the stronger is the causal connection between them. The
first data that we have to consider is the level of nominal global merchandise exports, which
is represented in Figure 17 below.
185 Ibid. 186 Ibid. 187 Ibid. 188 Mora, J. & Powers, W., Did trade credit problems deepen the great trade collapse? Cit. pp.115-116. 189 Ivi.
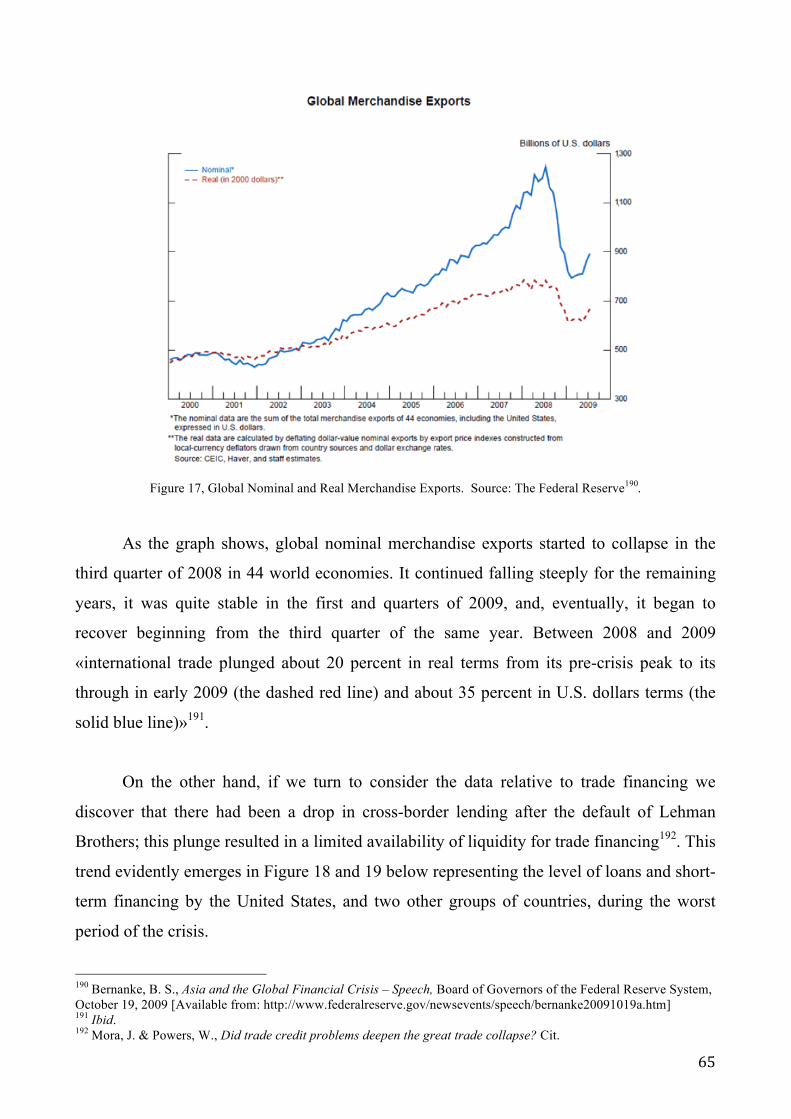
65
Figure 17, Global Nominal and Real Merchandise Exports. Source: The Federal Reserve190.
As the graph shows, global nominal merchandise exports started to collapse in the
third quarter of 2008 in 44 world economies. It continued falling steeply for the remaining
years, it was quite stable in the first and quarters of 2009, and, eventually, it began to
recover beginning from the third quarter of the same year. Between 2008 and 2009
«international trade plunged about 20 percent in real terms from its pre-crisis peak to its
through in early 2009 (the dashed red line) and about 35 percent in U.S. dollars terms (the
solid blue line)»191.
On the other hand, if we turn to consider the data relative to trade financing we
discover that there had been a drop in cross-border lending after the default of Lehman
Brothers; this plunge resulted in a limited availability of liquidity for trade financing192. This
trend evidently emerges in Figure 18 and 19 below representing the level of loans and short-
term financing by the United States, and two other groups of countries, during the worst
period of the crisis.
190 Bernanke, B. S., Asia and the Global Financial Crisis – Speech, Board of Governors of the Federal Reserve System, October 19, 2009 [Available from: http://www.federalreserve.gov/newsevents/speech/bernanke20091019a.htm] 191 Ibid. 192 Mora, J. & Powers, W., Did trade credit problems deepen the great trade collapse? Cit.

66
Loans Received
Figure 18, Level of loans received. Source: Baldwin (2011) Figure 3, p. 119.
Short-term Financing
Figure 19, Short-term Financing Received. Source: Baldwin (2011) Figure 4, p.119.
What emerges from these two graphs is that both the levels of loans and of short-term
financing received, dropped in the first quarter of 2008. Thus, the fall of credit availability
took place earlier than the decline in global merchandise exports. While the first diagram
represents the level of working-capital loans that, as mentioned above, is a slightly indirect
form of trade financing. On the other hand, short-term financing can be considered more
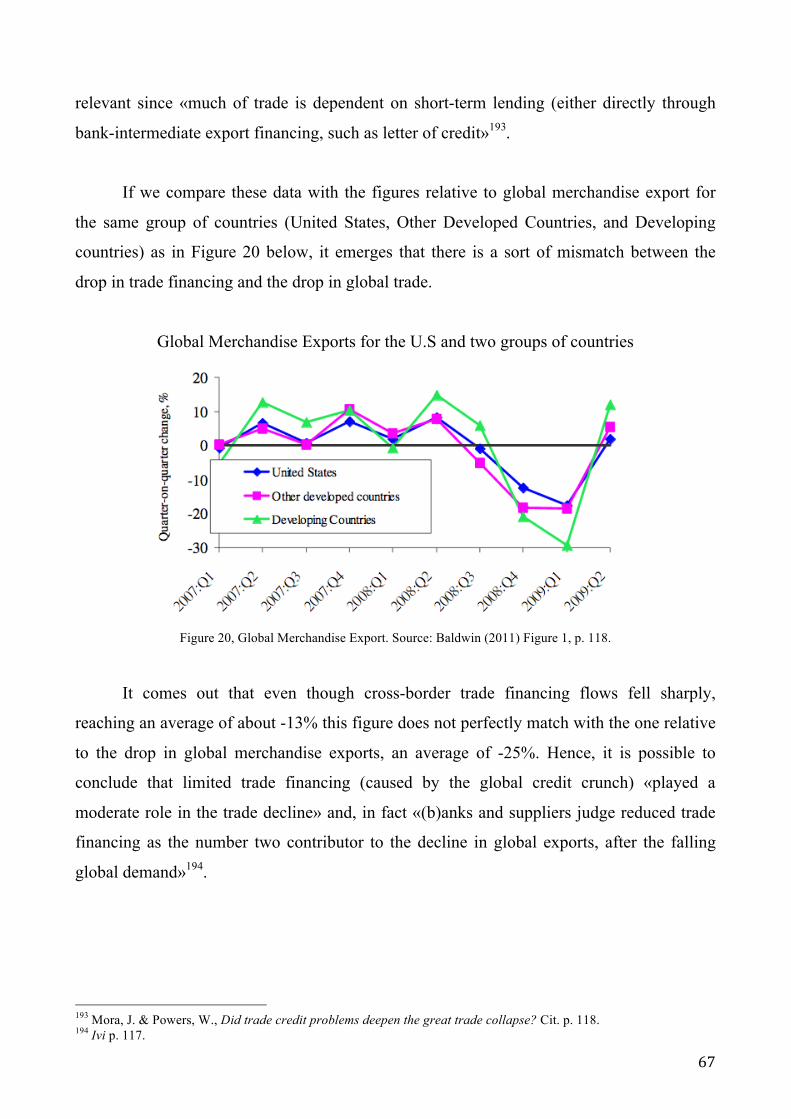
67
relevant since «much of trade is dependent on short-term lending (either directly through
bank-intermediate export financing, such as letter of credit»193.
If we compare these data with the figures relative to global merchandise export for
the same group of countries (United States, Other Developed Countries, and Developing
countries) as in Figure 20 below, it emerges that there is a sort of mismatch between the
drop in trade financing and the drop in global trade.
Global Merchandise Exports for the U.S and two groups of countries
Figure 20, Global Merchandise Export. Source: Baldwin (2011) Figure 1, p. 118.
It comes out that even though cross-border trade financing flows fell sharply,
reaching an average of about -13% this figure does not perfectly match with the one relative
to the drop in global merchandise exports, an average of -25%. Hence, it is possible to
conclude that limited trade financing (caused by the global credit crunch) «played a
moderate role in the trade decline» and, in fact «(b)anks and suppliers judge reduced trade
financing as the number two contributor to the decline in global exports, after the falling
global demand»194.
193 Mora, J. & Powers, W., Did trade credit problems deepen the great trade collapse? Cit. p. 118. 194 Ivi p. 117.

68
2.2.4 High Trade Costs
The third, and last, cause of global trade collapse is the increase of trade cost that, as
mentioned above, is strictly connected with the scarce availability of trade financing.
Strictly speaking, this trend depended on the relation between supply and demand of trade
funds: the amount of capital available for trade financing (the supply of capital) was lower
than the demand of exporters (demand of capital). Hence, as one of the most basic economic
rules teaches, when the demand of a certain good is higher than its supply the price rises.
Or, under another perspective, it is possible to consider the price as an index of the scarcity
of a certain good. This is precisely what happened as a result of the global credit crunch. As
Mora and Powers underlines, in fact, «the cost of trade financing195 […] briefly reached
several hundred basis point (bp) in some market, reflecting abnormally high financing costs
throughout the financial system during the fourth quarter of 2008»196. According to the
authors, in order to measure the shortage of capital available for trade financing it is useful
to consider the index of export credit insurance exposure in the short term, which is
guaranteed mainly by four country: the United States, Germany, France, and Italy. Figure
21 below shows the trend of this index197.
Export credit insurance exposure in the short-term
Figure 21, Export credit insurance exposure in the short term. Source: Baldwin (2011) Figure 5, p. 120.
195 A cost that is conventionally measured as a percentage of the value of the delivered products. 196 Mora, J. & Powers, W., Did trade credit problems deepen the great trade collapse? Cit. p. 118. 197 Ibid.

69
As the graph reflects, different countries’ export credit insurance exposure started to
decline in the first quarter of 2008, until it reached its limit of -15% at the beginning of
2009. This pattern symbolizes the scarce availability of capital for trade financing. A trend
that is confirmed by the results of a survey supported by the International Monetary Fund,
and by the World Trade Organization that reveals that «Most surveyed banks (47& to 71%
depending on the survey) reduced the supply of trade financing in the last quarter of 2008.
For example, the value of letters of credit fell 11% in that quarter as prices on those
instruments rose»198. Moreover, if we add to this phenomenon a decline of exporters’ trust
in the global market that resulted in an increased demand for insurances, the outcome is
higher trade financing cost and thus higher trade costs in general. And, in fact, according to
the survey, «Increased demand and reduced supply combined to drive trade financing prices
higher during the crisis»199.
2.3 The link between the banking Crisis and the Great Trade Collapse
In this paragraph is presented a deeper focus on the link between banking crises,
exporters, and the negative demand-shock (one of the three causes of the international trade
collapse examined above). More specifically, the two authors Leonardo Iacovone and
Veronica Zavacka, tried to understand whether the global trade collapse has been the result
of a financially-triggered supply shock or it was caused by a general drop in demand200.
Since the whole analysis evolves around the export sector, the underlying question is: was
the export declined ultimately triggered by the credit crunch or by a fall of demand? What is
the role played by the dependency on external finance?
2.3.1 Exporters and the Supply-side
As far as the supply-side is concerned, it is important to start from this consideration:
even tough financial crises have an overall negative impact on all producers, the category of
198 Mora, J. & Powers, W., Did trade credit problems deepen the great trade collapse? Cit. p. 122. 199 Ibid. 200 Iacovone, L. & Zavacka, V., Banking crises and exports: Lessons from the past for the recent trade collapse, in Baldwin (2011).

70
exporters is subjected to more serious reverberations201. This is due to the fact that «in
addition to production costs, (they) have to face the additional expense of penetrating
foreign markets (and) because international transactions normally involve higher working
capital requirements and default risks»202. In addition, as it will be examined in the
following lines, the export industry is also dependent on import demand of other countries.
Hence, when it comes to estimate the impact of a financial and credit crisis on exporters it is
fundamental to take into account the degree of the exporter’s dependence on external
finance to finance its business. A company that could rely on tangible assets and that has a
consistent internal cash flow that can support its activity will be less prone to financial
shocks203. The natural consequence is that in case of credit crunch more dependent business
will experience a slower growth-rate of exports. As emerged from Figure 22 and Figure 23
below, this is exactly what happened given the data relative to the examined last 23 banking
crises from 1980 to 2000204.
Growth Rate and Dependency From External Finance
Figure 22, Growth Rate and Dependency From External Finance, source: Iacovone, L. & Zavacka, V. (2009)205
201 Ibid. 202 Iacovone, L. & Zavacka, V., Banking crises and exports: Lessons from the past for the recent trade collapse, in Baldwin (2011), p. 107. 203 Iacovone, L. & Zavacka, V. (2009) Banking crises and exports: Lessons from the Past, Policy Research Working Paper Series 4723, The World Bank, Washington, D.C. 204 Ibid. 205 Iacovone, L. & Zavacka, V. (2009) Banking crises and exports: Lessons from the Past, Vox.org. [Available from: http://voxeu.org/article/banking-crises-and-exports-lessons-past]

71
This diagram confirms that in the previous banking crisis highly-dependent export
companies (e.g. exporter of machineries) experienced a negative growth-rate of export, and
that there was a significant difference with the performance of more independent exporters
(e.g. exporter of footwear)206.
Growth Rate and Tangible Assets Endowment
Figure 23, Growth Rate and Tangible assets Endowment, source: Iacovone, L. & Zavacka, V. (2009)207
On the other hand, what emerges examining this second graph is that if a company
was well endowed with tangible assets (represented by the left column), it had maintained
relatively higher level of export growth in comparison with business characterized by low
tangibility. Hence the internal cash flow played an important role in protecting export
industries by the most severe effect of banking crisis. Obviously exporters that are heavily-
reliant on external finance are the ones that are less endowed with tangible assets and that
are thus more prone to external financial shocks. While the opposite is true for companies
that can rely on inter-firm finance to sustain their commercial activities.
2.3.2 Exporters and the Demand-side
Turning to the demand-side effects on exports, the analysis of Iacovone and Zavacka
confirms the conclusion of the previous paragraphs: the overall impact of a fall of demand is
that it magnified the effect of the credit crunch. This is due to the fact that «when a banking
206 Ibid. 207 Iacovone, L. & Zavacka, V. (2009) Banking crises and exports: Lessons from the Past, Vox.org. [Available from: http://voxeu.org/article/banking-crises-and-exports-lessons-past]

72
crisis is simultaneously accompanied by a drop in demand, the exporters are hit twice»208.
This result is crucial because it explains the difference between the previous crisis and the
current one that triggered the Global Trade Collapse. More precisely, the past financial
downturns were not associated with a general decline in demand of the majority of
countries. What happened was that, in general, the level of consumption, and thus demand,
fell in the home countries of exporters but remained steady in their import counterparties.
This dynamic made it possible for exporter to compensate the negative effect of the crises
on their production. On contrary, what happened after the financial crisis of 2007-2008 was
that demand dropped across the world and, therefore, export companies could not
compensate their losses. In addition, Figure 24 below shows how company’s exports
reacted to negative-demand shocks depending on the degree of dependency on external
finance. The graph confirms that the more a company relies on external finance the more it
would suffer a negative demand-shock.
Percentage of Export Drop in Response to Demand Shocks
Figure 24, Export collapse in response to demand-shock. Source: Baldwin (2011) Figure 1, p. 109.
To conclude, in common banking crisis exporters that are heavily dependent on
external finance are more vulnerable in case of financial crisis, meaning that credit
restrictions caused slowly export growth. However, what happened for the first time in the
economic history was that there was a simultaneous demand shock across countries that 208 Ibid.

73
subtracted the trade finance channel from exporters and thus magnified the negative effect
of the crisis on this sector.

74
CHAPTER THREE
THE AMPLIFIER OF THE CRISIS: THE ROLE OF THE
INTERNATIONAL SUPPLY CHAIN
3.1 Understanding the International Supply Chain
As various authors pointed out209, the International Supply Chain has been one of the
main transmission channels of the shock generated by the financial crisis and the Great
Recession. Before analyzing the dynamics behind this phenomenon, however, it is
important to define what is meant by the term International Supply Chain, whose synonyms
are also or Global Value Chain or, more in general, Vertical Linkages.
3.1.1 What is the Value Chain?
First of all, every kind of manufactured good requires a process that involves
different activities in order to be produced. The sum of these various “productive steps” is
called Value Chain since it is the procedure that leads to the final value of the good210. The
most common activities of this process that are involved in the production of the great
209 Baldwin (2011), Yi (2009), and Araujo & Martins (2009) among others. 210 Feenstra, R. C. & Taylor, A. M., 2014, International Economics, 3rd Edition, Worth Publishers.

75
majority of goods, are showed in Figure 1 below that represents a simple version of the
Value Chain.
Value Chain Ranked by Production Order
Figure 1, Value Chain ranked by production order. Source: Feenstra & Taylor (2014, Figure 7-1, p. 200)
Here the various steps are ranked by production order. Starting from the left-end,
R&D stands for Research and Development of the product and involves inquiries,
experiments, tests, and prototypes, for instance. Following the line there is the Component
production, and the assembly phase. Finally, there are the marketing and sales activities that
include, for instance, the promotion activity, the launch of the product, its placement in the
market, and the distribution of the final goods. Those diverse activities could be
implemented either domestically, in the home country of the producer, or, conversely,
abroad. Usually, if we take into account a manufacturing firm that is placed in a developed,
high-income country we will notice that the entrepreneur will decide to carry out certain
activities in a foreign country where wages are lower than they are in its home country.
Figure 2 below is helpful to explain this dynamic.
Value Chain Ranked by Level of Expertise
Figure 2, Value Chain ranked by level of expertise. Source: Feenstra & Taylor (2014) Figure 7-1, p. 200.
76
Here the various productive steps are ranked by the level of skill required for their
implementation: from low-skill to high-skill. In addition, the track is divided by a vertical
line that separates the kind of activities that are commonly carried out abroad from the ones
that are implemented at the domestic level211. What made it possible the implementation of
part of the production process abroad in the first place was precisely the process of
globalization that brought about the kind of innovations that ultimately cut transport costs
and extremely facilitated long-distance communications212. But why should producers slice
the production chains and outsource part of the process? The answer is that, as «Economic
theory predicts […] if the production process of a final good can be segmented, then
opportunities for economies of scale or scope may exist. In such a case, slicing the value
chain into smaller segments leads to more efficient production, especially when done in an
international context, due to wider differences in factor endowments and comparative
advantages»213.
A firm that offshores part of its activity is slicing its value chains214, and its decision
to offshore part of its productive process is based of three main criteria:
1. The cost of labor: a company considers the relative wages, which, usually, are
lower in developing countries.
2. The cost of capital, which is usually higher in Foreign developing countries due
to:
i. «Higher prices to build a factory or higher prices for utilities such as
electricity or fuel
ii. Extra costs involved in transportation and communication, which will be
especially high if Foreign is still developing roads, ports, and telephone
capabilities […]
iii. Extra costs from tariffs if Foreign imposes taxes on goods (such as
components parts) when they come into the country»215.
211 Keeping in mind that it is assumed that home is a developed, high-income country while abroad/foreign is assumed to be a developing, low-income country. 212 Findlay R. & H. O'Rourke K. H., 2007, Power and Plenty: Trade, War, and the World Economy in the Second Millennium, Princeton University Press. 213 Escaith, H. & Gonguet, F., (2011) International Supply Chains as Real Transmission Channels of Financial Shocks, The Capco Institute Journal of Financial Transformation, cit. p. 84. 214 Feenstra, R. C. & Taylor, A. M., 2014, International Economics, 3rd Edition, Worth Publishers, cit.

77
3. Transport/shipment costs, which are related to oil prices, transportation facilities,
distance, etc.
Turning to the fragmentation of the supply chain, the procedures placed before the
vertical line does not require a high level of expertise: starting from the extreme left, in fact,
there are the productive steps of assembly and component production. Those activities are
commonly carried out abroad, generally in developing or emerging countries not only
because they do not require a high level of expertise but also because of lower production
costs: since wages are lower216 in this category of countries labor force cost less for the
producer. Conversely, the activities placed after the vertical line requires a higher level of
expertise, they are: Marketing/Sales and Research & Development, which necessitates high-
skilled workers. Hence, these parts of the productive process are carried out domestically.
Furthermore, it is interesting to notice that, together with vertical linkages, there are also
important transversal connections since «(s)ome services industries, such as financial
services or transport services will be part of almost all value chains. (And e)xtractive and
raw material industries are also likely to be at the beginning of most manufacturing
GVCs»217.
3.1.2 The Determinants of the Global Value Chain
The position of the vertical line can shift leftward or rightward depending on changes
of all the relevant factors that have an impact on the production costs218. An increase in
transportation costs, for instance, could discourage the producer to offshore part of its
activities, but also the variation of foreign or domestic supply or labor (thus, the change in
the relative wage) plays a crucial role in determining where each part of the chain takes
place219. Moreover, not only the position of the vertical line can change, but also the length
215 Feenstra, R. C. & Taylor, A. M., 2014, International Economics, 3rd Edition, Worth Publishers, cit. p. 201 216 According to Krugman, P. R. & Maurice Obstfeld (2008), poorer countries have lower wages in tradables because of lower productivity. 217 Miroudot S. & De Backer K.,Working Party of the Trade Commitee (2012) Mapping Global Value Chains, The OECD Conference Centre, Paris. 218 Feenstra, R. C. & Taylor, A. M., 2014, International Economics, cit. 219 Ibid.

78
of the global value chain itself may change depending on industries’ characteristics. Figure
3 below shows the various lengths of GVCs.
Length of Global Value Chain by Industries
Figure 3, Length of GVC by Industries (2008). Source: Miroudot & De Backer (2012) Figure 1, p. 15.
Broadly speaking, international supply chains in which manufacturing industries are
involved are generally longer than others’ (like services, for instance). Still, overall, as a
general rule «(o)ptimal chain length is […] determined by the trade-off between the gains to
specialization and the higher failure rate associated with longer chain length»220.
But how much does the Global Value Chain weigh on each country’s economy? In
order to measure the importance of vertical linkages, the OECD Working Party of the Trade
Committee determined the level of OECD and non-OECD countries’ involvement in
220 Escaith, H. & GOnguet, F., (2011) International Supply Chains as Real Transmission Channels of Financial Shocks, The Capco Institute Journal of Financial Transformation, cit. p. 84.

79
vertically fragmented production by measuring «the share of foreign inputs and
domestically produced inputs used in third countries’ exports»221 . Figure 4 below
represents the participation index of OECD countries registered 2008, while Figure 5
reports the same index for non-OECD countries. It is interesting to notice that small open
economies as Luxembourg, South Korea, Slovak Republic and Belgium, for instance, are
characterized by an high level of vertical integration. Due to the size of their economies
«they source more inputs from abroad and produce more inputs used in GVCs than large
countries such as the United States or Japan (where due to the size of the economy, a larger
share of value chain is domestic […])»222.
Participation index – OECD Countries
Figure 4, Participation Index in OECD countries (2008). Source: Miroudot & De Backer (2012) Figure 1, p. 12.
221 Miroudot S. & De Backer K., Working Party of the Trade Commitee (2012) Mapping Global Value Chains, The OECD Conference Centre, Paris, cit. p. 11. 222 Ivi p. 12.
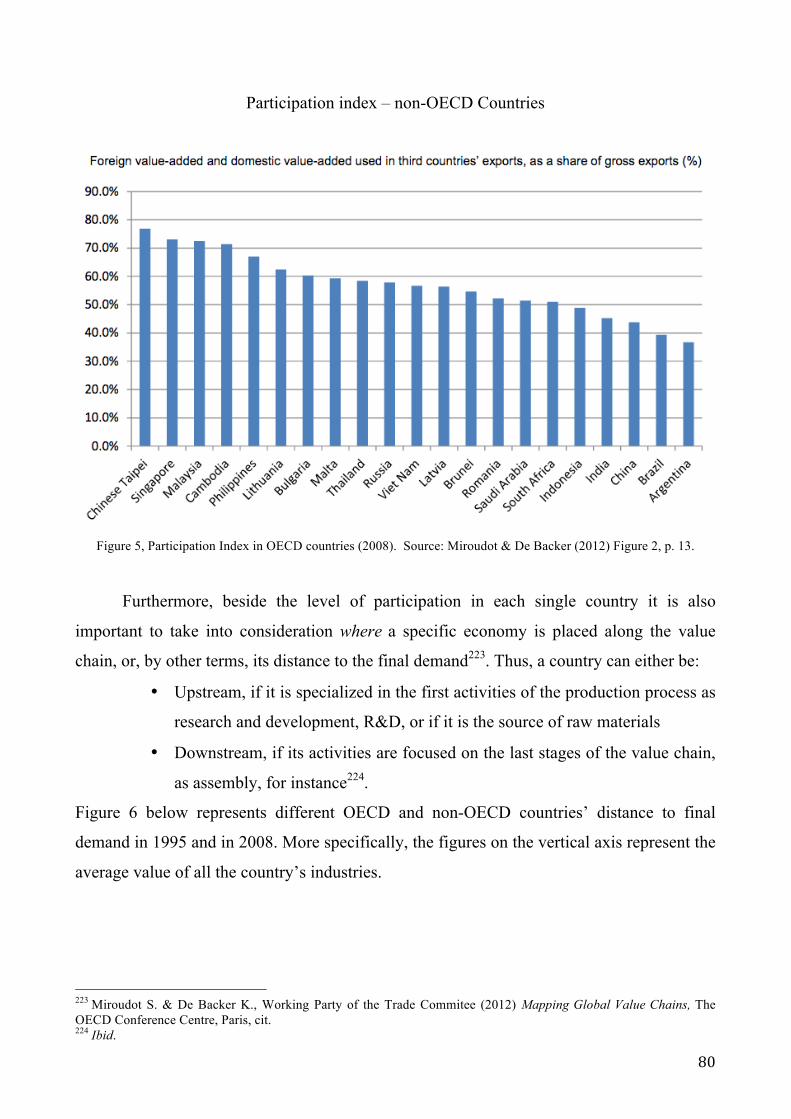
80
Participation index – non-OECD Countries
Figure 5, Participation Index in OECD countries (2008). Source: Miroudot & De Backer (2012) Figure 2, p. 13.
Furthermore, beside the level of participation in each single country it is also
important to take into consideration where a specific economy is placed along the value
chain, or, by other terms, its distance to the final demand223. Thus, a country can either be:
• Upstream, if it is specialized in the first activities of the production process as
research and development, R&D, or if it is the source of raw materials
• Downstream, if its activities are focused on the last stages of the value chain,
as assembly, for instance224.
Figure 6 below represents different OECD and non-OECD countries’ distance to final
demand in 1995 and in 2008. More specifically, the figures on the vertical axis represent the
average value of all the country’s industries.
223 Miroudot S. & De Backer K., Working Party of the Trade Commitee (2012) Mapping Global Value Chains, The OECD Conference Centre, Paris, cit. 224 Ibid.

81
Distance to Final Demand
Figure 6, Distance to Final Demand, by economy, 1995 and 2008. Source: Miroudot & De Backer (2012) Figure 2, p.
16.
An increase in the distance to final demand, between 1995 and 2008, means that the
country has become increasingly specialized in the first stages of the value chain (see Figure
1). On contrary, if the country has diminished its distance to final demand it means that it
has become more specialized in the last steps of the supply chains. Nevertheless, it is
interesting to notice that, as can be depicted from the graph the majority of analyzed country
has moved towards the first stages of the value chain. This trend «is consistent with the
overall increase in the length of GVCs and the outsourcing phenomenon. (Because w)hen
the production of some inputs is outsourced, their value-added is moved backward to the
industries supplying intermediate inputs and the distance to final demand increases»225.
3.1.3 The International Supply Chain behind iPhone production
In order to have a clearer idea of the dynamics regulating the global supply chain it
could be useful to analyze the international supply chains that lies behind the production of
225 Miroudot S. & De Backer K., Working Party of the Trade Commitee (2012) Mapping Global Value Chains, The OECD Conference Centre, Paris, cit. p.15.

82
one of the most successful Apple’s products: the iPhone226. This is an interesting example
because it perfectly displays the complexity of a widespread value chain. Moreover, it also
represents the high degree of globalization reached by the world economy, the level of
interconnectedness of different countries and, lastly the extreme level of interdependences
that results from these interactions. All of these factors will be crucial in explaining why the
international supply chain has been considered a channel of transmission and an amplifier of
the Global Recession. Figure 7 below clearly shows how the value chain behind iPhone’s
production is spread across different areas of the world.
Apple Suppliers: Locations and Numbers
Figure 7, Location and number of Apple suppliers per country. Source: Hillsberg, A. (2014)227
226 The following lines that describe the international supply chain deal with the production of iPhone 6. 227 Hillsberg, A. How & Where iPhone is Made: Comparison of Apple’s Manufacturing Process, September 17, 2014 [Available Online from: http://comparecamp.com/how-where-iphone-is-made-comparison-of-apples-manufacturing-process/]

83
More precisely, there are 31 countries involved in the value chain process that brings
to this item. Depending on different factors endowments, each county is specialized in a
certain stages of the value chain, as it is schematically expressed in Figure 8 below.
iPhone International Value Chain
Figure 8, iPhone International Supply chain. Source: Hillsberg, A. (2014)
Hence, following the scheme of Figure 1 above it is possible to associate each
productive step to the relative group of countries involved:
• Research and Development: this first stage of the productive process takes place
entirely in the United States.
• Component production/sourcing takes places in three different regions (North
America, Asia, European Union) but mainly in Asia. The major Asian companies that
are involved in the process are, among the others:
§ LG Display (South Korea) which is the large display panel supplier
84
§ Sony (Japan) which supplies front a rear cameras
§ Toshiba (Japan) and SK Hynix (South Korea) that supply storages
§ NXP (Germany) supplies short-range wireless chip for iPhone 6
§ STM Microelectronics (France and Italy) that provides gyroscope
• Assembly takes place entirely in China at Guangdong, Henan, Shanxi, and Shanghai
• Marketing operations took place in the United States
• Sales/distribution operations start from the United States to the rest of the world.
3.2 The International Supply Chain as a Transmission Channel of the Financial Shock
In the aftermath of the crisis, a broad consensus is emerging among economists and
scholars about the issue of the International Supply Chain as channel of transmission of
systemic shocks. More precisely, both the financial shock and the Great Recession have
been magnified by the existence of vertical specialization across countries.
As emerged from the first chapter, one of the effects of the Financial crisis of 2007 –
2008 was the so-called credit crunch that lowered credit availability and negatively affected
the level of investments, trade financing system and, eventually, aggregate consumption.
Furthermore, it is essential to underline that the low availability of credit was even more
disruptive due to the existence of vertical linkages. Broadly speaking, the dynamic is the
following: «(b)ecause firms rely on suppliers in carrying out part of the production process
(outsourcing or off-shoring), and/or because they sell their production to other firms, the
smooth realization of production plans from initial investment to final sales depends on the
availability of credit at all stages of the production chain. (Hence) the initial financial
downturn propagates itself along the chain, affecting all firms in the supply network»228.
The authors Hubert Escaith and Fabien Gonguet focused their research229 on the functioning
of this dynamic. As will be explained in detail in the following paragraphs, this research
examines how the interactions between the financial system and the production process
amplified the effect of the crisis.
228 Escaith, H. & Gonguet, F., (2011) International Supply Chains as Real Transmission Channels of Financial Shocks, The Capco Institute Journal of Financial Transformation, cit. p.84. 229 Ibid.

85
3.2.1 The Monetary Circuit in a Closed Economy
First of all it is important to define the basic concept of monetary circuit since it
could be defined as the bridge between the financial/bank system and the real economy. The
cycle starts with the entrepreneur/producer asking for a loan to the Bank, or another credit
institute, in order to start its production process or increase its turnover via an investment. In
the manufacturing industry, for instance, the producer will need machineries and raw
material, intermediate inputs and services, lastly he/she would need to pay workers. Usually
the bank’ decision to grant a loan depends on four factors:
1. Case-specific considerations about the firms itself like the quality of its
management and its financial situation (microeconomic perspective)
2. «Sectorial specificities, such as the cyclical nature of the business in which the
firm operates
3. Macroeconomic considerations, such as the probability of expansion or
recession […]
4. The institutional capacity of the bank to extend new credit within the limit of
its loans/assets adequacy ratio»230.
Once the bank has decided to extend new credit and the final goods is produced and
sold through the final market or to other industries (if the company manufactures
intermediate inputs) the entrepreneur/producer will repay its initial debt to the bank, and the
circuit ends. Hence, the time laps between the creation and the destruction of money is
strongly linked with the time required for the production process231. Lastly, the repayment
of the initial debt makes it also possible for the bank to concede a new loan in support of
another production process. Thus, a central feature of the model proposed by the authors is
represented by «the record of debt and its ratio with respect to the bank’s assets (since) it
230 Escaith, H. & Gonguet, F., (2011) International Supply Chains as Real Transmission Channels of Financial Shocks, The Capco Institute Journal of Financial Transformation, cit. p.88. 231 Ibid.

86
acts as a bridge between flows and stocks, between real and monetary shocks»232. Figure 9
below schematizes the money circuit.
Monetary Circuit
Figure 9, Monetary Circuit. Source: Escaith & Gonguet (2009) Figure 1, p.6.
Notice that the authors assume that, at the end of the circuit, there are no retained
earnings, i.e. money earned from the sales is completely redistributed to proprietors. This
also means that this model assumes that there are not goods that remains unsold because
«any stock of goods remaining in the “real system […] has a counterpart in outstanding
credit money in the financial circuit»233. Any quantity of unsold products must be financed,
thus the net demand of money will increase too. This is precisely what happened as a result
of the negative-demand shock triggered by the financial downturn: an accumulation of
inventories matched by an increase in the net demand for credit.
232 Escaith, H. & Gonguet, F., (2011) International Supply Chains as Real Transmission Channels of Financial Shocks, cit. p.85. 233Ivi p.86.

87
In order for this system to work two conditions are required: first, the production
process must function smoothly and must pay its costs; second the Credit Institute must not
exceed its adequacy ratio234. The capital adequacy ratio (CAR) could be defined as «a
measure of bank’s capital (and) it is expressed as a percentage ok bank’s risk weighted
credit exposures»235. This measure is an important indicator of financial stability since it
lowers the risk of bank insolvency in case of an external shock.
3.2.2 The Monetary Circuit in an Open Economy
When the model is applied to an open economy characterized by the presence of the
international supply chain the number of economic interactions and transactions increases.
Once we consider a globalized world in which different countries trade with each other and
in which capital can move more or less freely across border we have to take into account
that «(t)he funds borrowed to finance production are used to purchase intermediate goods
and services from other firms that may be located in different countries. In the same way the
production process depends on the capacity of the respective supplier firms to obtain credit
from their own banks and deliver in time their inputs»236. The point is that the existence of
vertical linkages across countries increases the number of variables and thus the level of
uncertainty. One of the ways in which firms protect themselves from risks is through
extended «short-term trade finance to their suppliers and (extended) payment facilities to
their customers»237. However, the collateral effect is the rise of leading’s firm financial
exposure.
3.2.3 The Monetary Circuit and Vertical Specialization
As mentioned in the previous lines, in order to achieve the objective of financial
stability, banks should respect the limit of capital adequacy ratio that, from now on will be
referred to as parameter “α”. Strictly speaking, α determines the adequate degree of bank’s 234 Ibid. 235 Definition from Investopedia [Available online from: http://www.investopedia.com/terms/c/capitaladequacyratio.asp] 236 Ivi. 237 Ivi.

88
exposure, i.e. the quantity of credit it can issue. Under the international standards of Basil II
established by the Bank for International Settlements (BIS), α should be 8% 238 .
Nevertheless, this is not the only parameter that the bank has to take into account when it
decides whether to grant a loan to a firm. The credit institute must also evaluate, along with
macroeconomic considerations, the stability and the wealth of the company itself. In a
global scenario characterized by the existence of international supply chains, the bank will
also have to consider the network in which the business operates because any eventual
«default of a client can cause distress to its suppliers, and the difficulties of a key supplier
can jeopardize the viability of a production plan»239. Hence, the stability of the firm asking
for credit does not depend only on its structure but also on exogenous variables. In times of
business cycle downturn, as it happened during the Great Recession, the credit institute’s
propensity to extend new loans diminishes, mainly because of the fact that the assets’
market value is strictly connected to the level of risk associated with them.
Nevertheless, the lower propensity to extend new loans (the credit crunch) can also
be considered itself as the cause the Great Recession, whose effect was magnified by the
presence of vertical linkages. By other terms the international supply chain can be
considered as a channel of transmission and an amplifier of financial shocks. Specifically, if
as a consequence of credit crunch «a firm’s request for credit is turned down, it must scale
down its production […] (and this) affects in turn its suppliers and even its clients through
the supply chain, an influence final demand through lower household income (wages and
profits)»240. In other words, an external financial shock reverberates across the real economy
through international supply chains. In a vicious circle it will also negatively affect the
monetary circuit by increasing firms’ default risk, which is taken into account by credit
institutes when it comes to extend new credit.
238 Escaith, H. & Gonguet, F., (2011) International Supply Chains as Real Transmission Channels of Financial Shocks, cit. 239 Escaith, H. & Gonguet, F., (2011) International Supply Chains as Real Transmission Channels of Financial Shocks, The Capco Institute Journal of Financial Transformation, cit. p.89. 240 Ibid.
89
3.3 The International Supply Chain as a Transmission Channel of the Negative-demand
Shock
If on the one hand the international supply chain amplified the effect of credit crunch,
on the other hand it had also boost the spread of negative-demand shocks through similar
dynamics. In order to understand this phenomenon it could be useful to imagine what would
have happened as a consequence of the Financial Crisis of 2007-2008 in absence of vertical
specialization.
Counterfactual exercise: If the United States’ aggregate income declines as a
consequence of the Great Recession, this means a reduction of households’ and firms’
disposable income and, thus, a reduction in consumption that will affect also the volume of
imports. The collateral effect is that exporters of other countries will be negatively affected
and will face a decrease in their income. Conversely they would have to reduce their
spending and decrease their imports. This is how the simple trade channel works: if all
world trade is in value-added (in final goods), trade’s drop is exactly equal to the fall in
demand for final imported goods, hence the trade effects are not amplified241.
Now suppose that there exist international supply chains and that, for the same
reason, US income declines. The initial effect is the same as in the previous example: the
total value of imports decline. However, this time «some of this reduced import spending is
on imported vertically specialized goods»242 as cars, for instance. This results in lower
foreign demand of American intermediate inputs that are necessary in the cars assembly
process. The final outcome is that the US will see a decline in both its imports and exports.
Thus «international trade declines in a more synchronized manner than in non-vertically
specialized world»243. The rapidity of the transmission from country A (home) to country B
(foreign) is closely related to two factors:
1. Country B final demand for goods and services exported by country A.
241 Bems, R, Johnson, R. C., & YI Kei-Mun (2010), The Role of Vertical Linkages in the Propagation of the Global Downturn of 2008, Federal Bank of Philadelphia, cit. pp. 45-47 242 Ibid. 243 Ibid.
90
2. «The volume of trade in intermediate goods linking industries of both
countries»244.
While the first factor does not depend on the level of vertical integration, the second
element in completely dependent on the pervasiveness of the international supply chain. In
addition it is relevant to notice that this effect is further magnified since, as Johnson and
Noguera pointed out «Trade in intermediate inputs accounts for as much as two thirds of
international trade»245.
3.3.1 O’Rourke’s Collapsing Trade in a Barbie World
O’Rourke article, Collapsing Trade in a Barbie World provides a more detailed,
arithmetical example of how the disintegration of the productive process can work as an
amplifier of a crisis.246. In his work the author explains why it is possible to state that, today,
«(e)very time the US buys one fewer Barbie doll, trade declines not only by the value of the
finished doll, but by the value of all the intermediate trade flows that went into creating
it»247. He imagines three different scenarios.
In World A only one good is traded: Barbie dolls; and this product is created in
absence of an international supply chain (the productive process is not disintegrated across
countries). At time t, world trade is represented by 100 Barbie dolls. Then, at time t+1,
income (total world income = world GDP) diminishes by 1% and this drop results in one
less unit of Barbie doll being exported/imported248. Thus, in World A, since 1% decline in
total income results in 1% decline in trade «(t)he elasticity of trade with respect to GDP is
1»249.
244 Escaith, H. & Gonguet, F., (2011) International Supply Chains as Real Transmission Channels of Financial Shocks, cit. p.88. 245 Johnson, R. C. & Noguera, G. (2009) Accounting for intermediates: Production Sharing and Trade in Value-Added”. Manuscript. Dartmouth College 246 O’Rourke, K. Collapsing trade in a Barbie world, The Irish Economy, July 18 2009. [Available online from: http://www.irisheconomy.ie/index.php/2009/06/18/collapsing-trade-in-a-barbie-world/] 247 Ibid. 248 Ibid. 249 Ibid.

91
Table 1, Effects of Income Decline on World Trade (only one goods; without vertical specialization)
In World B, again, only one good is traded: Barbie dolls. However, in this case, the
productive process is disintegrated across countries; this means that «(t)he constituent parts
and components of final good crosses borders several times before the final product reaches
the consumer; at each border crossing, the full value of the partially assembled good is
recorded as trade»250. Hence, there exists an equivalent trade flows for intermediate inputs,
thus the total trade, at time t, is now 200. Here, again, at time t+1, income diminishes by 1%
corresponding to one less Barbie imported/exported. Since «for a given reduction in world
income, trade should decline not only by the value of the finished product, but also by the
value of all the intermediate flows that went into creating it» trade declines by 2. Hence,
there is still a 1% decline in World Trade and the elasticity of trade has remained 1.
Table 2, Effects of Income Decline on World Trade (only one goods; with vertical specialization)
Conversely, in World C, two different goods are traded: Barbie dolls and Kens.
Here, 50 Barbies are manufactured through an international supply chain and create a trade
flow of 100 (since we have to consider even the intermediate inputs’ flow). In addition there
are also 50 Kens that are produced via entirely domestic productive chains, creating a trade
flow of 50. Thus, in this case, the total trade is 150. Assuming that world income declines
by 1%, one less Barbie is traded and trade diminishes by 2, in this case this fall corresponds
to a 1.33% decline in total world trade. Hence trade elasticity to GDP is higher in World C.
250 Altomonte, C. & Ottaviano G. I. P., Resilient to the crisis? Global supply chains and trade flows, in Baldwin (2011).

92
Table 3, Effects of Income Decline on World Trade (two goods; one produced through vertical
specialization/one produced completely domestically)
Considering the extreme case in which trade involves only 1 Barbie and 99 Ken, if
the 1% income decline results in one less Barbie exported the elasticity would almost
double251. Furthermore, «if the marginal impact of falling income was to lower trade in
Kens rather than in Barbies, the conclusion would be very different» since the elasticity of
world trade to GDP would have been significantly lower. Table 4 below synthetizes
O’Rourke Barbie’s example.
O’Rourke’s Barbie doll example
Table 4, Elaborated Data from O’Rourke’s Barbie doll example
251 O’Rourke, K. Collapsing trade in a Barbie world, cit.

93
Broadly speaking, what this example shows is that the impact of a drop in income
depends on how the productive processes are organized in the world economy252. More
specifically, in a world in which «goods are either vertically disintegrated or not, vertical
disintegration can help to explain the higher elasticity of trade with respect to GDP». Thus,
if the negative-demand shock is mainly concentrated on goods that are produced via an
international supply chain, as it happened during the Great Recession, the volume of trade
will be very sensitive to a variation in demand253. To sum up, « (b)ecause production is
internationally diversified, adverse external shocks may affect firms not only through final
demand (a sudden decline in exports), but also through a disruption of the flow of inputs
received from their suppliers. (Hence), the greater supply interconnection has also provided
greater and faster channels of propagation of adverse external shocks»254.
3.3.2 Indirect Effects of Vertical Linkages
Lastly, in order to have a full perspective of the phenomenon it necessary underline
that there are also other, more indirect, ways in which international supply chains magnify
the effect of the Great Recession. Even though they are not as relevant as the transmission
of negative-demand shock via import/export of intermediate inputs it is important to
enumerate them:
1. Re-nationalization of the global value chain: broadly speaking, in period of crisis
multinationals generally lower their real activity abroad. More specifically,
companies that are facing losses in their own market, usually reduce labor demand
and/or investment abroad255. On the other hand, the same dynamic could be triggered
by an increase in the level of protectionism: if the government of the host country
decides to adopt protective policies to safeguard domestic producers, foreign-owned
companies could be hit and decide to lower or stop its investment in that country.
252 Ibid. 253 Bems, R., Johnson, R. & Yi, K. The Collapse of Global Trade: Update on the role of vertical linkages, in Baldwin (2011) cit. 254 Escaith, H. & Gonguet, F., (2011) International Supply Chains as Real Transmission Channels of Financial Shocks, The Capco Institute Journal of Financial Transformation, cit. p. 84. 255 Krugman, P. R. & Maurice Obstfeld, 2008, International Economics:Theory and Policy, cit.

94
2. The effects of low elasticity of substitution of vertically specialized products.
Most of the intermediate goods used in the value chain are not commodities (like oil,
for instance) but, conversely they are client or industry specific, thus, in case of
default of suppliers, it is very difficult and costly to find another adequate alternative.
In other words, many authors underlined the relevance of the «(t)he technological
dimension of complexity related with the imperfect substitutability of inputs and the
associated search costs on international market»256. Hence, «Firms dealing with very
specific, low-substitutability goods that require particular production processes or
specialized channels face higher trade complexity. As a corollary, the failure of any
single supplier will affect the entire production chain in the short and medium-
term»257. Considering the example of the Italian business Intermac (the top player in
the international scenario of glass processing machineries), this company produces
highly client-specific machineries, which, in some cases, introduce a complete new
technology in the market. Even though those machineries are not real intermediate
inputs themselves, they are used by other business to produce intermediates (like
auto vehicles glass) or final goods. If such a specialized and specific industry
interrupt its production it would be extremely difficult, if not impossible, for a glass
producer to find another supplier that can guarantee the same standard of quality and
level of technology.
3.3.3 How to measure the effect of the International Supply Chain
In order to quantify the effects of the International Supply Chain as a channel of
transmission of the negative-demand shock, Rudolf Bems, Robert Jonson and Kei-Mu Yi
measured «bilateral imported intermediate goods linkages using trade data combined with
national input-output table»258. These linkages emerge each time an imported input is used
in a production process; vertical linkages arise if the final good is consequently exported259.
As mentioned above, a negative-demand shock in one country (or in a group of countries)
that involves vertical specialized goods could be easily transferred to other country. In
256 Escaith, H. & Gonguet, F., (2011) International Supply Chains as Real Transmission Channels of Financial Shocks, cit. p. 87. 257 Ibid. 258 Bems, R., Johnson, R. & Yi, K. The Collapse of Global Trade: Update on the role of vertical linkages, cit. p. 80. 259 Ibid.
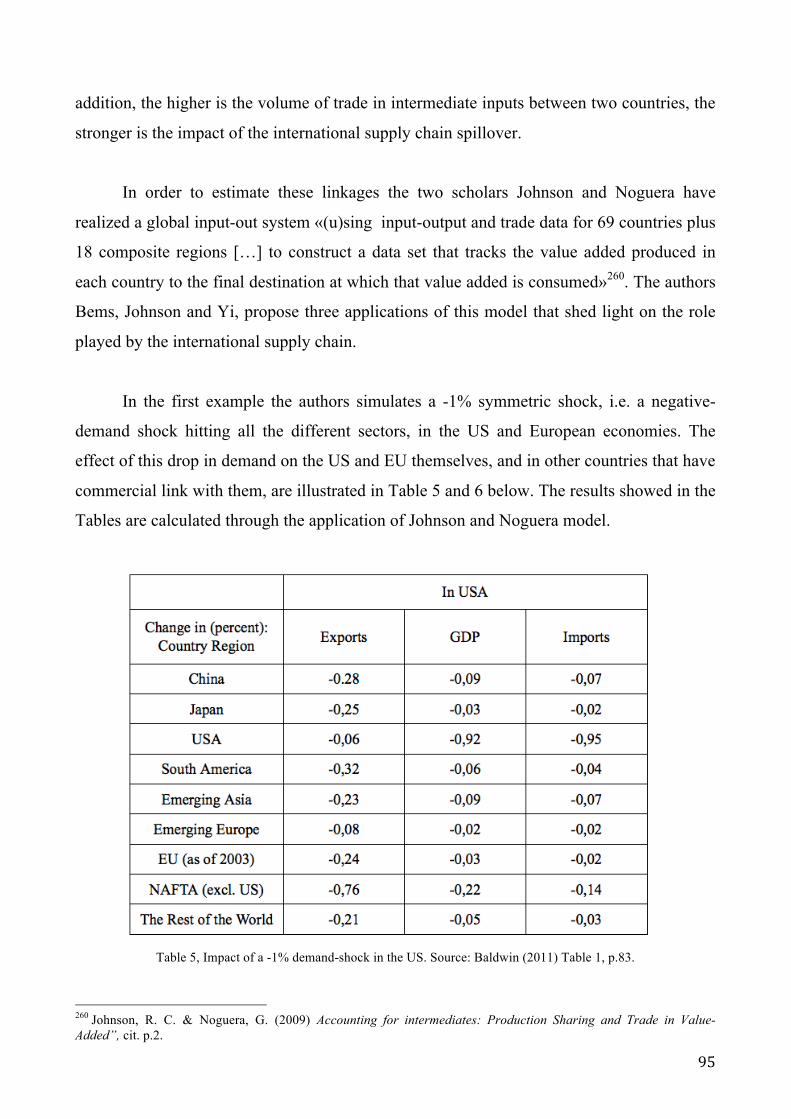
95
addition, the higher is the volume of trade in intermediate inputs between two countries, the
stronger is the impact of the international supply chain spillover.
In order to estimate these linkages the two scholars Johnson and Noguera have
realized a global input-out system «(u)sing input-output and trade data for 69 countries plus
18 composite regions […] to construct a data set that tracks the value added produced in
each country to the final destination at which that value added is consumed»260. The authors
Bems, Johnson and Yi, propose three applications of this model that shed light on the role
played by the international supply chain.
In the first example the authors simulates a -1% symmetric shock, i.e. a negative-
demand shock hitting all the different sectors, in the US and European economies. The
effect of this drop in demand on the US and EU themselves, and in other countries that have
commercial link with them, are illustrated in Table 5 and 6 below. The results showed in the
Tables are calculated through the application of Johnson and Noguera model.
Table 5, Impact of a -1% demand-shock in the US. Source: Baldwin (2011) Table 1, p.83.
260 Johnson, R. C. & Noguera, G. (2009) Accounting for intermediates: Production Sharing and Trade in Value-Added”, cit. p.2.

96
On the one hand, it emerges that US GDP (third line in Table 4) drops by -0,92%
while the import’s decline is -0,95%, confirming that a decline in final demand results in
less imports. Conversely, it is interesting to notice that exports decrease only by -0,06%
«reflecting the fact the US are not, in the aggregate, tightly integrated into cross-borders
production networks»261. On the other hand, as far as the effect on other countries are
concerned it is interesting to notice the similarity between Chinese and Japanese drops in
export: -0,28% and -0,25 respectively. This data are somehow surprising since US import
from China is 60% higher than its imports from Japan262. Nevertheless, the presence of the
international value chain is the key to explain this outcome since a significant part «of
Japanese value added is exported to the US through China and other countries»263.
Table 6, Impact of a -1% demand-shock in the EU. Source: Baldwin (2011) Table 1, p.83.
On the other hand, as far as the European scenario is concerned it is interesting to
notice what would happen to Emerging Europe in case of a similar shock. This area’s
import would fall only by -0,12% but, nevertheless, this drop is considerably higher that
other regions’ (with the exclusion of the European Union itself). This, again, is due to the
261 Bems, R., Johnson, R. & Yi, K. The Collapse of Global Trade: Update on the role of vertical linkages,) cit. p. 82. 262 Bems, R., Johnson, R. & Yi, K. The Collapse of Global Trade: Update on the role of vertical linkages, cit. 263 Ivi p.82.
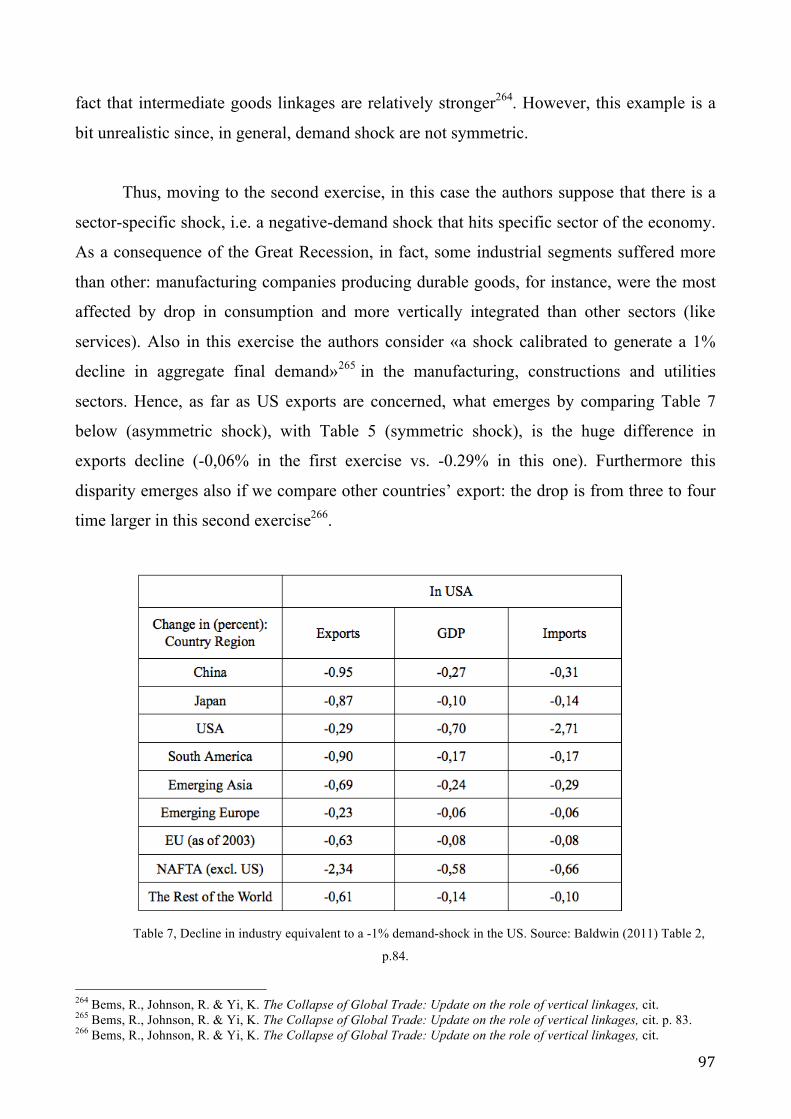
97
fact that intermediate goods linkages are relatively stronger264. However, this example is a
bit unrealistic since, in general, demand shock are not symmetric.
Thus, moving to the second exercise, in this case the authors suppose that there is a
sector-specific shock, i.e. a negative-demand shock that hits specific sector of the economy.
As a consequence of the Great Recession, in fact, some industrial segments suffered more
than other: manufacturing companies producing durable goods, for instance, were the most
affected by drop in consumption and more vertically integrated than other sectors (like
services). Also in this exercise the authors consider «a shock calibrated to generate a 1%
decline in aggregate final demand»265 in the manufacturing, constructions and utilities
sectors. Hence, as far as US exports are concerned, what emerges by comparing Table 7
below (asymmetric shock), with Table 5 (symmetric shock), is the huge difference in
exports decline (-0,06% in the first exercise vs. -0.29% in this one). Furthermore this
disparity emerges also if we compare other countries’ export: the drop is from three to four
time larger in this second exercise266.
Table 7, Decline in industry equivalent to a -1% demand-shock in the US. Source: Baldwin (2011) Table 2,
p.84.
264 Bems, R., Johnson, R. & Yi, K. The Collapse of Global Trade: Update on the role of vertical linkages, cit. 265 Bems, R., Johnson, R. & Yi, K. The Collapse of Global Trade: Update on the role of vertical linkages, cit. p. 83. 266 Bems, R., Johnson, R. & Yi, K. The Collapse of Global Trade: Update on the role of vertical linkages, cit.
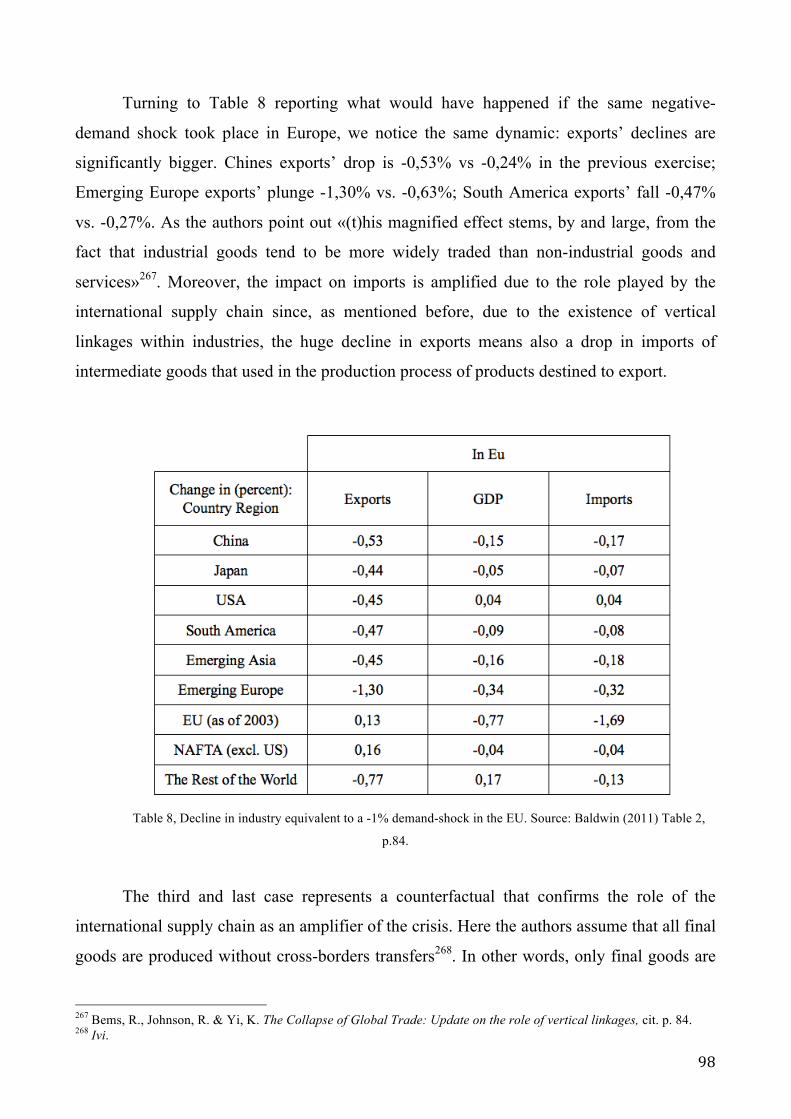
98
Turning to Table 8 reporting what would have happened if the same negative-
demand shock took place in Europe, we notice the same dynamic: exports’ declines are
significantly bigger. Chines exports’ drop is -0,53% vs -0,24% in the previous exercise;
Emerging Europe exports’ plunge -1,30% vs. -0,63%; South America exports’ fall -0,47%
vs. -0,27%. As the authors point out «(t)his magnified effect stems, by and large, from the
fact that industrial goods tend to be more widely traded than non-industrial goods and
services»267. Moreover, the impact on imports is amplified due to the role played by the
international supply chain since, as mentioned before, due to the existence of vertical
linkages within industries, the huge decline in exports means also a drop in imports of
intermediate goods that used in the production process of products destined to export.
Table 8, Decline in industry equivalent to a -1% demand-shock in the EU. Source: Baldwin (2011) Table 2,
p.84.
The third and last case represents a counterfactual that confirms the role of the
international supply chain as an amplifier of the crisis. Here the authors assume that all final
goods are produced without cross-borders transfers268. In other words, only final goods are
267 Bems, R., Johnson, R. & Yi, K. The Collapse of Global Trade: Update on the role of vertical linkages, cit. p. 84. 268 Ivi.

99
traded. The second assumption is that, as in the second example, there is a industry-specific
negative-demand shock of -1%. Table 9 below show what would happen if this shock took
place in the American market.
Table 9, Decline in industry sectors equivalent to a -1% demand-shock in the US with no vertical linkages. Source:
Baldwin (2011) Table 2, p.85.
Obviously imports decline, by -1,92%, only in the US market, since demand for final
goods is unchanged in the other countries. Conversely, what do change are other countries’
exports that diminish as a result of a lower demand for their exported goods.
As demonstrated by figures in Table 10, the same would happen if the negative-
demand shock took place in Europe: only European imports and other countries’ exports
will be negatively affected269. Thus, thanks to this counterfactual exercise, it is possible to
conclude that «we can interpret the declines in imports in the previous exercise as the effect
of vertical specialization»270.
269 Ivi 270 Ivi p. 85.

100
Table 10, Decline in industry sectors equivalent to a -1% demand-shock in the EU with no vertical linkages. Source:
Baldwin (2011) Table 2, p.85.
To conclude, what emerges from the numerous researches examined in this chapter is
that the existence of vertical linkages across countries amplified both:
• The effects of the financial crisis via the monetary circuit that links the
banking system to the real economy
• The impact of the negative-demand shock through a fall in both the level of
import and export of intermediate inputs.

101
CHAPTER FOUR
THE RECOVERY AND THE EFFECTS OF GLOBAL TRADE
COLLAPSE ON THE INTERNATIONAL ECONOMY
4.1 The Effects of the Crisis on the International Economy
4.1.1 The Reprise of Global Trade
Overall, the recovery of global trade was relatively rapid, according to the European
Commission data, in fact, the volume of world trade reached its pre-crisis level already in
the mid of 2010271 even though, the reprise has slow down in the second quarter of 2011 for
three main reasons:
1. The outbreak sovereign-debt crisis in the European Union.
2. The fall of the level of production in Japan as a consequence of the Tōhoku
earthquake of March the 11th 2011, which caused severe damages to many
infrastructures (among them the Fukushima nuclear plant)
271 European Commission, Economic and Financial Affairs (2012) Volume 11 – Issue 2 Quarterly Report on the euro area, July 2012. [Available online from: http://ec.europa.eu/economy_finance/publications/qr_euro_area/2012/pdf/qrea2_section_1_en.pdf]

102
3. «The increasing uncertainty concerning US fiscal policies»272.
It is interesting to notice that while global trade collapse was extremely
synchronized, the path of reprise was characterized by a significant asymmetry both in
regional and sectorial terms. On the one hand, as far as regional diversity is concerned,
different areas of the world reacted differently to trade collapse depending on the way in
which the crisis hit their own economies273. Some countries, as the US, or regions, as the
European Union, has been hit by both the financial crisis and the real/trade crisis, hence
these countries experienced a relatively slow recovery. Conversely, many emerging
countries were affected only by the negative-demand shock via a sharp decrease in the
demand for their exports, thus these areas saw a relatively rapid reprise. Figure 1 below
clearly shows the different paces of reprise among countries/regions.
Real Imports Developments Across Regions (1991 = 100)
Figure 1, Real Imports Developments Across Regions (1991 = 100). Source: European Commission, Quarterly Report
on the Euro area (2012) p. 10, Graph 1.2.
272 European Commission, Economic and Financial Affairs (2012) Volume 11 – Issue 2 Quarterly Report on the euro area, July 2012, cit. p. 9. 273 Ibid.

103
Starting from the bottom of the graph, the lower line that represents the Euro Area
evidently illustrates the rather slow recovery process of this region. After the negative peak
of the second quarter of 2009, in fact, even though, on average, the slope is positive, the line
is almost flat. This means that the real imports development is relatively low in these
countries. However, it is essential to take into account two considerations: first, as
mentioned in the previous lines, Europe suffered the consequences of the sovereign-debt
crisis; second, the import growth rate was already relatively sluggish before the outbreak of
the financial crisis, this is even more evident if we consider the huge gap between Europe
and Asia import growth from 2001 to 2007. Moving on to the United States (dark green
line) they were characterized, as the European Union, by a slothful growth rate even before
2007 and, moreover, even if imports rose faster than they did in the EU after 2009, they
reached pre-crisis level only after 2013. This is a common feature of advanced economy
whose markets have become relatively stagnant. On the other hand, if we take into account
the import pattern of developing/emerging regions as Asia and Latin America, we notice
that their growth rate was greater both before and after 2009. More precisely those regions
reached their pre-crisis level already in 2012. This is mainly due to the fact that the effects
of the crisis on their economies were less severe, or better, less prolonged principally
because they were «less burdened by the repercussions of the global financial crisis in terms
of deleveraging needs»274.
As far as disparity at the sectorial level is concerned, in this case the pace of recovery
was different depending on product categories. This phenomenon is principally due to the
price effect discussed in chapter two of this dissertation. More in detail, «(i)n nominal
terms, exports of crude materials, which are subject to large price fluctuations, had exceed
their pre-crisis peak by 30% in 2011, while fuel exports were 23% below levels seen in
2007»275. The latter trend was conditioned by the fact that oil prices were significantly high
before the outbreak of the crisis (price effect). Figure 2 below illustrates the different
sectors’ recovery rates.
274 European Commission, Economic and Financial Affairs (2012) Volume 11 – Issue 2 Quarterly Report on the euro area, July 2012, cit. p. 10. 275Ivi p. 12.

104
Global Export Recovery of Different Product Categories
(Exports in 2011, 5 of 2008 level)
Figure 2, Global Exports Recovery of Different Product Categories. Source: European Commission, Quarterly Report
on the Euro area (2012) p. 12, Graph 1.7.
Moreover, beside fuel exports also other sectors, especially those involving a higher
level of technology, took more time to reach their pre-crisis standard. For instance the
category of «machinery and machine parts, telecommunication equipment, road vehicles
and other transport equipment […] (were) still between 2.5% and 8% below previous peak
levels»276 in 2012 (see Appendix 1). In addition, this trend can account for the slow
recovery of high-income, developed country for the following reason: since the production
of these kind of goods involving high technology takes place mainly in advanced countries,
the sluggish export recovery of these category can be one of the reasons why these regions
are experiencing a slowly reprise.
To conclude, it is possible to argue that the growth rate of global trade is today far
below the level it would have been in absence of the Great Recession277. Nevertheless, it is
crucial to remember that the high-growth rate experienced by world trade between 2002 and
2008 was also the outcome of a, extra-ordinary buoyant context which was characterized
276 Ibid 277 European Commission, Economic and Financial Affairs (2012) Volume 11 – Issue 2 Quarterly Report on the euro area, July 2012, cit.

105
«by a global liquidity glut and excessive consumption in several advanced countries»278.
Thus, it is unlikely that global trade will return to its previous growth rate levels, at least in
the short-run and medium-run.
4.1.2 The International Economy after Global Trade Collapse
Regardless of the recovery process, the deep world trade downturn caused by the
Great Recession inevitably impacted international trade dynamics. Broadly speaking, there
has been three main changes which are the following:
• On the demand-side there has been a regional shift in favor of emerging
markets in terms of income growth and, thus, import demand279.
• On the supply-side it is possible to argue that both trade elasticities and the
international production structures (international supply chains) are changing
as a result of the shock280.
• On the financial side, bank intermediate trade financing is still suffering the
effect of the crisis281
As far demand-side is concerned, under a more long-time perspective, «(s)ince the
1990s, emerging markets economies have gradually increased their share of global output,
accounting for half of the world GDP in 2011 (based on purchasing-power parity
valuation)»282. Figure 3 below represents this trend.
278 European Commission, Economic and Financial Affairs (2012) Volume 11 – Issue 2 Quarterly Report on the euro area, July 2012, cit. p. 9. 279 European Commission, Economic and Financial Affairs (2012) Volume 11 – Issue 2 Quarterly Report on the euro area, July 2012, cit. 280Ibid. 281Ibid. 282 European Commission, Economic and Financial Affairs (2012) Volume 11 – Issue 2 Quarterly Report on the euro area, July 2012, cit. p.10.

106
Decreasing Regional Concentrations of World GDP
(Gini coefficient)
Figure 3, Decreasing Regional Concentrations of World GDP. Source: IMF
This means that, nowadays, the growth of international trade is more widespread
across countries in comparison to the last decades of the 21th century when the main
contributors of world GDP were few advanced countries. Even though the rise of emerging
countries has been slowed down by the outbreak of the crisis, they have experienced a
relatively quickly recovery in comparison with developed countries. Moreover, as already
mentioned in the second chapter, one of the consequences of the Great Recession was the
drop of the level of consumption (aggregate demand) of the high-income countries most hit
by the crisis, this, in fact, was precisely the channel through which the crisis was transmitted
to developing/emerging countries that saw their level of export abruptly declining in 2008-
2009. Furthermore, even after trade recovery the level of imports of developed country
remained relatively stagnant due to their rather slow recovery. On the other hand,
developing countries’ demand for import started increasing after 2010 due to their prompt
reprise. Thus, «income growth in emerging markets has […] translated into a rising share of

107
emerging market in import demand»283 This phenomenon is clearly illustrated in Figure 4
below.
Changes in Imports Across Product Categories and Countries, Values
(2008 = 100: pre-crisis level)
Figure 4, Changes in Imports Across Product Categories and Countries, Values (2008 = 100: pre-crisis level). Source:
European Commission, Quarterly Report on the Euro area (2012) p. 11, Graph 1.4.
As it can be easily depicted from the chart, aggregate demand/import growth of
emerging countries for many good categories (food and beverages; industrial supplies; fuels
and lubricant; capital goods; transport equipment) represented by the red columns, has
experienced a faster reprise in comparison with those of the most advanced countries
(represented by the lighter columns). In addition it is interesting to notice that this trend
involved not only intermediate goods used in the production process but also final goods284.
283 Ivi. 284 European Commission, Economic and Financial Affairs (2012) Volume 11 – Issue 2 Quarterly Report on the euro area, July 2012, cit.

108
As far the supply-side is concerned, one the effects of the Great Recession on
international economy was a change in countries’ export shares and product composition285.
This dynamic is strictly correlated to the transformations in the demand-side: due to the fall
and stagnation of developed countries’ demand there have been an increase in south-south
trade. Hence, not only emerging countries saw their import level growing in the last years
but, in addition, their export’s share augmented too. Hence, as a result of the Great
Recession, developing countries are less dependent on high-income regions imports. Even
though it is important to take into consideration the fact that today high-income advanced
countries still accounts «for two thirds of emerging markets’ exports»286 (see Figure 5). This
means that, at least in the medium term, emerging market dependency on advanced
countries’ markets will persist.
Destinations for Emerging Markets’ Merchandise Exports
(in % of total exports)
Figure 5, Destinations for Emerging Markets’ Merchandise Exports (in % of total exports). Source: IMF
285 Ibid. 286 European Commission, Economic and Financial Affairs (2012) Volume 11 – Issue 2 Quarterly Report on the euro area, July 2012, cit. p.11.
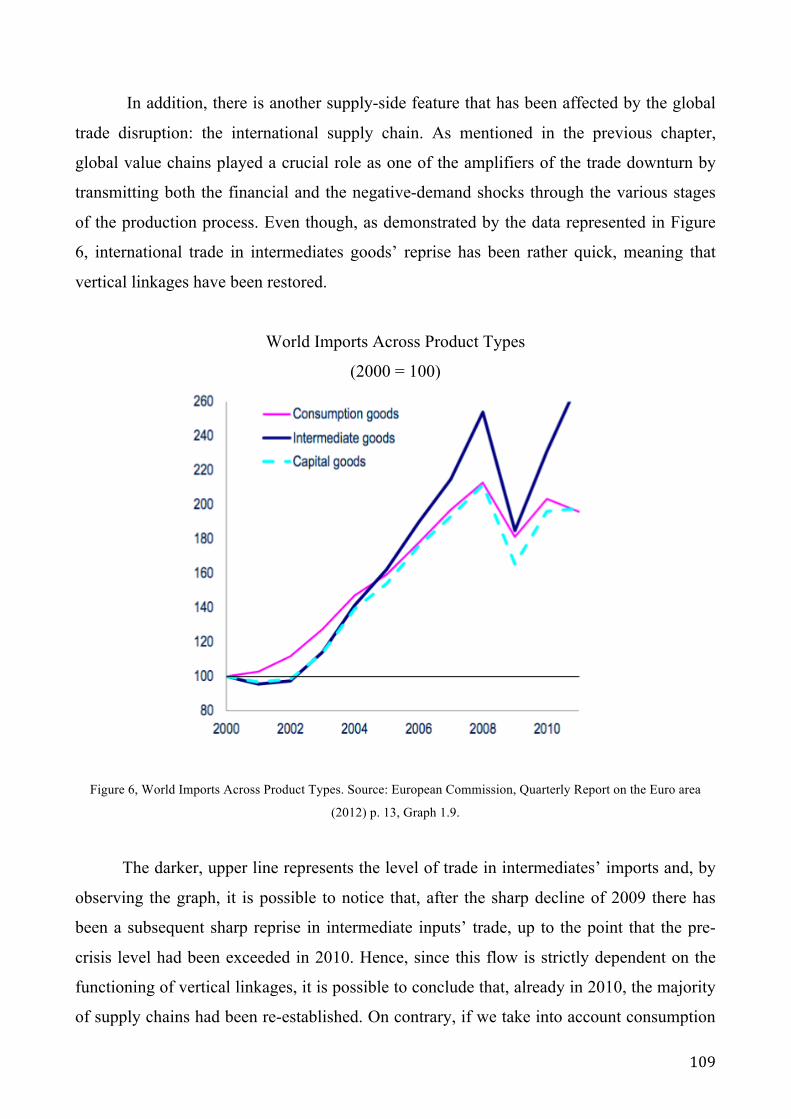
109
In addition, there is another supply-side feature that has been affected by the global
trade disruption: the international supply chain. As mentioned in the previous chapter,
global value chains played a crucial role as one of the amplifiers of the trade downturn by
transmitting both the financial and the negative-demand shocks through the various stages
of the production process. Even though, as demonstrated by the data represented in Figure
6, international trade in intermediates goods’ reprise has been rather quick, meaning that
vertical linkages have been restored.
World Imports Across Product Types
(2000 = 100)
Figure 6, World Imports Across Product Types. Source: European Commission, Quarterly Report on the Euro area
(2012) p. 13, Graph 1.9.
The darker, upper line represents the level of trade in intermediates’ imports and, by
observing the graph, it is possible to notice that, after the sharp decline of 2009 there has
been a subsequent sharp reprise in intermediate inputs’ trade, up to the point that the pre-
crisis level had been exceeded in 2010. Hence, since this flow is strictly dependent on the
functioning of vertical linkages, it is possible to conclude that, already in 2010, the majority
of supply chains had been re-established. On contrary, if we take into account consumption

110
goods’ and capital goods’ level of imports we notice that, even though after the severe
decline of 2009 there had been a process of recovery, pre-crisis levels have not been reached
in the following years. Moreover, if we consider the trade pattern of consumption goods we
discover that there has been a decline after 2010. However, even though the crisis has not
triggered a process of dis-integration and vertical linkages have been quickly restored, there
has been a change in terms of international supply chains consolidation. If global value
chains of certain sectors undertake a process of consolidation it means that the number of
stages in the production process diminishes together with trans-border transaction287, i.e. the
dispersion of the production process declines. More precisely, it is important to take into
account the fact that some sectors had already begun a process of consolidation even before
the outbreak of the financial crisis of 2007. According to recent empirical studies the global
trade collapse has somehow accelerated these processes of consolidation288. There are two
main hypotheses that can account for this trend:
1. The negative-demand shock caused by the Great Recession could have
caused a move towards domestic production
2. In the aftermath of the crisis some companies that have succeeded in escaping
the collapse may have increase the scale of their capacity and subsequently
created entry barriers289
More in detail, this shift does not depend on the specific characteristics of the product
involved in the global value chain. On contrary, this dynamic is more linked to the
economic environment in which the production process took place: Asian countries, and
particularly China, have significantly augmented their market share in the sense that there
has been an increase in the number of production stages that are implemented in these
countries290. Another country that is massively increasing its share in global value chain
networks is India. As will be explained in detail in the following paragraph, in fact, the
State-led Make in India policy’s objective is to foster the manufacturing sector and to invite
and incentive international producers to move parts of their production chains in India. 287 European Commission, Economic and Financial Affairs (2012) Volume 11 – Issue 2 Quarterly Report on the euro area, July 2012, cit. 288 Ibid. 289 Ibid. 290 Ibid.
111
Should this package of policies being successful, more and more business will augment
vertical connections with this country. Nevertheless it is important to take into consideration
the fact that this shift, however, happened, and happens, at the expense of smaller and less
competitive economies whose share in the global production network is diminishing.
Lastly, as far as financial aspects of the crisis are concerned, broadly speaking
economic history has taught that financial crises usually have deeper and long lasting effects
than mere real economy crises on the most directly affected countries. This is primarily do
to the fact that scarce credit availability constraints aggregate investments and thus reduces
gross national output; moreover also aggregate income, and hence imports will be
negatively affected291. In addition, another long-term consequence of financial crises is the
increase in capital out-flow and the decrease in foreign investment due to investors’
adversity to risk and instability and, as empirical studies have demonstrated, these dynamics
durably affects imports292. Nevertheless, it is also relevant to consider that, in case of a
floating exchange rate system, massive capital outflow can also trigger currency
depreciation. This in turn will result in an improved competitiveness of exporters, which
could be helpful for the recovery process.
Figure 7 below compares the different import’s adjustments trends of countries that
had been hit by the recent crisis with the import recovery of Sweden and Finland. These
Baltic countries, in fact, experienced a similar crisis in the early 1990s: after the burst of a
credit-fuelled real-estate bubble and a stock-market downturn Finland and Sweden saw the
collapse of investments and consumption293. «As a result, imports decreased by 8% in
Sweden and plummeted by more than 21% in Finland in the first year after the crisis»294 and
it took four years for their economies to reach pre-crisis level, in these specific cases
recovery was helped by structural reforms and exporters’ increased competitiveness due to
currency depreciation.
291 Ibid. 292 Ibid. 293 Ibid. 294 European Commission, Economic and Financial Affairs (2012) Volume 11 – Issue 2 Quarterly Report on the euro area, July 2012, cit. p. 16.

112
Real Import Recovery in Countries Hit by Banking Crises, Goods and Services
(pre-crisis peak = 100)
Figure 7 Real Import Recovery in Countries Hit by Banking Crises, Goods and Services. Source: Source: European
Commission, Quarterly Report on the Euro area (2012) p. 17, Graph 1.10.
NOTES: Peaks dates are: 1990 Q1 (FI); 1990 Q2 (SW); 2007 Q3 (US), 2007 Q4 (ES, IR, IS).
However, it is important to take into consideration the fact that the economic
scenario was rather different in the recent crisis, with way more countries involved. In other
words, it was more synchronized and for this reason the effects of the 2007 financial crisis
have been more prolonged. Furthermore, the outbreak of the sovereign-debt crisis in Europe
significantly worsened the economic environment. In addition, «liquidity contractions and
the tightening of financial conditions are likely to have restricted trade finance and thus
reduced demand in trade-intensive sectors that are most credit-dependent»295. However, as
mentioned in the second chapter, this phenomenon played only a marginal role since the
greatest part of «merchandise trade is financed on an open account basis or by cash-in-
advance arrangements296».
295 Ivi p. 17. 296 Ivi.

113
4.2 Lessons from the Global Trade Collapse: the Threat of Trade Imbalances
Even before the outbreak of the financial crisis in 2007, the world economy was
characterized by huge trade imbalances297. In order to grasp the relevance this feature had
on international economy it is useful to briefly recall what is meant by the term trade
imbalance and to recall what are the consequences of the existence of this disequilibrium.
4.2.1 The Implications of Trade Imbalances
Strictly speaking, this term refers to both the cases in which a country runs a current
account surplus or a current account deficit. On his part, the current account includes the
difference between exports and imports (trade balance, TB) but also represents national
(governmental + private) savings minus investments. This second CA’s form derives from
the open-economy national income identity (1) according to which national income (Y)
equals aggregate consumption (C) plus investments (I) plus public spending (G) plus the
current account (CA). Since Y – C – G, (2) represents national savings it is possible to
represent the current account as the result saving minus investments (3)298.
(1) Y = C + I + G + CA open economy national income identity
(2) CA = (Y – C – G) – I national savings minus investments
(3) CA = S – I current account identity
Hence if a country runs a current account surplus (CA > 0) it means also its
populations saves more than it invests (S > I). This scenario is typical of ageing countries
characterized by low expected growth in future299. On the other hand, a country that is
running a CA deficit invests more than it saves300. This, conversely, could be the case of an
emerging country that is catching up in term of productivity. Both a great CA deficit and a
huge CA surplus could be, for instance, the outcome of either domestic of systemic
297 Krugman, P. R. & Maurice Obstfeld, 2008, International Economics: Theory and Policy, cit. 298 Feenstra, R. C. & Taylor, A. M., 2014, International Economics, cit. 299 Krugman, P. R. & Maurice Obstfeld, 2008, International Economics: Theory and Policy, cit. 300 Ibid.

114
distortions301. As far a domestic distortions are concerned, too high private savings can be
caused by the lack of social insurance or of financial repression; conversely to low private
saving can trigger asset bubbles as in the case of the real estate sector in the US302. On the
other hand, as far as systemic distortions are concerned, emerging countries running huge
current account surplus, for instance, accumulates large FOREX reserves which are partly
insurance against speculative attacks but are also causes of global imbalances303. The point
is that trade imbalances are dangerous for international economy’s stability. According to
the Balance of Payment Theory, BoP, in fact, since every credit should be matched by a
debit the sum of Current Account plus the Financial Account, FA, plus the Capital Account,
KA304, must equal zero (4).
(4) CA + FA + KA = 0
Where:
i. CA: could be defined as a register of all international transactions linked to the
movements of goods, services and income. Hence, it equals: EXP – IMP + NFIA305 +
NUT306
ii. FA: records the transactions between residents and non residents that involves financial
assets; thus it measures how the country accumulates or decumulates assets through
financial transactions. Hence it equals the Exports of assets minus the Import of assets:
EXPasset – IMPasset
iii. KA: covers two minor areas as the acquisition and disposal of non financial/non
produced assets and the transfers as gifts of assets. Hence, it equals capital received
minus capital transferred: Kin - Kout
Since the KA plays a marginal role it is possible to consider only the current account
and the financial account. Hence, following the BoP Theory, it emerges the fact that each
negative current account must be matched by a positive financial account, and vice versa. In
301 Ibid. 302 Ibid. 303 Ibid. 304 It records the flows of non-financial assets, e.g. debt forgiveness or royal rights. 305 Net Factor Income from Abroad; the value of factor services exports minus the value of factor services imports. 306 Net Unilateral Transfer: the value of unilateral transfers the country receives from the rest of the world minus those it gives to the rest of the world.
115
other words, surpluses or deficits in the current account side must be offset on the asses
side. Here emerges the crucial concept of external wealth that represents the country’s net
worth with respect to the rest of the world. This measure is also called net international
position and it is a stock measure. This value (5) is obtained by subtracting from the assets
held by the rest of the world (external assets = credit) all the home assets owned by the rest
of the world (external liabilities = debt).
(5) External wealth, W = RoW assets owned by home – Home assets owned by RoW
Hence, if the External Wealth is positive it means that the Home country is a net
creditor: it has more external assets than external liabilities. Thus, a country that runs a
current account surplus must by net buyer of assets (a creditor/lender) and, vice versa, a
countries with a current account deficit must be a net seller of assets (debtor/borrower). The
point is that, even before the crisis the world economy was characterized by severe
imbalances in the sense that there were countries that were running huge current account
surpluses, as China, and other that had massive deficit, the United States. Both kind of
country were extremely exposed and vulnerable to external shocks as, for instance,
exchange rate fluctuations. This made the international economic system’s stability
extremely volatile.
4.2.2 Trade Imbalances in the Aftermath of the Crisis
The outbreak of the financial crisis of 2007 was, under certain aspect, the
consequence of those wide dis-equilibrium but, interestingly, with the occurrence of the
Great Recession, «the resulting collapse of imports and exports rapidly improved global
imbalances since the gap between exports and imports ineluctably falls at the same pace as
underlying export and import flows»307 (see Figure 8 below).
307 Baldwin, R. & Taglioni, D., The Great Trade Collapse and Trade Imbalances, in Baldwin (2011).
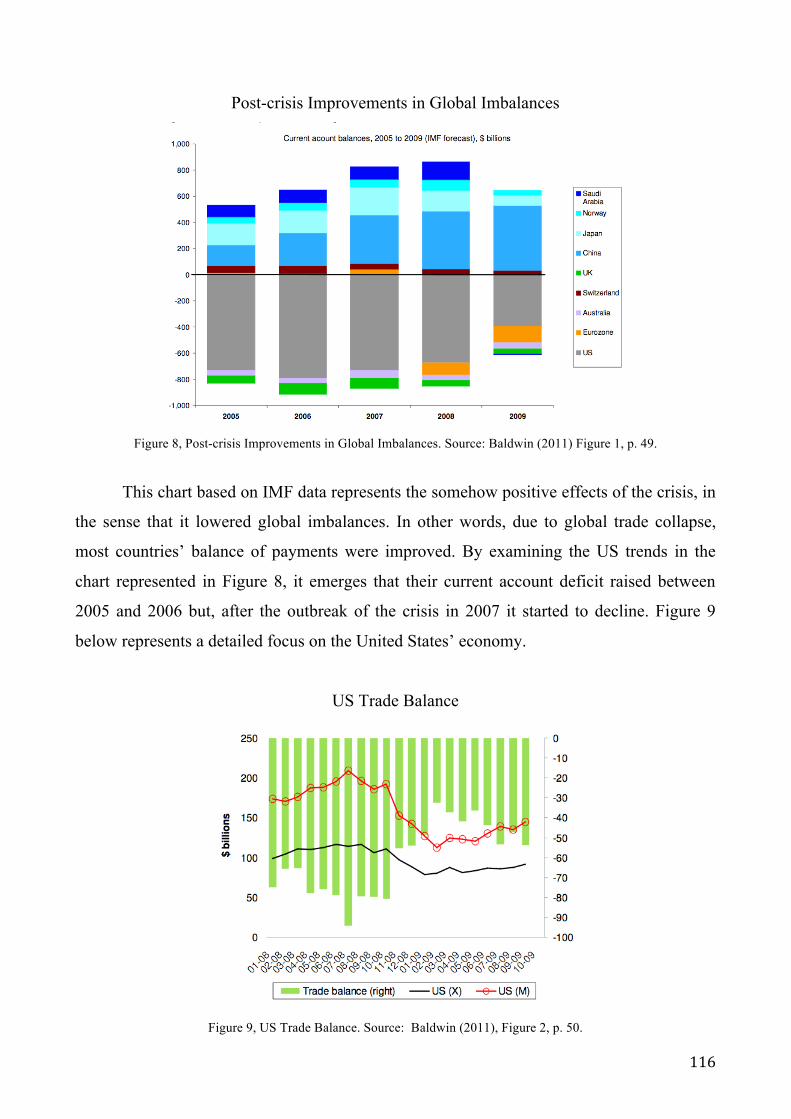
116
Post-crisis Improvements in Global Imbalances
Figure 8, Post-crisis Improvements in Global Imbalances. Source: Baldwin (2011) Figure 1, p. 49.
This chart based on IMF data represents the somehow positive effects of the crisis, in
the sense that it lowered global imbalances. In other words, due to global trade collapse,
most countries’ balance of payments were improved. By examining the US trends in the
chart represented in Figure 8, it emerges that their current account deficit raised between
2005 and 2006 but, after the outbreak of the crisis in 2007 it started to decline. Figure 9
below represents a detailed focus on the United States’ economy.
US Trade Balance
Figure 9, US Trade Balance. Source: Baldwin (2011), Figure 2, p. 50.
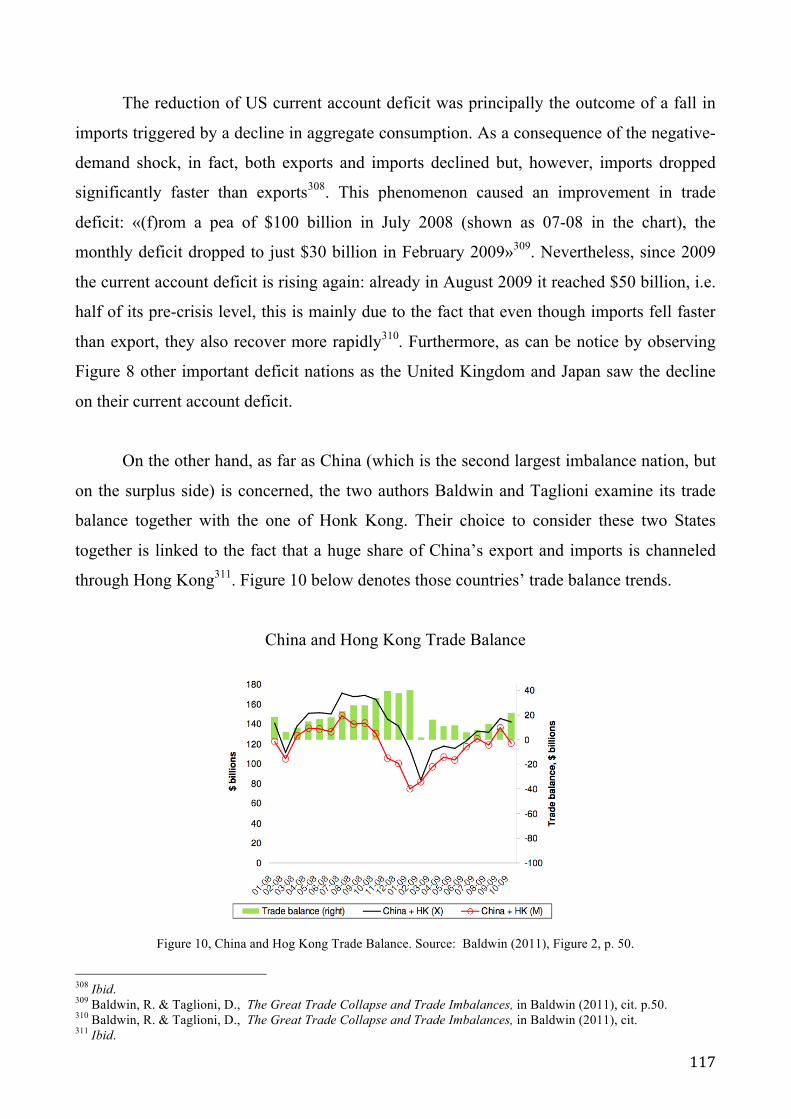
117
The reduction of US current account deficit was principally the outcome of a fall in
imports triggered by a decline in aggregate consumption. As a consequence of the negative-
demand shock, in fact, both exports and imports declined but, however, imports dropped
significantly faster than exports308. This phenomenon caused an improvement in trade
deficit: «(f)rom a pea of $100 billion in July 2008 (shown as 07-08 in the chart), the
monthly deficit dropped to just $30 billion in February 2009»309. Nevertheless, since 2009
the current account deficit is rising again: already in August 2009 it reached $50 billion, i.e.
half of its pre-crisis level, this is mainly due to the fact that even though imports fell faster
than export, they also recover more rapidly310. Furthermore, as can be notice by observing
Figure 8 other important deficit nations as the United Kingdom and Japan saw the decline
on their current account deficit.
On the other hand, as far as China (which is the second largest imbalance nation, but
on the surplus side) is concerned, the two authors Baldwin and Taglioni examine its trade
balance together with the one of Honk Kong. Their choice to consider these two States
together is linked to the fact that a huge share of China’s export and imports is channeled
through Hong Kong311. Figure 10 below denotes those countries’ trade balance trends.
China and Hong Kong Trade Balance
Figure 10, China and Hog Kong Trade Balance. Source: Baldwin (2011), Figure 2, p. 50.
308 Ibid. 309 Baldwin, R. & Taglioni, D., The Great Trade Collapse and Trade Imbalances, in Baldwin (2011), cit. p.50. 310 Baldwin, R. & Taglioni, D., The Great Trade Collapse and Trade Imbalances, in Baldwin (2011), cit. 311 Ibid.

118
As the graph demonstrates, global trade collapse caused both import and export to
fall, in this case, however, export dropped faster than imports due to the decline in other
nations’, and especially US, imports. However, with trade revival exports rose faster than
imports, thus, « (t)his has turned the monthly balance from approximately zero in February
2009 to about $20 billion in October 2009 – about half way back to its pre-crisis high, as in
the US case»312. Hence it is possible to argue that global trade collapse had a positive effect
in the sense that it improved the trade balances of the most imbalance nations as the US and
China. Nonetheless, since trade flows’ drop was caused by a negative-demand shock and
not by supply-side shock that might have hindered a fast reprise, with aggregate demand
recovery the old imbalances emerged again, threatening international stability313. Hence,
international economy’s stability being the objective, it would be desirable that
«governments should use the transition to install policies that will ensure that imbalances do
not (permanently) revert to pre-crisis trends – policies that encourage saving in the US and
prevent an overvalued dollar, and policies to stimulate spending in China and other parts of
Asia and prevent undervalued currencies»314.
4.3 The Importance of Trade Policies and of Governments’ Behavior: prospects
Today as before Governments’ behavior and policies do matter for international
economy. The existences of tariffs, quotas, and other non-tariff barriers, for instance, greatly
influence trade costs and thus trade flows. Usually policy makers decide to adopt one
measure or another for ideological reasons but, most of the times, governments uses these
tools for strategic objectives. Hence, economic history is full of episodes in which, in times
of crises policy makers adopted protectionist measures in order to safeguard the national
economy. This is why the decade after the Great Depression is defined as a moment of
globalization backlash, a period in which many nations retreated from free trade in order to
protect domestic interests315. As far as governments’ reactions are concerned, this crisis
312 Baldwin, R. & Taglioni, D., The Great Trade Collapse and Trade Imbalances, in Baldwin (2011), cit. p. 51. 313 Ibid. 314 Freund, C. The Trade Response to Global Downturns, in Baldwin (2011). 315 Findlay R. & H. O'Rourke K. H., 2007, Power and Plenty: Trade, War, and the World Economy in the Second Millennium, cit.

119
does not completely break the historical pattern even though the shift toward protectionism
was not as harsh as the one following the Great Depression316.
4.3.1 The Threat of Murky Protectionism
«On 15 November 2008, world leaders gathered in Washington DC for the first of a
series of G20 summits on the global financial crisis and its economic fallout. At that
meeting, G20 leaders pledged to eschew protectionism for 12 months»317. However, when
in the next month world trade was hit by one of the heaviest shock of the last century, world
leaders faced strong pressures against their promises not to harm foreign commercial
interests318. Thus, concerns emerged in the economic and academic communities about the
negative effects of defensive policies in the field of international trade. In order to monitor
the State’s behavior and the implementations of protectionist policies the Global Trade Alert
(GTA) database was updated and kept under control, what emerged was that «(o)f the 606
state measures investigated, 402 have already been implemented (one year after the
summit»319. Nevertheless, it is essential to take into account the fact that not all the policies
implemented actually harmed foreign commercial interest since 51 of them, for instance,
actually benefited importers (by freeing up foreign direct investments)320. The ten most used
discrimination policies are represented in Figure 11 below.
The top 10 Discriminatory Policies
Figure 11, The top 10 Discriminatory Policies. Source: Baldwin (2011) Figure 1, p. 39.
316 Evenett, S., Crisis Era Protectionism One Year After the Washington G20 Meeting, in Badwin (2011) 317 Ivi p. 37. 318 Evenett, S., Crisis Era Protectionism One Year After the Washington G20 Meeting, cit. 319 Evenett, S., Crisis Era Protectionism One Year After the Washington G20 Meeting, cit. p. 38. 320 Evenett, S., Crisis Era Protectionism One Year After the Washington G20 Meeting, cit.

120
What emerges is that the bail outs and state aid measures (i.e. financial assistance
packages) has been the most used forms of discrimination (32%), «followed by anti-
dumping, countervailing duty, and safeguard actions which collectively account for 20% of
harmful measures implemented» 321 while tariff measures accounts for 14% of total
measures. Table 1 below represents the ranking of countries which have inflicted the most
harm in the first year after the G20 meeting.
Table 1 Which countries has inflicted the most harm?
Table 1, Which countries have inflicted the most harm? Source: Baldwin (2011) Table 1, p. 40.
Nevertheless it is necessary to take into account the fact that governments’ reactions
in the aftermath of the crisis cannot be defined a repeat of the 1930s322. In fact « (f)or only 4
321 Ivi p. 39. 322 Evenett, S., Crisis Era Protectionism One Year After the Washington G20 Meeting, cit.

121
nations is the percentage of tariff lines affected by their state’s discrimination equal, or in
excess of, 25% (as during the Great Depression). (Moreover a)cross-the-board tariff
increases were not a general feature»323 of the years following the crisis.
4.3.2 The Crucial Role Played by Governments: Make in India
In the aftermath of the Crisis new connections and networks are emerging, linking
different parts of the world and their economies even tighter together. These new linkages
are growing not only spontaneously as the result of individual initiative but, on contrary,
this process is somehow driven from the top, through governmental policies. One of the
case that best embodies the importance of governments’ behavior is the Make in India
project that was devised after the crisis in order to increase the Indian participation index in
the international supply chain. In other words, this plan represents a new step toward
globalization which is even more important if we take into account the stagnation that
followed the Great Recession. Hence, the following part of this section tries to shed light on
this new, ambitious initiative.
Make In India policy is an initiative of the Indian Government announced by the
Prime Minister Novendra Modi, the leader of BJP (Bharatiya Janata Party), on September
the twenty-fifth, 2015, in New Delhi, during a function at the Vigyan Bhavan (the
convention center of the Indian Government). The final objective of this ambitious project
is to foster multinational, but also domestic, companies’ manufacturing activities in India.
Particularly, this is this is not just a political economic project but also a well-structured
marketing campaign which was introduced to attract physical-human capital and technology
(mainly through FDI) in India.
The core of this package of policies «includes major new initiatives designed to
facilitate investment, foster innovation protect intellectual property, and build best-in-class
manufacturing infrastructure»324. Specifically, the rationale behind this project is to attract
resources, every kind of resources (financial, human and intangibles as knowledge and
323 Evenett, S., Crisis Era Protectionism One Year After the Washington G20 Meeting, cit. p.41. 324 Make In India, Official Website [Available from: www.makeinindia.com ]

122
know-how), in order to boost the Indian economy mainly, but not only, through the
manufacturing sectors. In facts, this is the literal meaning of the initiative, the key word
being make: today, the majority of the items we use in everyday life (mobile phones,
televisions, radios, cloths, kitchen tools, shoes, toys) are produced in other South Asian
economies, namely China, Taiwan, Vietnam325. The aim of this set of policies is to create a
business-friendly environment in order to attracted foreign investors and entrepreneur and to
make them able to manufacture their products in India.
More precisely this program, as it is presented, will involve three kinds of broad
initiatives: new processes, new infrastructure and new sectors326. First, the new process
initiative encompasses a series of simplification of administrative scheme and a project of
skill development; second, the focus on infrastructures evolves around industrial corridors,
smart cities and the creation of National Industrial Manufacturing Zones (NIMZs); lastly the
opening up of new sectors to foreign investment represent one of the most important
novelties of Make in India.
As far as new processes are concerned, as a consequence of the implementation of these
policies, de-licensing and deregulation measures has been adopted, meaning that, nowadays
doing business in India has become more easy, both for domestic and foreign firms, due to a
significant increase in speed and transparency. For instance, the process of applying for
Industrial License & Industrial Entrepreneur Memorandum and of attaining environmental
clearances, have been made completely available online through the new eBiz portal (a
single-window IT platform) and the validity of Industrial license has been extended to three
years. State Governments will play a crucial and active role in the implementation of this
program: they «would have to simplify and rationalize (the) regulatory environment»
starting from the low local level327. In order to do this, they should place on Ministry’s and
Department’s web portal a check-list of required compliances so that every entrepreneurs
willing to start a new business or to invest in an Indian firms would know clearly and in
advance all the necessary requirements. Predictability and transparency are two of the most 325 QUORA (2014), What is the Make in India project? [Online] December 2014. Available from: https://www.quora.com/What-is-the-Make-in-India-project 326 All the following technical information about the program explained in the next paragraphs are based on the Make in India website: http://www.makeinindia.com/policy/new-initiatives 327 Ibid.

123
important attributes for any business-friendly environment and they both have to be
enhanced to attract foreign investors.
Finally, a completely new mechanism of auto-certification has been introduced for
activities that fall in the categories of «non-risk, non-hazardous business»328. This is one of
the great accomplishments of this policy since it enables a relatively fast and simple
beginning of new initiative by avoiding a long bureaucratic process. Broadly speaking, all
these new processes’ changes work in the same direction: overcoming red tape restrictions.
In economics the terms red tape refers to disproportionate bureaucratic regulation and the
excessive adherence to formal rules: this type of restrictions is of the main factors that
prevent foreign and domestic firms to create their plants and activities. The overall effect on
the economic environment is a scarcely competitive system and a slow GDP growth pace.
Thus, less restrictions and less administrative barriers support the creation of a more
attractive scenario for investments.
As far as new infrastructures are concerned, Make in India’s proponents argue that
«India’s manufacturing infrastructure and capacity for innovation is poised for phenomenal
growth: new smart cities and industrial clusters, (are) being developed in identified
industrial corridors having connectivity, (and) new youth-focused programs and institutions
(are being) dedicated to […] develop specialized skills»329. The creation of these industrial
clusters should foster advanced practice in manufacturing, by helping the spread of new
technologies through all the country. For instance, the Delhi-Mumbai Industrial Corridor
(DMIC) is one of the most ambitious projects with international perspective (since it has
been developed in collaboration and partnership with the Government of Japan) and it
should represent a model for the other developing Industrial Corridor. Moreover, a specific
body has been established in order to mange this development project: DMICDC – the
Delhi-Mumbai Industrial Corridor Development Corporation have to facilitate the creation
of all the necessary technology and infrastructures (DMICDC, 2015).
One of the most important features of Make in India is the creation of National
328 Ibid. 329 Ibid.

124
Industrial Manufacturing Zones (NIMZ). In order to appreciate the novelty of this policy it
is necessary to compare it with the pre-existing scheme of Special Economic Zones: this
policy has already been established by the previous government under the broader project of
National Manufacturing Policy. SEZs (Special Economic Zones) were deemed as foreign
territories and were subjected to a lighter taxes regime in comparison with zones that did not
fall under this categorization: manufacturing within a SEZ was meant to be way easier and
less expensive than elsewhere330. For this reason SEZs were mainly devised for export-
oriented industries: less taxes means lower production costs and thus lower final price so, as
a consequences, this scheme was meant to boost the international competitiveness of
manufacturing industries and, more in general, industrialization. It was devised as a
«[g]raduated sovereignty in the form of various special economic zones […] as a state
strategy to create spaces where liberalization and deregulation could take place in the face
of significant resistance»331.
On the other hand, NIMZs regulation will encompass all support systems like electricity,
water, roads, shopping malls, service centers, schools, hospitals and residences. They are
usually made as a model town and, thus, they will be given township status under the
respective municipalities, the reason being they should have some independence to grow as
manufacturing hubs. Furthermore, under the NIMZ scheme, a blanket clearance will be
enough for the entire zone in most of the cases. In contrast with the SEZs scheme, part of
energy required for those areas to be effective will be procured from renewable resources
and by state government subsidies to NIMZs. Strikingly, Government would pay 50% fees
for international patent application332. This is a very crucial feature of this scheme: as far as
innovation is concerned, one of the biggest problem facing India is that the rate of
investment in innovation and technological developments is very low due to a lack of
capital and purchasing new and advanced technology is very expensive. For these reasons,
governmental aid is fundamental to enable the development of new manufacturing
industries: by paying 50% of the international patent application and by providing for tax
330 Jenkins, R., Kennedy, L., & Mukhopadgyay, P. (2014). Introduction. Power, Protest, and India’s Special Economic Zones. In R. Jenkins, L. Kennedy & P. Mukhopadhyay (Eds.), Power, Policy, and Protest: The Politics of India’s Special Economic Zones. New Delhi: Oxford University Press, pp. 1-38. 331 Ivi p. 12. 332 Make in India, Official Website [Available from: www.makeinindia.com ]

125
exemptions on money spent in the acquisition of ISO (International Standards Organization)
certificates it foster the development manufacturing industries.
Lastly, one of the greatest changes, in comparison to the pre-existing policies regulating
the industrial and trade environment, concerns the opening up of different sectors to foreign
investors, in other words, the opening up to FDI (Foreign Direct Investment). Even though
India experienced a process of economic liberalization in the 1990s and some sectors were
opened up to foreign investments, those were possible only to a limited extent and for
specific sectors. Thus, the entry into force of Make in India policies has dramatically
modified the foreign direct investment regulation by easing the control over capital and
investments in high-value industrial sectors such as defense and railroads, for instance333.
Here are some of the most important changes:
o Policy in Defense sector was liberalized and FDI cap raised from 26% to 49%
o Portfolio investment in Defense sector has been permitted up to 24% under the
automatic route
o 100% of FDI under automatic route has been permitted in construction,
operation and maintenance in specified Rail Infrastructure projects such as:
§ Suburban corridor projects
§ High speed train projects
§ Dedicated freight lines
§ Rolling stock including train sets and locomotives/coaches
manufacturing and maintenance facilities
§ Railway electrification
§ Signaling systems
§ Freight terminals
§ Passenger terminals
§ Infrastructures in industrial park penetrating to railway line/sidings
including electrified railway lines and connectivity to main railway line
§ 10 Mass Rapid Transport Systems334
333 Ibid. 334 Ibid.

126
Make in India policies will have an impact of twenty-five sectors of the economy, which
includes: information technologies, electronics pharmaceuticals, chemicals, biotechnologies,
automobiles, wellness, railways, renewable energies, tourism and hospitality, leather, design
manufacturing, ports, mining, textiles, and aviation.
Appendix 1: Case study, Intermac
Intermac is a multinational company part of Biesse Group that is specialized in the
production of glass, stone and metal processing machineries. Moreover, as far as the glass
division is concerned Intermac is the international leader, being the company the first
producer of the world. As the majority of industry producing durable goods it was severely
hit by the Great Recession and by the Global Trade Collapse. Nevertheless, starting from
2010 it began a process of recovery and growth, up to the point that it outreached its pre-
crisis turnover. Thus, this case study focuses on an Italian business which perfectly
embodies the recovery experienced by world trade in the last years. Hence, this paragraph
examines the development of Intermac’s business with special attention to the period of
trade recovery that started in 2010. The main objective of this analysis is to demonstrate
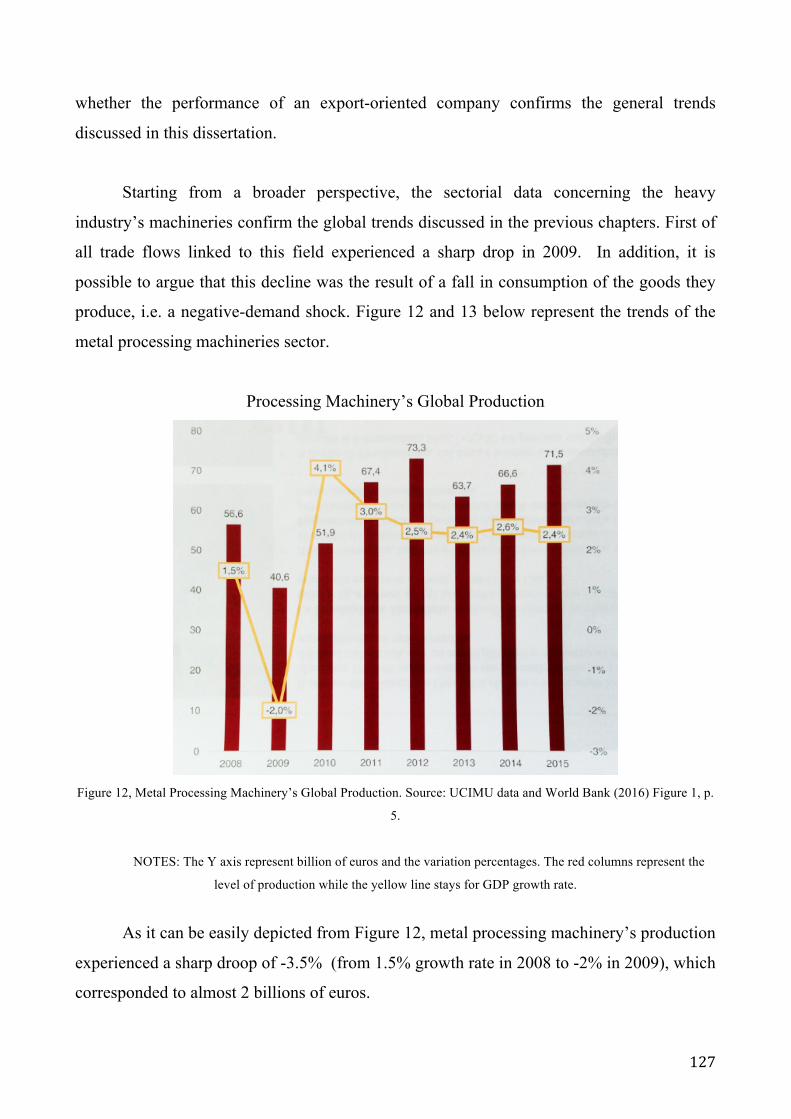
127
whether the performance of an export-oriented company confirms the general trends
discussed in this dissertation.
Starting from a broader perspective, the sectorial data concerning the heavy
industry’s machineries confirm the global trends discussed in the previous chapters. First of
all trade flows linked to this field experienced a sharp drop in 2009. In addition, it is
possible to argue that this decline was the result of a fall in consumption of the goods they
produce, i.e. a negative-demand shock. Figure 12 and 13 below represent the trends of the
metal processing machineries sector.
Processing Machinery’s Global Production
Figure 12, Metal Processing Machinery’s Global Production. Source: UCIMU data and World Bank (2016) Figure 1, p.
5.
NOTES: The Y axis represent billion of euros and the variation percentages. The red columns represent the
level of production while the yellow line stays for GDP growth rate.
As it can be easily depicted from Figure 12, metal processing machinery’s production
experienced a sharp droop of -3.5% (from 1.5% growth rate in 2008 to -2% in 2009), which
corresponded to almost 2 billions of euros.
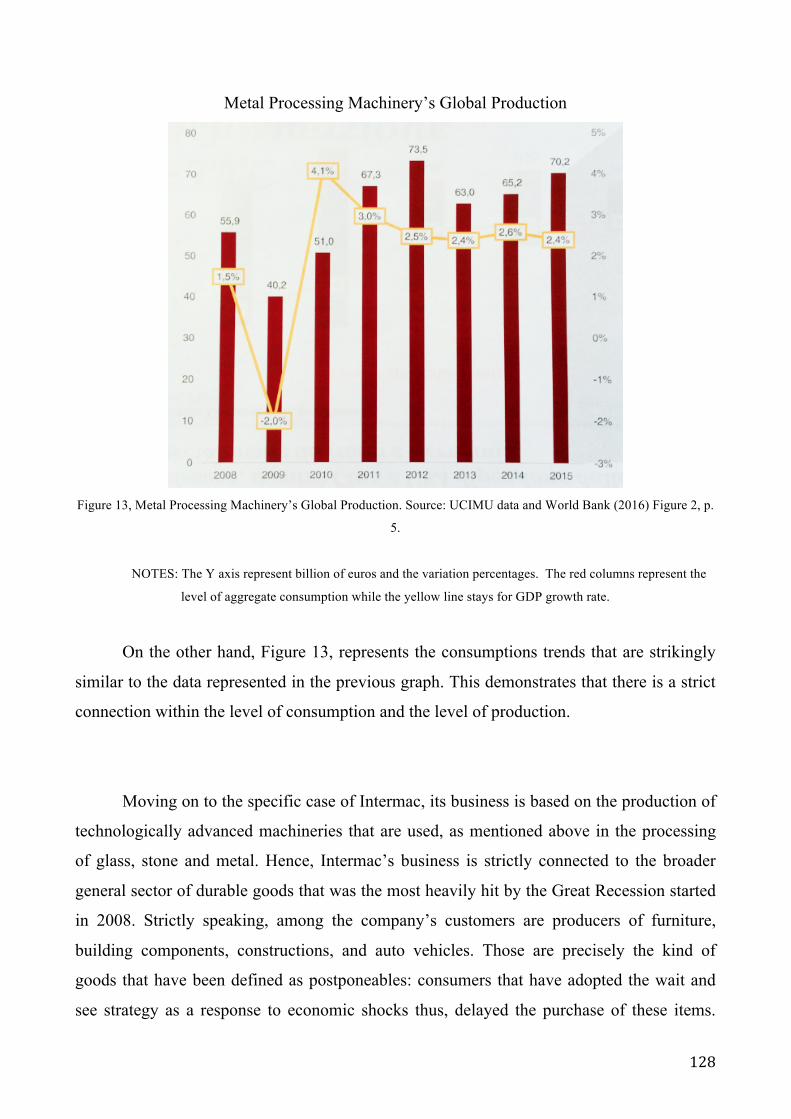
128
Metal Processing Machinery’s Global Production
Figure 13, Metal Processing Machinery’s Global Production. Source: UCIMU data and World Bank (2016) Figure 2, p.
5.
NOTES: The Y axis represent billion of euros and the variation percentages. The red columns represent the
level of aggregate consumption while the yellow line stays for GDP growth rate.
On the other hand, Figure 13, represents the consumptions trends that are strikingly
similar to the data represented in the previous graph. This demonstrates that there is a strict
connection within the level of consumption and the level of production.
Moving on to the specific case of Intermac, its business is based on the production of
technologically advanced machineries that are used, as mentioned above in the processing
of glass, stone and metal. Hence, Intermac’s business is strictly connected to the broader
general sector of durable goods that was the most heavily hit by the Great Recession started
in 2008. Strictly speaking, among the company’s customers are producers of furniture,
building components, constructions, and auto vehicles. Those are precisely the kind of
goods that have been defined as postponeables: consumers that have adopted the wait and
see strategy as a response to economic shocks thus, delayed the purchase of these items.
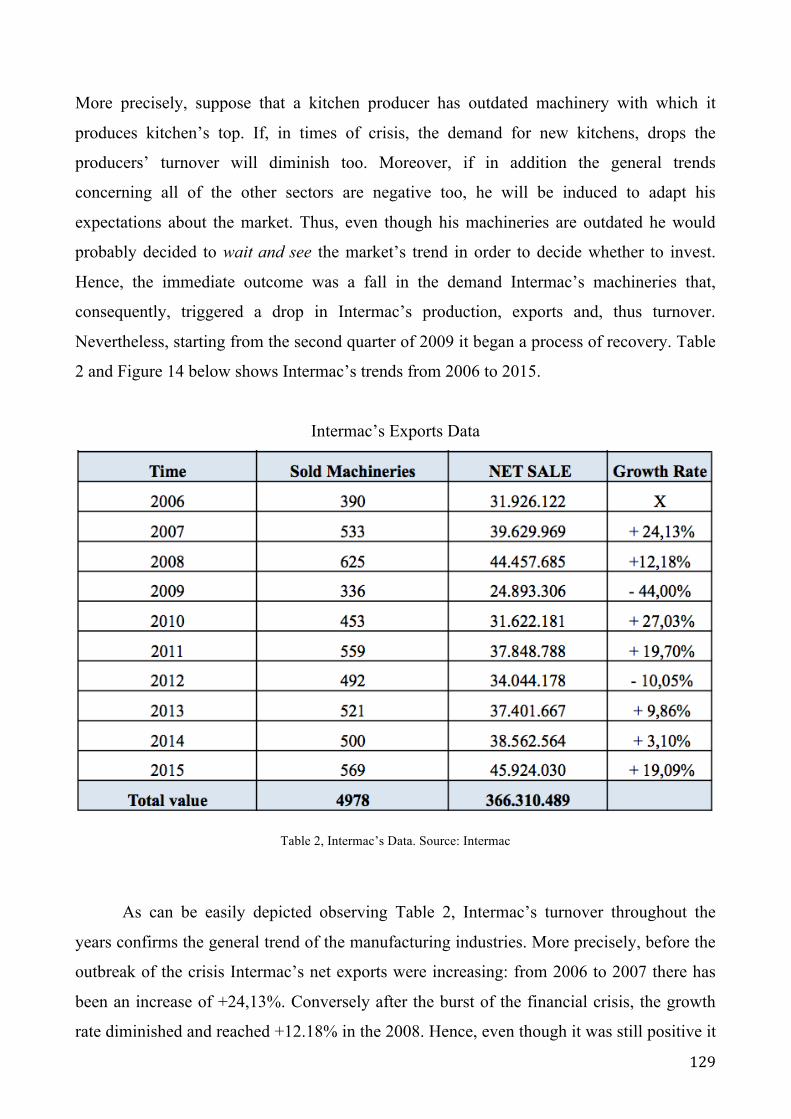
129
More precisely, suppose that a kitchen producer has outdated machinery with which it
produces kitchen’s top. If, in times of crisis, the demand for new kitchens, drops the
producers’ turnover will diminish too. Moreover, if in addition the general trends
concerning all of the other sectors are negative too, he will be induced to adapt his
expectations about the market. Thus, even though his machineries are outdated he would
probably decided to wait and see the market’s trend in order to decide whether to invest.
Hence, the immediate outcome was a fall in the demand Intermac’s machineries that,
consequently, triggered a drop in Intermac’s production, exports and, thus turnover.
Nevertheless, starting from the second quarter of 2009 it began a process of recovery. Table
2 and Figure 14 below shows Intermac’s trends from 2006 to 2015.
Intermac’s Exports Data
Table 2, Intermac’s Data. Source: Intermac
As can be easily depicted observing Table 2, Intermac’s turnover throughout the
years confirms the general trend of the manufacturing industries. More precisely, before the
outbreak of the crisis Intermac’s net exports were increasing: from 2006 to 2007 there has
been an increase of +24,13%. Conversely after the burst of the financial crisis, the growth
rate diminished and reached +12.18% in the 2008. Hence, even though it was still positive it

130
was half of the growth rate of the previous year. At the end of 2008, i.e. before the financial
crisis spread to the real economy, Intermac’s net sale (to the rest of the world) was
39.629.969 billion of euros. Then, as a consequence of the Great Depression, net exports’
growth rate abruptly collapsed in 2009 reaching - 44%. Nevertheless, starting from the
second quarter of 2009 export’s level started increasing again: 2010 registered +27%.
Figure 14 below show the trends described in the previous lines.
Intermac’s Export Trends
Figure 14, Intermac’s Export Trend. Source: Intermac.
NOTES: Y-axis unit of measure is billion of euros.
It is interesting to notice that Intermac’s performance followed the trends described
in Figure 2 above, according to which the reprise of the machinery and machine parts
category was slower than the others. As the graph in Figure XX demonstrates, in fact, this
business’ export levels, in fact, reached its pre-crisis level only at the beginning of 2015.
131
CONCLUSION
This dissertation tried to examine one of the most important phenomena of
contemporary economy. Even though there are many differences, the recent crisis has been
often compared to the Great Depression: an event that is considered a watershed in the
economic and historical literature. Almost eighty years later another catastrophic event
shook the international stability. In a world characterized by huge imbalances, the key
players (e.g. the United States and China) ran either current account deficit of current
account surplus, being respectively a net debtor or a net creditor. These are only two side of
the same coin since both the cases involve a high degree of vulnerability. However, the
huge worldwide imbalances were not the only causes of instability: starting from the
eighties in fact finance had undertook a process of liberalization and deregulation, the
banking system itself has been deeply modify and changed its real nature, and leverage
became excessively high. The free movement of capital and the financial liberalization
created the scenario in which al the most important commercial and investment bank were
strictly connected to each other. Regardless of this huge causes of instability, however, the
world economy was growing at an increasing pace in the first years of 2000, only few knew
that this growth was under certain perspective artificial, based on excessive leverage, a
massive flow of liquidity and fragile real economy basis. The outburst of the real estate
bubble in the United States brought these imbalances and fragilities to light. Due to the
strong connection between the real estate sector and the banking system based on the newly
132
created assets of derivatives, the general insolvency was rapidly transformed in a banking
crisis and then in a financial crisis. It was just a matter of time and, through various
transmission channels, the most important of which was the so-called credit crunch, the
financial crisis became an economic crisis. The sudden stop of capital flow to Europe,
moreover, triggered the sovereign-debt country in this region.
The crisis was synchronized, severe, and sudden and world trade collapsed.
According to the economic literature, the main explanation for trade flows drop is linked to
the negative-demand shock: after the Lehman Brother default a feeling of uncertainty about
the next future began to affect not only economists but also the common consumer. People
adopted the wait and see strategy and aggregate consumption, and thus demand froze. Less
consumption means also lower imports, and, in a globalized world characterized by the
existence of vertical linkages, a falling demand for final goods doubles its effect through the
collapse of trade in intermediate inputs. This helps explaining why world trade fell more
than world GDP. In other words, the international supply chains amplified the effect of the
crisis: the fact that the production process is fragmented across the world meant that the
negative-demand shock moved even more rapidly across border. In addition, due to scarce
credit availability also the level of investment dropped and many firms were force to scale
down their production, thus negatively affecting their suppliers and clients. World trade
began its recovery process already in 2010, even if it slowed down in 2011 due to the
European sovereign-debt crisis. The reprise was faster in emerging countries since these
areas experienced the crisis mainly as an external shock linked to a fall of their exports due
to the drop in other countries’ imports. In other words, they did not have the same structural
fragilities that affected the most developed countries, nor were their national banks as
involved as the most important western banks.
Nonetheless, the Global Trade Collapse has left its marks on international economy.
Economic history has taught that financial crises usually have deeper and long lasting
effects than mere real economy crises on the most directly affected countries. Trade patterns
are changing, with an increase of the share of South-South trade, emerging countries’
income growth and thus demand (both in intermediates and in final goods) is rising in
comparison with developed countries’. Hence, as a result of the Great Recession,

133
developing countries are less dependent on high-income regions imports. On the other hand,
international production structures are moving towards consolidation, in the sense that the
dispersion of the global value chain is declining. One of the reasons that can account for this
trend is the fact that in case of crises government tend to protect domestic interest through
protectionist policies that generally harm international trade. The appeal to protectionism, in
fact, characterized also this crisis. Nevertheless, together with recovery, governments’
attitude is changing toward world economic integration as the Make in India case
demonstrates.
To conclude, it is undeniable that today global trade’s growth rate is far below the
level it would have been in absence of the Great Recession. Nevertheless, it is crucial to
remember that the high-growth rate experienced by world trade between 2002 and 2008 was
also the outcome of a, extra-ordinary buoyant context which was characterized by excessive
liquidity and consumption in many developed regions. The recent crisis has demonstrated
how global imbalances and excessive leverage represent a threat for international stability.
Solving these structural problems will be essential to the development of a stable
international environment.

134
BIBLIOGRAPHY
Altomonte, C., Di Mauro, F., Ottaviano, G., Rungi, A. & Vicard V., 2012, Global Value
Chains during The Great Trade Collapse, a bullwhip effect?, European Central Bank
Working Paper.
Araujo, S. & Martins O. J. (2009), The Great Synchronization: what do high-frequency data
statistics tell us about the trade collapse?, VoxEu.org, 8 July 2009.
Baldwin, R., 2011, The Great Trade Collapse: Causes, Consequences and Prospects, A
VoxEU.org Publication
Bems, R., Johnson, R. C & Kei-Mu Yi, 2012, The Great Trade Collapse, National Bureau
of Economic research, Cambridge, MA.
Bems, R, Johnson, R. C., & YI Kei-Mun (2010), The Role of Vertical Linkages in the
Propagation of the Global Downturn of 2008, Federal Bank of Philadelphia.
Bernanke, B. S., Asia and the Global Financial Crisis – Speech, Board of Governors of the
Federal Reserve System, October 19, 2009 [Available from:
http://www.federalreserve.gov/newsevents/speech/bernanke20091019a.htm]
Betting the Earth [online]. Dissent, No. 28, Summer 2008 - 2009: 6-9. Availability:
<http://search.informit.com.au/documentSummary;dn=531480593191928;res=IELLCC>
ISSN: 1443-2102. [cited 10 Mar 16].
Black, S. & Cusbert T., ( 2010) Durable Goods and the Business Cycle, Reserve Bank of
Australia [Available from: http://www.rba.gov.au/publications/bulletin/2010/sep/2.html]
Blanchard, O., Amighini, A. & Giavazzi, F., 2010, Macroeconomia, Il Mulino.
135
Blanchard, O. & Milesi-Ferretti G. M., 2009, Global Imbalances: In Midstream?,
International Monetary Fund
Bochert, I. & Mattoo, A. (2009), The Crisis-Resilience of Services Trade, World Bank
Policy Research Working Paper, No. 4917, April 2009.
Canuto, O. & Leipziger, D.M., 2012 Ascent after Decline: Regrowing Global Economies
after the Great Recesssion, The World Bank
Chauffour, J. & Malouche, M., 2011, Trade Finance During the Great Trade Collapse, The
World Bank
Chen, N. & Juvenal, L. (2016), Quality and the Great Trade Collapse, IMF Working Paper
16/30.
Eichengreen, B. & O’Rourke, K. 2010, A tale of two Depressions: what the new data tell
us? VoxEU.org [Available from: http://voxeu.org/article/tale-‐two-‐depressions-‐what-‐
do-‐new-‐data-‐tell-‐us-‐february-‐2010-‐update]
European Commission, Economic and Financial Affairs (2012) Volume 11 – Issue 2
Quarterly Report on the euro area, July 2012. [Available online from:
http://ec.europa.eu/economy_finance/publications/qr_euro_area/2012/pdf/qrea2_section_1_
en.pdf]
Escaith, H. & Gonguet, F., (2011) International Supply Chains as Real Transmission
Channels of Financial Shocks, The Capco Institute Journal of Financial Transformation.
Feenstra, R. C. & Taylor, A. M., 2014, International Economics, 3rd Edition, Worth
Publishers.
Findlay R. & H. O'Rourke K. H., 2007, Power and Plenty: Trade, War, and the World
Economy in the Second Millennium, Princeton University Press.

136
Global trade begins 2014 in lacklustre fashion, July 18th 2014, The Economist [Available
online from:
http://country.eiu.com/article.aspx?articleid=552032439&Country=Hong%20Kong&topic=
Economy&subtopic=Forecast ]
Hillsberg, A. How & Where iPhone is Made: Comparison of Apple’s Manufacturing
Process, September 17, 2014 [Available Online from: http://comparecamp.com/how-where-
iphone-is-made-comparison-of-apples-manufacturing-process/]
Hoeckman, B., 2015, The Global Trade slowdown: A New Normal?, VoxEu.org
Iacovone, L. & Zavacka, V. (2009) Banking crises and exports: Lessons from the Past,
Vox.org. [Available from: http://voxeu.org/article/banking-crises-and-exports-lessons-past]
Jenkins, R., Kennedy, L., & Mukhopadgyay, P. (2014). Introduction. Power, Protest, and India’s
Special Economic Zones. In R. Jenkins, L. Kennedy & P. Mukhopadhyay (Eds.), Power, Policy,
and Protest: The Politics of India’s Special Economic Zones. New Delhi: Oxford University
Press, pp. 1-‐38.
Krugman, P. R. & Maurice Obstfeld, 2008, International Economics: Theory and Policy,
Addison-Wesley, 8th edition, Prentice Hall.
Make In India, Official Website [Available from: www.makeinindia.com ]
Miroudot S. & De Backer K.,Working Party of the Trade Commitee (2012) Mapping
Global Value Chains, The OECD Conference Centre, Paris.
O’Rourke, K. Collapsing trade in a Barbie world, The Irish Economy, July 18 2009. [Available
online from: http://www.irisheconomy.ie/index.php/2009/06/18/collapsing-‐trade-‐in-‐a-‐
barbie-‐world/]

137
Obstfeld, M. & Rogoff, K., 2009, Global Imbalances and the Financial Crisis: products of
common causes, Berkley, Santa Barbara.
QUORA (2014), What is the Make in India project? [Online] December 2014. Available
from: https://www.quora.com/What-is-the-Make-in-India-project
Shik Kang, J. & Shambaugh J.C., The Evolution of Current Account Deficits in the Euro
Area Periphery and the Baltics: many Path to the Same Endpoin, IMF Working paper
[Available online from: https://www.imf.org/external/pubs/ft/wp/2013/wp13169.pdf].
Tanaka, K., 2009, Trade Collapse and Vertical Foreign Direct Investment, VoxEU.org
The Autombile Industry in and Beyond the Crisis, OECD [Available online from:
https://www.oecd.org/eco/outlook/44089863.pdf]
Verbatim of the remarks made by Mario Draghi, The European Central Bank Website
[Available online from:
https://www.ecb.europa.eu/press/key/date/2012/html/sp120726.en.html].
Wolf, M. 2015, The Shifts and the Shocks, Penguin, Great Britain.

138

139
ABSTRACT
The main objective of this dissertation is to shed light on one of the most relevant
phenomenon that affected contemporary economy: the Global Trade Collapse. The
magnitude of this event is such that, even though there are many differences, the recent
crisis has been often compared to the Great Depression of the thirties: an event that is
considered a watershed in the economic and historical literature.
After a period of impressive and extra-ordinary growth rate, as a consequence of the
financial crisis of 2007-2008, in 2009 world GDP and international trade flows dropped
sharply, and continued falling for at least one year. Concealed under the quiet surface of
increasing growth, in fact, the world economy was characterized by both real economy and
financial severe imbalances. The aim of this dissertation is to shed light on the dynamics
that stand behind these macro economic movements: where did the Global Trade Collapse
originate? And what are its effects on the international economy?
Since the Great Recession that produced the international trade collapse was
ultimately triggered by the financial crisis of 2007-2008, the first chapter focuses on this
topic. Broadly speaking, the international financial system presented a series of structural
fragilities that made it vulnerable to either exogenous or endogenous shocks. Starting from

140
le last decades od the twentieth century four different but connected processes began
undermining the basis of the international finance structure and contributed to the outbreak
of the Subprime crisis. First, starting from the first years of the eighties a wave of financial
liberalization and deregulation, strictly connected to the mounting political-economic
doctrine of new-liberalism, spread all over the world, starting from the United Kingdom and
the United States. Second, the banking system itself undertook a process of transformation.
As Martin Wolf pointed out, in fact: funding, banking and holdings of the new assets,
started a process of globalization335. One of the consequences of this process was that the
current account deficit of most of the countries was funded, and thus sustained, through
international bank financing, extremely increasing the level of interdependency across the
world. Moreover, starting from 2000, with the creation of the new financial instrument of
derivatives most of the commercial banks stopped holding the instruments of credit they
issued, lowering the quality of mortgages. In the meanwhile, a series of legal, technical and
organizational innovations, as the establishment of the shadow banking system and the
creation of derivatives resulted in faster but less transparent transnational transactions over
which national or supranational authorizes had almost no control. Lastly, overall «leverage
of non-financial borrowers, such as house buyers, who borrowed more relative to the value
of houses; leverage embedded in new instruments, particularly derivatives; and leverage
inside the financial sector itself, […] became extraordinarily high in many institutions»336.
After a period of rising inflation in the first years of 2000, the outburst of subprime
bubble in the United States, via a phenomenon of general mortgage insolvency, triggered
the great financial crisis in the 2007. Due to the strict connection between two of the most
important financial centers, Wall Street and the City (the London Stock Exchange) the
shock was easily transmitted in Europe. The transmission happened through two main
channels: first, via the newly created financial instruments (as CBO and CDS) that were
held by many of the most important European banks; second, the turmoil of the financial
and banking system caused the so called sudden stop or credit crunch. When the movement
of capital was frozen and liquidity dried-up, those European countries that were heavily
reliant on capital inflow in order to finance their huge current account deficits found
335 M. Wolf, The Shifts and the Shocks, Penguin, Great Britain, 2015. 336 M. Wolf, The Shifts and the Shocks, cit. p. 131.

141
themselves on the brink of bankruptcy. The outcome of both the financial and sovereign-
debt crisis was the Great Recession: world GDP impressively dropped by almost 30% in
2009337 reflecting a sharp fall in investment and consumption and causing a huge depression
in the most-hit economies, reflected by an extremely high level of unemployment.
The second chapter sheds light on the phenomenon of the Global Trade Collapse
itself and on the channel of transmission that made it possible for the financial crisis to
trigger the drop of trade flows. Through data and figures it shows how the Great Recession
ruthlessly hit international trade flows: each country’s volume of exports and imports, in
fact, dropped by more than 20% in the period between the end of 2008 and the second
quarter of 2009338. Even though the world economy had already experienced various severe
crises (e.g. the Great Depression, the Oil Crises) none of then was so sudden, so severe and
so synchronized as the one of 2008339. More in detail, what made such an astounding
plummet possible was the fact that trade dropped simultaneously in most of the OECD
countries. As Baldwin underlines: «All 104 nations on which the WTO reports data
experienced a drop in both import and export during the second half of 2008 and the first
half of 2009. […] World trade in almost every product category was positive in 2008Q2,
almost all were negative in 2008 Q4 and all were negative in 2009Q1»340. The principal
cause of international trade collapse was a massive negative-demand shock that affected
primarily durable/manufactured goods. The Lehman Brothers accident, i.e. the fact that one
of the five most important investment banks was not bailed out, created in the market the
belief that the situation was becoming more and more out of control341. It was the
occurrence of this single event that created the so-called «fear factor»342, that triggered the
“wait and see” behavior of consumers and investors that froze the market and thus trade.
Strictly speaking, consumers began to postpone the purchase of durable and high quality
goods (e.g. cars, refrigerators, machineries). The collateral effects were even wider: a fall in
337 Baldwin, R., 2011, The Great Trade Collapse: Causes, Consequences and Prospects, A VoxEU.org Publication. 338 Ibid. 339 Ibid. 340 Baldwin, R., 2011, The Great Trade Collapse: Causes, Consequences and Prospects, cit. 341 Ibid. 342 Baldwin, R., 2011, The Great Trade Collapse: Causes, Consequences and Prospects, cit. p. 10.

142
the demand, and thus production, of the related intermediate inputs343 via the international
supply chains.
In addition, a trade-specific credit crunch and a rise in trade cost deeply undermined
international trade. If we consider the data relative to trade financing we discover that there
had been a drop in cross-border lending after the default of Lehman Brothers and this
plunge resulted in a limited availability of liquidity for trade financing344. Nevertheless, it is
important to remind that «(b)anks and suppliers judge reduced trade financing as the
number two contributor to the decline in global exports, after the falling global demand»345.
On the other hand, the increase of trade cost is obviously strictly connected with the scarce
availability of trade financing.
Moreover, as the theses exposed in third chapter demonstrate, the existence of
international supply chains significantly amplified the effect of both the financial crisis and
of the Great Recession. The fragmentation of the various stages of the production chains
across the world, in fact, means that trade flows are based not only of final goods but also
on intermediates. Hence, on the one hand, low availability of credit was extremely
disruptive due to the existence of vertical linkages. Broadly speaking, in fact, the dynamic is
the following: «(b)ecause firms rely on suppliers in carrying out part of the production
process (outsourcing or off-shoring), and/or because they sell their production to other
firms, the smooth realization of production plans from initial investment to final sales
depends on the availability of credit at all stages of the production chain»346.Strictly
speaking, if as a result of the credit crunch, a firm’s request for credit is denied, the
company will be forced to scale down its production, adversely affecting both its suppliers
and clients across the world. On the other hand, the existence of vertical linkages magnified
also the effect of the negative-demand shock. As the O’Rourke Barbie doll example
brilliantly explains, «(e)very time the US buys one fewer Barbie doll, trade declines not
only by the value of the finished doll, but by the value of all the intermediate trade flows
343 Ibid. 344 Mora, J. & Powers, W., Did trade credit problems deepen the great trade collapse? Cit. 345 Mora, J. & Powers, W., Did trade credit problems deepen the great trade collapse? Cit. p. 117. 346 Escaith, H. & Gonguet, F., (2011) International Supply Chains as Real Transmission Channels of Financial Shocks, The Capco Institute Journal of Financial Transformation, cit. p.84.

143
that went into creating it»347. Hence, an «adverse external shocks may affect firms not only
through final demand (a sudden decline in exports), but also through a disruption of the
flow of inputs received from their suppliers»348.
To conclude, the last chapter describes the recovery process and the effects of the
Global Trade Collapse on the structures of international economy. Broadly speaking, the
recovery of global trade was relatively rapid, according to the European Commission data,
in fact, the volume of world trade reached its pre-crisis level already in the mid of 2010349
even though, the reprise has slow down in the second quarter of 2011 as a consequence of
the European sovereign-debt crisis, of the Japanese Tōhoku earthquake of March the 11th
2011 that caused a drop in the level of production of that country, and of the uncertainty
concerning US fiscal policy.
Overall, it is interesting to notice that while global trade collapse was extremely
synchronized, the path of reprise was characterized by a significant asymmetry both in
regional and sectorial terms. On the one hand, as far as regional diversity is concerned,
different areas of the world reacted differently to trade collapse depending on the way in
which the crisis hit their own economies350. Some countries, as the US, or regions, as the
European Union, has been hit by both the financial crisis and the real/trade crisis, hence
these countries experienced a relatively slow recovery. Conversely, many emerging
countries were affected only by the negative-demand shock via a sharp decrease in the
demand for their exports, thus these areas saw a relatively rapid reprise. As far as disparity
at the sectorial level is concerned, in this case the pace of recovery was different depending
on product categories. This phenomenon is principally due to the price effect discussed in
chapter two of this dissertation. More in detail, «(i)n nominal terms, exports of crude
materials, which are subject to large price fluctuations, had exceed their pre-crisis peak by
347 O’Rourke, K. Collapsing trade in a Barbie world, The Irish Economy, July 18 2009. [Available online from: http://www.irisheconomy.ie/index.php/2009/06/18/collapsing-trade-in-a-barbie-world/] 348 Escaith, H. & Gonguet, F., (2011) International Supply Chains as Real Transmission Channels of Financial Shocks, The Capco Institute Journal of Financial Transformation, cit. p. 84. 349 European Commission, Economic and Financial Affairs (2012) Volume 11 – Issue 2 Quarterly Report on the euro area, July 2012. [Available online from: http://ec.europa.eu/economy_finance/publications/qr_euro_area/2012/pdf/qrea2_section_1_en.pdf] 350 Ibid.

144
30% in 2011, while fuel exports were 23% below levels seen in 2007»351. The latter trend
was conditioned by the fact that oil prices were significantly high before the outbreak of the
crisis (price effect).
However, Global Trade Collapse has left lasting marks on the international economy.
First of all, on the demand-side there has been a regional shift in favor of emerging markets
in terms of income growth and, thus, import demand352. In fact, «(s)ince the 1990s,
emerging markets economies have gradually increased their share of global output,
accounting for half of the world GDP in 2011 (based on purchasing-power parity
valuation)»353. This means that, nowadays, the growth of international trade is more
widespread across countries in comparison to the last decades of the 21th century when the
main contributors of world GDP were few advanced countries. Conversely, on the supply-
side one of the effects of the Great Recession on international economy was a change in
countries’ export shares and product composition354. This dynamic is strictly correlated to
the transformations in the demand-side: due to the fall and stagnation of developed
countries’ demand there have been an increase in south-south trade. Hence, not only
emerging countries saw their import level growing in the last years but, in addition, their
export’s share augmented too. Hence, as a result of the Great Recession, developing
countries are less dependent on high-income regions imports. Even though it is important to
take into consideration the fact that today high-income advanced countries still accounts
«for two thirds of emerging markets’ exports»355 Moreover, even though the crisis has not
triggered a process of dis-integration and vertical linkages have been quickly restored, there
has been a change in terms of international supply chains consolidation. If global value
chains of certain sectors undertake a process of consolidation it means that the number of
stages in the production process diminishes together with trans-border transaction356, i.e. the
dispersion of the production process declines. Lastly, as far as financial aspects of the crisis
351 European Commission, Economic and Financial Affairs (2012) Volume 11 – Issue 2 Quarterly Report on the euro area, July 2012, cit. p. 12. 352 European Commission, Economic and Financial Affairs (2012) Volume 11 – Issue 2 Quarterly Report on the euro area, July 2012, cit. 353 Ivi p.10. 354 Ibid. 355 Ivi p.11. 356 European Commission, Economic and Financial Affairs (2012) Volume 11 – Issue 2 Quarterly Report on the euro area, July 2012, cit.

145
are concerned, broadly speaking economic history has taught that financial crises usually
have deeper and long lasting effects than mere real economy crises on the most directly
affected countries. This is primarily do to the fact that scarce credit availability constraints
aggregate investments and thus reduces gross national output; moreover also aggregate
income, and hence imports will be negatively affected357 for a longer period. In addition, on
the financial side, bank intermediate trade financing is still suffering the effect of the
crisis358 thus slowing the recovery process.
Nevertheless, it is interesting to notice that, even though the outbreak of the financial
crisis of 2007 was, under certain aspect, the consequence of those wide dis-equilibrium,
interestingly, with the occurrence of the Great Recession, «the resulting collapse of imports
and exports rapidly improved global imbalances since the gap between exports and imports
ineluctably falls at the same pace as underlying export and import flows»359. In other words,
due to global trade collapse, most countries’ balance of payments had been improved. The
reduction of US current account deficit, for instance, was principally the outcome of a fall in
imports triggered by a decline in aggregate consumption. As a consequence of the negative-
demand shock, in fact, both exports and imports declined but, however, imports dropped
significantly faster than exports360. This phenomenon caused an improvement in trade
deficit: «(f)rom a pea of $100 billion in July 2008 (shown as 07-08 in the chart), the
monthly deficit dropped to just $30 billion in February 2009»361. Nevertheless, since 2009
the current account deficit is rising again: already in August 2009 it reached $50 billion, i.e.
half of its pre-crisis level, this is mainly due to the fact that even though imports fell faster
than export, they also recover more rapidly362. Hence, international economy’s stability
being the objective, it would be desirable that «governments should use the transition to
install policies that will ensure that imbalances do not (permanently) revert to pre-crisis
trends»363.
357 Ibid. 358 Ibid. 359 Baldwin, R. & Taglioni, D., The Great Trade Collapse and Trade Imbalances, in Baldwin (2011). 360 Ibid. 361 Baldwin, R. & Taglioni, D., The Great Trade Collapse and Trade Imbalances, in Baldwin (2011), cit. p.50. 362 Ibid. 363 Freund, C. The Trade Response to Global Downturns, in Baldwin (2011).
146
Lastly, it is important to underline that the Global Trade Collapse had affected also
the sphere of international trade policies. The economic history is full of episodes in which,
in times of crises policy makers adopted protectionist measures in order to safeguard the
national economy. This is why the decade after the Great Depression is defined as a moment
of globalization backlash, a period in which many nations retreated from free trade in order
to protect domestic interests364. As far as governments’ reactions are concerned, this crisis
does not completely break the historical pattern even though the shift toward protectionism
was not as harsh as the one following the Great Depression365. When world trade was hit by
one of the heaviest shock of the last century, world leaders faced strong pressures in favor
of protectionism. Thus, concerns emerged in the economic and academic communities
about the negative effects of defensive policies in the field of international trade. To monitor
the State’s behavior and the implementations of protectionist policies the Global Trade Alert
(GTA) database was updated and kept under control, what emerged was that «(o)f the 606
state measures investigated, 402 have already been implemented (one year after the
summit»366. Nevertheless, it is essential to take into account the fact that not all the policies
implemented actually harmed foreign commercial interest since 51 of them, for instance,
actually benefited importers (by freeing up foreign direct investments)367. With trade
recovery not only the majority of these measures are being dismantled, but there are also
important emerging countries as India (with its Make in India project) that are further
opening up their economies.
To conclude, global trade’s growth rate is today far below the level it would have
been in absence of the Great Recession368. Nevertheless, it is crucial to take into account
that the high growth rate experienced by world trade and world GDP between 2002 and
2008 was also the outcome of a, extra-ordinary buoyant context which was characterized
«by a global liquidity glut and excessive consumption in several advanced countries»369.
364 Findlay R. & H. O'Rourke K. H., 2007, Power and Plenty: Trade, War, and the World Economy in the Second Millennium, cit. 365 Evenett, S., Crisis Era Protectionism One Year After the Washington G20 Meeting, in Baldwin (2011) 366 Ivi p. 38. 367 Evenett, S., Crisis Era Protectionism One Year After the Washington G20 Meeting, cit. 368 European Commission, Economic and Financial Affairs (2012) Volume 11 – Issue 2 Quarterly Report on the euro area, July 2012, cit. 369 European Commission, Economic and Financial Affairs (2012) Volume 11 – Issue 2 Quarterly Report on the euro area, July 2012, cit. p. 9.
147
Hence, it is likely that, at least in the medium term, trade will grow with the trend growth
observed in the 90s370.
370 Ibid.