the geographic pattern of china's growth and convergence ... · pdf filetextile and food...
TRANSCRIPT

Highlights
Since the mid-2000s, the center of gravity of China’s growth has shifted from the coastline to the inland and regional income gap has ceased to increase.
This macroeconomic catch-up refl ects, with a time lag, the rapid convergence process which has been taking place in China’s manufacturing industry since the end of the 1990s.
The Chinese case confi rms the existence of an unconditional and rapid convergence in manufacturing industry.
The Geographic Pattern
of China's Growth
and Convergence within Industry
No 2014-04 – February Working Paper
Françoise Lemoine, Grégoire Mayo, Sandra Poncet & Deniz Ünal
CEPII Working Paper The Geographic Pattern of China’s Growth and Convergence within Industry
Abstract
Since the mid-2000s, the center of gravity of China’s economic growth has shifted from the coastline to the inland and the gap in GDP per capita between the two areas has narrowed. This macroeconomic catch-up refl ects, with a time lag, the convergence process which has been at work in manufacturing industry since the end of the 1990s and suggests that China is becoming increasingly integrated in terms of technological level. This pattern is in line with a process whereby the inland catches up the labor productivity level of the coast thanks to the transfer of technology and capital from these most advanced regions.
Keywords
China, Regional inequality, Manufacturing industry, Convergence, Growth.
JEL
F63, O14, O25, O53, R12.
CEPII (Centre d’Etudes Prospectives et d’Informations Internationales) is a French institute dedicated to producing independent, policy-oriented economic research helpful to understand the international economic environment and challenges in the areas of trade policy, competitiveness, macroeconomics, international fi nance and growth.
CEPII Working PaperContributing to research in international economics
© CEPII, PARIS, 2014
All rights reserved. Opinions expressed in this publication are those of the author(s) alone.
Editorial Director:Sébastien Jean
Production: Laure Boivin
No ISSN: 1293-2574
CEPII113, rue de Grenelle75007 Paris+33 1 53 68 55 00
www.cepii.frPress contact: [email protected]
Working Paper
CEPII Working Paper The Geographic Pattern of China’s Growth and Convergence within Industry
1
The Geographic Pattern of China's Growth and Convergence within Industry
Françoise Lemoine, Grégoire Mayo, Sandra Poncet, Deniz Ünal*
1. Introduction
In China, regional inequality and geographic imbalances go hand in hand as the dividing line
between advanced and backward provinces roughly coincides with the dichotomy between
coast and inland. This dichotomy has structured China’s development process since the
19th century as the center of gravity of the economy has been alternately located in the coast
and in the interior.
From the early 1990s to the late 2000s, China’s rapid economic growth was associated with
widening regional disparities and growing spatial imbalances. A reversal has been underway
since recently: regional inequality peaked in the mid-2000s and the center of gravity of the
economy has begun to move from the advanced eastern region to the inland.
The paper analyses the regional pattern of economic growth in the long run and focuses on
the evolution of manufacturing industry as the main determinant of the recent reversal. It
argues that industry has been the driving force underlying regional dynamics and that the
recent changes in the regional growth pattern have been driven by the rapid catch up of
inland industry.
The analysis is based on data collected by the National Bureau of Statistics (Beijing). We
used the long term macroeconomic series (1952-2011) at provincial level published in the
Statistical Yearbooks and a database on manufacturing industry detailed at firm level
(Industrial enterprise census data) for the years 1997 to 2009i
.
The paper is organized as follows. Section 2 sketches out how the center of gravity of
China’s economy oscillated between the coast and the interior from the early phase of
modernization up to now. Section 3 focuses on manufacturing industry in the 2000s and
shows that inland performance, which lagged far behind in the 1990s, is now catching up
with that of the coast. Section 4 presents an econometric estimation of the convergence pace
in manufacturing industry between 1998 and 2009. Section 5 concludes.
2. The center of gravity of China’s economy: history and geography
In a country as vast as China (the fourth largest country in the world by the geographic
dimension and the first by the size of population) regional differences are huge. They stem
from natural and historical conditions. The extreme diversity of the climate and relief, the
large variations in population density, in natural resources and in communication facilities
create different conditions for economic development. Regional development has also been
shaped by the political power. In the economic strategies that have been followed since the
*
Françoise Lemoine (corresponding author, [email protected] ) is economist adviser at CEPII, Grégoire Mayo
was intern at CEPII, Sandra Poncet is scientific adviser at CEPII and Deniz Ünal is economist at CEPII.
CEPII Working Paper The Geographic Pattern of China’s Growth and Convergence within Industry
2
founding of the PRC, spatial imbalances and regional disparities have been a crucial
concern.
This section analyses the changes in the geographic pattern of China’s economy in a long
term perspective and argues that the center of gravity has been alternately located in the
coastal area (Blue China) and in inland area (Yellow China). The coastline was the engine of
the takeoff experienced by the Chinese economy over the past 25 years, but a reversal is
currently underway as economic growth in the interior has overtaken that in the coast since
the mid-2000s. The income gap between the coast and the interior which had widened
during this take-off has narrowed in the past decade. This geographic rebalancing is crucial
for China’s long-term development and its spatial integration. This tilting of the center of
gravity of the economy from the coastline to the center is in line with the transition to a new
growth regime, less dependent on world markets.
2.1. The coast/inland dualism
Unlike other countries of similar size, China is not a federal state. It consists of 22 provinces,
four municipalities directly linked to the central government and five autonomous regions.
Beyond these administrative divisions, there are many geographical, historical or cultural
fault lines (North/South, rural/urban, Han/non Han).
A traditionally distinction is made between “China proper” (or “inner China”) which consists of
the 18 “historical” provinces, densely populated and mostly by Han; and “China peripheral”
(or “outer China”) composed of border, landlocked regions, more recently integrated in to the
Empire, most of them desert or semi-desert and where ethnic minority populations live
(Sanjuan, 2007).
Another great dividing line runs between the “Blue China” i.e. the coastal area, open to the
outside world, with seaports and merchant traditions; and the “Yellow China” which
encompasses the central and western regions, making up a continental area, less advanced
economically. Of course this division overlooks the internal heterogeneity of the two areas,
which include provinces with different natural, economic, social characteristics. But the
economic history of modern China (since the early 19th century) shows that this dichotomy
based on geography as well on economy has structured the development process and can
usefully shed light on the issues of today’s China.
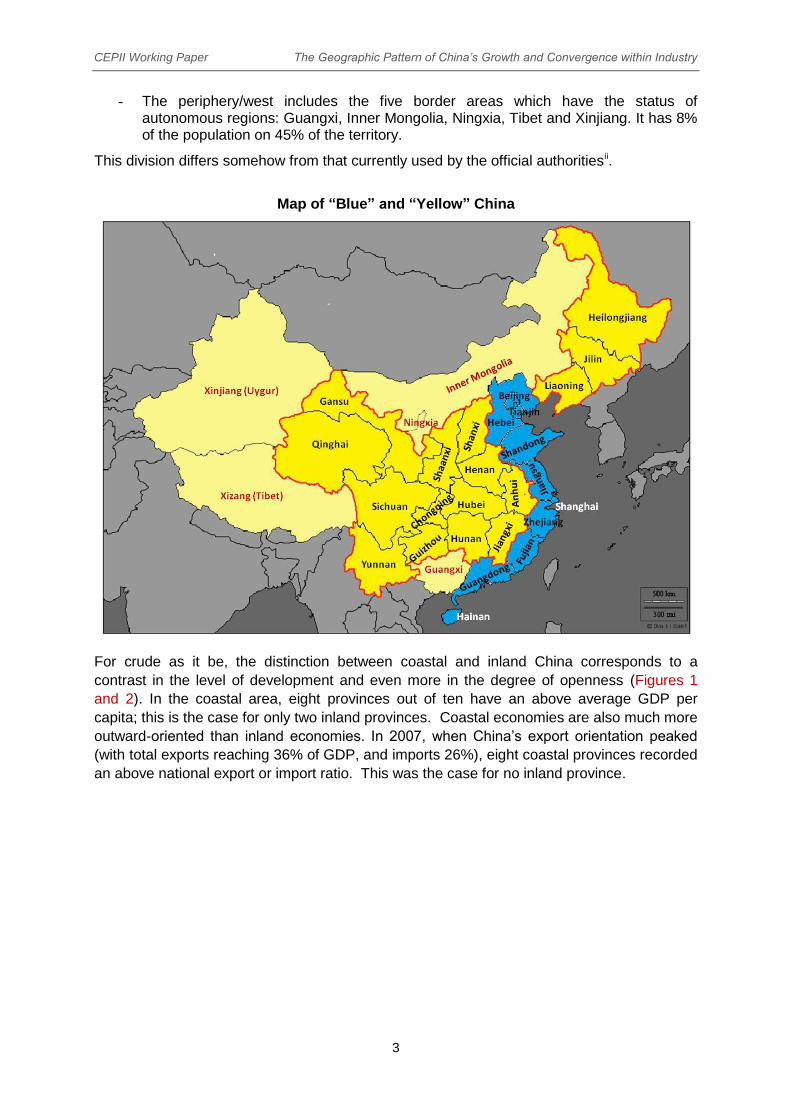
This study refers to the division between the coast and the interior (see the map). The coast
includes here seven provinces Fujian, Guangdong, Hainan, Hebei, Jiangsu, Shandong,
Zhejiang and three municipalities with provincial level (Beijing, Shanghai, Tianjin). It is home
to 38% of the Chinese population on 10% of the territory, and creates about half China’s
GDP.
The inland area includes all other provinces and can be subdivided into three regions:
- The central region is the biggest one and includes 12 provinces (Anhui, Gansu, Guizhou, Henan, Hubei, Hunan, Jiangxi, Qinghai, Shaanxi, Shanxi, Sichuan and Yunnan) and one municipality (Chongqing). It is home to 46% of the population on 37% of the territory.
- The northeast encompasses three provinces (Liaoning, Jilin and Heilongjiang), with 8% of the population on 8% of the territory.
CEPII Working Paper The Geographic Pattern of China’s Growth and Convergence within Industry
3
- The periphery/west includes the five border areas which have the status of autonomous regions: Guangxi, Inner Mongolia, Ningxia, Tibet and Xinjiang. It has 8% of the population on 45% of the territory.
This division differs somehow from that currently used by the official authoritiesii.
Map of “Blue” and “Yellow” China
For crude as it be, the distinction between coastal and inland China corresponds to a
contrast in the level of development and even more in the degree of openness (Figures 1
and 2). In the coastal area, eight provinces out of ten have an above average GDP per
capita; this is the case for only two inland provinces. Coastal economies are also much more
outward-oriented than inland economies. In 2007, when China’s export orientation peaked
(with total exports reaching 36% of GDP, and imports 26%), eight coastal provinces recorded
an above national export or import ratio. This was the case for no inland province.

CEPII Working Paper The Geographic Pattern of China’s Growth and Convergence within Industry
4
Figure 1
Provincial GDP per capita in Yuan, 2011
Source: National Bureau of Statistics, China statistical yearbook 2012.
Figure 2
Exports and imports as a share of provincial GDP in 2007 (%)
Source: National Bureau of Statistics, China statistical yearbook 2012.
2.2. The advance of coastal cities in early modernization (late 19th-early 20th
centuries):
Without going back to the beginnings of Chinese history, it is interesting to give a brief
overview of the spatial dimension of China’s economy at the initial stage of its modernization
(Saw and Wong, 2009).
In the 18th century, China experienced a “Golden Age” as reflected in the unprecedented
growth of its population (from 140 to 380 million between 1700 and 1820). In 1820, China
CEPII Working Paper The Geographic Pattern of China’s Growth and Convergence within Industry
5
was by far the largest economy in the world. Maddison (2010) estimated that China was then
responsible for one third of world production (Western Europe for one fourth).
Contrasting with Japan which began to modernize during the Meiji period (1868-1912), China
missed the industrial revolution of the 19th century. For China, this century was a period of
decline, marked by stagnant economy, social unrest, weakened Manchu dynasty and foreign
aggression. However, as amply shown by Bergère (1989), in the mid-19th century, a modern
economic activity had begun to emerge in coastal cities (Shanghai, Nanjing, Guangzhou,
etc.). Textile and food industries, commerce, modern banks were taking off and their
expansion reached a peak between 1912 and 1927. This modern sector was largely (but not
entirely) under the control of foreign capitalists who had acquired the right to do business in
the open ports since the mid-19th century, thanks to the Unequal Treaties which put an end to
the Opium Wars. The activities of these new industrial centers spread in their neighborhood,
and especially along the waterways. But their spillover effects remained insufficient to pull
the industrialization of the whole country, given the lack of government support to economic
modernization. The importance of the modern sector remained marginal, accounting for
about 13% the national income in 1933 (Liu and Yeh 1965).
Modernity was concentrated in coastal cities, with Shanghai as the main landmark. In the
1920s, Shanghai accounted for about half of China’s foreign trade and industrial output
(Giroir, 1999). This openness to foreign influences had historical roots as the coastal area
had been as soon as in the 12th and 13th century, the host of a marine economy and of active
trading activities with Southeast Asian countries. But the regional differentiation of China’s
economy and the dualism between the coast and inland date back to this initial phase of
modernization (Gipouloux, 2009).
In 1931 Manchuria was invaded by the Japanese who carried an accelerated industrialization
drive based on the region’s natural resources. Transport infrastructures were developed for
routing goods to Japan. The region became one of the most industrialized parts of China,
producing 93% of the steel and half of the coal and electric power of the country in 1943
(Giroir, 1999).
The eastern part of China had thus initiated an economic modernization which was
fundamentally associated with the presence of foreign powers, with colonial or military
penetration. This period's legacy was a radical break between inland China, characterized as
rural, bureaucratic and traditional, and maritime China, seen as cosmopolitan, enterprising
and open to innovation (Bergère et al, 1990).
2.3. The industrialization of interior provinces under Mao (1952-1978)
In 1949, the Communist victory was achieved by inland rural forces and the “civilization of
the coast” was therefore denounced as corrupted and subservient to foreign interests.
The development strategy designed by the Communist power in the 1950s imposed a radical
break with the previous period in all dimensions of China’s economy. The economic strategy
put forward the principle of national self-sufficiency in a world deemed as hostile. Economic
and commercial ties with the rest of the world were severed, or kept at minimum, even with
other communist countries after the Sino-Soviet rupture in 1960.
CEPII Working Paper The Geographic Pattern of China’s Growth and Convergence within Industry
6
The central planning of economic development aimed at reducing regional inequality and at
balancing the distribution of industrial capacities. Ideological, political, and strategic
considerations lay under such priorities. Coastal cities were ostracized because their
economic preeminence was inherited from the colonial powers. Moreover, in 1963, the
government launched a program for the construction of military-industrial plants in inland
provinces (the “third front”) out of reach of a possible foreign military aggression. The
provinces of Shaanxi, Sichuan and Guizhou benefited from these investments.
During this period, the state budget centralized large financial resources (accounting for 30%
of China’s GDP in 1978) and financed the bulk of capital investment in industry. There were
large financial transfers to backward provinces and massive investment in heavy industry
(coal, steel, chemicals) and infrastructures. During the third five-year plan (1966-1970),
Shanghai Municipality provided 40% of the state budget revenues, and 71% of state
investment was directed to inland provinces (Démurger et alii, 2002).
This investment allocation, which favored the poor at the expense of advanced economic
regions, was costly in terms of economic growth. Investment in inland areas was less
productive and less profitable than in more advanced regions. As Lardy (1980) states
“Management has deliberately chosen to sacrifice some economic growth to achieve the
improvement of regional economic imbalances”.
At the same time, in accordance with the motto of “self-reliance”, interregional and
interprovincial trade was kept at a minimum level so that the fragmentation of the economy
and the lack of regional specialization also dampened economic growth.
During this period, there was no convergence in regional income (Démurger et alii, 2002). In
1952, GDP per capita in coastal area was on average 30% higher than in the inner zone and
in 1978 it was 50% higher. However, the distribution of industrial production changed in favor
of the central region (its share in the industrial GDP increased from 26% to 30%) while the
north-east lost ground (with a share falling from 23% to 17%). The industrialization drive
resulted in far-reaching changes in the pattern of regional GDP. The progress of industry was
especially rapid in the regions initially the least industrialized, i.e. the centre and the
periphery, as shown in Table 1.
Table 1
Structure of the regions’ GDP by sector, 1952 and 1978 (%)
Agriculture Industry Services GDP
1952 1978 1952 1978 1952 1978 1952 1978
Coast 49 23 25 57 26 20 100 100
Inland 59 34 21 48 20 20 100 100
Central 65 34 16 48 20 20 100 100
North-East 36 38 41 43 23 21 100 100
Periphery 68 18 18 67 14 15 100 100
China 55 29 23 52 23 20 100 100
Source: National Bureau of Statistics, Comprehensive statistical data and
materials on 50 years of new China (1999).

CEPII Working Paper The Geographic Pattern of China’s Growth and Convergence within Industry
7
2.4. The coastline economic takeoff in the era of globalization
The reforms initiated at the end of 1978 reflected a new mindset. The priority was to
maximize growth and accelerate the country's modernization. This required a better use of
resources at national level and led to a gradual transition to market mechanisms and to the
opening to the outside world. In this new logic, the comparative advantages were to guide
regional specializations and the reforms were accompanied by a far-reaching fiscal and
economic decentralization up to the mid-1990s.
2.4.1. The opening up of coastal provinces
The new economic policy has awakened the “coastal civilization” (Bergère et al, 1990). The
coastal provinces were the spearhead of the opening policy. In 1979, three special economic
zones (SEZs) were established in Guangdong and Fujian in order to attract foreign direct
investment, expected to come firstly from the neighbors, Hong Kong and Taiwan. These SEZ
also served to experiment with market mechanisms (price and wage liberalization).
As these innovations proved to have positive effects on local economies (inflows of foreign
capital, new commercial and industrial enterprises), they triggered the diffusion of similar
policies in other coastal provinces. In 1988, 14 coastal cities were allowed to implement
open-door policies and the movement has afterwards spread to the entire coastline
(Démurger et al, 2002).
At the same time, the five-year plans explicitly set new regional priorities. The 1981-1985
plan gave coastal provinces a leading role in industrial modernization and pushed them to
build on their comparative advantages: abundant and cheap labor, geographical proximity to
world markets and to foreign financial centers (Lemoine, 1990).
The next plan (1986-1990) advocated the specialization of coastal areas in modern
industries, new technology sectors, in the production of consumer goods and in export-
oriented industries. The inland was to provide the necessary inputs: agricultural products,
raw materials, heavy industrial goods. Given the complementarity existing between the two
regions, the coastal development was expected to have ripple effects on the inland regions
(Anderson et alii, 2013).
In 1988, the Prime Minister Zhao Ziyang announced measures to promote export-oriented
industries. The imports of goods for processing and re-exports were to be exempted from
customs duty. This laid ground to the development of international subcontracting and
assembly operations and to the integration of coastal industries into the international division
of labor. It has structured Chinese manufacturing industry and exports for the two following
decades (Gaulier et alii, 2007).
In the 1990s, economic reforms took momentum and extended to the whole territory. The
accession of China to the WTO, at the end of 2001, gave a new impulse to its integration into
the world economy. Multinational companies from all over the world have arrived, attracted
by the low production costs and by the potential domestic market. In the mid-2000s, the
boom in consumer demand in the US and Europe as well as in large emerging economies
offered new opportunities of expansion to China’s exporting industries.

CEPII Working Paper The Geographic Pattern of China’s Growth and Convergence within Industry
8
2.4.2. The great leap eastward
Since 1978 and up to 2005 the coastal provinces registered an accelerated pace of
economic growth, driven by manufacturing industries. They exploited their comparative
advantages, and developed new industrial specialization thanks to the availability of foreign
capital (Berthélemy and Démurger, 2000).
In a first phase, during the 1980s, “new industrial clusters” emerged on the southern part of
the coastline, in the provinces of Guangdong (the Pearl River delta), Fujian and Zhejiang.
Special economic zones attracted not only foreign investors but also investors from other
provinces. Foreign investment created the conditions for mass production and put China in a
position to gain competitiveness in international markets. Spilling over the border of SEZs,
exporting industries proliferated mobilizing the rural labor force under-employed in
agriculture. In the late 1980s almost all of the Hong Kong industry had migrated to
Guangdong province, attracted by the low level of wages and of land prices. Enterprises from
Taiwan and other Asian countries followed.
In a second phase, in the 1990s the growth center moved northward on the coastline and the
old industrial centers (such as Shanghai) began to experience an economic revival as they
introduced economic reforms and opening up. Shanghai begun its transformation only in the
early 1990s. Since then, its growth has been based mainly on services, while its industrial
activities has relocated to the neighboring province of Jiangsu.
A third phase took place in the 2000s, as the internationalization of coastal economies
accelerated. In the mid-2000s, external demand boomed and contributed for two to three
percentage points of China’s annual GDP growth. This export-led growth further accentuated
regional polarization as foreign trade remained heavily concentrated in the coastal provinces.
In 2007, the coast accounted for 91% of exports and five provinces (Beijing, Shanghai,
Jiangsu, Zhejiang and Guangdong) for 72% of exports. The export-driven model of coastal
provinces during the 2000s is reflected in the rapid rise of their export to GDP ratios
(Table 2).
Table 2
Coast and Inland Region
Openness to Foreign Trade in the 2000s (% of GDP)
Exports Imports
2000
200
7
2000 2007
Coast 35 54
32 42
Inland 6 9
5 7
Source: National Bureau of Statistics, China Statistical
Yearbooks 2001 & 2008.
The share of the coast in national GDP increased from 44% in 1978 to 56% in 2006
(Figure 3). Its prominence was even bigger in industry, with more than two-thirds the gross
value of industrial output.

CEPII Working Paper The Geographic Pattern of China’s Growth and Convergence within Industry
9
Figure 3
Regional distribution of China’s GDP
(in percent)
Figure 4
Income gap between coast and inland:
GDP per capita in percent of national
average
Source: National Bureau of Statistics of the PRC: China Statistical Yearbook, various issues
In the early 2000s, regional disparity and the widening income gap between the coastline
and the rest of China were recognized as major issues (Lin et alii (2002) and Naughton
(2002). These authors attributed the divergence to the pace of the industrialization process
in eastern China and to the erosion of the redistribution policy by the central government.
From 1978 to 1995, economic and fiscal decentralization led to a relative decline in budget
and the government expenses for investment programs collapsed.
In the first half of the 2000s, the fault line between the coast and the rest of China further
deepened. In 1978, the GDP per capita was on average 50% higher in the coast than in the
interior; in 1998, it was twice higher and in 2006 the ratio reached 2.2 (Figure 4).
2.5. The rebalancing in favor of inland region
Pressures for changes in the spatial dynamics had begun to be felt since the end of the
1990s. Since the mid-2000s external shocks and domestic factors have made the past
growth regime unsustainable anymore.
2.5.1. International environment
On the external side, the Asian crisis of 1997-1998 was a first shock which highlighted the
vulnerability of the China’s economy to the ups and downs of the international environment.
Chinese exports stagnated as a result of a weaker demand in Asia and of the devaluation of
Asian currencies which threatened the competitiveness of Chinese products.
Ten years later, in 2008, the global crisis interrupted a period of unprecedented expansion of
world trade of which China had been a major beneficiary. This second shock was stronger
than the first one because the contraction of the international trade was more brutal (world
trade went down by 18 % in value in 2009) and because the Chinese economy had become
more open.
To cushion the depressive effects, in late 2008 the government launched a vigorous stimulus
plan based on massive capital expenditure, most of which was directed to the inland
provinces. While the coast was the most directly affected by the crisis, the interior was the
main beneficiary of the package (Inomata and Ushida, 2009).
CEPII Working Paper The Geographic Pattern of China’s Growth and Convergence within Industry
10
2.5.2. Domestic factors
The polarization of economic development in the coastline and the risk that this geographical
imbalance implied for the regional integration of China’s economy had become a political
concern in the late 1990s. Due to their integration into international production networks,
Coastal provinces developed stronger links with world markets than with the rest of China.
Poor transport infrastructure in the interior hampered inter-regional trade and encouraged the
outward-oriented bias of the coastline.
Regional disparity and the increasing geographic dualism aroused political concern as they
were likely to fuel tensions and resentment in poor areas and border provinces.
Policies in favor of a more balanced development dated back to the late 1990s, when the
government launched the “Go West policy”, a program aimed at enhancing the economic
development of the 12 central and western provinces. This encompassed fiscal transfers and
tax preferences, measures to induce financial institutions and especially policy banks to
increase loans to western regions development.
The reversal in the demographic situation has been another important factor for change.
Since 2010, the working age population has ceased to increase and the younger age
categories have begun to diminish. The period of surplus labor has come to an end (or will
soon do so), and this has altered the situation in the labor market. As early as 2005, local
shortages occurred in coastal provinces (Guangdong), where export industries depend
heavily on the migrants. The wages of the low skilled workers, which had stagnated for
nearly a decade, were too low to attract migrants, all the more as they were excluded from
the benefits enjoyed by urban citizens (social security, pensions, housing). Since the late
2000s, the increase in wages has accelerated, reducing the competitiveness of the coastal
industries and pushing them to move to central regions where wages are lower (Saw and
Wong, 2009). These less industrialized and less urbanized regions have a larger reserve of
labor force in rural areas.
Since the mid-2000s, internal factors and external conditions have thus combined to
accelerate the economic growth in the inland.
2.5.3. The watershed of the mid-2000s
The weight of inland in China’s GDP which declined up to 2005 has increased steadily since
and has recovered in 2011 its 1998 level (Figure 4, above). Most of the increase came from
central provinces and to a lesser extent from periphery regions.
The difference in per capita income between the coast and the interior has ceased to
increase. The ratio declined to 1.8 in 2011, thus reverting to what it was in 2004, before the
phase of export-led growth.
3. The catch up of inland industry in the 2000s
The gap in regional per capita income has narrowed since the mid-2000s and this
convergence can be explained by the rapid catch up which has taken place in the
manufacturing industry of the backward/inland provinces. The present section focuses on
CEPII Working Paper The Geographic Pattern of China’s Growth and Convergence within Industry
11
industry and shows that since the end of the 1990s, the inland industrial performance has
improved rapidly, closing the gap with that of the coast in most manufacturing branches.
3.1. A brief survey of literature on the recent regional rebalancing
The studies analyzing regional imbalances and disparities at the macroeconomic level agree
on the conclusion that economic reforms since 1978 led to widening regional imbalances
between the coast and the inland associated with increased regional disparities between
advanced and backward regions. They also find a mitigation of provincial divergence in the
mid-2000s. Wei (2009) observes that the increase mobility of capital and labor accentuated
the trend towards concentration of economic activities (in particular of industry) in the east up
to 2004, which marked a turning point, when regional disparities of GDP per capita have
ceased to increase. Industrial production is moving to north and to west as a result of
government policies and of rising costs of labor and land in the coast. Industrial productivity
and profitability provide evidence of the economic take off of the central region. The author
considers that regional development has entered a watershed period and that the latecomers
may become economic pace setters. In a similar way, Feng (2009) observes that since 2004
the geometric gravity center of economy has moved from east to west, as growth rates has
slowed in the East and increased in the West. The OECD (2010) indicates that inter-
provincial inequalities peaked around 2004 and have declined in the following years.
Anderson et alii (2013) confirm that a regional divergence corresponding to the east/west
divide characterized the initial phase of reforms and that the divergence peaked as early as
1994. Since the 2003, the “followers” (mostly inland provinces) have grown faster than the
“leaders” (mainly coastal provinces) and productivity levels have begun to converge.
Other studies, using firm-level datasets, show a convergence of industrial labor productivity
across regions. The catch-up process of backward regions has taken place since the mid-
1990s and has been associated with a spatial diffusion of industry.
Jefferson, Rawski and Zhang (2008) analyze the multifactor productivity gap between four
regions (the coast, the center, the north-east and the west), using the manufacturing
enterprise census database covering the period 1998-2005. They find that in term of
multifactor productivity, the center has caught up with the coast as early as 2005 and that
this rapid improvement is mainly explained by the restructuring of SOEs, which is taking
place in the interior during this period (and had taken place earlier in the coast). They
conclude that the center’s higher productivity growth may be temporary. However, they also
observe that an extensive diffusion of technology and efficiency has contributed to the
convergence of labor productivity.
Deng and Jefferson (2010 and 2011) carry an analysis based on a large and medium
industrial enterprise dataset from 1995 to 2004. They consider labor productivity in reference
with the international technology frontier (the US). They find that coastal industry reduced its
technology gap with the international frontier at an especially rapid pace from 1995 to 2000,
but that this gap-growth advantage disappeared in the mid-2000s. From 1995 to 2004, the
labor productivity gap between the coastal and interior regions narrowed significantly as the
relatively backward inland regions exploited the advantages of backwardness. The larger the
initial gap for a given industry-province, the higher the subsequent growth rate of labor
productivity. They underline that the coast and the inland follow different growth trajectories:
initially the coast benefited from “the advantage of openness” and later on, the inland grew
faster due to the “advantage of backwardness”. This growth pattern offers China a rare
CEPII Working Paper The Geographic Pattern of China’s Growth and Convergence within Industry
12
opportunity simultaneously to reduce income inequality while maintaining a high overall
growth rate.
The studies based on firm level data which analyze regional performance in specific
manufacturing industries confirm the convergence process and the signs of a westward
move. Ruan and Zhang (2010) test whether the flying geese model hypothesis applies to the
case of textile industry in China. They refer to the history of US industry when rising labor
costs and union density drove manufacturing industries from the mid-west and north-east to
the south and west. In the case of China’s textile industry, they find that the return on capital
and the profit per worker is higher in the central region than in the eastern region since 2006
and that the extreme concentration of this industry in the east has begun to diminish since
2004. The question is whether the lower price of labor and of land in the central region will be
a sufficient condition to counter the agglomeration advantage existing in the east. Qu et alii
(2012) consider China’s labor-intensive manufacturing industry from 2004 to 2008 and show
that it has become less geographically concentrated in the east. Higher return on assets and
profit per capita in inland labor intensive industry might be key factors behind this recent
relocation of businesses to the interior regions. With rising labor costs, the labor-intensive
manufacturing industry of the eastern region is now facing increasingly significant
competitive pressure and is therefore likely to seek new space to grow.
Taking into account this literature, the aim of this section is
- To compare the inland and the coast industrial performance at the level of distinctive manufacturing branches from 1998 to 2009 and to investigate whether the catch-up process is associated with changes in regional industrial specialization.
- To extend the analysis of the regional industrial pattern to the most recent period and find out whether the disparity between the coastal and the inland performance has continued to narrow up to 2011 and whether the global crisis has reinforced the move to the west of the economic center of gravity.
- To shed some light on the differences in the regional industrial trajectories, especially in terms of openness and ownership pattern.
3.2. Industrialization at the core of regional dynamics
Industry has been the main engine of China’s economic development during the Maoist
period as well as since 1978. As noted by Naughton (2002), the pace of industrial growth
was the most important factor in the evolution of inter-regional disparities.
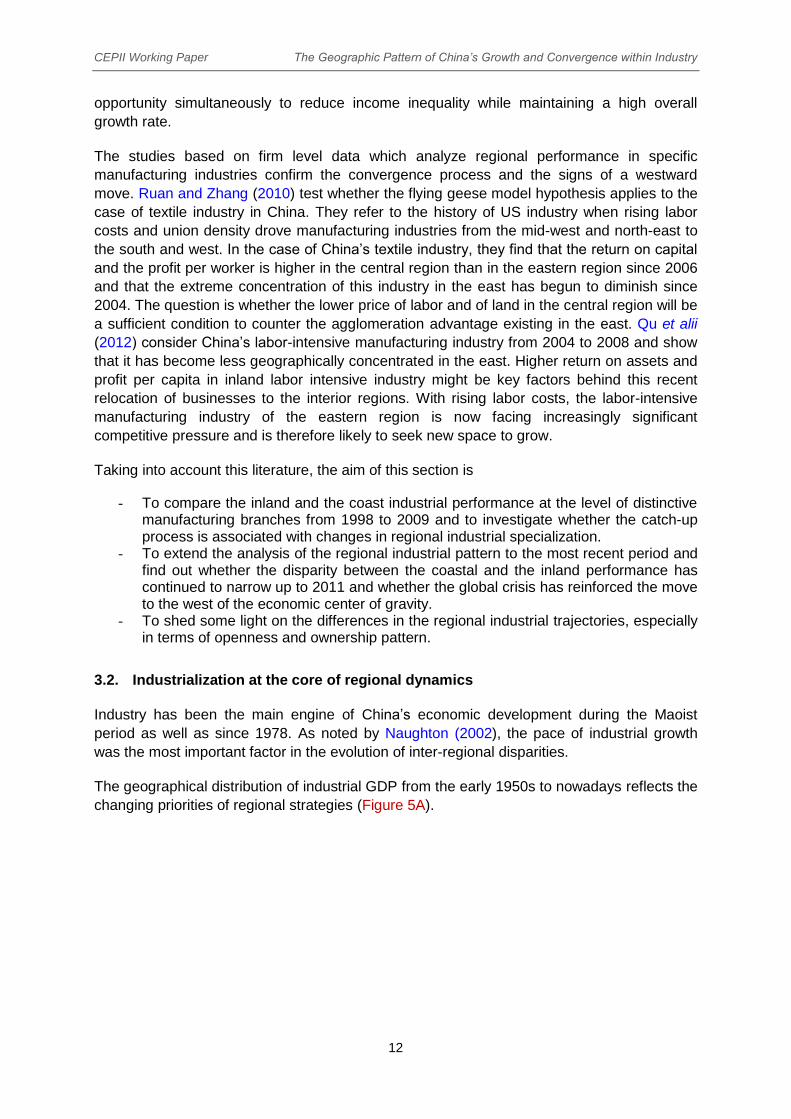
The geographical distribution of industrial GDP from the early 1950s to nowadays reflects the
changing priorities of regional strategies (Figure 5A).
CEPII Working Paper The Geographic Pattern of China’s Growth and Convergence within Industry
13
Figure 5
Regional distribution of industrial value added
and of gross value of industrial output (GVIO)
A. Value Added, 1952-2011 (%) B. GVIO, 1998-2011 (%)
Source: National Bureau of Statistics of the PRC, China Statistical Yearbook, various issues.
During the Maoist period the relative importance of the central region increased (with a share
rising from 26% to 30% of industrial value added between 1952 and 1978). The north-east
lost part of the importance it had gained in the pre-war period (its weight in the total industrial
value-added fell from 23% to 17%), while peripheral areas remained marginal. These trends
resulted in a slight decrease of the interior as a whole in China’s industrial GDP.
The period 1978-2006 was characterized by the great leap forward of coastal industry. As
shown in Figure 5A, in a first phase which runs from 1978 to 1998, both the coast and the
central region were the winners of economic reforms, while the north-east continued to lose
ground as the restructuring of its large state-owned sector was a difficult process.
In a second phase, from 1998 to 2006, the coastal area expanded its manufacturing activity
at an accelerated pace, at the expense of both the central region and the north-east. Its
share in industrial GDP reached 59-60% from 2002 to 2006.
Since 2006, the trend has returned and the coastline receded. In 2011, its contribution to
China’s industrial added value was hardly higher than it was in 1978. The mid-2000s marked
a watershed in the spatial pattern of industry. In 2011, the central region has more than
recovered the ground lost in the previous period and its contribution to the country's industrial
added value weight has never been so high (one third). The northeast has ceased to lose
ground.
The distribution of industrial production, measured by the gross value of industrial output
(GVIO) of “above-scale” industrial firms, confirms that the years 2005-2006 marked a turning
point in the relative positions of the coast and the inland. It is worth noting that the
importance of the coast is greater in the GVIO (which includes the value of intermediate
products) that in the added value data, because coastal industries include low value-added
activities, namely international subcontracting and assembly operations (Figure 5.B).
CEPII Working Paper The Geographic Pattern of China’s Growth and Convergence within Industry
14
3.3. Trends in regional specialization
The industrial enterprise census data for years from 1998 to 2009 makes it possible to
analyze the spatial evolution at the sectoral level and to examine whether the inland
industrial catch up has been associated with changes in specialization.
Because of its natural resource endowments, the inland area dominates production in mining
and in energy sectors, with 60% of national output. Its contribution to manufacturing output is
much lower, but on the rise since the mid-2000s: 35% in 2009 against 31% in 2004.
The contribution of inland to output followed the same pattern in most industrial branches
(Figure 6). It contracted from the end of the 1990s to the mid-2000s and increased in the
following years (except in transport equipment and metallurgy). In 2009, the inland
contribution to industrial output had caught up or exceeded the level it had in 1998 in all
industries but two (metallurgy and electronics).
Figure 6
Inland Share in China’s Industrial Output by Branch
(in percent of each branch GVIO)
Source: National Bureau of Statistics of the PRC, Industrial enterprise census data.
Regional specialization is measured by an index computed as the weight of a branch in the
region’s production over the weight of this branch in national production. Inland specialization
lies in the energy sector, public utilities (distribution of water, gas and electricity) and in three
manufacturing industries, food, metallurgy and transport equipment (Figure 7). The sectoral
specialization persist all over the period, but a shift in the intensity of specialization has
occurred since the mid-2000s.

CEPII Working Paper The Geographic Pattern of China’s Growth and Convergence within Industry
15
Figure 7
Inland Specialization in Industry*
*Notes: Specialization is measured by the ratio:
where i is
the inland region, Q the output (Gross value of industrial output) and k
the branch.
Source: National Bureau of Statistics of the PRC, Manufacturing
enterprise census data.
During the first half of the 2000s, specialization tended to increase. The indicator shows an
upward trend in the industries in which the inland area was initially specialized and a
downward trend in those it was not specialized (electronic, textile, electrical equipment).
Since the mid-2000s, however, the specialization index has tended to decrease (except in
food) meaning that regional industrial structures have begun to converge. In textile, electrical
equipment (and to a lesser extent in electronics), the inland has recently begun to reduce its
“disadvantage”, presumably reflecting the relocation of coastal industries to the interior.
Recent trends thus suggest that the inland area may be on the way to diversify its
manufacturing industry and shift away from its traditional specialization pattern.
3.4. Closing the productivity gap
The following analysis focuses on manufacturing industry. Tilting the center of gravity of
manufacturing towards the interior may at least partly be explained by the impact of the
global crisis and its mechanical effect on the coastal industries. But this is not the full story.
The sales in the domestic market (calculated as total sales minus exports) confirms the
geographical redeployment, as from 2004 to 2009, the coast share in domestic sales
diminished from 64% to 60%.
The performance of inland manufacturing enterprises has improved since the late 1990s and
this movement has accelerated since the middle of the past decade.
Figure 8 shows the relative performance of the inland compared to the coast in terms of labor
productivity, profitability (profit per employee, profit per unit of fixed assets) and capital
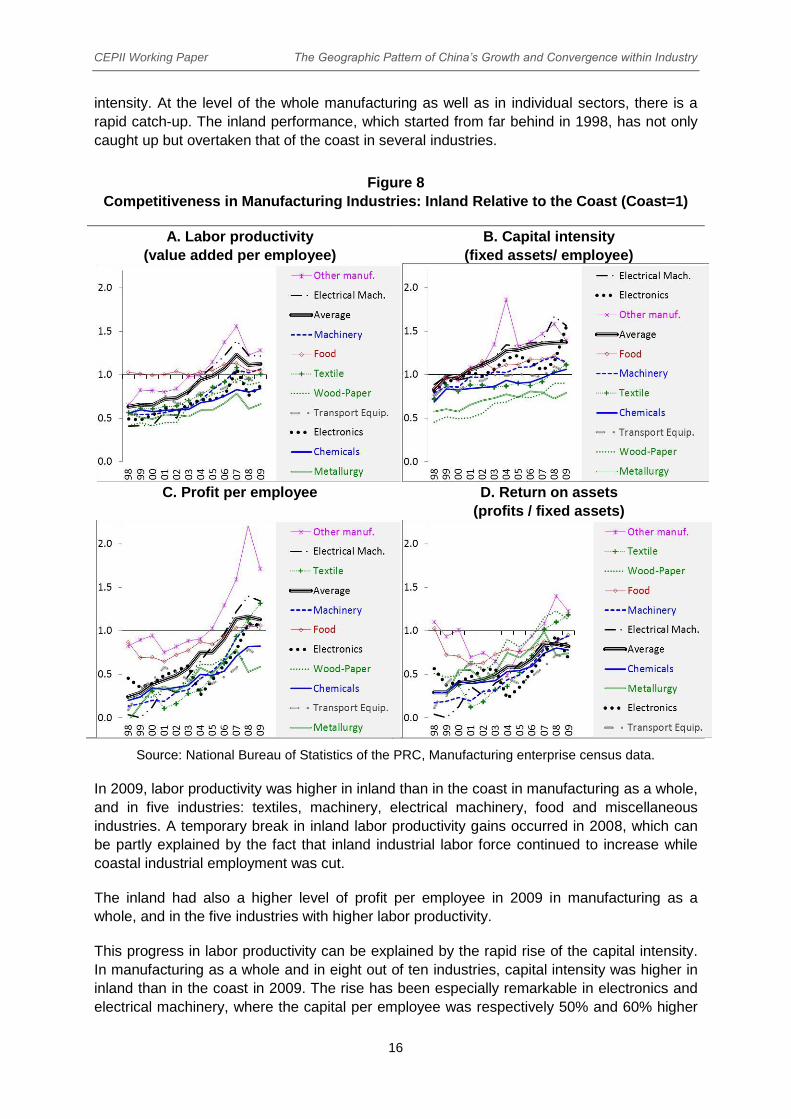
CEPII Working Paper The Geographic Pattern of China’s Growth and Convergence within Industry
16
intensity. At the level of the whole manufacturing as well as in individual sectors, there is a
rapid catch-up. The inland performance, which started from far behind in 1998, has not only
caught up but overtaken that of the coast in several industries.
Figure 8
Competitiveness in Manufacturing Industries: Inland Relative to the Coast (Coast=1)
A. Labor productivity
(value added per employee)
B. Capital intensity
(fixed assets/ employee)
C. Profit per employee D. Return on assets
(profits / fixed assets)
Source: National Bureau of Statistics of the PRC, Manufacturing enterprise census data.
In 2009, labor productivity was higher in inland than in the coast in manufacturing as a whole,
and in five industries: textiles, machinery, electrical machinery, food and miscellaneous
industries. A temporary break in inland labor productivity gains occurred in 2008, which can
be partly explained by the fact that inland industrial labor force continued to increase while
coastal industrial employment was cut.
The inland had also a higher level of profit per employee in 2009 in manufacturing as a
whole, and in the five industries with higher labor productivity.
This progress in labor productivity can be explained by the rapid rise of the capital intensity.
In manufacturing as a whole and in eight out of ten industries, capital intensity was higher in
inland than in the coast in 2009. The rise has been especially remarkable in electronics and
electrical machinery, where the capital per employee was respectively 50% and 60% higher
CEPII Working Paper The Geographic Pattern of China’s Growth and Convergence within Industry
17
in inland than in the coast in 2009. This suggests that the production of these two industries,
which has been up to now heavily concentrated in the coast, will move westward in the years
to come. The pattern of investment in fixed assets indicates that the shift of the center of
gravity of Chinese manufacturing in inland area is a well-entrenched tendency.
The increase in the capital intensity has been accompanied by a progress in the profitability
of the fixed assets (profit/fixed capital), which however has remained, on average, well below
that of the coast, excepted in textile, wood-paper and miscellaneous industries (all of which
are not capital intensive). This gap does not imply that the investment drive in inland
industries has been driven by political considerations and incentives: the profitability of new
industrial investment in inland may be above that of the coast.
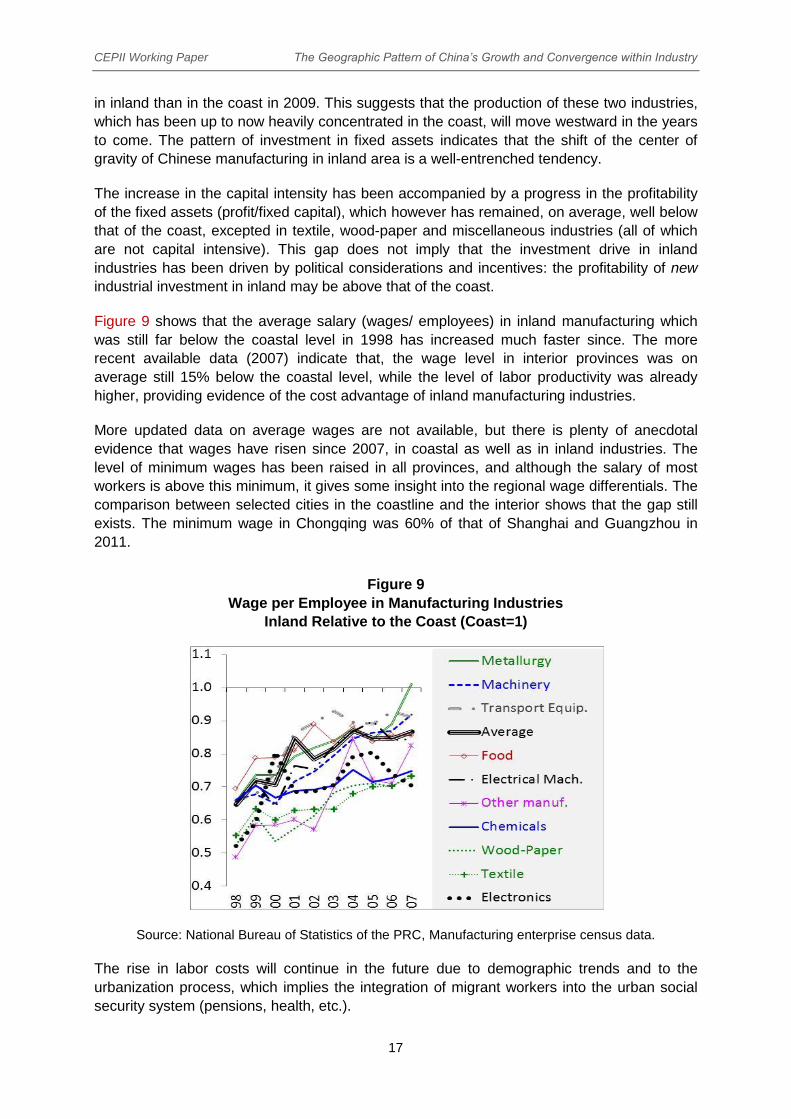
Figure 9 shows that the average salary (wages/ employees) in inland manufacturing which
was still far below the coastal level in 1998 has increased much faster since. The more
recent available data (2007) indicate that, the wage level in interior provinces was on
average still 15% below the coastal level, while the level of labor productivity was already
higher, providing evidence of the cost advantage of inland manufacturing industries.
More updated data on average wages are not available, but there is plenty of anecdotal
evidence that wages have risen since 2007, in coastal as well as in inland industries. The
level of minimum wages has been raised in all provinces, and although the salary of most
workers is above this minimum, it gives some insight into the regional wage differentials. The
comparison between selected cities in the coastline and the interior shows that the gap still
exists. The minimum wage in Chongqing was 60% of that of Shanghai and Guangzhou in
2011.
Figure 9
Wage per Employee in Manufacturing Industries
Inland Relative to the Coast (Coast=1)
Source: National Bureau of Statistics of the PRC, Manufacturing enterprise census data.
The rise in labor costs will continue in the future due to demographic trends and to the
urbanization process, which implies the integration of migrant workers into the urban social
security system (pensions, health, etc.).

CEPII Working Paper The Geographic Pattern of China’s Growth and Convergence within Industry
18
Comparison of labor productivity provides evidence that the coastal area has lost its
comparative advantage over the interior in manufacturing. The cost of labor combined with
the cost of land will continue to induce manufacturing industries to move from the coastline to
inland.
In this context, the coastal area has to build up new specialization in high value added
industries and in services. The reform in services sector, i.e. its opening up to private
Chinese investors as well as to foreign enterprises is thus of crucial importance for coastal
economies. The recent project of “Special economic zone” in Shanghai epitomizes the need
for the coastal to find new growth opportunity.
3.5. The global crisis has supported the ongoing changes.
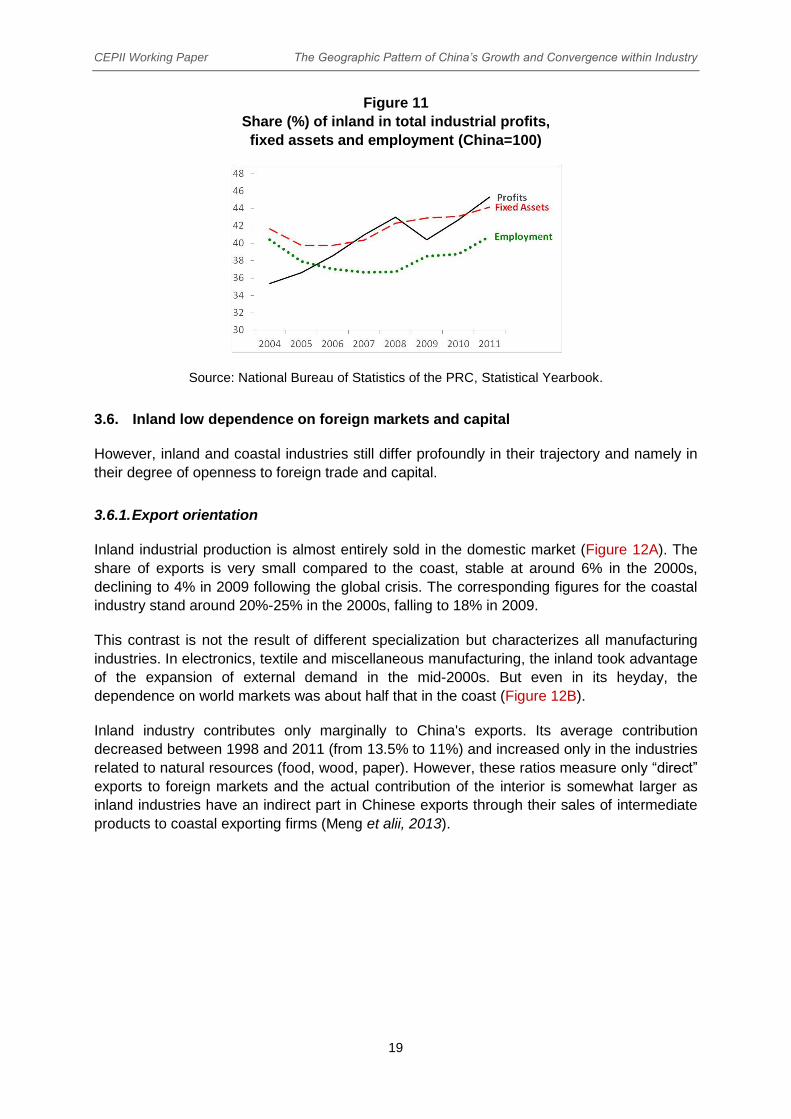
Macroeconomic data for more recent years (drawn from Statistical yearbooks) indicate that
inland industry has consolidated its progress in terms of productivity and profitability
(Figure 10). Between 2008 and 2011, its share in China’s industrial employment, fixed assets
and profits continued to increase (Figure 11). In fact, while industrial employment has
stagnated in the coast since 2008, it has continued to increase in inland provinces quite
steadily up to 2011.
Figure 10
Competitiveness in industry:
inland relative to coast* (coast=100)
*The comparison concerns industry as a whole
(including Mining and energy, public utilities). The
ratio thus differs from that In Figure 8D which
concerns only manufacturing.
Source: National Bureau of Statistics of the PRC,
Manufacturing enterprise census data.
The evolution up to 2011 indicates that the inland industrial catch-up since the late 1990s
was not a temporary phenomenon related to the restructuring of SOEs but sustainable trend
reflecting new comparative advantages.
CEPII Working Paper The Geographic Pattern of China’s Growth and Convergence within Industry
19
Figure 11
Share (%) of inland in total industrial profits,
fixed assets and employment (China=100)
Source: National Bureau of Statistics of the PRC, Statistical Yearbook.
3.6. Inland low dependence on foreign markets and capital
However, inland and coastal industries still differ profoundly in their trajectory and namely in
their degree of openness to foreign trade and capital.
3.6.1. Export orientation
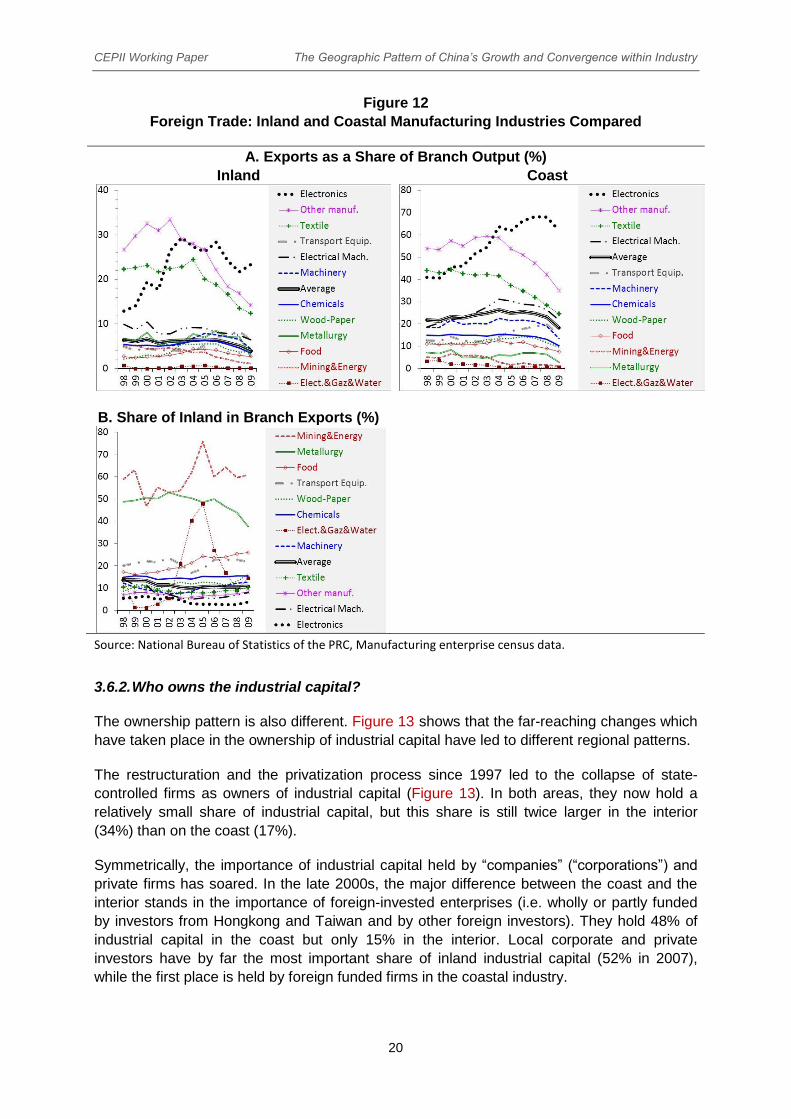
Inland industrial production is almost entirely sold in the domestic market (Figure 12A). The
share of exports is very small compared to the coast, stable at around 6% in the 2000s,
declining to 4% in 2009 following the global crisis. The corresponding figures for the coastal
industry stand around 20%-25% in the 2000s, falling to 18% in 2009.
This contrast is not the result of different specialization but characterizes all manufacturing
industries. In electronics, textile and miscellaneous manufacturing, the inland took advantage
of the expansion of external demand in the mid-2000s. But even in its heyday, the
dependence on world markets was about half that in the coast (Figure 12B).
Inland industry contributes only marginally to China's exports. Its average contribution
decreased between 1998 and 2011 (from 13.5% to 11%) and increased only in the industries
related to natural resources (food, wood, paper). However, these ratios measure only “direct”
exports to foreign markets and the actual contribution of the interior is somewhat larger as
inland industries have an indirect part in Chinese exports through their sales of intermediate
products to coastal exporting firms (Meng et alii, 2013).
CEPII Working Paper The Geographic Pattern of China’s Growth and Convergence within Industry
20
Figure 12
Foreign Trade: Inland and Coastal Manufacturing Industries Compared
A. Exports as a Share of Branch Output (%)
Inland Coast
B. Share of Inland in Branch Exports (%)
Source: National Bureau of Statistics of the PRC, Manufacturing enterprise census data.
3.6.2. Who owns the industrial capital?
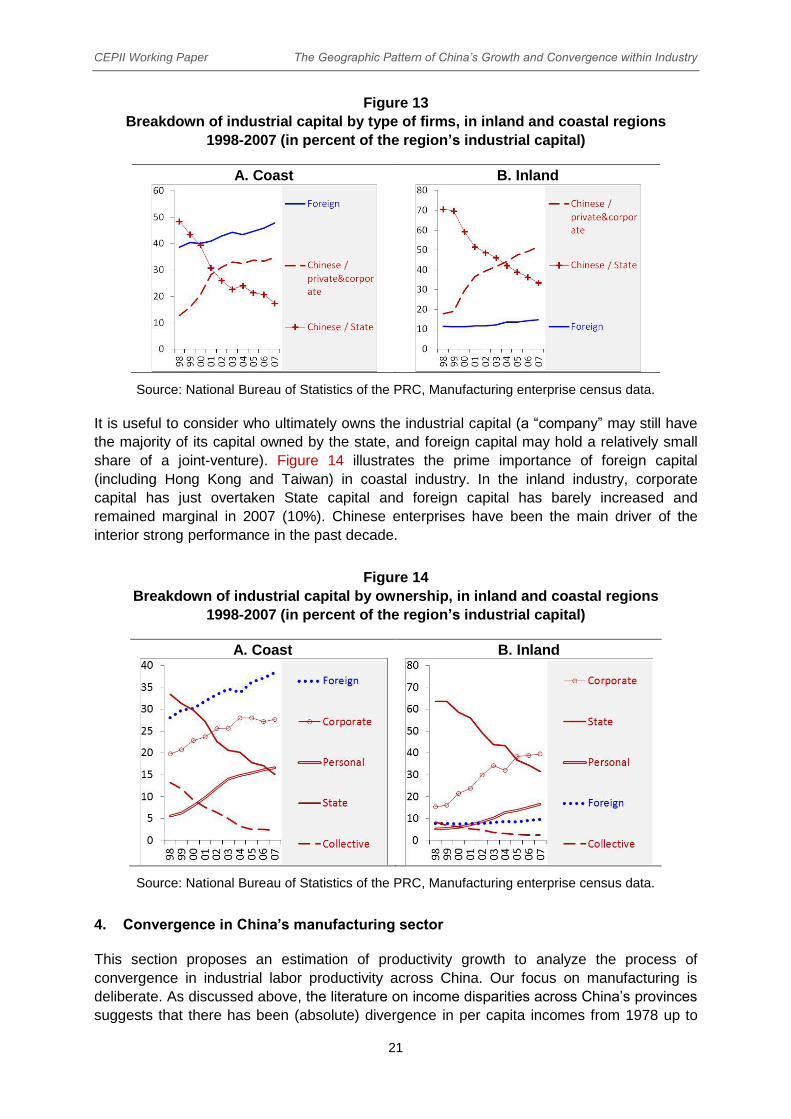
The ownership pattern is also different. Figure 13 shows that the far-reaching changes which
have taken place in the ownership of industrial capital have led to different regional patterns.
The restructuration and the privatization process since 1997 led to the collapse of state-
controlled firms as owners of industrial capital (Figure 13). In both areas, they now hold a
relatively small share of industrial capital, but this share is still twice larger in the interior
(34%) than on the coast (17%).
Symmetrically, the importance of industrial capital held by “companies” (“corporations”) and
private firms has soared. In the late 2000s, the major difference between the coast and the
interior stands in the importance of foreign-invested enterprises (i.e. wholly or partly funded
by investors from Hongkong and Taiwan and by other foreign investors). They hold 48% of
industrial capital in the coast but only 15% in the interior. Local corporate and private
investors have by far the most important share of inland industrial capital (52% in 2007),
while the first place is held by foreign funded firms in the coastal industry.
CEPII Working Paper The Geographic Pattern of China’s Growth and Convergence within Industry
21
Figure 13
Breakdown of industrial capital by type of firms, in inland and coastal regions
1998-2007 (in percent of the region’s industrial capital)
A. Coast B. Inland
Source: National Bureau of Statistics of the PRC, Manufacturing enterprise census data.
It is useful to consider who ultimately owns the industrial capital (a “company” may still have
the majority of its capital owned by the state, and foreign capital may hold a relatively small
share of a joint-venture). Figure 14 illustrates the prime importance of foreign capital
(including Hong Kong and Taiwan) in coastal industry. In the inland industry, corporate
capital has just overtaken State capital and foreign capital has barely increased and
remained marginal in 2007 (10%). Chinese enterprises have been the main driver of the
interior strong performance in the past decade.
Figure 14
Breakdown of industrial capital by ownership, in inland and coastal regions
1998-2007 (in percent of the region’s industrial capital)
A. Coast B. Inland
Source: National Bureau of Statistics of the PRC, Manufacturing enterprise census data.
4. Convergence in China’s manufacturing sector
This section proposes an estimation of productivity growth to analyze the process of
convergence in industrial labor productivity across China. Our focus on manufacturing is
deliberate. As discussed above, the literature on income disparities across China’s provinces
suggests that there has been (absolute) divergence in per capita incomes from 1978 up to
CEPII Working Paper The Geographic Pattern of China’s Growth and Convergence within Industry
22
recently (Jian, et al., 1996; Chen and Fleisher, 1996; Li, et al., 1998; Jones et al., 2003). A
recent analysis by Rodrik (2013) however suggests that strong convergence forces may
operate in manufacturing industries even when economies as a whole fail to exhibit
unconditional convergence, i.e. a systematic propensity of lagging behind countries to catch-
up with richer ones irrespective of their characteristics. Rodrik suggests that in manufacturing
activities intrinsic forces allow firms with lower than average productivity to catch-up with the
most productive ones, hence displaying larger growth rates.
Our empirical approach relies on prefecture level data to estimate the speed at which labor
productivities catch-up in the manufacturing sector in China. We are hence able to determine
whether convergence coefficients vary between the various geographic regions. We also
propose some preliminary examination of what factors appear to facilitate the convergence
process. We look notably at the role of firm ownership and qualification.
4.1. Empirical specification
Following Rodrik (2013), we assume labor productivity growth in an industry i in a location j in
period t to be a function of both location-specific conditions and a convergence effect. The
convergence effect is set to be proportional to the gap between each industry’s initial
productivity and its frontier technology. The latter is hence specific to the industry i and
common to all locations represented by Dit in the following expression of the growth of
nominal labor productivity:
Growth_yijt = β ln yijt + Dj + Dit + εijt
where Dj is a dummy variable that stands in for all time- and industry-invariant location-
specific factors. The error term εijt is assumed uncorrelated with other explanatory variables
and captures all other idiosyncratic influences on labor productivity growth.
The empirical strategy is hence to regress the growth of labor productivity in nominal terms
on the initial level of labor productivity, a set of industry/time period fixed effects (Dit) and
prefecture fixed effects (Dj).
The coefficient of interest is that on β. Unconditional convergence is tested when estimating
the equation without location fixed effects (Dj). Findings of a negative and significant β will
suggest unconditional convergence. In turn when local-specific conditions are controlled for
by these fixed effects, the estimate of β will be a measure of conditional convergence.
4.2. Data
The dependent variable is the (compound annual) growth rate of labor productivity with labor
productivity for 3-digit manufacturing industries. Labor productivity is computed dividing
nominal value added by employment. The original firm-level dataset (NBS) is aggregated up
to the 163 3-digit GBT sectors and to the prefecture-level. The regressors are the log of initial
labor productivity and a host of fixed effects, depending on the specification. Each regression
is run first without and then with prefecture dummies. Then we add controls built in the spirit
of those found in the macro literature. We introduce proxies for capital intensity, export
outward-orientation, size and the importance of the public and foreign sector. They are
computed at the industry-prefecture level from the NBS census. Capital intensity is measured
as the ratio of fixed assets per worker. Outward orientation is the ratio of exports over

CEPII Working Paper The Geographic Pattern of China’s Growth and Convergence within Industry
23
industrial sales. The importance of share ownership is computed dividing the output
emanating from state-owned firms by the total output for each prefecture-industry pair. The
role of foreign capital is apprehended following the same logic but looking at the output from
foreign firms.
4.3. Regression results
4.3.1. Benchmark results
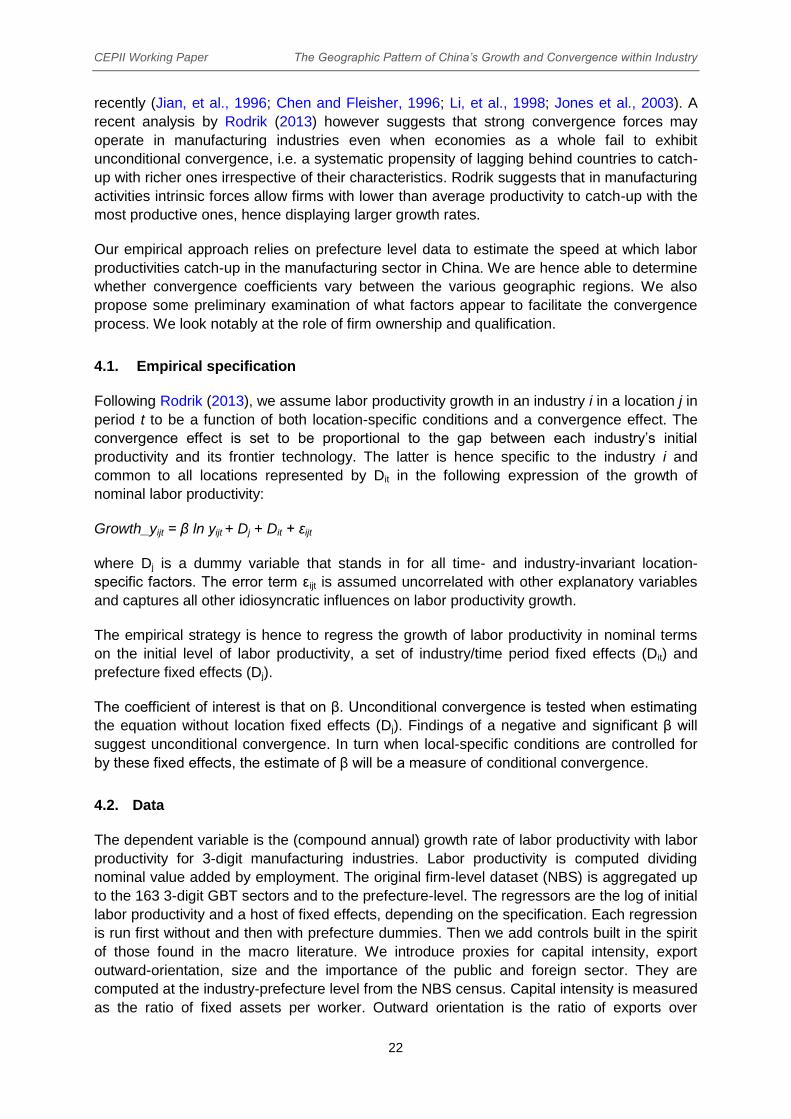
Table 3 reports the results when running over a pure cross-section for the period 1999-2009.
In that case industry × time period fixed effects are reduced to industry fixed effects.
Column 1 is the baseline result in absence of prefecture-level dummies. The coefficient of
unconditional convergence (“beta”) is very large – 9 percent per year. This figure is three
times higher than the value between 2-3 percent found in a cross-country analysis of Rodrik
(2013). This is consistent with the greater economic homogeneity and easier technology
diffusion within China than across different countries. Also our estimates are based on a
much more disaggregated classification of industries. Rodrik’s benchmark results correspond
to a breakdown of 23 2-digit industries. He notes that more disaggregated specifications
generally yielding somewhat higher estimates. A convergence rate of 9 percent implies that
industries that are, say, a fifth of the way to the technology frontier experience a convergence
boost in their labor productivity growth of 14 percentage points per annum (0.09 × ln(5)). It
also means that it takes 8 years for the laggards to cut by half their distance to the leaders.
Column 2 adds prefecture fixed effects. The coefficient on the initial productivity remains
globally unaffected suggesting that the rate of conditional convergence is roughly similar to
that of unconditional convergence.
Column 3 further adds the squared term of the initial productivity to test for non-linearity of β.
The squared term turns out to be positive and rather small in magnitude suggesting that the
convergence boost in labor productivity growth does not increase indefinitely. It reaches a
maximum value of 34 percentage points for industries which labor productivity is 26 times
lower than the technology frontier. Moreover it does not drop rapidly as labor productivity
catch-ups with the frontier confirming strong convergence forces.
CEPII Working Paper The Geographic Pattern of China’s Growth and Convergence within Industry
24
Table 3
Baseline specification: cross-section of Chinese prefectures (1999-2009)
Explained variable Annual growth rate of labor productivity (industry-prefecture) 1999-2009 decade
(1) (2) (3)
Unconditional convergence
Conditional convergence
With square
productivity
log initial productivity -0.090*** -0.094*** -0.105***
(0.001) (0.001) (0.002)
log initial productivity square
0.002***
(0.000)
Capital Intensity
0.003*** 0.002***
(0.001) (0.001)
Size (number of employee)
0.000 0.001
(0.000) (0.000)
Export on sales
-0.017*** -0.016***
(0.003) (0.003)
Share of public production
0.000 0.000
(0.002) (0.002)
Share of foreign production
0.004 0.003
(0.003) (0.003)
prefecture fixed effects No Yes Yes
industry fixed effects Yes Yes Yes
Observations 19,024 18,987 18,987
R-squared 0.619 0.655 0.656
Number of prefecture 336 336 336
Note: Heteroskedasticity-robust standard errors are reported in
parentheses. ***, ** and * respectively denote significance at the 1%,
5% and 10% levels. Control variables (capital intensity, size, export on
sales, production shares) are measured as average over the period.
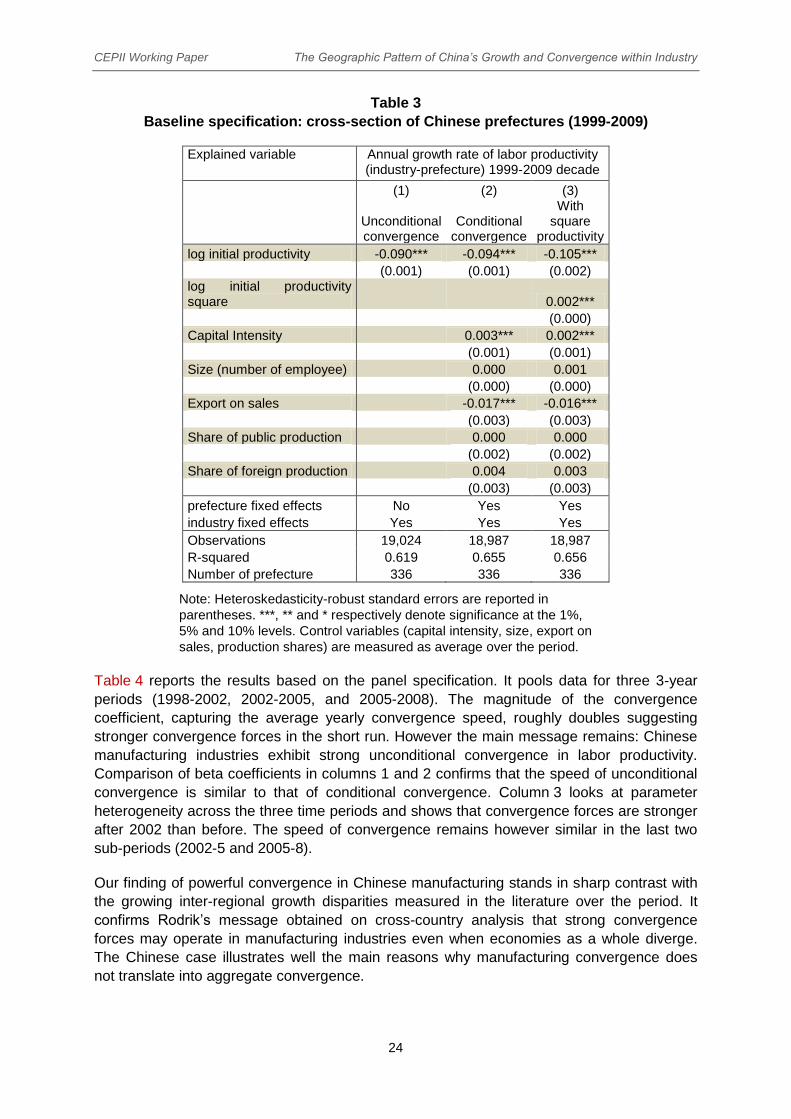
Table 4 reports the results based on the panel specification. It pools data for three 3-year
periods (1998-2002, 2002-2005, and 2005-2008). The magnitude of the convergence
coefficient, capturing the average yearly convergence speed, roughly doubles suggesting
stronger convergence forces in the short run. However the main message remains: Chinese
manufacturing industries exhibit strong unconditional convergence in labor productivity.
Comparison of beta coefficients in columns 1 and 2 confirms that the speed of unconditional
convergence is similar to that of conditional convergence. Column 3 looks at parameter
heterogeneity across the three time periods and shows that convergence forces are stronger
after 2002 than before. The speed of convergence remains however similar in the last two
sub-periods (2002-5 and 2005-8).
Our finding of powerful convergence in Chinese manufacturing stands in sharp contrast with
the growing inter-regional growth disparities measured in the literature over the period. It
confirms Rodrik’s message obtained on cross-country analysis that strong convergence
forces may operate in manufacturing industries even when economies as a whole diverge.
The Chinese case illustrates well the main reasons why manufacturing convergence does
not translate into aggregate convergence.
CEPII Working Paper The Geographic Pattern of China’s Growth and Convergence within Industry
25
The main explanations proposed by Rodrik is that non-manufacturing activities (contrary to
manufacturing) do not exhibit unconditional convergence and that the share of employment
in manufacturing is low in the poorest economies and typically rising over the course of
development. China fits this pattern. Industrial employment accounts for on average 27%,
but is much lower in poorer locations (14% in Xinjiang and 17% in Inner Mongolia) than in the
richer ones (reaching more than 40% in the Jiangsu-Zhejiang-Shanghai area), as shown in
Figure 15 below. This gives the latter a growth boost, but depresses the contribution of
manufacturing to overall productivity growth in the less developed locations. As, the share of
industrial employment increased over the period, its impact on overall convergence has
become more discernible.
Table 4
Panel specification of Chinese prefectures: three -year sub-periods
(1999-2002, 2002-05, 2005-08)
Explained variable Annual growth rate of labor productivity (industry-prefecture)
(1) (2) (3)
Unconditional Conditional
Interacting year with initial labor productivity
log initial productivity (common 1999-2008) -0.182*** -0.219*** -0.187***
(0.003) (0.002) (0.004)
log initial productivity * period 2002-2005
-0.055***
(0.004)
log initial productivity * period 2005-2008
-0.049***
(0.004)
Capital Intensity
0.019*** 0.021***
(0.002) (0.002)
Size (number of employee)
0.005*** 0.005***
(0.001) (0.001)
Export on sales
-0.049*** -0.052***
(0.006) (0.006)
Share of public production
-0.037*** -0.034***
(0.004) (0.004)
Share of foreign production
0.013*** 0.012**
(0.005) (0.005)
prefecture fixed effects No Yes Yes
industry fixed effects Yes Yes Yes
period fixed effects Yes Yes Yes
Observations 59,439 59,361 59,361
R-squared 0.310 0.367 0.373
Number of prefecture 339 339 339
Note: Heteroskedasticity-robust standard errors are reported in parentheses. ***, ** and * respectively
denote significance at the 1%, 5% and 10% levels. Control variables (capital intensity, size, export on
sales, production shares) are measured as average over the various sub-periods.

CEPII Working Paper The Geographic Pattern of China’s Growth and Convergence within Industry
26
Figure 15
Share of manufacturing employment and GDP per capita by province (2008)
Source: National Bureau of Statistics of the PRC, Statistical Yearbook.
4.3.2. Heterogeneity across geographic zones
We use two complementary approaches to verify that the process of convergence is at work
across the whole Chinese territory.
First we check that β-convergence also exists within Chinese provinces. Our regressions so
far were pooling information at the city level for all provinces. It could be a possibility that our
finding of convergence over time holds only for a sub-set of provinces or that labor
productivity converges between provinces but diverges within provinces. To improve the
estimation fit labor productivity is computed at the county level1
(instead of the prefecture
level). We estimate the individual convergence coefficients on a province-by-province basis
for each of the 24 provinces that have a sufficient number of (county) sub-locations.
1
Counties correspond to the geographical level just below the prefectures: there are between 50 and 150 counties by
province. Given the low number of counties, we do not consider intra-provincial convergence for the following provinces:
Hainan, Tibet, Ningxia, Beijing, Tianjin, Jiangsu, Chongqing.
CEPII Working Paper The Geographic Pattern of China’s Growth and Convergence within Industry
27
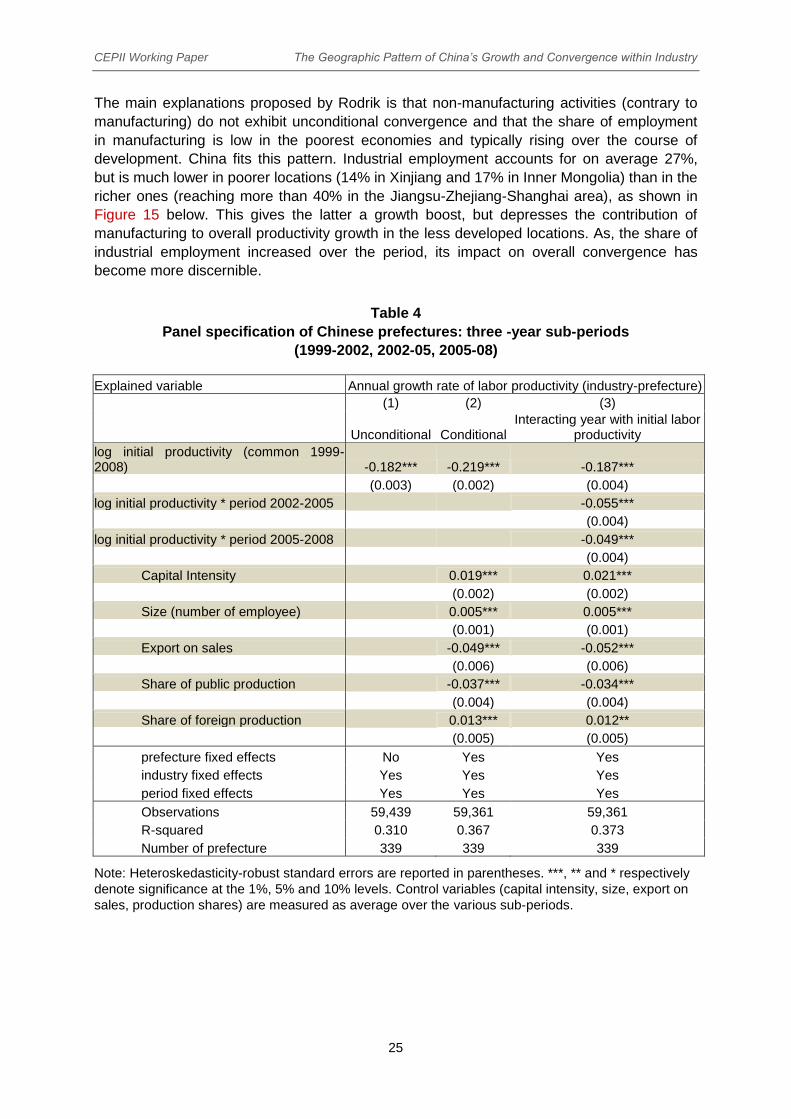
Table 5
Convergence speed at the province level:
cross-section for the 1999-2009 period
Code Province Number of counties
Beta coefficient
Significance
13 Hebei 167 -0.093 ***
14 Shanxi 47 -0.093 ***
15 Nei Mongol 55 -0.099 ***
21 Liaoning 100 -0.098 ***
22 Jilin 57 -0.097 ***
23 Heilongjiang 110 -0.095 ***
32 Jiangsu 92 -0.094 ***
33 Zhejiang 74 -0.093 ***
34 Anhui 87 -0.093 ***
35 Fujian 70 -0.097 ***
36 Jiangxi 51 -0.089 ***
37 Shandong 123 -0.091 ***
41 Henan 134 -0.092 ***
42 Hubei 96 -0.093 ***
43 Hunan 116 -0.095 ***
44 Guangdong 101 -0.093 ***
45 Guangxi 54 -0.100 ***
51 Sichuan 127 -0.093 ***
52 Guizhou 79 -0.089 ***
53 Yunnan 77 -0.092 ***
61 Shaanxi 57 -0.096 ***
62 Gansu 32 -0.100 ***
63 Qinghai 21 -0.093 ***
65 Xinjiang 66 -0.090 ***
Note: These coefficients are obtained by running pure cross-
section regressions for each province separately (at the county
level) including sector fixed effects. ***, ** and * respectively
denote significance at the 1%, 5% and 10% levels.
They are obtained from regressing, separately for each province, the growth rate of an
industry’s labor productivity against its initial level across all counties and industries in cross-
section for the 1999-2009 period. Regressions include the same controls as in Table 3 as
well as sector fixed effects at 2 digit level.2 Beta coefficients are shown in Table 5. There is
very little evidence of parameter heterogeneity across provinces as the beta coefficient only
varies between 9 and 10 percent.
Second, we use our benchmark sample as the prefecture level and allow the initial
productivity term to vary by regions. We use the regional division into 4 groups: coast,
interior, north-east and west. As shown in Table 6, convergence forces are stronger in the
central and north-eastern regions. The speed of convergence in the most backward western
area by contrast does not appear to be significantly different than the most advanced Coastal
area when capital intensity and export orientation are controlled for suggesting that western
2
The 3 digit level used in the previous regressions appears to be too detailed for this specification.

CEPII Working Paper The Geographic Pattern of China’s Growth and Convergence within Industry
28
locations have more difficulties to catch-up than less peripheral areas. This would be in line
with the issue of limited absorption capacity in the poorest locations.
Table 6
Regional heterogeneity in the baseline specification: cross-section 1999-2009
Explained variable : Annual growth rate of labor productivity (industry-prefecture)
log initial productivity -0.090*** -0.091***
(0.001) (0.001)
log initial productivity x Western area -0.006** -0.001
(0.003) (0.002)
log initial productivity x Central area -0.005*** -0.004***
(0.002) (0.002)
log initial productivity x North-eastern area -0.006*** -0.005**
(0.002) (0.002)
Capital Intensity 0.002***
(0.001)
Size (number of employee) 0.000
(0.000)
Export on sales -0.017***
(0.003)
Share of public production 0.000
(0.002)
Share of foreign production 0.004
(0.002)
prefecture fixed effects Yes Yes
industry fixed effects Yes Yes
Observations 18,986 18,986
Number of prefecture 336 336
R-squared 0.655 0.655
Note: Heteroskedasticity-robust standard errors are reported in parentheses. ***, **
and * respectively denote significance at the 1%, 5% and 10% levels. Control
variables (capital intensity, size, export on sales, production shares) are measured
as average over the period.
4.3.3. Investigating the drivers of convergence
Our investigation of the factors susceptible to be conducive to convergence exploits
successively the heterogeneity across industries and across firm-type.
Table 7 shows the individual convergence coefficients estimated on an industry-by-industry
basis for each of our 2-digit industries. Regressions are run separately for each industry. The
growth rate of an industry’s labor productivity between 1999 and 2009 is regressed on its
initial level across all prefectures added the same controls as in Table 3. The tobacco sector
stands as the only exception in our findings of rapid β-convergence. This highly-regulated
sector has an average labor productivity 10 times higher than the manufacturing average.
This anomaly which derives both from very low labor intensity and high and administratively
set prices may be at the root of the absence of convergence dynamics in this sector. The
convergence speed measured in the remaining manufacturing sectors stands in a narrow
range, between 6.7% in basic chemicals and 10 % for non-ferrous metals.
CEPII Working Paper The Geographic Pattern of China’s Growth and Convergence within Industry
29
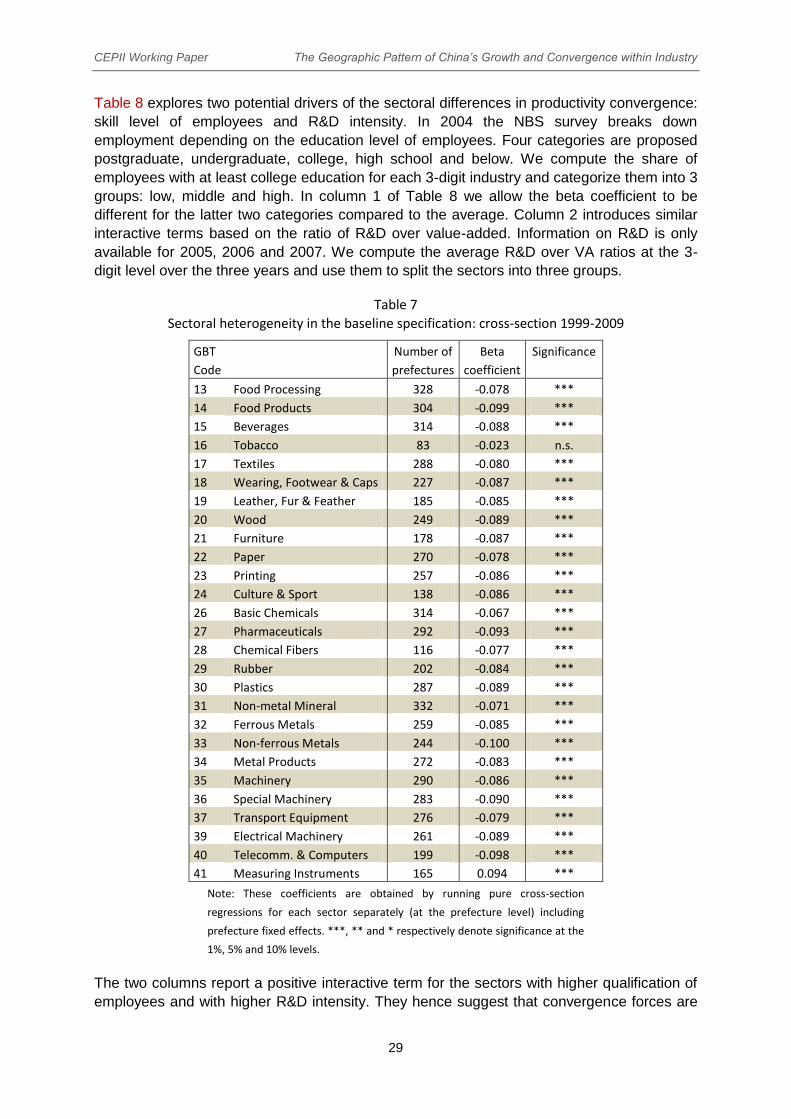
Table 8 explores two potential drivers of the sectoral differences in productivity convergence:
skill level of employees and R&D intensity. In 2004 the NBS survey breaks down
employment depending on the education level of employees. Four categories are proposed
postgraduate, undergraduate, college, high school and below. We compute the share of
employees with at least college education for each 3-digit industry and categorize them into 3
groups: low, middle and high. In column 1 of Table 8 we allow the beta coefficient to be
different for the latter two categories compared to the average. Column 2 introduces similar
interactive terms based on the ratio of R&D over value-added. Information on R&D is only
available for 2005, 2006 and 2007. We compute the average R&D over VA ratios at the 3-
digit level over the three years and use them to split the sectors into three groups.
Table 7
Sectoral heterogeneity in the baseline specification: cross-section 1999-2009
GBT
Code
Number of
prefectures
Beta
coefficient
Significance
13 Food Processing 328 -0.078 ***
14 Food Products 304 -0.099 ***
15 Beverages 314 -0.088 ***
16 Tobacco 83 -0.023 n.s.
17 Textiles 288 -0.080 ***
18 Wearing, Footwear & Caps 227 -0.087 ***
19 Leather, Fur & Feather 185 -0.085 ***
20 Wood 249 -0.089 ***
21 Furniture 178 -0.087 ***
22 Paper 270 -0.078 ***
23 Printing 257 -0.086 ***
24 Culture & Sport 138 -0.086 ***
26 Basic Chemicals 314 -0.067 ***
27 Pharmaceuticals 292 -0.093 ***
28 Chemical Fibers 116 -0.077 ***
29 Rubber 202 -0.084 ***
30 Plastics 287 -0.089 ***
31 Non-metal Mineral 332 -0.071 ***
32 Ferrous Metals 259 -0.085 ***
33 Non-ferrous Metals 244 -0.100 ***
34 Metal Products 272 -0.083 ***
35 Machinery 290 -0.086 ***
36 Special Machinery 283 -0.090 ***
37 Transport Equipment 276 -0.079 ***
39 Electrical Machinery 261 -0.089 ***
40 Telecomm. & Computers 199 -0.098 ***
41 Measuring Instruments 165 0.094 ***
Note: These coefficients are obtained by running pure cross-section
regressions for each sector separately (at the prefecture level) including
prefecture fixed effects. ***, ** and * respectively denote significance at the
1%, 5% and 10% levels.
The two columns report a positive interactive term for the sectors with higher qualification of
employees and with higher R&D intensity. They hence suggest that convergence forces are

CEPII Working Paper The Geographic Pattern of China’s Growth and Convergence within Industry
30
stronger in sectors with low qualification and R&D. This somewhat surprising result may
reflect the fact that sectors that are closer to the local comparative advantages converge
faster. Indeed in China sectors with lower qualification or R&D may be more likely to benefit
from spillovers and exploit the backwardness advantages. By contrast, sectors in the higher
end of the qualification or R&D spectrum may have more limited links with the local
productive structure and thus may be in a less favorable position to capitalize on the existing
productive knowledge. This result would be in line with findings in the context of China that
consistency with the local productive structure yields positive spillovers, such as knowledge
externalities and economies of scale and scope (Poncet and Starosta de Waldemar, 2013).
Also they are in line with Cai et al. (2011) who find that policy interventions in favor of low
skill-intensive or R and D intensive sectors were associated with higher productivity levels
and growth rates.
Table 8
Sectoral convergence and R&D and skill intensity: cross-section
1999-2009
Explained variable : Annual growth rate of labor productivity
(industry-prefecture)
1 2
log initial productivity -0.096*** -0.096***
(0.001) (0.001)
log initial productivity x high R&D 0.004***
(0.002)
log initial productivity x medium R&D 0.002*
(0.001)
log initial productivity x high qualification
0.005***
(0.002)
log initial productivity x medium qualification
0.002
(0.001)
Capital Intensity 0.003*** 0.003***
(0.001) (0.001)
Size (number of employee) 0.000 0.000
(0.000) (0.000)
Export on sales -0.017*** -0.017***
(0.003) (0.003)
Share of public production 0.000 0.000
(0.002) (0.002)
Share of foreign production 0.004 0.004*
(0.002) (0.003)
prefecture fixed effects Yes Yes
industry fixed effects Yes Yes
Observations 18,986 18,986
R-squared 0.655 0.655
Number of prefecture 336 336
Note: Heteroskedasticity-robust standard errors are reported in
parentheses. ***, ** and * respectively denote significance at the 1%, 5%
and 10% levels. Control variables (capital intensity, size, export on sales,
production shares) are measured as average over the period.

CEPII Working Paper The Geographic Pattern of China’s Growth and Convergence within Industry
31
We now exploit the information on the ownership structure of firms in the census data to
determine whether convergence forces vary across firm-types. We distinguish between three
categories of firms: domestic state-owned, domestic private and foreign owned. Column 1 of
Table 9 allows the speed of convergence to differ depending on the three firm types. The
positive and significant coefficients on the interactive terms for public and foreign firms
indicate that convergence forces are stronger for private firms. This result is confirmed when
splitting the sample according to the three groups. Higher beta coefficient is found for private
firms.
Lower convergence speed for state-owned activities may relate to the well-documented
inefficiency and lack of incentives in the public sector in China. It is interesting to note that
the foreign capital is not associated with a faster speed of convergence of Chinese
prefectures. This result is in line with growing evidence of fewer spillover gains emanating
from foreign activities (Poncet and Starosta de Waldemar, 2013; Hale and Long, 2011).
Table 9
Firm ownership and convergence: cross-section 1999-2009
Explained variable Annual growth rate of labor productivity (industry-
prefecture)
(1) (2) (3) (4)
Interacting base productivity with
firms type
Only public firms
Only private firms
Only foreign firms
log initial productivity -0.097*** -0.088*** -0.095*** -0.093***
(0.001) (0.002) (0.001) (0.001)
log initial productivity x public type 0.009***
(0.002)
log initial productivity x foreign type 0.010***
(0.002)
Capital Intensity 0.004*** 0.005*** 0.002*** 0.005***
(0.001) (0.002) (0.001) (0.001)
Size (number of employee) 0.001* 0.001 0.001 0.004***
(0.000) (0.001) (0.001) (0.001)
Export on sales -0.014*** -0.010 -0.007** -0.016***
(0.003) (0.009) (0.003) (0.004)
Prefecture fixed effects Yes Yes Yes Yes
Industry fixed effects Yes Yes Yes Yes
Observations 20,550 5,436 10,172 4,942
R-squared 0.581 0.424 0.702 0.614
Number of prefecture 332 323 325 264
Note: Heteroskedasticity-robust standard errors are reported in parentheses. ***, ** and *
respectively denote significance at the 1%, 5% and 10% levels. Control variables (capital
intensity, size, export on sales, production shares) are measured as average over the period.
5. Conclusions
The paper shows that China has entered a new phase in its growth trajectory in the 2000s.
There has been a spatial rebalancing of economic growth in favor of the interior and the gap
in GDP per capita between the coast and inland has narrowed. This macroeconomic catch-

CEPII Working Paper The Geographic Pattern of China’s Growth and Convergence within Industry
32
up reflects, with a time lag, the convergence process which has been at work in
manufacturing industry since the end of the 1990s.
The Chinese case exemplifies Rodrik’s finding of an unconditional convergence in
manufacturing industry, i.e. a systematic propensity of .lagging behind countries to catch-up
with richer ones irrespective of their characteristics. It also highlights how the "flying geese"
model operates within a vast country with still large regional disparities. It suggests that
inland industry has been catching up the labor productivity level of the coastal industry,
thanks to the transfer of technology and capital from these most advanced regions. China is
thus becoming increasingly integrated in terms of technological level.
The industrialization of the inner regions opens up new prospects for the Chinese
development. Relying mainly on domestic market and capital, inland industrial pattern is in
line with the transition to a growth model less dependent on global markets. However, this
inland industrialization drive will have to be made compatible with the new priority of
promoting consumption over investment and of protecting the environment.
The advanced coastal regions are losing their comparative advantage in labor intensive
industries and have now to build up new specialization in high value-added industry and
services. The opening of the services sector to Chinese private investors as well as foreign
companies becomes crucial for coastal economies. The recent "special economic zone"
opened in Shanghai embodies the need for the coast to find new growth opportunities.
CEPII Working Paper The Geographic Pattern of China’s Growth and Convergence within Industry
33
References
Andersson Fredrik N. G., David L. Edgerton and Sonja Opper, 2013, A Matter of Time:
Revisiting Growth Convergence in China, World Development, forthcoming.
Berthélemy Jean-Claude, Sylvie Démurger (2000): Foreign Direct Investment and Economic
Growth: Theory and Application to China. Review of Development Economics, 4: 140–
155. doi: 10.1111/1467-9361.00083
Bergère, Marie Claire (1989), The Golden Age of the Chinese Bourgeoisie, Cambridge
University Press.
Bergère, Marie Claire, Lucien Bianco, Jürgen Domes (1990), La Chine du XXème siècle.
D’une révolution à l’autre, 1895-1949, Editions Fayard.
Cai, Jing, Ann Harrison and Justin Lin (2011), “The Pattern of Protection and Economic
Growth: Evidence from Chinese Cities”, mimeo.
Chen, Jian and Fleisher, Belton M., (1996), “Regional Income Inequality and Economic
Growth in China”, Journal of Comparative Economics, Elsevier, vol. 22(2), pages 141-
164, April.
Démurger, Sylvie, Jeffrey Sachs, Wing Thye Woo, Shiming Bao, Gene Chang (2002),
“Geography, Economic Policy and Regional Development in China”, Asian Economic
Papers, 1:1, pp.146-195.
Deng, Paul, Gary Jefferson (2010), “Is Inequality bad for China’s economic growth?”, China
Growth Center Discussion Paper Series, n°8 July.
Deng, Paul and Gary Jefferson (2011), “Explaining Spatial Convergence of China’s Industrial
Productivity,” Oxford Bulletin of Economics and Statistics, Vol. 73, Issue 6, pp. 818-
832.
Dernberger Robert F. (editor) (1980), China’s Development Experience in Comparative
Perspective, Harvard University Press, Cambridge, Massachusetts and London.
Feng, Liu (2009), “New Trends in China’s Regional Economic Development”, in Swee-Hock
Saw and John Wong (eds), Regional Economic Development in China, Saw Center for
Financial Studies, East Asian Institute, National University of Singapore, Institute of
Southeast Asian Studies.
Gaulier, Guillaume, Françoise Lemoine and Deniz Ünal-Kesenci (2007), China’s emergence
and the reorganisation of trade flows in Asia, China Economic Review, vol.18, pp.209-
243.
Gipouloux François (2009), La Méditerranée asiatique. Villes portuaires et réseaux
marchands en Chine, au Japon et en Asie du Sud-Est, XVIè-XXIè siècle, Editions
CNRS.
Giroir, Guillaume (1999), « Processus de développement et dynamiques régionales en
Chine », in Larivière J.-P. (dir.), La Chine et les Chinois de la diaspora, SEDES.

CEPII Working Paper The Geographic Pattern of China’s Growth and Convergence within Industry
34
Hale, Galina, and Cheryl Long (2011), “Are There Productivity Spillovers From Foreign Direct
Investment In China?”, Pacific Economic Review, 16(2): 135-153.
Inomata, Satoshi and Yoko Ushida (2009), “Asia Beyond the Crisis - Visions from
International Input-Output Analyses”, IDE-JETRO Spot Survey, No.31, December.
Jefferson, Gary H., Thomas G. Rawski, Yifan Zhang (2008), “Productivity Growth and
Convergence Across China Industrial Economy”, Journal of Chinese Economics and
Business Studies, , 6,2:121-140 (Reprinted in China Economic Quarterly, 7,3, 809-826,
May, 2008).
Jones, Derek, Cheng Li and Ann L. Owen (2003), “Growth and Regional Inequality in China
During the Reform Era”, William Davidson Working Paper, n°561, May.
Jian, Tianlun, Sachs, Jeffrey D. and Warner, Andrew M. (1996), “Trends in regional
inequality in China”, China Economic Review, Elsevier, vol. 7(1), pages 1-21.
Kang, Lily and Fei Peng (2013), “Cost competitiveness comparisons and convergence in
China”, National Institute Economic Review, n°2, p.49-60.
Lardy, Nicholas (1980), “Regional Growth and Income Distribution in China”, in Dernberger
(ed.), China’s Development Experience in Comparative Perspective, Harvard
University Press, Cambridge, Massachusetts and London.
Lemoine, Françoise (1990), « La vague d’industrialisation des régions côtières chinoises »,
Economie Prospective Internationale, N°42, 2ème trimestre.
Li, H., Liu Z.N., Rebelo I. (1998), “Testing the Neoclassical Theory of Economic Growth:
Evidence from Chinese Provinces”, Economics of Planning, Vol. 31, 117-132.
Lin, Justin Yifu, Fang Cai and Zhou Li (2002), “Social consequences of economic reform in
China: an analysis of regional disparity in the transition period”, in M-F. Renard (editor),
China and its Regions: Economic Growth and Reform in Chinese Provinces, Edward
Elgar.
Liu, Ta-Chung and Kung-Chia Yeh (1965), The Economy of Chinese Mainland. National
Income and Economic Development, Princeton University Press.
Maddison, Angus. (2010), Statistics on World Population, GDP and Per Capita GDP, 1-2008
AD University of Groningen, http://www.ggdc.net/maddison/oriindex.htm.
McKay, Huw and Ligang Song (eds) (2012), Rebalancing and Sustaining Growth in China,
The Australian National University Press, Canberra, and Social Sciences Academic
Press (China), Beijing. Online: http://www.eastasiaforum.org/2012/07/03/rebalancing-
the-chinese-economy-to-sustain-long-term-growth/?format=pdf.
Meng Bo, Zhi Wang and Robert Koopman (2013), “How are Global Value-chains
Fragmented and Extended in China’s Domestic production Networks?”, IDE Discussion
Paper N°424, August.

CEPII Working Paper The Geographic Pattern of China’s Growth and Convergence within Industry
35
Naugton, Barry (2002), “Provincial economic growth in China: causes and consequences of
regional differentiation”, in M-F. Renard (editor), China and its Regions: Economic
Growth and Reform in Chinese Provinces, Edward Elgar.
OECD (2010), OECD Economic Surveys. China. Volume 2010/6. February.
Poncet, Sandra and Felipe, Starosta de Waldemar (2013), “Product relatedness and firm
exports in China”, The World Bank Economic Review, forthcoming.
Qu, Yue, Fang Cai and Xiaobo Zhang (2012), “Has the ‘Flying Geese’ Phenomenon in
Industrial Transformation Occurred in China?”, in McKay Huw and Ligang Song (eds),
Rebalancing and Sustaining Growth in China, The Australian National University Press.
Renard, Mary-Françoise (editor) (2002), China and its Regions: Economic Growth and
Reform in Chinese Provinces, Edward Elgar.
Rodrik, Dani (2013), “Unconditional Convergence in Manufacturing”, The Quarterly Journal of
Economics, 128 (1): 165-204.
Ruan, Jianqing, Xiaobo Zhang (2010), “Do Geese Migrate Domestically? Evidence from the
Chinese Textile and Apparel Industry”, IFPRI Discussion Paper, n°01040, December.
Sanjuan, Thierry (2007), Atlas de la Chine, Editions Autrement.
Saw, Swee-Hock and John Wong (eds) (2009), Regional Economic Development in China,
Saw Center for Financial Studies, East Asian Institute, National University of
Singapore, Institute of Southeast Asian Studies.
Sha, Ran, Wim Naudé and Wilma Viviers, 2007, Income Disparities across Chinese
Provinces: Revisiting the Convergence-Divergence Debate, mimeo.
Wei, Houkai (2009), “Regional Economic Development in China: Agglomeration and
Relocation”, in Swee-Hock Saw, John Wong (eds), Regional Economic Development in
China.
CEPII Working Paper The Geographic Pattern of China’s Growth and Convergence within Industry
36
Appendices
Appendix 1 The database
Harmonization and adjustments
The Industrial enterprises census database provides data at firm level and covers all state-
owned and non-state-owned industrial enterprises with annual sales above 5 million Yuan.
We made the following harmonization and adjustment in the data set.
The industry codes changed in 2003, and we connected the old codes with the new ones
using the concordance file proposed by Zheng Wang
(http://zhengwang.weebly.com/research.html; Excel File: 3-digit Chinese GB/T industry
codes consistent before and after 2003).
There were changes in the prefecture codes assigned to the same firm during the all period.
These codes have been converted into the relevant ones. For the four municipalities which
have a provincial rank (Beijing, Chongqing, Shanghai and Tianjin), we have merged the
different prefectures’ codes because they were not relevant for our convergence analysis.
There is no data for value-added value in the database for the following years: 2001, 2004,
2008, 2009. For 2001 and 2004, we have the data for the Gross value of industrial output
(GVIO) and the intermediate input. So we calculated the value added by subtracting the input
to the output. For 2008 and 2009, we had data only for GVIO. Considering that the ratio
value added/output by industry is quite steady over time, we have calculated the average
ratio on 2006-2007 and applied this ratio to estimate the value added by industry in 2008 and
2009.
For 2000, 2008 and 2009, the data concern only the average number of employees. But the
difference between this variable and the total number of employee at industry level is minimal
for the other when the comparison can be made.
In our dataset, some variables take abnormal values (excessively low or high) which is likely
to be due to unit problems (e.g. 1000 Yuan instead of 10000). In order to correct this, we
dropped the following firms:
- Those with negative fixed assets - The very small firms (i.e. with less than 8 workers) because their accountability
system is presumably not reliable enough. These firms don’t fill generally the criterion of at least 5 million Yuan annual sales.
- The firms which record a ratio of value added/sales which is negative or above 1.
The following session presents the representativeness of the two databases, i.e. the initial
database and the new one which excludes the above mentioned firms.
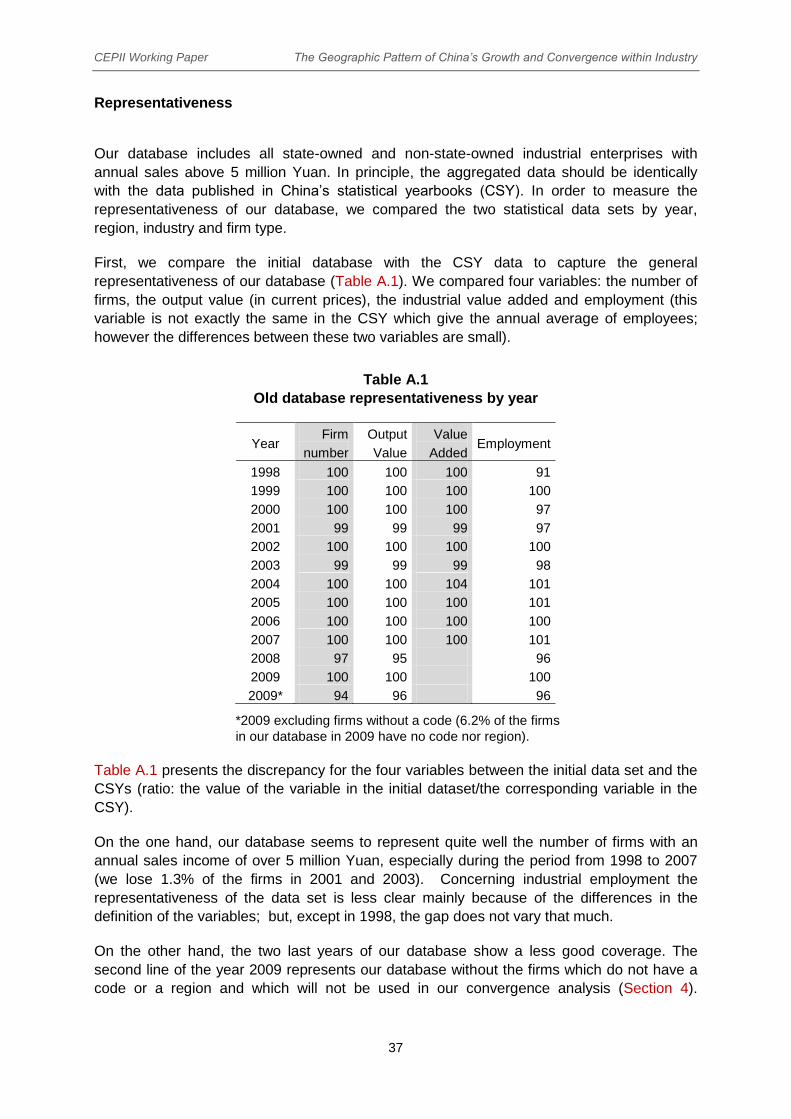
CEPII Working Paper The Geographic Pattern of China’s Growth and Convergence within Industry
37
Representativeness
Our database includes all state-owned and non-state-owned industrial enterprises with
annual sales above 5 million Yuan. In principle, the aggregated data should be identically
with the data published in China’s statistical yearbooks (CSY). In order to measure the
representativeness of our database, we compared the two statistical data sets by year,
region, industry and firm type.
First, we compare the initial database with the CSY data to capture the general
representativeness of our database (Table A.1). We compared four variables: the number of
firms, the output value (in current prices), the industrial value added and employment (this
variable is not exactly the same in the CSY which give the annual average of employees;
however the differences between these two variables are small).
Table A.1
Old database representativeness by year
Year Firm
number
Output
Value
Value
Added Employment
1998 100 100 100 91
1999 100 100 100 100
2000 100 100 100 97
2001 99 99 99 97
2002 100 100 100 100
2003 99 99 99 98
2004 100 100 104 101
2005 100 100 100 101
2006 100 100 100 100
2007 100 100 100 101
2008 97 95 96
2009 100 100 100
2009* 94 96 96
*2009 excluding firms without a code (6.2% of the firms
in our database in 2009 have no code nor region).
Table A.1 presents the discrepancy for the four variables between the initial data set and the
CSYs (ratio: the value of the variable in the initial dataset/the corresponding variable in the
CSY).
On the one hand, our database seems to represent quite well the number of firms with an
annual sales income of over 5 million Yuan, especially during the period from 1998 to 2007
(we lose 1.3% of the firms in 2001 and 2003). Concerning industrial employment the
representativeness of the data set is less clear mainly because of the differences in the
definition of the variables; but, except in 1998, the gap does not vary that much.
On the other hand, the two last years of our database show a less good coverage. The
second line of the year 2009 represents our database without the firms which do not have a
code or a region and which will not be used in our convergence analysis (Section 4).

CEPII Working Paper The Geographic Pattern of China’s Growth and Convergence within Industry
38
However we still have a good coverage in terms of all variables (around 95% of CSD’s
values for all variables).
We have checked the representativeness of the data set at the level of province, industry
and category of types. Due to space limitation, the tables are not shown here but the
following observations stand out.
The coverage is the best at the level of firm category, less good at the level of provinces, and
the worst at the level of industry. The main issues are the following:
- In 2001 and 2008, the number of firms is under-reported in Nonferrous metal industries (including the Smelting and Pressing of Non-ferrous Metals industry which represents 4.5% of firms present in our database for other years) and the number of firms is over-reported in recycling industry.
- The codes of Logging and Transport of Timber and Bamboo industry has changed after 2002 and we have included it in sector Wood-Paper. In the same way, Recycling and Disposal of Waste is present in the database only since 2003 and we have included it in Other manufacturing).
- In 2003, there is no data for the Tibet (Xizang) province, and half of the firms for Yunnan and Shaanxi provinces are missing.
- In 2008 and 2009, the data set shows a better coverage for Coastal and North-East region provinces that for the Central and Western provinces.
- The data set over-represents Cooperative firms in 2009.
The above comparison concerns the representativeness of the initial database. The
representativeness of the new data base (without the firms we have excluded) is presented
in Table A.2.
Table A.2
New database representativeness by year
Year Firm
number
Output
Value VA Employment
1998 85 92 95 84
1999 91 97 99 95
2000 89 96 97 95
2001 92 97 97 94
2002 94 98 99 97
2003 95 98 97 96
2004 95 98 101 98
2005 97 98 99 98
2006 97 98 99 98
2007 97 98 98 99
2008 96 94 96
2009 99 100 100
2009* 93 96 95
*2009 without firms without a code (6.2% of the firms
in our database in 2009 have no code, nor regions).
Table A.2 shows that we lose from 1% to 15% of the firms, depending of the year, compared
with the CSY. The loss is smaller for the other variables (less than 5%, in general, for output,
value added and employment); mainly because we dropped small firms (i.e. the ones with

CEPII Working Paper The Geographic Pattern of China’s Growth and Convergence within Industry
39
less than 8 workers). Moreover, it is likely that the firms which show abnormal values (of
fixed asset, value added or sales) are the small ones. The representativeness of our new
database is lower during the first years of our sample and improves in more recent years.
Lastly, in 2008 and 2009, the representativeness of the new data set is not very different
from the initial data set.
To sum up, the initial database provides data which are, in general, quite close to that of the
China Statistical Yearbooks, with some exceptions (for a particular industry, province and
year). The revised database, which excludes the small firms and the firms showing abnormal
variable values, is also relatively close to the CSY. Except for 1998, more than 90% of our
four main variables (number of firms, value added, output and employment) are covered.
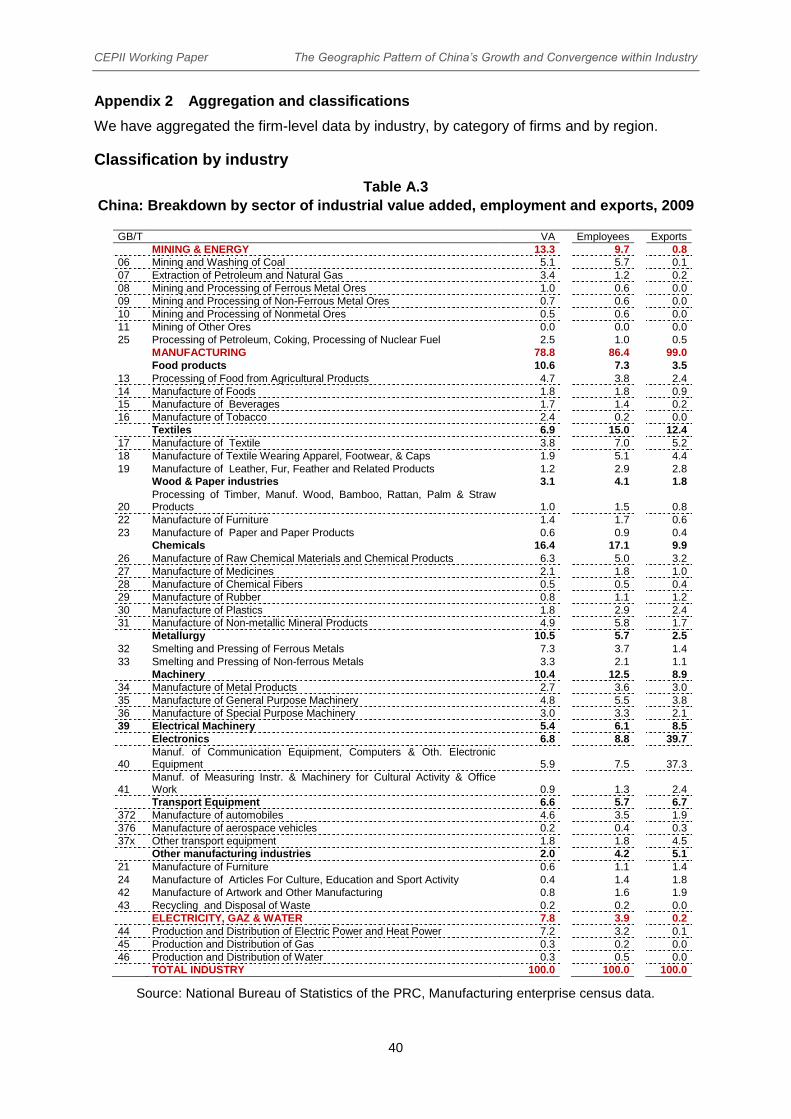
CEPII Working Paper The Geographic Pattern of China’s Growth and Convergence within Industry
40
Appendix 2 Aggregation and classifications
We have aggregated the firm-level data by industry, by category of firms and by region.
Classification by industry
Table A.3
China: Breakdown by sector of industrial value added, employment and exports, 2009
GB/T
VA
Employees
Exports
MINING & ENERGY 13.3
9.7
0.8
06 Mining and Washing of Coal 5.1
5.7
0.1
07 Extraction of Petroleum and Natural Gas 3.4
1.2
0.2
08 Mining and Processing of Ferrous Metal Ores 1.0
0.6
0.0
09 Mining and Processing of Non-Ferrous Metal Ores 0.7
0.6
0.0
10 Mining and Processing of Nonmetal Ores 0.5
0.6
0.0
11 Mining of Other Ores 0.0
0.0
0.0
25 Processing of Petroleum, Coking, Processing of Nuclear Fuel 2.5
1.0
0.5
MANUFACTURING 78.8
86.4
99.0
Food products 10.6
7.3
3.5
13 Processing of Food from Agricultural Products 4.7
3.8
2.4
14 Manufacture of Foods 1.8
1.8
0.9
15 Manufacture of Beverages 1.7
1.4
0.2
16 Manufacture of Tobacco 2.4
0.2
0.0
Textiles 6.9
15.0
12.4
17 Manufacture of Textile 3.8
7.0
5.2
18 Manufacture of Textile Wearing Apparel, Footwear, & Caps 1.9
5.1
4.4
19 Manufacture of Leather, Fur, Feather and Related Products 1.2
2.9
2.8
Wood & Paper industries 3.1
4.1
1.8
20 Processing of Timber, Manuf. Wood, Bamboo, Rattan, Palm & Straw Products 1.0
1.5
0.8
22 Manufacture of Furniture 1.4
1.7
0.6
23 Manufacture of Paper and Paper Products 0.6
0.9
0.4
Chemicals 16.4
17.1
9.9
26 Manufacture of Raw Chemical Materials and Chemical Products 6.3
5.0
3.2
27 Manufacture of Medicines 2.1
1.8
1.0
28 Manufacture of Chemical Fibers 0.5
0.5
0.4
29 Manufacture of Rubber 0.8
1.1
1.2
30 Manufacture of Plastics 1.8
2.9
2.4
31 Manufacture of Non-metallic Mineral Products 4.9
5.8
1.7
Metallurgy 10.5
5.7
2.5
32 Smelting and Pressing of Ferrous Metals 7.3
3.7
1.4
33 Smelting and Pressing of Non-ferrous Metals 3.3
2.1
1.1
Machinery 10.4
12.5
8.9
34 Manufacture of Metal Products 2.7
3.6
3.0
35 Manufacture of General Purpose Machinery 4.8
5.5
3.8
36 Manufacture of Special Purpose Machinery 3.0
3.3
2.1
39 Electrical Machinery 5.4
6.1
8.5
Electronics 6.8
8.8
39.7
40 Manuf. of Communication Equipment, Computers & Oth. Electronic Equipment 5.9
7.5
37.3
41 Manuf. of Measuring Instr. & Machinery for Cultural Activity & Office Work 0.9
1.3
2.4
Transport Equipment 6.6
5.7
6.7
372 Manufacture of automobiles 4.6
3.5
1.9
376 Manufacture of aerospace vehicles 0.2
0.4
0.3
37x Other transport equipment 1.8
1.8
4.5
Other manufacturing industries 2.0
4.2
5.1
21 Manufacture of Furniture 0.6
1.1
1.4
24 Manufacture of Articles For Culture, Education and Sport Activity 0.4
1.4
1.8
42 Manufacture of Artwork and Other Manufacturing 0.8
1.6
1.9
43 Recycling and Disposal of Waste 0.2
0.2
0.0
ELECTRICITY, GAZ & WATER 7.8
3.9
0.2
44 Production and Distribution of Electric Power and Heat Power 7.2
3.2
0.1
45 Production and Distribution of Gas 0.3
0.2
0.0
46 Production and Distribution of Water 0.3
0.5
0.0
TOTAL INDUSTRY 100.0 100.0 100.0
Source: National Bureau of Statistics of the PRC, Manufacturing enterprise census data.

CEPII Working Paper The Geographic Pattern of China’s Growth and Convergence within Industry
41
Classification by category of firm and type of ownership
Table A.4
China: breakdown of industrial capital by category of firms and type of ownership
2007 (% total)
Type of capital ownership
Code Category of firm State Collective Corporate Personal HMT Foreign Total
Public firms 13.5 0.9 8.7 0.3 0.1 0.1 23.7
110 SOE (State owned enterprise) 9.0 0.1 5.5 0.1 0.0 0.0 14.7
120 Collective-owned enterprise 0.0 0.8 0.3 0.1 0.0 0.0 1.2
141 State cooperative enterprise 0.1 0.0 0.1 0.0 0.0 0.0 0.2
142 Collective cooperative enterprise 0.0 0.0 0.0 0.0 0.0 0.0 0.0
143 State and collective cooperative enterprise 0.0 0.0 0.0 0.0 0.0 0.0 0.0
151 State-owned limited liability Co. 4.4 0.1 2.8 0.1 0.0 0.0 7.4
Private & corporate firms 6.4 1.1 17.7 15.3 0.3 0.4 41.2
130 Equity joint venture 0.0 0.1 0.3 0.2 0.0 0.0 0.6
149 Other cooperative enterprise 0.0 0.0 0.1 0.0 0.0 0.0 0.1
159 Other limited liability Co. 2.7 0.7 8.9 3.7 0.1 0.2 16.3
171 Private wholly owned enterprise 0.0 0.0 0.6 1.3 0.0 0.0 2.0
172 Private partnership enterprise 0.0 0.0 0.1 0.3 0.0 0.0 0.4
173 Private limited liability company 0.0 0.1 3.4 7.5 0.0 0.1 11.1
174 Private Co., Ltd 0.0 0.0 0.3 0.6 0.0 0.0 0.9
190 Other domestic enterprise 0.0 0.0 0.3 0.1 0.0 0.0 0.3
160 Share-holding Co, Ltd 3.6 0.2 3.7 1.7 0.1 0.1 9.5
Firms with foreign capital 1.5 0.3 5.8 0.9 9.5 17.1 35.2
Hong Kong, Macao, Taiwan (HMT) 0.5 0.1 1.9 0.4 9.1 0.3 12.4
210 HMT equity joint venture 0.3 0.1 1.4 0.3 1.9 0.2 4.1
220 HMT cooperative venture 0.1 0.0 0.1 0.0 0.4 0.0 0.6
230 HMT wholly owned enterprise 0.0 0.0 0.2 0.0 6.7 0.1 7.1
240 HMT invested Co., Ltd 0.1 0.0 0.2 0.1 0.2 0.0 0.6
Other foreign firms 1.1 0.2 3.9 0.5 0.4 16.8 22.8
310 Foreign equity joint venture 0.9 0.2 3.0 0.4 0.2 4.8 9.5
320 Foreign cooperative venture 0.0 0.0 0.2 0.0 0.0 0.5 0.9
330 Foreign wholly owned enterprise 0.0 0.0 0.4 0.0 0.1 10.9 11.4
340 Foreign invested Co., Ltd 0.1 0.0 0.3 0.1 0.0 0.5 1.0
All firms 21.4 2.4 32.2 16.6 9.8 17.5 100.0
Source: National Bureau of Statistics of the PRC, Manufacturing enterprise census data.
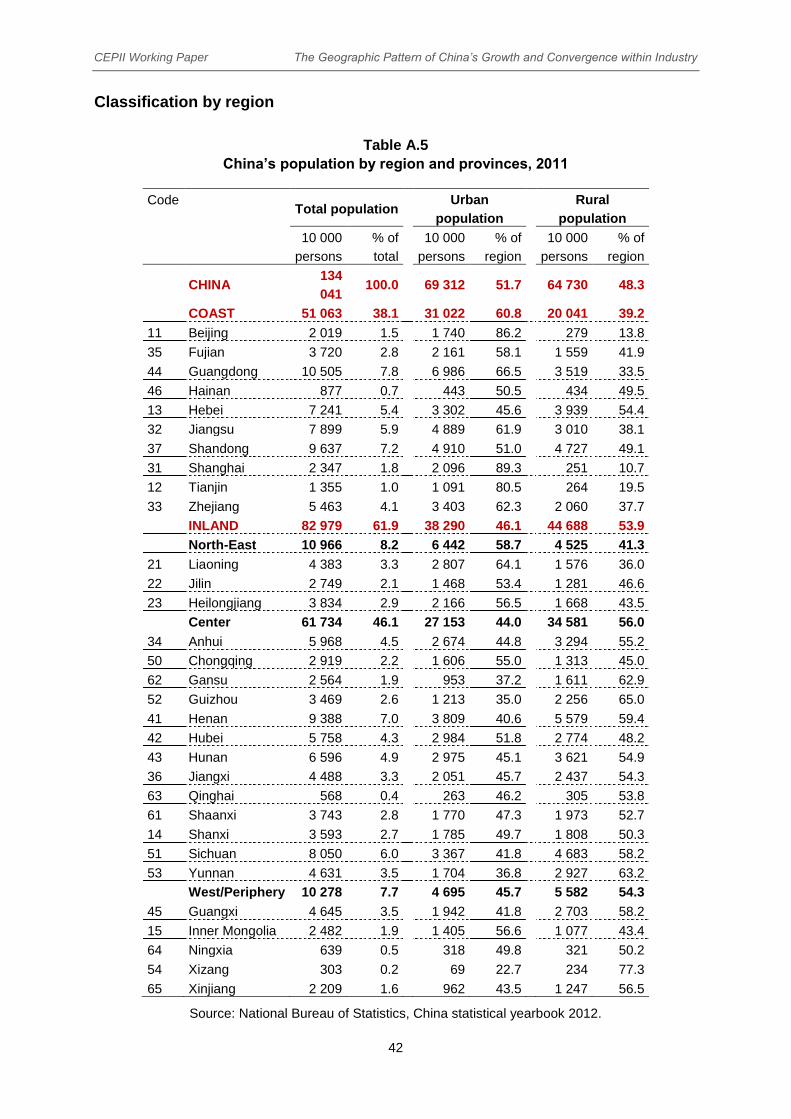
CEPII Working Paper The Geographic Pattern of China’s Growth and Convergence within Industry
42
Classification by region
Table A.5
China’s population by region and provinces, 2011
Code
Total population
Urban
population
Rural
population
10 000
persons
% of
total
10 000
persons
% of
region
10 000
persons
% of
region
CHINA
134
041 100.0
69 312 51.7
64 730 48.3
COAST 51 063 38.1 31 022 60.8 20 041 39.2
11 Beijing 2 019 1.5 1 740 86.2 279 13.8
35 Fujian 3 720 2.8 2 161 58.1 1 559 41.9
44 Guangdong 10 505 7.8 6 986 66.5 3 519 33.5
46 Hainan 877 0.7 443 50.5 434 49.5
13 Hebei 7 241 5.4 3 302 45.6 3 939 54.4
32 Jiangsu 7 899 5.9 4 889 61.9 3 010 38.1
37 Shandong 9 637 7.2 4 910 51.0 4 727 49.1
31 Shanghai 2 347 1.8 2 096 89.3 251 10.7
12 Tianjin 1 355 1.0 1 091 80.5 264 19.5
33 Zhejiang 5 463 4.1 3 403 62.3 2 060 37.7
INLAND 82 979 61.9 38 290 46.1 44 688 53.9
North-East 10 966 8.2 6 442 58.7 4 525 41.3
21 Liaoning 4 383 3.3 2 807 64.1 1 576 36.0
22 Jilin 2 749 2.1 1 468 53.4 1 281 46.6
23 Heilongjiang 3 834 2.9 2 166 56.5 1 668 43.5
Center 61 734 46.1 27 153 44.0 34 581 56.0
34 Anhui 5 968 4.5 2 674 44.8 3 294 55.2
50 Chongqing 2 919 2.2 1 606 55.0 1 313 45.0
62 Gansu 2 564 1.9 953 37.2 1 611 62.9
52 Guizhou 3 469 2.6 1 213 35.0 2 256 65.0
41 Henan 9 388 7.0 3 809 40.6 5 579 59.4
42 Hubei 5 758 4.3 2 984 51.8 2 774 48.2
43 Hunan 6 596 4.9 2 975 45.1 3 621 54.9
36 Jiangxi 4 488 3.3 2 051 45.7 2 437 54.3
63 Qinghai 568 0.4 263 46.2 305 53.8
61 Shaanxi 3 743 2.8 1 770 47.3 1 973 52.7
14 Shanxi 3 593 2.7 1 785 49.7 1 808 50.3
51 Sichuan 8 050 6.0 3 367 41.8 4 683 58.2
53 Yunnan 4 631 3.5 1 704 36.8 2 927 63.2
West/Periphery 10 278 7.7 4 695 45.7 5 582 54.3
45 Guangxi 4 645 3.5 1 942 41.8 2 703 58.2
15 Inner Mongolia 2 482 1.9 1 405 56.6 1 077 43.4
64 Ningxia 639 0.5 318 49.8 321 50.2
54 Xizang 303 0.2 69 22.7 234 77.3
65 Xinjiang 2 209 1.6 962 43.5 1 247 56.5
Source: National Bureau of Statistics, China statistical yearbook 2012.

CEPII Working Paper The Geographic Pattern of China’s Growth and Convergence within Industry
43
i Our database includes all state-owned and non-state-owned industrial enterprises with annual sales over 5 million Yuan
(often referred as the “above-scale” industrial firms). These data come from annual surveys conducted by the National
Bureau of Statistics (NBS). Industry is defined here to include mining, manufacturing and public utilities. ii Since 1949, the Chinese government has had various definitions of economic regions, depending on
the distinctive priorities of its development strategy (Wei, 2009). Since the 11th plan (2006-2010), the
basic framework for regional development policy distinguishes four economic regions. The coastal
(eastern) area has the same geographical limits (10 provinces) as in our classification; the north-east
also (3 provinces); but the center area encompasses only six provinces (Shanxi, Anhui, Jiangsu,
Henan, Hubei, Hunan) while the Western Region is greater than in our classification and
encompasses 12 provinces (Inner Mongolia, Guangxi, Chongqing, Sichuan, Guizhou, Yunnan, Tibet,
Shaanxi, Gansu, Qinghai, Ningxia, Xinjiang).

CEPII Working Paper The Geographic Pattern of China’s Growth and Convergence within Industry
Abstract
Since the mid-2000s, the center of gravity of China’s economic growth has shifted from the coastline to the inland and the gap in GDP per capita between the two areas has narrowed. This macroeconomic catch-up refl ects, with a time lag, the convergence process which has been at work in manufacturing industry since the end of the 1990s and suggests that China is becoming increasingly integrated in terms of technological level. This pattern is in line with a process whereby the inland catches up the labor productivity level of the coast thanks to the transfer of technology and capital from these most advanced regions.
Keywords
China, Regional inequality, Manufacturing industry, Convergence, Growth.
JEL
F63, O14, O25, O53, R12.
CEPII (Centre d’Etudes Prospectives et d’Informations Internationales) is a French institute dedicated to producing independent, policy-oriented economic research helpful to understand the international economic environment and challenges in the areas of trade policy, competitiveness, macroeconomics, international fi nance and growth.
CEPII Working PaperContributing to research in international economics
© CEPII, PARIS, 2014
All rights reserved. Opinions expressed in this publication are those of the author(s) alone.
Editorial Director:Sébastien Jean
Production: Laure Boivin
No ISSN: 1293-2574
CEPII113, rue de Grenelle75007 Paris+33 1 53 68 55 00
www.cepii.frPress contact: [email protected]
Working Paper