the future of jobs report - national skills network
TRANSCRIPT

The Future of Jobs Report
2020O C T O B E R 2 0 2 0

The Future of Jobs 2
ContentsPreface
Executive Summary
Part 1 Tracking the Future of Jobs
Chapter 1 The Labour Market Outlook in the Pandemic Economy
1.1 Introduction
1.2 Short-term shocks and long-term trends
1.3 The remote and hybrid workforce
1.4 Impact on equality
Chapter 2 Forecasts for Labour Market Evolution in 2020-2025
2.1 Technological adoption
2.2 Emerging and declining jobs
2.3 Emerging and declining skills
Chapter 3 Public and Private Sector Pathways to Reviving Labour Markets
3.1 From temporary public policy relief to long-term solutions
3.2 From deploying human resources to leveraging human potential
Conclusion
Notes
References
Part 2 Country and Industry Profiles
User’s Guide: How to Read the Country and Industry Profiles
Country Profiles
Industry Profiles
Appendix A: Report Methodology
Contributors
Acknowledgements
Survey Partners
3
5
7
8
8
9
16
19
26
27
29
35
40
40
45
49
50
53
55
56
66
119
150
157
158
160
Cover: Unsplash/Joel Guerrero
Inside: Unsplash/Christina wocintechchat; Unsplash/Faruq Al Aqib; Unsplash/Rob Lambert
© 2020 World Economic Forum. All rightsreserved. No part of this publication maybe reproduced or transmitted in any formor by any means, including photocopyingand recording, or by any informationstorage and retrieval system.

The Future of Jobs October 2020
The Future of Jobs 3
Klaus Schwab
Founder and
Executive Chairman
Saadia Zahidi
Member of the
Managing Board
Preface
After years of growing income inequality, concerns about technology-driven displacement of jobs, and rising societal discord globally, the combined health and economic shocks of 2020 have put economies into freefall, disrupted labour markets and fully revealed the inadequacies of our social contracts. Millions of individuals globally have lost their livelihoods and millions more are at risk from the global recession, structural change to the economy and further automation. Additionally, the pandemic and the subsequent recession have impacted most those communities which were already at a disadvantage.
We find ourselves at a defining moment: the decisions and choices we make today will determine the course of entire generations’ lives and livelihoods. We have the tools at our disposal. The bounty of technological innovation which defines our current era can be leveraged to unleash human potential. We have the means to reskill and upskill individuals in unprecedented numbers, to deploy precision safety nets which protect displaced workers from destitution, and to create bespoke maps which orient displaced workers towards the jobs of tomorrow where they will be able to thrive.
However, the efforts to support those affected by the current crisis lag behind the speed of disruption. It is now urgent to enact a Global Reset towards a socio-economic system that is more fair, sustainable and equitable, one where social mobility is reinvigorated, social cohesion restored, and economic prosperity is compatible with a healthy planet. If this opportunity is missed, we will face lost generations of adults and youth who will be raised into growing inequality, discord and lost potential.
The Future of Jobs Report provides the timely insights needed to orient labour markets and workers towards opportunity today and in the
future of work. Now in its third edition, the report maps the jobs and skills of the future, tracking the pace of change and direction of travel. This year we find that while technology-driven job creation is still expected to outpace job destruction over the next five years, the economic contraction is reducing the rate of growth in the jobs of tomorrow. There is a renewed urgency to take proactive measures to ease the transition of workers into more sustainable job opportunities. There is room for measured optimism in the data, but supporting workers will require global, regional and national public-private collaboration at an unprecedented scale and speed.
The Platform for the New Economy and Society at the World Economic Forum works as a “docking station” for such collaboration on economic growth, revival and transformation; work, wages and job creation; education, skills and learning; and diversity, equity and inclusion. By leveraging this publication and other insights, the Platform supports a range of consortia and action coalitions, including the Reskilling Revolution Initiative to provide better jobs, skills and education to one billion people by 2030. We are deeply grateful to the New Economy and Society Stewardship Board members for their leadership of this agenda, to the over 100 partners of the Platform, and the expert guidance of Global Future Councils, the communities of Chief Economists, Chief Human Resource Officers, Chief Learning Officers and Chief Diversity Officers, and to a range of national ministries of economy, education and labour.
We are also grateful to the many partners whose views created the unique collection of insights in this report. It presents the workforce planning and quantitative projections of Chief Human Resource and Strategy officers through to 2025, while also drawing upon the qualitative expertise of a wide range of World Economic Forum executive and expert communities. In addition,

The Future of Jobs 4
the report features unique data from LinkedIn, Coursera, ADP and FutureFit.AI, which have provided innovative new metrics to shed light on one of the most important challenges of our time.
We would like to express our appreciation to Vesselina Ratcheva, Insights Lead; Guillaume Hingel, Insights Lead; and Sophie Brown, Project Specialist for their dedication to this report. We would also like to thank Ida Jeng Christensen, Eoin Ó Cathasaigh, Genesis Elhussein, Till Leopold and SungAh Lee for their support of this project at the World Economic Forum.
Human ingenuity is at the root of all shared prosperity. As the frontier between the work tasks performed by humans and those performed by machines and algorithms shifts, we have a short window of opportunity to ensure that these transformations lead to a new age of good work, good jobs and improved quality of life for all. In the midst of the pandemic recession, this window is closing fast. Businesses, governments and workers must plan to work together to implement a new vision for the global workforce.

The Future of Jobs October 2020
The Future of Jobs 5
The COVID-19 pandemic-induced lockdowns and related global recession of 2020 have created a highly uncertain outlook for the labour market and accelerated the arrival of the future of work. The Future of Jobs Report 2020 aims to shed light on: 1) the pandemic-related disruptions thus far in 2020, contextualized within a longer history of economic cycles, and 2) the expected outlook for technology adoption jobs and skills in the next five years. Despite the currently high degree of uncertainty, the report uses a unique combination of qualitative and quantitative intelligence to expand the knowledge base about the future of jobs and skills. It aggregates the views of business leaders—chief executives, chief strategy officers and chief human resources officers–on the frontlines of decision-making regarding human capital with the latest data from public and private sources to create a clearer picture of both the current situation and the future outlook for jobs and skills. The report also provides in-depth information for 15 industry sectors and 26 advanced and emerging countries.
The report’s key findings include:
– The pace of technology adoption is expected
to remain unabated and may accelerate in
some areas. The adoption of cloud computing, big data and e-commerce remain high priorities for business leaders, following a trend established in previous years. However, there has also been a significant rise in interest for encryption, non-humanoid robots and artificial intelligence.
– Automation, in tandem with the COVID-19
recession, is creating a ‘double-disruption’
scenario for workers. In addition to the current disruption from the pandemic-induced lockdowns and economic contraction, technological adoption by companies will transform tasks, jobs and skills by 2025. Forty-three percent of businesses surveyed indicate that they are set to reduce their workforce due to technology integration, 41% plan to expand their use of contractors for task-specialized work, and 34% plan to expand their workforce due to technology integration. By 2025, the time spent on current tasks at work by humans and machines will be equal. A significant share of companies also expect to make changes to locations, their value chains, and the size of their workforce due to factors beyond technology in the next five years.
– Although the number of jobs destroyed will
be surpassed by the number of ‘jobs of
tomorrow’ created, in contrast to previous
years, job creation is slowing while job
destruction accelerates. Employers expect that by 2025, increasingly redundant roles will decline from being 15.4% of the workforce to 9% (6.4% decline), and that emerging professions will grow from 7.8% to 13.5% (5.7% growth) of the total employee base of company respondents. Based on these figures, we estimate that by 2025, 85 million jobs may be displaced by a shift in the division of labour between humans and machines, while 97 million new roles may emerge that are more adapted to the new division of labour between humans, machines and algorithms.
– Skills gaps continue to be high as in-
demand skills across jobs change in
the next five years. The top skills and skill groups which employers see as rising in prominence in the lead up to 2025 include groups such as critical thinking and analysis as well as problem-solving, and skills in self-management such as active learning, resilience, stress tolerance and flexibility. On average, companies estimate that around 40% of workers will require reskilling of six months or less and 94% of business leaders report that they expect employees to pick up new skills on the job, a sharp uptake from 65% in 2018.
– The future of work has already arrived for
a large majority of the online white-collar
workforce. Eighty-four percent of employers are set to rapidly digitalize working processes, including a significant expansion of remote work—with the potential to move 44% of their workforce to operate remotely. To address concerns about productivity and well-being, about one-third of all employers expect to also take steps to create a sense of community, connection and belonging among employees through digital tools, and to tackle the well-being challenges posed by the shift to remote work.
– In the absence of proactive efforts,
inequality is likely to be exacerbated by
the dual impact of technology and the
pandemic recession. Jobs held by lower wage workers, women and younger workers were more deeply impacted in the first phase of the economic contraction. Comparing the impact of the Global Financial Crisis of 2008 on individuals with lower education levels to the impact of the COVID-19 crisis, the impact today is far more significant and more likely to deepen existing inequalities.
– Online learning and training is on the rise
but looks different for those in employment
Executive Summary

The Future of Jobs 6
and those who are unemployed. There has been a four-fold increase in the numbers of individuals seeking out opportunities for learning online through their own initiative, a five-fold increase in employer provision of online learning opportunities to their workers and a nine-fold enrolment increase for learners accessing online learning through government programmes. Those in employment are placing larger emphasis on personal development courses, which have seen 88% growth among that population. Those who are unemployed have placed greater emphasis on learning digital skills such as data analysis, computer science and information technology.
– The window of opportunity to reskill and
upskill workers has become shorter in
the newly constrained labour market. This applies to workers who are likely to stay in their roles as well as those who risk losing their roles due to rising recession-related unemployment and can no longer expect to retrain at work. For those workers set to remain in their roles, the share of core skills that will change in the next five years is 40%, and 50% of all employees will need reskilling (up 4%).
– Despite the current economic downturn,
the large majority of employers recognize
the value of human capital investment.
An average of 66% of employers surveyed expect to get a return on investment in upskilling and reskilling within one year. However, this time horizon risks being too long for many employers in the context of the current economic shock, and nearly 17% remain uncertain on having any return on their investment. On average, employers expect to offer reskilling and upskilling to just over 70% of their employees by 2025. However, employee engagement into those courses is
lagging, with only 42% of employees taking up employer-supported reskilling and upskilling opportunities.
– Companies need to invest in better metrics
of human and social capital through
adoption of environmental, social and
governance (ESG) metrics and matched
with renewed measures of human capital
accounting. A significant number of business leaders understand that reskilling employees, particularly in industry coalitions and in public-private collaborations, is both cost-effective and has significant mid- to long-term dividends—not only for their enterprise but also for the benefit of society more broadly. Companies hope to internally redeploy nearly 50% of workers displaced by technological automation and augmentation, as opposed to making wider use of layoffs and automation-based labour savings as a core workforce strategy.
– The public sector needs to provide stronger
support for reskilling and upskilling for
at-risk or displaced workers. Currently, only 21% of businesses report being able to make use of public funds to support their employees through reskilling and upskilling. The public sector will need to create incentives for investments in the markets and jobs of tomorrow; provide stronger safety nets for displaced workers in the midst of job transitions; and to decisively tackle long-delayed improvements to education and training systems. Additionally, it will be important for governments to consider the longer-term labour market implications of maintaining, withdrawing or partly continuing the strong COVID-19 crisis support they are providing to support wages and maintain jobs in most advanced economies.

The Future of Jobs October 2020
The Future of Jobs 7
Part 1 Tracking the Future of Jobs

The Future of Jobs October 2020
The Future of Jobs 8
Introduction
The Labour Market Outlook in the Pandemic Economy
1
Developing and enhancing human skills and capabilities through education, learning and meaningful work are key drivers of economic success, of individual well-being and societal cohesion. The global shift to a future of work is defined by an ever-expanding cohort of new technologies, by new sectors and markets, by global economic systems that are more interconnected than in any other point in history, and by information that travels fast and spreads wide. Yet the past decade of technological advancement has also brought about the looming possibility of mass job displacement, untenable skills shortages and a competing claim to the unique nature of human intelligence now challenged by artificial intelligence. The coming decade will require purposeful leadership to arrive at a future of work that fulfils human potential and creates broadly shared prosperity.
In 2020, economic globalization is stalling, social cohesion is being eroded by significant unrest and political polarization, and an unfolding recession is threatening the livelihoods of those at the lower end of the income spectrum. As a new global recession brought on by the COVID-19 health pandemic impacts economies and labour markets, millions of workers have experienced changes which have profoundly transformed their lives within and beyond work, their well-being and their productivity. One of the defining features of these changes is their asymmetric nature—impacting already disadvantaged populations with greater ferocity and velocity.
Over the course of half a decade the World Economic Forum has tracked the labour market impact of the Fourth Industrial Revolution, identifying the potential scale of worker displacement alongside strategies for empowering job transitions from declining to emerging roles. The fundamental rate of progress towards greater technological incursion into the world of work has only accelerated over the two years since the 2018 edition of the report. Under the influence of the current economic recession the underlying trends toward the technological augmentation of work have accelerated. Building upon the Future of Jobs methodology developed
in 2016 and 2018, this 2020 third edition of the Future of Jobs Report provides a global overview of the ongoing technological augmentation of work, emerging and disrupted jobs and skills, projected expansion of mass reskilling and upskilling across industries as well as new strategies for effective workforce transitions at scale.
Over the past decade, a set of ground-breaking, emerging technologies have signalled the start of the Fourth Industrial Revolution. To capture the opportunities created by these technologies, many companies across the private sector have embarked on a reorientation of their strategic direction. By 2025, the capabilities of machines and algorithms will be more broadly employed than in previous years, and the work hours performed by machines will match the time spent working by human beings. The augmentation of work will disrupt the employment prospects of workers across a broad range of industries and geographies. New data from the Future of Jobs Survey suggests that on average 15% of a company’s workforce is at risk of disruption in the horizon up to 2025, and on average 6% of workers are expected to be fully displaced.
This report projects that in the mid-term, job destruction will most likely be offset by job growth in the 'jobs of tomorrow'—the surging demand for workers who can fill green economy jobs, roles at the forefront of the data and AI economy, as well as new roles in engineering, cloud computing and product development. This set of emerging professions also reflects the continuing importance of human interaction in the new economy, with increasing demand for care economy jobs; roles in marketing, sales and content production; as well as roles at the forefront of people and culture.1 Employers answering the Future of Jobs Survey are motivated to support workers who are displaced from their current roles, and plan to transition as many as 46% of those workers from their current jobs into emerging opportunities. In addition, companies are looking to provide reskilling and upskilling opportunities to the majority of their staff (73%) cognizant of the fact that, by 2025, 44% of the skills that employees will need to perform their roles effectively will change.
1.1

The Future of Jobs 9
The sections that follow in this first chapter of the Future of Jobs Report situate the 2020 COVID-19 economic recession in the context of past recessions, and in the context of the Fourth Industrial Revolution. They review the impact of this health shock on the labour market, paying particular attention to its asymmetric nature. Chapter 2 outlines the latest evidence from the Future of Jobs Survey, taking stock of the path of technological adoption, the scale and depth of the job transitions and the learning provision that is in place and planned in the horizon up to 2024. Finally, Chapter 3 reviews the public and private sector policies and practices that can support a proactive adaptation to these unfolding trends. In particular, the chapter outlines the mechanisms for job transitions, the imperatives of creating a learning organization and
structures which can support such adaptation both across government and across business.
This edition of the Future of Jobs Report takes stock of the impact of two twin events—the onset of the Fourth Industrial Revolution and of the COVID-19 recession in the context of broader societal and economic inequities. It provides new insights into effective practices and policies for supporting worker transitions towards a more equitable and prosperous future of work. In economies riddled with inequalities and sluggish adaptation to the demands of the new world of work, there is an ever-larger need for a ‘Great Reset’, which can herald opportunities for economic prosperity and societal progress through good jobs.
1.2 Short-term shocks and long-term trends
Over centuries, technological, social and political transformations have shaped economies and the capacity of individuals to make a living. The first and second Industrial Revolutions displaced trades that had thrived on older technologies and gave rise to new machines, new ways of work and new demand for skill sets that could harness the power of steam, coal and factory production. The transformation of production has consequently given rise to new professions and new ways of working that eventually paved the path to greater prosperity despite initial job displacement among individuals. Although in 2018 we proposed that the labour market impact of the Fourth Industrial Revolution can be managed while maintaining stable levels of employment, the current 2020 global recession has created a ‘new normal’ in which short-term and long-term disruptions are intertwined.
A significant volume of research has been published on the future of work since the World Economic Forum published it first edition. To date, the conclusions drawn from that body of literature appear to offer both hope and caution. The twin forces of technology and globalisation have brought profound transformations to labour markets and in the near term.2 Few analysts propose that technological disruption will lead to shrinking opportunities in the aggregate,3 and many of the insights gathered point to the emergence of new job opportunities. Across countries and supply chains, research has evidenced rising demand for employment in nonroutine analytics jobs accompanied by significant automation of routine manual jobs.4 Empirically, these changes can be observed in data tracking employment trends in the United States between 2007–2018. The evidence indicates that nearly 2.6 million jobs were displaced over a span of a decade.5 Figure 1 presents the types of roles that are being displaced—namely Computer Operators, Administrative Assistants, Filing Clerks, Data Entry Keyers, Payroll Clerks and other such roles which depend on technologies and work processes which are fast becoming obsolete.
In late 2019, the gradual onset of the future of work—due in large part to automation, technology and globalization—appeared to pose the greatest risk to labour market stability. The first half of 2020 has seen an additional, significant and unexpected disruption to labour markets, with immediate knock-on effects on the livelihoods of individuals and the household incomes of families. The COVID-19 pandemic appears to be deepening existing inequalities across labour markets, to have reversed the gain in employment made since the Global Financial Crisis in 2007–2008, and to have accelerated the arrival of the future of work. The changes heralded by the COVID-19 pandemic have compounded the long-term changes already triggered by the Fourth Industrial Revolution, which has, consequently, increased in velocity and depth.
In reaction to the risk to life caused by the spread of the COVID-19 virus, governments have legislated full or partial closures of business operations, causing a sharp shock to economies, societies and labour markets. Many businesses have closed their physical office locations and have faced limitations in doing business face-to-face. Figure 2 shows the trajectory of those closures. Beginning in mid-March and by mid-April, nearly 55% of economies (about 100 countries) had enacted workplace closures which affected all but essential businesses.6 During May and June, economies resumed some in-person business operations—yet limitations to the physical operation of business continue, geographic mobility between countries persist and the consumption patterns of individuals have been dramatically altered. By late June 2020, about 5% of countries globally still mandated a full closure of in-person business operations, and only about 23% of countries were fully back to open.7
In addition, irrespective of legislated measures, individuals have shifted to working remotely and enacting physical distancing.8

The Future of Jobs 10
Collectively, the life-preserving measures to stop the spread of the COVID-19 virus have led to a sharp contraction of economic activity, a marked decline in capital expenditure among several industries facing decline in demand for their products and services, and put new pressures on enterprises and sectors. Not all companies have been equally affected. Some businesses have the resources to weather the uncertainty, but others do not. Among those faltering are companies that typically don’t hold large cash reserves such as SMEs (small-to-medium enterprises) or businesses in sectors such as Restaurants and Hospitality. Some types of business operations can be resumed remotely, but others, such as those in the Tourism or Retail sectors that depend on in-person contact or travel, have sustained greater damage (Figure 9 on page 17 demonstrates some of those effects).
The current health pandemic has led to an immediate and sudden spike in unemployment across several key economies—displacing workers from their current roles. Since the end of the Global Financial Crisis in 2007–2008, economies across the globe had witnessed a steady decrease of unemployment. Figure 3 presents the historical time series of unemployment across a selection of countries and regions. Annotated across the figure are the
four global recessions which have throughout history impacted employment levels in significant ways. The figure shows that during periods of relative labour market stability unemployment stands at near or around 5% while during periods of major disruption unemployment peaks at or exceeds 10%. During the financial crisis of 2010, unemployment peaked at 8.5% only to drop to an average of 5% across OECD economies in late 2019.9 According to the International Labour Organization (ILO), during the first half of 2020 real unemployment figures jumped to an average of 6.6% in quarter 2 of 2020. The OECD predicts that those figures could peak at 12.6% by the end of 2020 and still could stand at 8.9% by end 2021.10 This scenarios assumes that the economies analysed experience two waves of infection from the COVID-19 virus accompanied by an associated slow-down of economic activity. It remains unclear whether current unemployment figures have peaked or whether job losses will deepen over time. New analysis conducted by the IMF has estimated that 97.3 million individuals, or roughly 15% of the workforce in the 35 countries included in the analysis, are classified as being at high risk of being furloughed or made redundant in the current context.11
-80 -70 -60 -50 -40 -30 -20 -10 0
Drywall and Ceiling Tile Installers
Cutting, Punching, and Press Machine Setters, Operators, and Tenders, Metal and Plastic
Payroll and Timekeeping Clerks
Helpers–Installation, Maintenance, and Repair Workers
Sewing Machine Operators
Information and Record Clerks, All Other
Legal Secretaries
Order Clerks
Mail Clerks and Mail Machine Operators, Except Postal Service
Bill and Account Collectors
Data Entry Keyers
Brickmasons and Blockmasons
Postal Service Mail Sorters, Processors, and Processing Machine Operators
File Clerks
Telemarketers
Machine Feeders and Offbearers
Switchboard Operators, Including Answering Service
Word Processors and Typists
Executive Secretaries and Executive Administrative Assistants
Computer Operators
Employment change 2007-2018 (%)
Employment trends for jobs in the United States at high risk of automation, 2007–2018F I G U R E 1
Source
Ding, et al, 2020.

The Future of Jobs 11
27 Jan 2020
01 Feb 2020
01 Mar 2020
01 Apr 2020
01 May 2020
01 Jun 2020
01 Jul 2020
01 Aug 2020
01 Sep 2020
28 Sep 2020
Share of countries (%)
Partial closuresFully open All but essential work closed
0 20 40 60 80 100
Source
Hale, et al, 2020.
Countries enacting workplace closures, February–September 2020F I G U R E 2

The Future of Jobs 12
Source
OECD Economic Outlook: Statistics and Projections, and Kose,
M. Ayhan, et al. 2020.
Notes
Forecasts for Q3 2020 produced by the OECD assuming two waves of
COVID-19, namely a "double hit" scenario. EA17 = Belgium, Germany,
Estonia, Ireland, Greece, Spain, France, Italy, Cyprus, Luxembourg, Malta,
Netherlands, Austria, Portugal, Slovenia, Slovakia, and Finland.
Countries have taken different approaches to tackling the pandemic, in the established provision of social protection to displaced workers and in newly enacted temporary government schemes targeted at job retention. This has created varied trajectories of labour market disruption and recovery. For instance, several economies, such as Germany and Italy, have established large-scale temporary job retention schemes including wage support measures (commonly called furlough schemes). According to the latest
estimates such schemes have in recent months subsidized the wages of close to 60 million workers.12
While initially more temporary in nature, the persistence of limits to economic activity caused by COVID-19 has led to an extension of several job retention schemes up to the end of 2021 in an effort to prevent sudden spikes in unemployment.13 While such measures have meant that unemployment figures in those economies have stayed relatively stable, it is yet to be seen if these trends hold after they are lifted.
Unemployment rate, selected countries and regions, 1960–2020F I G U R E 3
0
5
10
15
20
25
30
35
South Africa USA OECD countries Mexico Korea, Rep. Japan Italy
United Kingdom France EA17 Germany Canada Australia
1960 1970 1980 1990 2000 2010 2020
1975 1982 1991 2009
Uneymployment rate (%)
Comparing figures for quarter 2 of 2020 to the same quarter in 2019, unemployment in Australia increased by 1.5 percentage points; in Brazil that same figure was 1.6; in Canada, 6; in Chile, 5.5; Columbia, 9; and United States, 8.5. The relevant statistics for countries such as the United Kingdom, Germany, Japan, France and Italy show greater resilience. The Country Profiles in Part 2 of this report present key labour market indicators showcasing the latest annual, monthly and quarterly figures for the economies covered in this report, including the figures listed above. It is evident that the United States and Canada experienced a significant disruption on an unprecedented scale. Employment figures for the United States illustrated in Figure 4 show that the
unemployment rate rose from 3.5% in February 2020 to peak at 14.7% in April 2020. The unemployment rate for the United States has now dropped to stand closer to 10%. In contrast, during the Global Financial Crisis in 2009 the unemployment rate in the United States rose from 4.7% in December 2007 to nearly 10% by June 2009.14 In two months the COVID-19 pandemic has destroyed more jobs than the Great Recession did in two years. As the United States has lifted restrictions on the physical movement of people, some workers have been recalled into employment while others have seen temporary redundancies become permanent job displacement (some of this data can be observed in Figure 11 on page 19).

The Future of Jobs 13
Source
United States Bureau of Labor Statistics.
Notes
Unemployment Rate - Job Losers (U-2) [U2RATE], retrieved from FRED,
Federal Reserve Bank of St. Louis; https://fred.stlouisfed.org/series/U2RATE,
15 September 2020.
It appears increasingly likely that changes to business practice brought about by this pandemic are likely to further entrench wholly new ways of working, and that the second half of 2020 will not see a return ‘back to normal’ but will instead see a return to ‘the new normal’.
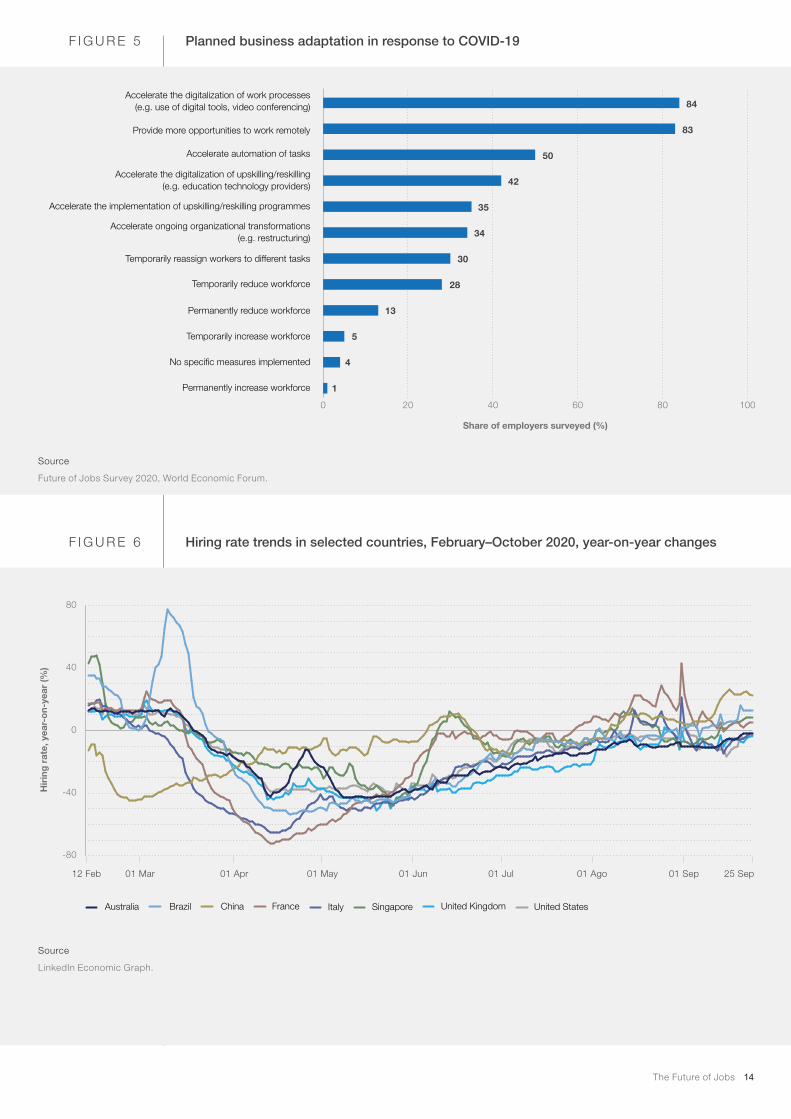
Early evidence from the World Economic Forum’s Future of Jobs Survey presented in Figure 5 suggests that, in addition to the labour market displacement caused by this health shock, employers are set to accelerate their job automation and augmentation agenda, raising the possibility of a jobless recovery. Among the business leaders surveyed, just over 80% report that they are accelerating the automation of their work processes and expanding their use of remote work. A significant 50% also indicate that they are set to accelerate the automation of jobs in their companies. In addition, more than one-quarter of employers expect to temporarily reduce their workforce, and one in five expect to permanently do so. The International Labour Organization (ILO) projects that by the second quarter of 2020, the equivalent of 195 million workers will have been displaced and as jobs are transformed at a greater speed.15
While many workers moved into unemployment during the period of mid-March to the end of July hiring rates also remained low, reflecting business
reluctance to invest in new personnel. This means that workers displaced from the labour market have fewer opportunities to return to work as businesses reduce their workforce. This trend can be observed through data from the professionals on the LinkedIn platform, which allows the LinkedIn Economic Graph team to track changes in hiring rates for seven key economies—Australia, China, France, Italy, Singapore, the United Kingdom and the United States. Those hiring rates are featured in Figure 6. They show that in China, for instance, hiring contracted to a low of -47% year-on-year rate at the end of February. In France and Italy, the contraction was more pronounced, reaching -70% and -64.5%, respectively, in mid-April. Those low figures were approached by the United Kingdom and Australia, where contractions reached a relatively more robust -40%. Since then, hiring rates have gradually rebounded, with most of the seven key economies tracked by these metrics trending towards a 0% year-on-year change. By 1 July, China, France and the United States had seen the most recovery in comparative hiring rates, at -6% or -7%. By the end of September the countries with the strongest recovery in hiring were China (22%), Brazil (13%), Singapore (8%) and France (5%). In those economies it appears that hiring is now compensating for the months in which new personnel were not engaged, indicating some stabilization of the labour market.
Unemployment rate in the United States, seasonally adjusted, 1967–2020F I G U R E 4
1967 1970 1980 1990 2000 2010 2020
Uneymployment rate (%)
0
3
6
9
12
15
Date
The Future of Jobs 14
Source
Future of Jobs Survey 2020, World Economic Forum.
Source
LinkedIn Economic Graph.
Planned business adaptation in response to COVID-19
Hiring rate trends in selected countries, February–October 2020, year-on-year changes
F I G U R E 5
F I G U R E 6
Accelerate the digitalization of work processes
(e.g. use of digital tools, video conferencing)
Provide more opportunities to work remotely
Accelerate automation of tasks
Accelerate the digitalization of upskilling/reskilling
(e.g. education technology providers)
Accelerate the implementation of upskilling/reskilling programmes
Accelerate ongoing organizational transformations
(e.g. restructuring)
Temporarily reassign workers to different tasks
Temporarily reduce workforce
Permanently reduce workforce
Temporarily increase workforce
No specific measures implemented
Permanently increase workforce
0 20 40 60 80 100
Share of employers surveyed (%)
84
83
50
42
35
34
30
28
13
5
4
1
United StatesSingaporeItalyChinaBrazilAustralia United KingdomFrance
-80
-40
0
40
80
12 Feb 01 Mar 01 Apr 01 May 01 Jun 01 Jul 01 Ago 25 Sep01 Sep
Hiring rate, year-on-year (%
)

The Future of Jobs 15
Hiring rate trends in selected countries, by industry, April-September 2020, year-on-year changesF I G U R E 7
Industry Country/EconomyApril
(month)May
(month)June
(month)July
(month)August (month)
25 September (14-day rolling
average)
All -41% -39% -13% -11% 4% -4%
Australia -34% -41% -23% -19% -3% -11%
Brazil -51% -46% -21% -8% -2% 3%
China -11% -11% 2% -8% 10% 11%
France -67% -40% 3% -3% 24% 3%
Italy -57% -48% -22% -13% 2% -11%
Singapore -25% -39% 3% -9% 4% -5%
United Kingdom -42% -45% -27% -19% -4% -11%
United States -40% -39% -19% -11% 0% -11%
Consumer Goods -61% -53% -27% -22% -5% -14%
Australia -44% -50% -24% -21% -11% -12%
France -75% -50% -13% -12% 8% -3%
Italy -76% -62% -35% -27% -8% -31%
United Kingdom -56% -55% -40% -31% -11% -8%
United States -53% -48% -21% -16% -2% -14%
Finance -42% -38% -21% -13% 3% -7%
Australia -19% -37% -27% -28% -1% -7%
France -72% -41% 1% -8% 12% 6%
Italy -48% -41% -31% -3% 7% -9%
United Kingdom -39% -37% -34% -23% -13% -18%
United States -33% -34% -14% -3% 9% -6%
Health Care -23% -22% 6% 1% 23% 8%
Australia -12% -26% -1% 6% 19% 14%
France -54% -19% 37% 10% 40% 17%
Italy -29% -27% 2% 0% 26% 1%
United Kingdom 10% -4% 1% -5% 18% 7%
United States -28% -33% -11% -6% 14% 0%
Manufacturing -53% -45% -20% -18% 3% -6%
Australia -34% -31% -18% -12% 3% 5%
France -71% -39% -1% -14% 20% -8%
Italy -61% -54% -34% -18% -4% -16%
United Kingdom -51% -55% -38% -32% -4% -4%
United States -47% -47% -12% -13% 3% -8%
Recreation & Travel -79% -74% -43% -32% -20% -28%
Australia -77% -77% -51% -44% -43% -50%
France -82% -70% -15% -8% 11% -5%
Italy -87% -78% -40% -28% -15% n/a
United Kingdom -73% -77% -63% -50% -23% -26%
United States -75% -69% -44% -32% -28% -31%
Retail -53% -47% -15% -5% 13% 4%
Australia -38% -44% -18% -6% 9% 5%
France -68% -38% 21% 9% 41% 20%
Italy -73% -58% -27% 7% 10% -1%
United Kingdom -42% -48% -28% -22% 1% 2%
United States -46% -48% -24% -13% 6% -8%
Software & IT Services -38% -36% -15% -22% -3% -14%
Australia -27% -37% -24% -23% -4% -12%
France -61% -35% -7% -24% 0% -20%
Italy -43% -44% -24% -16% -2% -10%
United Kingdom -31% -39% -6% -27% -6% -16%
United States -28% -26% -14% -22% -2% -12%
Source
LinkedIn Economic Graph.
Note
Values in brown indicate where the hiring rate
is lower than in 2019, while values in green
indicate where the rate is higher than 2019.
The darker the colour, the lower/higher the rate.

The Future of Jobs 16
This tentative rebound is not equally distributed across industries. Figure 7 shows the year-on-year change in hiring rates throughout April, May, June, July, August, and most of September for seven key industries and the seven economies tracked by LinkedIn. Among the notable findings are those indicating a persistent hiring slump in Recreation and Travel, Consumer Goods and Manufacturing. Also striking is that the Software and IT sector, which is not shedding jobs at the same rate as other industries, is also not hiring at the same rate as this time last year. The same observation also holds for the Finance Industry. It is perhaps not surprising that the Health and Healthcare industry has maintained the closest to comparable hiring rates to this time last year.
In sum, unemployment and hiring rates suggest a significant number of individuals were displaced across labour markets over the month of April 2020. While those figures have stopped trending in a negative direction in the period up to July 2020, this recovery remains tentative, with unequal geographic and industry patterns. Longer persistence of these trends is likely to entrench labour market scarring, lead to an overall reduction in employment and entrench worker displacement.
As a result of the twin forces of the Fourth Industrial revolution and the COVID-19 recession, day-to-day digitalization has leapt forward, with a large-scale shift to remote working and e-commerce, driving a surge in work-from-home arrangements and a new marketplace for remote work. However, it has also brought about significant well-being challenges as workers have struggled to adapt to new ways of work over a short period of time.
In the COVID-19 context, workers have been segmented into three categories: 1) ‘essential workers’ such as delivery personnel, carers and health workers, food shop workers, agricultural workers and manufacturers of medical goods; 2) ‘remote workers’ who can work remotely and are likely to keep their jobs; and 3) ‘displaced workers’ who have been displaced from their jobs in the short term and potentially in the future, and who fall disproportionately into the sectors most negatively affected by the pandemic—Hospitality, Retail, Service work as well as Travel and Tourism.
All three types of workers are facing a wholesale shift in working practices, which now require new types of resilience and entail a reskilling or upskilling agenda. For essential workers, physical safety remains a paramount concern. Displaced workers are facing significant job uncertainty, and a short-term or permanent need to shift roles. Remote workers are faced with potential well-being and mental health challenges due to extensive changes to working practices as well as new areas of exclusion such as access to digital connectivity, living circumstances and the additional care responsibilities faced by parents or those looking after elderly relatives.16
New evidence from Chief Human Resource Officers completing the Forum’s Future of Jobs 2020 Survey indicates that, on average, 44% of workers are able to work remotely during the COVID-19 crisis while 24% of workers are unable to perform their current role. This estimate indicates an aspiration to expand the availability of remote work. The current theoretical share of jobs that can be performed remotely in any
given economy has been approximated at 38% of jobs in high-income countries, 25% in upper-middle income economies, 17% in lower-middle income economies and 13% in low-income economies.17 When adjusted to account for disparities in internet access by economy, the same figures decrease to 33.6% of jobs in high income economies, 17.8% of jobs in upper-middle income economies, 10% of jobs in lower-middle income economies, and just 4% of jobs in low income economies.18 Figure 8 plots the estimated share of workers unable to work remotely against the GDP per capita for each country. According to such estimates around 60% of workers in high-income countries such as the United States and Switzerland are unable to fully work from home. This figure rises to more than 80-90% for economies such as Egypt and Bangladesh.
Sectoral differences underpin the estimates shared above. A larger share of roles in the Finance and Insurance and Information and Professional Services sectors can be performed remotely, while Accommodation and Food Services, Agriculture, Retail, Construction, Transportation and Warehousing offer fewer opportunities for remote work.19 Figure 9 presents one estimate of the associated risk to employment across different sub-industries: 47% of workers in the Accommodation and Food Services sector, 15% in Wholesale and Retail Trade and 15% of the workforce in Transportation are at risk of unemployment.
Despite the limitations listed above, demand from employers for remote-based work is increasing rapidly across economies. Insights from the Glassdoor online platform show that access to working from home has nearly doubled since 2011, from 28% to 54% of workers mentioning that they had the opportunity to work from home.20 The industries with the largest opportunity to work from home are the Information Technology and Insurance industries, with 74% of workers in those industries reporting having access to remote working. But there are also industries such as Finance, Legal work and Business Services, which could, in theory, perform more remote work.
1.3 The remote and hybrid workforce

The Future of Jobs 17
Estimated share of workers unable to work from home, by per capita GDP
Estimated share of workers at risk of unemployment, by sub-industry
F I G U R E 8
F I G U R E 9
Source
Dingel & Neuman, World Bank Home Based Work (HBW) index,
World Bank's World Development Indicators database.
Source
Brussevich, et al, 2020.
0 10,000 20,000 30,000 40,000 50,000 60,000 70,000 80,000
GDP per capita (USD)
Workers unable to w
ork from home (%)
0
20
40
60
80
100
Argentina
Bangladesh
Brazil
Egypt
Germany
Mexico
Russian FederationSwitzerland
United States
Not at riskAt risk
Share of workers (%)
47%
15%
15%
15%
15%
14%
14%
9%
8%
7%
4%
3%
2%
Accommodation and Food Services
Wholesale and Retail Trade
Transportation
Education
Construction
Manufacturing
Health Care and Social Assistance
Professional Services, Administrative and Support
Government and Public Sector
Financial Services and Insurance
Mining
Agriculture
Utilities
0 20 40 60 80 100

The Future of Jobs 18
Data shared by the LinkedIn Economic Graph team demonstrates that, in addition to established patterns of working from home and the theoretical potential for at-home work, there is actually an emerging marketplace for remote work–as evidenced by both strong demand from jobseekers21 as well as an increasing demand from employers for jobs that are based remotely.22
The index of job searches and job postings displayed in Figure 10 show that the amount of workers looking for remote job opportunities has nearly doubled, while the number of job postings (controlling for shifts in hiring rates) has gradually increased—with peaks of a two-fold increase in mid-April and a three-fold increase in mid-June.23
In addition, workers in those industries surveyed for the LinkedIn Workforce Confidence Index believe there is potential to expand the use of remote work beyond what it has been historically to match the theoretical potential of working from home.24
The pandemic has shown that a new hybrid way of working is possible at greater scale than imaged in previous years, yet business leaders remain uncertain about the productivity outcomes of the shift to remote or hybrid work. Overall, 78% of business leaders expect some negative impact of the current way of working on worker productivity, with 22% expecting a strong negative impact and only 15% believing that it will have no impact or a positive impact on productivity. Such scepticism is likely to
reflect a number of factors: 1) the switch to remote work is occurring during a period of additional stress and concern caused by the risk to life and health of the COVID-19 virus; 2) those caring after young children are faced with additional pressures—needing to take on more unpaid care work due to the intermittence of school and nursery arrangement; 3) while companies with established remote work practices are accustomed to a range of approaches to maintaining a sense of community, of active collaboration and ensuring a flow of communication, newly remote companies are still establishing these ways of communicating and coordinating in the new, post-pandemic world of work.
The Future of Jobs Survey indicates that company adaptation to the newly remote and hybrid workplace is already underway. Ensuring employee well-being is among the key measures undertaken by business leaders looking to effectively shift to remote work. In particular, 34% of leaders report that they are taking steps to create a sense of community among employees online and looking to tackle the well-being challenges posed by the shift to remote work.
The new marketplace for remote workF I G U R E 1 0
Source
LinkedIn Economic Graph.
A. Changes to job-seeking behaviour, February-June 2020 B. Changes to job-posting behaviour, February-June 2020
Index of job postings, % (relative to 11 Feb)
05 Apr08 Mar 03 May 07 Jun 28 Jun
0
50
100
150
200
250
300
11 Feb
Index of job searches, % (relative to 11 Feb)
07 Apr10 Mar 05 May 02 Jun 30 Jun
0
50
100
150
200
250
300
11 Feb

The Future of Jobs 19
The individuals and communities most affected by the unprecedented changes brought about by COVID-19 are likely to be those which are already most disadvantaged—living in neighbourhoods with poor infrastructure, who have poor employment prospects and whose income does not equip them with a comfortable living standard, healthcare coverage or savings.25 Furthermore, across several countries, the pandemic is set to broaden. An estimated 88 to 115 million people could fall back into extreme poverty in 2020 as a result of this recession.26 The following wide array of characteristics typically pose a risk of social and economic exclusion among these populations: age and generation; gender and gender expression; sexual orientation; mental and physical abilities; level of health; race, ethnicity and religion; in-country geographic location, such as rural and urban. These characteristics are typically reflected in outcomes such as levels of education, employment type, income level and socio-economic status.27
In some countries those affected have been disproportionately women, for whom the ILO reports higher unemployment rates. This is the case in the United States, Germany and Australia. In the United States between December and April 2020, women’s unemployment rose by 11% while the same figure for men was 9%. In Germany those figures were 1.6% and 0.8%, respectively. New sources of data can add more granularity to these trends. ADP Research Institute (ADPRI) has been able to track the impact of COVID-19 on the United States labour market in near real time.28 The data shows that, within the observable shifts of workers’ employment over the period of February to May, 25% of workers left or were asked to leave their current role. Of those 25%, 82% of workers tracked by APDRI dropped
out of employment and become displaced workers,29
14% of workers were initially displaced and then recalled by their companies, and just 5% made successful transitions elsewhere in the labour market (Figure 11). The data shows variations by gender, age and wage level. As revealed in Figure 12, women make up a smaller share of both those who were retained by companies and of those who are recalled. Displaced workers are in fact on average more female, younger and have a lower wage.
The metrics shared by ADPRI also reveal the effect of this disruption by industry and wage level. Figure 13 A details the industries which are most affected by the current disruption; in particular, workers in Arts, Entertainment, and Recreation, and Accommodation and Food Services. Significant numbers of workers have also been displaced from the Retail sector as well as from the Real Estate, Rental and Leasing sector. In addition to this measure of attrition, Figure 13 B presents an overview of the workers who transitioned in and out of jobs during the same period; in effect, the re-allocation of workers by industry sector. The data shows that, on average, workers who did transition moved towards sectors which provide essential services such as Retail and Health, as well as sectors which have been less disrupted, such as Financial Services and Construction. Across these transitions, workers were also able to increase their wages. By contrast, struggling sectors such as Arts, Entertainment and Recreation as well as Accommodation and Food Services gained fewer workers than they lost in the February to May period—and workers who transitioned to those sectors appear to have taken a pay cut, suggesting necessity rather than desirability dictated the change.
1.4 Impact on equality
Outcomes for workers who lost their jobs in the United States, February–May 2020, by genderF I G U R E 1 1
Source
ADP Research Institute, produced for the World Economic
Forum's New Metrics CoLab.
Transitioned
5%
Recalled
workers
14%
Displaced
workers
82%
Transitioned
5%
Recalled
workers
12%
Displaced
workers
83%
Transitioned
5%
Recalled
workers
15%
Displaced
workers
80%
A. Overall B. Women C. Men

The Future of Jobs 20
Retained, recalled, transitioned and displaced workers in the United States, by gender and by category of affected worker
F I G U R E 1 2
Source
ADP Research Institute, produced for the World Economic
Forum's New Metrics CoLab.
Female Male
Share of workers (%)
Retained workers
Female - age: 42, wage ($): 26 Male - age: 43, wage ($): 3245% 55%
Recalled workers
Female - age: 40, wage ($): 32 Male - age: 44, wage ($): 5244% 56%
Workers transitioned to new company
Female - age: 36, wage ($): 20 Male - age: 37, wage ($): 2450% 50%
Displaced workers
Female - age: 38, wage ($): 18 Male - age: 39, wage ($): 2251% 49%
Figures 13 C and 13 D present the wage and age dynamics of workers in the United States who were retained, recalled, displaced or transitioned. The markers in brown denote displaced workers; in gold, those who transitioned to new opportunities; in light blue, those who were recalled; and in dark blue, those who were retained. Those recalled into the labour market have the highest average wage of the four cohorts, and those who are displaced have the lowest average wage. In Retail, those who were displaced earn on average a low $17.80 an hour while those recalled are earning $27.00 an hour. In Information and Media, those displaced earn $28.70 an hour while those recalled earn $61.20 an hour.
In addition, retained and recalled workers are, on average older, aged 40 and above, while displaced workers are more typically in their mid-to-late thirties or have just turned 40. For example, in Education Services, those displaced are on average aged 35, while those retained at nearing 43. In Retail and in Accommodation and Food Services these average ages are distorted by the relative youth of both sectors. In Retail, the average age for a displaced worker is 34, while those retained are nearing 40. Across the board, younger workers (those in their 30s) are more likely to have transitioned to new roles during these uncertain times.
Across established labour market indicators, unemployment figures for those with basic education are typically higher than for those who have completed a tertiary education degree. Current ILO figures list unemployment levels among those with an advanced degree as 6.5% and among those with
basic education as 7.5%. The latest available figures by economy are listed in the Country Profiles in Part 2 of the report. It must be noted that such figures are still too rarely collected and that more timely unemployment figures remain unreliable. This trend can be further confirmed by focusing on country-level data with strong availability. Figure 14 presents unemployment levels among workers in the United States by education level over time. It shows that the unemployment rate among those with less than secondary education peaked at 21.2% in April, and stills stands at 12.6% as of the end of August. On the other hand, unemployment levels among workers who hold at least a tertiary degree spiked at 8.4% in April and stands at 5.3% as of the end of August. Comparing the impact of the Global Financial Crisis of 2008 on individuals with lower education levels to the impact of the COVID-19 crisis, it is clear that the impact today is far more significant and more likely to deepen existing inequalities.

The Future of Jobs 21
A. Affected workers by sub-industry
B. Worker transitions into sub-industries, by relative volume of transitions and wage change accepted
Retained, transitioned, recalled and displaced workers in the United States, by industry, age and hourly wage
F I G U R E 1 3
0 20 40 60 80 100
Share of workers (%)
Arts, Entertainment and Recreation
Accomodation and Food Services
Retail
Other Services
Mining, Quarrying and Oil and Gas Extraction
Real Estate, Rental and Leasing
Office and Facilities Support Services
Management of Companies and Enterprises
Transportation and Warehousing
Construction
Education Services
Health and Healthcare
Wholesale Trade
Manufacturing
Information and Media
Professional, Scientific and Technical Services
Government and Public Sector
Financial Services and Insurance
Recalled Transitioned DisplacedRetained
-60 -40 -20 0 20 40 60
Change between those transitioning in and out of industries (%)
Financial Services and Insurance (wage change: 19%)
Retail (wage change: 3%)
Government and Public Sector (wage change: 14%)
Health and Healthcare (wage change: 6%)
Construction (wage change: 16%)
Information and Media (wage change:13%)
Manufacturing (wage change: 10%)
Transportation and Warehousing (wage change: 8%)
Professional, Scientific and Technical Services (wage change: 14%)
Wholesale Trade (wage change: 6%)
Office and Facilities Support Services (wage change: 14%)
Education Services (wage change: 1%)
Real Estate, Rental and Leasing (wage change: 7%)
Other Services (wage change: 4%)
Management of Companies and Enterprises (wage change: 9%)
Accomodation and Food Services (wage change -6%)
Arts, Entertainment and Recreation (wage change: -6%)
41%
26%
26%
15%
13%
3%
0%
-4%
-5%
-5%
-7%
-7%
-11%
-16%
-28%
-39%
-31%
1 / 2
Note
The wage change value shows the difference of starting and
ending wage as a share of the starting wage. It is calculated
from data showing transitions from one industry to another as
the unweighted median wage change of transitions from all
other industries into the destination industry.

The Future of Jobs 22
Retained, transitioned, recalled and displaced workers in the United States, by industry, age and hourly wage
F IGURE 13
Source
ADP Research Institute, produced for the World Economic
Forum's New Metrics CoLab.
C. Affected workers by sub-industry and age
D. Affected workers by industry and wage
30 32 34 36 4038 42 44 4846 50
Retained Recalled Transitioned Displaced
Accomodation and Food Services
Arts, Entertainment and Recreation
Construction
Education Services
Financial Services and Insurance
Government and Public Sector
Health and Healthcare
Information and Media
Management of Companies and Enterprises
Manufacturing
Mining, Quarrying and Oil and Gas Extraction
Office and Facilities Support Services
Other Services
Professional, Scientific and Technical Services
Real Estate, Rental and Leasing
Retail
Transportation and Warehousing
Wholesale Trade
Average age of workers
10 20 30 40 6050 70 80 90 100
Accomodation and Food Services
Arts, Entertainment and Recreation
Construction
Education Services
Financial Services and Insurance
Government and Public Sector
Health and Healthcare
Information and Media
Management of Companies and Enterprises
Manufacturing
Mining, Quarrying and Oil and Gas Extraction
Office and Facilities Support Services
Other Services
Professional, Scientific and Technical Services
Real Estate, Rental and Leasing
Retail
Transportation and Warehousing
Wholesale Trade
Retained Recalled Transitioned Displaced
A������ ������ ��� �� �
2 / 2

The Future of Jobs 23
Unemployment rate in the United States by educational attainment, seasonally adjusted, 2000–2020
F I G U R E 1 4
Source
United States Bureau of Labor Statistics.
Note
Short-cycle tertiary education provides professional
knowledge, skills and competencies. Typically, programmes
are practically based and occupationally-specific.
0
5
10
15
20
25
2001 2005 2010 2015 2020
Unemployment rate (%)
Short-cycle tertiary education
Secondary non-tertiary educationLess than secondary education
Tertiary education
Finally, such turbulent labour markets provide additional challenges to young professionals navigating their entry into working life. The FutureFit AI global data map combines job automation and growth forecasts, real-time labour market information, learner resumes and the professional profiles of individuals. As such, it can track the historic job trajectories of professionals through different roles and industries,30 and in this instance the transition of young professionals who are in their first decade of working life in the United States observed between 2008 and 2019.31 The data in Figure 15 A reveals that, historically, the Retail, Restaurants, Hospitality, and the Food & Beverage sectors, as well some parts of Higher Education, have been among the top 20 starter-sectors for young people. However, as Figure 15 B indicates, these industries maintain a high attrition rate as workers tend to be transient. Thirty-seven percent of young professionals who work in Retail use the industry as a stepping-stone to another career and have historically moved onto another industry beyond the six affected sectors. The same figure is at 32% for those in the Restaurant sector. As roles in these sectors are temporarily or permanently displaced, those at the start of their careers will need to re-route and leapfrog into aspirational opportunities to work in high quality, well-remunerated jobs.
Figure 16 presents FutureFit AI data that documents past labour market transitions of young professionals over a decade. It shows the kinds of industries
young professionals have targeted for their job transitions after entering the world of work in one of the six industries most affected by the COVID-19 pandemic. Figure 17 illustrates those next-step possible opportunities, which include new roles in the Healthcare, Financial Services, Not-for-Profit and Information, Technology and Services industries—roles such as Credit Analysts, Bank Tellers and Public Relations Coordinators in the Not-for-Profit sector, Certified Nursing Assistants in Healthcare, and Account Executives in the Information Technology and Services sector.
This willingness to transition to new job opportunities, matched with new reskilling and upskilling capabilities, can help place young professionals back on track, helping them find routes from affected to new, growing opportunities. While the data shared above suggests that businesses and individuals have taken on significant initiative to adapt to the current labour market, economic scarring and persistent damage to the labour market have the potential to limit the scale of opportunities available to workers. However, governments have at their disposal a range of tools that can alleviate the impact on workers as economies recover.

The Future of Jobs 24
In previous recessions, the long-term impact on earnings among young people resulted in persistent earnings declines lasting up to 10 years, as young professionals started to work for lower-paying employers, then partly recover through a gradual process of mobility toward better firms. We have also seen young professionals start to work in occupations that do not match their education levels.32 As we consider the ways to revive the labour market, such insights can point to ways in which data-driven re-employment can support not only re-entry into one’s original industry or to an adjacent one, but also provide accelerated transitions to the ultimate career designation aspired to by young professionals.
The early indicators shared in this section signal that without adequate intervention, gains towards bridging societal inequalities might be reversed and wages further polarized. While data for the United States cannot be generalized to the world, the availability of such granular insights in this one economy serves as a stark reminder of the potential impact of these disruptions on equality within and across all economies.
Relationship between youth job transitions and affected industries F I G U R E 1 5
Source
FutureFit AI, produced for the World Economic Forum's New
Metrics CoLab.
0 2 4 6 8 10 12 14 16 18 20
Higher Education
Retail
Hospital & Health Care
Restaurants
Financial Services
Military
Non-Profit Organization Management
Education Management
Information Technology and Services
Government Administration
Hospitality
Food & Beverages
Entertainment
Marketing and Advertising
Banking
Share of workers (%)
A. Youth first jobs, by sub-industry
B. Youth transcience through affected sub-industries
0 20 40 60 80 100
Share of workers (%)
32%
32%
35%
36%
37%
39%
Stay in sub-industry Transition to one of the six affected industries Transition out of the six affected industries
Higher Education
Retail
Entertainment
Food & Beverages
Restaurants
Hospitality

The Future of Jobs 25
Primary possible transitions for affected young professionals
In-focus transitions for affected young workers
F I G U R E 1 6
F I G U R E 1 7
Destination sub-industry
Source sub-industry
Apparel & Fashion
Broadcast Media
Education Management
Financial Services
Hospital & Health Care
Non-Profit Organization Management
Information Technology
and Services
Marketing and Advertising
Real Estate
Entertainment - 4% - 4% 5% 4% - 5% -
Food &
Beverages- - 4% 5% 6% 5% 3% - -
Higher
Education- - 4% 4% 9% 6% 4% - -
Hospitality - - - 7% 7% 5% - 4% 4%
Restaurants - - 3% 5% 8% 6% 3% - -
Retail 5% - 4% 6% 8% 4% - - -
Source
FutureFit AI, produced for the World Economic Forum's New
Metrics CoLab.
Source
FutureFit AI, produced for the World Economic Forum's New
Metrics CoLab.
Note
Values refer to share of workers transitioning from source sub-
industry to destination sub-industry.
size = share of transitions
Education Management
Financial Services
Hospital and Health Care
Information Technology
and Services
Non-Profit Organization
Management
Account Executive
Applications Analyst
Bank Teller
Certified Nursing Assistant
Consultant
Customer Service Representative
Financial Analyst
Financial Representative
Medical Assistant
Nursing Assistant
Personal Banker
Pharmacy Technician
Registered Nurse
Sales Associate
Social Worker
Software Engineer
Substitute Teacher
Teacher
Tutor
Web Developer
Entertainment
Food & Beverages
Higher Education
Hospitality
Restaurants
Retail

The Future of Jobs October 2020
The Future of Jobs 26
Over the past five years, the World Economic Forum has tracked the arrival of the future of work, identifying the potential scale of worker displacement due to technological automation and augmentation alongside effective strategies for empowering job transitions from declining to emerging jobs. At the core of the report and its analysis is the Future of Jobs survey, a unique tool which assess the short- and long-term trends and impact of technological adoption on labour markets. The data outlined in
the following chapter tracks technological adoption among firms alongside changing job requirements and skills demand. These qualitative survey responses are further complemented by granular data from new sources derived from privately-held data that tracks key jobs and skills trends. Together, these two types of sources provide a comprehensive overview of the unfolding labour market trends as well as an opportunity to plan and strategize towards a better future of work.
Forecasts for Labour Market Evolution in 2020-2025
2

The Future of Jobs 27
Technologies likely to be adopted by 2025 (by share of companies surveyed)F I G U R E 1 8
2018 Difference2025
0 20 40 60 80 100
Share of company surveyed (%)
Cloud computing (17%)
Big data analytics (2%)
Internet of things and connected devices (9%)
Encryption and cybersecurity (29%)
Artificial intelligence (inc. ML and NLP) (8%)
Text, image and voice processing (-)
E-commerce and digital trade (2%)
Robots, non-humanoid (e.g industrial automation, drones) (10%)
Augmented and virtual reality (1%)
Distributed ledger technology (e.g. blockchain) (11%)
3D and 4D printing and modelling (10%)
Power storage and generation (-)
New materials (e.g. nanotubes, graphene) (-12%)
Biotechnology (8%)
Robots, humanoid (11%)
Quantum computing (-5%)
Source
Future of Jobs Survey 2020, World Economic Forum.
Technological adoption2.1
The past two years have seen a clear acceleration in the adoption of new technologies among the companies surveyed. Figure 18 presents a selection of technologies organized according to companies’ likelihood to adopt them by 2025. Cloud computing, big data and e-commerce remain high priorities, following a trend established in previous years. However, there has also been a significant rise in interest in encryption, reflecting the new vulnerabilities of our digital age, and a significant increase in the number of firms expecting to adopt non-humanoid robots and artificial intelligence, with both technologies slowly becoming a mainstay of work across industries.
These patterns of technological adoption vary according to industry. As demonstrated in Figure 19, Artificial intelligence is finding the most broad adaptation among the Digital Information and Communications, Financial Services, Healthcare, and Transportation industries. Big data, the Internet of Things and Non-Humanoid Robotics are seeing strong adoption in Mining and Metals, while the Government and the Public Sector industry shows a distinctive focus on encryption.
These new technologies are set to drive future growth across industries, as well as to increase the demand for new job roles and skill sets. Such positive effects may be counter-balanced by workforce disruptions. A substantial amount of literature has indicated that technological adoption will impact workers’ jobs by displacing some tasks performed by humans into the realm of work performed by machines. The extent of disruption will vary depending on a worker’s occupation and skill set.33
Data from the Forum’s Future of Jobs Survey shows that companies expect to re-structure their workforce in response to new technologies (Figure 20). In particular, the companies surveyed indicate that they are also looking to transform the composition of their value chain (55%), introduce further automation, reduce the current workforce (43%) or expand their workforce as a result of deeper technological integration (34%), and expand their use of contractors for task-specialized work (41%).

The Future of Jobs 28
Source
Future of Jobs Survey 2020, World Economic Forum.
Note
AGRI = Agriculture, Food and Beverage; AUTO = Automotive; CON = Consumer;
DIGICIT = Digital Communications and Information Technology; EDU =
Education; ENG = Energy Utilities & Technologies; FS = Financial Services;
GOV = Government and Public Sector; HE = Health and Healthcare; MANF =
Manufacturing; MIM = Mining and Metals; OILG = Oil and Gas; PS = Professional
Services; TRANS = Transportation and Storage.
Technology/SectorAGRI (%)
AUTO (%)
CON (%)
DIGICIT (%)
EDU (%)
ENG (%)
FS (%)
GOV (%)
HE (%)
MANF (%)
MIM (%)
OILG (%)
PS (%)
TRANS (%)
3D and 4D printing and modelling
54 67 39 39 69 69 27 45 65 69 48 79 40 60
Artificial intelligence (e.g. machine
learning, neural networks, NLP)
62 76 73 95 76 81 90 65 89 71 76 71 76 88
Augmented and virtual reality
17 53 58 73 70 75 62 56 67 54 57 71 57 62
Big data analytics 86 88 91 95 95 76 91 85 89 81 90 86 86 94
Biotechnology 50 18 48 40 46 47 46 38 65 31 16 36 28 23
Cloud computing 75 80 82 95 95 88 98 95 84 92 87 86 88 94
Distributed ledger technology (e.g.
blockchain)31 40 41 72 61 50 73 40 72 41 50 46 53 38
E-commerce and digital trade
80 75 85 82 72 71 90 67 78 82 62 62 70 87
Encryption and cyber security
47 88 85 95 86 88 95 95 84 72 83 71 78 75
Internet of things and connected devices
88 82 94 92 62 94 88 79 95 84 90 93 74 76
New materials (e.g. nanotubes,
graphene)15 46 22 36 67 65 36 33 47 51 37 36 27 27
Power storage and generation
75 64 59 38 27 88 55 33 31 62 57 69 45 46
Quantum computing 18 21 17 51 25 41 44 36 38 21 29 25 19 38
Robots, humanoid 42 50 38 44 47 24 47 31 47 41 15 17 25 21
Robots, non-humanoid (industrial automation, drones,
etc.)
54 60 52 61 59 65 53 50 56 79 90 79 35 69
Text, image and voice processing
50 59 82 90 89 88 88 89 88 64 76 87 79 65
Technologies likely to be adopted by 2025, by share of companies surveyed, selected sectorsF I G U R E 1 9
The reallocation of current tasks between human and machine is already in motion. Figure 21 presents the share of current tasks at work performed by human vs. machine in 2020 and forecasted for 2025 according to the estimates and planning of senior executives today. One of the central findings of the Future of Jobs
2018 Report continues to hold—by 2025 the average estimated time spent by humans and
machines at work will be at parity based on today's tasks. Algorithms and machines will be primarily focused on the tasks of information and data processing and retrieval, administrative tasks and some aspects of traditional manual labour. The tasks where humans are expected to retain their comparative advantage include managing, advising, decision-making, reasoning, communicating and interacting.

The Future of Jobs 29
Companies' expected changes to the workforce by 2025 (by share of companies surveyed)
Share of tasks performed by humans vs machines, 2020 and 2025 (expected), by share of companies surveyed
F I G U R E 2 0
F I G U R E 2 1
Share of company surveyed (%)
Modify the composition of one's value chain
Reduce current workforce due to technological integration
or automation
Expand use of contractors doing task-specialized work
Modify the locations where the organization operates
Expand current workforce due to technological integration
or automation
Expand current workforce
Reduce current workforce
0 10 20 30 40 50 60
55.1
43.2
41.8
38.3
34.5
32.4
15
Source
Future of Jobs Survey 2020, World Economic Forum.
Source
Future of Jobs Survey 2020, World Economic Forum.
Information and data processing
Looking for and receiving job-related information
Performing complex and technical activities
Administering
Identifying and evaluating job-relevant information
All tasks
Performing physical and manual work activities
Communicating and interacting
Reasoning and decision-making
Coordinating, developing, managing and advising
Machine 2020
Human-machine frontier 2025
Human 2020 Machine 2025 Human 2025
Share of task hours (%)
0 20 40 60 80 100
Emerging and declining jobs2.2
Extrapolating from the figures shared in the Future of Jobs Survey 2020, employers expect that by 2025, increasingly redundant roles will decline from being 15.4% of the workforce to 9% (6.4% decline), and that emerging professions will grow from 7.8% to 13.5% (5.7% growth) of the total employee base of company respondents. Based on these figures, we estimate that by 2025, 85 million jobs may be displaced by a shift in the division of labour between humans and machines, while 97 million new roles may emerge that are more adapted
to the new division of labour between humans, machines and algorithms, across the 15 industries and 26 economies covered by the report.
The 2020 version of the Future of Jobs Survey also reveals similarities across industries when looking at increasingly strategic and increasingly redundant job roles. Similar to the 2018 survey, the leading positions in growing demand are roles such as Data Analysts and Scientists, AI and Machine Learning Specialists, Robotics Engineers,

The Future of Jobs 30
Top 20 job roles in increasing and decreasing demand across industriesF I G U R E 2 2
1 Data Analysts and Scientists
2 AI and Machine Learning Specialists
3 Big Data Specialists
4 Digital Marketing and Strategy Specialists
5 Process Automation Specialists
6 Business Development Professionals
7 Digital Transformation Specialists
8 Information Security Analysts
9 Software and Applications Developers
10 Internet of Things Specialists
11 Project Managers
12 Business Services and Administration Managers
13 Database and Network Professionals
14 Robotics Engineers
15 Strategic Advisors
16 Management and Organization Analysts
17 FinTech Engineers
18 Mechanics and Machinery Repairers
19 Organizational Development Specialists
20 Risk Management Specialists
1 Data Entry Clerks
2 Administrative and Executive Secretaries
3 Accounting, Bookkeeping and Payroll Clerks
4 Accountants and Auditors
5 Assembly and Factory Workers
6 Business Services and Administration Managers
7 Client Information and Customer Service Workers
8 General and Operations Managers
9 Mechanics and Machinery Repairers
10 Material-Recording and Stock-Keeping Clerks
11 Financial Analysts
12 Postal Service Clerks
13 Sales Rep., Wholesale and Manuf., Tech. and Sci.Products
14 Relationship Managers
15 Bank Tellers and Related Clerks
16 Door-To-Door Sales, News and Street Vendors
17 Electronics and Telecoms Installers and Repairers
18 Human Resources Specialists
19 Training and Development Specialists
20 Construction Laborers
Source
Future of Jobs Survey 2020, World Economic Forum.
Increasing demand Decreasing demand
Software and Application developers as well as Digital Transformation Specialists. However, job roles such as Process Automation Specialists, Information Security Analysts and Internet of Things Specialists are newly emerging among a cohort of roles which are seeing growing demand from employers. The emergence of these roles reflects the acceleration of automation as well as the resurgence of cybersecurity risks.
In addition, as presented in the Industry Profiles in Part 2 of this report, a set of roles are distinctively emerging within specific industries. This includes Materials Engineers in the Automotive Sector, Ecommerce and Social Media Specialists in the Consumer sector, Renewable Energy Engineers in the Energy Sector, FinTech Engineers in Financial Services, Biologists and Geneticists in Health and Healthcare as well as Remote Sensing Scientists and Technicians in Mining and Metals. The nature of these roles reflects the trajectory towards areas of innovation and growth across multiple industries.
At the opposite end of the scale, the roles which are set to be increasingly redundant by 2025 remain largely consistent with the job roles identified in 2018 and across a range of research papers on the automation of jobs.34 These include roles which are being displaced by new technologies: Data Entry Clerks, Administrative and Executive Secretaries,
Accounting and Bookkeeping and Payroll Clerks, Accountant and Auditors, Assembly and Factory Workers, as well as Business Services and Administrative Managers.
Such job disruption is counter-balanced by job creation in new fields, the ‘jobs of tomorrow’. Over the coming decade, a non-negligible share of newly created jobs will be in wholly new occupations, or existing occupations undergoing significant transformations in terms of their content and skills requirements. The World Economic Forum's Jobs
of Tomorrow report, authored in partnership with data scientists at partner companies LinkedIn and Coursera, presented for the first time a way to measure and track the emergence of a set of new jobs across the economy using real-time labour market data.35 The data from this collaboration identified 99 jobs that are consistently growing in demand across 20 economies. Those jobs were then organized into distinct professional clusters according to their skills similarity.
This resulting set of emerging professions reflects the adoption of new technologies and increasing demand for new products and services, which are driving greater demand for green economy jobs, roles at the forefront of the data and AI economy, as well as new roles in engineering, cloud computing and product development. In addition, the emerging

The Future of Jobs 31
professions showcase the continuing importance of human interaction in the new economy through roles in the care economy; in marketing, sales and content production; as well as roles where a facility or aptitude for understanding and being comfortable working with different types of people from different backgrounds is critical. Figure 23 displays the set of roles which correspond to each professional cluster, organized according to the scale of each opportunity.36 Due to constraints related to data availability, the Care and Green Jobs cluster are not currently covered by the following analysis.
In this report we present a unique extension of this analysis which examines key learnings gleaned from job transitions into those emerging clusters using LinkedIn data gathered over the past five years. For this analysis the LinkedIn data science team analysed the job transitions of professionals who moved into emerging jobs over the period of 2015 to 2020. The researchers analysed when professionals transitioned into any new role as well as when they transitioned to a wholly new occupation—here called ‘pivots’. To understand the skill profile of each occupation, analysts first identified a list of the most representative skills associated with an occupation, based on LinkedIn’s Skills Genome Metric which calculates the ‘most representative’ skills across roles, using the TF-IDF method. To examine the extent to which certain skills groups of interest are associated with a particular occupation, a ‘skill penetration’ figure is calculated. This indicates the share of individual skills associated with that occupation that belong to a given skill group. To understand the skill profile of each occupation, analysts calculated the ‘skill penetration’ score for each skill associated with an occupation. That is, the ‘skill penetration’ figure indicates the individuals from that occupation who list the specific skill as a share of all individuals employed in that occupation.
The aggregate skills similarity between two occupations is then calculated as the cosine similarity of those two occupations. In addition, for each skill group, a skills gap measure is calculated by expressing the skill penetration of the destination job as a share of the same indicator in the source job.
The evidence indicates that some emerging job clusters present significant opportunities for transitions into growing jobs (jobs in increasing demand) through effective career pivots. As demonstrated in Figure24 A, among the transitions into Data and AI professions, 50% of the shifts made are from non-emerging roles. That figure is much higher at 75% in Sales, 72% in content roles and 67% of Engineering roles. One could say that such field are easier to break into, while those such as Data and AI and People and Culture present more challenges. These figures suggest that some level of labour force reallocation is already underway.
By analysing these career pivots—instances where professionals transition to wholly new occupations—it becomes apparent that some of
these so-called ‘jobs of tomorrow’ present greater opportunities for workers looking to fully switch their job family and therefore present more options to reimagine one’s professional trajectory, while other emerging professions remain more fully bounded. As presented in Figure 24 C only 19% and 26% of job transitions into Engineering and People and Culture, respectively, come from outside the job family in which those roles are today. In contrast, 72% of Data and AI bound transitions originate from a different job family and 68% of transitions into emerging jobs within Sales. As illustrated in Figure 25 emerging job clusters are typically staffed by workers starting in a set of distinctive job families, but the diversity of those source job families varies by emerging profession. While emerging roles in Product Development draw professionals from a range of job families, emerging roles in People and Culture job cluster typically transition from the Human Resources job family. The emerging Cloud Computing job cluster is primarily populated by professionals transitioning from IT and Engineering.
Finally, a number of jobs of tomorrow present greater opportunities to pivot into professions with a significant change in skills profile. In Figure24 B it is possible to observe that transitions into People and Culture and into Engineering have typically been ones with high skills similarity while Marketing and Content Development have been more permissive of low skills similarity. Among the emerging professions outlined in this report, transitions into Data and AI allow for the largest variation in skills profile between source and destination job title.
Figure 25 demonstrates that the newer emerging professions such as Data and AI, Product Development and Cloud Computing present more opportunities to break into these frontier fields, and that, in fact, such transitions do not require a full skills match between the source and destination occupation. However, some job clusters of tomorrow remain more ‘closed’ and tend to recruit staff with a very specific skill set. It is not possible to observe whether those limitations are necessary or simply established practice. It may be the case that such ‘siloed’ professional clusters can be reinvigorated by experimentation with relaxing the constraints for entry into some emerging jobs alongside appropriate reskilling and upskilling.

The Future of Jobs 32
Emerging roles clustered into the jobs of tomorrowF I G U R E 2 3
# Rank Niche Mass
Cloud Computing
Site Reliability Engineer
Platform Engineer
Cloud Engineer
DevOps Engineer
Cloud Consultant
DevOps Manager
Content Production
Social Media Assistant
Social Media Coordinator
Content Specialist
Content Producer
Content Writer
Creative Copywriter
Data and AI
Artificial Intelligence Specialist
Data Scientist
Data Engineer
Big Data Developer
Data Analyst
Analytics Specialist
Data Consultant
Insights Analyst
Business Intelligence Developer
Analytics Consultant
Engineering
Python Developer
Full Stack Engineer
Javascript Developer
Back End Developer
Frontend Engineer
Software Developer Dotnet
Development Specialist
Technology Analyst
1
2
3
3
5
6
1
2
3
4
5
6
1
2
3
4
5
6
7
8
9
10
1
2
2
4
5
5
7
8
Marketing
Growth Hacker
Growth Manager
Digital Marketing Specialist
Digital Specialist
Ecommerce Specialist
Commerce Manager
Head Of Digital
Digital Marketing Consultant
Digital Marketing Manager
Chief Marketing Officer
People and Culture
Information Technology Recruiter
Human Resources Partner
Talent Acquisition Specialist
Business Partner
Human Resources Business Partner
Product Development
Product Owner
Quality Assurance Tester
Agile Coach
Software Quality Assurance Engineer
Product Analyst
Quality Assurance Engineer
Scrum Master
Digital Product Manager
Delivery Lead
Sales
Customer Success Specialist
Sales Development Representative
Commercial Sales Representative
Business Development Representative
Customer Specialist
Partnerships Specialist
Chief Commercial Officer
Head Of Partnerships
Enterprise Account Executive
Business Development Specialist
Chief Strategy Officer
Head Of Business Development
1
2
3
4
5
6
6
8
9
10
1
2
3
4
5
1
2
3
4
5
6
6
8
9
1
2
3
4
5
6
7
8
9
10
11
12
Green EconomyCare Economy
Source
LinkedIn Economic Graph.

The Future of Jobs 33
0 20 40 60 80 100
Data and AI
Cloud Computing
Product Development
People and Culture
Marketing
Engineering
Content Production
Sales
Same emerging job clusterSame occupation Any occupation outside emerging clusterAny emerging cluster
Share of transitions (%)
Cloud Computing
Data and AI
Product Development
Sales
Content Production
Marketing
People and Culture
Engineering
0 20 40 60 80 100
Share of transitions (%)
2%
7%
21%
22%
35%
37%
56%
60%
76%
43%
59%
57%
43%
42%
25%
27%
22%
50%
20%
21%
22%
22%
19%
12%
Medium similarityHigh similarity Low similarity
Product Development
Data and AI
Sales
Cloud Computing
Content Production
Marketing
People and Culture
Engineering
Change in job familyNo change in job family
28% 72�
28� 72�
32� 68�
47� 53�
50� 50�
55� 45�
74� 26�
81� 19�
����e of transitions (%)
0 20 40 60 80 100
Transitions and pivots into the jobs of tomorrow, selected countriesF I G U R E 2 4
A. Transition by occupation and job cluster of source occupation
B. Job pivots by skills similarity with source occupation
C. Job pivots by job family of source occupation
Source
LinkedIn Economic Graph.
Note
Job transitions refers to any job transition while job pivots
refers to individuals moving away from their current occupation.
Job Families are groups of occupations based upon work
performed, skills, education, training, and credentials.
Data derived from the following countries
Argentina, Australia, Brazil, Canada, France, Germany, India,
Ireland, Italy, Mexico, Netherlands, New Zealand, Saudi
Arabia, Singapore, South Africa, Spain, Sweden, United Arab
Emirates, United Kingdom and United States.
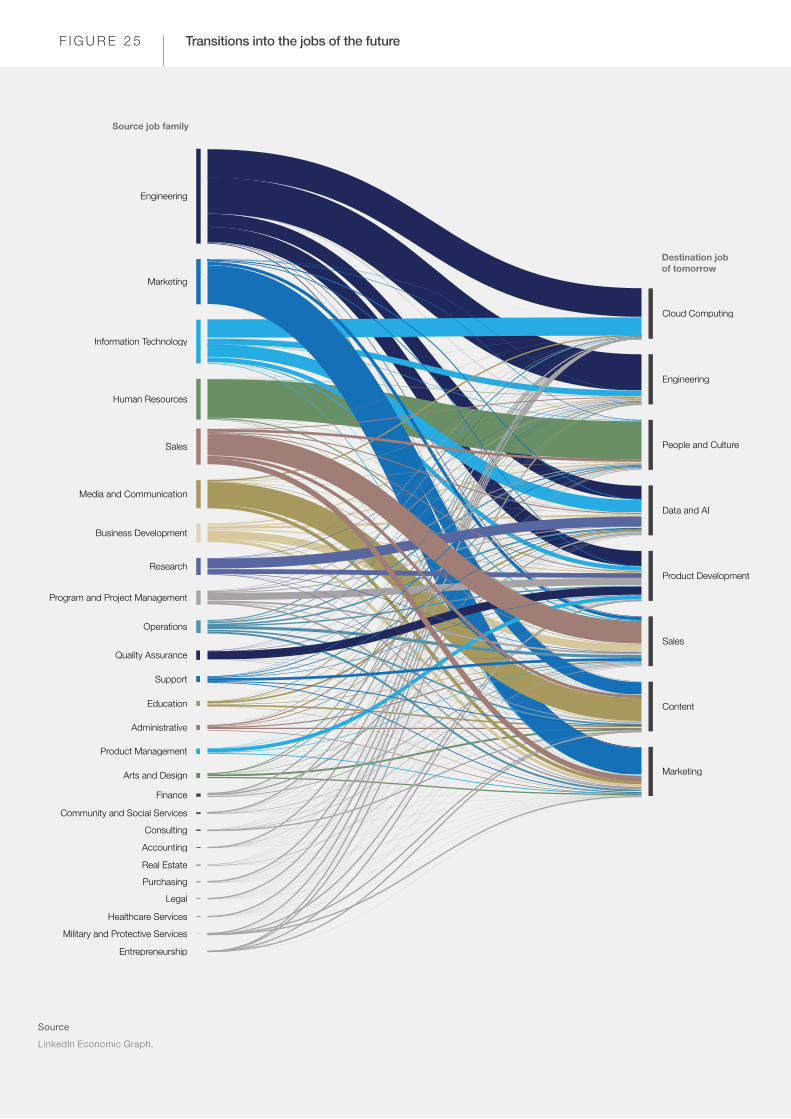
The Future of Jobs 34
Transitions into the jobs of the futureF I G U R E 2 5
Source
LinkedIn Economic Graph.
Cloud Computing
Content
Data and AI
Engineering
People and Culture
Marketing
Product Development
Sales
Accounting
Administrative
Arts and Design
Business Development
Community and Social Services
Consulting
Education
Engineering
Entrepreneurship
Finance
Healthcare Services
Human Resources
Information Technology
Legal
Marketing
Media and Communication
Military and Protective Services
Operations
Product Management
Program and Project Management
Purchasing
Quality Assurance
Real Estate
Research
Sales
Support
Source job family
Destination job
of tomorrow

The Future of Jobs 35
Perceived barriers to the adoption of new technologiesF I G U R E 2 6
The ability of global companies to harness the growth potential of new technological adoption is hindered by skills shortages. Figure 26 shows that skills gaps in the local labour market and inability to attract the right talent remain among the leading barriers to the adoption of new technologies. This finding is consistent across 20 of the 26 countries covered by the Country Profiles presented in Part 2 of the report. In the absence of ready talent, employers surveyed through the Future of Jobs Survey report that, on average, they provide access to reskilling and upskilling to 62% of their workforce, and that by 2025 they will expand that provision to a further 11% of their workforce. However, employee engagement into those courses is lagging, with only 42% of employees taking up employer-supported reskilling and upskilling opportunities.
Skill shortages are more acute in emerging professions. Asked to rate the ease of finding skilled employees across a range of new, strategic roles, business leaders consistently cite difficulties when hiring for Data Analysts and Scientists, AI and Machine Learning Specialists as well as Software and Application Developers, among other emerging roles. While an exact skills match is not a prerequisite to making a job transition, the long-term productivity of employees is determined by their mastery of key competencies. This section of the report takes stock of the types of skills that are currently in demand as well as the efforts underway to fill that demand through appropriate reskilling and upskilling.
Emerging and declining skills2.3
Source
Future of Jobs Survey 2020, World Economic Forum.
Skills gaps in the local labour market
Inability to attract specialized talent
Skills gaps among organization’s leadership
Insufficient understanding of opportunities
Lack of flexibility of the regulatory framework
Shortage of investment capital
Lack of flexibility in hiring and firing
Lack of interest among leadership
Other
Share of companies surveyed (%)
0 10 20 30 40 50 60
55.4
46.7
41.4
38.9
33
32.3
26.3
17.9
5.3
Since its 2016 edition, this report has tracked the cross-functional skills which are in increasing demand. Figure 27 shows the top skills and skill groups which employers see as rising in prominence in the lead up to 2025. These include groups such as critical thinking and analysis as well as problem-solving, which have stayed at the top of the agenda with year-on-year consistency. Newly emerging this year are skills in self-management such as active learning, resilience, stress tolerance and flexibility. In addition, the data available through metrics partnerships with LinkedIn and Coursera allow us to track with unprecedented granularity the types of specialized skills needed for the jobs of tomorrow. Figure 28 demonstrates the set of skills which are in demand across multiple emerging professions. Among these ‘cross-cutting’ skills are specialized skills in Product Marketing, Digital Marketing and Human Computer Interaction.
This report reveals in further granular detail the types of insights that can guide job transitions through to appropriate reskilling and upskilling. Figures 29 and 30 demonstrate those metrics. Figure 29 presents the set of high-growth, emerging roles that are currently covered by the Data and AI job cluster, and the typical skills gap between source and destination professions when workers have moved into those roles over the past five years. Figure 30 presents the typical learning curriculum of Coursera learners who are targeting a transition into Data and AI and the distance from the optimal level of mastery in the relevant job cluster, and quantifies the days of learning needed for the average worker to gain that level of mastery. Figures 29 and 30 together demonstrate that it is common for individuals moving into Data and AI to lack key data science skills—but that individuals seeking to transition into such roles will be able to work towards the right skill set through mastery of skills such as statistical programming within a recommended time frame, in this case, 76 days of learning.

The Future of Jobs 36
Perceived skills and skills groups with growing demand by 2025, by share of companies surveyedF I G U R E 2 7
A. Relative importance of different skill groups
0 20 40 60 80 100
Critical thinking and analysis
Problem-solving
Self-management
Working with people
Management and communication of activities
Technology use and development
Core literacies
Physical abilities
Share of companies surveyed (%)
StableDecreasing Increasing
1 Analytical thinking and innovation
2 Active learning and learning strategies
3 Complex problem-solving
4 Critical thinking and analysis
5 Creativity, originality and initiative
6 Leadership and social influence
7 Technology use, monitoring and control
8 Technology design and programming
Source
Future of Jobs Survey 2020, World Economic Forum.
B. Top 15 skills for 2025
9 Resilience, stress tolerance and flexibility
10 Reasoning, problem-solving and ideation
11 Emotional intelligence
12 Troubleshooting and user experience
13 Service orientation
14 Systems analysis and evaluation
15 Persuasion and negotiation
In addition to skills that are directly jobs-relevant, during the COVID-19 context of 2020, data from the online learning provider Coursera has been able to identify an increasing emphasis within learner reskilling and upskilling efforts on personal development and self-management skills. This echoes earlier findings on the importance of well-being when managing in the remote and hybrid work: demand for new skills acquisition has bifurcated. Figure 31 A illustrates the changing demand for training by employment status, comparing the April-to-June period this year with the same period last year. This data reveals a significant increase in demand for personal development courses, as well as for courses in health, and a clear distinction between those who are currently in employment and those who are unemployed. Those in employment are placing larger emphasis on personal development courses, which have seen 88% growth among that population. Those who are unemployed have placed greater emphasis on learning digital skills such as data analysis, computer science and information technology. These trends can be observed in more granular detail in Figures 31 B and C. In particular, self-management skills
such as mindfulness, meditation, gratitude and kindness are among the top 10 focus areas of those in employment in contrast to the more technical skills which were in-focus in 2019. In contrast, those who are unemployed have continued to emphasize skills which are of relevance to emerging jobs in Engineering, Cloud Computing, Data and AI.37
When it comes to employers providing workers with training opportunities for reskilling and upskilling, in contrast to previous years, employers are expecting to lean more fully on informal as opposed to formal learning. In the Future of Jobs Survey, 94% of business leaders report that they expect employees to pick up new skills on the job, a sharp uptake from 65% in 2018. An organization’s learning curricula is expected to blend different approaches—drawing on internal and external expertise, on new education technology tools and using both formal and informal methods of skills acquisition.

The Future of Jobs 37
Top cross-cutting, specialized skills of the future F I G U R E 2 8
Source
LinkedIn Economic Graph.
Note
Cross-cutting skills are those skills that are
applicable and easily transferable across many
occupations and roles.
Specialized skill Emerging job clusters
1. Product Marketing Data and AI, People and Culture, Marketing, Product Development, Sales (5)
2. Digital Marketing Content, Data and AI, Marketing, Product Development, Sales (5)
3. Software Development Life Cycle (SDLC) Cloud Computing, Data and AI, Engineering, Marketing, Product Development (5)
4. Business Management People and Culture, Marketing, Product Development, Sales (4)
5. Advertising Content, Data and AI, Marketing, Sales (4)
6. Human Computer Interaction Content, Engineering, Marketing, Product Development (4)
7. Development Tools Cloud Computing, Data and AI, Engineering, Product Development (4)
8. Data Storage Technologies Cloud Computing, Data and AI, Engineering, Product Development (4)
9. Computer Networking Cloud Computing, Data and AI, Engineering, Sales (4)
10. Web Development Cloud Computing, Content, Engineering, Marketing (4)
11. Management Consulting Data and AI, People and Culture, Product Development (3)
12. Entrepreneurship People and Culture, Marketing, Sales (3)
13. Artificial Intelligence Cloud Computing, Data and AI, Engineering (3)
14. Data Science Data and AI, Marketing, Product Development (3)
15. Retail Sales People and Culture, Marketing, Sales (3)
16. Technical Support Cloud Computing, Product Development, Sales (3)
17. Social Media Content, Marketing, Sales (3)
18. Graphic Design Content, Engineering, Marketing (3)
19. Information Management Content, Data and AI, Marketing (3)
Data and AI jobs of tomorrow, top roles and typical skills in past transitionsF I G U R E 2 9
RankScale of
opportunityJob
1 MassArtificial Intelligence
Specialist
2 Mass Data Scientist
3 Mass Data Engineer
4 Niche Big Data Developer
5 Mass Data Analyst
6 Mass Analytics Specialist
7 Niche Data Consultant
8 Niche Insights Analyst
9 NicheBusiness Intelligence
Developer
10 Mass Analytics Consultant
Rank Skill
Skill gap of workers transitioning into
this job cluster (0 is full gap, 1 is no gap)
1 Data Science 0.19
2 Data Storage Technologies 0.41
3 Artificial Intelligence 0.10
4 Development Tools 0.73
5 Computer Networking 0.78
6 Management Consulting 0.85
7 Scientific Computing 0.41
8 Product Marketing 1.00
9 Natural Language Processing 0.11
10 Digital Marketing 1.00
11 Advertising 1.00
12 Cloud Computing 0.27
13 Customer Experience 1.00
14 Signal Processing 0.15
15 Information Management 0.93
16 Software Development Life Cycle (SDLC) 1.00
Note
The gap measure has been capped at 1.00.
Source
LinkedIn Economic Graph.
A. Opportunities within professional cluster B. Typical skills gaps across successful job transitions

The Future of Jobs 38
Data and AI jobs of tomorrow, typical learning agenda and time to achieve mastery in key skillsF I G U R E 3 0
Rank Skill
1 Data Analysis
2 Computer Programming
3 General Statistics
4 Leadership And Management
5 Regression
6 Machine Learning
7 Big Data
8 Python Programming
Rank SkillExpected
mastery score (0 to 6, best)
Typical mastery gap
Average days to
master skill
1 Statistical Programming 5.50 54% 72
2 Communication 4.36 34% 80
3 Leadership and Management 3.61 66% 39
4 Data Management 3.61 45% 84
5 Marketing 3.57 55% 43
6 Finance 3.56 46% 67
7 Sales 3.43 84% 13
8 Computer Programming 3.43 41% 76
9 Business Analysis 3.24 65% 34
10 Machine Learning 3.06 54% 86
Source
Coursera.
Note
Mastery score is the score attained by those in the top 80%
on an assessment for that skill. Mastery gap is measured as
a percentage representing the score among those looking to
A. Typical learning agenda B. Top 10 skills by required level of mastery and time to achieve that mastery
transition to the occupation as a share of the score among
those already in the occupation.
According to data from the Future of Jobs Survey, formal upskilling appears to be more closely focused on technology use and design skills, while emotional intelligence skills are less frequently targeted in that formal reskilling provision. Data from Coursera showing the focus areas of workforce recovery programmes and employer-led reskilling and upskilling activities confirms that finding. In-focus courses are primarily those in technical skills alongside a cohort of managerial skills in strategy and leadership.
On average, respondents to the Future of Jobs Survey estimate that around 40% of workers will require reskilling of six months or less. That figure is higher for workers in the Consumer industry and in the Health and Healthcare industry, where employers are likely to expect to lean on short-cycle reskilling. The share of workers who can be reskilled within six months is lower in the Financial Services and the Energy sectors, where employers expect that workers will need more time-intensive reskilling. These patterns are explored more deeply in the Industry Profiles in Part 2.
According to Future of Jobs Survey data, employers expect to lean primarily on internal capacity to deliver training: 39% of training will be delivered by an internal department. However, that training will be supplemented by online learning platforms (16% of training) and by external consultants (11% of training). The trend towards the use of digital online reskilling has accelerated during the restrictions on in-person learning since the onset of the COVID-19 pandemic. New data from the online learning platform Coursera for April, May and June of 2020 (quarter 2) signals a substantial expansion in the use
of online learning. In fact, there has been a four-fold increase in the numbers of individuals seeking out opportunities for learning online through their own initiative, a five-fold increase in employer provision of online learning opportunities to their workers and an even more extensive nine-fold enrolment increase for learners accessing online learning through government programmes.
Through focused efforts, individuals could acquire one of Coursera’s top 10 mastery skills in emerging professions across People and Culture, Content Writing, Sales and Marketing in one to two months. Learners could expand their skills in Product Development and Data and AI in two to three months; and if they wish to fully re-pivot to Cloud and Engineering, learners could make headway into that key skill set through a 4-5 month learning programme.38 Such figures suggest that although learning a new skill set is increasingly accessible through new digital technologies, to consolidate new learning individuals will need access to the time and funding to pursue such new career trajectories. LinkedIn data presented in section 2.2 indicates that although many individuals can move into emerging roles with low or mid skills similarity, a low-fit initial transition will still require eventual upskilling and reskilling to ensure long term productivity.

The Future of Jobs 39
Distribution of course enrolment and growth of interest, by course specialism, employment status and year
F I G U R E 3 1
Distribution of enrolled, April, May and June (Q2) Year-on-year change, Q2 2019 to 2020
Rank 2020
Course SpecialismAll
2019All
2020Employed
2019Employed
2020Unemployed
2019Unemployed
2020All Employed Unemployed
1 Business 18% 19% 21% 22% 16% 19% 5% 7% 17%
2 Computer Science 18% 16% 17% 11% 23% 21% -8% -34% -7%
3 Health 9% 13% 8% 14% 6% 8% 48% 81% 44%
4 Data Science 20% 13% 22% 12% 28% 18% -37% -44% -35%
5 Personal Development 6% 9% 6% 12% 3% 5% 42% 88% 67%
6 Language Learning 5% 7% 4% 6% 4% 6% 46% 55% 45%
7 Arts and Humanities 6% 7% 5% 7% 4% 5% 12% 32% 4%
8Physical Science and
Engineering6% 6% 5% 5% 6% 6% 7% 3% 11%
9 Social Sciences 6% 5% 5% 5% 4% 3% -27% -4% -17%
10 Information Technology 4% 4% 5% 4% 5% 7% 1% -23% 49%
11 Math and Logic 2% 1% 1% 1% 2% 1% -23% -15% -16%
Source
Coursera, produced for the World Economic Forum's New
Metrics CoLab.
Note
Values in brown indicate where the hiring rate is lower than in 2019, while values in
green indicate where the rate is higher than 2019. The darker the colour, the lower/
higher the rate.
A. Changes to in-focus course specialism by employment status
Rank 2019 2020
1 Python Programming Writing
2 Artificial Neural Networks Strategy
3 Algorithms Python Programming
4 Regression Mindfulness
5 Strategy Meditation
6 Deep Learning Gratitude
7 Writing Kindness
8 Supply Chain Listening
9 Cloud Computing Algorithms
10 General Statistics Grammar
Rank 2019 2020
1 Python Programming Python Programming
2 Artificial Neural Networks Algorithms
3 Algorithms Writing
4 Regression Strategy
5 Deep Learning Artificial Neural Networks
6 Strategy Regression
7 Supply Chain Grammar
8 Writing Deep Learning
9 General Statistics General Statistics
10 Tensorflow Problem-Solving
B. Top 10 in-focus skills of those in employment C. Top 10 skills for those who are unemployed

The Future of Jobs October 2020
The Future of Jobs 40
The challenges facing labour markets today are
significant but not insurmountable. To jointly lead economies and societies to greater prosperity, the public and private sector will need to tackle the factors that lead to the misallocation and waste of human capabilities and potential. For over half a century, economic thinkers have been able to track the benefits of expanding human skills and capabilities to economic prosperity.39 One of the most valuable assets of any economy or company is its human capital–the skills, capabilities and innovation of its citizens. Distortions that undercut individuals’ skills development and their ability to find a job that matches their current and potential capabilities erode the factors of economic productivity, innovation and growth that are derived from harnessing human skills and capabilities.40
To harness human potential towards greater prosperity and inclusion, leaders will need to shift talent from areas of decline to areas of growth in the economy. They will be called on to create
effective systems for upgrading individual’s skills and capabilities in line with emerging skills demand—in essence, expanding access and delivery of mid-career reskilling and upskilling through private and public sector investment and to ensure that such efforts by workers are rewarded with adequate job opportunities. To realize the value of such investments, businesses and governments will need to accompany such efforts with policies and practices that ensure that workers are able to prosper on the basis of merit rather than the misallocation of talent due to social strata or characteristics such as race or gender, strengthening the connection between personal income and productivity, and expanding safety nets to alleviate economic strain during periods of transition.
Public and Private Sector Pathways to Reviving Labour Markets
3
From temporary public policy relief
to long-term solutions
3.1
As illustrated throughout this report, the COVID-19 pandemic has laid bare the lack of mechanisms to support workers through mid-career transitions and to ensure worker well-being and livelihoods amidst disruptions. What is needed is fundamental reform—or, more accurately, a revolution in the way education and training systems operate, and in how they interact with labour market policies and business approaches to training workers with new skills. This section reviews the current public policy ecosystem for ensuring adequate social protection, including new temporary measures put in place since the onset of COVID-19.
Reacting to the current social and economic crisis, countries across the globe have announced packages of emergency fiscal and monetary measures of unprecedented scope, and the pandemic has led to the temporary adoption of measures enhancing social safety nets for workers and households in a number of economies.
Governments and central banks have implemented fiscal and monetary packages of unique breadth and depth to counterbalance the economic impact of the pandemic as well as to protect workers and households. According to recent estimates by the IMF (International Monetary Fund), close to $11 trillion has been deployed through direct fiscal impulse and liquidity measures aimed at supporting households and businesses through the crisis.41 As illustrated by Figure 32, the fiscal measures implemented by G20 countries in 2020 are larger than those taken during and just after Global Financial Criss in 2007–2008.42 However, the breadth and scale of those policies remain out of reach for most developing economies, which have implemented less than half the number of measures implemented in developed economies. This continues to be a concern given that many developing economies still lack well-established health systems in addition to social safety nets.

The Future of Jobs 41
In the immediate term it is possible to analyse the types of measures adopted and prioritized by different economies, while a longer-term horizon will allow a broader analysis of their overall efficacy. Data from the ILO presented in Figure 33 shows that more than 1,000 different policy measures have been implemented in more than 200 countries since the onset of the pandemic. They vary in focus and by instrument utilized. The majority of the measures observed span a range of agile policy solutions which have the capacity to protect the most vulnerable workers directly. While some instruments depend on in-kind services maintaining health, nutrition and having access to shelter, others focus on income stability, such as the widespread use of one-off cash transfers and allowances to subsidize household expenses, as well as a temporary extension and expansion of benefits to workers such as unemployment leave.
The timeliness and adaptability of cash transfer mechanisms have made them a critical tool to be deployed in the volatile context caused by COVID-19, which is why a number of governments across the world have expanded the provision and
coverage of social protection schemes using this specific mechanism. However, the majority of the cash transfer measures implemented are time-bound and temporary and might not be the appropriate tool to provide the long-term economic relief necessary to vulnerable households. As illustrated in Figure 34, such mechanisms typically lasted one to three months, with only 16% of the programmes implemented as a result of the pandemic lasting longer than three months.43 Going forward, an innovative approach to addressing the uncertain nature of recessions could be to introduce cash stimulus payments which would be “automatically triggered” by a deterioration in economic conditions, preventing administrative lag and indecision.44
Comparing the size of selected economies' 2009-2020 fiscal stimulus packages, as share of economy GDP
F I G U R E 3 2
Source
Policy Tracker 12 June 2020, International Monetary
Fund (IMF); International Institute of Labour Studies; and
Transatlantic Institute.
Note
Values include 'above-the-line' measures but exclude 'below-
the-line measures' (equity injections, loans, asset purchase or
debt assumptions, or guarantees).
Fiscal stimulus as a % of GDP (%)
United States
Japan
Germany
Australia
Brazil
United Kingdom
Canada
South Africa
China
Italy
Korea
Argentina
France
Indonesia
Saudi Arabia
Russia
India
Mexico
Turkey
2020 value Decreased compared to 2009 Increased compared to 2009
0 2 4 6 8 10 12 14

The Future of Jobs 42
Social protection measures introduced by governments, by type of instrument and function
F I G U R E 3 3
Source
International Labour Organization (ILO) Social Protection
Monitor, July 2020.
Note
The values represent the distribution of 1,218 measures
introduced across 203 countries.
A. Function
B. Instrument
0 5 10 15 20
Introducing benefits for poor or vulnerable populations
Introducing benefits for workers or their dependants
Introducing subsidies to, deferring or reducing the cost of necessities
Increasing benefit level
Introducing subsidies to wages
Extending coverage of existing benefits
Deferring, reducing or waiving special contribution
Improving delivery mechanisms and capacity
Increasing resources or budgetary allocation
Relaxing or suspending elegibility criteria or conditionality
Share of in-country measures (%)
3.9
5.4
5.6
5.7
6.7
7.2
7.9
9.4
14.7
14.9
Another set of key policies has been focused on preserving the retention of staff by businesses through wage compensation schemes as well as tax or payment deferrals. Figure 35 presents the unprecedented use of job-retention schemes across several countries—notably New Zealand, France, Switzerland and the United Kingdom—affecting close to 60 million workers across OECD countries.45
While these measures have been broadly welcomed and have been effective at buffering unemployment, such schemes obscure the possible true impact of COVID-19 on the labour market. It is only as wage support and replacement mechanisms begin to expire that some of the damage to the labour market will be revealed.
While these temporary measures provide a lifeline to workers during this unprecedented crisis and ahead of a future recovery, the need for an urgent response should be transformed into an impulse to enhance permanent social protection mechanisms. New data from the OECD shows the projected employment growth of a number of economies in 2019–2020 if countries experience a potential second wave of COVID-19 infections. Figure 36 plots that possible new reality against the Social Resilience pillar of the World Economic Forum’s Global Social Mobility Index. The pillar score summarizes in one measure the level of social protection available in an economy alongside the presence of inclusive institutions.
Special allowance or grant
Income and job protection
Several functions
Unemployment leave
Health and healthcare
Housing and access to basic services
Food and nutrition
Children and families
Pension
Sick leave
Access to education
Maternity and parental leave
Employment injury compensation
Share of in-country measures (%)
15.5
13.3
12.5
11.3
9.8
9.4
9.2
7.8
6.2
3.5
0.7
0.5
0.2
0 5 10 15 20

The Future of Jobs 43
Duration of cash-transfer programmes in months
Participation in job-retention schemes
F I G U R E 3 4
F I G U R E 3 5
Source
Gentilini, et al, 2020.
Source
OECD Economic Outlook June 2020, based
on national sources.
#$
%&'
1 month
20%
1-2 months
14%
3 months
52%
12 months
2%
3-6 months
14%
0 20 40 60 80
Share of dependent employees (%)
New Zealand
France
Switzerland
Italy
Austria
Portugal
United Kingdom
Germany
Luxembourg
Netherlands
Australia
Belgium
Ireland
Czech Republic
Spain
Canada
Sweden
Denmark
Norway
Finland
Latvia
United States

The Future of Jobs 44
Countries that score high have well-developed social safety nets and protection as well as high levels of public service efficiency. Countries in the bottom-left quadrant of Figure 36 have low social resilience scores and at the same time are projected to experience lower economic disruption under this scenario. Countries in that quadrant include Mexico and the Republic of Korea. Those in the top-right quadrant can expect to see high disruption to employment but also have a high social resilience
score. They include Ireland, the United Kingdom and Spain. Countries in the bottom-right quadrant can expect to see high labour market disruption and also have a low social resilience score. Those countries include Colombia, Turkey and the United States. In summary, scenarios such as these suggest that some economies will experience a ‘double-hit’ scenario—relatively low coverage of social protection mechanisms in place to protect workers heavily displaced from the labour market.
Projected impact of COVID-19 on employment growth against an index of social resiliance, OECD countries
F I G U R E 3 6
Source
OECD Economic Outlook 2020, OECD, and Social Mobility
Index, World Economic Forum.
Note
Forecasts for Q4 2020 produced by the OECD assuming two
waves of COVID-19, namely a "double hit" scenario.
So
cia
l R
esilie
nc
e s
co
re f
rom
th
e G
lob
al S
oc
ial M
ob
ilit
y I
nd
ex 2
020
-30 -6 -9 -15-12
30
20
40
50
60
70
80
90
100
Employment growth (2019-2020 % change based on COVID-19 “double-hit” forecasts)
United States
Turkey
Mexico
Korea, Rep.Italy
Latvia
Lithuania
Colombia
Ireland
Portugal
Spain
Slovak Republic
Greece
Israel
Hungary
United KingdomNetherlands
DenmarkFinland
Belgium
Austria
Germany
Japan
Slovenia
Norway
Sweden
France
Canada
PolandEstonia
Iceland
New Zealand
Australia
Czech Republic
Switzerland
The political will to expand social protection has often been deadlocked, driven by concerns about the long-term impact on labour market participation, the efficiency of current tools and the capacity of government to deliver these public services with the adequate efficiency at scale. Given the large-scale disruption to workers from both the pandemic-driven recession and the accelerated pace of technology adoption, the question cannot be ‘if’ but should be ‘how’ to expand some of these essential protections.
Research shows that wages have, for some time, been misaligned from productivity and that wage level can be as much determined by the structure of local labour markets or disadvantaged by race or gender as they are by workers receiving a reasonable return on their skills and productivity.46
When it comes to preserving worker’s ability to save, governments can cap the erosion of wages, ensuring that all workers are able to gain a living
wage. The economic strain on families subsisting on low wages is not conducive to maximizing long-term human potential and leaves workers vulnerable to disruptions. Legislating against bias on the basis of gender, race or other characteristics protects the connection between employment, wages and the skills and capabilities of workers—guaranteeing that the talents of all parts of the population are used and can drive further growth and prosperity in the economy.
Past research has shown that long-term displacement from the labour market has a persistent, negative effect on workers.47 When social protection mechanisms are lacking, individuals in the midst of a career transition are forced to maintain a dual focus—on the one hand trying to preserve their quality of life and keep poverty and potential destitution at bay, and on the other hand attempting to successfully transition to a new role.

The Future of Jobs 45
For those with historically low wages, it is much more likely that basic needs such as health, nutrition and access to shelter become paramount and overwhelming concerns during such periods detract from productive and successful transitions to new roles. An individual’s capacity to manage this labour market transition can thus be undermined, leading to rushed and potentially sub-par redeployment and re-employment.
While some social protection policies are remedial and short term, not all support can be temporary in nature. When it comes to long-term sick leave, disability leave or long-term unemployment, social protection becomes a fundamental pillar of the support for its citizens on an ongoing basis. For the purposes of this report we have focused on supporting the bounceback of those who are or will be unemployed in the short term due to the recession and technological change. To expand safety nets in the medium to long term, societies will need to rebalance current public spending and consider expanding fiscal room through effective and appropriate taxation.
Governments can proactively shape the preconditions for effective labour market transitions and worker productivity by strengthening the link between skills, wages and employment. This can be achieved through policies that fund reskilling and upskilling of workers who are mid-way through their career and will need further skills to secure employment in the future of work, policies which ensure that workers are able to create cash reserves during periods of employment, and policies which legislate against bias in hiring, firing and setting wages. Reskilling and upskilling policies that have been utilized to date span the conditionality of unemployment benefits on taking up new re-skilling and up-skilling, providing wage subsidies to companies which extend reskilling and upskilling to workers, providing online learning accounts to citizens, and starting to fund online learning in addition to university degrees, TVET and school tuition.
A number of countries have in recent years developed innovative funding mechanisms to finance reskilling of workers. Singapore recently complemented its pioneering Skills Future Initiative through the deployment of Enhanced Training Support Package (ETSP)48 to support workers and organizations in sustaining investment in reskilling and upskilling during COVID-19. The package includes a significant increase in funding for Absentee Payroll Support and Course Fee Support among industries severely hit by the pandemic. At the end of 2019, France created an individual skills account with an integrated mobile application dedicated to vocational training and lifelong learning. Under the “moncompteformation.gouv.fr” (“MySkillsAccount”) scheme, 28 million eligible full- and part-time workers will receive €500 annually directly into their skills account to spend on upskilling and continuous learning, with low-skilled workers and those with special needs receiving up to €800 annually, capped at a total of €5,000 and €8,000, respectively. The Danish Ministry of Employment has introduced a number of measures aimed at providing additional opportunities for upskilling and job-focused education aimed at workers furloughed following as a consequence of the economic impact of the pandemic. First, both skilled and unskilled workers who pursue a vocational education are being provided with 110% of their usual unemployment benefits. Additionally, the Danish government expanded the scope of its current apprenticeship scheme, at the same time as prolonging its job rotation scheme, making it possible for more unskilled workers to have access to upskilling and reskilling opportunities.
From deploying human resources
to leveraging human potential
3.2
As changes to work accelerate, employers are bearing witness to a fundamental shift away from the linear transitions made by workers in previous points of history from school, into specialized training, into work and then along a progressive career ladder, defined by increasing responsibility within an established occupation structure. In today’s labour market, workers pivot between professions with significantly different skill sets, and navigate mid-career job transitions accompanied by substantial reskilling and upskilling. Those pivots are as important to the success of firms as they are to the prosperity
of workers. Without such pivots skills shortages will remain endemic and a scarcity of adequately skilled individuals to fill the jobs of tomorrow will lead to a persistent productivity lag.
The route to unlocking the value of human potential in tandem with profitability is to employ a ‘good jobs strategy', halting the erosion of wages, making work meaningful and purposeful, expanding employees’ sense of growth and achievement, promoting and developing talent on the basis of merit and proactively designing against racial, gender or other biases.49

The Future of Jobs 46
Fundamental to this strategy are two inter-connected, ambitious priorities which, between them, have the power to pave the way to a better, more productive and more rewarding future of work: 1) increasing company oversight of strategic people metrics; 2) effective job transitions from declining to emerging roles through well-funded reskilling and upskilling mechanisms.
There is an emerging consensus among companies that long-term value is most effectively created by serving the interests of all stakeholders. Companies that hold themselves accountable will be both more viable and valuable in the long-term. To do so, companies need a series of new metrics which can, at the Board and C-suite level, make visible the impact companies have on key desirable outcomes to governance, planet, people and prosperity.50
In collaboration with the International Business Council (IBC) the World Economic Forum has defined a set of key metrics which can track how businesses are creating broader, long-term value through an investment in human and social capital. People are at the heart of all organizations as investors, workers, customers, suppliers, distributors and contractors. The well-being, productivity and prosperity of individuals is at the core of all successful economies and firms. Human ingenuity is at the core of companies’ competitive advantage and no firm can prosper for long if it proves damaging to the social fabric around it. In the framework outlined within the paper Measuring
Stakeholder Capitalism, the Forum in collaboration with the IBC have identified a set of key measures that track: the representation of employees by age group, gender, ethnic and racial category and other markers of diversity; the pay equity between those different groups; the wage levels paid within the organization as a ratio to local minimum wage and the ratio of CEO pay to median employee pay; hours of training undertaken by employees; and average training investment by company. In addition to these core measures the report outlines basic standards of good work such as ensuring health and safety, as well as eliminating child and forced labour.51
To complement such key oversight metrics, businesses can benefit from more granular operational metrics which quantify the human capital—the skills and capabilities of employees—within an organization. Currently, business leaders lack the tools to adequately illustrate, diagnose and strategize for talent capacity. While businesses and economies have extensive systems to account for monetary assets at their disposals, there is a lag in establishing the value of human skills and capabilities. The losses incurred by talent attrition as well as the gains of acquiring individuals with exceptional skills or of developing talent pools through strong reskilling and upskilling programmes remain unrecorded and unobserved.
Companies without the tools to account for the value of skills and capabilities lack oversight of the depreciation or appreciation of one of their key intangible assets—the capabilities of their workforce. Without that oversight, setting the right investment strategy for reskilling and upskilling becomes a challenging feat. A recent World Economic Forum report, authored in collaboration with Willis Towers Watson, Human Capital as
an Asset: An accounting framework for the
new world of work, identifies additional areas of measurement that can start to quantify the value of human capital within an organization.52 In the outlined framework are the labour market value of the aggregate talent in an organization, the value added through additional reskilling and upskilling into job-relevant skills and the depreciation of those assets through gradual skills redundancy and a decrease in workforce engagement. The approaches to undertaking this quantification are in their infancy and there is need for further efforts to expand such efforts.
Frameworks to track the value of human capital in company balance sheets, to determine a re-investment strategy for human capital through redeployment, reskilling and upskilling, as well as to account for return on investment remain nascent. It is therefore not surprising that few Future of Jobs Survey respondents expected a return on investment from reskilling and upskilling workers within the first three months after employees complete reskilling, and that 17% of businesses remain unsure about the return on investment from reskilling. Survey responses also indicate that companies continue to struggle to quantify the scale of reskilling and upskilling investment that their companies currently make.
The Future of Jobs Survey signals that companies hope to internally redeploy 50% of workers displaced by technological automation and augmentation, but cross-cutting solutions and efficiencies for funding job transitions remain under-explored. Amidst the accelerated arrival of the automation and augmentation of work, as well as the job destruction brought about by COVID-19, businesses require a fast, agile and coherent workforce investment strategy. In collaboration with the leaders engaged with the New Economy and Society work at the World Economic Forum we have been able to identify a set of key elements of a successful workforce investment strategy. They include identifying workers who are being displaced from their roles; establishing appropriate internal committees to manage the displacement; funding reskilling and upskilling either wholly out of company budgets or by tapping into government funding; motivating employee engagement in this process; and tracking the long-term success of such transitions.

The Future of Jobs 47
Investment into employee reskilling and upskillingF I G U R E 3 7
Source
Future of Jobs Survey 2020, World Economic Forum.
Company leaders can ensure the success of workforce strategies by directing the transition of employees with empathy, within the rule of law, in line with company values and culture, by ensuring outcomes are equitable, and by directing learning to effective resources and meaningful curricula. A range of motivating factors can fuel reskilling and upskilling uptake—connected broadly to employees’ sense of purpose, meaning, growth and achievement. Employers can signal the market value of new online-first credentials by opening up role opportunities to new cohorts of workers who have completed mid-career reskilling and upskilling. Employers can make broader use of hiring on the basis of potential rather than current skill sets and match potential-based hiring with relevant training. The data featured in this
report has shown that a number of emerging roles are already staffed by individuals who first transition into those positions and then ‘grow into’ the full skill set required. As an overarching principle, business leaders need to place equity and diversity at the heart of their talent ecosystem, ensuring that employees believe in their capacity to prosper based on merit.
Expanding effective workforce strategies requires strong capabilities in real time, as well as dynamic mapping of the types of opportunities that remain available to workers displaced by the COVID-19 pandemic and the fast pace of automation. A set of technology companies which are broadly classed as EdTech and reskilling services companies can support the
Within 1 month
2.3%
Within 1–3 months
10.8%
Within 3–6 months
24%
Within 6–12 months
28.7%
More than 1 year
17.6%
Difficult to assess
16.6%
0 10 20 30 40 50 60 70 80
Centralized budget
Budget per department
Use free learning to minimize cost
Budget per worker
Tap into government funding
Share costs with other companies in your industry
Share costs with other companies outside your industry
Share of companies surveyed (%)
A. Perceived time period to receive return on investment
B. Source of funding

The Future of Jobs 48
process of redeploying workers into the jobs of tomorrow.53 Such companies utilize advanced data and AI capabilities matched with user interfaces that guide workers and managers through to discovering possible pathways into new job roles. The data featured in sections 2.2 and 2.3 already indicates the types of insights that can be accessed through such services—dynamically matching opportunities to workers, identifying possible job destinations and singling out bridging skill sets. Companies with such capabilities can become part of a new infrastructure for the future of work which powers worker transitions from displaced to emerging roles. The efforts of matching workers to possible opportunities can be complemented by the delivery of reskilling and upskilling at scale through educational technology services.
Finally, the necessary reskilling and upskilling demands substantial attention and broad-base systemic solutions to funding the job transitions which the current labour market context requires at an unprecedented pace and scale. As demonstrated in Figure 37, the Future of Jobs survey shows that 66% of businesses believe they can see return on investment within a year of funding reskilling for the average employee. It remains concerning, however, that the survey also reveals that only 21% of businesses report being able to make use of public funds, and merely 12% and 8% collaborate across companies and within industries, respectively. Previous estimates have shown that businesses can independently reskill some employees with positive return on investment; however, the employees who are most disrupted and with the largest need of reskilling are likely to need a larger investment.54
This report calls for renewed efforts to understand the division of spend on reskilling and upskilling workers between business and the public sector. A typical return on investment framework considers the costs on the side of both businesses and governments under various scenarios—such as the extent of training costs, the cost of employees taking time out of work, and the need to pay unemployment benefits. On the benefits of reskilling and upskilling workers, a calculation takes into account avoided severance and hiring costs borne by business, the avoided lag in productivity when onboarding new employees and the additional productivity of employees who feel supported and are thriving. Additional benefits to governments include the income tax dividends of citizens who are employed as opposed to out of work.
A number of companies have in recent years experimented with a range of approaches to reskilling and upskilling. The role of business in such a programme can be to directly drive such efforts and define the approach to reskilling and upskilling. In other cases, businesses can be in a supporting role, agreeing to redefine their approach to hiring and accept candidates who have been reskilled through new types of
credentials. In one example, Telecommunication company AT&T has worked with Udacity to create 50 training programmes designed to prepare individuals for the technical careers of the future which are distinctively relevant to AT&Ts future workforce and digital strategies.55
In particular, these strategies include courses focused on skills in web and mobile development, data science and machine learning. To date AT&T has spent over $200 million per year to design this internal training curriculum, known as T University, and has already achieved over 4,200 career pivots with 70% of jobs filled internally by those that were reskilled. In a similar effort, Shell launched an online education effort titled the Shell.ai Development Program, which focuses on teaching artificial intelligence skills to its employees.56 Both programmes have created customized versions of Udacity’s Nanodegree programs to reskill and upskill employees with hard-to-source, in-demand skill sets.
An additional example is provided by Coursera for Government.57 At the start of the COVID-19 pandemic, a number of countries experienced a surge in unemployment. Governments in over 100 countries provided access to the platform to citizens looking to gain new skills and credentials to re-enter the workforce. The programmes connected graduates directly with local companies who agreed to accept those credentials as the basis of hiring decisions. Since April, this programme has reached 650,000 unemployed workers who enrolled in over 2.5 million courses that provide the skills needed for fast-growing jobs in IT, healthcare and business. In one example, Costa Rica’s government has worked with local employers across the country to identify current job openings and skill demand and tailored the programme offering to that local demand. Similar structures of collaboration have been established across local government in the United States, specifically across a network of job centres.

The Future of Jobs October 2020
The Future of Jobs 49
The ongoing disruption to labour markets from
the Fourth Industrial Revolution has been further
complicated—and in some cases accelerated—by
the onset of the pandemic-related recession of 2020.
The most relevant question to businesses,
governments and individuals is not to what extent
automation and augmentation of human labour
will affect current employment numbers, but under
what conditions the global labour market can be
supported towards a new equilibrium in the division
of labour between human workers, robots and
algorithms. The technological disruptions which were
in their infancy in previous editions of the Future of
Jobs Report are currently accelerated and amplified alongside the COVID-19 recession as evidenced by findings from the 2020 Future of Jobs Survey. While it remains difficult to establish the long-term consequences of the pandemic on the demand for products and services in severely affected industries, supporting workers during this transition will protect one of the key assets of any company and country—its human capital.
In this new context, for the first time in recent years, job creation is starting to lag behind job destruction—and this factor is poised to affect disadvantaged workers with particular ferocity. Businesses are set to accelerate the digitalization of work processes, learning, expansion of remote work, as well as the automation of tasks within an organization. This report identifies one result of the pandemic as an increasing urgency to address the disruption underway both by supporting and retraining displaced workers and by monitoring the emergence of new opportunities in the labour market.
As unemployment figures rise, it is of increasing urgency to expand social protection, including support for retraining to displaced and at-risk workers as they navigate the paths towards new opportunities in the labour market and towards the ‘jobs of tomorrow’. Addressing the current challenges posed by COVID-19, in tandem with the disruption posed by technological change, requires renewed public service innovation for the benefit of affected workers everywhere. It also demands that leaders embrace stakeholder capitalism and pay closer attention to the long-dividends of investing in human and social capital. The current moment provides an opportunity for leaders in business, government, and public policy to focus common efforts on improving the access and delivery of reskilling and upskilling, motivating redeployment and reemployment, as well as signalling the market value of learning that can be delivered through education technology at scale.
To address the substantial challenges facing the labour market today, governments must pursue a holistic approach, creating active linkages and coordination between education providers, skills, workers and employers, and ensuring effective collaboration between employment agencies, regional governments and national governments.
Such efforts can be strengthened by multistakeholder collaboration between companies looking to support their workforce; governments willing to fund reskilling and the localization of mid-career education programmes; professional services firms and technology firms that can map potential job transitions or provide reskilling services; labour unions aware of the impact of those transitions on the well-being of workers; and community organizations that can give visibility to the efficacy of new legislation and provide early feedback on its design.
Conclusion

The Future of Jobs 50
1. World Economic Forum, 2020a.
2. Baldwin, 2019.
3. Acemoglu, et al, 2020.
4. World Economic Forum, 2018, DeVries, et al, 2020, and Frey and Osborne, 2013.
5. Ding and Saenz Molina, 2020.
6. Hale, et al, 2020.
7. Ibid.
8. YouGov, 2020.
9. OECD, 2020a.
10. OECD, 2020a.
11. Ibid.
12. OECD, 2020b.
13. Delfs and Colitt, 2020, and Migliaccio, et al, 2020.
14. Ravn and Sterk, 2017, and Farber, 2011.
15. ILO, 2020.
16. COVID Inequality Project, https://sites.google.com/view/covidinequality/.
17. Author’s calculations based on data in Dingel, et al, 2020.
18. De Vries, et al, 2020.
19. Author’s calculations based on data in Dingel, et al, 2020.
20. Zhao, 2020.
21. Job-seekers searching for roles on the LinkedIn platform using built-in remote job filters, normalized against changes to all job searches.
22. The share of job postings, which use number of keywords (i.e. ‘remote work’, ‘work from home’, home office’) in 10 different languages, as well as built-in remote job filters.
23. LinkedIn analysed data from job search behaviour and job postings of full-time roles and its changes due to COVID-19 during the period of 11 February to 1 July. Analysts utilized the ‘remote work’ filter and a set of searchable key words such as ‘remote work’, ‘work from home’, ‘homeoffice’ in 10 different languages. The index is the start of the analysis period, 11 July. Results are normalized for platform growth as well as in the case of job searchers against the volume of job searches. The daily figures represent a seven-day smoothed proportion.
24. Kimbrough, 2020.
25. Mongey, et al, 2020.
26. World Bank, 2020.
Notes

The Future of Jobs 51
27. Cook, et al, 2019.
28. ADP provides human capital management services to significant numbers of US companies. Its data can therefore act as a reliable proxy for changes to the American labour market.
29. Workers are considered to have dropped out of employment if they disappear from the ADP database. While some of those variations can reflect worker movements to companies which do not use ADP’s services, the scale of that effect is not typically as large; therefore, on the basis of past trends we can deduce that what we are reporting are reach changes to employment.
30. Data from FutureFit AI combines over 50 data sources on workforce demand and supply, translating a range of taxonomies of jobs and skills. Supply-side sources include over 350 million talent profiles listing 30,000 skills clusters, 80,000 job titles, hundreds of industries, thousands of learning opportunities and millions of companies worldwide. The data set used comes from worker profile information sourced from resumes and online professional profiles. It also includes key data points for the analysis—such as employers, start and end dates, job role, industries and employment sequence, among others.
31. This metric covers approximately 300,000 young professionals in the United States, defined here as those who have graduated with an upper secondary or tertiary (undergraduate) degree no earlier than 2008, and have held 15 or less positions and have not been in the labour market for longer than 20 years. These professionals have, on average, eight years of work experience after or during a student’s first degree. The average work experience tenure following graduation is 6.7 years. The overwhelming majority of this sample are in their first working decade.
32. Agopsowicz, 2019.
33. See, for example: Arntz, Melanie, Terry Gregory and Ulrich Zierahn, The risk of
automation for jobs in OECD countries: a comparative analysis, OECD Social, Employment and Migration Working Papers No 189, Organization for Economic Cooperation and Development (OECD), 2016; McKinsey Global Institute, A
Future That Works: Automation, Employment, and Productivity, McKinsey Global Institute (MGI), 2017; PwC, Will robots really steal our jobs? An international
analysis of the potential long term impact of automation, 2018. For a range of relevant additional considerations, see: van der Zande, Jochem, et al., The
Substitution of Labor: From technological feasibility to other factors influencing
job automation, Innovative Internet: Report 5, Stockholm School of Economics Institute for Research, 2018.
34. Ding and Saenz Molina, 2020.
35. World Economic Forum, 2020a.
36. For more details on how the clusters are computed please refer to World Economic Forum, 2020a.
37. For an in-depth analysis of emerging jobs please see World Economic Forum, 2020a.
38. According to Coursera data from individuals completing reskilling and upskilling on its platform, working towards a new skill in Cloud Computing could take on average 106 full calendrical days; in Content, 24 days; in Data and AI professions, 60; in Engineering, 77 days; in Marketing, 39; People and Culture, 36; Sales. 37; and in Product Development professions, 44. We take the average month to have 21 working days.
39. Sweetland, 1996.
40. Hsieh, et al., 2019.
41. IMF, 2020.

The Future of Jobs 52
42. Atlantic Council, 2020.
43. Gentilini, et al, 2020.
44. Economic Security Project, 2020.
45. OECD, 2020b.
46. Cahuc, et al, 2006, and Carroll, et al, 2016.
47. Deelen, 2018.
48. “Skills Future Enhanced Training Support Package”, https://www.enterprisejobskills.sg/content/upgrade-skills/enhanced-training-support-for-SME.html.
49. Ton, 2014, and https://goodjobsinstitute.org/good-jobs-scorecard/.
50. For more details on the overall framework please see Word Economic Forum, 2020b.
51. For the complete report, see https://www.weforum.org/reports/measuring-stakeholder-capitalism-towards-common-metrics-and-consistent-reporting-of-sustainable-value-creation.
52. For the complete report, see https://www.weforum.org/reports/human-capital-as-an-asset-an-accounting-framework-to-reset-the-value-of-talent-in-the-new-world-of-work.
53. World Economic Forum, 2020c.
54. World Economic Forum, 2019.
55. For details, see https://blog.udacity.com/2018/09/udacity-and-att-join-forces-to-train-workers-for-the-jobs-of-tomorrow.html.
56. For details, see https://www.shell.com/energy-and-innovation/digitalisation/digital-technologies/shell-ai/shell-ai-residency-programme.html.
57. For details, see https://www.coursera.org/government.

The Future of Jobs 53
Acemoglu, D. and P. Restrepo, Robots and Jobs: Evidence from US Labor Markets, NBER Working Paper No. 23285, National Bureau of Economic Research, 2017.
Adams-Prassl, A., T. Boneva, C. Rauh and M. Golin, Inequality in the Impact of the Coronavirus Shock: Evidence from Real Time Surveys, IZA DP No. 13183, IZA Institute of Labor Economics, 2020.
Agopsowicz, A., “The Recession Roadblock: The Long-term Career Consequences of Graduating into a Downturn”, RBC Thought Leadership Blog, 20 November 2019, https://thoughtleadership.rbc.com/the-recession-roadblock-the-long-term-career-consequences-of-graduating-into-a-downturn/.
Alberola, E., Y. Arslan, G. Cheng and R. Moessner, The fiscal response to the Covid-19 crisis in advanced and emerging market economies, BIS Bulletin No 23, Bank for International Settlements, 2020.
Atlantic Council, How does the G20 COVID-19 fiscal response compare to the Global Financial Crisis?, 26 April 2020.
Baldwin, R., The Globotics Upheaval: Globalisation, Robotics and the Future of Work, Oxford University Press, 2019.
Brussevich, M., E. Dabla-Norris, and S. Khalid, Who will Bear the Brunt of Lockdown Policies? Evidence from Tele-workability Measures Across Countries, IMF Working Paper, June 2020 (https://www.imf.org/en/Publications/WP/Issues/2020/06/12/Who-will-Bear-the-Brunt-of-Lockdown-Policies-Evidence-from-Tele-workability-Measures-Across-49479).
Cahuc, P., et al, “Wage Bargaining with On-The Job Search: Theory and Evidence”, Econometrica, vol. 24, no. 2, 2006, pp. 323–364.
Cook, K., D. Pinder, S. Stewart, A. Uchegbu and J. Wright, The Future of Work in Black America, McKinsey & Company, 4 October 2019.
COVID Inequality Project, https://sites.google.com/view/covidinequality/.
“Covid-19 Public Monitor”, YouGov, https://yougov.co.uk/topics/international/articles-reports/2020/03/17/YouGov-international-COVID-19-tracker, retrieved July 2020.
Deelen, A., M. de Graaf-Zijl and W. van den Berge, “Labour market effects of job displacement for prime-age and older workers”, IZA Journal of Labour Economics, vol. 7, no. 1, 2018, pp. 1-30.
Delfs, A. and R. Colitt, Germany Earmarks $12 Billion More to Extend Crisis Job Support, Bloomberg, 25 August, 2020, https://www.bloomberg.com/news/articles/2020-08-25/germany-closes-in-on-agreement-to-extend-job-preserving-aid.
De Vries, G., et al, The Rise of Robots and the Fall of Routines Jobs, ADB Working Paper Series no. 619, Asia Development Bank, 2020.
Ding, L. and J. Saenz Molina, Forced Automation by COVID-19? Early Trends from Current Population Survey Data, Federal Reserve Bank of Philadelphia, September 2020.
Dingel, J.I. and B. Neiman, How Many Jobs Can Be Done at Home?, NBER Working Paper No. 26948, National Bureau of Economic Research, 2020.
Farber, H., Job Loss in the Great Recession: Historical Perspective from the displaced workers Survey (1984-2010), NBER Working Paper no. 17040, National Bureau of Economic Research, 2011, https://www.nber.org/papers/w17040.pdf.
Frey, C. and M. Osborne, The Future of Employment: How Susceptible Are Jobs to Computerisation, Oxford University Press, 2013.
Garrote Sanchez, D., N. Gomez Parra, C. Ozden, B. Rijkers, M. Viollaz and H. Winkler, Who on Earth Can Work from Home?, World Bank Policy Research Working Paper No. 9347, World Bank, 2020.
Gentilini, U., M. Almenfi, I. Orton and P. Dale, Social Protection and Jobs Responses to COVID-19 : A Real-Time Review of Country Measures, 10 July 2020 Update, Open Knowledge Repository, World Bank, 2020.
Hale, T., S. Webster, A. Petherick, T. Phillips and B. Kira, Oxford COVID-19 Government Response Tracker, Blavatnik School of Government, University of Oxford, 2020.
Henrekson, M., How Labor Market Institutions Affect Job Creation and Productivity Growth, IZA World of Labor, 2020.
References

The Future of Jobs 54
Hsieh, Chang-Tai, et al, “The Allocation of Talent and Us Economic Growth”, Econometrica, vol. 87, no. 5, 2019, pp. 1439–1474.
International Labour Organization (ILO), ILO Monitor: COVID-19 and the World of Work, Second Edition, Updated estimates and analysis, 7 April 2020, https://www.ilo.org/wcmsp5/groups/public/---dgreports/---dcomm/documents/briefingnote/wcms_740877.pdf.
International Monetary Fund (IMF), Fiscal Monitor Database of Country Fiscal Measures in Response to the COVID-19 Pandemic, June 2020 Update, 2020.
Kimbrough, K., “Global hiring update: hiring beginning to stabilize, worker confidence is mixed”, LinkedIn, 18 May 2020, https://www.linkedin.com/pulse/global-hiring-update-beginning-stabilize-worker-mixed-karin-kimbrough/.
Migliaccio, A., A. Brambilla and M. Ermakova, “Italy Extends Worker, Business Protection to Avoid Cliff Edge”, Bloomberg, 7 August 2020, https://www.bloomberg.com/news/articles/2020-08-07/italy-extends-worker-business-protection-to-avoid-cliff-edge.
Mongey, S., L. Pilossoph and A. Weinberg, Which Workers Bear the Burden of Social Distancing Policies?, NBER Working Paper No. 27085, National Bureau of Economic Research, 2020.
Organization for Economic Co-operation and Development (OECD), OECD Data: Harmonised unemployment rate (HUR), January-June 2020, 2020a, https://data.oecd.org/unemp/harmonised-unemployment-rate-hur.htm.
———— , OECD Employment Outlook 2020: Worker Security and the COVID-19 Crisis, 2020b, https://www.oecd-ilibrary.org/employment/oecd-employment-outlook-2020_1686c758-en.
“Open Letter from Economists on Automatic Triggers for Cash Stimulus Payments”, Economic Security Project, 2020, https://www.economicsecurityproject.org/wp-content/uploads/2020/07/emp_economists_letter.pdf.
Parolin, Z. and C. Wimer, Forecasting Estimates of Poverty during the COVID-19 Crisis: Poverty Rates in the United States Could Reach Highest Levels in Over 50 Years, Center on Poverty & Social Policy at Columbia University, Poverty & Social Policy Brief Vol. 4, No. 6, 16 April 2020, https://www.povertycenter.columbia.edu/news-internal/coronavirus-forecasting-poverty-estimates.
Ravn, M. and V. Sterk, “Job uncertainty and deep recessions”, Journal of Monetary Economics, vol. 90, 2017, pp. 125-141.
Seron, C., et al, “Persistence Is Cultural: Professional Socialization and the
Reproduction of Sex Segregation”, Work and Occupations, vol. 43, no. 2, 2016, pp. 178–214.
Sweetland, S.R., “Human Capital Theory: Foundations of a Field of Inquiry”, Review of Educational Research, vol. 66, no. 3, 1996, pp. 341–59.
Ton, Z., The Good Jobs Strategy: How the Smartest Companies Invest in Employees to Lower Costs and Boost Profits, Houghton Mifflin Harcourt, 2014.
World Bank, Poverty and Shared Prosperity 2020: Reversals of Fortune, 2020, http://documents1.worldbank.org/curated/en/225881596202941026/pdf/Who-on-Earth-Can-Work-from-Home.pdf.
Word Economic Forum, The Future of Jobs Report 2018, 2018.
———— , Towards a Reskilling Revolution: Industry-Led Action for the Future of Work, 2019, https://www.weforum.org/whitepapers/towards-a-reskilling-revolution-industry-led-action-for-the-future-of-work.
———— , Jobs of Tomorrow: Mapping Opportunity in the New Economy, 2020a, https://www.weforum.org/reports/jobs-of-tomorrow-mapping-opportunity-in-the-new-economy.
———— , Measuring Stakeholder Capitalism: Towards Common Metrics and Consistent Reporting of Sustainable Value Creation, 2020b, https://www.weforum.org/reports/measuring-stakeholder-capitalism-towards-common-metrics-and-consistent-reporting-of-sustainable-value-creation.
———— , Markets of Tomorrow: Pathways to a new economy, 2020c.
———— , Global Social Mobility Index 2020: why economies benefit from fixing inequality, 2020d, https://www.weforum.org/reports/global-social-mobility-index-2020-why-economies-benefit-from-fixing-inequality.
Zhao, D., Work from Home: Has the Future of Work Arrived?, Glassdoor Economic Research, 18 March 2020, https://www.glassdoor.com/research/working-from-home/.

The Future of Jobs October 2020
The Future of Jobs 55
Part 2 Country and Industry Profiles Part 2 of the report presents data findings through both an industry and country lens, with the aim of providing specific practical information to decision-makers and experts from academia, business, government and civil society. Complementing the cross-industry and cross-country analysis of results in Part 1, this section provides deeper granularity for a given industry and country through dedicated Industry Profiles and Country Profiles. Profiles are intended to provide interested companies and policy-makers with the opportunity to benchmark their organization against the range of expectations prevalent in their industry and/or country. This User’s Guide provides an overview of the information contained in the various Industry Profiles and Country Profiles and its appropriate interpretation.

The Future of Jobs October 2020
The Future of Jobs 56
User’s GuideHow to Read the Country
and Industry Profiles
Country Profiles
Education & skills worst best
Digital skills among active population*WEIGHTED AVERAGE 2019-2020
Attainment of basic education2018
Business relevance of basic education*WEIGHTED AVERAGE 2019-2020
Attainment of advanced education2018
Business relevance of tertiary education*WEIGHTED AVERAGE 2019-2020
Supply of business-relevant skills*WEIGHTED AVERAGE 2019-2020
Unempl. rate among workers with adv. educ.2017
Unempl. rate among workers with basic educ.2017
Share of youth not in empl., educ. or training2020
Jobs & work worst best
Labour force participation2019
Vulnerable employment2020
Working cond. impact of gig economy*2020
Unemployment rate2019
* The figures presented for these indicators are rebased 0-100% progress scores, with 0 being the worst performance, and 100 being the best performance.
Impact of COVID-19 on companies’ strategyShare of companies surveyed looking to adopt this strategy as a result of COVID-19
Provide more opportunities to work remotely89.6%
Accelerate the digitalization of work processes (e.g. use of digital tools, videoconferencing)
77.1%Accelerate automation of tasks
47.9%Temporarily reassign workers to different tasks
45.8%Accelerate the implementation of upskilling/ reskilling programmes
39.6%
Emerging and redundant jobs rolesRole identified as being in high demand or increasingly redundant within theirorganization, ordered by frequency
EMERGING
1. Data Analysts and Scientists2. Digital Marketing and Strategy Specialists3. Business Development Professionals4. AI and Machine Learning Specialists5. Digital Transformation Specialists6. Process Automation Specialists7. Organisational Development Specialists8. General and Operations Managers9. Database and Network Professionals10. Big Data Specialists
REDUNDANT
1. Administrative and Executive Secretaries2. Data Entry Clerks3. Accounting, Bookkeeping and Payroll Clerks4. Postal Service Clerks5. Business Services and Administration Managers6. Mechanics and Machinery Repairers7. Accountants and Auditors8. Material-Recording and Stock-Keeping Clerks9. Client Information and Customer Service Workers10. Cashiers and Ticket Clerks
Technology adoptionShare of companies surveyed
Big data analytics
Internet of things and connected devices
Encryption and cyber security
Cloud computing
E-commerce and digital trade
Text, image and voice processing
Artificial intelligence (e.g. machine learning,neural networks, NLP)
Power storage and generation
Augmented and virtual reality
Distributed ledger technology (e.g. blockchain)
Emerging skillsSkills identified as being in high demand within their organization, ordered byfrequency
1. Analytical thinking and innovation2. Complex problem-solving3. Critical thinking and analysis4. Active learning and learning strategies5. Leadership and social influence6. Technology use, monitoring and control7. Creativity, originality and initiative8. Service orientation9. Resilience, stress tolerance and flexibility10. Emotional intelligence11. Technology design and programming12. Troubleshooting and user experience13. Quality control and safety awareness14. Systems analysis and evaluation15. Persuasion and negotiation
Country Profile
United Arab EmiratesWorking Age Population
8,112,7861 / 2
71.7%
82.9%
65.3%
51.8%
71%
70.5%
3.3%
0.8%
11.4%
85.2%
0.9%
32.5%
1.8%
Unemployment rate—
Unemployment, monthly—
Unemployment rate change—
Unemployment rate change, women—
Unemployment rate change, men—
89%
84%
84%
84%
81%
77%
76%
65%
57%
56%
1
3
5
2
4

The Future of Jobs 57
Current skills in focus of existing reskilling/upskillingprogrammesShare of companies surveyed identifying this skill as being in focus across theirreskilling or upskilling programs
1. Active learning and learning strategies2. Leadership and social influence3. Analytical thinking and innovation4. Quality control and safety awareness5. Complex problem-solving6. Critical thinking and analysis7. Management of personnel8. Creativity, originality and initiative9. Technology use, monitoring and control10. Service orientation
Responses to shifting skill needsShare of companies surveyed
Expect existing employees to pick up skills onthe job
Retrain existing employees
Hire new permanent staff with skills relevant tonew technologies
Look to automate the work
Outsource some business functions to externalcontractors
Hire new temporary staff with skills relevant tonew technologies
Strategic redundancies of staff who lack the skillsto use new technologies
Average reskilling needsShare of workforce of companies surveyed within this data
Projected use of training providersShare of companies surveyed
44.3% Internal learning and development
20.4% External online training
15.5% Private training providers
8.2% Public training providers
6.5% Private educational institutions
5.1% Public educational institutions
2 / 2
98%
86%
84%
78%
50%
49%
48%
DURATION OF RESKILLING
Less than 1 month30.6%
1 to 3 months21.4%
3 to 6 months18.6%
6 to 12 months13.1%
Over 1 year16.4%
6 7
9
8
Country Profiles
The Future of Jobs 58
1. Hard data contextual
indicators: Education & skills/
Jobs & work
This section aims to provide the reader with the latest available data from contextual indicators on education, skills, jobs and work. To allow for an understanding of the indicators of different nature and magnitude, the contextual indicators not expressed as a percentage have been normalized on a 0 to 100 scale, providing a ‘progress score’ for each indicator.
The total working age population is displayed in the top right corner of the page. The working-age population is the number of people aged 25 and over. In addition to using a minimum age threshold, certain countries also apply a maximum age limit.
Period: 2019 or latest available data (accessed September 2020).Source:ILOstat, International Labour Organization.
Education & skills
Digital skills among active population:
Score computed based on the average response of companies operating in this country to the Executive Opinion Survey question “In your country, to what extent does the active population possess sufficient digital skills (e.g. computer skills, basic coding, digital reading)?” [1 = not all; 7 = to a great extent]. Results converted to a 0-100 score called ‘progress score’, where 100 corresponds to the best possible frontier and 0 to the worst possible frontier.
Period: 2019–2020 weighted average or most recent period available. Source: World Economic Forum, Executive Opinion Survey 2020.
Attainment of basic education:
Percentage of the population aged 25 and over with at least a secondary education (includes ISCED 2-4). This data is cumulative, which means that those with tertiary education are counted in the figures.
Period: 2018 or latest available data (accessed September 2020).Source: UNESCO, Institute for Statistics, Education Indicators.
Business relevance of basic education:
Score computed based on the average response of companies operating in this country to the Executive Opinion Survey question “In your country, to what extent do secondary-education graduates possess the skills needed by businesses?" [1 = not all; 7 = to a great extent]. Results converted to
a 0-100 score called ‘progress score’, where 100 corresponds to the best possible frontier and 0 to the worst possible frontier.
Period: 2019–2020 weighted average or most recent period available. Source: World Economic Forum, Executive Opinion Survey 2020.
Attainment of advanced education:
Percentage of the population aged 25 and over with a tertiary education (includes ISCED 5-8).
Period: 2018 or latest available data (accessed September 2020).Source: UNESCO Institute for Statistics, Education Indicators.
Business relevance of tertiary education:
Score computed based on the average response of companies operating in this country to the Executive Opinion Survey question “In your country, to what extent do university graduates possess the skills needed by businesses?” [1 = not all; 7 = to a great extent]. Results converted to a 0-100 score called ‘progress score, where 100 corresponds to the best possible frontier and 0 to the worst possible frontier.
Period: 2019–2020 weighted average or most recent period available. Source: World Economic Forum, Executive Opinion Survey 2020.
Supply of business relevant skills:
Score computed based on the average response of companies operating in this country to the Executive Opinion Survey question “In your country, to what extent can companies find people with the skills required to fill their vacancies?” [1 = not at all; 7 = to a great extent]. Results converted to a 0-100 score called ‘progress score’, where 100 corresponds to the best possible frontier and 0 to the worst possible frontier.
Period: 2019–2020 weighted average or most recent period available. Source: World Economic Forum, Executive Opinion Survey 2020.
Unemployment rate among workers with basic
education:
The unemployment rate among workers with basic education is the number of persons who are unemployed as a percentage of the total number of employed and unemployed persons (i.e. the labour force). Data by level of education is provided on the highest level of education completed (includes ISCED 2-4).

The Future of Jobs 59
Period: 2019 or latest available data (accessed September 2020).Source: ILOstat, International Labour Organization.
Unemployment rate among workers with
advanced education:
The unemployment rate among workers with advanced education is the number of persons who are unemployed as a percentage of the total number of employed and unemployed persons (i.e. the labour force). Data by level of education is provided on the highest level of education completed. (includes ISCED 5-8).
Period: 2019 or latest available data (accessed September 2020).Source: ILOstat, International Labour Organization.
Share of youth not in employment, education or
training:
This is the share of youth not in employment, education or training (NEET). Values represented are ILO modelled estimates.
Please note that imputed observations are not based on national data, are subject to high uncertainty and should not be used for country comparisons or rankings. This indicator refers to the proportion of youth who are not in employment and not in education or training. For statistical purposes, youth are defined as persons between the ages of 15 and 24 years. For more information, refer to the indicator description and the ILO estimates and projections methodological note.
Period: November 2019.Source: ILOstat, International Labour Organization.
Jobs & work
Labour force participation:
The labour force participation rate is the proportion of the working-age population actively engaged in the labour market. The share of the population either in employment or looking for employment as a percentage of the total working age population.
Period: 2019 or latest available data (accessed September 2020).Source: ILOstat, International Labour Organization.
Vulnerable employment:
Vulnerable employment is defined as contributing family workers and own-account workers as a percentage of total employment.
Period: 2020 or latest available data (accessed
September 2020).Source: ILOstat, International Labour Organization.
Erosion of working conditions impacted by gig
economy:
Score computed based on the average response of companies operating in this country to the Executive Opinion Survey question “In your country, what is the impact of the online gig economy on working conditions (e.g., working time, remuneration, stability)?” [1= Significantly worsen working conditions; 7= Significantly improves working conditions]. Results converted to a 0-100 score called ‘progress score’, where 100 corresponds to the best possible frontier and 0 to the worst possible frontier.
Period: 2019–2020 weighted average or most recent period available. Source: World Economic Forum, Executive Opinion Survey 2020.
Unemployment rate (latest annual), latest
available quarterly), (latest monthly) :
The latest annual unemployment rate is calculated by expressing the number of unemployed persons as a percentage of the total number of persons in the labour force. The labour force (formerly known as the economically active population) is the sum of the number of persons employed and the number of persons unemployed. Thus, the measurement of the unemployment rate requires the measurement of both employment and unemployment. The unemployed comprise all persons of working age who were: a) without work during the reference period, i.e. were not in paid employment or self-employment; b) currently available for work, i.e. were available for paid employment or self-employment during the reference period; and c) seeking work, i.e. had taken specific steps in a specified recent period to seek paid employment or self-employment. Future starters, that is, persons who did not look for work but have a future labour market stake (made arrangements for a future job start) are also counted as unemployed, as well as participants in skills training or retraining schemes within employment promotion programmes, who on that basis, were “not in employment”, not “currently available” and did not “seek employment” because they had a job offer to start within a short subsequent period generally not greater than three months and persons “not in employment” who carried out activities to migrate abroad in order to work for pay or profit but who were still waiting for the opportunity to leave.
Period: Latest available data for each period (accessed September 2020).Source: ILOstat, International Labour Organization.

The Future of Jobs 60
Unemployment rate (2019-2020 Q2 change,
(2019-2020 Q2 change by gender)
These values represent the change in unemployment rate from 2019 year-end to Q2 2020, using the figures sourced above. We also featured these figures above broken down by gender.
Period: Latest available data for each period (accessed September 2020).Source: ILOstat, International Labour Organization.
2. Impact of COVID-19 on
companies strategies:
This bar chart shows the top five measures organizations are planning on implementing in response to the current COVID-19 outbreak as a share of survey respondents from companies operating in the country. It is based on the responses to the following question “In response to the current outbreak, which of the following measures has your company implemented or is planning to implement across the Organization?” from the Future of Jobs Survey.
Period: 2020. Source: World Economic Forum, Future of Jobs Survey 2020.
3. Technology adoption:
This bar chart represents the share of survey respondents from companies operating in the country who indicated that, by 2025, their company was “likely” or “very likely” (on a 5-point scale) to have adopted the stated technology as part of its growth strategy. For a more detailed discussion of each technology, please refer to the “Technological adoption” section in chapter 2 of the report.
Period: 2020. Source: World Economic Forum, Future of Jobs Survey 2020.
4. Emerging and redundant job
roles:
This table provides an overview of job roles expected to see an increase and decrease in demand across the country over the 2020–2025 period. The individual job roles listed are for illustrative purposes and report the job roles most frequently cited by survey respondents from companies operating in the country. Categorization of job roles is adapted from
the O*NET labour market information system (see Appendix A: Report Methodology for details).
Period: 2020.Source: World Economic Forum, Future of Jobs Survey 2020.
5. Emerging skills:
The table provides the list of skills the country respondents have selected as being increasingly important within their organization. It is based on the responses to the following question “Keeping in mind the tasks that will be performed by the key roles in your organization, in the next four years would you expect an increase or decrease in the use of the following skills by individuals?” from the Future of Jobs Survey. The skills are ranked by frequency and ranked from 1 to 15. The full list of skills is based on the O*NET classification and available in the appendix section of this report.
Period: 2020. Source: World Economic Forum, Future of Jobs Survey 2020.
6. Current skills in focus of
existing reskilling/upskilling
programmes:
The table provides the list of skills that are the focus of existing company reskilling/upskilling programmes for companies based in the country. It is based on the responses to the following question “Keeping in mind your current strategic direction, select the top 10 skill clusters that you are currently focusing your reskilling/upskilling efforts on?” from the Future of Jobs Survey. The skills are ranked from 1 to 15, with 1 being the skill for which most organizations offer training. The full list of skills is based on the O*NET classification and available in the appendix section of this report.
Period: 2020. Source: World Economic Forum, Future of Jobs Survey 2020.
7. Average reskilling needs:
The treemap shows the estimated time needed to reskill each share of the workforce that needs reskilling within the country. It is based on the responses to the following question “Bearing in mind the evolving skill demand, how long do you expect the reskilling/upskilling of your employees to take?”

The Future of Jobs October 2020
The Future of Jobs 61
from the Future of Jobs Survey. Respondents were
asked to provide as share of their workforce for each
duration of reskilling/upskilling.
Period: 2020.
Source: World Economic Forum, Future of Jobs
Survey 2020.
8. Response to shifting skill needs:
The bar chart shows the top strategies organizations
will undertake to address the shifting skills demand
as a share of survey responses from companies
operating in the country. It is based on the
responses to the following multiple-choice question
“How likely is your organization to undertake the
following strategies to address the shifting skills
demand?” from the Future of Jobs Survey.
Period: 2020.
Source: World Economic Forum, Future of Jobs
Survey 2020.
9. Projected use of training
providers:
The chart shows the projected proportion of the use
of different training providers for the future training
programmes of companies based in the country. It is
based on the responses to the following question “In
your future retraining programme, what proportion
of training provision will come from the options
mentioned below?” from the Future of Jobs Survey.
Period: 2020.
Source: World Economic Forum, Future of Jobs
Survey 2020.

The Future of Jobs 62
Industry Profiles
14%Average share of workers at risk of
displacement
Expected redeploymentsuccess rate of displaced
workers
41.3%
Average skills instabilityamong workforce
43.6%
Technology adoption in industryShare of companies surveyed
Cloud computing
Internet of things and connected devices
Robots, non-humanoid (industrial automation,drones, etc.)
E-commerce and digital trade
Big data analytics
Encryption and cyber security
3D and 4D printing and modelling
Artificial intelligence (e.g. machine learning, neuralnetworks, NLP)
Text, image and voice processing
Power storage and generation
Impact of COVID-19 on companies’ strategyShare of companies surveyed looking to adopt this strategy as a result of COVID-19
Provide more opportunities to work remotely76.9%
Accelerate the digitalization of work processes (e.g. use of digital tools, videoconferencing)
73.1%Accelerate automation of tasks
57.7%Temporarily reduce workforce
38.5%Accelerate ongoing organisational transformations (e.g. restructuring)
38.5%
Emerging skillsSkills identified as being in high demand within their organization, ordered byfrequency
1. Technology use, monitoring and control2. Critical thinking and analysis3. Active learning and learning strategies4. Leadership and social influence5. Analytical thinking and innovation6. Reasoning, problem-solving and ideation7. Complex problem-solving8. Service orientation9. Resilience, stress tolerance and flexibility10. Technology design and programming11. Troubleshooting and user experience12. Systems analysis and evaluation13. Coordination and time management14. Quality control and safety awareness15. Attention to detail, trustworthiness
Emerging and redundant jobs rolesRole identified as being in high demand or increasingly redundant within theirorganization, ordered by frequency
EMERGING
1. Business Development Professionals2. Software and Applications Developers3. Sales Representatives, Wholesale and Manufacturing, Technic…4. Robotics Engineers5. Internet of Things Specialists6. Data Analysts and Scientists7. Project Managers8. Power Production Plant Operators9. Assembly and Factory Workers10. AI and Machine Learning Specialists
REDUNDANT
1. Assembly and Factory Workers2. Relationship Managers3. Business Services and Administration Managers4. Sales Representatives, Wholesale and Manufacturing, Technic…5. Administrative and Executive Secretaries6. General and Operations Managers7. Door-To-Door Sales Workers, News and Street Vendors, and R…8. Data Entry Clerks9. Accounting, Bookkeeping and Payroll Clerks10. Accountants and Auditors
Industry Profile
Advanced Manufacturing1 / 2
89%
87%
85%
83%
76%
74%
74%
68%
62%
58%
1
3
5
2
4

The Future of Jobs 63
Industry Profiles
Barriers to adoption of new technologiesShare of companies surveyed
Skills gaps in the local labour market
Skills gaps among organization’s leadership
Inability to attract specialized talent
Shortage of investment capital
Insufficient understanding of opportunities
Lack of flexibility of the regulatory framework
Lack of flexibility in hiring and firing
Lack of interest among leadership
Other
Augmentation of key job tasks by 2024
Expected impact on workforceShare of companies surveyed
Modify the composition of the value chain67.7%
Expand its use of contractors doing task-specialized work48.4%
Reduce its current workforce due to technological integration or automation45.2%
Modify the locations where the organization operates41.9%
Expand its current workforce due to technological integration or automation41.9%
Current skills in focus of existing reskilling/upskillingprogrammesShare of companies surveyed identifying this skill as being in focus across theirreskilling or upskilling programs
1. Technology use, monitoring and control2. Analytical thinking and innovation3. Complex problem-solving4. Technology installation and maintenance5. Critical thinking and analysis6. Technology design and programming7. Quality control and safety awareness8. Service orientation9. Management of financial, material resources10. Leadership and social influence
Average reskilling needsShare of workforce within this industry
2 / 2
67.7%
54.8%
45.2%
41.9%
38.7%
25.8%
19.4%
9.7%
6.5%
DURATION OF RESKILLING
Less than 1 month26.8%
1 to 3 months22.4%
3 to 6 months16.6%
6 to 12 months20.6%
Over 1 year13.6%
Machine share Human share
Information and data processing
Performing physical and manual work activities
Looking for and receiving job-related information
All tasks
Identifying and evaluating job-relevant information
Administering
Performing complex and technical activities
Communicating and interacting
Coordinating, developing, managing and advising
Reasoning and decision-making
38.3%
44.1%
46%
48.5%
49.9%
52.2%
52.6%
59%
62.5%
67.4%
6
8
7
9
10

The Future of Jobs 64
1. Average share of displaced
workers / Expected redeployment
success rate of displaced workers
/ Average skills instability among
workforce
The share of workers at risk of displacement was calculated by computing the mean response of surveyed employers operating in this industry to the Future of Jobs Survey question: “What proportion of your global workforce do these employees which are likely to become increasingly redundant in your organization represent in the next four years?”
The expected redeployment success rate was calculated by computing the mean response from surveyed employers from this industry to the Future of Jobs Survey question “What percentage of employees with increasingly redundant skillsets do you expect to successfully redeploy within your organization after they have completed their reskilling programme?”
The average skills instability among the workforce was calculated by computing the mean response from surveyed employers from this industry to the Future of Jobs Survey question “Keeping in mind the tasks that will be performed by your employees, in the next four years what proportion of the core skills required to perform their roles well will be different”.
Period: 2020. Source: World Economic Forum, Future of Jobs Survey 2020.
2. Technology adoption in
industry:
This bar chart represents the share of survey respondents from companies operating in the industry who indicated that, by 2025, their company was “likely” or “very likely” (on a 5-point scale) to have adopted the stated technology as part of its growth strategy by 2025. For a more detailed discussion of each technology, please refer to the “Technology adoption” section in chapter 2 of the report.
Period: 2020. Source: World Economic Forum, Future of Jobs Survey 2020.
3. Emerging skills:
The table provides the list of skills the industry respondents have selected as being increasingly
important within their organization. It is based on the responses to the following question “Keeping in mind the tasks that will be performed by the key roles in your organization, in the next four years would you expect an increase or decrease in the use of the following skills by individuals?” from the Future of Jobs Survey. The skills are ranked by frequency and ranked from 1 to 15. The full list of skills is based on the O*NET classification and available in the appendix section of this report.
Period: 2020. Source: World Economic Forum, Future of Jobs Survey 2020.
4. Impact of Covid-19 on
companies’ strategy:
This bar chart shows the top 5 measures organizations are planning on implementing in response to the current COVID-19 outbreak as a share of survey respondents from the industry. It is based on the responses to the following question “In response to the current outbreak, which of the following measures has your company implemented or is planning to implement across the Organization?” from the Future of Jobs Survey.
Period: 2020. Source: World Economic Forum, Future of Jobs Survey 2020.
5. Emerging and redundant job
roles:
This table provides an overview of job roles expected to experience an increase and decrease in demand within this industry over the 2020–2025 period. The individual job roles listed are for illustrative purposes and report the job roles most frequently cited by survey respondents from companies operating in the industry. Categorization of job roles is adapted from the O*NET labour market information system (please see Appendix A: Report Methodology for details).
Period: 2020. Source: World Economic Forum, Future of Jobs Survey 2020.
6. Barriers to adoption of new
technologies:
This bar chart shows the most common barriers companies face when adopting new technologies.

The Future of Jobs 65
It is based on the responses to the following multiple-choice question “What are the top economic and social barriers your organization experiences when introducing new technologies?” from the Future of Jobs Survey. This bar is ranked by frequency of responses by companies surveyed from this industry.
Period: 2020. Source: World Economic Forum, Future of Jobs Survey 2020.
7. Expected impact on workforce:
This bar chart shows the expected impact of the current growth strategy of companies operating in this industry on their workforce in the next four years. It is based on the responses to the following multiple-choice question “To deliver on your organization’s current growth strategy in the next four years, your organization would need to?” from the Future of Jobs Survey.
Period: 2020. Source: World Economic Forum, Future of Jobs Survey 2020.
8. Augmentation of key job tasks
by 2024:
The bar chart depicts the share of time that will be performed by humans compared to machines by 2024 for each task. It is based on the responses to the following question “Currently, what proportion of time spent doing tasks in your organization is spent by your employees performing the work?” from the Future of Jobs Survey. This stacked bar chart is ranked by share of time spent doing tasks by machines.
Period: 2020. Source: World Economic Forum, Future of Jobs Survey 2020.
9. Current skills in focus of
existing reskilling/upskilling
programmes:
The table provides the list of skills that are the focus of existing industry company reskilling/upskilling programmes. It is based on the responses to the following question “Keeping in mind your current strategic direction, select the top 10 skill clusters that you are currently focusing your reskilling/
upskilling efforts on?” from the Future of Jobs Survey. The skills are ranked from 1 to 10 by frequency of responses by companies surveyed from this industry, with 1 being the skill for which most organzations offer training. The full list of skills is based on the O*NET classification and available in the appendix section of this report.
Period: 2020. Source: World Economic Forum, Future of Jobs Survey 2020.
10. Average reskilling needs:
The treemap shows the estimated time needed to reskill each share of the workforce that needs reskilling within the industry. It is based on the responses to the following question “Bearing in mind the evolving skill demand, how long do you expect the reskilling/upskilling of your employees to take?” from the Future of Jobs Survey. Respondents were asked to provide as share of their workforce for each duration of reskilling/upskilling.
Period: 2020. Source: World Economic Forum, Future of Jobs Survey 2020.

The Future of Jobs October 2020
The Future of Jobs 66
Country Profiles

Education & skills worst best
Digital skills among active population*WEIGHTED AVERAGE 2019-2020
Attainment of basic education2018
Business relevance of basic education*WEIGHTED AVERAGE 2019-2020
Attainment of advanced education2018
Business relevance of tertiary education*WEIGHTED AVERAGE 2019-2020
Supply of business-relevant skills*WEIGHTED AVERAGE 2019-2020
Unempl. rate among workers with adv. educ.2019
Unempl. rate among workers with basic educ.2019
Share of youth not in empl., educ. or training2020
Jobs & work worst best
Labour force participation2019
Vulnerable employment2020
Working cond. impact of gig economy*2020
Unemployment rate2019
* The figures presented for these indicators are rebased 0-100% progress scores, with 0 being the worst performance, and 100 being the best performance.
Impact of COVID-19 on companies’ strategyShare of companies surveyed looking to adopt this strategy as a result ofCOVID-19
Provide more opportunities to work remotely87.5%
Accelerate the digitalization of work processes (e.g. use of digital tools, videoconferencing)
87.5%Accelerate automation of tasks
56.2%Accelerate the digitalization of upskilling/ reskilling (e.g. education technologyproviders)
50%Accelerate the implementation of upskilling/ reskilling programmes
37.5%
Emerging and redundant job rolesRole identified as being in high demand or increasingly redundant withintheir organization, ordered by frequency
EMERGING
1. AI and Machine Learning Specialists2. Robotics Engineers3. Digital Transformation Specialists4. Software and Applications Developers5. Internet of Things Specialists6. FinTech Engineers7. Data Analysts and Scientists8. Business Services and Administration Managers9. Renewable Energy Engineers10. Digital Marketing and Strategy Specialists
REDUNDANT
1. Data Entry Clerks2. Accounting, Bookkeeping and Payroll Clerks3. Electronics and Telecommunications Installers and Repairers4. Assembly and Factory Workers5. Administrative and Executive Secretaries6. Shop Salespersons7. Sales and Marketing Professionals8. Relationship Managers9. Material-Recording and Stock-Keeping Clerks10. Bank Tellers and Related Clerks
Technology adoptionShare of companies surveyed
Text, image and voice processing
Cloud computing
Artificial intelligence (e.g. machine learning,neural networks, NLP)
Big data analytics
Internet of things and connected devices
E-commerce and digital trade
Encryption and cyber security
Robots, non-humanoid (industrial automation,drones, etc.)
Augmented and virtual reality
3D and 4D printing and modelling
Emerging skillsSkills identified as being in high demand within their organization, orderedby frequency
1. Creativity, originality and initiative2. Complex problem-solving3. Analytical thinking and innovation4. Reasoning, problem-solving and ideation5. Active learning and learning strategies6. Technology use, monitoring and control7. Quality control and safety awareness8. Emotional intelligence9. Resilience, stress tolerance and flexibility10. Persuasion and negotiation11. Critical thinking and analysis12. Coordination and time management13. Technology installation and maintenance14. Technology design and programming15. Troubleshooting and user experience
Country Profile
ArgentinaWorking Age Population
17,640,0481 / 2
50.1%
57.2%
45.9%
20%
66.2%
54%
3.4%
9.6%
19.9%
65.7%
21.9%
48.7%
7.4%
Unemployment rate—
Unemployment, monthly—
Unemployment rate change—
Unemployment rate change, women—
Unemployment rate change, men—
95%
90%
89%
80%
75%
72%
70%
68%
67%
65%
The Future of Jobs 67

Current skills in focus of existing reskilling/upskillingprogrammesShare of companies surveyed identifying this skill as being in focusacross their reskilling or upskilling programmes
1. Active learning and learning strategies2. Creativity, originality and initiative3. Critical thinking and analysis4. Troubleshooting and user experience5. Analytical thinking and innovation6. Reasoning, problem-solving and ideation7. Quality control and safety awareness8. Persuasion and negotiation9. Management of personnel10. Leadership and social influence
Responses to shifting skill needsShare of companies surveyed
Retrain existing employees
Expect existing employees to pick up skills onthe job
Hire new permanent staff with skills relevant tonew technologies
Look to automate the work
Hire new temporary staff with skills relevant tonew technologies
Hire freelancers with skills relevant to newtechnologies
Outsource some business functions to externalcontractors
Average reskilling needsShare of workforce of companies surveyed within this data
Projected use of training providersShare of companies surveyed
26.1% Internal learning and development
23.1% Private training providers
17.5% Public educational institutions
15.9% Private educational institutions
14% External online training
3.4% Public training providers
2 / 2
88%
88%
75%
69%
69%
69%
38%
DURATION OF RESKILLING
Less than 1 month33.3%
1 to 3 months15.9%
3 to 6 months18.4%
6 to 12 months14%
Over 1 year18.4%
The Future of Jobs 68

Education & skills worst best
Digital skills among active population*WEIGHTED AVERAGE 2019-2020
Attainment of basic education2018
Business relevance of basic education*WEIGHTED AVERAGE 2019-2020
Attainment of advanced education2018
Business relevance of tertiary education*WEIGHTED AVERAGE 2019-2020
Supply of business-relevant skills*WEIGHTED AVERAGE 2019-2020
Share of youth not in empl., educ. or training2020
Jobs & work worst best
Labour force participation2019
Vulnerable employment2020
Working cond. impact of gig economy*2020
Unemployment rate2019
Unemployment rateQ2 2020
Unemployment, monthlyAUGUST 2020
Unemployment rate change2019- Q2 2020 YOY CH.
Unemployment rate change, women2019- Q2 2020 YOY CH.
Unemployment rate change, men2019- Q2 2020 YOY CH.
* The figures presented for these indicators are rebased 0-100% progress scores, with 0 being the worst performance, and 100 being the best performance.
Impact of COVID-19 on companies’ strategyShare of companies surveyed looking to adopt this strategy as a result ofCOVID-19
Accelerate the digitalization of work processes (e.g. use of digital tools, videoconferencing)
92.3%Provide more opportunities to work remotely
80.8%Accelerate the digitalization of upskilling/ reskilling (e.g. education technologyproviders)
65.4%Accelerate automation of tasks
61.5%Accelerate ongoing organizational transformations (e.g. restructuring)
53.8%
Emerging and redundant job rolesRole identified as being in high demand or increasingly redundant withintheir organization, ordered by frequency
EMERGING
1. AI and Machine Learning Specialists2. Data Analysts and Scientists3. Information Security Analysts4. Big Data Specialists5. Process Automation Specialists6. Digital Transformation Specialists7. Remote Sensing Scientists and Technologists8. Organizational Development Specialists9. Mechanical Engineers10. Internet of Things Specialists
REDUNDANT
1. Data Entry Clerks2. Administrative and Executive Secretaries3. Accounting, Bookkeeping and Payroll Clerks4. Business Services and Administration Managers5. General and Operations Managers6. Assembly and Factory Workers7. Credit and Loans Officers8. Client Information and Customer Service Workers9. Accountants and Auditors10. Cashiers and Ticket Clerks
Technology adoptionShare of companies surveyed
Artificial intelligence (e.g. machine learning,neural networks, NLP)
Internet of things and connected devices
Cloud computing
Big data analytics
Robots, non-humanoid (industrial automation,drones, etc.)
Text, image and voice processing
Encryption and cyber security
Augmented and virtual reality
E-commerce and digital trade
3D and 4D printing and modelling
Emerging skillsSkills identified as being in high demand within their organization, orderedby frequency
1. Analytical thinking and innovation2. Active learning and learning strategies3. Critical thinking and analysis4. Leadership and social influence5. Technology use, monitoring and control6. Emotional intelligence7. Complex problem-solving8. Resilience, stress tolerance and flexibility9. Creativity, originality and initiative10. Technology design and programming11. Systems analysis and evaluation12. Service orientation13. Reasoning, problem-solving and ideation14. Quality control and safety awareness15. Troubleshooting and user experience
Country Profile
AustraliaWorking Age Population
17,332,0231 / 2
65.5%
93.4%
59.7%
43.3%
68.4%
59.7%
Unempl. rate among workers with adv. educ.—
Unempl. rate among workers with basic educ.—
8.6%
65.6%
10.6%
46.8%
3.9%
5.4%
5.6%
1.5%
1.3%
1.7%
97%
94%
91%
91%
81%
79%
79%
69%
68%
58%
The Future of Jobs 69

Current skills in focus of existing reskilling/upskillingprogrammesShare of companies surveyed identifying this skill as being in focusacross their reskilling or upskilling programmes
1. Analytical thinking and innovation2. Critical thinking and analysis3. Technology use, monitoring and control4. Leadership and social influence5. Active learning and learning strategies6. Technology design and programming7. Reasoning, problem-solving and ideation8. Complex problem-solving9. Quality control and safety awareness10. Emotional intelligence
Responses to shifting skill needsShare of companies surveyed
Retrain existing employees
Expect existing employees to pick up skills onthe job
Look to automate the work
Hire new permanent staff with skills relevant tonew technologies
Hire new temporary staff with skills relevant tonew technologies
Hire freelancers with skills relevant to newtechnologies
Outsource some business functions to externalcontractors
Average reskilling needsShare of workforce of companies surveyed within this data
Projected use of training providersShare of companies surveyed
44.6% Internal learning and development
15.3% Private training providers
15% Public educational institutions
14% External online training
7.8% Public training providers
3.4% Private educational institutions
2 / 2
97%
93%
86%
86%
66%
55%
48%
DURATION OF RESKILLING
Less than 1 month27.7%
1 to 3 months25.8%
3 to 6 months15.6%
6 to 12 months12.4%
Over 1 year18.5%
The Future of Jobs 70

Education & skills worst best
Digital skills among active population*WEIGHTED AVERAGE 2019-2020
Attainment of basic education2018
Business relevance of basic education*WEIGHTED AVERAGE 2019-2020
Attainment of advanced education2018
Business relevance of tertiary education*WEIGHTED AVERAGE 2019-2020
Supply of business-relevant skills*WEIGHTED AVERAGE 2019-2020
Unempl. rate among workers with adv. educ.2019
Unempl. rate among workers with basic educ.2019
Share of youth not in empl., educ. or training2020
Jobs & work worst best
Labour force participation2019
Vulnerable employment2020
Working cond. impact of gig economy*2020
Unemployment rate2019
Unemployment rateQ2 2020
Unemployment rate change2019- Q2 2020 YOY CH.
Unemployment rate change, women2019- Q2 2020 YOY CH.
Unemployment rate change, men2019- Q2 2020 YOY CH.
* The figures presented for these indicators are rebased 0-100% progress scores, with 0 being the worst performance, and 100 being the best performance.
Impact of COVID-19 on companies’ strategyShare of companies surveyed looking to adopt this strategy as a result ofCOVID-19
Accelerate the digitalization of work processes (e.g. use of digital tools, videoconferencing)
92%Provide more opportunities to work remotely
88%Accelerate automation of tasks
68%Accelerate the digitalization of upskilling/ reskilling (e.g. education technologyproviders)
52%Temporarily reassign workers to different tasks
40%
Emerging and redundant job rolesRole identified as being in high demand or increasingly redundant withintheir organization, ordered by frequency
EMERGING
1. AI and Machine Learning Specialists2. Data Analysts and Scientists3. Internet of Things Specialists4. Digital Transformation Specialists5. Big Data Specialists6. Management and Organisation Analysts7. Digital Marketing and Strategy Specialists8. Project Managers9. Process Automation Specialists10. Business Services and Administration Managers
REDUNDANT
1. Accounting, Bookkeeping and Payroll Clerks2. Data Entry Clerks3. Assembly and Factory Workers4. Administrative and Executive Secretaries5. Mechanics and Machinery Repairers6. Material-Recording and Stock-Keeping Clerks7. Client Information and Customer Service Workers8. Bank Tellers and Related Clerks9. Accountants and Auditors10. Business Services and Administration Managers
Technology adoptionShare of companies surveyed
Cloud computing
Big data analytics
Encryption and cyber security
Artificial intelligence (e.g. machine learning,neural networks, NLP)
Internet of things and connected devices
Text, image and voice processing
E-commerce and digital trade
Augmented and virtual reality
Robots, non-humanoid (industrial automation,drones, etc.)
Distributed ledger technology (e.g. blockchain)
Emerging skillsSkills identified as being in high demand within their organization, orderedby frequency
1. Active learning and learning strategies2. Analytical thinking and innovation3. Creativity, originality and initiative4. Leadership and social influence5. Emotional intelligence6. Critical thinking and analysis7. Complex problem-solving8. Resilience, stress tolerance and flexibility9. Technology design and programming10. Service orientation11. Reasoning, problem-solving and ideation12. Troubleshooting and user experience13. Technology use, monitoring and control14. Systems analysis and evaluation15. Persuasion and negotiation
Country Profile
BrazilWorking Age Population
136,154,6221 / 2
36.9%
60%
32.1%
16.5%
45.1%
42.2%
6%
9.3%
23.6%
64.2%
27.9%
44.7%
8.7%
11.9%Unemployment, monthly—
1.6%
1.4%
1.8%
97%
97%
94%
94%
91%
84%
84%
78%
74%
71%
The Future of Jobs 71

Current skills in focus of existing reskilling/upskillingprogrammesShare of companies surveyed identifying this skill as being in focusacross their reskilling or upskilling programmes
1. Leadership and social influence2. Analytical thinking and innovation3. Active learning and learning strategies4. Critical thinking and analysis5. Technology design and programming6. Service orientation7. Reasoning, problem-solving and ideation8. Management of personnel9. Creativity, originality and initiative10. Resilience, stress tolerance and flexibility
Responses to shifting skill needsShare of companies surveyed
Look to automate the work
Retrain existing employees
Hire new permanent staff with skills relevant tonew technologies
Expect existing employees to pick up skills onthe job
Outsource some business functions to externalcontractors
Hire new temporary staff with skills relevant tonew technologies
Hire freelancers with skills relevant to newtechnologies
Average reskilling needsShare of workforce of companies surveyed within this data
Projected use of training providersShare of companies surveyed
36.9% Internal learning and development
22.6% External online training
19.9% Private training providers
8.6% Private educational institutions
6.7% Public educational institutions
5.3% Public training providers
2 / 2
97%
93%
87%
84%
68%
61%
55%
DURATION OF RESKILLING
Less than 1 month21.4%
1 to 3 months19.6%
3 to 6 months20.9%
6 to 12 months17.1%
Over 1 year21%
The Future of Jobs 72

Education & skills worst best
Digital skills among active population*WEIGHTED AVERAGE 2019-2020
Business relevance of basic education*WEIGHTED AVERAGE 2019-2020
Attainment of advanced education2016
Business relevance of tertiary education*WEIGHTED AVERAGE 2019-2020
Supply of business-relevant skills*WEIGHTED AVERAGE 2019-2020
Unempl. rate among workers with adv. educ.2019
Unempl. rate among workers with basic educ.2019
Share of youth not in empl., educ. or training2020
Jobs & work worst best
Labour force participation2019
Vulnerable employment2020
Working cond. impact of gig economy*2020
Unemployment rate2019
Unemployment rateQ2 2020
Unemployment, monthlyAUGUST 2020
Unemployment rate change2019- Q2 2020 YOY CH.
Unemployment rate change, women2019- Q2 2020 YOY CH.
Unemployment rate change, men2019- Q2 2020 YOY CH.
* The figures presented for these indicators are rebased 0-100% progress scores, with 0 being the worst performance, and 100 being the best performance.
Impact of COVID-19 on companies’ strategyShare of companies surveyed looking to adopt this strategy as a result ofCOVID-19
Accelerate the digitalization of work processes (e.g. use of digital tools, videoconferencing)
89.5%Provide more opportunities to work remotely
78.9%Accelerate automation of tasks
63.2%Accelerate the digitalization of upskilling/ reskilling (e.g. education technologyproviders)
63.2%Accelerate ongoing organizational transformations (e.g. restructuring)
52.6%
Emerging and redundant job rolesRole identified as being in high demand or increasingly redundant withintheir organization, ordered by frequency
EMERGING
1. AI and Machine Learning Specialists2. Data Analysts and Scientists3. Process Automation Specialists4. Information Security Analysts5. Software and Applications Developers6. Internet of Things Specialists7. Big Data Specialists8. Mathematicians, Actuaries and Statisticians9. FinTech Engineers10. Digital Transformation Specialists
REDUNDANT
1. Data Entry Clerks2. Accounting, Bookkeeping and Payroll Clerks3. Business Services and Administration Managers4. Accountants and Auditors5. Administrative and Executive Secretaries6. Mining and Petroleum Extraction Workers7. Assembly and Factory Workers8. Mechanics and Machinery Repairers9. Human Resources Specialists10. Financial Analysts
Technology adoptionShare of companies surveyed
Encryption and cyber security
Cloud computing
Internet of things and connected devices
Big data analytics
Text, image and voice processing
E-commerce and digital trade
Distributed ledger technology (e.g. blockchain)
Augmented and virtual reality
Robots, non-humanoid (industrial automation,drones, etc.)
3D and 4D printing and modelling
Emerging skillsSkills identified as being in high demand within their organization, orderedby frequency
1. Analytical thinking and innovation2. Active learning and learning strategies3. Technology design and programming4. Critical thinking and analysis5. Complex problem-solving6. Leadership and social influence7. Emotional intelligence8. Technology use, monitoring and control9. Resilience, stress tolerance and flexibility10. Reasoning, problem-solving and ideation11. Creativity, originality and initiative12. Systems analysis and evaluation13. Troubleshooting and user experience14. Service orientation15. Quality control and safety awareness
Country Profile
CanadaWorking Age Population
26,359,8531 / 2
67.9%Attainment of basic education—
61.2%
49.7%
71.1%
68.4%
4.2%
8%
12.8%
65.9%
10.7%
36.1%
4.8%
10.5%
8.9%
6%
6.4%
5.5%
91%
91%
88%
84%
81%
79%
72%
72%
68%
60%
The Future of Jobs 73

Current skills in focus of existing reskilling/upskillingprogrammesShare of companies surveyed identifying this skill as being in focusacross their reskilling or upskilling programmes
1. Leadership and social influence2. Analytical thinking and innovation3. Critical thinking and analysis4. Technology design and programming5. Active learning and learning strategies6. Technology use, monitoring and control7. Reasoning, problem-solving and ideation8. Resilience, stress tolerance and flexibility9. Quality control and safety awareness10. Management of personnel
Responses to shifting skill needsShare of companies surveyed
Hire new permanent staff with skills relevant tonew technologies
Retrain existing employees
Look to automate the work
Hire new temporary staff with skills relevant tonew technologies
Hire freelancers with skills relevant to newtechnologies
Outsource some business functions to externalcontractors
Strategic redundancies of staff who lack the skillsto use new technologies
Average reskilling needsShare of workforce of companies surveyed within this data
Projected use of training providersShare of companies surveyed
42% Internal learning and development
20% Private training providers
17.6% External online training
8.2% Public educational institutions
6.2% Public training providers
6% Private educational institutions
2 / 2
93%
93%
79%
63%
59%
48%
44%
DURATION OF RESKILLING
Less than 1 month22.3%
1 to 3 months19.4%
3 to 6 months18.8%
6 to 12 months13.9%
Over 1 year25.6%
The Future of Jobs 74

Education & skills worst best
Digital skills among active population*2020
Business relevance of basic education*2020
Business relevance of tertiary education*2020
Supply of business-relevant skills*2020
Share of youth not in empl., educ. or training2020
Jobs & work worst best
Labour force participation2010
Vulnerable employment2020
Working cond. impact of gig economy*2020
* The figures presented for these indicators are rebased 0-100% progress scores, with 0 being the worst performance, and 100 being the best performance.
Impact of COVID-19 on companies’ strategyShare of companies surveyed looking to adopt this strategy as a result ofCOVID-19
Accelerate the digitalization of work processes (e.g. use of digital tools, videoconferencing)
92.3%Provide more opportunities to work remotely
82.1%Accelerate automation of tasks
53.8%Accelerate the digitalization of upskilling/ reskilling (e.g. education technologyproviders)
53.8%Accelerate the implementation of upskilling/ reskilling programmes
41%
Emerging and redundant job rolesRole identified as being in high demand or increasingly redundant withintheir organization, ordered by frequency
EMERGING
1. Data Analysts and Scientists2. AI and Machine Learning Specialists3. Big Data Specialists4. Information Security Analysts5. Digital Transformation Specialists6. Internet of Things Specialists7. Digital Marketing and Strategy Specialists8. Supply Chain and Logistics Specialists9. FinTech Engineers10. Assembly and Factory Workers
REDUNDANT
1. Data Entry Clerks2. Accounting, Bookkeeping and Payroll Clerks3. Administrative and Executive Secretaries4. Business Services and Administration Managers5. Assembly and Factory Workers6. Accountants and Auditors7. General and Operations Managers8. Client Information and Customer Service Workers9. Human Resources Specialists10. Financial and Investment Advisers
Technology adoptionShare of companies surveyed
Artificial intelligence (e.g. machine learning,neural networks, NLP)
Encryption and cyber security
Internet of things and connected devices
Big data analytics
E-commerce and digital trade
Robots, non-humanoid (industrial automation,drones, etc.)
Text, image and voice processing
Augmented and virtual reality
Distributed ledger technology (e.g. blockchain)
3D and 4D printing and modelling
Emerging skillsSkills identified as being in high demand within their organization, orderedby frequency
1. Analytical thinking and innovation2. Active learning and learning strategies3. Complex problem-solving4. Technology design and programming5. Creativity, originality and initiative6. Resilience, stress tolerance and flexibility7. Critical thinking and analysis8. Emotional intelligence9. Technology use, monitoring and control10. Reasoning, problem-solving and ideation11. Leadership and social influence12. Troubleshooting and user experience13. Service orientation14. Systems analysis and evaluation15. Quality control and safety awareness
Country Profile
ChinaWorking Age Population
-1 / 2
71.7%Attainment of basic education—
66.9%Attainment of advanced education—
73.6%
71.1%
Unempl. rate among workers with adv. educ.—
Unempl. rate among workers with basic educ.—
18%
74%
45.1%
28.2%Unemployment rate—
Unemployment rate—
Unemployment, monthly—
Unemployment rate change—
Unemployment rate change, women—
Unemployment rate change, men—
96%
94%
90%
88%
86%
84%
78%
73%
69%
66%
The Future of Jobs 75

Current skills in focus of existing reskilling/upskillingprogrammesShare of companies surveyed identifying this skill as being in focusacross their reskilling or upskilling programmes
1. Analytical thinking and innovation2. Leadership and social influence3. Active learning and learning strategies4. Technology design and programming5. Critical thinking and analysis6. Complex problem-solving7. Reasoning, problem-solving and ideation8. Creativity, originality and initiative9. Service orientation10. Technology use, monitoring and control
Responses to shifting skill needsShare of companies surveyed
Expect existing employees to pick up skills onthe job
Retrain existing employees
Look to automate the work
Hire new permanent staff with skills relevant tonew technologies
Outsource some business functions to externalcontractors
Hire new temporary staff with skills relevant tonew technologies
Hire freelancers with skills relevant to newtechnologies
Average reskilling needsShare of workforce of companies surveyed within this data
Projected use of training providersShare of companies surveyed
40.7% Internal learning and development
20.4% External online training
17.5% Private training providers
7.2% Private educational institutions
7.2% Public training providers
6.9% Public educational institutions
2 / 2
90%
89%
85%
83%
70%
68%
55%
DURATION OF RESKILLING
Less than 1 month18.7%
1 to 3 months18.8%
3 to 6 months20.9%
6 to 12 months19.9%
Over 1 year21.7%
The Future of Jobs 76

Education & skills worst best
Digital skills among active population*WEIGHTED AVERAGE 2019-2020
Attainment of basic education2017
Business relevance of basic education*WEIGHTED AVERAGE 2019-2020
Attainment of advanced education2017
Business relevance of tertiary education*WEIGHTED AVERAGE 2019-2020
Supply of business-relevant skills*WEIGHTED AVERAGE 2019-2020
Unempl. rate among workers with adv. educ.2019
Unempl. rate among workers with basic educ.2019
Share of youth not in empl., educ. or training2020
Jobs & work worst best
Labour force participation2019
Vulnerable employment2020
Working cond. impact of gig economy*2020
Unemployment rate2019
Unemployment rateQ2 2020
Unemployment, monthlyJULY 2020
Unemployment rate change2019- Q2 2020 YOY CH.
Unemployment rate change, women2019- Q2 2020 YOY CH.
Unemployment rate change, men2019- Q2 2020 YOY CH.
* The figures presented for these indicators are rebased 0-100% progress scores, with 0 being the worst performance, and 100 being the best performance.
Impact of COVID-19 on companies’ strategyShare of companies surveyed looking to adopt this strategy as a result ofCOVID-19
Accelerate the digitalization of work processes (e.g. use of digital tools, videoconferencing)
91.7%Provide more opportunities to work remotely
75%Accelerate automation of tasks
54.2%Accelerate the digitalization of upskilling/ reskilling (e.g. education technologyproviders)
45.8%Accelerate the implementation of upskilling/ reskilling programmes
37.5%
Emerging and redundant job rolesRole identified as being in high demand or increasingly redundant withintheir organization, ordered by frequency
EMERGING
1. Data Analysts and Scientists2. AI and Machine Learning Specialists3. Big Data Specialists4. Internet of Things Specialists5. Software and Applications Developers6. Assembly and Factory Workers7. General and Operations Managers8. FinTech Engineers9. Digital Transformation Specialists10. Business Services and Administration Managers
REDUNDANT
1. Data Entry Clerks2. Administrative and Executive Secretaries3. Accountants and Auditors4. Accounting, Bookkeeping and Payroll Clerks5. Assembly and Factory Workers6. Financial Analysts7. Human Resources Specialists8. General and Operations Managers9. Client Information and Customer Service Workers10. Claims Adjusters, Examiners, and Investigators
Technology adoptionShare of companies surveyed
Internet of things and connected devices
Artificial intelligence (e.g. machine learning,neural networks, NLP)
Encryption and cyber security
Cloud computing
Big data analytics
Augmented and virtual reality
Robots, non-humanoid (industrial automation,drones, etc.)
E-commerce and digital trade
Distributed ledger technology (e.g. blockchain)
Text, image and voice processing
Emerging skillsSkills identified as being in high demand within their organization, orderedby frequency
1. Active learning and learning strategies2. Critical thinking and analysis3. Analytical thinking and innovation4. Technology design and programming5. Complex problem-solving6. Creativity, originality and initiative7. Resilience, stress tolerance and flexibility8. Emotional intelligence9. Service orientation10. Leadership and social influence11. Reasoning, problem-solving and ideation12. Systems analysis and evaluation13. Technology use, monitoring and control14. Persuasion and negotiation15. Troubleshooting and user experience
Country Profile
FranceWorking Age Population
45,968,5691 / 2
57.1%
84.2%
55.7%
30.1%
67.2%
55.9%
4.6%
13.2%
10.3%
58.4%
7.4%
49.7%
7.3%
5.2%
5.4%
-1.6%
-2%
-1.2%
94%
91%
89%
89%
89%
78%
77%
74%
74%
72%
The Future of Jobs 77

Current skills in focus of existing reskilling/upskillingprogrammesShare of companies surveyed identifying this skill as being in focusacross their reskilling or upskilling programmes
1. Analytical thinking and innovation2. Active learning and learning strategies3. Leadership and social influence4. Emotional intelligence5. Critical thinking and analysis6. Resilience, stress tolerance and flexibility7. Management of personnel8. Complex problem-solving9. Technology use, monitoring and control10. Technology design and programming
Responses to shifting skill needsShare of companies surveyed
Retrain existing employees
Hire new permanent staff with skills relevant tonew technologies
Look to automate the work
Hire new temporary staff with skills relevant tonew technologies
Outsource some business functions to externalcontractors
Hire freelancers with skills relevant to newtechnologies
Strategic redundancies of staff who lack the skillsto use new technologies
Average reskilling needsShare of workforce of companies surveyed within this data
Projected use of training providersShare of companies surveyed
37.8% Internal learning and development
25.8% External online training
16% Private training providers
7.9% Public training providers
7.6% Public educational institutions
4.9% Private educational institutions
2 / 2
93%
88%
81%
70%
52%
47%
43%
DURATION OF RESKILLING
Less than 1 month16.2%
1 to 3 months13.5%
3 to 6 months18%
6 to 12 months19.8%
Over 1 year32.5%
The Future of Jobs 78

Education & skills worst best
Digital skills among active population*WEIGHTED AVERAGE 2019-2020
Attainment of basic education2018
Business relevance of basic education*WEIGHTED AVERAGE 2019-2020
Attainment of advanced education2018
Business relevance of tertiary education*WEIGHTED AVERAGE 2019-2020
Supply of business-relevant skills*WEIGHTED AVERAGE 2019-2020
Unempl. rate among workers with adv. educ.2019
Unempl. rate among workers with basic educ.2019
Share of youth not in empl., educ. or training2020
Jobs & work worst best
Labour force participation2019
Vulnerable employment2020
Working cond. impact of gig economy*2020
Unemployment rate2019
Unemployment, monthlyJULY 2020
* The figures presented for these indicators are rebased 0-100% progress scores, with 0 being the worst performance, and 100 being the best performance.
Impact of COVID-19 on companies’ strategyShare of companies surveyed looking to adopt this strategy as a result ofCOVID-19
Accelerate the digitalization of work processes (e.g. use of digital tools, videoconferencing)
85.7%Provide more opportunities to work remotely
77.1%Accelerate automation of tasks
51.4%Accelerate the digitalization of upskilling/ reskilling (e.g. education technologyproviders)
42.9%Accelerate the implementation of upskilling/ reskilling programmes
37.1%
Emerging and redundant job rolesRole identified as being in high demand or increasingly redundant withintheir organization, ordered by frequency
EMERGING
1. Data Analysts and Scientists2. AI and Machine Learning Specialists3. Digital Transformation Specialists4. Big Data Specialists5. Internet of Things Specialists6. Information Security Analysts7. Project Managers8. Software and Applications Developers9. Database and Network Professionals10. Process Automation Specialists
REDUNDANT
1. Data Entry Clerks2. Administrative and Executive Secretaries3. Accounting, Bookkeeping and Payroll Clerks4. Accountants and Auditors5. Business Services and Administration Managers6. General and Operations Managers7. Client Information and Customer Service Workers8. Financial and Investment Advisers9. Assembly and Factory Workers10. Human Resources Specialists
Technology adoptionShare of companies surveyed
Cloud computing
Big data analytics
Internet of things and connected devices
Artificial intelligence (e.g. machine learning,neural networks, NLP)
E-commerce and digital trade
Encryption and cyber security
Robots, non-humanoid (industrial automation,drones, etc.)
Augmented and virtual reality
Text, image and voice processing
Distributed ledger technology (e.g. blockchain)
Emerging skillsSkills identified as being in high demand within their organization, orderedby frequency
1. Active learning and learning strategies2. Analytical thinking and innovation3. Complex problem-solving4. Resilience, stress tolerance and flexibility5. Leadership and social influence6. Critical thinking and analysis7. Creativity, originality and initiative8. Technology design and programming9. Emotional intelligence10. Service orientation11. Systems analysis and evaluation12. Reasoning, problem-solving and ideation13. Technology use, monitoring and control14. Instruction, mentoring and teaching15. Troubleshooting and user experience
Country Profile
GermanyWorking Age Population
62,281,7251 / 2
62.5%
96.3%
64.7%
25.7%
69.6%
60.8%
1.8%
7.5%
5.4%
63.3%
5.6%
41.6%
2.9%
Unemployment rate—
4.2%
Unemployment rate change—
Unemployment rate change, women—
Unemployment rate change, men—
92%
90%
90%
90%
83%
81%
76%
73%
71%
60%
The Future of Jobs 79

Current skills in focus of existing reskilling/upskillingprogrammesShare of companies surveyed identifying this skill as being in focusacross their reskilling or upskilling programmes
1. Analytical thinking and innovation2. Leadership and social influence3. Active learning and learning strategies4. Critical thinking and analysis5. Technology design and programming6. Creativity, originality and initiative7. Emotional intelligence8. Complex problem-solving9. Service orientation10. Resilience, stress tolerance and flexibility
Responses to shifting skill needsShare of companies surveyed
Expect existing employees to pick up skills onthe job
Hire new permanent staff with skills relevant tonew technologies
Retrain existing employees
Look to automate the work
Hire new temporary staff with skills relevant tonew technologies
Hire freelancers with skills relevant to newtechnologies
Outsource some business functions to externalcontractors
Average reskilling needsShare of workforce of companies surveyed within this data
Projected use of training providersShare of companies surveyed
42.5% Internal learning and development
19.4% External online training
19.1% Private training providers
7.2% Private educational institutions
6.7% Public training providers
5% Public educational institutions
2 / 2
95%
86%
85%
81%
66%
54%
49%
DURATION OF RESKILLING
Less than 1 month23.7%
1 to 3 months18%
3 to 6 months16.5%
6 to 12 months19.7%
Over 1 year22.1%
The Future of Jobs 80

Education & skills worst best
Digital skills among active population*WEIGHTED AVERAGE 2019-2020
Business relevance of basic education*WEIGHTED AVERAGE 2019-2020
Business relevance of tertiary education*WEIGHTED AVERAGE 2019-2020
Supply of business-relevant skills*WEIGHTED AVERAGE 2019-2020
Unempl. rate among workers with adv. educ.2018
Unempl. rate among workers with basic educ.2018
Share of youth not in empl., educ. or training2020
Jobs & work worst best
Labour force participation2018
Vulnerable employment2020
Working cond. impact of gig economy*2020
Unemployment rate2018
* The figures presented for these indicators are rebased 0-100% progress scores, with 0 being the worst performance, and 100 being the best performance.
Impact of COVID-19 on companies’ strategyShare of companies surveyed looking to adopt this strategy as a result ofCOVID-19
Provide more opportunities to work remotely90.3%
Accelerate the digitalization of work processes (e.g. use of digital tools, videoconferencing)
87.1%Accelerate automation of tasks
58.1%Accelerate the digitalization of upskilling/ reskilling (e.g. education technologyproviders)
51.6%Accelerate the implementation of upskilling/ reskilling programmes
48.4%
Emerging and redundant job rolesRole identified as being in high demand or increasingly redundant withintheir organization, ordered by frequency
EMERGING
1. AI and Machine Learning Specialists2. Data Analysts and Scientists3. Information Security Analysts4. Internet of Things Specialists5. Big Data Specialists6. Project Managers7. FinTech Engineers8. Digital Marketing and Strategy Specialists9. Software and Applications Developers10. Business Development Professionals
REDUNDANT
1. Administrative and Executive Secretaries2. General and Operations Managers3. Assembly and Factory Workers4. Accounting, Bookkeeping and Payroll Clerks5. Data Entry Clerks6. Accountants and Auditors7. Architects and Surveyors8. Human Resources Specialists9. Client Information and Customer Service Workers10. Business Services and Administration Managers
Technology adoptionShare of companies surveyed
Cloud computing
Encryption and cyber security
Internet of things and connected devices
Big data analytics
Text, image and voice processing
Artificial intelligence (e.g. machine learning,neural networks, NLP)
Robots, non-humanoid (industrial automation,drones, etc.)
Distributed ledger technology (e.g. blockchain)
E-commerce and digital trade
Power storage and generation
Emerging skillsSkills identified as being in high demand within their organization, orderedby frequency
1. Analytical thinking and innovation2. Complex problem-solving3. Active learning and learning strategies4. Critical thinking and analysis5. Resilience, stress tolerance and flexibility6. Technology design and programming7. Emotional intelligence8. Creativity, originality and initiative9. Leadership and social influence10. Reasoning, problem-solving and ideation11. Technology use, monitoring and control12. Service orientation13. Troubleshooting and user experience14. Systems analysis and evaluation15. Persuasion and negotiation
Country Profile
IndiaWorking Age Population
588,373,7561 / 2
49.2%Attainment of basic education—
37.2%Attainment of advanced education—
38.9%
42.3%
9.2%
1.6%
31.1%
55.5%
74%
38.5%
2.5%
Unemployment rate—
Unemployment, monthly—
Unemployment rate change—
Unemployment rate change, women—
Unemployment rate change, men—
98%
95%
90%
88%
86%
81%
77%
75%
73%
64%
The Future of Jobs 81

Current skills in focus of existing reskilling/upskillingprogrammesShare of companies surveyed identifying this skill as being in focusacross their reskilling or upskilling programmes
1. Analytical thinking and innovation2. Active learning and learning strategies3. Leadership and social influence4. Critical thinking and analysis5. Technology design and programming6. Creativity, originality and initiative7. Complex problem-solving8. Technology use, monitoring and control9. Resilience, stress tolerance and flexibility10. Quality control and safety awareness
Responses to shifting skill needsShare of companies surveyed
Expect existing employees to pick up skills onthe job
Retrain existing employees
Hire new permanent staff with skills relevant tonew technologies
Look to automate the work
Hire new temporary staff with skills relevant tonew technologies
Outsource some business functions to externalcontractors
Hire freelancers with skills relevant to newtechnologies
Average reskilling needsShare of workforce of companies surveyed within this data
Projected use of training providersShare of companies surveyed
41.5% Internal learning and development
21.1% External online training
17.7% Private training providers
8.4% Public educational institutions
5.9% Public training providers
5.4% Private educational institutions
2 / 2
95%
92%
84%
82%
67%
65%
56%
DURATION OF RESKILLING
Less than 1 month24.2%
1 to 3 months20.4%
3 to 6 months18.9%
6 to 12 months14.3%
Over 1 year22.3%
The Future of Jobs 82

Education & skills worst best
Digital skills among active population*WEIGHTED AVERAGE 2019-2020
Attainment of basic education2018
Business relevance of basic education*WEIGHTED AVERAGE 2019-2020
Attainment of advanced education2018
Business relevance of tertiary education*WEIGHTED AVERAGE 2019-2020
Supply of business-relevant skills*WEIGHTED AVERAGE 2019-2020
Unempl. rate among workers with adv. educ.2019
Unempl. rate among workers with basic educ.2019
Share of youth not in empl., educ. or training2020
Jobs & work worst best
Labour force participation2019
Vulnerable employment2020
Working cond. impact of gig economy*2020
Unemployment rate2019
* The figures presented for these indicators are rebased 0-100% progress scores, with 0 being the worst performance, and 100 being the best performance.
Impact of COVID-19 on companies’ strategyShare of companies surveyed looking to adopt this strategy as a result ofCOVID-19
Provide more opportunities to work remotely91.7%
Accelerate the digitalization of work processes (e.g. use of digital tools, videoconferencing)
75%Accelerate automation of tasks
58.3%Temporarily reduce workforce
41.7%Accelerate the implementation of upskilling/ reskilling programmes
41.7%
Emerging and redundant job rolesRole identified as being in high demand or increasingly redundant withintheir organization, ordered by frequency
EMERGING
1. Data Analysts and Scientists2. Big Data Specialists3. AI and Machine Learning Specialists4. Digital Marketing and Strategy Specialists5. Renewable Energy Engineers6. Process Automation Specialists7. Internet of Things Specialists8. Digital Transformation Specialists9. Business Services and Administration Managers10. Business Development Professionals
REDUNDANT
1. Accounting, Bookkeeping and Payroll Clerks2. Data Entry Clerks3. Material-Recording and Stock-Keeping Clerks4. Assembly and Factory Workers5. Administrative and Executive Secretaries6. Mining and Petroleum Extraction Workers7. Mechanics and Machinery Repairers8. Human Resources Specialists9. Business Services and Administration Managers10. Accountants and Auditors
Technology adoptionShare of companies surveyed
Internet of things and connected devices
Encryption and cyber security
Cloud computing
Big data analytics
Artificial intelligence (e.g. machine learning,neural networks, NLP)
Robots, non-humanoid (industrial automation,drones, etc.)
E-commerce and digital trade
Distributed ledger technology (e.g. blockchain)
Text, image and voice processing
3D and 4D printing and modelling
Emerging skillsSkills identified as being in high demand within their organization, orderedby frequency
1. Creativity, originality and initiative2. Complex problem-solving3. Active learning and learning strategies4. Emotional intelligence5. Analytical thinking and innovation6. Troubleshooting and user experience7. Leadership and social influence8. Critical thinking and analysis9. Resilience, stress tolerance and flexibility10. Reasoning, problem-solving and ideation11. Service orientation12. Technology design and programming13. Technology use, monitoring and control14. Systems analysis and evaluation15. Instruction, mentoring and teaching
Country Profile
IndonesiaWorking Age Population
153,009,5071 / 2
60.6%
50.9%
55.3%
10%
64%
61%
2.5%
1.4%
22.2%
74%
47.5%
30.5%
1.8%
Unemployment rate—
Unemployment, monthly—
Unemployment rate change—
Unemployment rate change, women—
Unemployment rate change, men—
95%
95%
95%
89%
89%
84%
78%
72%
68%
68%
The Future of Jobs 83

Current skills in focus of existing reskilling/upskillingprogrammesShare of companies surveyed identifying this skill as being in focusacross their reskilling or upskilling programmes
1. Analytical thinking and innovation2. Technology design and programming3. Leadership and social influence4. Active learning and learning strategies5. Creativity, originality and initiative6. Critical thinking and analysis7. Service orientation8. Emotional intelligence9. Quality control and safety awareness10. Management of personnel
Responses to shifting skill needsShare of companies surveyed
Look to automate the work
Retrain existing employees
Expect existing employees to pick up skills onthe job
Hire new temporary staff with skills relevant tonew technologies
Outsource some business functions to externalcontractors
Hire freelancers with skills relevant to newtechnologies
Strategic redundancies of staff who lack the skillsto use new technologies
Average reskilling needsShare of workforce of companies surveyed within this data
Projected use of training providersShare of companies surveyed
41.3% Internal learning and development
22.1% External online training
19.6% Private training providers
6.7% Private educational institutions
5.4% Public training providers
4.9% Public educational institutions
2 / 2
94%
82%
82%
76%
71%
59%
53%
DURATION OF RESKILLING
Less than 1 month17.1%
1 to 3 months18.7%
3 to 6 months19.2%
6 to 12 months16.5%
Over 1 year28.5%
The Future of Jobs 84

Education & skills worst best
Digital skills among active population*WEIGHTED AVERAGE 2019-2020
Attainment of basic education2015
Business relevance of basic education*WEIGHTED AVERAGE 2019-2020
Attainment of advanced education2015
Business relevance of tertiary education*WEIGHTED AVERAGE 2019-2020
Supply of business-relevant skills*WEIGHTED AVERAGE 2019-2020
Unempl. rate among workers with adv. educ.2019
Unempl. rate among workers with basic educ.2019
Share of youth not in empl., educ. or training2020
Jobs & work worst best
Labour force participation2019
Vulnerable employment2020
Working cond. impact of gig economy*2020
Unemployment rate2019
Unemployment rateQ2 2020
Unemployment rate change2019- Q2 2020 YOY CH.
Unemployment rate change, women2019- Q2 2020 YOY CH.
Unemployment rate change, men2019- Q2 2020 YOY CH.
* The figures presented for these indicators are rebased 0-100% progress scores, with 0 being the worst performance, and 100 being the best performance.
Impact of COVID-19 on companies’ strategyShare of companies surveyed looking to adopt this strategy as a result ofCOVID-19
Accelerate the digitalization of work processes (e.g. use of digital tools, videoconferencing)
100%Provide more opportunities to work remotely
80%Accelerate automation of tasks
80%Accelerate the digitalization of upskilling/ reskilling (e.g. education technologyproviders)
70%Accelerate the implementation of upskilling/ reskilling programmes
40%
Emerging and redundant job rolesRole identified as being in high demand or increasingly redundant withintheir organization, ordered by frequency
EMERGING
1. AI and Machine Learning Specialists2. Internet of Things Specialists3. Data Analysts and Scientists4. Digital Transformation Specialists5. Assembly and Factory Workers6. Project Managers7. Process Automation Specialists8. General and Operations Managers9. Big Data Specialists10. Application engineers
REDUNDANT
1. Data Entry Clerks2. Administrative and Executive Secretaries3. Accounting, Bookkeeping and Payroll Clerks4. Business Services and Administration Managers5. Assembly and Factory Workers6. Accountants and Auditors7. Human Resources Specialists8. Financial and Investment Advisers9. Electronics and Telecommunications Installers and Repairers10. Credit and Loans Officers
Technology adoptionShare of companies surveyed
E-commerce and digital trade
Cloud computing
Big data analytics
Encryption and cyber security
Robots, non-humanoid (industrial automation,drones, etc.)
Augmented and virtual reality
Text, image and voice processing
Power storage and generation
3D and 4D printing and modelling
New materials (e.g. nanotubes, graphene)
Emerging skillsSkills identified as being in high demand within their organization, orderedby frequency
1. Creativity, originality and initiative2. Analytical thinking and innovation3. Critical thinking and analysis4. Active learning and learning strategies5. Resilience, stress tolerance and flexibility6. Emotional intelligence7. Leadership and social influence8. Complex problem-solving9. Technology use, monitoring and control10. Service orientation11. Technology design and programming12. Reasoning, problem-solving and ideation13. Persuasion and negotiation14. Quality control and safety awareness15. Coordination and time management
Country Profile
ItalyWorking Age Population
46,122,1301 / 2
50.7%
78.5%
51.8%
14.4%
61.6%
52.3%
5.5%
12.3%
19.1%
52.9%
16.9%
43.3%
8.7%
7.5%Unemployment, monthly—
-1.8%
-2%
-1.7%
94%
88%
88%
82%
80%
80%
76%
71%
71%
69%
The Future of Jobs 85

Current skills in focus of existing reskilling/upskillingprogrammesShare of companies surveyed identifying this skill as being in focusacross their reskilling or upskilling programmes
1. Analytical thinking and innovation2. Emotional intelligence3. Technology design and programming4. Management of personnel5. Active learning and learning strategies6. Leadership and social influence7. Critical thinking and analysis8. Resilience, stress tolerance and flexibility9. Service orientation10. Quality control and safety awareness
Responses to shifting skill needsShare of companies surveyed
Look to automate the work
Hire new permanent staff with skills relevant tonew technologies
Hire new temporary staff with skills relevant tonew technologies
Outsource some business functions to externalcontractors
Hire freelancers with skills relevant to newtechnologies
Other, please specify
Strategic redundancies of staff who lack the skillsto use new technologies
Average reskilling needsShare of workforce of companies surveyed within this data
Projected use of training providersShare of companies surveyed
41.5% Internal learning and development
20.9% External online training
16.9% Private training providers
7.4% Public educational institutions
6.6% Private educational institutions
6.6% Public training providers
2 / 2
86%
86%
57%
43%
36%
33%
31%
DURATION OF RESKILLING
Less than 1 month24.1%
1 to 3 months15.9%
3 to 6 months20.6%
6 to 12 months20.7%
Over 1 year18.6%
The Future of Jobs 86

Education & skills worst best
Digital skills among active population*WEIGHTED AVERAGE 2019-2020
Business relevance of basic education*WEIGHTED AVERAGE 2019-2020
Business relevance of tertiary education*WEIGHTED AVERAGE 2019-2020
Supply of business-relevant skills*WEIGHTED AVERAGE 2019-2020
Unempl. rate among workers with adv. educ.2019
Share of youth not in empl., educ. or training2020
Jobs & work worst best
Labour force participation2019
Vulnerable employment2020
Working cond. impact of gig economy*2020
Unemployment rate2019
Unemployment rateQ2 2020
Unemployment, monthlyJULY 2020
Unemployment rate change2019- Q2 2020 YOY CH.
Unemployment rate change, women2019- Q2 2020 YOY CH.
Unemployment rate change, men2019- Q2 2020 YOY CH.
* The figures presented for these indicators are rebased 0-100% progress scores, with 0 being the worst performance, and 100 being the best performance.
Impact of COVID-19 on companies’ strategyShare of companies surveyed looking to adopt this strategy as a result ofCOVID-19
Accelerate the digitalization of work processes (e.g. use of digital tools, videoconferencing)
93.5%Provide more opportunities to work remotely
83.9%Accelerate the digitalization of upskilling/ reskilling (e.g. education technologyproviders)
61.3%Accelerate automation of tasks
48.4%Accelerate the implementation of upskilling/ reskilling programmes
38.7%
Emerging and redundant job rolesRole identified as being in high demand or increasingly redundant withintheir organization, ordered by frequency
EMERGING
1. Data Analysts and Scientists2. AI and Machine Learning Specialists3. Internet of Things Specialists4. Digital Marketing and Strategy Specialists5. Big Data Specialists6. Information Security Analysts7. FinTech Engineers8. Digital Transformation Specialists9. Project Managers10. Management and Organisation Analysts
REDUNDANT
1. Data Entry Clerks2. Accounting, Bookkeeping and Payroll Clerks3. Administrative and Executive Secretaries4. Sales Representatives, Wholesale and Manufacturing, Technic…5. General and Operations Managers6. Business Services and Administration Managers7. Assembly and Factory Workers8. Mechanics and Machinery Repairers9. Legal Secretaries10. Statistical, Finance and Insurance Clerks
Technology adoptionShare of companies surveyed
Artificial intelligence (e.g. machine learning,neural networks, NLP)
Internet of things and connected devices
Big data analytics
Encryption and cyber security
Augmented and virtual reality
E-commerce and digital trade
Text, image and voice processing
Robots, non-humanoid (industrial automation,drones, etc.)
Distributed ledger technology (e.g. blockchain)
Robots, humanoid
Emerging skillsSkills identified as being in high demand within their organization, orderedby frequency
1. Analytical thinking and innovation2. Active learning and learning strategies3. Creativity, originality and initiative4. Complex problem-solving5. Technology use, monitoring and control6. Technology design and programming7. Resilience, stress tolerance and flexibility8. Reasoning, problem-solving and ideation9. Technology installation and maintenance10. Critical thinking and analysis11. Emotional intelligence12. Troubleshooting and user experience13. Systems analysis and evaluation14. Leadership and social influence15. Service orientation
Country Profile
JapanWorking Age Population
98,710,0001 / 2
50.8%Attainment of basic education—
56.3%Attainment of advanced education—
58.6%
52.9%
1.9%Unempl. rate among workers with basic educ.—
3.1%
63.7%
8.3%
45.6%
2.2%
2.3%
2.7%
0.3%
0.2%
0.4%
97%
97%
95%
92%
83%
81%
78%
68%
60%
59%
The Future of Jobs 87

Current skills in focus of existing reskilling/upskillingprogrammesShare of companies surveyed identifying this skill as being in focusacross their reskilling or upskilling programmes
1. Analytical thinking and innovation2. Leadership and social influence3. Active learning and learning strategies4. Critical thinking and analysis5. Creativity, originality and initiative6. Complex problem-solving7. Technology design and programming8. Systems analysis and evaluation9. Technology use, monitoring and control10. Reasoning, problem-solving and ideation
Responses to shifting skill needsShare of companies surveyed
Expect existing employees to pick up skills onthe job
Retrain existing employees
Look to automate the work
Hire new permanent staff with skills relevant tonew technologies
Outsource some business functions to externalcontractors
Hire new temporary staff with skills relevant tonew technologies
Hire freelancers with skills relevant to newtechnologies
Average reskilling needsShare of workforce of companies surveyed within this data
Projected use of training providersShare of companies surveyed
40.4% Internal learning and development
20.3% External online training
18.5% Private training providers
7.1% Private educational institutions
7.1% Public training providers
6.6% Public educational institutions
2 / 2
94%
91%
88%
81%
74%
71%
45%
DURATION OF RESKILLING
Less than 1 month22.2%
1 to 3 months19%
3 to 6 months19.5%
6 to 12 months12.6%
Over 1 year26.8%
The Future of Jobs 88

Education & skills worst best
Digital skills among active population*WEIGHTED AVERAGE 2019-2020
Attainment of basic education2016
Business relevance of basic education*WEIGHTED AVERAGE 2019-2020
Attainment of advanced education2016
Business relevance of tertiary education*WEIGHTED AVERAGE 2019-2020
Supply of business-relevant skills*WEIGHTED AVERAGE 2019-2020
Share of youth not in empl., educ. or training2020
Jobs & work worst best
Labour force participation2018
Vulnerable employment2020
Working cond. impact of gig economy*2020
Unemployment rate2018
* The figures presented for these indicators are rebased 0-100% progress scores, with 0 being the worst performance, and 100 being the best performance.
Impact of COVID-19 on companies’ strategyShare of companies surveyed looking to adopt this strategy as a result ofCOVID-19
Accelerate the digitalization of work processes (e.g. use of digital tools, videoconferencing)
100%Provide more opportunities to work remotely
75%Accelerate the digitalization of upskilling/ reskilling (e.g. education technologyproviders)
58.3%Temporarily reassign workers to different tasks
33.3%Accelerate the implementation of upskilling/ reskilling programmes
33.3%
Emerging and redundant job rolesRole identified as being in high demand or increasingly redundant withintheir organization, ordered by frequency
EMERGING
1. Data Analysts and Scientists2. Strategic Advisors3. Internet of Things Specialists4. Digital Transformation Specialists5. Digital Marketing and Strategy Specialists6. Big Data Specialists7. AI and Machine Learning Specialists8. Cyber Security Specialists9. Software and Applications Developers10. Renewable Energy Engineers
REDUNDANT
1. Data Entry Clerks2. Administrative and Executive Secretaries3. Accounting, Bookkeeping and Payroll Clerks4. Human Resources Specialists5. Mining and Petroleum Extraction Workers6. Mechanics and Machinery Repairers7. Environmental and Occupational Health and Hygiene Professio…8. Assembly and Factory Workers9. Accountants and Auditors10. Business Services and Administration Managers
Technology adoptionShare of companies surveyed
Internet of things and connected devices
Big data analytics
Encryption and cyber security
Artificial intelligence (e.g. machine learning,neural networks, NLP)
Text, image and voice processing
Robots, non-humanoid (industrial automation,drones, etc.)
Augmented and virtual reality
E-commerce and digital trade
Distributed ledger technology (e.g. blockchain)
3D and 4D printing and modelling
Emerging skillsSkills identified as being in high demand within their organization, orderedby frequency
1. Emotional intelligence2. Creativity, originality and initiative3. Analytical thinking and innovation4. Technology design and programming5. Complex problem-solving6. Active learning and learning strategies7. Troubleshooting and user experience8. Systems analysis and evaluation9. Leadership and social influence10. Critical thinking and analysis11. Technology use, monitoring and control12. Resilience, stress tolerance and flexibility13. Reasoning, problem-solving and ideation14. Service orientation15. Instruction, mentoring and teaching
Country Profile
MalaysiaWorking Age Population
16,231,0001 / 2
66.3%
74.2%
58.4%
18.8%
65.2%
64.4%
Unempl. rate among workers with adv. educ.—
Unempl. rate among workers with basic educ.—
12.2%
77.6%
21.7%
32.7%
1.7%
Unemployment rate—
Unemployment, monthly—
Unemployment rate change—
Unemployment rate change, women—
Unemployment rate change, men—
94%
94%
88%
88%
75%
73%
73%
69%
56%
56%
The Future of Jobs 89

Current skills in focus of existing reskilling/upskillingprogrammesShare of companies surveyed identifying this skill as being in focusacross their reskilling or upskilling programmes
1. Analytical thinking and innovation2. Active learning and learning strategies3. Critical thinking and analysis4. Technology use, monitoring and control5. Leadership and social influence6. Emotional intelligence7. Quality control and safety awareness8. Service orientation9. Resilience, stress tolerance and flexibility10. Management of personnel
Responses to shifting skill needsShare of companies surveyed
Look to automate the work
Hire new permanent staff with skills relevant tonew technologies
Expect existing employees to pick up skills onthe job
Hire new temporary staff with skills relevant tonew technologies
Outsource some business functions to externalcontractors
Strategic redundancies of staff who lack the skillsto use new technologies
Hire freelancers with skills relevant to newtechnologies
Average reskilling needsShare of workforce of companies surveyed within this data
Projected use of training providersShare of companies surveyed
36.1% Internal learning and development
22.9% External online training
22.1% Private training providers
8.2% Public educational institutions
5.9% Public training providers
4.8% Private educational institutions
2 / 2
86%
86%
86%
71%
64%
62%
50%
DURATION OF RESKILLING
Less than 1 month33.4%
1 to 3 months21.7%
3 to 6 months16.2%
6 to 12 months11.6%
Over 1 year17%
The Future of Jobs 90

Education & skills worst best
Digital skills among active population*WEIGHTED AVERAGE 2019-2020
Attainment of basic education2018
Business relevance of basic education*WEIGHTED AVERAGE 2019-2020
Attainment of advanced education2018
Business relevance of tertiary education*WEIGHTED AVERAGE 2019-2020
Supply of business-relevant skills*WEIGHTED AVERAGE 2019-2020
Unempl. rate among workers with adv. educ.2019
Unempl. rate among workers with basic educ.2019
Share of youth not in empl., educ. or training2020
Jobs & work worst best
Labour force participation2019
Vulnerable employment2020
Working cond. impact of gig economy*2020
Unemployment rate2019
Unemployment rateQ2 2020
Unemployment rate change2019- Q2 2020 YOY CH.
Unemployment rate change, women2019- Q2 2020 YOY CH.
Unemployment rate change, men2019- Q2 2020 YOY CH.
* The figures presented for these indicators are rebased 0-100% progress scores, with 0 being the worst performance, and 100 being the best performance.
Impact of COVID-19 on companies’ strategyShare of companies surveyed looking to adopt this strategy as a result ofCOVID-19
Provide more opportunities to work remotely94.4%
Accelerate the digitalization of work processes (e.g. use of digital tools, videoconferencing)
88.9%Accelerate automation of tasks
83.3%Accelerate the implementation of upskilling/ reskilling programmes
55.6%Accelerate the digitalization of upskilling/ reskilling (e.g. education technologyproviders)
44.4%
Emerging and redundant job rolesRole identified as being in high demand or increasingly redundant withintheir organization, ordered by frequency
EMERGING
1. AI and Machine Learning Specialists2. Data Analysts and Scientists3. Big Data Specialists4. Information Security Analysts5. Project Managers6. Process Automation Specialists7. Digital Marketing and Strategy Specialists8. Architects and Surveyors9. FinTech engineers10. University and Higher Education Teachers
REDUNDANT
1. Accounting, Bookkeeping and Payroll Clerks2. Data Entry Clerks3. Administrative and Executive Secretaries4. General and Operations Managers5. Architects and Surveyors6. Bank Tellers and Related Clerks7. Assembly and Factory Workers8. Statistical, Finance and Insurance Clerks9. Material-Recording and Stock-Keeping Clerks10. Accountants and Auditors
Technology adoptionShare of companies surveyed
Text, image and voice processing
Internet of things and connected devices
Cloud computing
Big data analytics
E-commerce and digital trade
Artificial intelligence (e.g. machine learning,neural networks, NLP)
Encryption and cyber security
Augmented and virtual reality
3D and 4D printing and modelling
Robots, non-humanoid (industrial automation,drones, etc.)
Emerging skillsSkills identified as being in high demand within their organization, orderedby frequency
1. Complex problem-solving2. Active learning and learning strategies3. Analytical thinking and innovation4. Critical thinking and analysis5. Technology design and programming6. Reasoning, problem-solving and ideation7. Creativity, originality and initiative8. Emotional intelligence9. Troubleshooting and user experience10. Service orientation11. Resilience, stress tolerance and flexibility12. Technology use, monitoring and control13. Leadership and social influence14. Persuasion and negotiation15. Coordination and time management
Country Profile
MexicoWorking Age Population
73,069,0001 / 2
42.9%
63.2%
42.5%
16.4%
57.6%
50.5%
3.9%
2.4%
18.9%
64.6%
26.9%
45.6%
2.7%
3.3%Unemployment, monthly—
1.4%
0.7%
1.9%
91%
91%
91%
91%
86%
82%
78%
64%
62%
60%
The Future of Jobs 91

Current skills in focus of existing reskilling/upskillingprogrammesShare of companies surveyed identifying this skill as being in focusacross their reskilling or upskilling programmes
1. Analytical thinking and innovation2. Leadership and social influence3. Critical thinking and analysis4. Technology design and programming5. Reasoning, problem-solving and ideation6. Active learning and learning strategies7. Creativity, originality and initiative8. Troubleshooting and user experience9. Technology use, monitoring and control10. Persuasion and negotiation
Responses to shifting skill needsShare of companies surveyed
Retrain existing employees
Hire new permanent staff with skills relevant tonew technologies
Look to automate the work
Expect existing employees to pick up skills onthe job
Strategic redundancies of staff who lack the skillsto use new technologies
Hire new temporary staff with skills relevant tonew technologies
Hire freelancers with skills relevant to newtechnologies
Average reskilling needsShare of workforce of companies surveyed within this data
Projected use of training providersShare of companies surveyed
43.2% Internal learning and development
19.4% External online training
16.6% Private training providers
9.7% Private educational institutions
6.5% Public educational institutions
4.7% Public training providers
2 / 2
95%
90%
85%
75%
65%
60%
60%
DURATION OF RESKILLING
Less than 1 month16.4%
1 to 3 months23.6%
3 to 6 months18.6%
6 to 12 months18.2%
Over 1 year23.2%
The Future of Jobs 92

Education & skills worst best
Digital skills among active population*WEIGHTED AVERAGE 2019-2020
Attainment of basic education2018
Business relevance of basic education*WEIGHTED AVERAGE 2019-2020
Attainment of advanced education2018
Business relevance of tertiary education*WEIGHTED AVERAGE 2019-2020
Supply of business-relevant skills*WEIGHTED AVERAGE 2019-2020
Unempl. rate among workers with adv. educ.2019
Unempl. rate among workers with basic educ.2019
Share of youth not in empl., educ. or training2020
Jobs & work worst best
Labour force participation2019
Vulnerable employment2020
Working cond. impact of gig economy*2020
Unemployment rate2019
Unemployment rateQ2 2020
Unemployment, monthlyAUGUST 2020
Unemployment rate change2019- Q2 2020 YOY CH.
Unemployment rate change, women2019- Q2 2020 YOY CH.
Unemployment rate change, men2019- Q2 2020 YOY CH.
* The figures presented for these indicators are rebased 0-100% progress scores, with 0 being the worst performance, and 100 being the best performance.
Impact of COVID-19 on companies’ strategyShare of companies surveyed looking to adopt this strategy as a result ofCOVID-19
Accelerate the digitalization of work processes (e.g. use of digital tools, videoconferencing)
96%Provide more opportunities to work remotely
88%Accelerate the digitalization of upskilling/ reskilling (e.g. education technologyproviders)
64%Accelerate automation of tasks
44%Accelerate ongoing organizational transformations (e.g. restructuring)
40%
Emerging and redundant job rolesRole identified as being in high demand or increasingly redundant withintheir organization, ordered by frequency
EMERGING
1. Data Analysts and Scientists2. AI and Machine Learning Specialists3. Big Data Specialists4. Information Security Analysts5. Food Scientists and Technologists6. Organizational Development Specialists7. Internet of Things Specialists8. FinTech Engineers9. Digital Marketing and Strategy Specialists10. Business Development Professionals
REDUNDANT
1. Data Entry Clerks2. Administrative and Executive Secretaries3. Accounting, Bookkeeping and Payroll Clerks4. Assembly and Factory Workers5. Client Information and Customer Service Workers6. Business Services and Administration Managers7. Credit and Loans Officers8. Bank Tellers and Related Clerks9. Cashiers and Ticket Clerks10. Insurance Underwriters
Technology adoptionShare of companies surveyed
Big data analytics
Internet of things and connected devices
Artificial intelligence (e.g. machine learning,neural networks, NLP)
E-commerce and digital trade
Cloud computing
Encryption and cyber security
Robots, non-humanoid (industrial automation,drones, etc.)
Text, image and voice processing
Augmented and virtual reality
3D and 4D printing and modelling
Emerging skillsSkills identified as being in high demand within their organization, orderedby frequency
1. Analytical thinking and innovation2. Active learning and learning strategies3. Leadership and social influence4. Critical thinking and analysis5. Creativity, originality and initiative6. Complex problem-solving7. Resilience, stress tolerance and flexibility8. Technology use, monitoring and control9. Service orientation10. Technology design and programming11. Emotional intelligence12. Reasoning, problem-solving and ideation13. Systems analysis and evaluation14. Troubleshooting and user experience15. Instruction, mentoring and teaching
Country Profile
NetherlandsWorking Age Population
12,236,2381 / 2
77.4%
90.4%
71.6%
33%
77.9%
63.7%
2.2%
4%
2.8%
63.9%
12.6%
38.7%
2.7%
2.8%
3%
0%
0%
0%
91%
91%
88%
86%
86%
83%
72%
68%
65%
58%
The Future of Jobs 93

Current skills in focus of existing reskilling/upskillingprogrammesShare of companies surveyed identifying this skill as being in focusacross their reskilling or upskilling programmes
1. Analytical thinking and innovation2. Active learning and learning strategies3. Leadership and social influence4. Critical thinking and analysis5. Creativity, originality and initiative6. Resilience, stress tolerance and flexibility7. Reasoning, problem-solving and ideation8. Complex problem-solving9. Service orientation10. Technology design and programming
Responses to shifting skill needsShare of companies surveyed
Expect existing employees to pick up skills onthe job
Look to automate the work
Retrain existing employees
Hire new permanent staff with skills relevant tonew technologies
Hire freelancers with skills relevant to newtechnologies
Outsource some business functions to externalcontractors
Hire new temporary staff with skills relevant tonew technologies
Average reskilling needsShare of workforce of companies surveyed within this data
Projected use of training providersShare of companies surveyed
38.7% Internal learning and development
20.8% External online training
16.6% Private training providers
8.9% Public educational institutions
8.6% Public training providers
6.3% Private educational institutions
2 / 2
97%
87%
83%
77%
70%
58%
57%
DURATION OF RESKILLING
Less than 1 month22.5%
1 to 3 months19.7%
3 to 6 months16.2%
6 to 12 months17.7%
Over 1 year23.8%
The Future of Jobs 94

Education & skills worst best
Digital skills among active population*WEIGHTED AVERAGE 2019-2020
Attainment of basic education2017
Business relevance of basic education*WEIGHTED AVERAGE 2019-2020
Attainment of advanced education2017
Business relevance of tertiary education*WEIGHTED AVERAGE 2019-2020
Supply of business-relevant skills*WEIGHTED AVERAGE 2019-2020
Unempl. rate among workers with adv. educ.2018
Unempl. rate among workers with basic educ.2018
Share of youth not in empl., educ. or training2020
Jobs & work worst best
Labour force participation2018
Vulnerable employment2020
Working cond. impact of gig economy*2020
Unemployment rate2018
* The figures presented for these indicators are rebased 0-100% progress scores, with 0 being the worst performance, and 100 being the best performance.
Impact of COVID-19 on companies’ strategyShare of companies surveyed looking to adopt this strategy as a result ofCOVID-19
Provide more opportunities to work remotely71.4%
Accelerate the digitalization of work processes (e.g. use of digital tools, videoconferencing)
71.4%Accelerate automation of tasks
57.1%Temporarily reassign workers to different tasks
42.9%Accelerate the implementation of upskilling/ reskilling programmes
38.1%
Emerging and redundant job rolesRole identified as being in high demand or increasingly redundant withintheir organization, ordered by frequency
EMERGING
1. Business Development Professionals2. Digital Marketing and Strategy Specialists3. Mechanics and Machinery Repairers4. Digital Transformation Specialists5. Software and Applications Developers6. Sales and Marketing Professionals7. Data Analysts and Scientists8. Business Services and Administration Managers9. Big Data Specialists10. Advertising and Public Relations Professionals
REDUNDANT
1. Data Entry Clerks2. Administrative and Executive Secretaries3. Management and Organisation Analysts4. General and Operations Managers5. Door-To-Door Sales Workers, News and Street Vendors, and R…6. Assembly and Factory Workers7. Accountants and Auditors8. Legal Secretaries9. Business Services and Administration Managers10. Postal Service Clerks
Technology adoptionShare of companies surveyed
E-commerce and digital trade
Big data analytics
Cloud computing
Encryption and cyber security
Text, image and voice processing
Artificial intelligence (e.g. machine learning,neural networks, NLP)
Power storage and generation
Distributed ledger technology (e.g. blockchain)
Augmented and virtual reality
3D and 4D printing and modelling
Emerging skillsSkills identified as being in high demand within their organization, orderedby frequency
1. Active learning and learning strategies2. Leadership and social influence3. Critical thinking and analysis4. Creativity, originality and initiative5. Analytical thinking and innovation6. Reasoning, problem-solving and ideation7. Complex problem-solving8. Technology use, monitoring and control9. Troubleshooting and user experience10. Systems analysis and evaluation11. Attention to detail, trustworthiness12. Resilience, stress tolerance and flexibility13. Coordination and time management14. Technology design and programming15. Quality control and safety awareness
Country Profile
PakistanWorking Age Population
82,345,2631 / 2
50.7%
36.4%
45.8%
8.7%
54.9%
51.1%
4.5%
2.3%
31.1%
56.3%
55.3%
47.3%
2.8%
Unemployment rate—
Unemployment, monthly—
Unemployment rate change—
Unemployment rate change, women—
Unemployment rate change, men—
91%
91%
91%
86%
83%
70%
65%
56%
55%
47%
The Future of Jobs 95
Current skills in focus of existing reskilling/upskillingprogrammesShare of companies surveyed identifying this skill as being in focusacross their reskilling or upskilling programmes
1. Analytical thinking and innovation2. Critical thinking and analysis3. Leadership and social influence4. Active learning and learning strategies5. Coordination and time management6. Management of personnel7. Creativity, originality and initiative8. Technology use, monitoring and control9. Technology design and programming10. Quality control and safety awareness
Responses to shifting skill needsShare of companies surveyed
Retrain existing employees
Look to automate the work
Hire new permanent staff with skills relevant tonew technologies
Strategic redundancies of staff who lack the skillsto use new technologies
Outsource some business functions to externalcontractors
Hire new temporary staff with skills relevant tonew technologies
Other, please specify
Average reskilling needsShare of workforce of companies surveyed within this data
Projected use of training providersShare of companies surveyed
51% Internal learning and development
18.3% Private training providers
16.5% External online training
6.9% Public training providers
4.2% Private educational institutions
3.1% Public educational institutions
2 / 2
96%
87%
86%
68%
64%
48%
36%
DURATION OF RESKILLING
Less than 1 month27.3%
1 to 3 months23.3%
3 to 6 months20.1%
6 to 12 months14.7%
Over 1 year14.6%
The Future of Jobs 96

Education & skills worst best
Digital skills among active population*WEIGHTED AVERAGE 2019-2020
Attainment of basic education2016
Business relevance of basic education*WEIGHTED AVERAGE 2019-2020
Attainment of advanced education2016
Business relevance of tertiary education*WEIGHTED AVERAGE 2019-2020
Supply of business-relevant skills*WEIGHTED AVERAGE 2019-2020
Unempl. rate among workers with adv. educ.2019
Unempl. rate among workers with basic educ.2019
Share of youth not in empl., educ. or training2020
Jobs & work worst best
Labour force participation2019
Vulnerable employment2020
Working cond. impact of gig economy*2020
Unemployment rate2019
Unemployment, monthlyJULY 2020
* The figures presented for these indicators are rebased 0-100% progress scores, with 0 being the worst performance, and 100 being the best performance.
Impact of COVID-19 on companies’ strategyShare of companies surveyed looking to adopt this strategy as a result ofCOVID-19
Accelerate the digitalization of work processes (e.g. use of digital tools, videoconferencing)
85.7%Provide more opportunities to work remotely
71.4%Accelerate the digitalization of upskilling/ reskilling (e.g. education technologyproviders)
57.1%Accelerate automation of tasks
42.9%Accelerate the implementation of upskilling/ reskilling programmes
28.6%
Emerging and redundant job rolesRole identified as being in high demand or increasingly redundant withintheir organization, ordered by frequency
EMERGING
1. AI and Machine Learning Specialists2. Big Data Specialists3. Internet of Things Specialists4. Database and Network Professionals5. Software and Applications Developers6. Social Media Strategist7. Materials Engineers8. Business Development Professionals9. Process Automation Specialists10. Robotics Engineers
REDUNDANT
1. Data Entry Clerks2. Administrative and Executive Secretaries3. Accounting, Bookkeeping and Payroll Clerks4. Material-Recording and Stock-Keeping Clerks5. Financial Analysts6. Assembly and Factory Workers7. Accountants and Auditors8. Car, Van and Motorcycle Drivers9. Business Services and Administration Managers10. Architects and Surveyors
Technology adoptionShare of companies surveyed
Encryption and cyber security
Artificial intelligence (e.g. machine learning,neural networks, NLP)
Cloud computing
Big data analytics
E-commerce and digital trade
Robots, non-humanoid (industrial automation,drones, etc.)
Power storage and generation
Text, image and voice processing
New materials (e.g. nanotubes, graphene)
Augmented and virtual reality
Emerging skillsSkills identified as being in high demand within their organization, orderedby frequency
1. Creativity, originality and initiative2. Active learning and learning strategies3. Resilience, stress tolerance and flexibility4. Complex problem-solving5. Analytical thinking and innovation6. Technology use, monitoring and control7. Service orientation8. Critical thinking and analysis9. Technology design and programming10. Reasoning, problem-solving and ideation11. Management of personnel12. Emotional intelligence13. Management of financial, material resources14. Leadership and social influence15. Instruction, mentoring and teaching
Country Profile
PolandWorking Age Population
26,745,7151 / 2
55.6%
85.3%
40.7%
25%
50.6%
52.7%
1.8%
7.9%
8.6%
59%
15.9%
42.1%
2.8%
Unemployment rate—
2.7%
Unemployment rate change—
Unemployment rate change, women—
Unemployment rate change, men—
87%
86%
80%
73%
71%
69%
69%
67%
60%
46%
The Future of Jobs 97
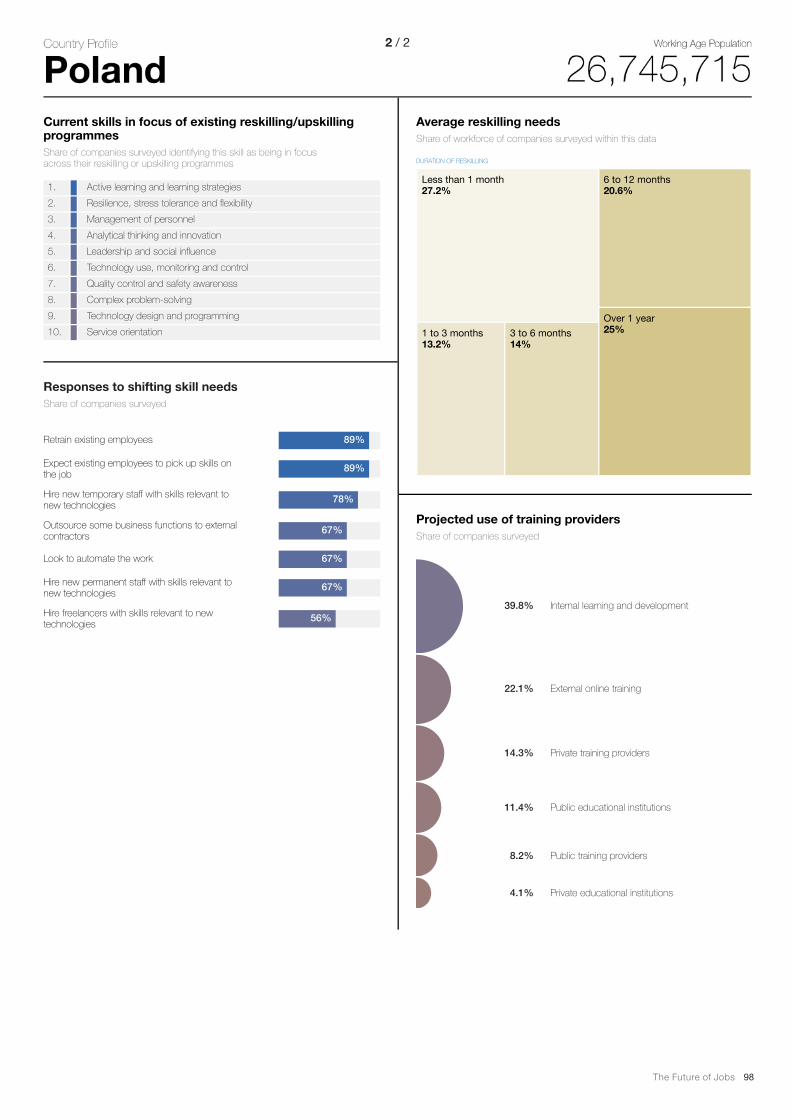
Current skills in focus of existing reskilling/upskillingprogrammesShare of companies surveyed identifying this skill as being in focusacross their reskilling or upskilling programmes
1. Active learning and learning strategies2. Resilience, stress tolerance and flexibility3. Management of personnel4. Analytical thinking and innovation5. Leadership and social influence6. Technology use, monitoring and control7. Quality control and safety awareness8. Complex problem-solving9. Technology design and programming10. Service orientation
Responses to shifting skill needsShare of companies surveyed
Retrain existing employees
Expect existing employees to pick up skills onthe job
Hire new temporary staff with skills relevant tonew technologies
Outsource some business functions to externalcontractors
Look to automate the work
Hire new permanent staff with skills relevant tonew technologies
Hire freelancers with skills relevant to newtechnologies
Average reskilling needsShare of workforce of companies surveyed within this data
Projected use of training providersShare of companies surveyed
39.8% Internal learning and development
22.1% External online training
14.3% Private training providers
11.4% Public educational institutions
8.2% Public training providers
4.1% Private educational institutions
2 / 2
89%
89%
78%
67%
67%
67%
56%
DURATION OF RESKILLING
Less than 1 month27.2%
1 to 3 months13.2%
3 to 6 months14%
6 to 12 months20.6%
Over 1 year25%
The Future of Jobs 98

Education & skills worst best
Digital skills among active population*WEIGHTED AVERAGE 2019-2020
Business relevance of basic education*WEIGHTED AVERAGE 2019-2020
Business relevance of tertiary education*WEIGHTED AVERAGE 2019-2020
Supply of business-relevant skills*WEIGHTED AVERAGE 2019-2020
Unempl. rate among workers with adv. educ.2019
Unempl. rate among workers with basic educ.2019
Share of youth not in empl., educ. or training2020
Jobs & work worst best
Labour force participation2019
Vulnerable employment2020
Working cond. impact of gig economy*2020
Unemployment rate2019
* The figures presented for these indicators are rebased 0-100% progress scores, with 0 being the worst performance, and 100 being the best performance.
Impact of COVID-19 on companies’ strategyShare of companies surveyed looking to adopt this strategy as a result ofCOVID-19
Provide more opportunities to work remotely80.6%
Accelerate the digitalization of work processes (e.g. use of digital tools, videoconferencing)
80.6%Accelerate automation of tasks
47.2%Accelerate the digitalization of upskilling/ reskilling (e.g. education technologyproviders)
33.3%Accelerate ongoing organizational transformations (e.g. restructuring)
30.6%
Emerging and redundant job rolesRole identified as being in high demand or increasingly redundant withintheir organization, ordered by frequency
EMERGING
1. AI and Machine Learning Specialists2. Data Analysts and Scientists3. Big Data Specialists4. Software and Applications Developers5. Sales Representatives, Wholesale and Manufacturing, Technic…6. Process Automation Specialists7. Management and Organisation Analysts8. Digital Marketing and Strategy Specialists9. Database and Network Professionals10. Business Services and Administration Managers
REDUNDANT
1. Accounting, Bookkeeping and Payroll Clerks2. Administrative and Executive Secretaries3. Data Entry Clerks4. Sales Representatives, Wholesale and Manufacturing, Technic…5. Accountants and Auditors6. Lawyers7. Mechanics and Machinery Repairers8. Legal Secretaries9. Door-To-Door Sales Workers, News and Street Vendors, and R…10. Assembly and Factory Workers
Technology adoptionShare of companies surveyed
Cloud computing
Big data analytics
Encryption and cyber security
Text, image and voice processing
Artificial intelligence (e.g. machine learning,neural networks, NLP)
E-commerce and digital trade
Robots, non-humanoid (industrial automation,drones, etc.)
Internet of things and connected devices
Augmented and virtual reality
Power storage and generation
Emerging skillsSkills identified as being in high demand within their organization, orderedby frequency
1. Complex problem-solving2. Analytical thinking and innovation3. Active learning and learning strategies4. Emotional intelligence5. Resilience, stress tolerance and flexibility6. Critical thinking and analysis7. Technology use, monitoring and control8. Creativity, originality and initiative9. Troubleshooting and user experience10. Technology design and programming11. Service orientation12. Reasoning, problem-solving and ideation13. Leadership and social influence14. Persuasion and negotiation15. Attention to detail, trustworthiness
Country Profile
Russian FederationWorking Age Population
106,913,4161 / 2
66%Attainment of basic education—
48%Attainment of advanced education—
53.1%
59.2%
3.6%
9.2%
15.9%
66.1%
5.3%
42.4%
3.8%
Unemployment rate—
Unemployment, monthly—
Unemployment rate change—
Unemployment rate change, women—
Unemployment rate change, men—
80%
76%
73%
72%
71%
67%
66%
65%
50%
48%
The Future of Jobs 99

Current skills in focus of existing reskilling/upskillingprogrammesShare of companies surveyed identifying this skill as being in focusacross their reskilling or upskilling programmes
1. Creativity, originality and initiative2. Complex problem-solving3. Analytical thinking and innovation4. Management of personnel5. Active learning and learning strategies6. Emotional intelligence7. Leadership and social influence8. Critical thinking and analysis9. Resilience, stress tolerance and flexibility10. Reasoning, problem-solving and ideation
Responses to shifting skill needsShare of companies surveyed
Expect existing employees to pick up skills onthe job
Retrain existing employees
Hire new permanent staff with skills relevant tonew technologies
Look to automate the work
Outsource some business functions to externalcontractors
Hire new temporary staff with skills relevant tonew technologies
Strategic redundancies of staff who lack the skillsto use new technologies
Average reskilling needsShare of workforce of companies surveyed within this data
Projected use of training providersShare of companies surveyed
38.6% Internal learning and development
18.3% External online training
15.9% Private training providers
9.9% Public educational institutions
9.6% Public training providers
7.8% Private educational institutions
2 / 2
83%
77%
72%
69%
57%
57%
43%
DURATION OF RESKILLING
Less than 1 month22.6%
1 to 3 months21.2%
3 to 6 months16.1%
6 to 12 months16.8%
Over 1 year23.3%
The Future of Jobs 100

Education & skills worst best
Digital skills among active population*WEIGHTED AVERAGE 2019-2020
Attainment of basic education2017
Business relevance of basic education*WEIGHTED AVERAGE 2019-2020
Attainment of advanced education2017
Business relevance of tertiary education*WEIGHTED AVERAGE 2019-2020
Supply of business-relevant skills*WEIGHTED AVERAGE 2019-2020
Unempl. rate among workers with adv. educ.2014
Unempl. rate among workers with basic educ.2014
Share of youth not in empl., educ. or training2020
Jobs & work worst best
Labour force participation2018
Vulnerable employment2020
Working cond. impact of gig economy*2020
Unemployment rate2018
* The figures presented for these indicators are rebased 0-100% progress scores, with 0 being the worst performance, and 100 being the best performance.
Impact of COVID-19 on companies’ strategyShare of companies surveyed looking to adopt this strategy as a result ofCOVID-19
Provide more opportunities to work remotely100%
Temporarily reassign workers to different tasks85.7%
Accelerate the digitalization of work processes (e.g. use of digital tools, videoconferencing)
78.6%Accelerate the implementation of upskilling/ reskilling programmes
71.4%Accelerate automation of tasks
64.3%
Emerging and redundant job rolesRole identified as being in high demand or increasingly redundant withintheir organization, ordered by frequency
EMERGING
1. AI and Machine Learning Specialists2. Software and Applications Developers3. Data Analysts and Scientists4. Digital Transformation Specialists5. Organizational Development Specialists6. Industrial and Production Engineers7. Mathematicians, Actuaries and Statisticians8. Digital Marketing and Strategy Specialists9. Process Automation Specialists10. Advertising and Public Relations Professionals
REDUNDANT
1. Administrative and Executive Secretaries2. Data Entry Clerks3. Mechanics and Machinery Repairers4. Material-Recording and Stock-Keeping Clerks5. Business Services and Administration Managers6. Accounting, Bookkeeping and Payroll Clerks7. Accountants and Auditors8. Assembly and Factory Workers9. Sales Representatives, Wholesale and Manufacturing, Technic…10. Strategic Advisors
Technology adoptionShare of companies surveyed
Big data analytics
Internet of things and connected devices
E-commerce and digital trade
Cloud computing
Artificial intelligence (e.g. machine learning,neural networks, NLP)
Text, image and voice processing
Encryption and cyber security
Robots, non-humanoid (industrial automation,drones, etc.)
Distributed ledger technology (e.g. blockchain)
Augmented and virtual reality
Emerging skillsSkills identified as being in high demand within their organization, orderedby frequency
1. Complex problem-solving2. Leadership and social influence3. Analytical thinking and innovation4. Active learning and learning strategies5. Resilience, stress tolerance and flexibility6. Critical thinking and analysis7. Technology use, monitoring and control8. Troubleshooting and user experience9. Creativity, originality and initiative10. Technology design and programming11. Systems analysis and evaluation12. Service orientation13. Reasoning, problem-solving and ideation14. Emotional intelligence15. Attention to detail, trustworthiness
Country Profile
Saudi ArabiaWorking Age Population
20,518,2781 / 2
73.9%
68.8%
51.1%
31.5%
71.3%
71%
7.6%
0.8%
16.1%
64.4%
3%
30.3%
4.5%
Unemployment rate—
Unemployment, monthly—
Unemployment rate change—
Unemployment rate change, women—
Unemployment rate change, men—
94%
93%
93%
88%
86%
81%
81%
64%
64%
64%
The Future of Jobs 101

Current skills in focus of existing reskilling/upskillingprogrammesShare of companies surveyed identifying this skill as being in focusacross their reskilling or upskilling programmes
1. Leadership and social influence2. Active learning and learning strategies3. Analytical thinking and innovation4. Quality control and safety awareness5. Emotional intelligence6. Technology use, monitoring and control7. Management of personnel8. Resilience, stress tolerance and flexibility9. Persuasion and negotiation10. Management of financial, material resources
Responses to shifting skill needsShare of companies surveyed
Expect existing employees to pick up skills onthe job
Hire new permanent staff with skills relevant tonew technologies
Look to automate the work
Strategic redundancies of staff who lack the skillsto use new technologies
Hire new temporary staff with skills relevant tonew technologies
Hire freelancers with skills relevant to newtechnologies
Outsource some business functions to externalcontractors
Average reskilling needsShare of workforce of companies surveyed within this data
Projected use of training providersShare of companies surveyed
49.3% Internal learning and development
25.9% External online training
9.4% Private training providers
7% Public training providers
4.5% Private educational institutions
3.9% Public educational institutions
2 / 2
93%
93%
87%
67%
64%
43%
40%
DURATION OF RESKILLING
Less than 1 month25.3%
1 to 3 months26.5%
3 to 6 months20.3%
6 to 12 months12.2%
Over 1 year15.6%
The Future of Jobs 102
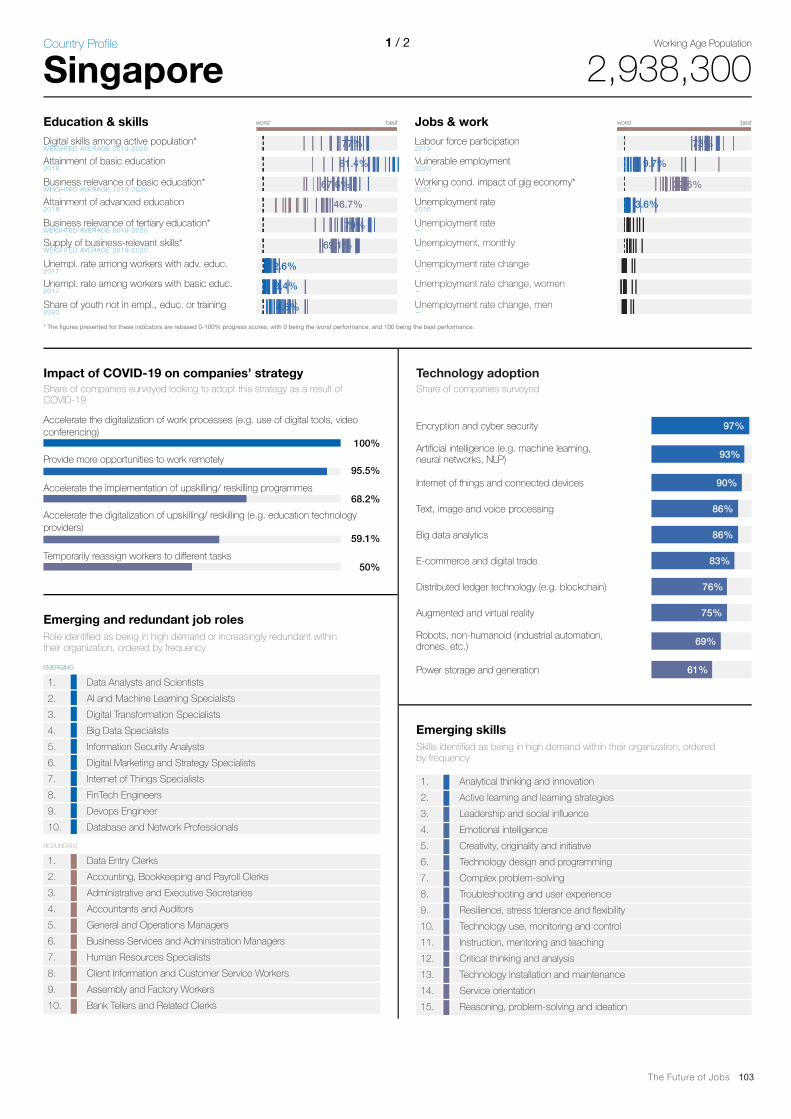
Education & skills worst best
Digital skills among active population*WEIGHTED AVERAGE 2019-2020
Attainment of basic education2018
Business relevance of basic education*WEIGHTED AVERAGE 2019-2020
Attainment of advanced education2018
Business relevance of tertiary education*WEIGHTED AVERAGE 2019-2020
Supply of business-relevant skills*WEIGHTED AVERAGE 2019-2020
Unempl. rate among workers with adv. educ.2017
Unempl. rate among workers with basic educ.2017
Share of youth not in empl., educ. or training2020
Jobs & work worst best
Labour force participation2019
Vulnerable employment2020
Working cond. impact of gig economy*2020
Unemployment rate2016
* The figures presented for these indicators are rebased 0-100% progress scores, with 0 being the worst performance, and 100 being the best performance.
Impact of COVID-19 on companies’ strategyShare of companies surveyed looking to adopt this strategy as a result ofCOVID-19
Accelerate the digitalization of work processes (e.g. use of digital tools, videoconferencing)
100%Provide more opportunities to work remotely
95.5%Accelerate the implementation of upskilling/ reskilling programmes
68.2%Accelerate the digitalization of upskilling/ reskilling (e.g. education technologyproviders)
59.1%Temporarily reassign workers to different tasks
50%
Emerging and redundant job rolesRole identified as being in high demand or increasingly redundant withintheir organization, ordered by frequency
EMERGING
1. Data Analysts and Scientists2. AI and Machine Learning Specialists3. Digital Transformation Specialists4. Big Data Specialists5. Information Security Analysts6. Digital Marketing and Strategy Specialists7. Internet of Things Specialists8. FinTech Engineers9. Devops Engineer10. Database and Network Professionals
REDUNDANT
1. Data Entry Clerks2. Accounting, Bookkeeping and Payroll Clerks3. Administrative and Executive Secretaries4. Accountants and Auditors5. General and Operations Managers6. Business Services and Administration Managers7. Human Resources Specialists8. Client Information and Customer Service Workers9. Assembly and Factory Workers10. Bank Tellers and Related Clerks
Technology adoptionShare of companies surveyed
Encryption and cyber security
Artificial intelligence (e.g. machine learning,neural networks, NLP)
Internet of things and connected devices
Text, image and voice processing
Big data analytics
E-commerce and digital trade
Distributed ledger technology (e.g. blockchain)
Augmented and virtual reality
Robots, non-humanoid (industrial automation,drones, etc.)
Power storage and generation
Emerging skillsSkills identified as being in high demand within their organization, orderedby frequency
1. Analytical thinking and innovation2. Active learning and learning strategies3. Leadership and social influence4. Emotional intelligence5. Creativity, originality and initiative6. Technology design and programming7. Complex problem-solving8. Troubleshooting and user experience9. Resilience, stress tolerance and flexibility10. Technology use, monitoring and control11. Instruction, mentoring and teaching12. Critical thinking and analysis13. Technology installation and maintenance14. Service orientation15. Reasoning, problem-solving and ideation
Country Profile
SingaporeWorking Age Population
2,938,3001 / 2
77%
81.4%
67.6%
46.7%
79%
69.1%
2.6%
3.4%
4.6%
73%
9.7%
32.6%
3.6%
Unemployment rate—
Unemployment, monthly—
Unemployment rate change—
Unemployment rate change, women—
Unemployment rate change, men—
97%
93%
90%
86%
86%
83%
76%
75%
69%
61%
The Future of Jobs 103

Current skills in focus of existing reskilling/upskillingprogrammesShare of companies surveyed identifying this skill as being in focusacross their reskilling or upskilling programmes
1. Analytical thinking and innovation2. Critical thinking and analysis3. Leadership and social influence4. Active learning and learning strategies5. Creativity, originality and initiative6. Emotional intelligence7. Resilience, stress tolerance and flexibility8. Complex problem-solving9. Technology design and programming10. Technology use, monitoring and control
Responses to shifting skill needsShare of companies surveyed
Hire new permanent staff with skills relevant tonew technologies
Expect existing employees to pick up skills onthe job
Look to automate the work
Hire new temporary staff with skills relevant tonew technologies
Hire freelancers with skills relevant to newtechnologies
Outsource some business functions to externalcontractors
Strategic redundancies of staff who lack the skillsto use new technologies
Average reskilling needsShare of workforce of companies surveyed within this data
Projected use of training providersShare of companies surveyed
42.4% Internal learning and development
24% External online training
15% Private training providers
7.2% Private educational institutions
7.2% Public training providers
4.2% Public educational institutions
2 / 2
92%
92%
84%
67%
62%
54%
43%
DURATION OF RESKILLING
Less than 1 month27.4%
1 to 3 months15.8%
3 to 6 months17.7%
6 to 12 months16.9%
Over 1 year22.1%
The Future of Jobs 104

Education & skills worst best
Digital skills among active population*WEIGHTED AVERAGE 2019-2020
Business relevance of basic education*WEIGHTED AVERAGE 2019-2020
Business relevance of tertiary education*WEIGHTED AVERAGE 2019-2020
Supply of business-relevant skills*WEIGHTED AVERAGE 2019-2020
Unempl. rate among workers with adv. educ.2019
Unempl. rate among workers with basic educ.2019
Share of youth not in empl., educ. or training2020
Jobs & work worst best
Labour force participation2019
Vulnerable employment2020
Working cond. impact of gig economy*2020
Unemployment rate2019
* The figures presented for these indicators are rebased 0-100% progress scores, with 0 being the worst performance, and 100 being the best performance.
Impact of COVID-19 on companies’ strategyShare of companies surveyed looking to adopt this strategy as a result ofCOVID-19
Accelerate automation of tasks75%
Provide more opportunities to work remotely62.5%
Accelerate the digitalization of work processes (e.g. use of digital tools, videoconferencing)
62.5%Accelerate ongoing organizational transformations (e.g. restructuring)
37.5%Accelerate the digitalization of upskilling/ reskilling (e.g. education technologyproviders)
37.5%
Emerging and redundant job rolesRole identified as being in high demand or increasingly redundant withintheir organization, ordered by frequency
EMERGING
1. Process Automation Specialists2. Data Analysts and Scientists3. Social Psychologists4. Management and Organisation Analysts5. Business Development Professionals6. Big Data Specialists7. Assembly and Factory Workers8. Compliance Officers9. Chemists and Chemical Laboratory Scientists10. AI and Machine Learning Specialists
REDUNDANT
1. Accounting, Bookkeeping and Payroll Clerks2. Client Information and Customer Service Workers3. Data Entry Clerks4. Administrative and Executive Secretaries5. Vehicle, Window, Laundry and Other Hand Cleaning Workers6. Sales Representatives, Wholesale and Manufacturing, Technic…7. Insurance Underwriters8. Business Services and Administration Managers9. Assembly and Factory Workers10. Accountants and Auditors
Technology adoptionShare of companies surveyed
Cloud computing
Artificial intelligence (e.g. machine learning,neural networks, NLP)
Text, image and voice processing
Internet of things and connected devices
Encryption and cyber security
Big data analytics
Robots, non-humanoid (industrial automation,drones, etc.)
Augmented and virtual reality
E-commerce and digital trade
Distributed ledger technology (e.g. blockchain)
Emerging skillsSkills identified as being in high demand within their organization, orderedby frequency
1. Analytical thinking and innovation2. Critical thinking and analysis3. Troubleshooting and user experience4. Leadership and social influence5. Complex problem-solving6. Systems analysis and evaluation7. Creativity, originality and initiative8. Technology use, monitoring and control9. Quality control and safety awareness10. Persuasion and negotiation11. Emotional intelligence12. Technology installation and maintenance13. Resilience, stress tolerance and flexibility14. Reasoning, problem-solving and ideation15. Active learning and learning strategies
Country Profile
South AfricaWorking Age Population
31,627,3891 / 2
29.9%Attainment of basic education—
29.9%Attainment of advanced education—
49.7%
44.4%
11.8%
31.6%
32.7%
64.9%
10.3%
46.2%
24.8%
Unemployment rate—
Unemployment, monthly—
Unemployment rate change—
Unemployment rate change, women—
Unemployment rate change, men—
93%
93%
87%
87%
87%
87%
86%
80%
79%
71%
The Future of Jobs 105

Current skills in focus of existing reskilling/upskillingprogrammesShare of companies surveyed identifying this skill as being in focusacross their reskilling or upskilling programmes
1. Analytical thinking and innovation2. Complex problem-solving3. Technology design and programming4. Quality control and safety awareness5. Leadership and social influence6. Critical thinking and analysis7. Reasoning, problem-solving and ideation8. Creativity, originality and initiative9. Resilience, stress tolerance and flexibility10. Active learning and learning strategies
Responses to shifting skill needsShare of companies surveyed
Look to automate the work
Retrain existing employees
Strategic redundancies of staff who lack the skillsto use new technologies
Outsource some business functions to externalcontractors
Hire new temporary staff with skills relevant tonew technologies
Hire freelancers with skills relevant to newtechnologies
Expect existing employees to pick up skills onthe job
Average reskilling needsShare of workforce of companies surveyed within this data
Projected use of training providersShare of companies surveyed
55.9% Internal learning and development
15.8% External online training
9.5% Private training providers
7.3% Public educational institutions
7.3% Public training providers
4.2% Private educational institutions
2 / 2
82%
73%
64%
64%
64%
55%
–
DURATION OF RESKILLING
Less than 1 month15.7%
1 to 3 months27.7%
3 to 6 months18%
6 to 12 months22.2%
Over 1 year16.4%
The Future of Jobs 106

Education & skills worst best
Digital skills among active population*WEIGHTED AVERAGE 2019-2020
Attainment of basic education2018
Business relevance of basic education*WEIGHTED AVERAGE 2019-2020
Attainment of advanced education2018
Business relevance of tertiary education*WEIGHTED AVERAGE 2019-2020
Supply of business-relevant skills*WEIGHTED AVERAGE 2019-2020
Unempl. rate among workers with adv. educ.2019
Unempl. rate among workers with basic educ.2019
Share of youth not in empl., educ. or training2020
Jobs & work worst best
Labour force participation2019
Vulnerable employment2020
Working cond. impact of gig economy*2020
Unemployment rate2019
Unemployment rateQ2 2020
Unemployment, monthlyJULY 2020
Unemployment rate change2019- Q2 2020 YOY CH.
Unemployment rate change, women2019- Q2 2020 YOY CH.
Unemployment rate change, men2019- Q2 2020 YOY CH.
* The figures presented for these indicators are rebased 0-100% progress scores, with 0 being the worst performance, and 100 being the best performance.
Impact of COVID-19 on companies’ strategyShare of companies surveyed looking to adopt this strategy as a result ofCOVID-19
Accelerate the digitalization of work processes (e.g. use of digital tools, videoconferencing)
92.9%Provide more opportunities to work remotely
85.7%Accelerate the digitalization of upskilling/ reskilling (e.g. education technologyproviders)
78.6%Accelerate automation of tasks
64.3%Accelerate ongoing organizational transformations (e.g. restructuring)
50%
Emerging and redundant job rolesRole identified as being in high demand or increasingly redundant withintheir organization, ordered by frequency
EMERGING
1. Internet of Things Specialists2. Data Analysts and Scientists3. Big Data Specialists4. AI and Machine Learning Specialists5. Digital Transformation Specialists6. Software and Applications Developers7. Project Managers8. Process Automation Specialists9. FinTech Engineers10. Assembly and Factory Workers
REDUNDANT
1. Data Entry Clerks2. Administrative and Executive Secretaries3. Accounting, Bookkeeping and Payroll Clerks4. Accountants and Auditors5. Statistical, Finance and Insurance Clerks6. Business Services and Administration Managers7. Financial Analysts8. Client Information and Customer Service Workers9. Claims Adjusters, Examiners, and Investigators10. Assembly and Factory Workers
Technology adoptionShare of companies surveyed
Big data analytics
Artificial intelligence (e.g. machine learning,neural networks, NLP)
Cloud computing
Encryption and cyber security
E-commerce and digital trade
Text, image and voice processing
Augmented and virtual reality
Distributed ledger technology (e.g. blockchain)
New materials (e.g. nanotubes, graphene)
Robots, non-humanoid (industrial automation,drones, etc.)
Emerging skillsSkills identified as being in high demand within their organization, orderedby frequency
1. Analytical thinking and innovation2. Active learning and learning strategies3. Critical thinking and analysis4. Creativity, originality and initiative5. Complex problem-solving6. Technology use, monitoring and control7. Resilience, stress tolerance and flexibility8. Leadership and social influence9. Technology design and programming10. Emotional intelligence11. Systems analysis and evaluation12. Persuasion and negotiation13. Troubleshooting and user experience14. Service orientation15. Reasoning, problem-solving and ideation
Country Profile
SpainWorking Age Population
35,092,1881 / 2
55.2%
77.7%
52.4%
31.1%
65.9%
59.7%
8%
18.2%
12.2%
61.2%
11%
45.5%
12.8%
15.3%
13.7%
1.1%
0.8%
1.5%
96%
96%
92%
88%
88%
84%
77%
74%
70%
68%
The Future of Jobs 107

Current skills in focus of existing reskilling/upskillingprogrammesShare of companies surveyed identifying this skill as being in focusacross their reskilling or upskilling programmes
1. Analytical thinking and innovation2. Active learning and learning strategies3. Critical thinking and analysis4. Technology use, monitoring and control5. Leadership and social influence6. Complex problem-solving7. Management of personnel8. Systems analysis and evaluation9. Service orientation10. Quality control and safety awareness
Responses to shifting skill needsShare of companies surveyed
Retrain existing employees
Look to automate the work
Hire new permanent staff with skills relevant tonew technologies
Hire new temporary staff with skills relevant tonew technologies
Outsource some business functions to externalcontractors
Hire freelancers with skills relevant to newtechnologies
Strategic redundancies of staff who lack the skillsto use new technologies
Average reskilling needsShare of workforce of companies surveyed within this data
Projected use of training providersShare of companies surveyed
45.5% Internal learning and development
22.1% External online training
16.6% Private training providers
6.8% Private educational institutions
5.7% Public educational institutions
3.4% Public training providers
2 / 2
95%
85%
85%
70%
45%
45%
33%
DURATION OF RESKILLING
Less than 1 month21.2%
1 to 3 months15.4%
3 to 6 months15.4%
6 to 12 months16.8%
Over 1 year31.2%
The Future of Jobs 108

Education & skills worst best
Digital skills among active population*WEIGHTED AVERAGE 2019-2020
Attainment of basic education2018
Business relevance of basic education*WEIGHTED AVERAGE 2019-2020
Attainment of advanced education2018
Business relevance of tertiary education*WEIGHTED AVERAGE 2019-2020
Supply of business-relevant skills*WEIGHTED AVERAGE 2019-2020
Unempl. rate among workers with adv. educ.2019
Unempl. rate among workers with basic educ.2019
Share of youth not in empl., educ. or training2020
Jobs & work worst best
Labour force participation2019
Vulnerable employment2020
Working cond. impact of gig economy*2020
Unemployment rate2019
Unemployment rateQ2 2020
Unemployment, monthlyJUNE 2020
Unemployment rate change2019- Q2 2020 YOY CH.
Unemployment rate change, women2019- Q2 2020 YOY CH.
Unemployment rate change, men2019- Q2 2020 YOY CH.
* The figures presented for these indicators are rebased 0-100% progress scores, with 0 being the worst performance, and 100 being the best performance.
Impact of COVID-19 on companies’ strategyShare of companies surveyed looking to adopt this strategy as a result ofCOVID-19
Provide more opportunities to work remotely90.9%
Accelerate the digitalization of work processes (e.g. use of digital tools, videoconferencing)
90.9%Accelerate automation of tasks
72.7%Accelerate the digitalization of upskilling/ reskilling (e.g. education technologyproviders)
45.5%Accelerate the implementation of upskilling/ reskilling programmes
45.5%
Emerging and redundant job rolesRole identified as being in high demand or increasingly redundant withintheir organization, ordered by frequency
EMERGING
1. Data Analysts and Scientists2. AI and Machine Learning Specialists3. Digital Transformation Specialists4. Process Automation Specialists5. Big Data Specialists6. Strategic Advisors7. Internet of Things Specialists8. Information Security Analysts9. Database and Network Professionals10. Biologists and Geneticists
REDUNDANT
1. Accounting, Bookkeeping and Payroll Clerks2. Data Entry Clerks3. Administrative and Executive Secretaries4. Accountants and Auditors5. Business Services and Administration Managers6. Human Resources Specialists7. Financial Analysts8. Claims Adjusters, Examiners, and Investigators9. Cashiers and Ticket Clerks10. Assembly and Factory Workers
Technology adoptionShare of companies surveyed
Encryption and cyber security
Big data analytics
Artificial intelligence (e.g. machine learning,neural networks, NLP)
E-commerce and digital trade
Internet of things and connected devices
Distributed ledger technology (e.g. blockchain)
Text, image and voice processing
Augmented and virtual reality
3D and 4D printing and modelling
Robots, non-humanoid (industrial automation,drones, etc.)
Emerging skillsSkills identified as being in high demand within their organization, orderedby frequency
1. Analytical thinking and innovation2. Active learning and learning strategies3. Complex problem-solving4. Technology use, monitoring and control5. Technology design and programming6. Resilience, stress tolerance and flexibility7. Critical thinking and analysis8. Instruction, mentoring and teaching9. Emotional intelligence10. Service orientation11. Creativity, originality and initiative12. Systems analysis and evaluation13. Technology installation and maintenance14. Reasoning, problem-solving and ideation15. Leadership and social influence
Country Profile
SwitzerlandWorking Age Population
6,326,8391 / 2
72%
97.1%
77.9%
39%
82.3%
62.7%
3.2%
7.5%
6.7%
68.5%
8.9%
40.9%
3.9%
4.1%
4.1%
0.2%
-0.4%
0.8%
95%
91%
90%
90%
86%
80%
77%
76%
71%
65%
The Future of Jobs 109

Current skills in focus of existing reskilling/upskillingprogrammesShare of companies surveyed identifying this skill as being in focusacross their reskilling or upskilling programmes
1. Complex problem-solving2. Analytical thinking and innovation3. Active learning and learning strategies4. Critical thinking and analysis5. Emotional intelligence6. Technology use, monitoring and control7. Resilience, stress tolerance and flexibility8. Leadership and social influence9. Technology design and programming10. Service orientation
Responses to shifting skill needsShare of companies surveyed
Look to automate the work
Retrain existing employees
Expect existing employees to pick up skills onthe job
Hire new temporary staff with skills relevant tonew technologies
Outsource some business functions to externalcontractors
Hire freelancers with skills relevant to newtechnologies
Strategic redundancies of staff who lack the skillsto use new technologies
Average reskilling needsShare of workforce of companies surveyed within this data
Projected use of training providersShare of companies surveyed
35.5% Internal learning and development
25.4% External online training
17.2% Private training providers
8.3% Private educational institutions
7.1% Public training providers
6.5% Public educational institutions
2 / 2
94%
88%
88%
76%
47%
47%
38%
DURATION OF RESKILLING
Less than 1 month20.6%
1 to 3 months15.5%
3 to 6 months22.2%
6 to 12 months19.5%
Over 1 year22.3%
The Future of Jobs 110

Education & skills worst best
Digital skills among active population*WEIGHTED AVERAGE 2019-2020
Attainment of basic education2016
Business relevance of basic education*WEIGHTED AVERAGE 2019-2020
Attainment of advanced education2016
Business relevance of tertiary education*WEIGHTED AVERAGE 2019-2020
Supply of business-relevant skills*WEIGHTED AVERAGE 2019-2020
Unempl. rate among workers with adv. educ.2019
Unempl. rate among workers with basic educ.2019
Share of youth not in empl., educ. or training2020
Jobs & work worst best
Labour force participation2019
Vulnerable employment2020
Working cond. impact of gig economy*2020
Unemployment rate2019
Unemployment rateQ2 2020
Unemployment rate change2019- Q2 2020 YOY CH.
Unemployment rate change, women2019- Q2 2020 YOY CH.
Unemployment rate change, men2019- Q2 2020 YOY CH.
* The figures presented for these indicators are rebased 0-100% progress scores, with 0 being the worst performance, and 100 being the best performance.
Impact of COVID-19 on companies’ strategyShare of companies surveyed looking to adopt this strategy as a result ofCOVID-19
Accelerate the digitalization of work processes (e.g. use of digital tools, videoconferencing)
84.4%Provide more opportunities to work remotely
75%Accelerate automation of tasks
50%Accelerate the implementation of upskilling/ reskilling programmes
40.6%Accelerate the digitalization of upskilling/ reskilling (e.g. education technologyproviders)
34.4%
Emerging and redundant job rolesRole identified as being in high demand or increasingly redundant withintheir organization, ordered by frequency
EMERGING
1. Data Analysts and Scientists2. Digital Marketing and Strategy Specialists3. Big Data Specialists4. AI and Machine Learning Specialists5. Software and Applications Developers6. Supply Chain and Logistics Specialists7. Strategic Advisors8. Database and Network Professionals9. Commercial and Industrial Designers10. Business Development Professionals
REDUNDANT
1. Data Entry Clerks2. Administrative and Executive Secretaries3. Accounting, Bookkeeping and Payroll Clerks4. Assembly and Factory Workers5. Construction Laborers6. Sales Representatives, Wholesale and Manufacturing, Technic…7. Human Resources Specialists8. Financial and Investment Advisers9. Client Information and Customer Service Workers10. Business Services and Administration Managers
Technology adoptionShare of companies surveyed
Cloud computing
Internet of things and connected devices
Encryption and cyber security
E-commerce and digital trade
Big data analytics
Artificial intelligence (e.g. machine learning,neural networks, NLP)
Text, image and voice processing
Robots, non-humanoid (industrial automation,drones, etc.)
Power storage and generation
Distributed ledger technology (e.g. blockchain)
Emerging skillsSkills identified as being in high demand within their organization, orderedby frequency
1. Analytical thinking and innovation2. Complex problem-solving3. Active learning and learning strategies4. Critical thinking and analysis5. Creativity, originality and initiative6. Troubleshooting and user experience7. Leadership and social influence8. Resilience, stress tolerance and flexibility9. Technology design and programming10. Technology use, monitoring and control11. Reasoning, problem-solving and ideation12. Technology installation and maintenance13. Management of personnel14. Attention to detail, trustworthiness15. Emotional intelligence
Country Profile
ThailandWorking Age Population
47,215,9191 / 2
54.9%
45.1%
46%
19.1%
60.5%
53.6%
0.6%
0.3%
14.4%
72.2%
48.2%
39.7%
0.3%
0.5%Unemployment, monthly—
0.3%
0.2%
0.3%
98%
95%
90%
87%
85%
80%
76%
67%
62%
59%
The Future of Jobs 111

Current skills in focus of existing reskilling/upskillingprogrammesShare of companies surveyed identifying this skill as being in focusacross their reskilling or upskilling programmes
1. Analytical thinking and innovation2. Active learning and learning strategies3. Critical thinking and analysis4. Leadership and social influence5. Complex problem-solving6. Creativity, originality and initiative7. Technology use, monitoring and control8. Technology design and programming9. Reasoning, problem-solving and ideation10. Resilience, stress tolerance and flexibility
Responses to shifting skill needsShare of companies surveyed
Expect existing employees to pick up skills onthe job
Outsource some business functions to externalcontractors
Hire new permanent staff with skills relevant tonew technologies
Look to automate the work
Retrain existing employees
Strategic redundancies of staff who lack the skillsto use new technologies
Hire freelancers with skills relevant to newtechnologies
Average reskilling needsShare of workforce of companies surveyed within this data
Projected use of training providersShare of companies surveyed
37.6% Internal learning and development
19.2% Private training providers
17% External online training
11.2% Public training providers
7.8% Public educational institutions
7.2% Private educational institutions
2 / 2
91%
81%
81%
78%
75%
59%
56%
DURATION OF RESKILLING
Less than 1 month25.2%
1 to 3 months23.1%
3 to 6 months17.5%
6 to 12 months14.3%
Over 1 year19.9%
The Future of Jobs 112

Education & skills worst best
Digital skills among active population*WEIGHTED AVERAGE 2019-2020
Attainment of basic education2018
Business relevance of basic education*WEIGHTED AVERAGE 2019-2020
Attainment of advanced education2018
Business relevance of tertiary education*WEIGHTED AVERAGE 2019-2020
Supply of business-relevant skills*WEIGHTED AVERAGE 2019-2020
Unempl. rate among workers with adv. educ.2017
Unempl. rate among workers with basic educ.2017
Share of youth not in empl., educ. or training2020
Jobs & work worst best
Labour force participation2019
Vulnerable employment2020
Working cond. impact of gig economy*2020
Unemployment rate2019
* The figures presented for these indicators are rebased 0-100% progress scores, with 0 being the worst performance, and 100 being the best performance.
Impact of COVID-19 on companies’ strategyShare of companies surveyed looking to adopt this strategy as a result ofCOVID-19
Provide more opportunities to work remotely89.6%
Accelerate the digitalization of work processes (e.g. use of digital tools, videoconferencing)
77.1%Accelerate automation of tasks
47.9%Temporarily reassign workers to different tasks
45.8%Accelerate the implementation of upskilling/ reskilling programmes
39.6%
Emerging and redundant job rolesRole identified as being in high demand or increasingly redundant withintheir organization, ordered by frequency
EMERGING
1. Data Analysts and Scientists2. Digital Marketing and Strategy Specialists3. Business Development Professionals4. AI and Machine Learning Specialists5. Digital Transformation Specialists6. Process Automation Specialists7. Organizational Development Specialists8. General and Operations Managers9. Database and Network Professionals10. Big Data Specialists
REDUNDANT
1. Administrative and Executive Secretaries2. Data Entry Clerks3. Accounting, Bookkeeping and Payroll Clerks4. Postal Service Clerks5. Business Services and Administration Managers6. Mechanics and Machinery Repairers7. Accountants and Auditors8. Material-Recording and Stock-Keeping Clerks9. Client Information and Customer Service Workers10. Cashiers and Ticket Clerks
Technology adoptionShare of companies surveyed
Big data analytics
Internet of things and connected devices
Encryption and cyber security
Cloud computing
E-commerce and digital trade
Text, image and voice processing
Artificial intelligence (e.g. machine learning,neural networks, NLP)
Power storage and generation
Augmented and virtual reality
Distributed ledger technology (e.g. blockchain)
Emerging skillsSkills identified as being in high demand within their organization, orderedby frequency
1. Analytical thinking and innovation2. Complex problem-solving3. Critical thinking and analysis4. Active learning and learning strategies5. Leadership and social influence6. Technology use, monitoring and control7. Creativity, originality and initiative8. Service orientation9. Resilience, stress tolerance and flexibility10. Emotional intelligence11. Technology design and programming12. Troubleshooting and user experience13. Quality control and safety awareness14. Systems analysis and evaluation15. Persuasion and negotiation
Country Profile
United Arab EmiratesWorking Age Population
8,112,7861 / 2
71.7%
82.9%
65.3%
51.8%
71%
70.5%
3.3%
0.8%
11.4%
85.2%
0.9%
32.5%
1.8%
Unemployment rate—
Unemployment, monthly—
Unemployment rate change—
Unemployment rate change, women—
Unemployment rate change, men—
89%
84%
84%
84%
81%
77%
76%
65%
57%
56%
The Future of Jobs 113

Current skills in focus of existing reskilling/upskillingprogrammesShare of companies surveyed identifying this skill as being in focusacross their reskilling or upskilling programmes
1. Active learning and learning strategies2. Leadership and social influence3. Analytical thinking and innovation4. Quality control and safety awareness5. Complex problem-solving6. Critical thinking and analysis7. Management of personnel8. Creativity, originality and initiative9. Technology use, monitoring and control10. Service orientation
Responses to shifting skill needsShare of companies surveyed
Expect existing employees to pick up skills onthe job
Retrain existing employees
Hire new permanent staff with skills relevant tonew technologies
Look to automate the work
Outsource some business functions to externalcontractors
Hire new temporary staff with skills relevant tonew technologies
Strategic redundancies of staff who lack the skillsto use new technologies
Average reskilling needsShare of workforce of companies surveyed within this data
Projected use of training providersShare of companies surveyed
44.3% Internal learning and development
20.4% External online training
15.5% Private training providers
8.2% Public training providers
6.5% Private educational institutions
5.1% Public educational institutions
2 / 2
98%
86%
84%
78%
50%
49%
48%
DURATION OF RESKILLING
Less than 1 month30.6%
1 to 3 months21.4%
3 to 6 months18.6%
6 to 12 months13.1%
Over 1 year16.4%
The Future of Jobs 114

Education & skills worst best
Digital skills among active population*WEIGHTED AVERAGE 2019-2020
Attainment of basic education2017
Business relevance of basic education*WEIGHTED AVERAGE 2019-2020
Attainment of advanced education2017
Business relevance of tertiary education*WEIGHTED AVERAGE 2019-2020
Supply of business-relevant skills*WEIGHTED AVERAGE 2019-2020
Unempl. rate among workers with adv. educ.2019
Unempl. rate among workers with basic educ.2019
Share of youth not in empl., educ. or training2020
Jobs & work worst best
Labour force participation2019
Vulnerable employment2020
Working cond. impact of gig economy*2020
Unemployment rate2019
Unemployment rateQ2 2020
Unemployment, monthlyJUNE 2020
Unemployment rate change2019- Q2 2020 YOY CH.
Unemployment rate change, women2019- Q2 2020 YOY CH.
Unemployment rate change, men2019- Q2 2020 YOY CH.
* The figures presented for these indicators are rebased 0-100% progress scores, with 0 being the worst performance, and 100 being the best performance.
Impact of COVID-19 on companies’ strategyShare of companies surveyed looking to adopt this strategy as a result ofCOVID-19
Accelerate the digitalization of work processes (e.g. use of digital tools, videoconferencing)
94.3%Provide more opportunities to work remotely
91.4%Accelerate the digitalization of upskilling/ reskilling (e.g. education technologyproviders)
65.7%Accelerate automation of tasks
57.1%Accelerate the implementation of upskilling/ reskilling programmes
48.6%
Emerging and redundant job rolesRole identified as being in high demand or increasingly redundant withintheir organization, ordered by frequency
EMERGING
1. Data Analysts and Scientists2. AI and Machine Learning Specialists3. Big Data Specialists4. Internet of Things Specialists5. Digital Transformation Specialists6. Process Automation Specialists7. Information Security Analysts8. FinTech Engineers9. Database and Network Professionals10. Business Development Professionals
REDUNDANT
1. Data Entry Clerks2. Accounting, Bookkeeping and Payroll Clerks3. Administrative and Executive Secretaries4. Accountants and Auditors5. General and Operations Managers6. Client Information and Customer Service Workers7. Assembly and Factory Workers8. Business Services and Administration Managers9. Statistical, Finance and Insurance Clerks10. Bank Tellers and Related Clerks
Technology adoptionShare of companies surveyed
Cloud computing
Encryption and cyber security
Big data analytics
Artificial intelligence (e.g. machine learning,neural networks, NLP)
Internet of things and connected devices
Text, image and voice processing
E-commerce and digital trade
Augmented and virtual reality
Distributed ledger technology (e.g. blockchain)
Robots, non-humanoid (industrial automation,drones, etc.)
Emerging skillsSkills identified as being in high demand within their organization, orderedby frequency
1. Active learning and learning strategies2. Analytical thinking and innovation3. Creativity, originality and initiative4. Complex problem-solving5. Critical thinking and analysis6. Emotional intelligence7. Resilience, stress tolerance and flexibility8. Leadership and social influence9. Technology design and programming10. Reasoning, problem-solving and ideation11. Systems analysis and evaluation12. Technology use, monitoring and control13. Service orientation14. Persuasion and negotiation15. Instruction, mentoring and teaching
Country Profile
United KingdomWorking Age Population
46,380,3581 / 2
61%
99.7%
52.6%
44.1%
62.5%
58.6%
2%
4.6%
11.1%
64.3%
12.9%
47.5%
2.7%
2.5%
2.7%
-0.1%
-0.2%
0%
95%
95%
94%
94%
92%
88%
81%
75%
73%
69%
The Future of Jobs 115

Current skills in focus of existing reskilling/upskillingprogrammesShare of companies surveyed identifying this skill as being in focusacross their reskilling or upskilling programmes
1. Analytical thinking and innovation2. Leadership and social influence3. Active learning and learning strategies4. Critical thinking and analysis5. Technology design and programming6. Technology use, monitoring and control7. Emotional intelligence8. Complex problem-solving9. Service orientation10. Resilience, stress tolerance and flexibility
Responses to shifting skill needsShare of companies surveyed
Retrain existing employees
Hire new permanent staff with skills relevant tonew technologies
Expect existing employees to pick up skills onthe job
Look to automate the work
Hire new temporary staff with skills relevant tonew technologies
Hire freelancers with skills relevant to newtechnologies
Outsource some business functions to externalcontractors
Average reskilling needsShare of workforce of companies surveyed within this data
Projected use of training providersShare of companies surveyed
43.7% Internal learning and development
21.7% External online training
17.1% Private training providers
7.4% Private educational institutions
6% Public educational institutions
4.2% Public training providers
2 / 2
98%
94%
94%
90%
73%
61%
55%
DURATION OF RESKILLING
Less than 1 month23.4%
1 to 3 months18.5%
3 to 6 months17.1%
6 to 12 months16.7%
Over 1 year24.3%
The Future of Jobs 116

Education & skills worst best
Digital skills among active population*WEIGHTED AVERAGE 2019-2020
Attainment of basic education2018
Business relevance of basic education*WEIGHTED AVERAGE 2019-2020
Attainment of advanced education2018
Business relevance of tertiary education*WEIGHTED AVERAGE 2019-2020
Supply of business-relevant skills*WEIGHTED AVERAGE 2019-2020
Unempl. rate among workers with adv. educ.2019
Unempl. rate among workers with basic educ.2019
Share of youth not in empl., educ. or training2020
Jobs & work worst best
Labour force participation2019
Vulnerable employment2020
Working cond. impact of gig economy*2020
Unemployment rate2019
Unemployment rateQ2 2020
Unemployment, monthlyAUGUST 2020
Unemployment rate change2019- Q2 2020 YOY CH.
Unemployment rate change, women2019- Q2 2020 YOY CH.
Unemployment rate change, men2019- Q2 2020 YOY CH.
* The figures presented for these indicators are rebased 0-100% progress scores, with 0 being the worst performance, and 100 being the best performance.
Impact of COVID-19 on companies’ strategyShare of companies surveyed looking to adopt this strategy as a result ofCOVID-19
Accelerate the digitalization of work processes (e.g. use of digital tools, videoconferencing)
91.5%Provide more opportunities to work remotely
86.4%Accelerate automation of tasks
57.6%Accelerate the digitalization of upskilling/ reskilling (e.g. education technologyproviders)
54.2%Accelerate the implementation of upskilling/ reskilling programmes
44.1%
Emerging and redundant job rolesRole identified as being in high demand or increasingly redundant withintheir organization, ordered by frequency
EMERGING
1. AI and Machine Learning Specialists2. Data Analysts and Scientists3. Big Data Specialists4. Internet of Things Specialists5. Digital Transformation Specialists6. Process Automation Specialists7. Project Managers8. Information Security Analysts9. Digital Marketing and Strategy Specialists10. Business Development Professionals
REDUNDANT
1. Data Entry Clerks2. Accounting, Bookkeeping and Payroll Clerks3. Administrative and Executive Secretaries4. Assembly and Factory Workers5. Accountants and Auditors6. Client Information and Customer Service Workers7. Business Services and Administration Managers8. General and Operations Managers9. Mechanics and Machinery Repairers10. Human Resources Specialists
Technology adoptionShare of companies surveyed
Cloud computing
Internet of things and connected devices
Artificial intelligence (e.g. machine learning,neural networks, NLP)
Encryption and cyber security
Big data analytics
Text, image and voice processing
E-commerce and digital trade
Robots, non-humanoid (industrial automation,drones, etc.)
Augmented and virtual reality
Distributed ledger technology (e.g. blockchain)
Emerging skillsSkills identified as being in high demand within their organization, orderedby frequency
1. Analytical thinking and innovation2. Active learning and learning strategies3. Complex problem-solving4. Critical thinking and analysis5. Resilience, stress tolerance and flexibility6. Creativity, originality and initiative7. Leadership and social influence8. Reasoning, problem-solving and ideation9. Emotional intelligence10. Technology design and programming11. Technology use, monitoring and control12. Systems analysis and evaluation13. Troubleshooting and user experience14. Service orientation15. Persuasion and negotiation
Country Profile
United StatesWorking Age Population
221,426,9621 / 2
69.4%
96%
64.5%
45.2%
70.5%
69.7%
2.2%
4.3%
14.1%
64.3%
3.8%
24.8%
3%
12.2%
7.7%
8.5%
9.3%
7.7%
96%
95%
93%
90%
90%
82%
81%
78%
77%
65%
The Future of Jobs 117

Current skills in focus of existing reskilling/upskillingprogrammesShare of companies surveyed identifying this skill as being in focusacross their reskilling or upskilling programmes
1. Analytical thinking and innovation2. Leadership and social influence3. Active learning and learning strategies4. Critical thinking and analysis5. Technology design and programming6. Complex problem-solving7. Technology use, monitoring and control8. Creativity, originality and initiative9. Emotional intelligence10. Reasoning, problem-solving and ideation
Responses to shifting skill needsShare of companies surveyed
Retrain existing employees
Expect existing employees to pick up skills onthe job
Hire new permanent staff with skills relevant tonew technologies
Look to automate the work
Hire new temporary staff with skills relevant tonew technologies
Outsource some business functions to externalcontractors
Hire freelancers with skills relevant to newtechnologies
Average reskilling needsShare of workforce of companies surveyed within this data
Projected use of training providersShare of companies surveyed
42.8% Internal learning and development
21.9% External online training
14.3% Private training providers
8.1% Public educational institutions
7% Private educational institutions
5.9% Public training providers
2 / 2
95%
93%
91%
85%
67%
54%
51%
DURATION OF RESKILLING
Less than 1 month18.7%
1 to 3 months18.7%
3 to 6 months17.7%
6 to 12 months17%
Over 1 year28%
The Future of Jobs 118

The Future of Jobs October 2020
The Future of Jobs 119
Industry Profiles

14%Average share of workers at risk
of displacement
Expected redeploymentsuccess rate of displaced
workers
41.3%
Average skillsinstability among
workforce
43.6%
Technology adoption in industryShare of companies surveyed
Cloud computing
Internet of things and connected devices
Robots, non-humanoid (industrial automation,drones, etc.)
E-commerce and digital trade
Big data analytics
Encryption and cyber security
3D and 4D printing and modelling
Artificial intelligence (e.g. machine learning, neuralnetworks, NLP)
Text, image and voice processing
Power storage and generation
Impact of COVID-19 on companies’ strategyShare of companies surveyed looking to adopt this strategy as a result ofCOVID-19
Provide more opportunities to work remotely76.9%
Accelerate the digitalization of work processes (e.g. use of digital tools, videoconferencing)
73.1%Accelerate automation of tasks
57.7%Temporarily reduce workforce
38.5%Accelerate ongoing organizational transformations (e.g. restructuring)
38.5%
Emerging skillsSkills identified as being in high demand within their organization, orderedby frequency
1. Technology use, monitoring and control2. Critical thinking and analysis3. Active learning and learning strategies4. Leadership and social influence5. Analytical thinking and innovation6. Reasoning, problem-solving and ideation7. Complex problem-solving8. Service orientation9. Resilience, stress tolerance and flexibility10. Technology design and programming11. Troubleshooting and user experience12. Systems analysis and evaluation13. Coordination and time management14. Quality control and safety awareness15. Attention to detail, trustworthiness
Emerging and redundant job rolesRole identified as being in high demand or increasingly redundant withintheir organization, ordered by frequency
EMERGING
1. Business Development Professionals2. Software and Applications Developers3. Sales Representatives, Wholesale and Manufacturing, Technic…4. Robotics Engineers5. Internet of Things Specialists6. Data Analysts and Scientists7. Project Managers8. Power Production Plant Operators9. Assembly and Factory Workers10. AI and Machine Learning Specialists
REDUNDANT
1. Assembly and Factory Workers2. Relationship Managers3. Business Services and Administration Managers4. Sales Representatives, Wholesale and Manufacturing, Technic…5. Administrative and Executive Secretaries6. General and Operations Managers7. Door-To-Door Sales Workers, News and Street Vendors, and R…8. Data Entry Clerks9. Accounting, Bookkeeping and Payroll Clerks10. Accountants and Auditors
Industry Profile
Advanced Manufacturing1 / 2
89%
87%
85%
83%
76%
74%
74%
68%
62%
58%
The Future of Jobs 120

Barriers to adoption of new technologiesShare of companies surveyed
Skills gaps in the local labour market
Skills gaps among organization’s leadership
Inability to attract specialized talent
Shortage of investment capital
Insufficient understanding of opportunities
Lack of flexibility of the regulatory framework
Lack of flexibility in hiring and firing
Lack of interest among leadership
Other
Augmentation of key job tasks by 2024
Expected impact on workforceShare of companies surveyed
Modify the composition of the value chain67.7%
Expand its use of contractors doing task-specialized work48.4%
Reduce its current workforce due to technological integration or automation45.2%
Modify the locations where the organization operates41.9%
Expand its current workforce due to technological integration or automation41.9%
Current skills in focus of existing reskilling/upskillingprogrammesShare of companies surveyed identifying this skill as being in focusacross their reskilling or upskilling programmes
1. Technology use, monitoring and control2. Analytical thinking and innovation3. Complex problem-solving4. Technology installation and maintenance5. Critical thinking and analysis6. Technology design and programming7. Quality control and safety awareness8. Service orientation9. Management of financial, material resources10. Leadership and social influence
Average reskilling needsShare of workforce within this industry
2 / 2
67.7%
54.8%
45.2%
41.9%
38.7%
25.8%
19.4%
9.7%
6.5%
DURATION OF RESKILLING
Less than 1 month26.8%
1 to 3 months22.4%
3 to 6 months16.6%
6 to 12 months20.6%
Over 1 year13.6%
Machine share Human share
Information and data processing
Performing physical and manual work activities
Looking for and receiving job-related information
All tasks
Identifying and evaluating job-relevant information
Administering
Performing complex and technical activities
Communicating and interacting
Coordinating, developing, managing and advising
Reasoning and decision-making
38.3%
44.1%
46%
48.5%
49.9%
52.2%
52.6%
59%
62.5%
67.4%
The Future of Jobs 121

11.2%Average share of workers at risk
of displacement
Expected redeploymentsuccess rate of displaced
workers
47.6%
Average skillsinstability among
workforce
35.8%
Technology adoption in industryShare of companies surveyed
Internet of things and connected devices
Big data analytics
E-commerce and digital trade
Power storage and generation
Cloud computing
Artificial intelligence (e.g. machine learning, neuralnetworks, NLP)
Robots, non-humanoid (industrial automation,drones, etc.)
3D and 4D printing and modelling
Text, image and voice processing
Biotechnology
Impact of COVID-19 on companies’ strategyShare of companies surveyed looking to adopt this strategy as a result ofCOVID-19
Accelerate the digitalization of work processes (e.g. use of digital tools, videoconferencing)
75%Provide more opportunities to work remotely
66.7%Temporarily reduce workforce
50%Accelerate the digitalization of upskilling/ reskilling (e.g. education technologyproviders)
41.7%Accelerate the implementation of upskilling/ reskilling programmes
41.7%
Emerging skillsSkills identified as being in high demand within their organization, orderedby frequency
1. Active learning and learning strategies2. Analytical thinking and innovation3. Technology use, monitoring and control4. Quality control and safety awareness5. Creativity, originality and initiative6. Management of personnel7. Leadership and social influence8. Instruction, mentoring and teaching9. Emotional intelligence10. Complex problem-solving11. Reasoning, problem-solving and ideation12. Management of financial, material resources13. Critical thinking and analysis14. Attention to detail, trustworthiness15. Coordination and time management
Emerging and redundant job rolesRole identified as being in high demand or increasingly redundant withintheir organization, ordered by frequency
EMERGING
1. Data Analysts and Scientists2. Car, Van and Motorcycle Drivers3. Digital Marketing and Strategy Specialists4. Database and Network Professionals5. Cashiers and Ticket Clerks6. Business Services and Administration Managers7. Business Development Professionals8. Big Data Specialists9. AI and Machine Learning Specialists10. Advertising and Public Relations Professionals
REDUNDANT
1. Data Entry Clerks2. Administrative and Executive Secretaries3. Business Services and Administration Managers4. Accounting, Bookkeeping and Payroll Clerks5. Internet of Things Specialists6. Food Processing and Related Trades Workers7. Construction Laborers8. Assembly and Factory Workers9. AI and Machine Learning Specialists10. Accountants and Auditors
Industry Profile
Agriculture, Food and Beverage1 / 2
88%
86%
80%
75%
75%
62%
54%
54%
50%
50%
The Future of Jobs 122
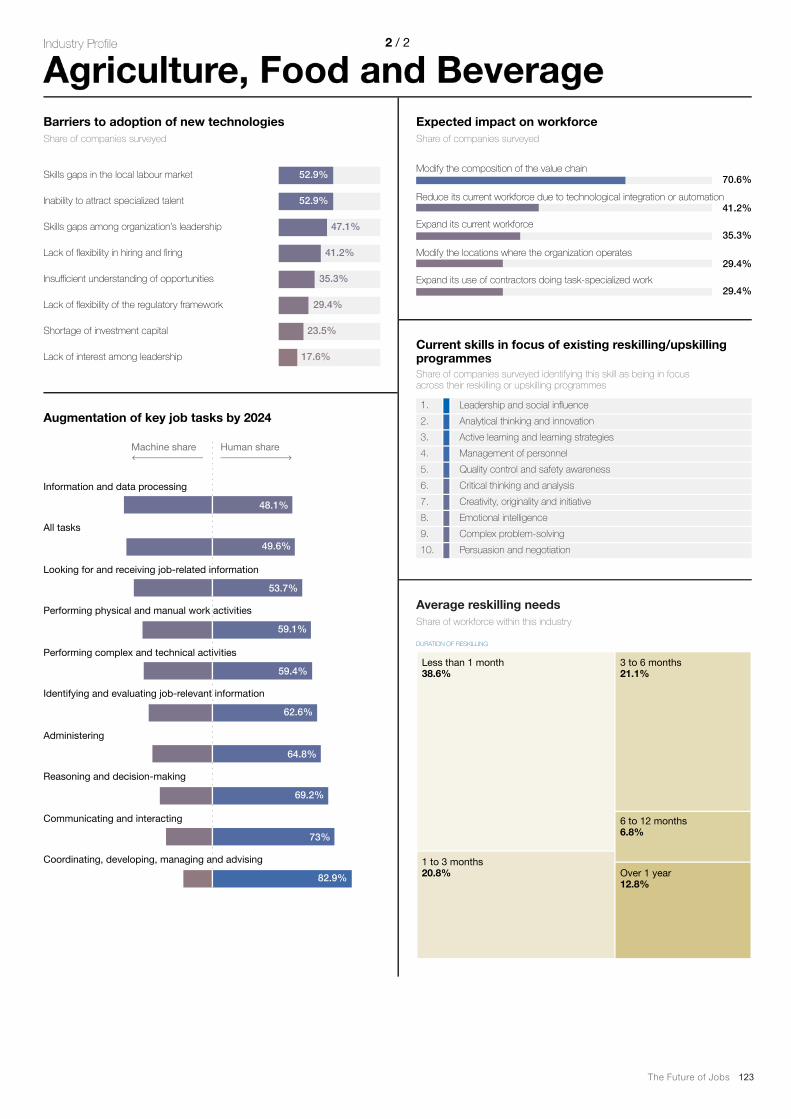
Barriers to adoption of new technologiesShare of companies surveyed
Skills gaps in the local labour market
Inability to attract specialized talent
Skills gaps among organization’s leadership
Lack of flexibility in hiring and firing
Insufficient understanding of opportunities
Lack of flexibility of the regulatory framework
Shortage of investment capital
Lack of interest among leadership
Augmentation of key job tasks by 2024
Expected impact on workforceShare of companies surveyed
Modify the composition of the value chain70.6%
Reduce its current workforce due to technological integration or automation41.2%
Expand its current workforce35.3%
Modify the locations where the organization operates29.4%
Expand its use of contractors doing task-specialized work29.4%
Current skills in focus of existing reskilling/upskillingprogrammesShare of companies surveyed identifying this skill as being in focusacross their reskilling or upskilling programmes
1. Leadership and social influence2. Analytical thinking and innovation3. Active learning and learning strategies4. Management of personnel5. Quality control and safety awareness6. Critical thinking and analysis7. Creativity, originality and initiative8. Emotional intelligence9. Complex problem-solving10. Persuasion and negotiation
Average reskilling needsShare of workforce within this industry
2 / 2
52.9%
52.9%
47.1%
41.2%
35.3%
29.4%
23.5%
17.6%
DURATION OF RESKILLING
Less than 1 month38.6%
1 to 3 months20.8%
3 to 6 months21.1%
6 to 12 months6.8%
Over 1 year12.8%
Machine share Human share
Information and data processing
All tasks
Looking for and receiving job-related information
Performing physical and manual work activities
Performing complex and technical activities
Identifying and evaluating job-relevant information
Administering
Reasoning and decision-making
Communicating and interacting
Coordinating, developing, managing and advising
48.1%
49.6%
53.7%
59.1%
59.4%
62.6%
64.8%
69.2%
73%
82.9%
The Future of Jobs 123

19.1%Average share of workers at risk
of displacement
Expected redeploymentsuccess rate of displaced
workers
44.4%
Average skillsinstability among
workforce
55.2%
Technology adoption in industryShare of companies surveyed
Big data analytics
Encryption and cyber security
Internet of things and connected devices
Cloud computing
Artificial intelligence (e.g. machine learning, neuralnetworks, NLP)
E-commerce and digital trade
3D and 4D printing and modelling
Power storage and generation
Robots, non-humanoid (industrial automation,drones, etc.)
Text, image and voice processing
Impact of COVID-19 on companies’ strategyShare of companies surveyed looking to adopt this strategy as a result ofCOVID-19
Accelerate the digitalization of work processes (e.g. use of digital tools, videoconferencing)
82.4%Provide more opportunities to work remotely
64.7%Accelerate ongoing organizational transformations (e.g. restructuring)
58.8%Temporarily reduce workforce
41.2%Accelerate automation of tasks
41.2%
Emerging skillsSkills identified as being in high demand within their organization, orderedby frequency
1. Analytical thinking and innovation2. Critical thinking and analysis3. Complex problem-solving4. Systems analysis and evaluation5. Resilience, stress tolerance and flexibility6. Active learning and learning strategies7. Creativity, originality and initiative8. Troubleshooting and user experience9. Reasoning, problem-solving and ideation10. Attention to detail, trustworthiness11. Technology use, monitoring and control12. Technology design and programming13. Persuasion and negotiation14. Technology installation and maintenance15. Management of personnel
Emerging and redundant job rolesRole identified as being in high demand or increasingly redundant withintheir organization, ordered by frequency
EMERGING
1. Data Analysts and Scientists2. Business Development Professionals3. AI and Machine Learning Specialists4. Strategic Advisors5. Materials Engineers6. Management and Organisation Analysts7. Digital Transformation Specialists8. Database and Network Professionals9. Environmental Protection Professionals10. Robotics Engineers
REDUNDANT
1. Data Entry Clerks2. Administrative and Executive Secretaries3. Accounting, Bookkeeping and Payroll Clerks4. Material-Recording and Stock-Keeping Clerks5. Cashiers and Ticket Clerks6. Assembly and Factory Workers7. Accountants and Auditors8. Sales Representatives, Wholesale and Manufacturing, Technic…9. Door-To-Door Sales Workers, News and Street Vendors, and R…10. Agricultural Inspectors
Industry Profile
Automotive1 / 2
88%
88%
82%
80%
76%
75%
67%
64%
60%
59%
The Future of Jobs 124
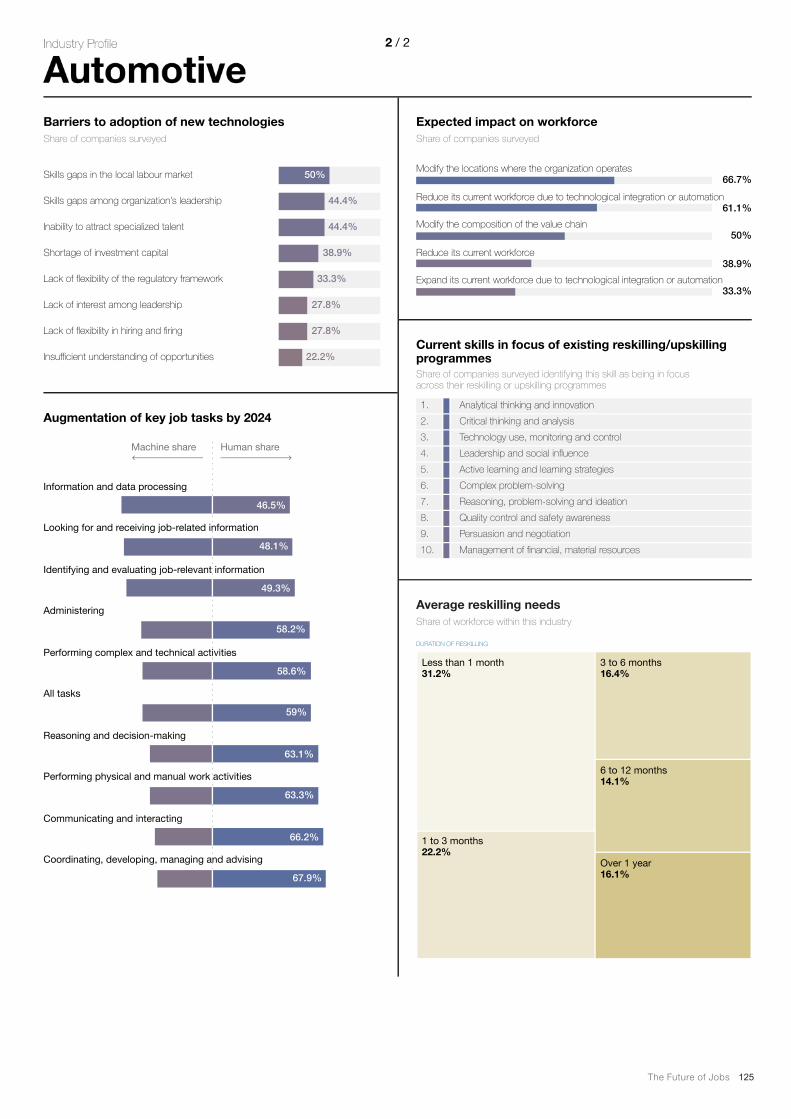
Barriers to adoption of new technologiesShare of companies surveyed
Skills gaps in the local labour market
Skills gaps among organization’s leadership
Inability to attract specialized talent
Shortage of investment capital
Lack of flexibility of the regulatory framework
Lack of interest among leadership
Lack of flexibility in hiring and firing
Insufficient understanding of opportunities
Augmentation of key job tasks by 2024
Expected impact on workforceShare of companies surveyed
Modify the locations where the organization operates66.7%
Reduce its current workforce due to technological integration or automation61.1%
Modify the composition of the value chain50%
Reduce its current workforce38.9%
Expand its current workforce due to technological integration or automation33.3%
Current skills in focus of existing reskilling/upskillingprogrammesShare of companies surveyed identifying this skill as being in focusacross their reskilling or upskilling programmes
1. Analytical thinking and innovation2. Critical thinking and analysis3. Technology use, monitoring and control4. Leadership and social influence5. Active learning and learning strategies6. Complex problem-solving7. Reasoning, problem-solving and ideation8. Quality control and safety awareness9. Persuasion and negotiation10. Management of financial, material resources
Average reskilling needsShare of workforce within this industry
2 / 2
50%
44.4%
44.4%
38.9%
33.3%
27.8%
27.8%
22.2%
DURATION OF RESKILLING
Less than 1 month31.2%
1 to 3 months22.2%
3 to 6 months16.4%
6 to 12 months14.1%
Over 1 year16.1%
Machine share Human share
Information and data processing
Looking for and receiving job-related information
Identifying and evaluating job-relevant information
Administering
Performing complex and technical activities
All tasks
Reasoning and decision-making
Performing physical and manual work activities
Communicating and interacting
Coordinating, developing, managing and advising
46.5%
48.1%
49.3%
58.2%
58.6%
59%
63.1%
63.3%
66.2%
67.9%
The Future of Jobs 125

16.8%Average share of workers at risk
of displacement
Expected redeploymentsuccess rate of displaced
workers
49.9%
Average skillsinstability among
workforce
43.2%
Technology adoption in industryShare of companies surveyed
Internet of things and connected devices
Big data analytics
Encryption and cyber security
E-commerce and digital trade
Cloud computing
Text, image and voice processing
Artificial intelligence (e.g. machine learning, neuralnetworks, NLP)
Power storage and generation
Augmented and virtual reality
Robots, non-humanoid (industrial automation,drones, etc.)
Impact of COVID-19 on companies’ strategyShare of companies surveyed looking to adopt this strategy as a result ofCOVID-19
Provide more opportunities to work remotely81%
Accelerate the digitalization of work processes (e.g. use of digital tools, videoconferencing)
76.2%Accelerate automation of tasks
52.4%Temporarily reassign workers to different tasks
47.6%Permanently reduce workforce
38.1%
Emerging skillsSkills identified as being in high demand within their organization, orderedby frequency
1. Complex problem-solving2. Analytical thinking and innovation3. Active learning and learning strategies4. Creativity, originality and initiative5. Technology use, monitoring and control6. Leadership and social influence7. Critical thinking and analysis8. Troubleshooting and user experience9. Service orientation10. Systems analysis and evaluation11. Management of financial, material resources12. Attention to detail, trustworthiness13. Coordination and time management14. Quality control and safety awareness15. Reasoning, problem-solving and ideation
Emerging and redundant job rolesRole identified as being in high demand or increasingly redundant withintheir organization, ordered by frequency
EMERGING
1. Data Analysts and Scientists2. Big Data Specialists3. AI and Machine Learning Specialists4. Process Automation Specialists5. Food Processing and Related Trades Workers6. Organizational Development Specialists7. Management and Organisation Analysts8. Database and Network Professionals9. Business Development Professionals10. Assembly and Factory Workers
REDUNDANT
1. Data Entry Clerks2. Administrative and Executive Secretaries3. Accounting, Bookkeeping and Payroll Clerks4. Accountants and Auditors5. Mechanics and Machinery Repairers6. Sales Representatives, Wholesale and Manufacturing, Technic…7. Material-Recording and Stock-Keeping Clerks8. Door-To-Door Sales Workers, News and Street Vendors, and R…9. Client Information and Customer Service Workers10. Assembly and Factory Workers
Industry Profile
Consumer1 / 2
94%
91%
85%
85%
82%
82%
73%
59%
58%
52%
The Future of Jobs 126

Barriers to adoption of new technologiesShare of companies surveyed
Skills gaps in the local labour market
Insufficient understanding of opportunities
Inability to attract specialized talent
Skills gaps among organization’s leadership
Shortage of investment capital
Lack of interest among leadership
Lack of flexibility in hiring and firing
Lack of flexibility of the regulatory framework
Other
Augmentation of key job tasks by 2024
Expected impact on workforceShare of companies surveyed
Modify the composition of the value chain58.8%
Reduce its current workforce due to technological integration or automation32.4%
Modify the locations where the organization operates32.4%
Expand its current workforce due to technological integration or automation32.4%
Expand its current workforce32.4%
Current skills in focus of existing reskilling/upskillingprogrammesShare of companies surveyed identifying this skill as being in focusacross their reskilling or upskilling programmes
1. Active learning and learning strategies2. Management of personnel3. Leadership and social influence4. Analytical thinking and innovation5. Creativity, originality and initiative6. Service orientation7. Critical thinking and analysis8. Coordination and time management9. Complex problem-solving10. Reasoning, problem-solving and ideation
Average reskilling needsShare of workforce within this industry
2 / 2
48.5%
42.4%
36.4%
33.3%
24.2%
21.2%
21.2%
18.2%
3%
DURATION OF RESKILLING
Less than 1 month24%
1 to 3 months26.9%
3 to 6 months22.4%
6 to 12 months12.5%
Over 1 year14.2%
Machine share Human share
Information and data processing
Looking for and receiving job-related information
Identifying and evaluating job-relevant information
All tasks
Performing complex and technical activities
Administering
Performing physical and manual work activities
Communicating and interacting
Reasoning and decision-making
Coordinating, developing, managing and advising
38.3%
45.5%
50.3%
50.7%
53.9%
56.4%
59.6%
64.7%
65.8%
72.5%
The Future of Jobs 127

17.5%Average share of workers at risk
of displacement
Expected redeploymentsuccess rate of displaced
workers
49.4%
Average skillsinstability among
workforce
44.1%
Technology adoption in industryShare of companies surveyed
Cloud computing
Big data analytics
Artificial intelligence (e.g. machine learning, neuralnetworks, NLP)
Encryption and cyber security
Internet of things and connected devices
Text, image and voice processing
E-commerce and digital trade
Augmented and virtual reality
Distributed ledger technology (e.g. blockchain)
Robots, non-humanoid (industrial automation,drones, etc.)
Impact of COVID-19 on companies’ strategyShare of companies surveyed looking to adopt this strategy as a result ofCOVID-19
Accelerate the digitalization of work processes (e.g. use of digital tools, videoconferencing)
90%Provide more opportunities to work remotely
86.7%Accelerate the implementation of upskilling/ reskilling programmes
63.3%Accelerate automation of tasks
53.3%Accelerate the digitalization of upskilling/ reskilling (e.g. education technologyproviders)
50%
Emerging skillsSkills identified as being in high demand within their organization, orderedby frequency
1. Analytical thinking and innovation2. Technology design and programming3. Complex problem-solving4. Active learning and learning strategies5. Resilience, stress tolerance and flexibility6. Creativity, originality and initiative7. Critical thinking and analysis8. Reasoning, problem-solving and ideation9. Leadership and social influence10. Technology use, monitoring and control11. Emotional intelligence12. Troubleshooting and user experience13. Systems analysis and evaluation14. Service orientation15. Persuasion and negotiation
Emerging and redundant job rolesRole identified as being in high demand or increasingly redundant withintheir organization, ordered by frequency
EMERGING
1. AI and Machine Learning Specialists2. Data Analysts and Scientists3. Big Data Specialists4. Information Security Analysts5. Process Automation Specialists6. Digital Marketing and Strategy Specialists7. Software and Applications Developers8. Digital Transformation Specialists9. FinTech Engineers10. Architects and Surveyors
REDUNDANT
1. Data Entry Clerks2. Accounting, Bookkeeping and Payroll Clerks3. Administrative and Executive Secretaries4. Client Information and Customer Service Workers5. Accountants and Auditors6. General and Operations Managers7. Electronics and Telecommunications Installers and Repairers8. Architects and Surveyors9. Business Services and Administration Managers10. Financial Analysts
Industry Profile
Digital Communications and Information Technology1 / 2
95%
95%
95%
95%
92%
90%
82%
73%
72%
61%
The Future of Jobs 128

Barriers to adoption of new technologiesShare of companies surveyed
Skills gaps in the local labour market
Inability to attract specialized talent
Skills gaps among organization’s leadership
Lack of flexibility of the regulatory framework
Insufficient understanding of opportunities
Shortage of investment capital
Lack of flexibility in hiring and firing
Lack of interest among leadership
Other
Augmentation of key job tasks by 2024
Expected impact on workforceShare of companies surveyed
Modify the locations where the organization operates51.2%
Modify the composition of the value chain48.8%
Expand its use of contractors doing task-specialized work48.8%
Expand its current workforce46.5%
Expand its current workforce due to technological integration or automation39.5%
Current skills in focus of existing reskilling/upskillingprogrammesShare of companies surveyed identifying this skill as being in focusacross their reskilling or upskilling programmes
1. Analytical thinking and innovation2. Technology design and programming3. Technology use, monitoring and control4. Active learning and learning strategies5. Critical thinking and analysis6. Complex problem-solving7. Systems analysis and evaluation8. Reasoning, problem-solving and ideation9. Creativity, originality and initiative10. Leadership and social influence
Average reskilling needsShare of workforce within this industry
2 / 2
60%
55%
45%
42.5%
32.5%
30%
27.5%
17.5%
12.5%
DURATION OF RESKILLING
Less than 1 month26.2%
1 to 3 months19.7%
3 to 6 months19.3%
6 to 12 months16.1%
Over 1 year18.7%
Machine share Human share
Information and data processing
Looking for and receiving job-related information
Administering
All tasks
Performing complex and technical activities
Performing physical and manual work activities
Identifying and evaluating job-relevant information
Reasoning and decision-making
Communicating and interacting
Coordinating, developing, managing and advising
29.3%
41.7%
46.6%
49%
49.5%
50.8%
53.8%
64%
64.8%
65.2%
The Future of Jobs 129

13.9%Average share of workers at risk
of displacement
Expected redeploymentsuccess rate of displaced
workers
30.9%
Average skillsinstability among
workforce
41.3%
Technology adoption in industryShare of companies surveyed
Cloud computing
Big data analytics
Text, image and voice processing
Encryption and cyber security
Artificial intelligence (e.g. machine learning, neuralnetworks, NLP)
E-commerce and digital trade
Augmented and virtual reality
3D and 4D printing and modelling
New materials (e.g. nanotubes, graphene)
Internet of things and connected devices
Impact of COVID-19 on companies’ strategyShare of companies surveyed looking to adopt this strategy as a result ofCOVID-19
Accelerate the digitalization of work processes (e.g. use of digital tools, videoconferencing)
100%Provide more opportunities to work remotely
88.2%Accelerate the digitalization of upskilling/ reskilling (e.g. education technologyproviders)
70.6%Accelerate automation of tasks
64.7%Accelerate ongoing organizational transformations (e.g. restructuring)
35.3%
Emerging skillsSkills identified as being in high demand within their organization, orderedby frequency
1. Creativity, originality and initiative2. Active learning and learning strategies3. Technology design and programming4. Emotional intelligence5. Critical thinking and analysis6. Complex problem-solving7. Analytical thinking and innovation8. Reasoning, problem-solving and ideation9. Service orientation10. Resilience, stress tolerance and flexibility11. Leadership and social influence12. Systems analysis and evaluation13. Persuasion and negotiation14. Technology use, monitoring and control15. Instruction, mentoring and teaching
Emerging and redundant job rolesRole identified as being in high demand or increasingly redundant withintheir organization, ordered by frequency
EMERGING
1. Vocational Education Teachers2. University and Higher Education Teachers3. Strategic Advisors4. Robotics Engineers5. Management and Organisation Analysts6. Information Security Analysts7. Data Analysts and Scientists8. Business Development Professionals9. Advertising and Public Relations Professionals10. Agricultural Equipment Operators
REDUNDANT
1. Administrative and Executive Secretaries2. Accounting, Bookkeeping and Payroll Clerks3. Data Entry Clerks4. Statistical, Finance and Insurance Clerks5. Postal Service Clerks6. Business Services and Administration Managers7. Technical Specialists8. Insurance Underwriters9. Building Caretakers and Housekeepers10. Accountants and Auditors
Industry Profile
Education1 / 2
95%
95%
89%
86%
76%
72%
70%
69%
67%
62%
The Future of Jobs 130

Barriers to adoption of new technologiesShare of companies surveyed
Insufficient understanding of opportunities
Shortage of investment capital
Skills gaps in the local labour market
Skills gaps among organization’s leadership
Inability to attract specialized talent
Lack of flexibility of the regulatory framework
Lack of interest among leadership
Lack of flexibility in hiring and firing
Other
Augmentation of key job tasks by 2024
Expected impact on workforceShare of companies surveyed
Expand its current workforce57.1%
Modify the locations where the organization operates52.4%
Modify the composition of the value chain42.9%
Expand its use of contractors doing task-specialized work42.9%
Expand its current workforce due to technological integration or automation38.1%
Current skills in focus of existing reskilling/upskillingprogrammesShare of companies surveyed identifying this skill as being in focusacross their reskilling or upskilling programmes
1. Analytical thinking and innovation2. Critical thinking and analysis3. Reasoning, problem-solving and ideation4. Leadership and social influence5. Active learning and learning strategies6. Creativity, originality and initiative7. Complex problem-solving8. Emotional intelligence9. Management of personnel10. Persuasion and negotiation
Average reskilling needsShare of workforce within this industry
2 / 2
68.2%
50%
45.5%
45.5%
45.5%
31.8%
27.3%
22.7%
9.1%
DURATION OF RESKILLING
Less than 1 month25.2%
1 to 3 months24.5%
3 to 6 months17.2%
6 to 12 months12.2%
Over 1 year20.9%
Machine share Human share
Information and data processing
Administering
Identifying and evaluating job-relevant information
Looking for and receiving job-related information
Performing physical and manual work activities
Performing complex and technical activities
All tasks
Coordinating, developing, managing and advising
Communicating and interacting
Reasoning and decision-making
32.3%
45.2%
48.2%
49.1%
54.5%
54.5%
59.4%
60.9%
64.9%
67.9%
The Future of Jobs 131

11.8%Average share of workers at risk
of displacement
Expected redeploymentsuccess rate of displaced
workers
51.1%
Average skillsinstability among
workforce
39.4%
Technology adoption in industryShare of companies surveyed
Internet of things and connected devices
Text, image and voice processing
Encryption and cyber security
Cloud computing
Power storage and generation
Artificial intelligence (e.g. machine learning, neuralnetworks, NLP)
Big data analytics
Augmented and virtual reality
E-commerce and digital trade
3D and 4D printing and modelling
Impact of COVID-19 on companies’ strategyShare of companies surveyed looking to adopt this strategy as a result ofCOVID-19
Provide more opportunities to work remotely100%
Accelerate the digitalization of work processes (e.g. use of digital tools, videoconferencing)
100%Accelerate automation of tasks
69.2%Accelerate the digitalization of upskilling/ reskilling (e.g. education technologyproviders)
53.8%Accelerate the implementation of upskilling/ reskilling programmes
46.2%
Emerging skillsSkills identified as being in high demand within their organization, orderedby frequency
1. Critical thinking and analysis2. Complex problem-solving3. Creativity, originality and initiative4. Analytical thinking and innovation5. Active learning and learning strategies6. Technology design and programming7. Service orientation8. Troubleshooting and user experience9. Leadership and social influence10. Technology use, monitoring and control11. Resilience, stress tolerance and flexibility12. Emotional intelligence13. Systems analysis and evaluation14. Reasoning, problem-solving and ideation15. Attention to detail, trustworthiness
Emerging and redundant job rolesRole identified as being in high demand or increasingly redundant withintheir organization, ordered by frequency
EMERGING
1. Data Analysts and Scientists2. Renewable Energy Engineers3. Big Data Specialists4. AI and Machine Learning Specialists5. Software and Applications Developers6. Mechanics and Machinery Repairers7. Internet of Things Specialists8. Construction Laborers9. Digital Transformation Specialists10. Robotics Engineers
REDUNDANT
1. Administrative and Executive Secretaries2. Mining and Petroleum Extraction Workers3. Accounting, Bookkeeping and Payroll Clerks4. Accountants and Auditors5. Power Production Plant Operators6. Mining and Petroleum Plant Operators7. Mechanics and Machinery Repairers8. Legal Secretaries9. Data Entry Clerks10. Data Analysts and Scientists
Industry Profile
Energy Utilities & Technologies1 / 2
94%
88%
88%
88%
88%
81%
76%
75%
71%
69%
The Future of Jobs 132

Barriers to adoption of new technologiesShare of companies surveyed
Skills gaps in the local labour market
Insufficient understanding of opportunities
Lack of flexibility of the regulatory framework
Skills gaps among organization’s leadership
Shortage of investment capital
Inability to attract specialized talent
Lack of flexibility in hiring and firing
Lack of interest among leadership
Other
Augmentation of key job tasks by 2024
Expected impact on workforceShare of companies surveyed
Modify the composition of the value chain58.8%
Modify the locations where the organization operates47.1%
Expand its use of contractors doing task-specialized work41.2%
Reduce its current workforce due to technological integration or automation29.4%
Expand its current workforce due to technological integration or automation29.4%
Current skills in focus of existing reskilling/upskillingprogrammesShare of companies surveyed identifying this skill as being in focusacross their reskilling or upskilling programmes
1. Critical thinking and analysis2. Analytical thinking and innovation3. Technology design and programming4. Complex problem-solving5. Reasoning, problem-solving and ideation6. Quality control and safety awareness7. Leadership and social influence8. Systems analysis and evaluation9. Management of personnel10. Active learning and learning strategies
Average reskilling needsShare of workforce within this industry
2 / 2
70.6%
58.8%
41.2%
35.3%
35.3%
35.3%
23.5%
17.6%
5.9%
DURATION OF RESKILLING
Less than 1 month24%
1 to 3 months17.5%
3 to 6 months14.4%
6 to 12 months12.8%
Over 1 year31.4%
Machine share Human share
Information and data processing
Looking for and receiving job-related information
Performing physical and manual work activities
Performing complex and technical activities
Administering
Identifying and evaluating job-relevant information
All tasks
Communicating and interacting
Coordinating, developing, managing and advising
Reasoning and decision-making
31.6%
40.4%
45.4%
54.6%
56.8%
57.3%
61.4%
64.7%
73.3%
75%
The Future of Jobs 133

20.8%Average share of workers at risk
of displacement
Expected redeploymentsuccess rate of displaced
workers
50.5%
Average skillsinstability among
workforce
44.1%
Technology adoption in industryShare of companies surveyed
Cloud computing
Encryption and cyber security
Big data analytics
E-commerce and digital trade
Artificial intelligence (e.g. machine learning, neuralnetworks, NLP)
Text, image and voice processing
Internet of things and connected devices
Distributed ledger technology (e.g. blockchain)
Augmented and virtual reality
Power storage and generation
Impact of COVID-19 on companies’ strategyShare of companies surveyed looking to adopt this strategy as a result ofCOVID-19
Accelerate the digitalization of work processes (e.g. use of digital tools, videoconferencing)
83.3%Provide more opportunities to work remotely
76.7%Accelerate automation of tasks
43.3%Accelerate the digitalization of upskilling/ reskilling (e.g. education technologyproviders)
40%Accelerate the implementation of upskilling/ reskilling programmes
30%
Emerging skillsSkills identified as being in high demand within their organization, orderedby frequency
1. Analytical thinking and innovation2. Critical thinking and analysis3. Creativity, originality and initiative4. Complex problem-solving5. Active learning and learning strategies6. Technology design and programming7. Troubleshooting and user experience8. Emotional intelligence9. Technology use, monitoring and control10. Leadership and social influence11. Reasoning, problem-solving and ideation12. Service orientation13. Resilience, stress tolerance and flexibility14. Systems analysis and evaluation15. Instruction, mentoring and teaching
Emerging and redundant job rolesRole identified as being in high demand or increasingly redundant withintheir organization, ordered by frequency
EMERGING
1. Data Analysts and Scientists2. Big Data Specialists3. Digital Marketing and Strategy Specialists4. AI and Machine Learning Specialists5. Digital Transformation Specialists6. Information Security Analysts7. Database and Network Professionals8. Business Development Professionals9. FinTech Engineers10. Cyber Security Specialists
REDUNDANT
1. Data Entry Clerks2. Accounting, Bookkeeping and Payroll Clerks3. Administrative and Executive Secretaries4. Accountants and Auditors5. Client Information and Customer Service Workers6. Bank Tellers and Related Clerks7. Statistical, Finance and Insurance Clerks8. Insurance Underwriters9. General and Operations Managers10. Financial Analysts
Industry Profile
Financial Services1 / 2
98%
95%
91%
90%
90%
88%
88%
73%
62%
55%
The Future of Jobs 134

Barriers to adoption of new technologiesShare of companies surveyed
Skills gaps in the local labour market
Inability to attract specialized talent
Skills gaps among organization’s leadership
Lack of flexibility of the regulatory framework
Insufficient understanding of opportunities
Shortage of investment capital
Lack of flexibility in hiring and firing
Lack of interest among leadership
Augmentation of key job tasks by 2024
Expected impact on workforceShare of companies surveyed
Modify the composition of the value chain54.8%
Reduce its current workforce due to technological integration or automation50%
Modify the locations where the organization operates38.1%
Expand its current workforce due to technological integration or automation38.1%
Expand its use of contractors doing task-specialized work35.7%
Current skills in focus of existing reskilling/upskillingprogrammesShare of companies surveyed identifying this skill as being in focusacross their reskilling or upskilling programmes
1. Leadership and social influence2. Analytical thinking and innovation3. Critical thinking and analysis4. Technology design and programming5. Complex problem-solving6. Technology use, monitoring and control7. Active learning and learning strategies8. Emotional intelligence9. Resilience, stress tolerance and flexibility10. Service orientation
Average reskilling needsShare of workforce within this industry
2 / 2
58.5%
51.2%
48.8%
43.9%
41.5%
19.5%
19.5%
12.2%
DURATION OF RESKILLING
Less than 1 month26.9%
1 to 3 months17.1%
3 to 6 months13.4%
6 to 12 months19.8%
Over 1 year22.9%
Machine share Human share
Information and data processing
Looking for and receiving job-related information
Identifying and evaluating job-relevant information
Administering
All tasks
Performing complex and technical activities
Performing physical and manual work activities
Communicating and interacting
Reasoning and decision-making
Coordinating, developing, managing and advising
25.7%
42.5%
47.2%
52.7%
53.2%
55.1%
60.4%
67.7%
69.5%
69.8%
The Future of Jobs 135

14.8%Average share of workers at risk
of displacement
Expected redeploymentsuccess rate of displaced
workers
39.5%
Average skillsinstability among
workforce
39.1%
Technology adoption in industryShare of companies surveyed
Encryption and cyber security
Cloud computing
Text, image and voice processing
Big data analytics
Internet of things and connected devices
E-commerce and digital trade
Artificial intelligence (e.g. machine learning, neuralnetworks, NLP)
Augmented and virtual reality
Robots, non-humanoid (industrial automation,drones, etc.)
3D and 4D printing and modelling
Impact of COVID-19 on companies’ strategyShare of companies surveyed looking to adopt this strategy as a result ofCOVID-19
Provide more opportunities to work remotely85.7%
Accelerate the digitalization of work processes (e.g. use of digital tools, videoconferencing)
78.6%Accelerate automation of tasks
50%Temporarily reassign workers to different tasks
42.9%Accelerate the digitalization of upskilling/ reskilling (e.g. education technologyproviders)
42.9%
Emerging skillsSkills identified as being in high demand within their organization, orderedby frequency
1. Leadership and social influence2. Complex problem-solving3. Analytical thinking and innovation4. Active learning and learning strategies5. Critical thinking and analysis6. Technology design and programming7. Resilience, stress tolerance and flexibility8. Technology use, monitoring and control9. Creativity, originality and initiative10. Technology installation and maintenance11. Systems analysis and evaluation12. Service orientation13. Reasoning, problem-solving and ideation14. Attention to detail, trustworthiness15. Persuasion and negotiation
Emerging and redundant job rolesRole identified as being in high demand or increasingly redundant withintheir organization, ordered by frequency
EMERGING
1. Information Security Analysts2. Risk Management Specialists3. Digital Transformation Specialists4. Data Analysts and Scientists5. Strategic Advisors6. Software and Applications Developers7. Project Managers8. Database and Network Professionals9. Big Data Specialists10. Online Learning Managers
REDUNDANT
1. Accounting, Bookkeeping and Payroll Clerks2. Data Entry Clerks3. Administrative and Executive Secretaries4. Sales and Marketing Professionals5. Material-Recording and Stock-Keeping Clerks6. Business Services and Administration Managers7. Accountants and Auditors8. Lawyers9. Human Resources Specialists10. Compliance Officers
Industry Profile
Government and Public Sector1 / 2
95%
95%
89%
85%
79%
67%
65%
56%
50%
45%
The Future of Jobs 136

Barriers to adoption of new technologiesShare of companies surveyed
Inability to attract specialized talent
Skills gaps in the local labour market
Insufficient understanding of opportunities
Skills gaps among organization’s leadership
Lack of flexibility in hiring and firing
Shortage of investment capital
Lack of interest among leadership
Lack of flexibility of the regulatory framework
Augmentation of key job tasks by 2024
Expected impact on workforceShare of companies surveyed
Expand its current workforce47.4%
Modify the composition of the value chain36.8%
Modify the locations where the organization operates31.6%
Expand its current workforce due to technological integration or automation31.6%
Expand its use of contractors doing task-specialized work26.3%
Current skills in focus of existing reskilling/upskillingprogrammesShare of companies surveyed identifying this skill as being in focusacross their reskilling or upskilling programmes
1. Analytical thinking and innovation2. Critical thinking and analysis3. Leadership and social influence4. Active learning and learning strategies5. Complex problem-solving6. Resilience, stress tolerance and flexibility7. Emotional intelligence8. Technology use, monitoring and control9. Quality control and safety awareness10. Management of personnel
Average reskilling needsShare of workforce within this industry
2 / 2
55%
50%
50%
40%
40%
25%
20%
20%
DURATION OF RESKILLING
Less than 1 month27.3%
1 to 3 months24.9%
3 to 6 months15.9%
6 to 12 months21.8%
Over 1 year10.1%
Machine share Human share
Information and data processing
Looking for and receiving job-related information
All tasks
Administering
Performing physical and manual work activities
Performing complex and technical activities
Identifying and evaluating job-relevant information
Reasoning and decision-making
Communicating and interacting
Coordinating, developing, managing and advising
28.9%
54.1%
57.5%
57.6%
59.9%
59.9%
60.5%
65.8%
69.7%
73.7%
The Future of Jobs 137

10.6%
Average share of workers at risk of displacement
Expected redeploymentsuccess rate of displaced
workers
44.2%
Average skillsinstability among
workforce
48.2%
Technology adoption in industryShare of companies surveyed
Internet of things and connected devices
Big data analytics
Artificial intelligence (e.g. machine learning, neuralnetworks, NLP)
Text, image and voice processing
Encryption and cyber security
Cloud computing
E-commerce and digital trade
Distributed ledger technology (e.g. blockchain)
Augmented and virtual reality
3D and 4D printing and modelling
Impact of COVID-19 on companies’ strategyShare of companies surveyed looking to adopt this strategy as a result ofCOVID-19
Provide more opportunities to work remotely100%
Accelerate the digitalization of work processes (e.g. use of digital tools, videoconferencing)
87.5%Accelerate automation of tasks
56.2%Accelerate the digitalization of upskilling/ reskilling (e.g. education technologyproviders)
37.5%Temporarily reassign workers to different tasks
31.2%
Emerging skillsSkills identified as being in high demand within their organization, orderedby frequency
1. Active learning and learning strategies2. Emotional intelligence3. Creativity, originality and initiative4. Leadership and social influence5. Resilience, stress tolerance and flexibility6. Reasoning, problem-solving and ideation7. Service orientation8. Complex problem-solving9. Troubleshooting and user experience10. Persuasion and negotiation11. Technology use, monitoring and control12. Technology design and programming13. Quality control and safety awareness14. Critical thinking and analysis15. Coordination and time management
Emerging and redundant job rolesRole identified as being in high demand or increasingly redundant withintheir organization, ordered by frequency
EMERGING
1. Data Analysts and Scientists2. AI and Machine Learning Specialists3. Social Science Research Assistants4. Internet of Things Specialists5. Information Security Analysts6. Digital Marketing and Strategy Specialists7. Biologists and Geneticists8. Specialist Medical Practitioners9. Digital Transformation Specialists10. Training and Development Specialists
REDUNDANT
1. Data Entry Clerks2. Accounting, Bookkeeping and Payroll Clerks3. Waiters and Bartenders4. Business Services and Administration Managers5. Human Resources Specialists6. Electronics and Telecommunications Installers and Repairers7. Door-To-Door Sales Workers, News and Street Vendors, and R…8. Assembly and Factory Workers9. Administrative and Executive Secretaries10. Accountants and Auditors
Industry Profile
Health and Healthcare1 / 2
95%
89%
89%
88%
84%
84%
78%
72%
67%
65%
The Future of Jobs 138
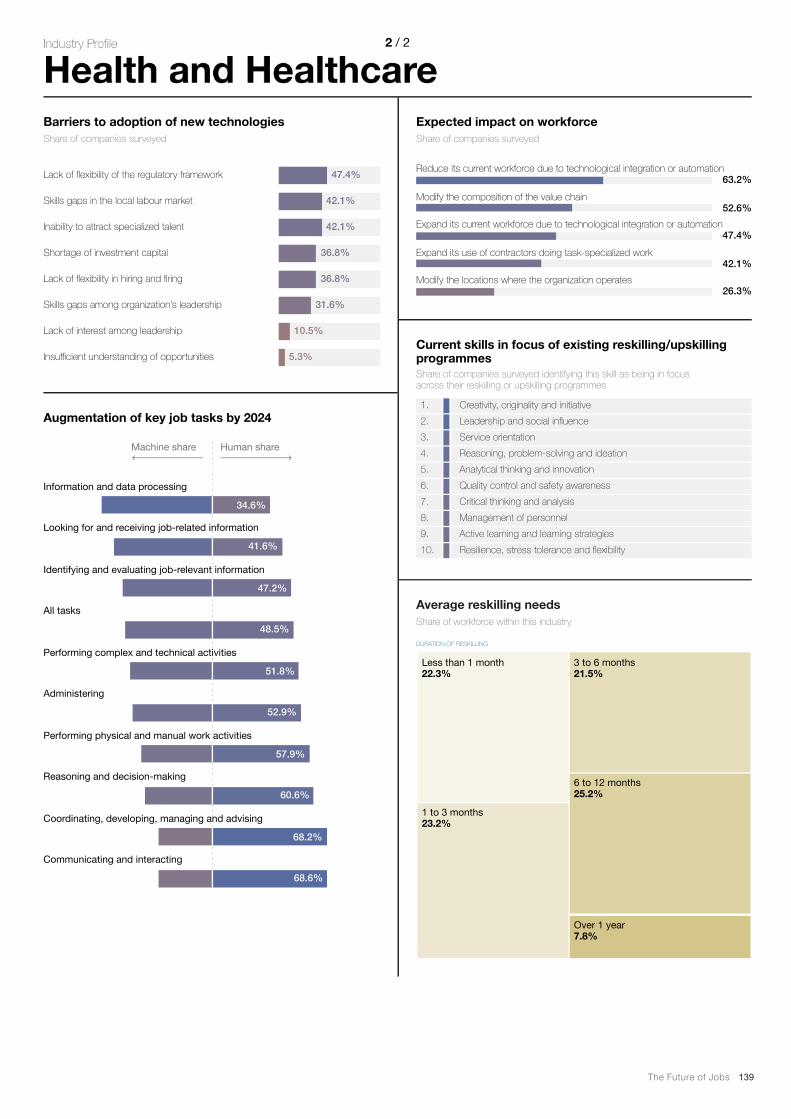
Barriers to adoption of new technologiesShare of companies surveyed
Lack of flexibility of the regulatory framework
Skills gaps in the local labour market
Inability to attract specialized talent
Shortage of investment capital
Lack of flexibility in hiring and firing
Skills gaps among organization’s leadership
Lack of interest among leadership
Insufficient understanding of opportunities
Augmentation of key job tasks by 2024
Expected impact on workforceShare of companies surveyed
Reduce its current workforce due to technological integration or automation63.2%
Modify the composition of the value chain52.6%
Expand its current workforce due to technological integration or automation47.4%
Expand its use of contractors doing task-specialized work42.1%
Modify the locations where the organization operates26.3%
Current skills in focus of existing reskilling/upskillingprogrammesShare of companies surveyed identifying this skill as being in focusacross their reskilling or upskilling programmes
1. Creativity, originality and initiative2. Leadership and social influence3. Service orientation4. Reasoning, problem-solving and ideation5. Analytical thinking and innovation6. Quality control and safety awareness7. Critical thinking and analysis8. Management of personnel9. Active learning and learning strategies10. Resilience, stress tolerance and flexibility
Average reskilling needsShare of workforce within this industry
2 / 2
47.4%
42.1%
42.1%
36.8%
36.8%
31.6%
10.5%
5.3%
DURATION OF RESKILLING
Less than 1 month22.3%
1 to 3 months23.2%
3 to 6 months21.5%
6 to 12 months25.2%
Over 1 year7.8%
Machine share Human share
Information and data processing
Looking for and receiving job-related information
Identifying and evaluating job-relevant information
All tasks
Performing complex and technical activities
Administering
Performing physical and manual work activities
Reasoning and decision-making
Coordinating, developing, managing and advising
Communicating and interacting
34.6%
41.6%
47.2%
48.5%
51.8%
52.9%
57.9%
60.6%
68.2%
68.6%
The Future of Jobs 139
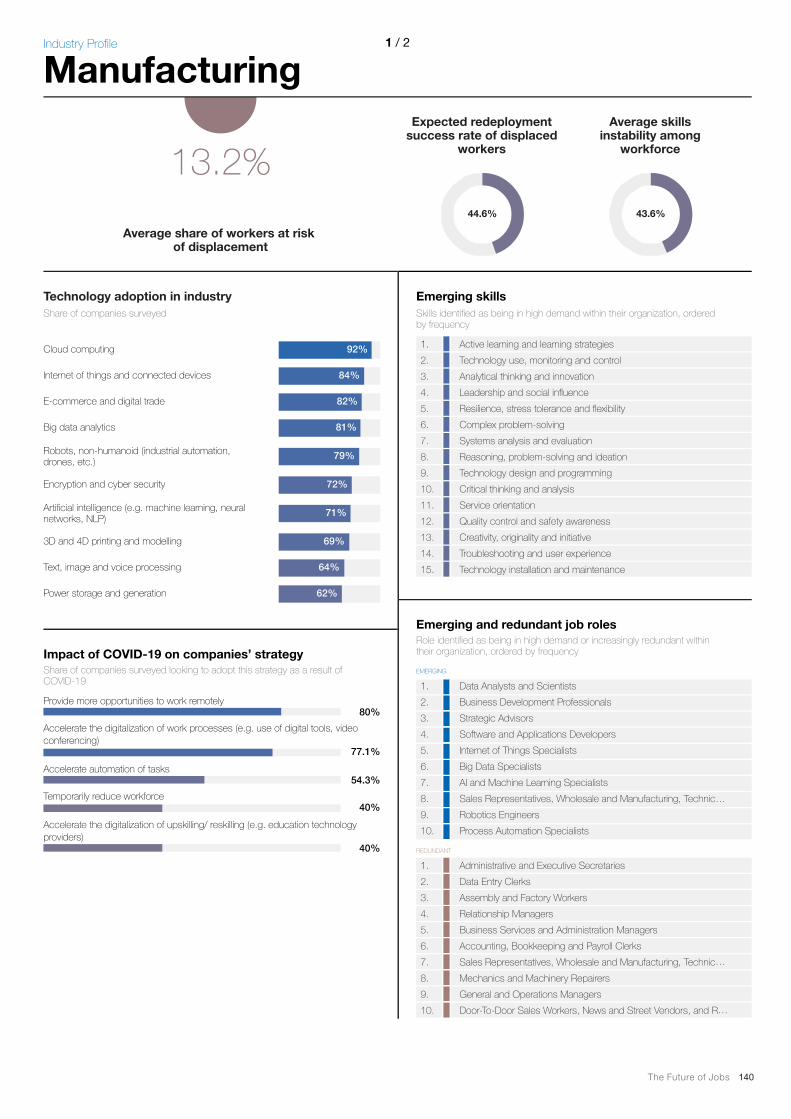
13.2%Average share of workers at risk
of displacement
Expected redeploymentsuccess rate of displaced
workers
44.6%
Average skillsinstability among
workforce
43.6%
Technology adoption in industryShare of companies surveyed
Cloud computing
Internet of things and connected devices
E-commerce and digital trade
Big data analytics
Robots, non-humanoid (industrial automation,drones, etc.)
Encryption and cyber security
Artificial intelligence (e.g. machine learning, neuralnetworks, NLP)
3D and 4D printing and modelling
Text, image and voice processing
Power storage and generation
Impact of COVID-19 on companies’ strategyShare of companies surveyed looking to adopt this strategy as a result ofCOVID-19
Provide more opportunities to work remotely80%
Accelerate the digitalization of work processes (e.g. use of digital tools, videoconferencing)
77.1%Accelerate automation of tasks
54.3%Temporarily reduce workforce
40%Accelerate the digitalization of upskilling/ reskilling (e.g. education technologyproviders)
40%
Emerging skillsSkills identified as being in high demand within their organization, orderedby frequency
1. Active learning and learning strategies2. Technology use, monitoring and control3. Analytical thinking and innovation4. Leadership and social influence5. Resilience, stress tolerance and flexibility6. Complex problem-solving7. Systems analysis and evaluation8. Reasoning, problem-solving and ideation9. Technology design and programming10. Critical thinking and analysis11. Service orientation12. Quality control and safety awareness13. Creativity, originality and initiative14. Troubleshooting and user experience15. Technology installation and maintenance
Emerging and redundant job rolesRole identified as being in high demand or increasingly redundant withintheir organization, ordered by frequency
EMERGING
1. Data Analysts and Scientists2. Business Development Professionals3. Strategic Advisors4. Software and Applications Developers5. Internet of Things Specialists6. Big Data Specialists7. AI and Machine Learning Specialists8. Sales Representatives, Wholesale and Manufacturing, Technic…9. Robotics Engineers10. Process Automation Specialists
REDUNDANT
1. Administrative and Executive Secretaries2. Data Entry Clerks3. Assembly and Factory Workers4. Relationship Managers5. Business Services and Administration Managers6. Accounting, Bookkeeping and Payroll Clerks7. Sales Representatives, Wholesale and Manufacturing, Technic…8. Mechanics and Machinery Repairers9. General and Operations Managers10. Door-To-Door Sales Workers, News and Street Vendors, and R…
Industry Profile
Manufacturing1 / 2
92%
84%
82%
81%
79%
72%
71%
69%
64%
62%
The Future of Jobs 140

Barriers to adoption of new technologiesShare of companies surveyed
Skills gaps in the local labour market
Inability to attract specialized talent
Skills gaps among organization’s leadership
Insufficient understanding of opportunities
Shortage of investment capital
Lack of flexibility of the regulatory framework
Lack of flexibility in hiring and firing
Lack of interest among leadership
Other
Augmentation of key job tasks by 2024
Expected impact on workforceShare of companies surveyed
Modify the composition of the value chain65.9%
Reduce its current workforce due to technological integration or automation50%
Expand its use of contractors doing task-specialized work45.5%
Modify the locations where the organization operates40.9%
Expand its current workforce due to technological integration or automation36.4%
Current skills in focus of existing reskilling/upskillingprogrammesShare of companies surveyed identifying this skill as being in focusacross their reskilling or upskilling programmes
1. Analytical thinking and innovation2. Technology use, monitoring and control3. Complex problem-solving4. Leadership and social influence5. Critical thinking and analysis6. Technology design and programming7. Quality control and safety awareness8. Technology installation and maintenance9. Active learning and learning strategies10. Creativity, originality and initiative
Average reskilling needsShare of workforce within this industry
2 / 2
63.6%
59.1%
54.5%
38.6%
31.8%
31.8%
25%
9.1%
6.8%
DURATION OF RESKILLING
Less than 1 month23.8%
1 to 3 months22.4%
3 to 6 months19.4%
6 to 12 months16.5%
Over 1 year17.9%
Machine share Human share
Information and data processing
Looking for and receiving job-related information
All tasks
Performing physical and manual work activities
Administering
Identifying and evaluating job-relevant information
Performing complex and technical activities
Communicating and interacting
Coordinating, developing, managing and advising
Reasoning and decision-making
40.1%
45.2%
51%
51.3%
51.4%
52%
53.9%
62.1%
64.1%
66.5%
The Future of Jobs 141

19.9%Average share of workers at risk
of displacement
Expected redeploymentsuccess rate of displaced
workers
49.5%
Average skillsinstability among
workforce
40.6%
Technology adoption in industryShare of companies surveyed
Robots, non-humanoid (industrial automation,drones, etc.)
Internet of things and connected devices
Big data analytics
Cloud computing
Encryption and cyber security
Text, image and voice processing
Artificial intelligence (e.g. machine learning, neuralnetworks, NLP)
E-commerce and digital trade
Power storage and generation
Augmented and virtual reality
Impact of COVID-19 on companies’ strategyShare of companies surveyed looking to adopt this strategy as a result ofCOVID-19
Provide more opportunities to work remotely94.7%
Accelerate the digitalization of work processes (e.g. use of digital tools, videoconferencing)
78.9%Temporarily reassign workers to different tasks
42.1%Temporarily reduce workforce
42.1%Accelerate ongoing organizational transformations (e.g. restructuring)
42.1%
Emerging skillsSkills identified as being in high demand within their organization, orderedby frequency
1. Technology use, monitoring and control2. Analytical thinking and innovation3. Critical thinking and analysis4. Complex problem-solving5. Systems analysis and evaluation6. Reasoning, problem-solving and ideation7. Troubleshooting and user experience8. Leadership and social influence9. Creativity, originality and initiative10. Active learning and learning strategies11. Emotional intelligence12. Resilience, stress tolerance and flexibility13. Quality control and safety awareness14. Instruction, mentoring and teaching15. Technology design and programming
Emerging and redundant job rolesRole identified as being in high demand or increasingly redundant withintheir organization, ordered by frequency
EMERGING
1. AI and Machine Learning Specialists2. Data Analysts and Scientists3. Process Automation Specialists4. Robotics Engineers5. Software and Applications Developers6. Digital Transformation Specialists7. Remote Sensing Scientists and Technologists8. Management and Organisation Analysts9. Internet of Things Specialists10. Big Data Specialists
REDUNDANT
1. Data Entry Clerks2. Assembly and Factory Workers3. Administrative and Executive Secretaries4. Accounting, Bookkeeping and Payroll Clerks5. Mining and Petroleum Extraction Workers6. Material-Recording and Stock-Keeping Clerks7. Locomotive Engine Drivers and Related Workers8. Heavy Truck and Bus Drivers9. Financial Analysts10. Construction Laborers
Industry Profile
Mining and Metals1 / 2
90%
90%
90%
87%
83%
76%
76%
62%
57%
57%
The Future of Jobs 142

Barriers to adoption of new technologiesShare of companies surveyed
Skills gaps in the local labour market
Inability to attract specialized talent
Insufficient understanding of opportunities
Skills gaps among organization’s leadership
Lack of flexibility in hiring and firing
Lack of flexibility of the regulatory framework
Shortage of investment capital
Lack of interest among leadership
Other
Augmentation of key job tasks by 2024
Expected impact on workforceShare of companies surveyed
Modify the composition of the value chain62.1%
Reduce its current workforce due to technological integration or automation51.7%
Expand its use of contractors doing task-specialized work51.7%
Modify the locations where the organization operates44.8%
Expand its current workforce due to technological integration or automation27.6%
Current skills in focus of existing reskilling/upskillingprogrammesShare of companies surveyed identifying this skill as being in focusacross their reskilling or upskilling programmes
1. Analytical thinking and innovation2. Leadership and social influence3. Technology use, monitoring and control4. Quality control and safety awareness5. Critical thinking and analysis6. Reasoning, problem-solving and ideation7. Active learning and learning strategies8. Resilience, stress tolerance and flexibility9. Management of personnel10. Creativity, originality and initiative
Average reskilling needsShare of workforce within this industry
2 / 2
73.3%
56.7%
50%
46.7%
36.7%
26.7%
23.3%
20%
10%
DURATION OF RESKILLING
Less than 1 month17.5%
1 to 3 months22.7%
3 to 6 months15.6%
6 to 12 months19.5%
Over 1 year24.7%
Machine share Human share
Information and data processing
Performing physical and manual work activities
Looking for and receiving job-related information
Performing complex and technical activities
Identifying and evaluating job-relevant information
Administering
All tasks
Reasoning and decision-making
Communicating and interacting
Coordinating, developing, managing and advising
32.3%
40.5%
46.1%
46.3%
50.9%
51.1%
51.3%
65.4%
67.6%
73.2%
The Future of Jobs 143

14.2%Average share of workers at risk
of displacement
Expected redeploymentsuccess rate of displaced
workers
48.1%
Average skillsinstability among
workforce
42.6%
Technology adoption in industryShare of companies surveyed
Internet of things and connected devices
Text, image and voice processing
Cloud computing
Big data analytics
Robots, non-humanoid (industrial automation,drones, etc.)
3D and 4D printing and modelling
Encryption and cyber security
Augmented and virtual reality
Artificial intelligence (e.g. machine learning, neuralnetworks, NLP)
Power storage and generation
Impact of COVID-19 on companies’ strategyShare of companies surveyed looking to adopt this strategy as a result ofCOVID-19
Accelerate the digitalization of work processes (e.g. use of digital tools, videoconferencing)
77.8%Provide more opportunities to work remotely
66.7%Accelerate the digitalization of upskilling/ reskilling (e.g. education technologyproviders)
44.4%Accelerate automation of tasks
33.3%Accelerate the implementation of upskilling/ reskilling programmes
33.3%
Emerging skillsSkills identified as being in high demand within their organization, orderedby frequency
1. Active learning and learning strategies2. Technology design and programming3. Service orientation4. Leadership and social influence5. Emotional intelligence6. Critical thinking and analysis7. Complex problem-solving8. Analytical thinking and innovation9. Troubleshooting and user experience10. Creativity, originality and initiative11. Technology use, monitoring and control12. Technology installation and maintenance13. Systems analysis and evaluation14. Quality control and safety awareness15. Reasoning, problem-solving and ideation
Emerging and redundant job rolesRole identified as being in high demand or increasingly redundant withintheir organization, ordered by frequency
EMERGING
1. Renewable Energy Engineers2. Sheet and Structural Metal Workers, Moulders and Welders3. Robotics Engineers4. Process Automation Specialists5. Internet of Things Specialists6. ICT Operations and User Support Technicians7. Data Analysts and Scientists8. Big Data Specialists9. AI and Machine Learning Specialists10. Дорожнотранспортные органы
REDUNDANT
1. Administrative and Executive Secretaries2. Assembly and Factory Workers3. Data Entry Clerks4. Accounting, Bookkeeping and Payroll Clerks5. Mechanics and Machinery Repairers6. Material-Recording and Stock-Keeping Clerks7. Accountants and Auditors8. Mining and Petroleum Extraction Workers9. Client Information and Customer Service Workers10. Legal Secretaries
Industry Profile
Oil and Gas1 / 2
93%
87%
86%
86%
79%
79%
71%
71%
71%
69%
The Future of Jobs 144

Barriers to adoption of new technologiesShare of companies surveyed
Skills gaps in the local labour market
Shortage of investment capital
Lack of flexibility in hiring and firing
Lack of flexibility of the regulatory framework
Insufficient understanding of opportunities
Inability to attract specialized talent
Skills gaps among organization’s leadership
Lack of interest among leadership
Other
Augmentation of key job tasks by 2024
Expected impact on workforceShare of companies surveyed
Modify the composition of the value chain71.4%
Reduce its current workforce due to technological integration or automation42.9%
Expand its use of contractors doing task-specialized work42.9%
Modify the locations where the organization operates35.7%
Expand its current workforce28.6%
Current skills in focus of existing reskilling/upskillingprogrammesShare of companies surveyed identifying this skill as being in focusacross their reskilling or upskilling programmes
1. Technology design and programming2. Quality control and safety awareness3. Complex problem-solving4. Technology use, monitoring and control5. Technology installation and maintenance6. Analytical thinking and innovation7. Leadership and social influence8. Critical thinking and analysis9. Troubleshooting and user experience10. Resilience, stress tolerance and flexibility
Average reskilling needsShare of workforce within this industry
2 / 2
50%
42.9%
42.9%
35.7%
35.7%
35.7%
28.6%
21.4%
7.1%
DURATION OF RESKILLING
Less than 1 month13.6%
1 to 3 months16.1%
3 to 6 months22.4%
6 to 12 months19.9%
Over 1 year28.1%
Machine share Human share
Information and data processing
Looking for and receiving job-related information
Performing physical and manual work activities
Administering
Performing complex and technical activities
All tasks
Identifying and evaluating job-relevant information
Communicating and interacting
Coordinating, developing, managing and advising
Reasoning and decision-making
40.5%
47.4%
54.3%
58.8%
59.2%
64.8%
66.8%
73.5%
73.9%
80.2%
The Future of Jobs 145

11.6%Average share of workers at risk
of displacement
Expected redeploymentsuccess rate of displaced
workers
41.3%
Average skillsinstability among
workforce
48%
Technology adoption in industryShare of companies surveyed
Cloud computing
Big data analytics
Text, image and voice processing
Encryption and cyber security
Artificial intelligence (e.g. machine learning, neuralnetworks, NLP)
Internet of things and connected devices
E-commerce and digital trade
Augmented and virtual reality
Distributed ledger technology (e.g. blockchain)
Power storage and generation
Impact of COVID-19 on companies’ strategyShare of companies surveyed looking to adopt this strategy as a result ofCOVID-19
Accelerate the digitalization of work processes (e.g. use of digital tools, videoconferencing)
92.9%Provide more opportunities to work remotely
85.7%Accelerate automation of tasks
45.2%Accelerate the digitalization of upskilling/ reskilling (e.g. education technologyproviders)
42.9%Accelerate ongoing organizational transformations (e.g. restructuring)
40.5%
Emerging skillsSkills identified as being in high demand within their organization, orderedby frequency
1. Analytical thinking and innovation2. Complex problem-solving3. Critical thinking and analysis4. Creativity, originality and initiative5. Active learning and learning strategies6. Reasoning, problem-solving and ideation7. Emotional intelligence8. Leadership and social influence9. Persuasion and negotiation10. Resilience, stress tolerance and flexibility11. Technology design and programming12. Service orientation13. Technology use, monitoring and control14. Attention to detail, trustworthiness15. Quality control and safety awareness
Emerging and redundant job rolesRole identified as being in high demand or increasingly redundant withintheir organization, ordered by frequency
EMERGING
1. Digital Marketing and Strategy Specialists2. AI and Machine Learning Specialists3. Data Analysts and Scientists4. Business Development Professionals5. Internet of Things Specialists6. Business Services and Administration Managers7. Project Managers8. Process Automation Specialists9. Lawyers10. Financial Analysts
REDUNDANT
1. Administrative and Executive Secretaries2. Accounting, Bookkeeping and Payroll Clerks3. Data Entry Clerks4. Relationship Managers5. Legal Secretaries6. Management and Organisation Analysts7. General and Operations Managers8. Electronics and Telecommunications Installers and Repairers9. Client Information and Customer Service Workers10. Business Services and Administration Managers
Industry Profile
Professional Services1 / 2
88%
86%
79%
78%
76%
74%
70%
57%
53%
45%
The Future of Jobs 146

Barriers to adoption of new technologiesShare of companies surveyed
Shortage of investment capital
Skills gaps in the local labour market
Insufficient understanding of opportunities
Skills gaps among organization’s leadership
Lack of flexibility of the regulatory framework
Inability to attract specialized talent
Lack of interest among leadership
Lack of flexibility in hiring and firing
Other
Augmentation of key job tasks by 2024
Expected impact on workforceShare of companies surveyed
Expand its current workforce53.8%
Expand its use of contractors doing task-specialized work51.9%
Modify the composition of the value chain48.1%
Expand its current workforce due to technological integration or automation42.3%
Modify the locations where the organization operates32.7%
Current skills in focus of existing reskilling/upskillingprogrammesShare of companies surveyed identifying this skill as being in focusacross their reskilling or upskilling programmes
1. Active learning and learning strategies2. Creativity, originality and initiative3. Analytical thinking and innovation4. Critical thinking and analysis5. Emotional intelligence6. Complex problem-solving7. Reasoning, problem-solving and ideation8. Management of personnel9. Leadership and social influence10. Persuasion and negotiation
Average reskilling needsShare of workforce within this industry
2 / 2
51%
41.2%
39.2%
35.3%
35.3%
35.3%
27.5%
17.6%
7.8%
DURATION OF RESKILLING
Less than 1 month29%
1 to 3 months20.5%
3 to 6 months17.1%
6 to 12 months15.6%
Over 1 year17.8%
Machine share Human share
Looking for and receiving job-related information
Information and data processing
Administering
Identifying and evaluating job-relevant information
Performing physical and manual work activities
Performing complex and technical activities
All tasks
Coordinating, developing, managing and advising
Communicating and interacting
Reasoning and decision-making
37.3%
37.7%
44.4%
45%
48.3%
51.8%
57.6%
59.9%
64.3%
65.9%
The Future of Jobs 147

14.7%Average share of workers at risk
of displacement
Expected redeploymentsuccess rate of displaced
workers
49.1%
Average skillsinstability among
workforce
38.2%
Technology adoption in industryShare of companies surveyed
Big data analytics
Cloud computing
Artificial intelligence (e.g. machine learning, neuralnetworks, NLP)
E-commerce and digital trade
Internet of things and connected devices
Encryption and cyber security
Robots, non-humanoid (industrial automation,drones, etc.)
Text, image and voice processing
Augmented and virtual reality
3D and 4D printing and modelling
Impact of COVID-19 on companies’ strategyShare of companies surveyed looking to adopt this strategy as a result ofCOVID-19
Accelerate the digitalization of work processes (e.g. use of digital tools, videoconferencing)
92.9%Provide more opportunities to work remotely
64.3%Accelerate automation of tasks
50%Accelerate ongoing organizational transformations (e.g. restructuring)
35.7%Accelerate the implementation of upskilling/ reskilling programmes
28.6%
Emerging skillsSkills identified as being in high demand within their organization, orderedby frequency
1. Active learning and learning strategies2. Complex problem-solving3. Analytical thinking and innovation4. Technology use, monitoring and control5. Technology design and programming6. Systems analysis and evaluation7. Service orientation8. Quality control and safety awareness9. Leadership and social influence10. Emotional intelligence11. Attention to detail, trustworthiness12. Management of personnel13. Resilience, stress tolerance and flexibility14. Reasoning, problem-solving and ideation15. Critical thinking and analysis
Emerging and redundant job rolesRole identified as being in high demand or increasingly redundant withintheir organization, ordered by frequency
EMERGING
1. AI and Machine Learning Specialists2. Digital Marketing and Strategy Specialists3. Data Analysts and Scientists4. Architects and Surveyors5. Software and Applications Developers6. Supply Chain and Logistics Specialists7. Environmental Protection Professionals8. Organizational Development Specialists9. Product Managers10. Ship and Boat Captains
REDUNDANT
1. Administrative and Executive Secretaries2. Data Entry Clerks3. Architects and Surveyors4. Accounting, Bookkeeping and Payroll Clerks5. Sales Representatives, Wholesale and Manufacturing, Technic…6. Postal Service Clerks7. Business Services and Administration Managers8. Accountants and Auditors9. Door-To-Door Sales Workers, News and Street Vendors, and R…10. Material-Recording and Stock-Keeping Clerks
Industry Profile
Transportation and Storage1 / 2
94%
94%
88%
87%
76%
75%
69%
65%
62%
60%
The Future of Jobs 148
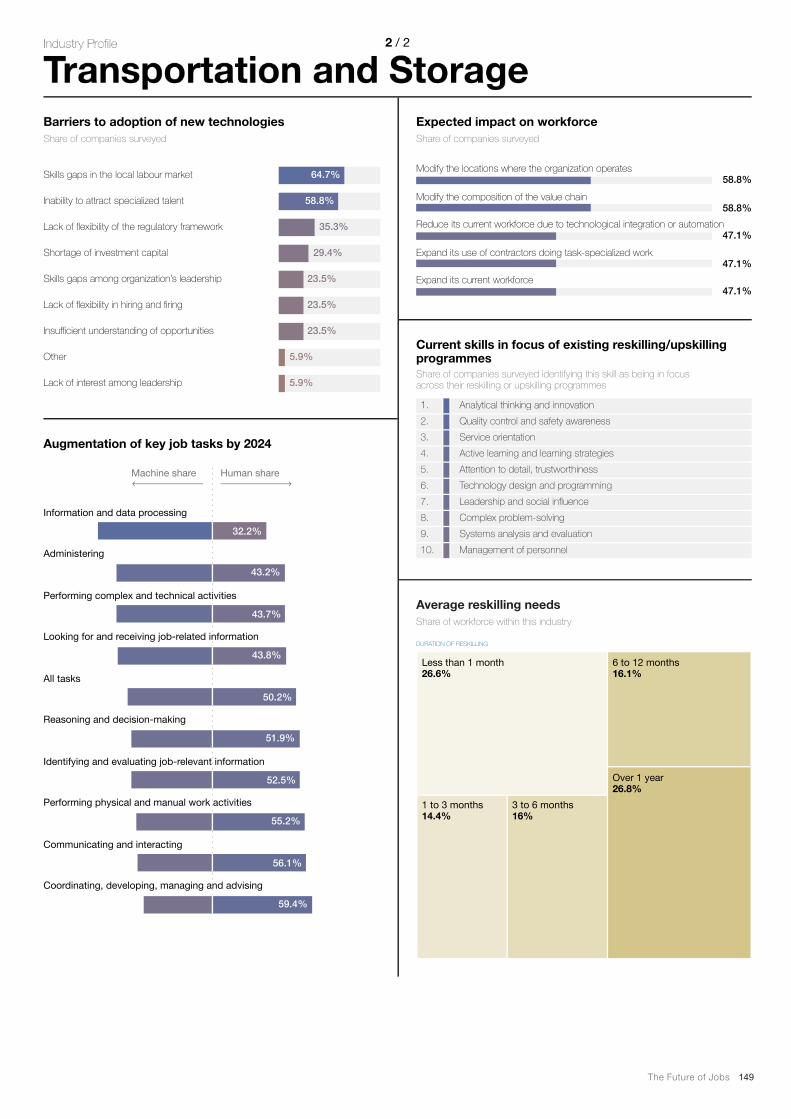
Barriers to adoption of new technologiesShare of companies surveyed
Skills gaps in the local labour market
Inability to attract specialized talent
Lack of flexibility of the regulatory framework
Shortage of investment capital
Skills gaps among organization’s leadership
Lack of flexibility in hiring and firing
Insufficient understanding of opportunities
Other
Lack of interest among leadership
Augmentation of key job tasks by 2024
Expected impact on workforceShare of companies surveyed
Modify the locations where the organization operates58.8%
Modify the composition of the value chain58.8%
Reduce its current workforce due to technological integration or automation47.1%
Expand its use of contractors doing task-specialized work47.1%
Expand its current workforce47.1%
Current skills in focus of existing reskilling/upskillingprogrammesShare of companies surveyed identifying this skill as being in focusacross their reskilling or upskilling programmes
1. Analytical thinking and innovation2. Quality control and safety awareness3. Service orientation4. Active learning and learning strategies5. Attention to detail, trustworthiness6. Technology design and programming7. Leadership and social influence8. Complex problem-solving9. Systems analysis and evaluation10. Management of personnel
Average reskilling needsShare of workforce within this industry
2 / 2
64.7%
58.8%
35.3%
29.4%
23.5%
23.5%
23.5%
5.9%
5.9%
DURATION OF RESKILLING
Less than 1 month26.6%
1 to 3 months14.4%
3 to 6 months16%
6 to 12 months16.1%
Over 1 year26.8%
Machine share Human share
Information and data processing
Administering
Performing complex and technical activities
Looking for and receiving job-related information
All tasks
Reasoning and decision-making
Identifying and evaluating job-relevant information
Performing physical and manual work activities
Communicating and interacting
Coordinating, developing, managing and advising
32.2%
43.2%
43.7%
43.8%
50.2%
51.9%
52.5%
55.2%
56.1%
59.4%
The Future of Jobs 149

The Future of Jobs October 2020
The Future of Jobs 150
The Future of Jobs Report is based on the results
of the 2020 edition of the Future �� ���� ����e��
a �� !�e ����ce �� ����"a# �� #$a# %a#$e�� #$e
�� %$#� ���" #$e oa�%e�# c�"&a� e� '��o(' (e ��
#$e c$a�% �% �a#��e �� '��)*
T$e ����e� a�)� �e� �� e+ec�# �e� #� �$a�e #$e &oa�� �%
��� #$e � c�"&a� e�f '��)���ce #�a�����"a# �� ' #$
a time horizon up to 2024. It aims to provide timely
and unique insights on the trends affecting the labour
"a�)e#� #$e �a#e �� #ec$��o�% cao a(�&# �� a"��%
firms, the shifting job landscape and associated changes to skills needs as well as business planning for appropriate upskilling and reskilling.
The 2020 survey dissemination took place during the first half of 2020. The survey provides a much-needed compass for business, governments, civil society Organizations as well as the public at large on the short-and medium-term transformations to the labour market.
Survey design
The survey builds on the methodology from the 2016 and 2018 survey editions. Following survey best practice and in consultation with the World Economic Forum Global Future Council on the new Education and Work Agenda, several questions were refined and new questions were added. The three core concepts that are key to the construction of the Future of Jobs Survey remain unchanged in this edition. That is, the nature of work is broken down into three interrelated subcategories: job roles, tasks and skills. Task are defined as the actions necessary to turn a set of inputs into valuable outputs. A collection of tasks forms the content of job roles, while skills are capabilities needed to be able to perform the tasks well.
The survey is structured into four parts. The first part includes questions on the expected transformations to the workforce, including the major trends that are affecting the labour market and the technologies that are being adopted. The second part focuses on jobs, skills and tasks and how these are expected to evolve over a four-year period. The third part collects information on training programmes and employee reskilling needs and efforts. Finally, to understand the shorter-term impacts of the global pandemic, a fourth section was added on the effects of the COVID-19 on the workforce.
The survey consists of quantitative as well as qualitative questions seeking to capture the strategic knowledge, projections and planning of the respondents. The study is designed to reveal the world’s leading employers’ estimates on how the labour force is transforming, their projections on how quickly these shifts will happen, and their efforts in addressing these changes.
In total the survey comprises 49 questions and was made available in four languages: English, Spanish, Japanese and Russian.
Survey distribution
The survey was distributed via an online platform through three dissemination networks. The primary distribution route was to the World Economic Forum partners and constituents in collaboration with the World Economic Forum Regional and Industry teams. The survey was further disseminated through a network of Partner Institutes—local partner organizations that administered the survey in their respective economies. Further dissemination through partner organizations enabled the strengthening of regional representation by extending the sample to local companies. As a third dissemination channel, the New Economy and Society team shared the survey with the collaborators from the countries in which the Closing the Skills and Innovation Gap Accelerators are present (South Africa, UAE, Bahrain, India, Pakistan). The Accelerator project brings about tangible change by building a national public-private collaboration platform to increase employability of the current workforce and increase work-readiness and critical skills among the future workforce.
For the full overview of the survey partners, please refer to the Survey Partners and Acknowledgements sections at the end of the report.
The network of survey partners responsible for the dissemination followed clear sampling guidelines, which specified the level of the respondent, the target companies and the sample composition. As the questions in the survey require deep insight into an organization’s current strategy as well as talent-related aspects of operationalizing this strategy, the target respondents were senior executives in charge of human resources, strategy and innovation departments.
Appendix A: Report Methodology

The Future of Jobs 151
The target companies were specified as the largest multinational and national companies, significant in terms of revenue or employee size. The threshold was set at companies with 100 employees or more as questions concerning technology absorption and its consequential impact on employee planning are most relevant for larger companies with a significant share of employment.
Finally, the guidelines specified the industry representation, which should reflect the structure of the economy by industry in proportion to the share of GDP (see Table A1), while also ensuring good geographical coverage.
The data was collected over a nine-month period from January to September 2020. In late February, the survey was updated to reflect the new global context. A specific section with questions relating directly to the COVID-19 health crisis and its implications for the workforce was included.
By 23 March, when most economies were experiencing the effects of the pandemic and had started to implement measures to slow the spread of the virus, only 24% of the Future of Jobs Surveys had been completed. By mid-April, by which time most economies were in full or partial lockdown (see Figure 2), 36% of companies had completed the survey. Therefore, most of the responses were collected during the COVID-19 pandemic while at least partial lockdown measures were in place, and therefore captured some of the impact of COVID-19 on the organization’s workforce planning. Nevertheless, results should be interpreted with caution as companies might not have been fully aware of the implications of their health crisis on their workforce during the early phases of the pandemic.
Representativeness
With the purpose to represent the planning and projections of global business, 65% of the final sample is composed of multinational companies, while 35% is from larger local companies, significant in terms of revenue or size. The final sample includes responses from Chief Executive Officers (12%), top executives (59%), middle-level executives (25%), and, in exceptional cases, other respondents such as consultants (3%).
Over half of the final sample (52%) is composed of respondents from Human Resources departments, responsible for the planning of the company’s employees. Other responses represent the views of executives from the organization’s strategic departments, including Finance, Operation and Strategy.
After applying the representative criteria, the final sample comprised 15 industry clusters and 26 countries which collectively represent 80% of the world GDP. The industries represented are: Professional Services; Manufacturing; Digital Communications and Information Technology;
Financial Services; Consumer; Mining and Metals; Education; Government and Public Sector; Health and Healthcare; Automotive; Agriculture, Food and Beverage; Transportation and Storage; Energy Utilities and Technologies; Oil and Gas and Advanced Manufacturing. The countries represented are the United States, the United Kingdom, the United Arab Emirates, China, Germany, India, Saudi Arabia, Poland, the Russian Federation, Japan, France, Thailand, Australia, Brazil, Canada, the Netherlands, Singapore, Spain, Pakistan, Mexico, Switzerland, Argentina, Indonesia, Italy, South Africa and Malaysia.
In total, the report’s data set contains 291 unique responses by global companies, collectively representing more than 7.7 million employees worldwide. Out of scope of this report are responses from small companies with fewer than 100 employees as well as responses from the informal sector.
The report aims to provide guidance and stimulating discussion. However, the results should be treated with caution when looking to generalize its findings in a manner that could be considered representative of all trends across an entire industry or country.
Classification framework
for jobs and skills
Following the 2016 and 2018 taxonomy, this year’s report employed the Occupational Information Network (O*NET) framework for its categories of analysis for jobs, skills and tasks. O*NET was developed by the US Department of Labor in collaboration with its Bureau of Labor Statistics’ Standard Classification of Occupations (SOC) and remains the most extensive and respected classification of its kind. In its unabridged form, the O*NET-SOC taxonomy includes detailed information on 974 individual occupations in the United States, grouped into approximately 20 broader job families, which are regularly revised and updated for new and emerging occupations to keep up with the changing occupational landscape.
The Generalized Work Activities segment of the O*NET methodology was used to form the list of tasks used in the survey. In addition, for the classification of skills, the report team employed an abridged version of the “Worker Characteristics” and Worker Requirement classifications; in particular, bundles 1.A., 1.C., 2.A., and 2.B. Additional details about the composition of the skills list used in this report can be found in Table A2.
The list of roles used in the report is enhanced with roles which were consistently added to previous editions of the report. In addition, the skills taxonomy used is an adapted and enhanced version of the O*NET taxonomy, enriched by feedback and insights from New Metrics collaborators. For details please see Tables A2 and A3.

The Future of Jobs 152
Taxonomy of industry categories TA B L E A 1
Source
World Economic Forum.
Industry cluster Industry Alternative names
Agriculture, Food and Beverage Agriculture, Forestry, Fishing and Hunting
Agriculture, Food and Beverage Food and Beverages
Automotive Automotive
Consumer Accomodation and Food Services Retail, Consumer Goods and Lifestyle
Consumer Restaurants Retail, Consumer Goods and Lifestyle
Consumer Retail / Retail Trade Retail, Consumer Goods and Lifestyle
Digital Communications and Information Technology Telecommunications
Digital Communications and Information Technology Information Technology
Digital Communications and Information Technology Electronics
Education Education Management
Education Education Services
Education Higher Education
Energy Utilities & Technologies Energy Utilities Utilities
Energy Utilities & Technologies Energy Technology
Financial Services Banking and Capital Markets Banking
Financial Services Insurance and Asset ManagementFinancial Services and Insurance / Finance and
Insurance
Financial Services Institutional InvestorsFinancial Services and Insurance / Finance and
Insurance
Financial Services Private InvestorsFinancial Services and Insurance / Finance and
Insurance
Government and Public Sector Government and Public Sector Public Administration / Government Administration
Government and Public Sector Non-Profits Non-Profit Organization Management
Health and Healthcare -Health Care and Social Assistance / Hospital &
Health care
Information Technology - Information Technology & Services
Infra, Urban Dev. & Real Estate Construction
Infra, Urban Dev. & Real Estate Real Estate, Rental and Leasing
Manufacturing Advanced Manufacturing
Manufacturing Aerospace
Manufacturing Chemical and Advanced Materials
Media, Entertainment & Culture Arts, Entertainment and Recreation
Media, Entertainment & Culture Marketing and Advertising
Media, Entertainment & Culture Information and Media
Military -
Mining and Metals Mining and Metals Mining, Quarrying, and Oil and Gas Extraction
Office and Facilities Support ServicesAdministrative and Support and Waste Management and
Remediation Services
Oil and Gas Oil and Gas Mining, Quarrying, and Oil and Gas Extraction
Oil and Gas Oil Field Services and Equipment Mining, Quarrying, and Oil and Gas Extraction
Other Services Other Services
Professional Services Administrative and Support Services
Professional Services Management of Companies and Enterprises
Professional Services Professional, Scientific and Technical Services
Supply Chain & Transportation Transportation and Warehousing
Supply Chain & Transportation Wholesale Trade
Transportation and Storage Aviation, Travel and Tourism
Transportation and Storage Supply Chain and Transportation

The Future of Jobs 153
Classification of skills used, based on O*NET content modelTA B L E A 2 1 / 2
Competency bundle Competency Description
Active learning and learning strategies Active learningUnderstanding the implications of new information for both current and future
problem-solving and decision-making.
Learning strategiesSelecting and using training/instructional methods and procedures appropriate for
the situation when learning or teaching new things.
Analytical thinking and innovation Analytical thinkingJob requires analyzing information and using logic to address work-related issues
and problems.
InnovationJob requires creativity and alternative thinking to develop new ideas for and
answers to work-related problems.
Attention to detail, trustworthiness Attention to detail Job requires being careful about detail and thorough in completing work tasks.
Dependability Job requires being reliable, responsible and dependable, and fulfilling obligations.
Integrity Job requires being honest and ethical.
Complex problem-solving Complex problem-solvingIdentifying complex problems and reviewing related information to develop and
evaluate options and implement solutions.
Coordination and time management Time management Managing one's own time and the time of others.
Coordination Adjusting actions in relation to others' actions.
Creativity, originality and initiative Initiative Job requires a willingness to take on responsibilities and challenges.
Critical thinking and analysis Critical thinkingUsing logic and reasoning to identify the strengths and weaknesses of alternative
solutions, conclusions or approaches to problems.
MonitoringMonitoring/assessing performance of yourself, other individuals, or organizations
to make improvements or take corrective action.
Emotional intelligence Concern for othersJob requires being sensitive to others' needs and feelings and being understanding
and helpful on the job.
CooperationJob requires being pleasant with others on the job and displaying a good-natured,
cooperative attitude.
Social orientationJob requires preferring to work with others rather than alone, and being personally
connected with others on the job.
Social perceptiveness Being aware of others' reactions and understanding why they react as they do.
Instruction, mentoring and teaching Instructing Teaching others how to do something.
Leadership and social influence Leadership Job requires a willingness to lead, take charge and offer opinions and direction.
Management of financial, material
resourcesManagement of financial resources
Determining how money will be spent to get the work done, and accounting for
these expenditures.
Management of material resourcesObtaining and seeing to the appropriate use of equipment, facilities and materials
needed to do certain work.
Management of personnel Management of personnel resourcesMotivating, developing and directing people as they work, identifying the best
people for the job.
Manual dexterity, endurance and
precisionEndurance
The ability to exert oneself physically over long periods without getting out of
breath.
Flexibility, balance and coordination Abilities related to the control of gross body movements.
Physical strength abilities Abilities related to the capacity to exert force.
Control movement abilities Abilities related to the control and manipulation of objects in time and space
Fine manipulative abilities Abilities related to the manipulation of objects.
Reaction time and speed abilities Abilities related to speed of manipulation of objects.
Memory, verbal, auditory and spatial
abilitiesAttentiveness Abilities related to application of attention.
Memory Abilities related to the recall of available information.
Perceptual abilities Abilities related to the acquisition and organization of visual information.
Spatial abilities Abilities related to the manipulation and organization of spatial information
Verbal abilitiesAbilities that influence the acquisition and application of verbal information in
problem-solving.
Persuasion and negotiation Negotiation Bringing others together and trying to reconcile differences.
Persuasion Persuading others to change their minds or behaviour.
Quality control and safety awareness Quality control analysisConducting tests and inspections of products, services or processes to evaluate
quality or performance.
Reading, writing, math and active listening Active listening
Giving full attention to what other people are saying, taking time to understand
the points being made, asking questions as appropriate, and not interrupting at
inappropriate times.

The Future of Jobs 154
Classification of skills used, based on O*NET content modelTA B L E A 2
Competency bundle Competency Description
Mathematics Using mathematics to solve problems.
Reading comprehension Understanding written sentences and paragraphs in work related documents.
Science Using scientific rules and methods to solve problems.
Speaking Talking to others to convey information effectively
Writing Communicating effectively in writing as appropriate for the needs of the audience.
Reasoning, problem-solving and ideation Idea generation and reasoning abilitiesAbilities that influence the application and manipulation of information in problem-
solving.
Quantitative abilitiesAbilities that influence the solution of problems involving mathematical
relationships.
Resilience, stress tolerance and flexibility Adaptability/flexibilityJob requires being open to change (positive or negative) and to considerable
variety in the workplace.
Self controlJob requires maintaining composure, keeping emotions in check, controlling anger
and avoiding aggressive behavior, even in very difficult situations.
Stress toleranceJob requires accepting criticism and dealing calmly and effectively with high stress
situations.
Service orientation Service orientation Actively looking for ways to help people.
Systems analysis and evaluation Judgment and decision-makingConsidering the relative costs and benefits of potential actions to choose the most
appropriate one.
Systems analysisDetermining how a system should work and how changes in conditions, operations
and the environment will affect outcomes.
Systems evaluationIdentifying measures or indicators of system performance and the actions needed
to improve or correct performance, relative to the goals of the system.
Technology design and programming Programming Writing computer programmes for various purposes.
Technology design Generating or adapting equipment and technology to serve user needs.
Technology installation and maintenance Equipment maintenancePerforming routine maintenance on equipment and determining when and what
kind of maintenance is needed.
Installation Installing equipment, machines, wiring or programmes to meet specifications.
Repairing Repairing machines or systems using the needed tools.
Technology use, monitoring and control Equipment selection Determining the kind of tools and equipment needed to do a job.
Operation and control Controlling operations of equipment or systems.
Operation monitoringWatching gauges, dials or other indicators to make sure a machine is working
properly.
Operations analysis Analyzing needs and product requirements to create a design.
Troubleshooting and user experience Troubleshooting Determining causes of operating errors and deciding what to do about them.
Visual, auditory and speech abilities Auditory and speech abilities Abilities related to auditory and oral input.
Visual abilities Abilities related to visual sensory input.
Source
World Economic Forum.
2 / 2

The Future of Jobs 155
Classification of skills used, skills taxonomyTA B L E A 3
v
Competency typeTaxonomy cluster level 1
Taxonomy cluster level 2
Taxonomy cluster level 3
Taxonomy cluster level 3 definition
Skills and knowledge: Skills
are the capabilities needed to
complete a task, and therefore
a job.
Knowledge is the body of facts,
principles and theories that are
related to a field of work or study
and can be further split into
dependent knowledge (practical
and procedural) and context-
independent or theoretical
knowledge.
Business skills Management and
communication of
activities
Coordination and time
management
Capacity to manage one's time and planning in tandem with
others.
Management of financial,
material resources
Developed capacities for gathering resources to achieve
tasks including how money will be spent to get the work done,
obtaining equipment, facilities, and materials and accounting for
expenditures.
Sales, communication and
marketing of products and
services
Developed capacities to identify and shape effective value proposi-
tions for products and services, as well as to sell products on that
basis.
Quality control and safety
awareness
Conducting tests and inspections of products, services or processes
to evaluate quality and level of performance.
Innovation and
creativity
Problem-solving Analyticial thinking and
originality3
Capacity to analyze information and use logic to address issues and
problems, apply alternative thinking to develop new, original ideas
and answers.
Analyticial thinking and
originality3
Capacity to solve novel, ill-defined problems in complex, real-world
settings.
Complex problem-solving Abilities that influence the acquisition and application of knowledge
in problem-solving.
Systems analysis and
evaluation
Capacities used to understand, monitor and improve socio-technical
systems.
Critical thinking and analysis Using logic and reasoning to identify the strengths and weaknesses
of alternative solutions, conclusions or approaches to problems as
well as assessing performance of yourself, other individuals or orga-
nizations to make improvements or take corrective action.
Digital Technology use and
development
Creating and maintaining
technology5
Capacity to use programming to design machines or technological
systems which fit user needs. In addition, understanding how others
use tools, determine the cause of operating errors and how to fix
them.
Skills include:
- Artificial Intelligence
- Computer Hardware & Networking Systems
- Cybersecurity and Application Security
- Data Science and Analysis
- Human Computer Interaction
- Scrum/Agile Product Development
- Software & Programming
- Technical Support and Maintenance
- Web Development
Using and operating
technology6
Capacity to select the right tools needed to perform tasks, use
those tools well and set up and operate technology.
Skills include:
- Accounting and Finance Software
- Construction Management Software
- Clininal Information Systems
- Digital Design
- Digital Literacy
- Digital Marketing
- Geographic Information Systems
- Human Resourse Management Systems
- Productivity Software
- Machining & Manufacturing Technologies
- Scientific Computing
Industry-specialized Skills specific to certain fields or professions: Documentation in
Cloud Computing, Video and Editing in Marketing, Sales and
Content or Radiation Oncology (in the Care Economy professional
cluster). The cluster excludes skills related to the operation and
design of digital technologies.
1 / 2

The Future of Jobs 156
Classification of skills used, skills taxonomyTABLE A3
v
Competency typeTaxonomy cluster
level 1
Taxonomy cluster
level 2
Taxonomy cluster
level 3Taxonomy cluster level 3 definition
Attitudes: Consistent behaviours,
emotional intelligence traits and
beliefs that individuals exhibit that
influence their approach to a variety
of things such as ideas, persons and
situations. Attitudes are learned and
often a big part of the driving force
of learning and the approach to
doing tasks.
Interpersonal Working with people Management of personnel Motivating, developing and directing people as they work, identifying
the best people for the job.
Persuasion and negotiation Persuading others to change their minds or behaviour as well as
bringing them together and trying to reconcile differences.
Service orientation Actively looking for ways to help others as well as to make them feel
attended to and welcome.
Emotional intelligence Developed capacities used to work with people to achieve goals and
in particular being pleasant, cooperative, sensitive to others, easy to
get along with and enjoying work with people.
Leadership and social
influence
Having an impact on others in the organization, and displaying
energy and leadership.
Learning strategies, instruc-
tion, mentoring and teaching4
Capacities for teaching others how to do something, including
selecting and using training/instructional methods and procedures
appropriate for the situation when learning or teaching new things.
Self-management Initative2 Willingness to take on responsibilities and challenges.
Active learning1 Understanding the implications of new information for both current
and future problem-solving and decision-making.
Attention to detail, trustwor-
thiness
Dependability, commitment to doing the job correctly and carefully,
being trustworthy, accountable and paying attentive to details.
Resilience, stress tolerance
and flexibility
Maturity, poise, flexibility and restraint to cope with pressure, stress,
criticism, setbacks, personal and work-related problems.
Social justice Awareness of the wider world, of history and of social justice issues
that result from historical inequalities. Playing an active role in the
global and local community and the appliation of civic values.
Abilites: The range of physical,
psychomotor, cognitive and sensory
abilities that are required to perform
a job role.
Physical abilities Physical abilities Manual dexterity, endurance
and precision
Abilities related to the capacity to manipulate and control objects,
strength, endurance, flexibility, balance and coordination.
Memory, verbal, auditory and
spatial abilities
Abilities that influence the acquisition and application of knowledge
in problem-solving.
Visual, auditory and speech
abilities
Abilities that influence visual, auditory and speech perception.
Cognitive:
Commonly cover conceptual
thinking and the ability to process
thoughts and perform various mental
activities, and are most closely
associated with learning, reasoning
and problem-solving.
Core literacies Core literacies Reading, writing, math, active
listening
Core literacies needed to work with and acquire more specific skills
in a variety of different domains.
2 / 2
Source
World Economic Forum.
Note
1 listed as "Active learning and learning strategies" throughout the report;
2 listed as "Creativity, originality and initiative" throughout the report; 3
listed as "Analytical thinking and innovation" throughout the report; 4 listed
as "Instruction, mentoring and teaching" throughout the report; 5 listed as
"Technology design and programming" throughout the report"; 6 listed as
"Technology use, monitoring and control" throughout the report.

The Future of Jobs 157
World Economic Forum Platform for Shaping the Future
of the New Economy and Society
Project team
Saadia Zahidi
Member of Managing Board
Vesselina Ratcheva
Insight Lead, Benchmarking Practice
Guillaume Hingel
Insight Lead, Benchmarking Practice
Sophie Brown
Project Specialist
Acknowledgements We are extremely grateful to our colleagues on the Platform team for their collaboration, help and efforts, and in particular to Ida Jeng Christensen, Eoin Ó Cathasaigh, Genesis Elhussein, Till Leopold and SungAh Lee. A special thank you to Michael Fisher for his excellent copyediting work and to Accurat for their outstanding graphic designing and layout of the report.
Collaborations The Platform for the New Economy and Society aims to empower decision-making among leaders in business and policy by providing fresh, actionable insight through collaboration with leading experts and data-holding companies as part of its New Metrics Co-Lab. We would like to thank the following contributors for their collaboration and support to this report:
Automatic Data Processing (ADP)
Matthew Levin, Chief Strategy Officer, ADP LLCAhu Yildirmaz, Co-Head, ADP Research InstituteRenzhong Meng, Director, ADP Research Institute
Coursera
Emily Glassberg Sands, Head of Data Science Vinod Bakthavachalam, Senior Data Scientist Eric Karsten, Data Scientist
FutureFit AI
Hamoon Ekhtiari, CEOTerralynn Forsyth, Head of Product
Rachel Bowley, Senior Data Scientist, Economic GraphMurat Erer, Senior Insights AnalystMariano Mamertino, Senior Economist, Economic Graph TeamKristin Keveloh, Manager, Economic Graph Team Sein O Muineachain, Manager, Economic Graph Research and Insights (EMEA)
Contributors

The Future of Jobs 158
New Economy and Society Partners
The World Economic Forum would like to thank the Partners of the Platform for Shaping the New Economy and Society for their guidance and support to this report.
Platform Partners
Acknowledgements
AARPAccenture Adecco Group AGAIGAlghanim IndustriesAlixPartnersAmazon Web ServicesAroundtown SAAutomatic Data Processing Inc. (ADP)Bahrain Economic Development BoardBank of AmericaBank of MontrealBarclaysBC Energy Investments Corp.Bill & Melinda Gates FoundationBloomberg LPBoston Consulting GroupCentene CorporationCharoen Pokphand Group Company Limited (CP Group)Cisco Systems Inc.Clayton, Dubilier & Rice LLCCNH Industrial N.V.Coursera Inc.Crescent EnterprisesDassault Systèmes SEDawood Hercules CorporationDell TechnologiesDeloitteDentsu Inc.Deutsche Bank AGDeutsche Post DHL GroupDogan Şirketler Grubu Holding A.SDP World LimitedEurasian Resources Group SàrlEuropean Investment Bank (EIB)
EYFutureFit AIGoogle Inc.HCL TechnologiesHeidrick & StrugglesHenry Schein Inc.Hewlett Packard EnterpriseHP IncHSBCHubert Burda MediaIBM CorporationIndus GroupInfosys LtdIngka Group (IKEA)Invesco LtdIslamic Development BankJLLJohnson & JohnsonKearney Inc.KIRKBI A/S/The LEGO FoundationLinkedIn CorporationLRN CorporationManpowerGroupMarsh & McLennan Companies/MercerMcKinsey and CompanyMerck KGaAMicrosoft Corp.NatixisNBC Universal NestléNMC HealthcareNokia CorporationNovartis AGNovolipetsk Steel (NLMK)NYSE Group Inc.Oando PlcOmnicom Group Inc.
Open Society InstitutePAO SeverstalPayPalPJSC PhosAgroPladis Foods LimitedPricewaterhouseCoopers International LimitedPrince Mohammed Bin Salman bin Abdulaziz (MiSK) FoundationProcter & GamblePublicis GroupeQI GroupRBC Financial GroupRecruit Holdings Co. LtdReliance Industries LimitedRMZ Corp.Royal DSM NVSalesforce, SàrlSanofiSAP SESaudi AramcoSea LimitedSempra EnergyStandard Chartered BankStanley Black & Decker Inc.Teck Resources LimitedTrip.com Group LtdUber TechnologiesUdacityUnileverVerizon CommunicationsVisa Inc.VMware Inc.Willis Towers WatsonWiproWorkday Inc.WorldQuant LLCZurich Insurance Group
In addition, to our partners, the Platform for Shaping the Future of the New Economy and Society would like to thank the members of the Stewardship Board for their strategic guidance.
Platform Stewardship Board Members
A. Michael Spence, William R. Berkley Professor in Economics and Business, NYU Stern School of Business
Achim Steiner, Administrator, United Nations Development Programme (UNDP)
Adam Grant, Saul P. Steinberg Professor of Management and Psychology, The Wharton School, University of Pennsylvania
Ahmad bin Abdullah Humaid Belhoul Al Falasi, Minister of State for Entrepreneurship and SMEs, United Arab Emirates Government

The Future of Jobs 159
Alain Dehaze, Chief Executive Officer, Adecco Group AG
Alicia Bárcena Ibarra, Executive Secretary, United Nations Economic Commission for Latin America and the Caribbean (ECLAC)
Allen Blue, Co-Founder and Vice-President, Products, LinkedIn Corporation
Andrew McAfee, Co-Director and Co-Founder, MIT Initiative on the Digital Economy; Principal Research Scientist, Massachusetts Institute of Technology (MIT)
Asheesh Advani, President and Chief Executive Officer, JA Worldwide
Badr Jafar, Chief Executive Officer, Crescent Enterprises
Brian Gallagher, President and Chief Executive Officer, United Way Worldwide
Bruno Le Maire, Minister of Economy and Finance, Ministry of the Economy, Finance and the Recovery of France
Erik Brynjolfsson, Schussel Family Professor; Director, MIT Initiative on the Digital Economy, MIT - Sloan School of Management
Frank Appel, Chief Executive Officer, Deutsche Post DHL Group
Guy Ryder, Director-General, International Labour Organization (ILO)
Henrietta H. Fore, Executive Director, United Nations Children's Fund (UNICEF)
Jo Ann Jenkins, Chief Executive Officer, AARP
John Goodwin, Chief Executive Officer, The LEGO Foundation
Jonas Prising, Chairman and Chief Executive Officer, ManpowerGroup
Josephine Teo, Minister for Manpower and Second Minister for Home Affairs, Ministry of Manpower of Singapore
Khalid Al-Falih, Minister of Investment, Ministry of Investment of Saudi Arabia
Laura D'Andrea Tyson, Distinguished Professor of the Graduate School, Haas School of Business, University of California, Berkeley
Laura Liswood, Secretary-General, Council of Women World Leaders
Lynda Gratton, Professor of Management Practice, London Business School
Magdalena Andersson, Minister of Finance, Ministry of Finance of Sweden
Mariana Mazzucato, Professor of Economics of Innovation and Public Value; Founder and Director, Institute for Innovation and Public Purpose, University College London (UCL)
Martine Ferland, Chief Executive Officer, Mercer Limited
Minouche Shafik, Director, London School of Economics and Political Science
Peter Hummelgaard, Minister for Employment, Ministry of Employment of Denmark
Peter T. Grauer, Chairman, Bloomberg LP
Phumzile Mlambo-Ngcuka, Undersecretary-General and Executive Director, United Nations Entity for Gender Equality and the Empowerment of Women (UN WOMEN)
Rania Al-Mashat, Minister of International Cooperation, Ministry of International Cooperation of Egypt
Ricardo Hausmann, Founder and Director, Growth Lab, Harvard University
Rich Lesser, Global Chief Executive Officer, Boston Consulting Group
Robert E. Moritz, Global Chairman, PwC
Salil S. Parekh, Chief Executive Officer and Managing Director, Infosys Limited
Sharan Burrow, General Secretary, International Trade Union Confederation (ITUC)
Sharon Thorne, Global Chair, Deloitte
Stanley M. Bergman, Chairman of the Board and Chief Executive Officer, Henry Schein Inc.
Tariq Al Gurg, Chief Executive Officer, Dubai Cares
Xavier Sala-i-Martin, Professor, Department of Economics, Columbia University
To learn more about the Platform for Shaping the Future of the New Economy and Society, please visit: https://www.weforum.org/platforms/shaping-the-future-of-the-new-economy-and-societyTo get involved, please contact [email protected]

The Future of Jobs 160
The Future of Jobs Report 2020 is the result of extensive collaboration between the World Economic Forum and regional survey partners. We would like to recognize the following organizations for their contribution to the World Economic Forum’s Future of Jobs Survey and this report.
Survey Partners
Argentina
IAE Business School—Universidad Austral
Bahrain
Bahrain Economic Development Board
India
LeadCap Knowledge Solutions Pvt. Ltd (LeadCap Ventures)National Skill Development Corporation (NSDC)
Indonesia
KADIN Indonesia
Japan
Waseda University
Mexico
Mexican Institute for Competitiveness (IMCO)
Netherlands
Amsterdam Centre for Business Innovation, Amsterdam Business School, University of Amsterdam
Pakistan
Mishal PakistanPunjab Skills Development Fund
Russian Federation
Eurasia Competitiveness Institute (ECI)
Switzerland
University of St. Gallen, Competence Centre for Diversity and Inclusion (CCDI-HSG)
South Africa
Business Leadership South AfricaBusiness Unity South AfricaTrade & Industrial Policy Strategies (TIPS)
Thailand
Chulalongkorn Business School, Chulalongkorn UniversityThailand Management Association (TMA)
United Arab Emirates
National Program for Advanced Skills
United Kingdom
Confederation of British Industry (CBI)
The World Economic Forum would like to thank Global Future Council on the New Education and Work Agenda for their thought leadership and strategic guidance on the Education 4.0 framework and the Schools of the Future campaign.
Global Future Council on the New Education and Work Agenda
Suzanne Fortier, Principal and Vice-Chancellor, McGill University, Canada (Council Co-Chair)
Sarah Kirby, Group Head, Organization Design and Human Resource Strategy, Zurich Insurance Group, Switzerland (Council Co-Chair)
Jeremias Adams-Prassl, Professor of Law, University of Oxford, UK
Abdullah Al Karam, Chairman and Director-General, Knowledge and Human Development Authority, United Arab Emirates
Erik Brynjolfsson, Schussel Family Professor; Director, MIT Initiative on the Digital Economy, MIT - Sloan School of Management, USA
Greetje Corporaal, Postdoctoral Research Fellow, Oxford Internet Institute, University of Oxford, UK (Council Fellow)
Xiao Dun, Founder, 17Zyuoye, China

The Future of Jobs 161
Susan Gianinno, Senior Adviser, Publicis Groupe, France
Emily Glassberg Sands, Head, Data Science, Coursera Inc., USA
Mark Graham, Professor of Internet Geography, Oxford Internet Institute, University of Oxford, UK
Lynda Gratton, Professor of Management Practice, London Business School, UK
Anne-Sophie Grouchka, Member of the Executive Board, France; Chief Customer Officer, Allianz SE, France
Harsha Jalihal, Vice-President, Human Resources, USA, Unilever, USA
Jawad Khan, Chief Executive Officer, Punjab Skills Development Fund, Pakistan
Annie Koh, V3 Group Professor of Family Entrepreneurship; Professor of Finance, Practice; Vice-President, Office of Business Development, Singapore Management University, Singapore
Frida Polli, Co-Founder and Chief Executive Officer, Pymetrics Inc., USA
Dan Restuccia, Chief Analytics and Product Officer, Burning Glass Technologies, USA
Lee Sangheon, Director, Employment Policy Department, International Labour Organization, Switzerland
Bettina Schaller, Head, Group Public Affairs, The Adecco Group, Switzerland
Andria Zafirakou, Teacher, Arts and Textile, Alperton Community School, UK
Ray Tong Zhilei, Chairman and Chief Executive Officer, ChineseAll Digital Publishing Group Co. Ltd, China

The Future of Jobs October 2020
The Future of Jobs 162

World Economic Forum91-93 route de la CapiteCH-1223 Cologny/GenevaSwitzerland
Tel +41 (0) 22 869 1212Fax +41 (0) 22 786 2744
The World Economic Forum is
the International Organization
for Public-Private Cooperation
and engages the foremost
political, business and other
leaders of society to shape
global, regional and industry
agendas.