the evolution of the u.s. automobile industry and detroit ... evolution of the u.s. automobile...
TRANSCRIPT

The Evolution of the U.S. Automobile Industry and
Detroit as its Capital
Steven Klepper, Carnegie Mellon University
Date of this version: November 2001
Print date: 30 December, 2001
Steven Klepper
Dept. of Social & Decision Sciences
Carnegie Mellon University
Pittsburgh, PA 15213
USA
phone 412 268 3235
fax 412 268 6938
email [email protected]
Acknowledgements: I thank David Hounshell and John Miller for many helpful discussions and Wesley Cohen, Stan Metcalfe, Peter Thompson, and seminar participants at Wharton for helpful comments. Support is gratefully acknowledged from the Economics Program of the National Science Foundation, Grant No. SES-0111429, and from IBM through its faculty partnership awards.
The Evolution of the U.S. Automobile Industry and Detroit as its Capital
Abstract
In its first fifteen years the U.S. automobile industry was characterized by a great
deal of entry and the number of firms exceeded 200. Despite robust growth in the market
for automobiles, the industry subsequently sustained a prolonged shakeout in the number
of producers and evolved to be an oligopoly dominated by three firms. The industry also
evolved to be heavily concentrated around Detroit, Michigan, which not only was home
to its top three firms but most of its other leaders. A model of industry evolution
characterized by heterogeneous firm capabilities, increasing returns associated with
R&D, and a birth and inheritance process governing entry is developed to explain these
patterns. Predictions of the model concerning entry and firm survival are tested using
data on the origin and years of production of every entrant into the industry. The
shakeout is shown to result from a process imparting strong advantages to early entrants,
and the geographic concentration of the industry is attributed to the success of four early
entrants around Detroit, who in turn spawned a large number of successful firms in the
Detroit area that together dominated the industry.
[Key words: Firm Capabilities, Spinoffs, First-mover Advantatages]
[Running Title: Firm Capabilities and Industry Evolution]
1
The Evolution of the U.S. Automobile Industry and Detroit as its Capital
Steven Klepper
I. Introduction
Between 1900 and 1930, Detroit experienced nearly unparalleled growth for a
large city, growing six-fold from a population of 305,000 to 1,837,000. There was no
secret formula behind this growth. It was fueled by the concentration around Detroit of
the automobile industry, which by 1929 was the largest industry in the U.S. (Davis [1988,
p. ix]). The industry was not initially concentrated around Detroit, with numerous firms
entering through the eastern seaboard and the midwest. By 1909, when there were well
over 200 producers, Detroit was a leading automobile center, but it was in the subsequent
era that Detroit rose to preeminence. After 1909 the number of firms in the industry fell
sharply and within ten years most of the leading makes of automobiles were produced by
Detroit-area firms, with the industry evolving to be an oligopoly dominated by three
famous Detroit firms, General Motors, Ford, and Chrysler.
While industries are typically agglomerated geographically, it is rare for
industries to be as concentrated around one region as automobiles (Ellison and Glaeser
[1997]). Unraveling the causes of the extreme shakeout and concentration of the auto
industry around Detroit thus promises to shed light on one of the driving questions of the
burgeoning literature on economic geography, namely what forces contribute to the
agglomeration of industrial activity. Numerous explanations have been advanced for the
concentration of the automobile industry around Detroit. Some emphasize Detroit’s low-
cost access by water to raw materials and major markets for autos and Detroit’s many
small machine shops and skilled laborers available to supply the industry (Rae [1980]).
Coupled with increasing returns to scale, which is not much of a leap given the
oligopolistic structure that emerged in the industry, one has the main ingredients of
Krugman et al.’s (Krugman [1991], Futia, Krugman, and Venables [1999]) theory of
agglomeration. Other explanations emphasize factors making Detroit’s initial entrants
especially capable competitors. Coupled with positive externalities associated with
knowledge spillovers and more developed input markets (Tsai [1997], Rae [1980]), one
has the main ingredients of agglomeration theories featuring externalities and path-
2
dependent processes (Arthur [1988]). Indeed, the auto industry has been a kind of litmus
test of competing theories of agglomeration, but no consensus has emerged for the
concentration of the industry around Detroit, reflecting deficiencies in all the proferred
explanations (Tsai [1997]).
The purpose of this paper is to exploit the wealth of information that has been
collected about the industry and the heritage of its producers to gain new insight into the
forces that shaped its evolution. Using data on the location and years of production of
every manufacturer of automobiles from 1895 to 1966 and on the annual production
leaders, the evolution of the market structure and the concentration of the industry around
Detroit is traced. Brief information on the origin of each entrant into the industry is also
used to identify the pre-entry experiences of each firm. Three types of firms with
distinctive experiences that could be interpreted as the basis for firm “capabilities” are
distinguished: preexisting firms diversifying from related industries, new firms founded
by people who headed firms in these same related industries, and new firms founded by
employees of incumbent automobile firms. The analysis focuses on how the background
of firms and the timing of their entry affected their performance, which in turn is used to
gain insight into the factors conditioning the evolution of the industry’s market structure
and geographic distribution of activity.
A version of the model of industry evolution developed in Klepper [1996, 2001b]
is used to structure the analysis of the data. It features how heterogeneity in firm
capabilities, increasing returns to firm size associated with research and development,
and costly firm growth can account for a rise and then shakeout in the number of
producers and the evolution of an oligopolistic market structure. A birth and heredity
process is added to the model to analyze the entry of new firms started by employees of
incumbent firms. It is shown that with this additional component, the model can not only
explain the evolution of the industry’s market structure but also its concentration around
Detroit, Michigan, attributing the latter development to the chance location around
Detroit of four of the most successful early entrants into the industry and the many firms
they spawned. Numerous distinctive hypotheses are derived from the model that are used
to test its explanation for the evolution of the industry’s horizontal and geographic market
structure.
3
The paper is organized as follows. The history of the industry is first reviewed in
Section II. The model of industry evolution developed in Klepper [1996, 2001b],
extended to encompass a birth and heredity process for employee startups, is then
presented in Section III. Various predictions are derived from the model concerning
entry, firm location, and firm survival in Section IV. Firm entry and survival analyses are
used to evaluate the predictions in Section V, and more formal econometric methods are
used to test the predictions in Section VI. Implications of the findings are discussed in
Section VII, which also includes concluding remarks.
II. History of the Industry
Smith [1968] compiled a list of every make of automobile produced
commercially1 in the United States from the start of the industry in 1895 through 1966.
He lists the firms that manufactured each make, their location, the years they
manufactured the make, and any reorganizations and ownership changes the firms
underwent. Smith’s list of makes was used to derive the annual number of entries, exits,
and manufacturers of automobiles for the period 1895-1966, where entry and exit dates
are based on the first and last year of commercial production. These series are graphed in
the bottom panel of Figure 1. The top panel plots the percentage of firms exiting the
industry on an annual and five-year moving average basis.
The number of firms that entered the industry grew steadily from 1895 to 1907,
peaking at 82 in 1907. Entry remained high for the next three years and then dropped
sharply. It averaged 15 firms per year from 1911 to 1922 and became negligible after
1922, with only 15 firms entering from 1923 through 1966. After the first few years, the
industry exit rate exceeded 10% for many years, and by 1910 the number of exits
overtook the number of entries. Except for the two-year period 1919-1921, the number
1 Various lists of automobile producers have been compiled. The most inclusive is a list compiled by Carroll and Hannan [1995] from the Standard Catalog of American Cars, which attempts to list all firms ever mentioned as involved in the automobile industry. Smith [1968, pp. 183-184] confines his list to firms that manufactured and sold to the general public. He excludes the few companies that built and exhibited cars for the sole purpose of selling stock, the hundreds of companies that filed for incorporation but failed to advance beyond the paper stage, and the hundreds more that designed a car but never got into production. He also excludes firms that produced racing cars, taxicabs, and cycle cars. Although the compilations of Smith and Carroll and Hannan differ in terms of the number of producers, they have similar time patterns in terms of entry, exit, and the number of producers. Except for Epstein [1928], who
4
of firms fell steadily from 1909 to 1941, dropping from a peak of 272 in 1909 to 9 in
1941.
Not surprisingly given this drastic decline in the number of firms, the industry
evolved to be a tight oligopoly dominated by three firms, General Motors, Ford, and
Chrysler. General Motors was formed in 1908 as a merger of a number of firms, with its
most prominent components, Buick, Cadillac, and Olds Motor Works, dating back
respectively to 1903, 1902, and 1901. Ford Motor Company entered in 1903. Chrysler
Corporation emerged in 1924 through the efforts of Walter Chrysler, ex-president of
Buick, to reorganize two of the leading firms in the industry that had merged after falling
on hard times, Maxwell Motor Corporation, which dated back to 1904, and Chalmers
Motor Co., which dated back to 1906. In 1911, Ford and General Motors were the top
two firms, accounting for 38% of the industry’s output. By the 1920s their joint share
had increased to over 60%, and after 1930 General Motors, Ford, and Chrysler jointly
accounted for over 80% of the industry’s output (FTC [1939, p. 20]).
General Motors, Ford, and Chrysler were all based in Detroit, Michigan, which
for many years had been the geographic center of the industry. The industry was not,
however, originally focused around Detroit. The annual number of firms and the
percentage of all firms located in the Detroit area2 from 1895 to 1941, when the number
of firms reached a trough of 9, is presented in the bottom two panels of Figure 2. In the
first six years of the industry, 1895-1900, there were 69 entrants. Packard Motor Car Co.
(nee Ohio Auto Co.) entered in 1900 and moved to Detroit in 1903, but otherwise no
manufacturer was located in Detroit until Old Motor Works in 1901. Subsequently, the
number of firms in the Detroit area rose, reaching a peak of 41 in 1913, four years after
compiled a very selected list, most other lists exhibit similar time trends (cf. Klepper and Simons [1997, pp. 387-388]). 2 In addition to Detroit, the Detroit area was defined to include the following locations in Michigan, all of which are within approximately 100 miles of Detroit: Adrian, Chelsea, Flint, Jackson, Marysville, Oxford, Plymouth, Pontiac, Port Huron, Sibley, Wayne, and Ypsilanti. The boundaries of this region were chosen to reflect mobility of the firms within the region. For example, Olds Motor Works moved from Lansing to Detroit and back and Buick moved from Detroit to Flint, suggesting that Lansing and Flint, two of the further cities from Detroit in the defined region, were in the same geographic sphere as Detroit. While most firms located in the Detroit area maintained this location over their entire period of automobile production, 11 firms moved into or out of the Detroit area. In the econometric analysis, the location of these firms was allowed to vary on annual basis, but in all compilations the 11 firms were assigned a single location based on where they were located for a majority of their years of automobile production.
5
the peak in the number of firms in the industry. The number of Detroit-area firms
subsequently declined along with the decline in the total number of automobile
producers. After the entry of Olds Motor Works in 1901, the percentage of firms in the
Detroit area rose to 15% by 1905, then fell back some in the next four years after which it
increased to 24% by 1916. It subsequently fell back again in the next eight years or so,
after which it climbed to over 50% by 1935.
The concentration of activity around Detroit was actually considerably greater
than the percentage of firms based in the Detroit area. The editors of the magazine
Automobile Quarterly compiled a list of the leading makes of American automobiles
beginning in 1896 based upon production figures by make (Bailey [1971]). Through
1900 at most six total makes are listed, with 14 or 15 makes listed from 1905 to 1924 and
18 makes listed by 1928, after which nearly all the makes were manufactured by firms
based in the Detroit area. The annual number of makes manufactured by Detroit-area
firms for 1896 to 1928 is plotted in the top panel of Figure 2. The one make listed for the
Detroit area in 1896 and 1897 reflects one experimental car made by Ford and Olds
respectively in these two years. The first listing of a Detroit-area firm that produced
more than one car was Olds Motor Works in 1901, when it was credited with the
manufacture of 425 cars. Olds was the only firm in the Detroit area listed as one of the
(nine) industry leaders in 1901. Subsequently, the number of makes manufactured by
Detroit-area firms increased through 1915, when it reached 13 (out of 15 makes listed),
and then reached 15 (out of 18) by the end of the period in 1928. Thus, by the mid-1910s
the Detroit-area firms were totally dominating the industry, with over 14 separate firms
involved in the decade 1911-1920,3 and the Detroit-area firms continued to dominate the
industry for the next 45 years.
III. Model of Industry Evolution
The model is the same as in Klepper [2001b], with a few extensions. It is first
specified, and then its implications for the evolution of industry market structure are
discussed.
3 Even these figures understate the dominance of Detroit, with two of the three other prominent non-Detroit firms having links to Detroit. One, Studebaker, entered initially by marketing the cars of a Detroit
6
A. Specification of the Model
The model contains many simplifications and stylizations designed to isolate the
role of R&D, where R&D encompasses all efforts devoted by firms to improving their
technology. The model is specified in terms of discrete time intervals, where period 1
denotes the start of the industry. In each period, it is assumed that new opportunities for
technological improvements arise, and incumbent firms conduct R&D to lower their
average cost.4 Firms are assumed to differ in terms of the productivity of their R&D, and
all innovations are assumed to be imitated one period after they are introduced. This is
modeled as follows. The average cost of firm i in period t, cit, is
cit = ct – aig(rit) + εit,
where ct is a cost component common to all firms in period t, rit is firm i’s spending on
R&D in period t, εit ≥ 0 is a random cost shock to firm i in period t, and ai calibrates the
productivity of the firm’s R&D efforts. For simplicity, unit transportation costs, which
are embodied in ct, are assumed not to vary across firms or units of output, reflecting the
national character of the automobile industry. The reduction in the firm’s average cost in
period t is determined by the amount of R&D it conducts, rit, and the productivity of its
R&D, ai. The function g(rit) is assumed to be such that g'(rit) > 0 and g''(rit) < 0 for all rit
> 0 to reflect diminishing returns to R&D. All innovations are assumed to be costlessly
imitated after one period, which is modeled as ct = ct-1–maxi{aig(rit-1)}, where
maxi{aig(rit-1)} is the largest cost decrease from R&D among all firms in period t-1. Last,
εit is a random cost shock that causes the firm’s average cost to exceed its minimum
possible value in period t. Cost shocks arise from factors such as difficulties in imitating
the leading firm’s innovations, unanticipated capital shortages, lax management, etc. It is
assumed that cost shocks are independent across periods and thus last for only one
period.
In each period, firms are assumed to retain their customers from the prior period,
but if they want to expand they must incur a cost of growth of m(∆qit), where ∆qit is the
company, E-M-F, that it later acquired. The other, Nash, was a leading firm acquired by Charles Nash, the ex-president of General Motors, in 1916. 4 R&D to improve product quality can be thought of as lowering the firm’s average cost per unit of quality and thus can be accommodated.
7
growth in the firm’s output and m'(∆qit) ≥ 0 and m''(∆qit) ≥ 0 for all ∆qit ≥ 0 to reflect
increasing marginal costs of growth. This cost of growth applies to entrants as well as
incumbents and thus determines their size at entry.5 For simplicity, it is assumed that the
industry demand curve is fixed over time and all firms are price takers, so that in each
period the price pt clears the market.6
Firms in the industry in period t choose rit and ∆qit to maximize Πit, their profits in
period t before the realization of the cost shock εit:
(1) Πit = [pt – ct + aig(rit)] (qit-1 + ∆qit) – rit – m(∆qit).
If these profits are less than zero then the firm exits the industry. Incumbent firms are
also assumed to exit if they incur a sufficiently large cost shock. To simplify, in each
period t the decision to exit after the realization of the cost shock is assumed to be based
only on the firm’s current profitability. If the firm’s cost shock is such that εit > pt – ct +
aig(rit) then the firm would lose money by producing, in which case the firm is assumed
to disband its R&D operation and permanently exit the industry. Otherwise, the firm
remains in the industry and spends rit on R&D and grows by ∆qit.
Entry is specified as follows. In each period there are a limited number of
potential entrants with the requisite R&D productivity to enter the industry. Four types
of entrants are distinguished: experienced firms, experienced entrepreneurs, spinoffs, and
inexperienced firms. The first group diversify from related industries, the second group
are de novo firms founded by heads of firms in related industries, the third group are de
novo firms founded by employees of incumbent firms, and the fourth group is a residual
category of inexperienced denovo firms composed primarily of firms founded by
capitalists and firms founded by lower-level employees in related industries. Let amax
denote the maximum R&D productivity of any firm. It is assumed that some experienced
firms, experienced entrepreneurs, and spinoffs attain amax, but all the inexperienced firms
lack the pre-entry experience needed to attain amax. The inexperienced firms are also
assumed to have a less favorable distribution of R&D productivities than the other three
5 Entrants in period t have no output prior to entry and thus enter at size ∆qit. 6 Firms are also assumed to be sufficiently small that the exit of any one firm does not appreciably affect the total quantity supplied by all firms.
8
types of firms. This is specified as follows. Experienced firms, experienced
entrepreneurs, and spinoff potential entrants are assumed to have the same distribution of
R&D productivities, denoted as F(a). The distribution of R&D productivities for the
inexperienced firms, G(a), is such that (F(a)-F(p))/(1-F(p)) < (G(a)-G(p))/(1-G(p)) for all
p≤a<amax, which insures that for any cutoff p, the truncated distribution of R&D
productivity above p for the experienced firms, experienced entrepreneurs, and spinoffs
stochastically dominates that of the inexperienced firms.7 Each firm is assumed to know
its R&D productivity at its time of entry, and for now it is assumed that its R&D
productivity remains fixed over time.
Potential entrants in each period enter if their maximum possible profits based on
(1) (with qit-1 = 0) are positive. For simplicity, it is assumed that to take advantage of
local knowledge and to avoid the costs of moving, entrants locate where they are based,
which for de novo firms is where their founder(s) lives. The number of potential entrants
of each type in each period is specified as follows. It is assumed that at the start of the
new industry, there are firms and experienced entrepreneurs in related industries with
sufficiently high R&D productivities to enter profitably. As these firms enter, their ranks
get depleted, causing the number of potential entrants in the experienced firm and
experienced entrepreneur categories to decline over time. The third category of entrants,
spinoffs, is assumed to be governed by a birth and heredity process. Employees of
incumbent firms are assumed to learn from their experiences, which they can exploit in
their own firms. Only employees with the requisite organizational skills, knowledge, and
risk preferences start spinoffs. It is assumed that better-performing firms have superior
learning environments, which leads them to spawn more spinoffs and spinoffs with
higher R&D productivity. For simplicity, it is assumed that as the industry expands and
more employees are hired, the number of potential spinoff entrants rises proportionally.
The fourth category is composed primarily of two types of firms. One type is founded by
capitalists, who typically hire experienced employees of incumbents to direct their firms.
It is assumed that the number of these potential entrants increases in proportion to the
7 Letting p=0, this implies F(a)<G(a), which is the standard condition for stochastic dominance. If only R&D productivities above p are considered, the respective truncated distributions are (F(a)-F(p))/(1-F(p))
9
number of employees in the industry, comparable to potential spinoff entrants. The other
type of inexperienced firm is founded by lower-level employees in related industries.
Comparable to the first two types of potential entrants, their number is assumed to
decline over time as the ranks of employees in related industries willing and able to start
their own firms gets depleted over time. Based on the time trends in these two types of
potential entrants, the percentage growth in the number of potential inexperienced
entrants should be less than the growth rate of the spinoff potential entrants but greater
than the growth rates of the first two types of potential entrants.
B. Evolution of Market Structure
Klepper [2001b] derives a number of results that apply directly to the proposed
model. In each period, larger firms invest more in R&D since the total profit from R&D,
which equals the reduction in average cost times the firm’s output, is scaled by the firm’s
output. Furthermore, in every period firms expand until the marginal cost of growth
equals their profit per unit of output. The firm’s profit per unit of output is determined by
its investment in R&D and its R&D productivity. Therefore, larger firms and firms with
greater R&D productivity have greater profit margins and thus expand faster.
Consequently, among firms that entered in the same period, firms with greater R&D
productivity conduct more R&D and are always larger and more profitable than firms
with lower R&D productivity. Furthermore, among firms with the same R&D
productivity, firms that entered earlier start growing earlier and are thus always larger and
more profitable than later entrants.
Expansion of incumbents over time and (initially) entry is assumed to cause the
total output of the industry to rise over time and pt – ct, the average price-cost margin of
firms that do no R&D, to decline over time. When pt – ct is high initially, the minimum
R&D productivity required for entry to be profitable is low and a range of firms in terms
of their R&D productivities enter. As pt – ct falls over time, the minimum ai needed for
entry to be profitable rises, causing the percentage of potential entrants of each type that
enter the industry to decline over time. Eventually entry becomes unprofitable even for
firms with the greatest R&D productivity, at which point entry ceases altogether.
and (G(a)-G(p))/(1-G(p)), so the assumed condition is the analogous condition for stochastic dominance for
10
The decline in pt – ct also causes the profits of incumbents to decline over time.
This is partially offset by the rise in firm R&D over time that occurs as firms grow, which
lowers firm average costs. In every period, incumbents that experience a sufficiently
large cost shock exit. Incumbents also exit when pt – ct falls sufficiently that they cannot
earn positive profits even if they produce at their minimum possible cost. The latest
entrants with the lowest R&D productivity are always the least profitable and thus the
most vulnerable to exit. Thus, even after entry ceases, firms exit, with the latest entrants
with the lowest R&D productivity expected to exit first. This causes the number of firms
to decline steadily over time, resulting in a shakeout. It also causes the earliest entrants
with the greatest R&D productivity to take over an increasing share of the industry’s
output, which contributes to the evolution of an oligopolistic market structure.
Thus, over time firm profit margins decline, entry eventually ceases and a
shakeout occurs, and the industry evolves to be an oligopoly. The market structure
predictions of the model correspond to what occurred in the auto industry. Furthermore,
the rates of return on investment of the leading firms, which began at extremely high
levels, also declined over time (Epstein [1928, p. 256]). Thus, the model passes an initial
hurdle of being able to account for the way the market structure of the automobile
industry and the profitability of the firms evolved over time. It remains to be shown that
the model can also account for the increasing concentration of the industry in one region,
around Detroiit, Michigan. This is shown in the next section, where further predictions
are derived from the model that are used subsequently to test its account of the evolution
of the automobile industry.
IV. Further Predictions
The model has a number of additional implications concerning firm survival,
entry, and the geographic distribution of activity that are reviewed in this section. The
predictions regarding entry and regional activity follow straightforwardly from the
model. The survival predictions are based on comparable predictions established in
Klepper [2001b].
A. Firm Survival
the truncated distributions.
11
The survival rates of firms will be examined empirically based on their time of
entry and background. The model provides some intuition regarding how both factors
affect survival rates.
Consider first two cohorts of entrants that entered at different times. Suppose the
entrants in each cohort had the same distribution of R&D productivities. At each age, the
earlier entrants would face a higher industry price-cost margin than the later entrants.
Thus, if two entrants had the same R&D productivity, at every age the earlier entrant
would do more R&D and grow more. Hence it would have a higher profit margin and
thus a lower hazard because it would take a greater cost shock to induce it to exit than the
later entrant. Therefore, if the early and late entry cohorts had the same distribution of
R&D productivities, the earlier entry cohort would have a lower hazard and higher
survival rate at every age. However, the two entry cohorts will not have the same
distribution of R&D productivities—the composition of potential entrants changes over
time, and more importantly, the minimum R&D productivity needed for profitable entry
is greater for the later entry cohort. Consequently, the earlier entry cohort will have a set
of lower R&D productivity firms with no counterpart in the later entry cohort. These
firms will pull up the initial hazard of the early entry cohort and could conceivably cause
the hazard of the early entry cohort at young ages not to be less than that of the later entry
cohort. Over time, the lowest productivity firms from each cohort would be expected to
exit first, causing the R&D productivities of the firms in each cohort to converge toward
amax. The early entrants with R&D productivity of amax will have the lowest hazards of all
firms. Consequently, as the R&D productivities of the early and late entry cohorts
converge toward amax, the earlier entrants would be expected eventually to have lower
hazards and higher survival rates, with the later entry cohort expected to become extinct
first.
Thus, the model admits the possibility of the earlier entrants not having lower
hazards and higher survival rates at young ages, but eventually having lower hazards and
higher survival rates at older ages. This possibility is listed as hypothesis 1 in Table 1
and is illustrated in the cohort survival graph in the top panel of Figure 3. Anticipating
the empirical analysis, three cohorts of entrants are represented. The survival curves
represent the percentage of firms surviving to each age. The vertical axis in each graph is
12
scaled logarithmically so that the negative of the slope of each curve indicates the hazard
of the firms at the respective age. To simplify, it is assumed that the firms in cohort 3,
the latest group of entrants, have a constant hazard rate up to the time that the cohort
becomes extinct. The figure is (arbitrarily) constructed so that the entrants in the first two
cohorts initially have the same hazards as the entrants in the last cohort. Eventually the
earlier entry cohorts have lower hazards, with the first cohort having the lowest hazards
at older ages, which causes the survival curves of the first two cohorts to flatten out with
age and diverge from the survival curve of the third cohort. These patterns are
distinctive. Many theories attribute shakeouts to a particular event, such as an innovation
or an information cascade (Utterback and Suárez [1993], Jovanovic and MacDonald
[1994], Horvath, Schivardi, and Woywode [2001]). Such theories imply that early
entrants have a lower hazard at young but not older ages (Klepper and Simons [2001]),
which is the opposite of the illustrated pattern.
The model also has distinctive implications regarding how survival rates differ
across firms with different backgrounds. Among firms that entered at the same time, the
assumptions regarding the R&D productivity distributions of the four types of firms
imply that inexperienced firms will have lower average R&D productivities at every age
than the other three firm types. Consequently, in each entry cohort, the inexperienced
firms will have higher hazards at every age than the other three types of firms. This is
summarized as hypothesis 2 in Table 1 and is illustrated in the bottom panel of Figure 3
for inexperienced and experienced firms for the arbitrary case of constant hazards.
Hypothesis 2 is also distinctive. Many theories can accommodate more experienced
firms having higher hazards than inexperienced firms at young ages, but their logic
generally implies that such differences decline with age (Klepper [2001b]).8
Hypotheses 1 and 2 are stated in terms of the four classes of entrants that are
distinguished. Finer gradations of the spinoffs and the experienced firms and
experienced entrepreneurs will be introduced in the empirical analysis. The model
8 It was assumed that firm R&D productivities do not change over time, but this is not necessary for hypothesis 2. If firm R&D productivities revert toward a common value as firms age, then at any given age firms that entered with a greater R&D productivity would still be larger. Therefore, they would conduct more R&D and hence have greater profit margins and lower hazards than firms that entered at the same time with lower R&D productivities, and hypothesis 2 would continue to hold.
13
assumes that spinoffs from better-performing firms will have higher R&D productivities,
hence the hazard of spinoffs at every age should be a decreasing function of the
performance of their parents. The premise behind experienced firms and experienced
entrepreneurs having lower hazards than inexperienced firms is that they can draw on
their experiences in related industries to enhance the productivity of their R&D. It would
be expected that the more related their industries are to automobiles, the more valuable
will be their experience and thus the lower will be their hazards at every age. These
propositions are summarized as hypothesis 3 in Table 1.
B. Entry
Over time, the minimum R&D productivity required for profitable entry rises,
which causes the fraction of each type of potential entrant that enters the industry to fall.
This fraction will be equal for the experienced firms, experienced entrepreneurs, and
spinoff potential entrants since they have the same R&D productivity distribution. But
the number of potential spinoff entrants was assumed to rise over time while the number
of potential experienced firm and experienced entrepreneur entrants was assumed to
decline over time. Consequently, the ratio of spinoffs to experienced firm and
experienced entrepreneur entrants should rise over time. Alternatively, the fraction of
potential entrants that enter must always be less for the inexperienced firms than the other
three types of firms and must go to zero before the other three types of firms.
Consequently, eventually the ratio of spinoff entrants, experienced firm entrants, and
experienced entrepeneur entrants relative to inexperienced entrants should rise. It was
assumed that the R&D productivity of spinoff entrants was related to the performance of
their parents. Consequently, with the minimum R&D productivity required for profitable
entry rising over time, the model implies that over time the performance of the parents of
spinoff entrants should improve. At any point in time, the model also implies (by
assumption) that better-performing firms will spawn more spinoffs. These predictions
are summarized as hypotheses 4a-4d in Table 1. Hypotheses 4b and 4c concerning the
eventual relative decline in the number of inexperienced entrants and the improvement in
the performance of the parents of spinoff entrants are distinctive; they follows only if
potential entrants know their R&D productivity prior to entry, whereas many theories
14
assume that entrants can learn about their capabilities only by entering (e.g., Jovanovic
[1982], Horvath et al. [2001]).
C. Regional Activity
Recall that in the first six years of the automobile industry, no firms entered in the
Detroit area, and subsequently the percentage of firms in the Detroit area increased
sharply and the firms were distinctively successful.
The model implies that the early entrants will be disproportionately experienced
firms and experienced entrepreneurs. If the Detroit area attracted few early entrants, then
the model implies that the percentage of entrants accounted for by experienced firms and
entrepreneurs should be lower in the Detroit area than elsewhere. Since the
inexperienced firms are not expected to be as successful as the spinoff entrants, it would
then have to be the spinoff entrants that fueled the growing concentration of activity in
the Detroit area if the model is to explain this pattern. This could occur if the earliest
entrants in the Detroit area were unusually successful. According to the model, better-
performing firms will have more and better spinoffs, and spinoffs will generally locate
close to their parents. Hence if the earliest entrants in the Detroit area were unusually
successful, this could start a cascading spinoff process in the Detroit area contributing to
a growing concentration of the industry around Detroit.
This explanation is dependent on a number of assumptions and has a number of
testable implications. First, if spinoffs locate close to their parents, then spinoffs of
Detroit-area firms should generally have located in the Detroit area and spinoffs located
in the Detroit area should generally have had parents located in the Detroit area. Second,
if a few unusually successful early entrants fueled a cascading spinoff process, then the
percentage of entrants that were spinoffs should have been higher in the Detroit area than
elsewhere. Third, if better-performing firms spawn better-performing spinoffs, then the
parents of Detroit-area spinoffs should have performed better than the parents of spinoffs
elsewhere. Fourth, if a few unusually successful early entrants in the Detroit area
spawned a cascading spinoff process, then it should be possible to directly and indirectly
trace back many of the spinoffs in the Detroit area to a few very successful early entrants.
Fifth, relatedly the spinoffs in the Detroit area should have had lower hazards of exit at
every age than the spinoffs elsewhere. Sixth, the model assumes that better-performing
15
firms spawn better-performing spinoffs because the founders of the spinoffs learn from
their parents. Learning is assumed to occur only between a firm and its spinoffs, and no
benefits are assumed to accrue to any other firms. Moreover, there are no other
mechanisms hypothesized in the model that would allow firms to learn from or benefit
from other firms. Therefore, inexperienced entrants that located in the Detroit area would
not share in any of the benefits experienced by the spinoffs because of the absence of any
kind of agglomeration economy in the model. This implies that in contrast to the spinoff
entrants, inexperienced entrants located in the Detroit area should not have had lower
hazards than inexperienced entrants located elsewhere. These predictions are summarized
as hypothesss 5a-5f in Table 1.
V. General Patterns
To test the various predictions, the firms are divided according to their time of
entry and prior experience. To probe the importance of time of entry, firms are grouped
into three entry cohorts. Each cohort is constrained to span at least five years, and the
cohorts are defined to have comparable numbers of firms. The first cohort contains the
219 firms that entered from 1895 to 1904, the second cohort includes the 271 firms that
entered between 1905 and 1909, and the third cohort contains the remaining 235 firms
that entered between 1910 and 1966. Firms that were reorganized or acquired by
nonautomobile producers were treated as continuing producers. Mergers and acquistions
were treated as continuations of the firm whose name was retained, or in the case of
mergers the largest firm involved, with the other firms treated as censored exits.9
Approximately 6% of the firms exited by being acquired by another automobile firm or
through a merger.
The classification of firms according to their prior experience is based primarily
on Smith [1968] and the brief histories of the firms in the Standard Catalog of American
9 These standards were generally straightforward to implement. The principal exception concerned Chrysler Corporation. Chrysler evolved out of Maxwell Motor Co. and Chalmers Motor Co. when Walter Chrysler, formerly the president of Buick, was called in to reorganize Maxwell, which had recently merged with Chalmers. Maxwell was descended from Mawell-Briscoe, which was a very successful 1904 entrant that was the centerpiece of the unsuccessful 1910 United States Motor Co. merger organized by one of the founders of Maxwell-Briscoe. Maxwell emerged from the ruins of United States Motor Co., regaining a leading position in the industry until it floundered before Walter Chrysler was brought in to reorganize it. Accordingly, Chrysler Corporation was treated as the lineal descendant of Maxwell-Briscoe.
16
Automobiles (Kimes [1996]), which contains an entry for every make of automobile on
Smith’s list.10 Smith categorized firms according to whether they entered automobiles
from another business. Those that did were classified in the category of experienced
firms. Twenty-five additional firms on Smith’s list were identified from the Standard
Catalog as entering from another business, most often from carriages/wagons. These
firms were also classified as experienced firms,11 yielding a total of 120 experienced
firms. Firms were classified into the category of experienced entrepreneurs if in the
Standard Catalog at least one of their founders was identified as the head of a named
firm that was active or had recently been sold.12 This yielded a total of 108 experienced
entrepreneurs. The Standard Catalog was used to identify the main prior product
produced by each experienced firm and experienced enterpreneur. Firms were classified
as spinoffs if at least one of their founders had worked for and/or founded an automobile
firm in Smith’s list, yielding a total of 145 spinoffs.13 The latest firm worked for by the
founder was designated as the parent of the spinoff and prior firms worked by the founder
were designated as secondary parents.14 In about 30% of the spinoffs, the motivation for
10 Also consulted were the compilations of Detroit firms in Szudarek [1996] and world-wide producers in Baldwin et al. [1987] and the histories of Ransom Olds’ automobile ventures (May [1977]) and the Franklin Automobile Company (Powell [1999]). 11 Only firms that produced automobiles and earlier products under (exactly) the same name were included in this category. 12 It was sometimes difficult to distinguish firms in this category from experienced firms because some firms entered with names very similar to, but not exactly the same, as preexisting firms in related industries. Some of these cases represent instances when the head/leading stockholder of a preexisting firm could not convince the other stockholders to enter autos, in which case a new firm with the same head and similar stockholders was formed to enter autos. Whenever there was any uncertainty about such cases, they were classified as experienced entrepreneurs rather than experienced firms, no doubt blurring the distinction between these two categories. Furthermore, some of the firms Smith classified as preexisting producers were suspicious based on their descriptions in the Standard Catalog, which may have further blurred the distinction between these two firm categories. 13 In the case of some spinoffs it was difficult to tell from the brief history in the Standard Catalog whether a person who was mentioned as having worked for another automobile firm was a founder of the spinoff. These firms generally did not survive very long. To be conservative, they were included as spinoffs. One firm, Dodge Brothers, was a major supplier to Ford Motor Company from its inception and the Dodge brothers themselves were major stockholders of Ford. Based on their experience with Ford, they were classified as a spinoff rather than an experienced firm. In a few instances it appeared that an incumbent firm sponsored a separate entrant. These firms, which tended to be short-lived, were also classified as spinoffs. 14 In most cases, only one firm was mentioned for spinoff founders. In some spinoffs there were multiple founders that had worked for different automobile firms. In these cases, the parent of the spinoff was determined based on the founder(s) that were described as the most instrumental in the spinoff, with the prior employers of the other founders classified as secondary parents.

17
the spinoff could be discerned from the firm’s description in the Standard Catalog and
the circumstances of the firm’s founding, and this was recorded. The 352 firms that were
not classified as experienced firms, experienced entrepreneurs, or spinoffs were included
in the residual category of inexperienced firms.15
The first hypothesis in Table 1 deals with how time of entry affects firm survival.
It is tested using the survival graphs in Figure 4. Cohort 1 refers to the 1895-1904
entrants, cohort 2 to the 1905-1909 entrants, and cohort 3 to the 1910-1966 entrants. The
top graph includes all the firms and the other four graphs look separately at the four
categories of entrants. The graphs are analogous to Figure 3, indicating the percentage of
firms in a cohort surviving to each age, plotted on a logarithmic scale so that minus the
slope of the curve at any age is the hazard rate for the cohort.16 A curve drops to the
horizontal axis at a particular age when the survival rate of the cohort at that age is less
than or equal to 1%.17 The three survival curves for all the firms in the top panel initially
overlap until approximately age seven, when they diverge, with cohort 1 having the
highest survival rate at older ages, followed by cohort 2 and then cohort 3.
Correspondingly, the survival curve of the third cohort drops to the horizontal axis at the
earliest age, followed by the second cohort, with the first cohort having well over a 1%
survival rate through 1966. This conforms to the predicted pattern, as reflected in the top
panel of Figure 3. With the exception of the intertwining of the survival curves of the last
two cohorts of experienced firm entrants, the graphs for each type of entrant are similar.
15 Some of the candidates for this category were also difficult to classify. Some firms produced engines or trucks for a few years or less before autos, and it was difficult to tell if these firms were started with the purpose of producing autos or whether they should be classified as experienced firms. Apart from the few instances where the Standard Catalog indicated the firm was started to produce engines or trucks and not autos, these firms were classified as inexperienced entrants. It was also difficult to classify firms that had financiers with lengthy business histories. Unless the financiers appeared to have been instrumental in the formation of the firm, they were not considered to have been founders and their firms were classified as inexperienced firms. Some firms had founders that were noted as owning an unnamed machine shop, repair shop, or similar kind of business. Apart from a few instances in which it was clear the prior business was substantial, these firms were classified as inexperienced entrants because their generic businesses were not considered sufficiently significant to warrant their classification as experienced entrepreneurs. Last, for some firms no information was provided about their founders or only their initial officers were listed with little information provided about their backgrounds. These firms were all classified as inexperienced firms, but no doubt some of them deserved to be in one of the other categories. 16 The percentage of firms surviving to age x was estimated as the product of the percentage of nonacquired firms surviving through each one-year age interval through age x.
18
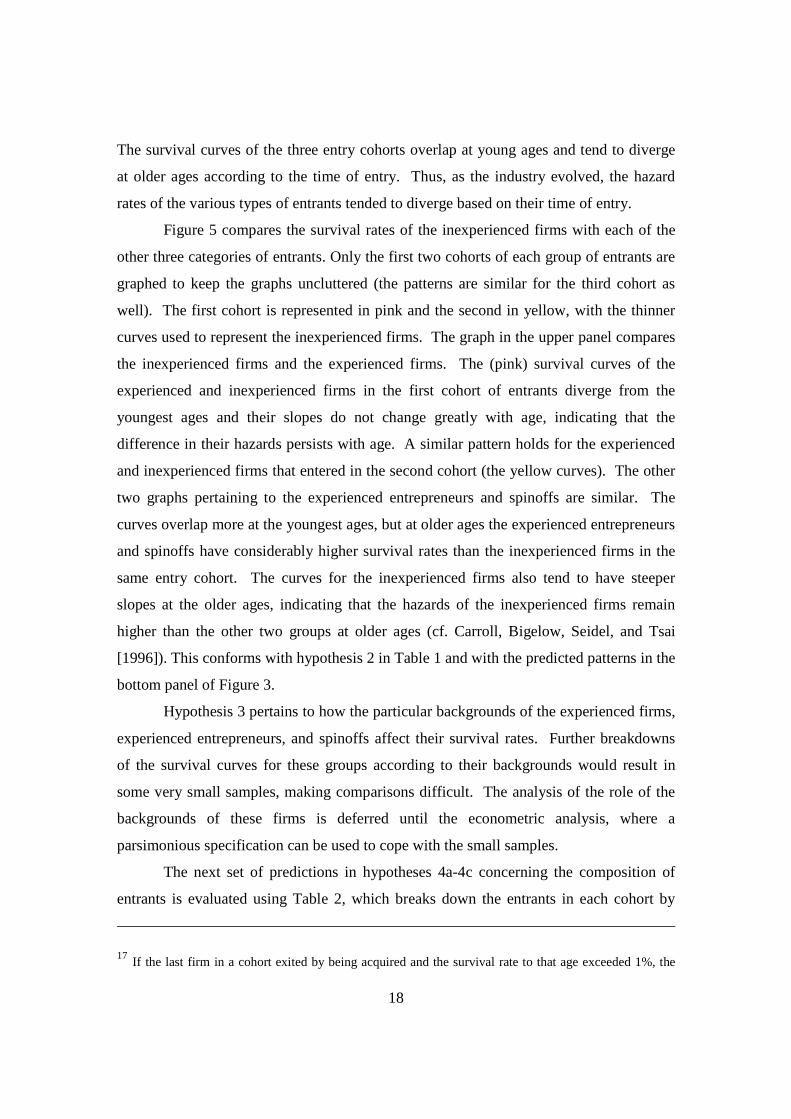
The survival curves of the three entry cohorts overlap at young ages and tend to diverge
at older ages according to the time of entry. Thus, as the industry evolved, the hazard
rates of the various types of entrants tended to diverge based on their time of entry.
Figure 5 compares the survival rates of the inexperienced firms with each of the
other three categories of entrants. Only the first two cohorts of each group of entrants are
graphed to keep the graphs uncluttered (the patterns are similar for the third cohort as
well). The first cohort is represented in pink and the second in yellow, with the thinner
curves used to represent the inexperienced firms. The graph in the upper panel compares
the inexperienced firms and the experienced firms. The (pink) survival curves of the
experienced and inexperienced firms in the first cohort of entrants diverge from the
youngest ages and their slopes do not change greatly with age, indicating that the
difference in their hazards persists with age. A similar pattern holds for the experienced
and inexperienced firms that entered in the second cohort (the yellow curves). The other
two graphs pertaining to the experienced entrepreneurs and spinoffs are similar. The
curves overlap more at the youngest ages, but at older ages the experienced entrepreneurs
and spinoffs have considerably higher survival rates than the inexperienced firms in the
same entry cohort. The curves for the inexperienced firms also tend to have steeper
slopes at the older ages, indicating that the hazards of the inexperienced firms remain
higher than the other two groups at older ages (cf. Carroll, Bigelow, Seidel, and Tsai
[1996]). This conforms with hypothesis 2 in Table 1 and with the predicted patterns in the
bottom panel of Figure 3.
Hypothesis 3 pertains to how the particular backgrounds of the experienced firms,
experienced entrepreneurs, and spinoffs affect their survival rates. Further breakdowns
of the survival curves for these groups according to their backgrounds would result in
some very small samples, making comparisons difficult. The analysis of the role of the
backgrounds of these firms is deferred until the econometric analysis, where a
parsimonious specification can be used to cope with the small samples.
The next set of predictions in hypotheses 4a-4c concerning the composition of
entrants is evaluated using Table 2, which breaks down the entrants in each cohort by
17 If the last firm in a cohort exited by being acquired and the survival rate to that age exceeded 1%, the
19
background. Table 2 also reports various ratios regarding the number of entrants of each
type, with experienced firms and experienced entrepreneurs combined into one category
due to their similar entry patterns over time. Regarding hypothesis 4a, the ratio of
spinoffs to the sum of experienced firms and experienced entrepreneurs rises over the
three entry cohorts, as predicted. Regarding hypothesis 4b, the ratio of spinoffs to
inexperienced firms rises over the three entry cohorts while the ratio of the sum of
experienced firms and experienced entrepreneurs to inexperienced firms falls from cohort
1 to cohort 2 and then rises to cohort 3. Thus, consistent with hypothesis 4b, eventually
both ratios rise. To test hypothesis 4c regarding the performance of the parents of spinoff
entrants, the total years of production of parents was used as a measure of their
performance. Parents were crudely divided according to whether they produced for ten
years or more, with parents that were acquired within ten years of entry excluded from
the comparison. The percentage of parents that produced ten or more years was 50% (5
of 10) for the parents of spinoffs in cohort 1, 37% (13 of 35) for the parents of spinoffs in
cohort 2, and 62% (46 of 75) for the parents of spinoffs in cohort 3. Although the
percentage of parents that produced for ten or more years initially dropped from cohort 1
to cohort 2, once entry became more difficult after 1909 the percentage of parents that
produced for ten or more years increased markedly and was higher in cohort 3 than in
either of the two earlier entry cohorts, consistent with hypothesis 4c. Hypothesis 4d
concerning the incidence of spinoffs across firms is tested econometrically in the next
section.
The last set of predictions in hypothesis 5 pertain to the concentration of the
industry around Detroit. Hypothesis 5a concerns whether the spinoffs that located in the
Detroit area had parents in the Detroit area and whether the parents in the Detroit area
had spinoffs that located in the Detroit area. Fifty-four spinoffs located initially in the
Detroit area, and 50 of them had parents located in the Detroit area. Eleven spinoffs
with parents in the Detroit area located elsewhere, so 50 of the 61 spinoffs with parents in
the Detroit area located there.18 Thus, spinoffs with parents in the Detroit did not locate
cohort survival graph ends at the age of the acquired firm but does not drop to the horizontal axis. 18 One of the 11 spinoffs that did not initially locate in the Detroit area moved there soon after its founding, and two of the others were founded in their home cities by sales agents based outside of the Detroit area.
20
far from their parents, and few spinoffs without parents in the Detroit area located there,
as conjectured.19
Hypothesis 5b predicts there would be a disproportionate number of spinoffs in
the Detroit area. In total, 15% of the entrants located in the Detroit area. The Detroit
area was actually underrepresented in terms of experienced firms, experienced
entrepreneurs, and inexperienced firms. Only 9% of the experienced firms and
experienced entrepreneurs and 11% of the inexperienced firms located in the Detroit area.
What distinguished the Detroit area was spinoffs, with 37% of all spinoffs entering in the
Detroit area. More spinoffs entered in the Detroit area than any other type of entrant,
accounting for 48% of the firms located in the Detroit area versus only 15% of the firms
located elsewhere. Thus, apart from the spinoffs, the Detroit area did not attract a large
number of entrants into the industry.
Hypothesis 5c predicts that spinoffs in the Detroit area would have better-
performing parents than spinoffs elsewhere. Parents were again compared according to
whether they produced for ten or more years. Among parents that were not acquired
within ten years of entry, the percentage of parents that produced ten or more years was
66% (25 of 38) for the parents of the Detroit-area spinoffs and 48% (39 of 82) for the
parents of the spinoffs elsewhere. Thus, consistent with hypothesis 5c, the spinoffs in the
Detroit area came from longer-lived parents.
Hypothesis 5d predicts that it should be possible to trace a large number of
spinoffs in the Detroit area to a few very successful early entrants in the Detroit area.
This is evaluated using Table 3, which identifies the five firms with the most spinoffs and
reports information about the firms and their spinoffs. The first four firms, Olds,
Buick/General Motors, Cadillac, and Ford, were all early entrants that located in the
Detroit area. The fifth firm, Maxwell-Briscoe, which was a spinoff descended from Olds,
did not initially enter in the Detroit area but moved there later, where it spawned all but
19 The other 80 spinoffs (which did not have parents in the Detroit area and located outside of the Detroit area) also tended to locate close to their parents. Sixty of them, or 75%, located within a 100 miles of where they were working. Some of the other 20 involved founders who had already left their employers before starting their own firms and seemingly had moved on to other locations. This may have been more prevalent among the spinoffs not connected to the Detroit area, perhaps reflecting the lesser success of their parents relative to those of spinoffs connected to the Detroit area, as discussed below.
21
one of its spinoffs. Olds, Buick, Cadillac, and Ford quickly reached the ranks of the
production leaders of the industry, attaining the number one or two rank within five years
of entry. Given the paucity of experienced firms and experienced entrepreneurs, the
Detroit area was an extremely unlikely place for the entry of four such successful firms.
But they were led by extremely able men, three of whom had headed engine and carriage
firms in the Detroit area before the industry began in 1895. The four firms collectively
spawned 22 spinoffs, and 19 additional firms descended from these 22 spinoffs, for a
total of 41 descendants. Their descendants were extremely successful, accounting for all
but two of the subsequent twelve entrants in the Detroit area that made it into the ranks of
the production leaders. Their descendants also played an important role, as acquisitions,
in the success of General Motors, Ford, and Chrysler.20 Even the three principal industry
leaders outside the Detroit area were influenced by employees of the four firms.21 Thus,
not only were most of the leading firms in the Detroit area descended from Olds,
Buick/General Motors, Cadillac, and Ford, but in one way or another employees of the
four firms influenced nearly all the leading firms in the industry.
The remaining two parts of hypothesis 5, parts e and f, pertain to the survival
experiences of spinoffs and inexperienced firms in the Detroit area versus elsewhere.
These hypotheses are evaluated using the survival graphs in Figure 6. The top two
graphs present the survival curves for the three cohorts of spinoff entrants in the Detroit
area and elsewhere. They further establish the extraordinary performance of the Detroit
spinoffs, particularly the first two cohorts of spinoff entrants in the Detroit area. These
firms had much higher survival rates to older ages than spinoffs outside the Detroit area.
The other two survival graphs in Figure 6 pertain to the inexperienced entrants in the
Detroit area and elsewhere. These patterns are quite different. The cohort survival
20 General Motors acquired Chevrolet, itself a spinoff from General Motors, which it used to displace Ford as the industry leader. Ford acquired Lincoln, another General Motors spinoff, which provided it with a high quality line. Three of the descendants, Maxwell-Briscoe (in the form of its successor, Maxwell Motors), Chalmers, and Dodge, formed the core of Chrysler. 21 The three main industry leaders outside the Detroit area were Studebaker, Nash Motors Co., and Willys-Overland Co. Studebaker was a leading carriage producer. It rose to prominence in the automobile industry by acquiring E-M-F, a Detroit firm that which was descended from an Olds spinoff and was cofounded by two prior employees of Ford and Cadillac. Charles Nash, the head of Nash Motors, was the president of General Motors before acquiring Thomas B. Jeffrey & Co., the producer of the Rambler, and
22
curves for the Detroit-area inexperienced firms resemble those of the inexperienced firms
outside the Detroit area at young ages, but they all end by 10 years of age, reflecting that
no Detroit-area inexperienced firm survived over 10 years (one was acquired at age 10).
In contrast, a nonnegligible percentage of inexperienced firms that located outside of the
Detroit area survived over 10 years.
The failure of the Detroit-area inexperienced firms to survive to older ages
suggests that at some point the Detroit area may have become a difficult place for the
inexperienced firms, and possibly all firms, to compete. Indeed, after 1916 entry rates in
the Detroit area fell off sharply. Prior to 1916 the percentage of entrants that located in
the Detroit area had been steadily rising, increasing from 10% in 1895-1904 to 14% in
1905-1909 and 29% in 1910-1916, but after 1916 it was only 12%. While the entry of all
four types of firms declined, the decline was particularly severe for the inexperienced
firms. In 1910 to 1916, the Detroit area attracted 19% of the inexperienced entrants, but
after 1916 it attracted only 1 of 28, or 4%, of the inexperienced entrants. All this
suggests that the success of the Detroit-area firms was mainly attributable to their
pedigree and not their location, which may actually have been disadvantageous as
competition in the industry intensified.
VI. Econometric Analysis
The various hypotheses can be tested using econometric methods, which
facilitates a more detailed investigation and allows for the relevant factors to be analyzed
together. The hypotheses concerning firm hazards are tested first, followed by tests of the
hypotheses concerning firm spinoff rates.
A. Firm Hazards
The hypotheses about firm hazard rates are tested using the following
specification. The hazard of firm exit at age t, h(t), is modeled according to the
Gompertz specification:
h(t) = exp{(α0+α’x)t}exp{β0 + β’z},
where x and z are vectors of covariates and the other terms are coefficients. The first
exponential term allows the age of firms to affect (monotonically) their hazard rates. It
changing its name to Nash Motors. Willys-Overland was reorganized by Walter Chrysler, who had headed
23
also allows for the variables in x to condition how age affects the hazard. In particular,
the theory predicts that firm hazard rates may not be ordered by time of entry at young
ages but will be ordered by time of entry at older ages, which implies that time of entry
should condition the effect of age on the hazard. The second exponential term allows the
variables in z to affect the hazard proportionally at all ages. Included in z are the firm
background variables that distinguish the experienced firms, experienced entrepreneurs,
and spinoffs from the inexperienced firms. Also included in z are variables pertaining to
whether firms were located in the Detroit area.
A series of models that control for successively more factors are estimated.
Model 1 tests whether firms located in the Detroit area survived longer. It includes age, t,
as the only variable in the first exponential term and one covariate in the vector z in the
second exponential term, a 1-0 dummy variable equal to 1 for firms located in the Detroit
area. The estimates of this model are presented in the first column of Table 4, with
standard errors in parentheses and significance levels based on one-tailed tests. As
expected, the coefficient estimate of the Detroit variable is negative and significant,
implying a 31% lower annual hazard for firms in the Detroit area than elsewhere.22 The
estimate of the constant term α0, which is the coefficient estimate of t, is negative and
significant, implying that firm hazards decreased with age. The negative age dependence
of the hazard could be due to unobserved heterogeneity in firm capabilities; if more
capable firms have lower hazards, then the average capabilities of survivors will increase
with age, causing their hazard to decline. This will be tested by adding controls for firm
backgrounds and time of entry, which should diminish the negative age dependence of
the hazard if it is due to unobserved heterogeneity in firm capabilities.
Model 2 adds controls for the backgrounds of entrants. Three 1-0 dummies equal
to 1 for experienced firms, experienced entrepreneurs, and spinoffs are added to the
vector z, with inexperienced firms the omitted reference group. The coefficient estimates
of the three variables in Table 4 are all negative and significant, consistent with figure 5.
The experienced firms and experienced entrepreneurs have almost identical coefficient
Buick and later organized the Chrysler Corporation. 22 The percentage reduction in the hazard from being located in the Detroit area is computed as 100*( 1-exp{-.36740}) = 31%.
24
estimates, implying a 46% lower annual hazard for both groups than inexperienced firms.
The coefficient estimate for the spinoffs implies a 29% lower annual hazard than
inexperienced firms. The coefficient estimate for the Detroit variable is similar to Model
1 while the estimate of α0, the coefficient of t, is about a third less negative than in model
1, consistent with the negative age dependence of the hazard being attributable to
unobserved heterogeneity in firm capabilities.
Model 3 adds controls for time of entry in z, allowing time of entry to affect the
hazard proportionally at all ages. Two 1-0 dummy variables, denoted C1 and C2, are
added for firms that entered in cohort 1 and cohort 2 respectively, with cohort 3 the
omitted reference group. The coefficient estimates of both variables are negative and
significant, consistent with figure 4, implying respectively a 44% and 14% lower hazard
for entrants in cohorts 1 and 2 than cohort 3. The addition of C1 and C2 makes the
spinoff coefficient estimate about 50% more negative, bringing the implied annual hazard
of spinoffs down closer to the hazards of the experienced firms and experienced
entrepreneurs. Spinoffs enter after their parents and thus tend to enter later. Since later
entry raises the hazard, controlling for the time of entry increases the negative effect of a
spinoff background on the hazard. The coefficient estimate of t is about half of its value
for Model 3, further suggesting that the negative age dependence of the hazard is due to
unobserved heterogeneity in firm capabilities
In Model 4 C1 and C2 are also added to the vector x, which effectively adds the
variables C1*t and C2*t to the first exponential term. This allows the effect of time of
entry on the hazard to depend on firm age. The coefficient estimates of C1*t and C2*t
are negative and significant while the coefficient estimates of C1 and C2 in z both
become small and insignificant. This implies that at young ages different entry cohorts
have similar hazards, but the hazards of the cohorts diverge with age according to the
time of entry, as predicted by the theoretical model. For example, the estimates imply
that cohorts 1 and 2 have 76% and 48% lower hazards at age 15 and 90% and 67% lower
hazards at age 25 than entrants in cohort 3. The estimates also imply that the hazard
declines with age only for cohort 1 (the effect of age for cohort 1 equals the sum of the
coefficients of t and C1*t), and significantly, whereas it increases with age for cohorts 2
and 3, with the latter effect significant. If the negative age dependence of the hazard
25
reflects unobserved heterogeneity in firm capabilities, then these results are consistent
with the theory, which predicted that earlier entry cohorts are more heterogeneous in
terms of firm capabilities because the firms entered when conditions were less
demanding. The other estimates of Model 4 are similar to Model 3.
The theoretical model assumed that location in Detroit does not provide any
competitive advantages and that the superior performance of Detroit-area firms should be
confined to spinoffs in the Detroit area. To test this, a 1-0 dummy for spinoffs located in
the Detroit area was added to Model 4. The coefficient estimate of this variable in Model
5 is negative and significant, as predicted. More important, the coefficient estimate of the
Detroit-area dummy is trivial and insignificant, suggesting that the lower hazard of
Detroit-area firms was in fact confined to the spinoffs in the Detroit area. In terms of the
ranking of firms regarding their hazards, the estimates imply that the Detroit-area
spinoffs had the lowest hazards, followed by the experienced firms and experienced
entrepreneurs, the non-Detroit-area spinoffs, and the inexperienced firms.
In Model 6 the Detroit-area dummy is dropped and the experienced firms and
experienced entrepreneurs are distinguished according to whether their pre-entry
experience was in the carriage and wagon, engine, or bicycle industries, with 1-0
dummies added for each group of firms with such a background. These are the three
backgrounds most closely related to autos technically and in terms of marketing, and
firms with such backgrounds were expected to have superior capabilities. The coefficient
estimates of both of the added dummies are negative, with the one for the experienced
firms significant, suggesting that firms with backgrounds in the three industries did in
fact have lower hazards. The main experienced firm and experienced entrepreneur
variables continue to have significant coefficient estimates, suggesting that any kind of
pre-entry industry experience was valuable. In terms of the ranking of firms according to
their hazards, the Detroit-area spinoffs still have lower implied hazards than any other
group of entrants, including the experienced firms and experienced entrepreneurs from
the carriage and wagon, engine, and bicycle industries, which have comparable hazards.
The other coefficient estimates are similar to Model 5.
The advantage of the Detroit-area spinoffs is probed further in Models 7 and 8. If
the lower hazard of the Detroit-area spinoffs is attributable to their superior heritage, then
26
the hazards of the spinoffs should vary according to their heritage and controlling for
their heritage should reduce the coefficient estimates of the spinoff and Detroit-area
spinoff dummies. Spinoffs were assumed to be influenced by their parents, with better-
performing parents spawning better-performing spinoffs. The only variable that could
be constructed for the performance of all the parents is the total number of years they
produced autos. This measure does not distinguish the performance of the parents
before the entry of their spinoffs when the founders of the spinoffs worked for their
parents, but it would be expected to be correlated with the parents’ performance during
this period. It is added to the vector of covariates z in Model 7. Parents that were
acquired and played an important role in their acquirer were assigned the same total years
of production as their parents.23 The coefficient estimate of the parent’s years of
production is negative and significant, consistent with the theoretical model. It implies a
1.34% lower spinoff hazard for each additional year of production of the parent.
Furthermore, the coefficient estimates of both the spinoff and Detroit-area spinoff
dummies are less negative than in Model 6. The former coefficient estimate is small and
insignificant while the latter remains significant but is about 30% less negative than in
model 6.
Model 8 adds some measures of the performance of the parents prior to the entry
of their spinoffs and a variable for the impetus of the spinoffs. It was expected that
parents that were among the production leaders of the industry in the five years preceding
and including the year of entry of their spinoff would have better-performing spinoffs.24
To test this, three 1-0 dummy variables were created. The first equals 1 for spinoffs
whose parent was ranked among the production leaders in the year of the spinoff or the
preceding five years. The second equals 1 for spinoffs whose parent was the number one
producer in the industry in the year of the spinoff or the preceding five years. The third
equals 1 for spinoffs whose secondary parent (i.e., the firm the spinoff’s founder worked
23 This includes Olds Motor Works, Cadillac, and Chevrolet, all of which were acquired by General Motors, Overman Auto, which was acquired by Locomobile, and Rauch & Lang, which was acquired by Baker. 24 The dates when the founders of spinoffs worked at their parents were not generally known, but judging from the dates of entry of the parents and other information, most of the founders worked for their parents within five years of the formation of their spinoffs.
27
for immediately before the parent of the spinoff if the founder had worked for at least two
auto firms) was the number one producer in the industry in the year of the spinoff or the
preceding five years. The first dummy added little explanatory power to Model 7 due to
its high correlation with the years of production of the parent, but the other two dummies
had greater explanatory power and were included as covariates in z.25
The other covariate added to z in Model 8 was a 1-0 dummy pertaining to the
impetus for the founding of the spinoffs. It equals 1 for spinoffs that arose due to a
disagreement in the parent firm about strategy or innovation, the failure or imminent
failure of the parent firm (or its automobile business), or the desire of the parent firm to
market a new car through a separate organization in order to preserve its image. The
distinctive quality of these spinoffs is that they generally built directly on the expertise of
their parents while at the same time differentiated themselves from their parents.
Descriptions of the origins of the other spinoffs suggest they were not so closely linked to
their parents, although no doubt the brevity of the historical record for some obscured
their connection to their parents. It was expected that the spinoffs that built in discernible
ways on the expertise of their parent would have lower hazards, ceteris paribus.26
The coefficient estimates of all three of the added variables are negative, as
predicted, with only the dummy for the spinoff’s secondary parent not significant.
Furthermore, the coefficient estimate of the Detroit spinoff dummy is approximately 55%
less negative than in model 7 and is insignificant, making both it and the coefficient
estimate of the spinoff dummy insignificant. Thus, crude controls for the heritage of the
spinoffs largely explain the superior performance of the Detroit-area firms, suggesting
further that there were no particular advantages to locating in Detroit. The controls also
25 When the two included dummies were broadened to encompass parents who were the number two producer, their explanatory power declined considerably. The production leaders of the industry, in particular Olds and Ford, were the first to mass produce automobiles and apparently provided novel challenges to their employees. Indeed, Ransom Olds, the founder of Olds Motor Works, was known as the “Schoolmaster of Motordom” (Doolittle, [1916, p. 44]). 26 Note that many of these spinoffs, especially the ones whose parents’ failure was imminent, did not produce very long. Not surprisingly, their parents did not generally produce long either. All that is predicted is that after controlling for the years of production of their parent and the other variables in the model, these firms survived longer, ceteris paribus. Efforts to break down the 1-0 dummy according to the particular motivation of the spinoffs were not productive.
28
suggest that the superior performance of spinoffs generally was restricted to those with
distinctive heritages.
The absence of a Detroit-area effect is probed further by estimating Model 9,
which drops the the spinoff and Detroit-area spinoff dummies and adds two covariates to
z that interact the 1-0 dummy for location in the Detroit area with the years of production
of the spinoff’s parent and the 1-0 dummy for the spinoff having a discernible reason for
its formation.27 This makes it possible to test if the spinoff background variables had
similar effects for Detroit-area and non-Detroit-area spinoffs. The estimates of the
interacted variables are negative but insignificant, while the coefficient estimates of the
main variables continue to be negative and significant. This implies that background
similarly affected the hazard of spinoffs everywhere. To gauge the effects of all the
background variables, one last model, Model 10, was estimated without the two
interactive variables added to Model 9. The coefficient estimates of all four variables for
the backgrounds of the spinoffs are negative and significant, along with nearly all the
other background variables, confirming further the importance of the pre-entry
experience of firms on their performance.
B. Firm Fertility
The other key prediction of the theoretical model, which lies at the heart of its
explanation for the concentration of the industry around Detroit, is that better-performing
firms spawn more spinoffs (hypothesis 4d in Table 1). It was shown earlier that Olds,
Buick/General Motors, Cadillac, and Ford, which were all located in the Detroit area, had
the most spinoffs among all firms and that the Detroit area was characterized by a
disproportionate number of spinoff entrants. A host of factors other than better
performance, such as the Detroit-area firms producing longer, could account for their
greater number of spinoffs. To test this, an ordered logit model was estimated of the
annual rate of spinoffs of each firm in the industry. Nearly all the spinoffs entered
between 1899 and 1924, and so the analysis is restricted to this period. Each firm’s
27 The two dummies for the spinoff’s parent and secondary parent being the number one producer were not interacted with the Detroit-area dummy because all the spinoffs with primary or secondary parents that
29
history is broken into annual intervals from the year before its date of entry28 (or 1899 if
it entered earlier) through 1924. The observations of all firms are pooled and an ordered
logit is estimated of the factors influencing the annual probability of a firm having one,
two, or three spinoffs.29
To control for all possible determinants of the spinoff rate, a specification similar
to the one used by Klepper and Sleeper [2000] to analyze spinoffs in the laser industry is
employed. The explanatory variables for each firm-year t include: a 1-0 dummy equal to
1 for firms that produced in year t; a 1-0 dummy equal to 1 for firms that did not produce
in year t but had ceased producing less than five years earlier; the number of years of
production through year t and the number of years of production squared for firms that
produced in year t; the total number of years the firm produced autos;30 a 1-0 dummy
equal to 1 if the firm had been among the production leaders of the industry in year t or
the preceding five years and a 1-0 dummy equal to 1 if the firm had been the number one
or two producer in year t or the preceding five years;31 a 1-0 dummy equal to 1 for firms
that were acquired by another auto firm between year t-1 and t+2 and a comparable 1-0
dummy equal to 1 for firms acquired by nonauto firms between year t-1 and t+2, both of
which were based on listings of ownership changes in Smith [1968]; a variable equal to
the number of nonspinoff entrants divided by the number of firms averaged over years t-
2, t-1, and t; and two 1-0 dummies for firms located in the Detroit area, with the first
dummy equal to 1 for firms located in the Detroit area in year t and the second equal to 1
for firms located in the Detroit area in year t for years greater than 1916.
were the number one producer either entered in the Detroit area or, in the case of one spinoff, moved there after it entered. 28 The firm’s entry date is its initial year of commercial production in Smith [1968]. Some firms were organized before this date, and in two instances spinoffs entered in the year prior to the first year of commercial production of the parent firm. To accommodate this, the analysis was started in the year prior to each firm’s initial year of commercial production. 29 While 130 of the spinoffs occurred in years in which firms had only one spinoff, an ordered logit was used because there were six years in which firms had two spinoffs and one year in which one firm had three spinoffs. 30 As in the hazard analysis, acquired firms that played an important role in their acquirer were assigned the same number of years of production as their acquirer. In addition to Olds, Cadillac, Chevrolet, Overman, and Rauch & Lang, the firms affected included Oakland, Edwards, Lincoln, Dodge, and Motorcar. 31 In contrast to the hazard analysis, including the number two producer increased the explanatory power of this variable. This largely reflects the comparable spinoff rates of Cadillac and Buick/General Motors to Olds and Ford.
30
The firm spinoff rate is allowed to vary according to the firm’s history of
production under the expectation that firms no longer producing, especially ones that had
not produced for over five years, would have lower spinoff rates.32 The number of years
of production through year t (for producers in year t) was included to allow more
experienced firms to have more knowledge for employees to draw upon, increasing the
spinoff rate. It was entered quadratically to allow for the possibility of a firm’s
knowledge becoming more embodied in the production process as it aged and grew, with
such knowledge possibly more difficult for employees to access, thus lowering the
spinoff rate. The years of production and production leadership variables were included
to test whether a firm’s performance affected its spinoff rate, as the theoretical model
presumes. The acquisition variables were included to allow for the possibility of
acquisitions causing changes in firm strategies, which could provide greater opportunities
for spinoffs to exploit expertise gleaned from their parent. The nonspinoff entry variable
was included to allow the spinoff rate to vary according to the attractiveness of entry
generally.33 Last, the Detroit-area dummies were included to test whether the Detroit-
area firms had higher spinoff rates even after controlling for their greater success. A
separate dummy for years after 1916 was included to test whether the spinoff rate of
Detroit-area firms was lower in later years, with 1916 chosen as the cutoff based on the
fall in the entry of all firms in the Detroit area after 1916.
The estimates of the coefficients of the variables and three constant terms
quantifying the thresholds for one, two, and three spinoffs are reported in Table 5. The
estimates largely conform with expectations. The probability of a spinoff is significantly
greater in years firms were producing. It is also significantly greater for firms that had
ceased producing within the last five years (relative to firms that had ceased producing
over five years ago, the omitted reference category). For producers, the probability of a
spinoff increases significantly through approximately age 14, after which it declines
significantly. Klepper and Sleeper [2000] found a similar relationship for laser spinoffs.
The probability of a spinoff is significantly greater around times that firms were acquired
32 If employees started firms after the exit of their parents, which occurred in some cases, then firms would have spinoffs after they ceased producing, but this was not expected to be the norm. 33 This was alternatively controlled using year dummies, which had little effect on the estimates
31
by either auto or nonauto firms. It is also significantly greater in years with a higher
nonspinoff entry rate. In terms of the critical variables for the theory, the probability of a
spinoff each year is significantly greater for firms that produced longer. It is also
significantly greater for firms that were among the production leaders in the
contemporaneous or prior five years, and significantly greater still for firms that were the
number one or two producer in this same time period. Thus, consistent with hypothesis 3,
firms that performed better had higher annual spinoff rates.
The coefficient estimate for the Detroit dummy is positive and significant. It is
almost completely offset by the negative coefficient estimate for the Detroit dummy after
1916, which is also significant. Thus, after 1916 the Detroit-area firms were not
especially fertile, but before that Detroit-area firms spawned more spinoffs than expected
based on their performance. The effect is quite large—the coefficient estimate of the
Detroit-area dummy implies that through 1916 Detroit-area firms were about three times
as likely to spawn one or more spinoffs than firms of comparable performance located
elsewhere.34 Thus, a substantial part of the greater fertility of the Detroit-area firms
appears to have been attributable to circumstances peculiar to the Detroit area. In
contrast, the hazard analysis suggested that the greater longevity of the Detroit-area firms,
and in particular the Detroit-area spinoffs, was not primarily due to circumstances
peculiar to the Detroit area but could largely be traced back to four very successful early
entrants.
VII. Discussion
The findings are first summarized, and then the implications of the findings are
discussed.
Initially a large number of firms entered the automobile industry and the number
of producers peaked at 272 in 1909. Subsequently entry fell sharply and became
negligible by the 1920s and the industry experienced a sharp and prolonged shakeout.
34 The coefficient estimates can be interpreted in the conventional way as the derivative of the log odds ratio with respect to the explanatory variables, where the log odds ratio is the log of the probability of one or more spinoffs divided by one minus this probability (cf. Cox and Snell [1989, p. 159]). Thus, exp(1.2079) = 3.346 quantifies how much greater the odds ratio is for Detroit-area firms than firms located elsewhere. Since the annual probability of firms spawning one or more spinoffs is quite low, the denominator in the odds ratio is close to one, implying that the annual probability of a spinoff through 1916 was around three times greater for Detroit-area firms than firms located elsewhere.
32
Diversifying firms in related industries and firms founded by the heads of such firms
tended to enter early, but few entered in the Detroit area. Consequently, there was little
initial entry in the Detroit area, and in total the Detroit area only attracted 15% of all the
entrants to the industry. But fueled by spinoffs, which accounted for a disproportionate
share of entrants in the Detroit area, the percentage of producers in the Detroit area rose
over time. By the late 1910s most of the leading makes of automobiles were produced by
Detroit-area firms, and Detroit was home to the three firms that by the 1930s produced
over 80% of the industry’s output.
The performance of firms in terms of the hazard of exit was strongly related to
their time of entry and the firms’ pre-entry backgrounds. Entry cohorts had similar
hazards at young ages but at older ages their hazards diverged sharply according to their
time of entry. Firms with experience in related industries and firms founded by heads of
firms in these industries had lower hazards at every age, particularly if the industries in
which they participated were more closely related to automobiles. Better-performing
firms and firms located in the Detroit area had higher spinoff rates, and better-performing
firms had spinoffs with lower hazards at every age. Spinoffs did not venture far from
their parents, and many of the Detroit-area spinoffs, especially the most successful ones,
could be traced back to Olds, Buick/General Motors, Cadillac, and Ford, four of the most
successful early entrants into the industry that all happened to locate in the Detroit area.
These patterns are revealing about the forces that shaped the evolution of the
industry. Consider first the findings about how firm hazards were related to the time of
entry. It appears that early entrants had substantial competitive advantages that surfaced
as the industry evolved. A few later firms, such as Chrysler, that built on the efforts of
earlier entrants were successful, but later entrants that started from scratch were rarely
able to compete very long in the industry.35 Strong advantages to early entry would help
explain the eventual falloff in the rate of entry that occurred in the industry. With entry
eventually becoming negligible, a shakeout in the number of producers was inevitable,
with earlier entrants taking over an increasing share of the industry’s output. Once the
35 In the analysis, firms like Chrysler are not counted as entrants but as continuations of other firms and thus do not influence the hazard rates of the later entry cohorts.
33
window of opportunity for entry closed, there was also little chance of entry overturning
the established geographic distribution of activity around Detroit that had already arisen.
The fact that entry cohort hazard rates diverged with age suggests that earlier
entrants possessed a competitive advantage that did not dissipate as they and the other
firms in the industry grew over time. Such a pattern suggests that shakeouts were not
triggered by particular technological developments, whose effects would be expected to
dissipate over time, but were part of a broader process of industry evolution (cf. Klepper
and Simons [2001]). Not many factors could account for the persistently lower hazards of
earlier entrants. Production scale economies eventually were prominent in the industry,
but competitive advantages associated with production scale economies might be
expected to diminish in importance as firms grew. Similar reasoning applies to learning
by doing. The most obvious candidate driving the persistent advantage of the earlier
entrants were the dramatic technological advances achieved in the industry, especially in
the production process. Such advances required costly efforts, and the larger the firm
then the greater the output over which it could amortize these efforts. Consistent with the
model, Klepper and Simons [1997, 2001] found that early automobile entrants were in
the vanguard of innovation, particularly process innovation, and innovators had markedly
lower hazards.36
The importance of technological change provides a way of explaining the long-
term effects of pre-entry experience on firm hazards, linking the productivity of firms’
R&D efforts to their pre-entry experience (cf. Holbrook, Cohen, Hounshell, and Klepper
[2000]). The similar hazards of experienced firms and experienced entrepreneurs and the
low hazards of spinoffs, especially ones descended from more successful firms, suggests
that in autos key capabilities resided as much in people as organizations. Olds,
Buick/General Motors, Cadillac, and Ford exemplify this. Each had a famous leader with
distinctive pre-entry experience in engines, carriages, or autos. In turn, these firms
36 Klepper [2001b] found that other industries that experienced extreme shakeouts, including tires, televisions, and penicillin, had similar firm survival patterns to automobiles, and these industries were also characterized by rapid rates of technological advance in both their products and production processes. Moreover, detailed analyses of firm survival and innovation in both tires and televisions suggested that early entrants and firms with greater related pre-entry experience were in the vanguard of innovation, and this was key to their greater longevity and superior performance (Klepper and Simons [2000a, 2000b]).
34
proved to be fertile training grounds for many other great auto men who started nearly all
the other firms in the Detroit area that made it into the ranks of the industry leaders.
Indeed, two of the leading historians of the auto industry attributed its concentration
around Detroit to the preponderance of great men located there (Rae [1980], May
[1977]). They did not explain, though, why so many great men were located in the
Detroit area. The theoretical model can’t explain why four of the most successful early
firms arose in the Detroit area, which was an unlikely place for this to occur given the
paucity of early entrants around Detroit. But given the chance occurrence of four such
firms around Detroit, the theory can explain the subsequent concentration of great men
around Detroit that propelled Detroit to become the capital of the U.S. automobile
industry, attributing it to the birth and heredity process governing spinoffs.
The extraordinary success of many of the spinoffs in the Detroit area and the
connection between the performance of spinoffs and their parents suggests that successful
incumbent firms can be powerful incubators of significant later entrants. Indeed, the
success of firms in the Detroit area was largely confined to the Detroit-area spinoffs. If
agglomerations result from positive spillovers associated with R&D and/or input markets,
as Alfred Marshall and others have conjectured, or from having producers and their
suppliers locate close to each other and to buyers, as in Krugman et al.’s model, then the
benefits of locating in the Detroit area should have been experienced by all types of
firms. Moreover, it is not clear that there were any benefits from locating in the Detroit
area. The success of the Detroit-area spinoffs can largely be explained by the superior
performance of their parents and their greater proclivity to build on the expertise of their
parents.
The theoretical model contains a number of elements that are needed to generate
the extreme agglomeration of activity that characterized the auto industry. One is the
ability of de novo firms founded by people with distinctive experience to compete with
organizations diversifying from related industries. This does not occur in all industries.
For example, the television industry evolved in a very similar way to autos (Klepper
[2001b]), but the industry was dominated by firms diversifying from the radio industry.
Consequently, the geographic distribution of activity did not concentrate in any one
place, but largely reflected the geographic distribution of the radio producers. A second
35
aspect of the model contributing to the agglomeration of activity is the advantage of early
entrants associated with technological change. This eventually causes entry to dry up,
which not only contributes to a shakeout of producers but also limits the extent to which
agglomerations can be overturned once they occur. While many technologically
progressive industries eventually experience a drying up of entry and greater longevity of
earlier entrants (cf. Klepper [2001b]), some, such as lasers, do not. Although spinoffs
were also prominent in the laser industry, the industry has experienced a continual
turnover of firms that seems to have limited its geographic concentration (Klepper and
Sleeper [2000]). Last, in the model agglomeration depends on the chance location of a
few successful firms in one narrow region. This is certainly a rare event. If all three
conditions of the model are required to produce the kind of agglomeration that
characterized autos, it would explain why such extreme agglomerations are rare (Ellison
and Glaeser [1997]).37
The model implies that a region, including a nation, will not naturally develop a
presence in a new industry unless it has firms in related industries that could successfully
diversify into the new industry and subsequently spawn other entrants. It does not rule
out, though, that a region could generate qualified entrants through a government-
supported seeding process. The model is less informative about whether nations would
find it beneficial to promote geographic agglomeration of evolving industries. There are
no social advantages to agglomerations in the model. But judging from the experience of
Silicon Valley, which appears to have been fueled by spinoffs in semiconductors (Brittain
and Freeman [1986]) and other industries such as disk drives (Franco and Filson [2000])
and lasers (Klepper and Sleeper [2000]), agglomerations driven by spinoffs may well
promote economic growth. Exactly how this occurs and whether in fact spinoffs are
socially beneficial is an unresolved question. The rate of spinoffs was much higher in the
Detroit area than expected based on the explanatory variables of the order logit model,
suggesting that agglomerations may promote spinoffs, which would be socially beneficial
37 Once agglomerations occur, though, the model predicts they will tend to be self-reinforcing, which could explain Sorenson and Audia’s [2000] finding for the footwear industry that firms entered disproportionately in agglomerated areas even though firms in those areas had shorter lifetimes, ceteris paribus.
36
if spinoffs are an important element of the growth process. If spinoffs are socially
beneficial, then promoting spinoffs through such policies as restricting noncompete
convenants and trade secrets may be warranted (cf. Hyde [2000], Klepper [2001a], Stuart
and Sorenson [2001]). Nations may even want to take steps to reduce any stigma
associated with employees leaving to start their own firms and the inevitable failures that
will result from more employee startups.
In many ways the model used to analyze the evolution of the automobile industry
embodied many restrictive assumptions regarding firm behavior. Firms were assumed to
use little discretion in where they located and when they entered, with the latter based
largely on when they acquired the capabilities to enter. These capabilities were assumed
to be based on the firms’ pre-entry experiences and as such were heterogeneous and not
easily duplicated by less experienced firms. Firms were assumed not to be able to grow
quickly without incurring substantial costs and to make decisions based on near-term
considerations. All told, these assumptions greatly circumscribed firm behavior, thereby
simplifying the analysis of competition and making it possible to derive a number of
distinctive predictions that guided the empirical analysis. Nelson and Winter [1982]
pioneered this kind of modeling, and the detailed analysis of the origins of the automobile
firms and the evolution of the automobile industry illustrates the kind of insights it can
generate.

37
Table 1: Hypotheses
1. Among all firms and each type of entrant, the hazards of early and late entrants
cannot be ordered at young ages, but at older ages the early entry cohorts will have
lower hazards and will become extinct later than the late entry cohorts.
2. Experienced firms, experienced entrepreneurs, and spinoffs will have lower hazards
at every age than inexperienced firms.
3. Spinoffs from better-performing parents and experienced firms and experienced
entrepreneurs with experience in industries more related to automobiles will have
lower hazards at every age.
4. a. The number of spinoff entrants relative to the number of experienced firm and
experienced entrepreneur entrants will steadily rise over time.
b. The number of experienced firm, experienced entrepreneur, and spinoff entrants
relative to the number of inexperienced firm entrants will eventually rise as the
industry evolves.
c. The performance of the parents of spinoff entrants will improve over time.
d. Better-performing firms will spawn more spinoffs.
5 a. The spinoffs of Detroit-area firms will locate in the Detroit area and the spinoffs
located in the Detroit area will have parents located in the Detroit area.
b. The percentage of entrants that are spinoffs will be higher in the Detroit area than
elsewhere.
c. Parents of Detroit-area spinoffs will perform better than parents of spinoffs
elsewhere.
d. A few early Detroit-area entrants should rank high on the list of firms with the
greatest number of spinoffs, and the most successful spinoffs in the Detroit area
should be related, either directly or through their spinoffs, to these firms.
e. Spinoffs located in the Detroit area will have lower hazards at every age than
spinoffs located elsewhere.
f. Inexperienced firms located in the Detroit area will not have lower hazards at
every age than inexperienced firms located elsewhere.
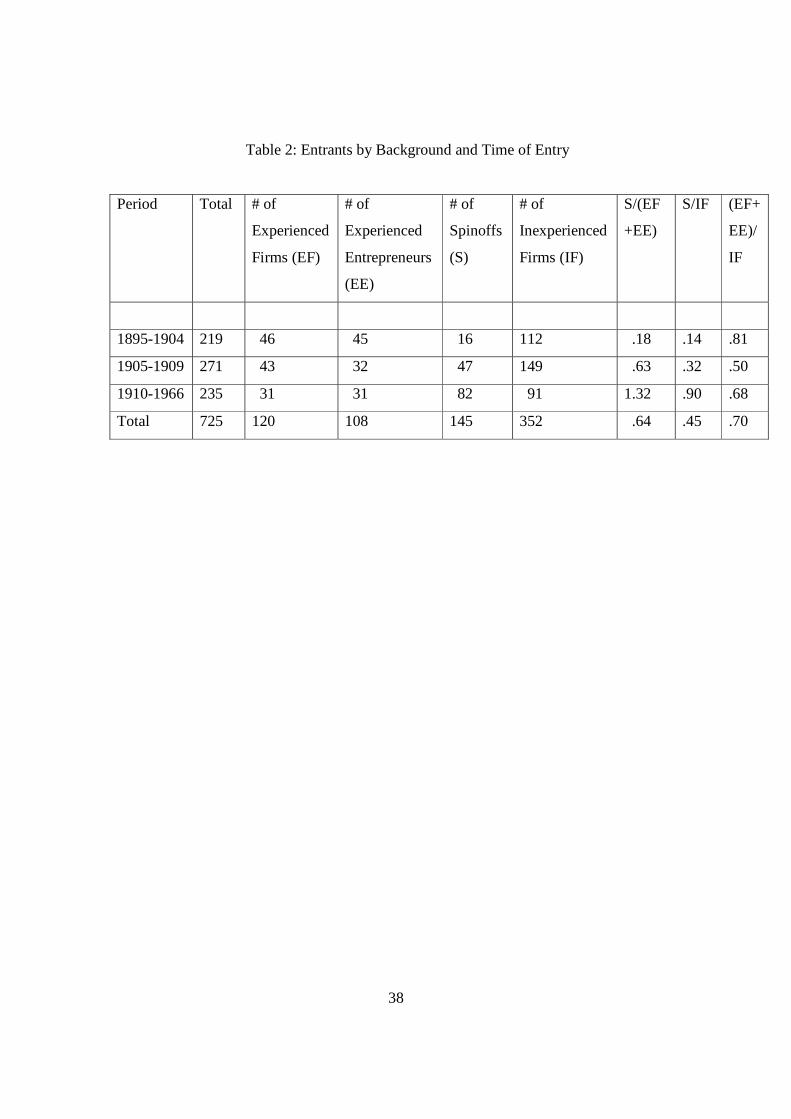
38
Table 2: Entrants by Background and Time of Entry
Period Total
# of
Experienced
Firms (EF)
# of
Experienced
Entrepreneurs
(EE)
# of
Spinoffs
(S)
# of
Inexperienced
Firms (IF)
S/(EF
+EE)
S/IF (EF+
EE)/
IF
1895-1904 219 46 45 16 112 .18 .14 .81
1905-1909 271 43 32 47 149 .63 .32 .50
1910-1966 235 31 31 82 91 1.32 .90 .68
Total 725 120 108 145 352 .64 .45 .70
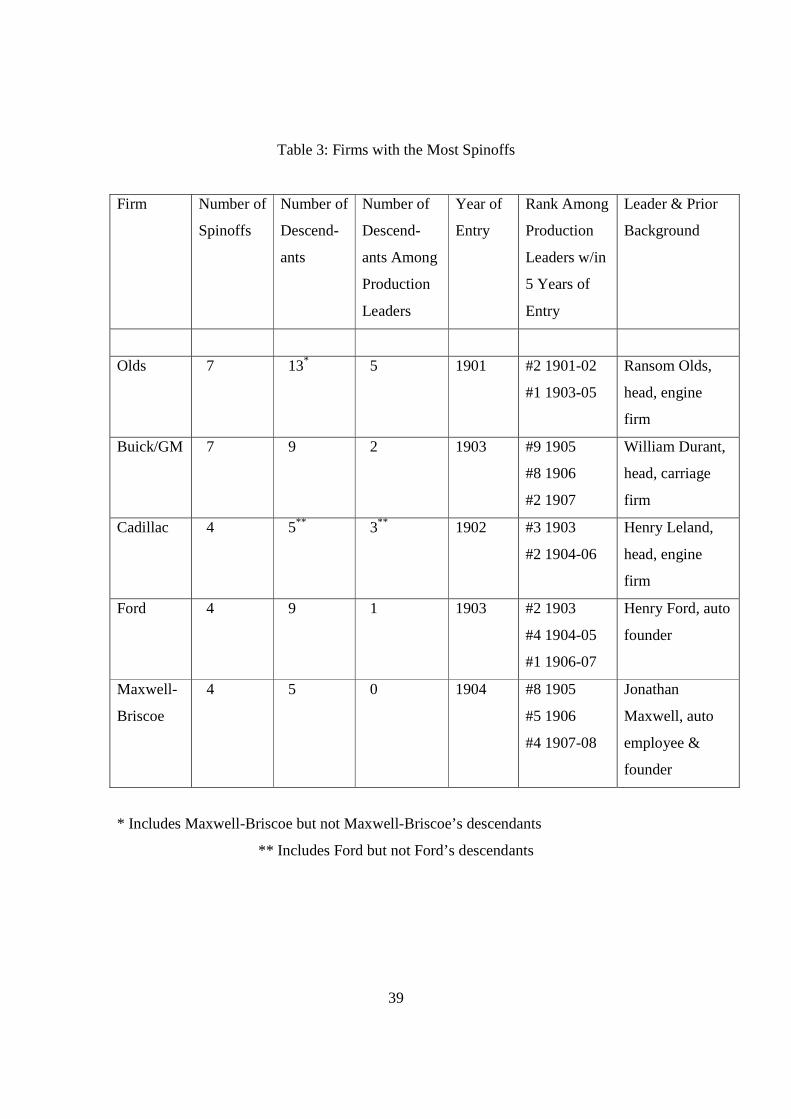
39
Table 3: Firms with the Most Spinoffs
Firm Number of
Spinoffs
Number of
Descend-
ants
Number of
Descend-
ants Among
Production
Leaders
Year of
Entry
Rank Among
Production
Leaders w/in
5 Years of
Entry
Leader & Prior
Background
Olds 7 13* 5 1901 #2 1901-02
#1 1903-05
Ransom Olds,
head, engine
firm
Buick/GM 7 9 2 1903 #9 1905
#8 1906
#2 1907
William Durant,
head, carriage
firm
Cadillac 4 5** 3** 1902 #3 1903
#2 1904-06
Henry Leland,
head, engine
firm
Ford 4 9 1 1903 #2 1903
#4 1904-05
#1 1906-07
Henry Ford, auto
founder
Maxwell-
Briscoe
4 5 0 1904 #8 1905
#5 1906
#4 1907-08
Jonathan
Maxwell, auto
employee &
founder
* Includes Maxwell-Briscoe but not Maxwell-Briscoe’s descendants
** Includes Ford but not Ford’s descendants
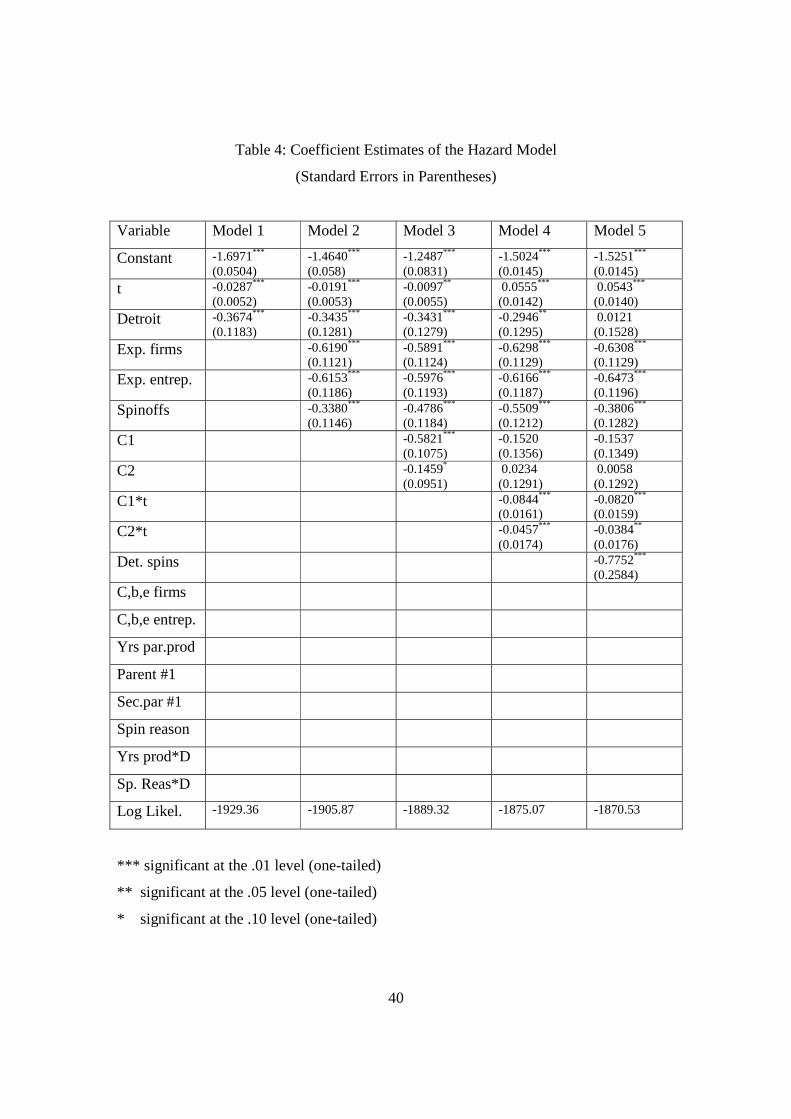
40
Table 4: Coefficient Estimates of the Hazard Model
(Standard Errors in Parentheses)
Variable Model 1 Model 2 Model 3 Model 4 Model 5
Constant -1.6971*** (0.0504)
-1.4640*** (0.058)
-1.2487***
(0.0831) -1.5024***
(0.0145) -1.5251***
(0.0145) t -0.0287***
(0.0052) -0.0191***
(0.0053) -0.0097**
(0.0055) 0.0555***
(0.0142) 0.0543***
(0.0140) Detroit -0.3674***
(0.1183) -0.3435***
(0.1281) -0.3431***
(0.1279) -0.2946**
(0.1295) 0.0121 (0.1528)
Exp. firms -0.6190***
(0.1121) -0.5891***
(0.1124) -0.6298***
(0.1129) -0.6308***
(0.1129) Exp. entrep. -0.6153***
(0.1186) -0.5976***
(0.1193) -0.6166***
(0.1187) -0.6473***
(0.1196)
Spinoffs -0.3380***
(0.1146) -0.4786***
(0.1184) -0.5509***
(0.1212) -0.3806***
(0.1282) C1 -0.5821***
(0.1075) -0.1520 (0.1356)
-0.1537 (0.1349)
C2 -0.1459*
(0.0951) 0.0234 (0.1291)
0.0058 (0.1292)
C1*t -0.0844***
(0.0161) -0.0820***
(0.0159) C2*t -0.0457***
(0.0174) -0.0384**
(0.0176) Det. spins -0.7752***
(0.2584) C,b,e firms
C,b,e entrep.
Yrs par.prod
Parent #1
Sec.par #1
Spin reason
Yrs prod*D
Sp. Reas*D
Log Likel. -1929.36 -1905.87 -1889.32 -1875.07 -1870.53
*** significant at the .01 level (one-tailed)
** significant at the .05 level (one-tailed)
* significant at the .10 level (one-tailed)
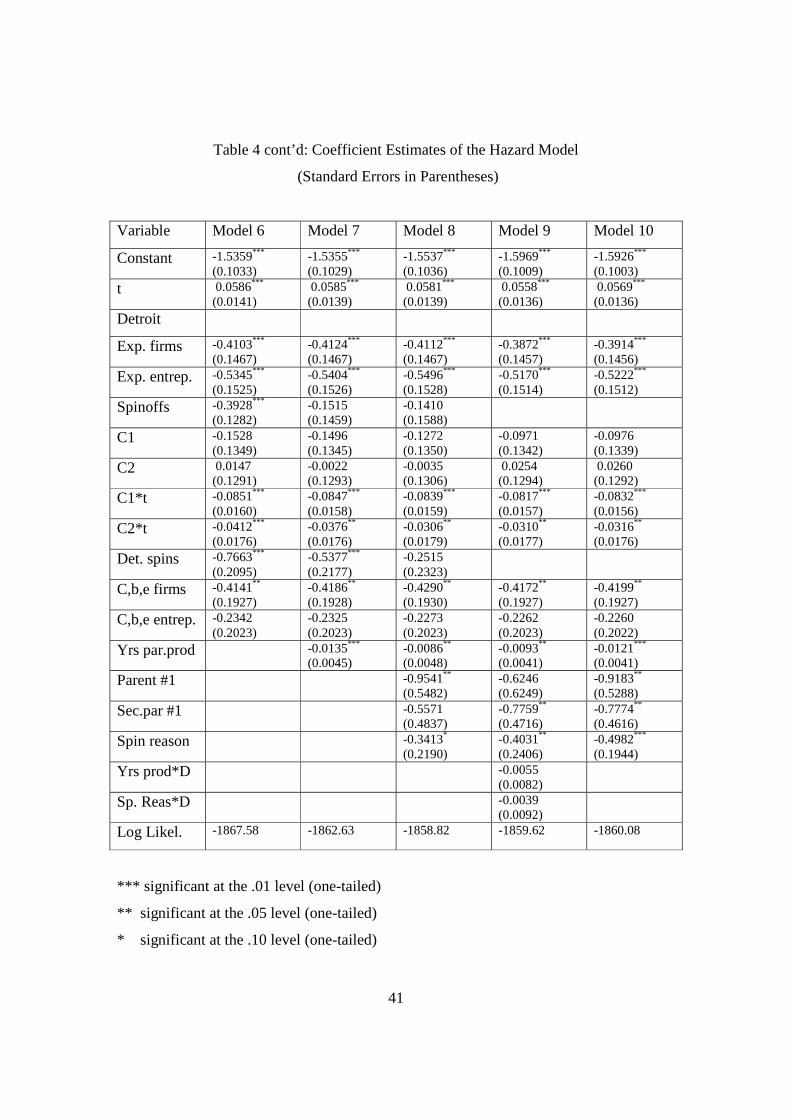
41
Table 4 cont’d: Coefficient Estimates of the Hazard Model
(Standard Errors in Parentheses)
Variable Model 6 Model 7 Model 8 Model 9 Model 10
Constant -1.5359***
(0.1033) -1.5355***
(0.1029) -1.5537***
(0.1036) -1.5969***
(0.1009) -1.5926***
(0.1003) t 0.0586***
(0.0141) 0.0585***
(0.0139) 0.0581***
(0.0139) 0.0558***
(0.0136) 0.0569***
(0.0136) Detroit
Exp. firms -0.4103***
(0.1467) -0.4124***
(0.1467) -0.4112***
(0.1467) -0.3872*** (0.1457)
-0.3914*** (0.1456)
Exp. entrep. -0.5345***
(0.1525) -0.5404***
(0.1526) -0.5496***
(0.1528) -0.5170*** (0.1514)
-0.5222*** (0.1512)
Spinoffs -0.3928***
(0.1282) -0.1515 (0.1459)
-0.1410 (0.1588)
C1 -0.1528 (0.1349)
-0.1496 (0.1345)
-0.1272 (0.1350)
-0.0971 (0.1342)
-0.0976 (0.1339)
C2 0.0147 (0.1291)
-0.0022 (0.1293)
-0.0035 (0.1306)
0.0254 (0.1294)
0.0260 (0.1292)
C1*t -0.0851***
(0.0160) -0.0847***
(0.0158) -0.0839***
(0.0159) -0.0817***
(0.0157) -0.0832***
(0.0156) C2*t -0.0412***
(0.0176) -0.0376**
(0.0176) -0.0306**
(0.0179) -0.0310**
(0.0177) -0.0316**
(0.0176) Det. spins -0.7663***
(0.2095) -0.5377***
(0.2177) -0.2515 (0.2323)
C,b,e firms -0.4141**
(0.1927) -0.4186**
(0.1928) -0.4290**
(0.1930) -0.4172** (0.1927)
-0.4199** (0.1927)
C,b,e entrep. -0.2342 (0.2023)
-0.2325 (0.2023)
-0.2273 (0.2023)
-0.2262 (0.2023)
-0.2260 (0.2022)
Yrs par.prod -0.0135***
(0.0045) -0.0086**
(0.0048) -0.0093**
(0.0041) -0.0121***
(0.0041) Parent #1 -0.9541**
(0.5482) -0.6246
(0.6249) -0.9183**
(0.5288)
Sec.par #1 -0.5571 (0.4837)
-0.7759**
(0.4716) -0.7774**
(0.4616) Spin reason -0.3413*
(0.2190) -0.4031** (0.2406)
-0.4982*** (0.1944)
Yrs prod*D -0.0055 (0.0082)
Sp. Reas*D -0.0039 (0.0092)
Log Likel. -1867.58 -1862.63 -1858.82 -1859.62 -1860.08
*** significant at the .01 level (one-tailed)
** significant at the .05 level (one-tailed)
* significant at the .10 level (one-tailed)
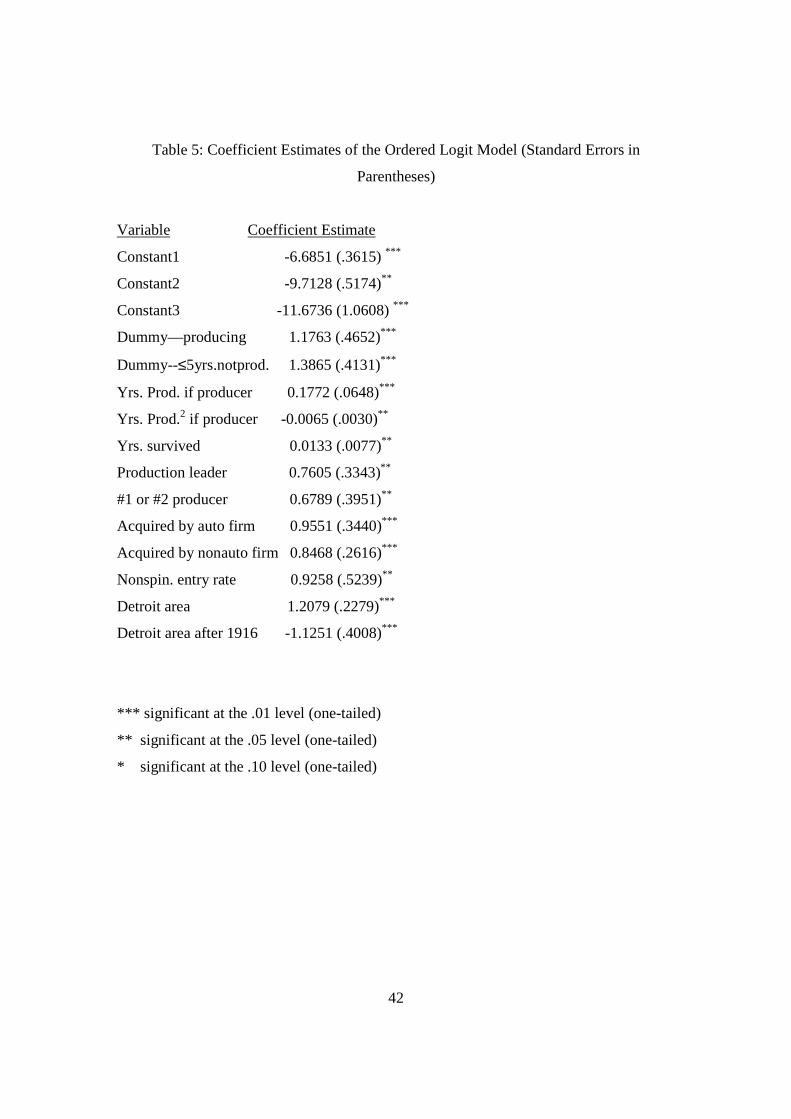
42
Table 5: Coefficient Estimates of the Ordered Logit Model (Standard Errors in
Parentheses)
Variable Coefficient Estimate
Constant1 -6.6851 (.3615) ***
Constant2 -9.7128 (.5174)**
Constant3 -11.6736 (1.0608) ***
Dummy—producing 1.1763 (.4652)***
Dummy--≤5yrs.notprod. 1.3865 (.4131)***
Yrs. Prod. if producer 0.1772 (.0648)***
Yrs. Prod.2 if producer -0.0065 (.0030)**
Yrs. survived 0.0133 (.0077)**
Production leader 0.7605 (.3343)**
#1 or #2 producer 0.6789 (.3951)**
Acquired by auto firm 0.9551 (.3440)***
Acquired by nonauto firm 0.8468 (.2616)***
Nonspin. entry rate 0.9258 (.5239)**
Detroit area 1.2079 (.2279)***
Detroit area after 1916 -1.1251 (.4008)***
*** significant at the .01 level (one-tailed)
** significant at the .05 level (one-tailed)
* significant at the .10 level (one-tailed)
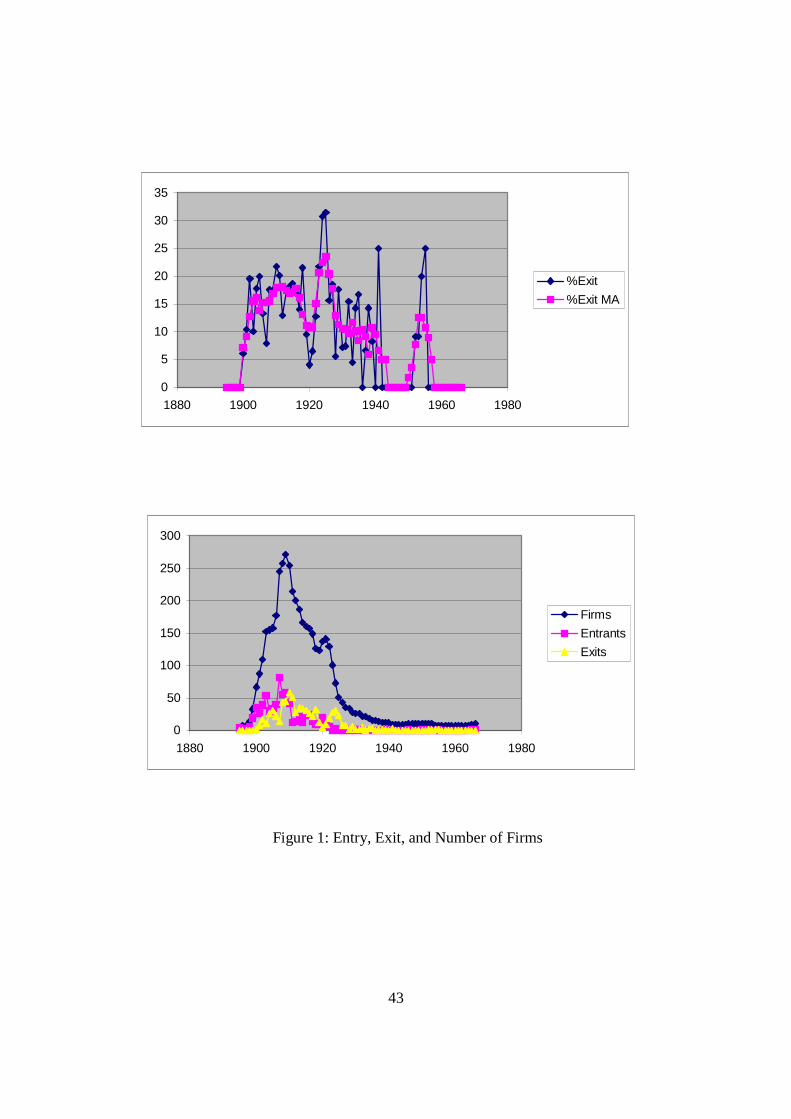
43
Figure 1: Entry, Exit, and Number of Firms
0
5
10
15
20
25
30
35
1880 1900 1920 1940 1960 1980
%Exit
%Exit MA
0
50
100
150
200
250
300
1880 1900 1920 1940 1960 1980
Firms
Entrants
Exits
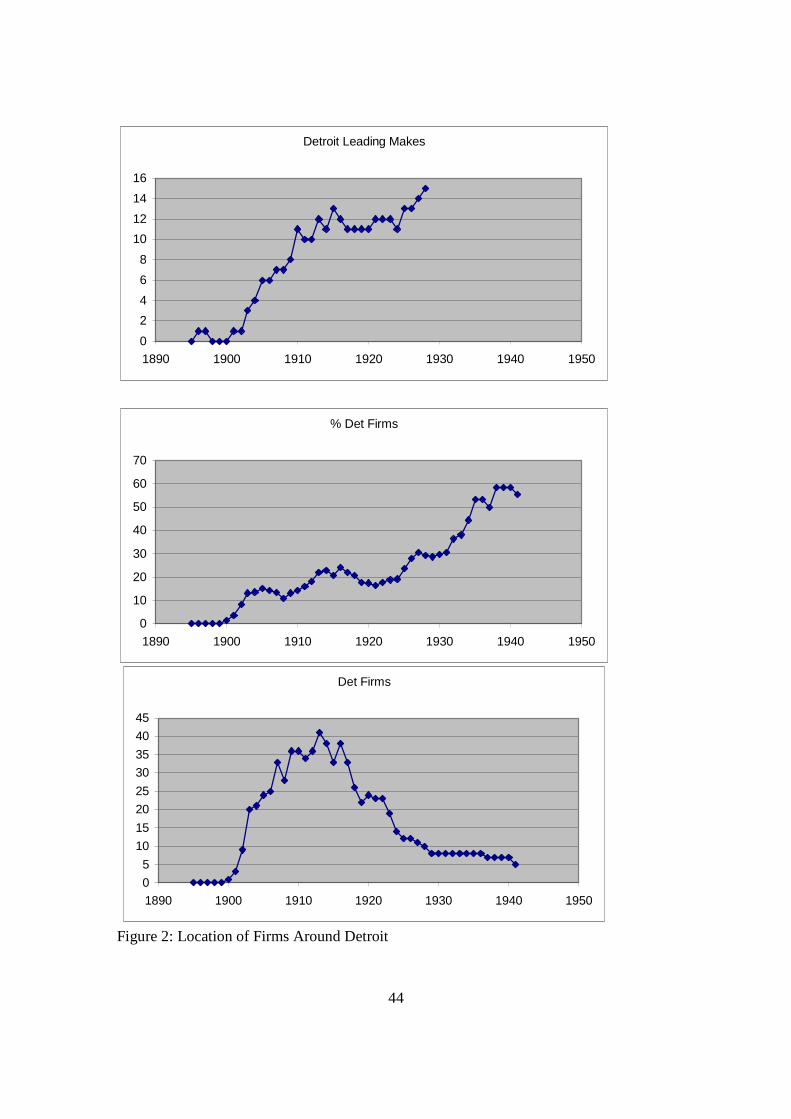
44
Figure 2: Location of Firms Around Detroit
Det Firms
0
5
10
15
20
25
30
35
40
45
1890 1900 1910 1920 1930 1940 1950
% Det Firms
0
10
20
30
40
50
60
70
1890 1900 1910 1920 1930 1940 1950
Detroit Leading Makes
0
2
4
6
8
10
12
14
16
1890 1900 1910 1920 1930 1940 1950
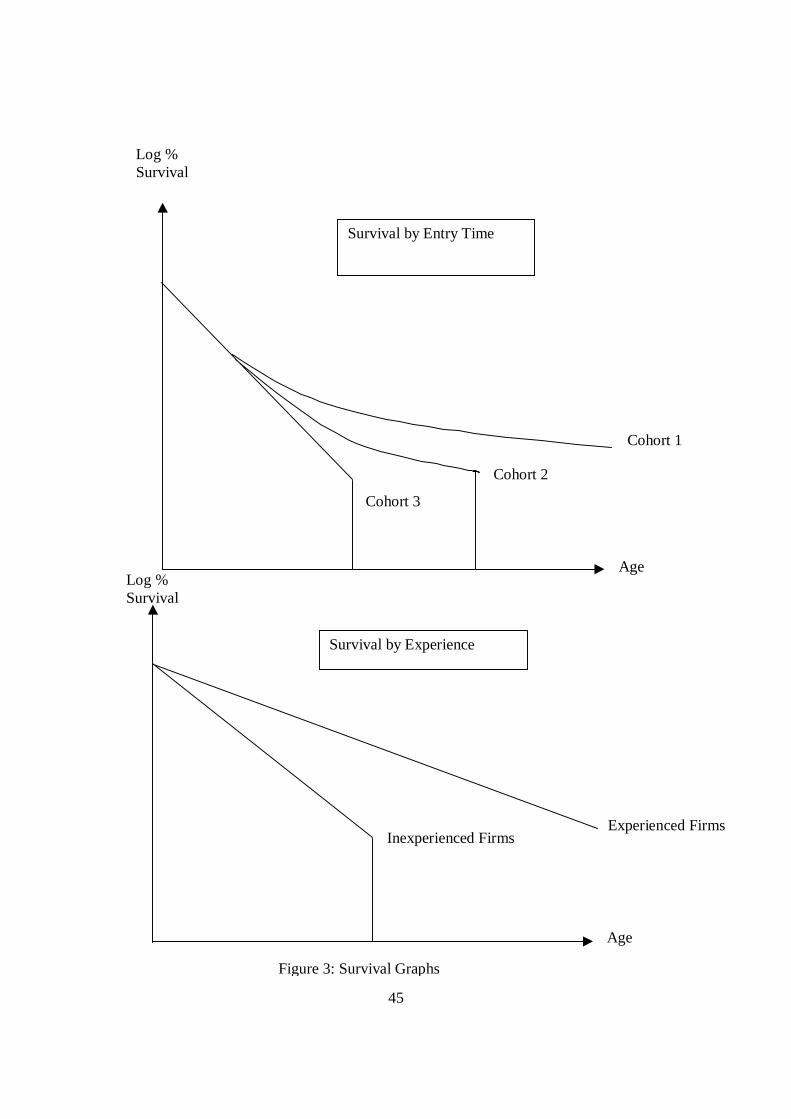
45
Figure 3: Survival Graphs
Experienced FirmsInexperienced Firms
Cohort 3
Cohort 2
Cohort 1
Survival by Experience
Survival by Entry Time
Log %Survival
Log %Survival
Age
Age
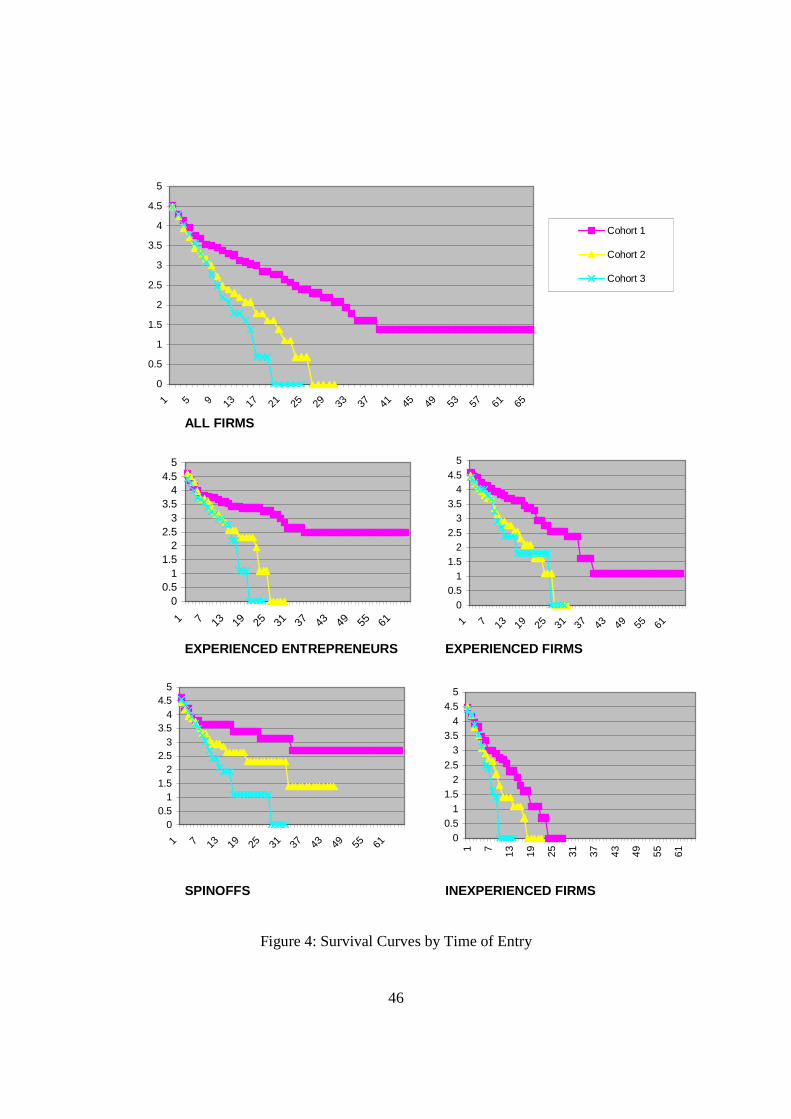
46
Figure 4: Survival Curves by Time of Entry
ALL FIRMS
EXPERIENCED ENTREPRENEURS EXPERIENCED FIRMS
SPINOFFS INEXPERIENCED FIRMS
0
0.5
1
1.5
2
2.5
3
3.5
4
4.5
5
1 5 9 13 17 21 25 29 33 37 41 45 49 53 57 61 65
Cohort 1
Cohort 2
Cohort 3
00.5
11.5
22.5
33.5
44.5
5
1 7 13 19 25 31 37 43 49 55 61
00.5
11.5
22.5
33.5
44.5
5
1 7 13 19 25 31 37 43 49 55 61
00.5
11.5
22.5
33.5
44.5
5
1 7 13 19 25 31 37 43 49 55 61
00.5
11.5
22.5
33.5
44.5
5
1 7 13 19 25 31 37 43 49 55 61
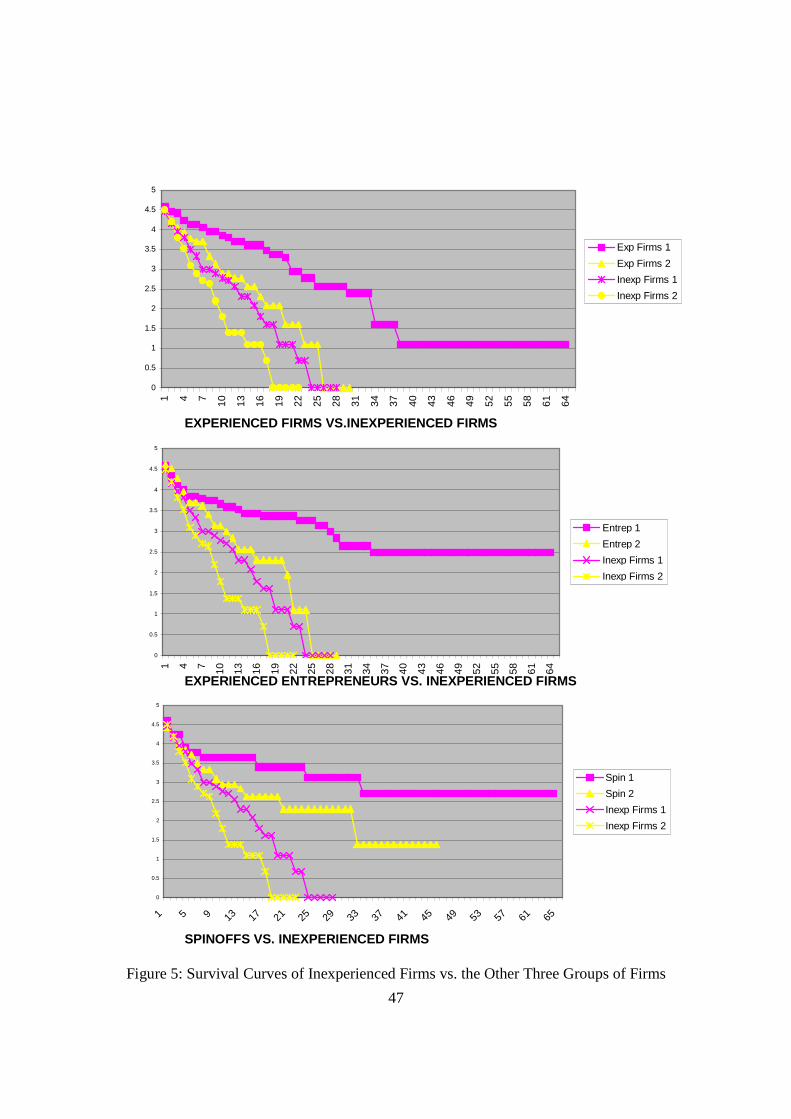
47
Figure 5: Survival Curves of Inexperienced Firms vs. the Other Three Groups of Firms
EXPERIENCED FIRMS VS.INEXPERIENCED FIRMS
EXPERIENCED ENTREPRENEURS VS. INEXPERIENCED FIRMS
SPINOFFS VS. INEXPERIENCED FIRMS
0
0.5
1
1.5
2
2.5
3
3.5
4
4.5
5
1 4 7 10 13 16 19 22 25 28 31 34 37 40 43 46 49 52 55 58 61 64
Exp Firms 1
Exp Firms 2
Inexp Firms 1
Inexp Firms 2
0
0.5
1
1.5
2
2.5
3
3.5
4
4.5
5
1 4 7 10 13 16 19 22 25 28 31 34 37 40 43 46 49 52 55 58 61 64
Entrep 1
Entrep 2
Inexp Firms 1
Inexp Firms 2
0
0.5
1
1.5
2
2.5
3
3.5
4
4.5
5
1 5 9 13 17 21 25 29 33 37 41 45 49 53 57 61 65
Spin 1
Spin 2
Inexp Firms 1
Inexp Firms 2
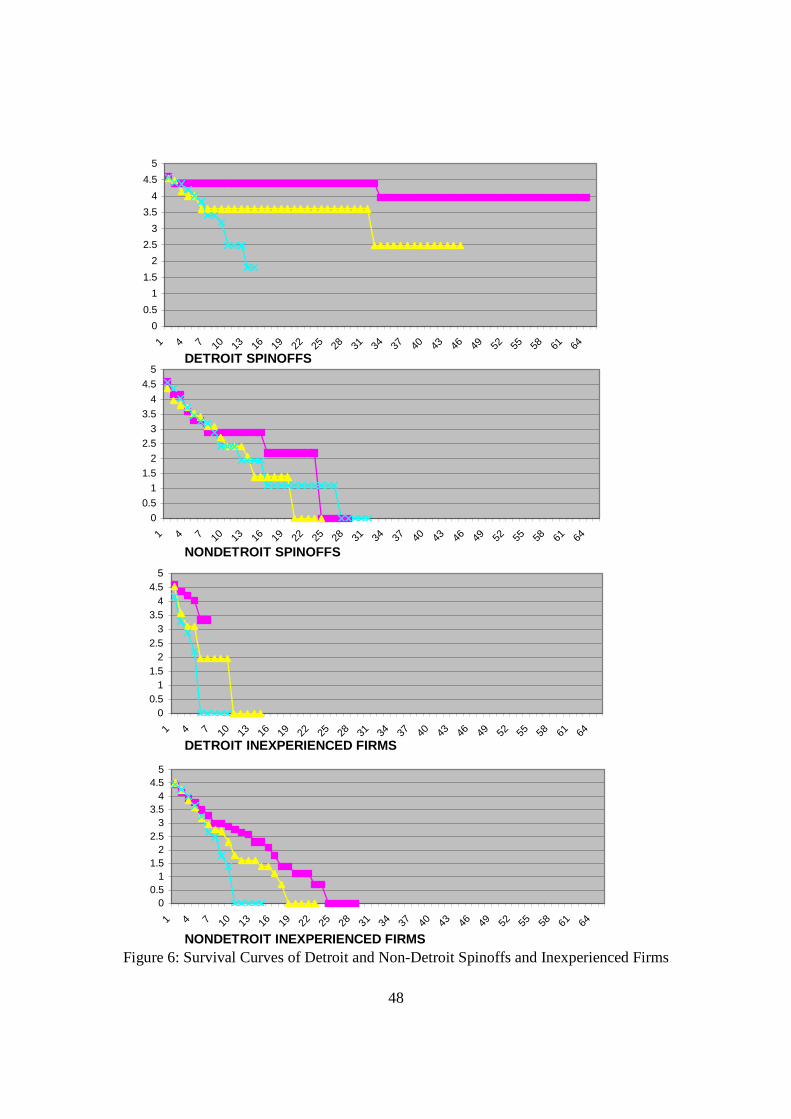
48
Figure 6: Survival Curves of Detroit and Non-Detroit Spinoffs and Inexperienced Firms
DETROIT SPINOFFS
NONDETROIT SPINOFFS
DETROIT INEXPERIENCED FIRMS
NONDETROIT INEXPERIENCED FIRMS
0
0.5
1
1.5
2
2.5
3
3.5
4
4.5
5
1 4 7 10 13 16 19 22 25 28 31 34 37 40 43 46 49 52 55 58 61 64
0
0.5
1
1.5
2
2.53
3.5
4
4.5
5
1 4 7 10 13 16 19 22 25 28 31 34 37 40 43 46 49 52 55 58 61 64
00.5
11.5
22.5
33.5
44.5
5
1 4 7 10 13 16 19 22 25 28 31 34 37 40 43 46 49 52 55 58 61 64
00.5
11.5
22.5
33.5
44.5
5
1 4 7 10 13 16 19 22 25 28 31 34 37 40 43 46 49 52 55 58 61 64
49
References
Arthur, Brian. “Self-Reinforcing Mechanisms in Economics,” in The Economy as an
Evolving Complex System, 1988, Philip W. Anderson, Kenneth J. Arrow, and David
Prines, eds. New York: Addison-Wesley.
Bailey, L. Scott. The American Car Since 1775, 1971, New York: Automobile Quarterly,
Inc.
Baldwin, Nick, G. N. Georgano, Michael Sedgwick, and Brian Laban. The World Guide
to Automobile Manufacturers, 1987, London: Macdonald & Co.
Brittain, Jack W. and John Freeman. “Entrepreneurship in the Semiconductor Industry,”
1986, mimeo.
Carroll, Glenn R. and Michael T. Hannan. “Automobile Manufacturers,” in Glenn R.
Carroll and Michael T. Hannan, eds., Organizations in Industry, 1995, New York:
Oxford University Press, 195-214.
Carroll, Glenn R., Lyda S. Bigelow, Marc-David L. Seidel, and Lucia B. Tsai. “The Fates
of De Novo and De Alio Producers in the American Automobile Industry 1885-1981,”
Strategic Management Journal 17 (1996), 117-137.
Cox, D. R. and E. J. Snell. Analysis of Binary Data, second edition, 1989, London:
Chapman and Hall.
Davis, Donald F. Conspicuous Production: Automobiles and Elites in Detroit, 1899-
1933, 1988, Philadelphia: Temple University Press.
Doolittle, James R. The Romance of the Automobile Industry, 1916, New York: The
Klebold Press.
Epstein, Ralph. The Automobile Industry, 1928, Chicago: A.W. Shaw Company.
Federal Trade Commission. Report on the Motor Vehicle Industry, 1939, Washington,
D.C.:U.S. Government Printing Office.
Franco, April M. and Darren Filson. “Knowledge Diffusion through Employee Mobility,”
2000, Federal Reserve Bank of Minneapolis, Staff Report 272.
Fujita, Masahisa, Paul Krugman, and Anthony J. Venables. The Spatial Economy, 1999,
Cambridge, MA: The MIT Press.

50
Ellison, Glenn and Edward L. Glaeser. “Geographic Concentration in U.S.
Manufacturing Industries: A Dartboard Approach,” Journal of Political Economy 105
(1997), 889-927.
Holbrook, Daniel, Wesley M. Cohen, David A. Hounshell, and Steven Klepper. “The Nature,
Sources, and Consequences of Firm Differences in the Early History of the Semiconductor
Industry,” Strategic Management Journal 21 (2000), 1017-1041.
Horvath, Michael, Fabiano Schivardi, and Michael Woywode. “On Industry Life-Cycles:
Delay, Entry, and Shakeout in Beer Brewing,” International Journal of Industrial
Organization 19 (2001), 1023-1052.
Hyde, Alan. “Working in Silicon Valley: Economic and Legal Analysis of a High-
Velocity Labor Market,” 2000, Chapters 2 and 3, mimeo.
Jovanovic, Boyan. “Selection and the Evolution of Industry,” Econometrica 50 (1982),
649-670.
Jovanovic, Boyan, and Glenn MacDonald. “The Life Cycle of a Competitive Industry,”
Journal of Political Economy 102 (1994), 322-347.
Kimes, Beverly R. Standard Catalog of American Cars, 1890-1942, third edition, 1996,
Iola, WI: Krause Publications Inc.
Klepper, Steven. “Entry, Exit, Growth, and Innovation over the Product Life Cycle,”
American Economic Review 86 (1996), 562-583.
Klepper, Steven. “Employee Startups in High Tech Industries,” Industrial and Corporate
Change 10 (2001a), 639-674.
Klepper, Steven. “Firm Survival and the Evolution of Oligopoly,” Carnegie Mellon
University, (2001b), forthcoming in the Rand Journal of Economics.
Klepper, Steven, and Kenneth L. Simons. “Technological Extinctions of Industrial
Firms: An Enquiry into their Nature and Causes,” Industrial and Corporate Change 6
(1997), 379-460.
Klepper, Steven, and Kenneth L. Simons. “The Making of an Oligopoly: Firm Survival and
Technological Change in the Evolution of the U.S. Tire Industry,” Journal of Political
Economy 108 (2000a), 728-760.
51
Klepper, Steven and Kenneth L. Simons. “Dominance by Birthright: Entry of Prior Radio
Producers and Competitive Ramifications in the U.S. Television Receiver Industry,”
Strategic Management Journal 21 (2000b), 997-1016.
Klepper, Steven and Kenneth L. Simons. “Industry Shakeouts and Technological
Change,” 2001, mimeo.
Klepper, Steven and Sally Sleeper. “Entry by Spinoffs,” 2000, mimeo.
Krugman, Paul. Geography and Trade, 1991, Cambridge, MA: MIT Press
May, George S. A Most Unique Machine: The Michigan Origins of the American
Automobile Industry, 1975, Grand Rapids, MI: William B. Eerdmans Publishing
Company.
May, George S. R.E. Olds: Auto Industry Pioneer, 1977, Grand Rapids, MI: William B.
Eerdmans Publishing Co.
Nelson, Richard R. and Sidney G. Winter. An Evolutionary Theory of Economic Change,
1982, Cambridge, MA: Harvard University Press.
Powell, Sinclair. The Franklin Automobile Company, 1999, Warrendale, PA: Society of
Automotive Engineers.
Rae, John B. “Why Michigan,” in The Automobile and American Culture, Daniel L.
Lewis and Laurence Goldstein, eds., 1980, Ann Arbor: The University of Michigan
Press.
Smith, Philip H. Wheels within Wheels, 1968, New York: Funk and Wagnalls.
Sorenson, Olav and Pino G. Audia. “The Social Structure of Entrepreneurial Activity:
Geographic Concentration of Footwear Production in the United States, 1940-1989,”
American Journal of Sociology 106 (2000), 424-461.
Stuart, Toby E. and Olav Sorenson. “Liquidity Events, Noncompete Covenants and the
Geographic Distribution of Entrepreneurial Activity,” 2001, mimeo.
Szudarek, Robert G. How Detroit Became the Automotive Capital, 1996, Detroit: The
Typocraft Company.
Tsai, Lucia B. “The Spatial Aggregation of Automobile Manufacturing Activities in the
American Midwest,” 1997, mimeo.
Utterback, James, and Fernando Suárez. “Innovation, Competition, and Industry Structure,”
Research Policy 22 (1993), 1-21.