the energy-water nexus: state and local roles in ... · –19% of california electricity2 • ......
TRANSCRIPT

1 | Energy Efficiency and Renewable Energy eere.energy.gov
The Energy-Water Nexus: State and Local Roles in Efficiency & Water and Wastewater Treatment Plants
September 11th, 2013
DOE’s State and Local Technical Assistance Program

2
DOE’s Technical Assistance Program
• Strategic Energy Planning
• Program & Policy Design and Implementation
• Financing Strategies
• Data Management and EM&V
• EE & RE Technologies
Priority Areas
• General Education (e.g., fact sheets, 101s)
• Case Studies
• Tools for Decision-Making
• Protocols (e.g., how-to guides, model documents)
Resources
• Webinars • Conferences & in-person trainings
• Better Buildings Project Teams
Peer Exchange &
Trainings • Level of effort will vary
• In-depth efforts will be focused on:
• High impact efforts
• Opportunities for replicability
• Filling gaps in the technical assistance marketplace
One-on-One

3
• Trainings & Peer Exchange
Upcoming TAP Webinars: States Applications for Combined Heat and Power Technologies, 9/25 Tapping New Markets for Efficiency: State Initiatives for Multifamily Housing, 10/17 www.eere.energy.gov/wip/solutioncenter/wip_events.html
• Resources
Advanced Manufacturing Office’s Energy Resource Center www.eere.energy.gov/manufacturing/tech_assistance/ecenter.html
Water Environment Foundation’s Matrices of Best Practices in Energy Roadmap www.wef.org/energywater.aspx
EPA’s Sustainable Water Infrastructure Program water.epa.gov/infrastructure/sustain/index.cfm
EPA’s State and Local Guide to Energy Efficiency in Water and Wastewater Facilities www.epa.gov/statelocalclimate/documents/pdf/wastewater-guide.pdf
Updated Solution Center resource portal for technology deployment live later this year
Priority Area: EE & RE Technologies
4
• Visit the Solution Center www.eere.energy.gov/wip/solutioncenter/
• Submit an application for assistance www.eere.energy.gov/wip/solutioncenter/technical_assistance.html
• Sign up for TAP Alerts, the TAP mailing list, for updates on our latest and greatest [email protected]
How to Tap into These and Other TAP Offerings

U.S. Department of Energy TAP Webinar:
Energy Efficiency in Water and Wastewater
Treatment Facilities
September 11, 2013
Energy Conservation
and Generation
Technologies at Water
& Wastewater
Facilities
Barry Liner, Ph.D., P.E. Director, Water Science &
Engineering Center

Energy Use in Water Sector
• Drinking water and wastewater consume:
– 3% - 4% of domestic electricity1
– 7% of worldwide electricity1
– 19% of California electricity2
• (Includes end use)
• Water resources can be 50% of a
municipality’s electricity use
1. Electric Power Research Institute (Burton 1996)
2. Energy Down the Drain: The Hidden Costs of
California’s Water Supply

Drinking Water Energy Use
• 1,000 – 2,500 kWh/MG – Roughly 80% is pumping
New regulations are increasing the use of the following, energy intensive treatment processes:
– UV Disinfection 70-100 kWh/MG
– Ozone 170 kWh/MG
– Membranes • Nano and RO 1,800 kWh/MG
• Ultrafiltration 1,000 kwh/MG
• Microfiltration 100 kwh/MG
AwwaRF 91201.Energy Index Development for Benchmarking Water and
Wastewater Utilities

Wastewater Facility Energy Use
• 1,000-4,000 kWh/MG
• Wastewater contains between 2-10 times
amount of energy needed to treat it

Change our Mind(set)
• WEF believes that wastewater treatment
plants are NOT waste disposal facilities, but
rather water resource recovery facilities that
produce clean water, recover nutrients
(such as phosphorus and nitrogen), and have
the potential to reduce the nation’s
dependence upon fossil fuel through the
production and use of renewable energy.

Key Barriers Barriers • Little guidance from Federal to
State for energy efficiency
• Regulations are not streamlined
and often mandate other
priorities
• Energy from biosolids not
universally considered renewable
• Selling excess electricity back to
the grid is sometimes hindered by
tariffs and interconnection policies
• Standardization is needed for the
state definition of energy service
companies – WRRFs and their
energy streams (biogas/biosolids)
should be included
Potential Solutions • Provide guidance for improving
energy efficiency and
implementing energy generation
at water treatment facilities
• Encourage policy and integrated
planning that supports a permit
process incentivizing energy
efficiency and energy generation
in the water sector
• Offer grants, tax credits, state
revolving funds, public/private
partnerships, or other options to
help with financing the energy
transition
• Work to harmonize ESCO
legislation in all 50 states

Free Resources – WEF Matrices of Best Practices
in Energy Roadmap • http://www.wef.org/energywater.aspx
– WEF e-learning course • Drivers Ed for the Energy Roadmap
– The U.S. Environmental Protection Agency (EPA) Energy Efficiency in Water and Wastewater Facilities
• http://www.epa.gov/statelocalclimate/documents/pdf/wastewater-guide.pdf


Case
Studies

Efficiency
• Variable Frequency
Drives
• Peak Shaving
• SCADA
Micro-Hydro

Energy Flow at WRRF

http://www.appleton.org/
Anaerobic Digestion & Biogas
• Biogas is generally 50%
methane
• Combined heat & power
(CHP)
• Co-digestion
– Fats, oils, grease
– Organic wastes
– Whey
• Generate electricity
• Clean gas and use as fuel
Stevens Point, WI


Net Energy Producer
Or flair for flares?

Traditional
Renewables
Courtesy of Peter Goldberg for Narragansett Bay Commission
Kent County,
Delaware

Gasification & Pyrolysis
KORE Infrastructure
LLC

Fuel Cells: Orange County
Sanitation District

>

Lisa Henderson Arizona Governor’s Office of Energy Policy Community Energy Program Manager 1700 W. Washington Phoenix, AZ 602 771-1134 [email protected]
WATER ENERGY PARTNERSHIP IN ARIZONA (WEPA)
Connecting Water & Energy

31
The U.S. Environmental Protection
Agency (EPA) estimates 3-4 percent of
national electricity consumption,
equivalent to approximately 56 billion
kilowatt hours (kWh), or $4 billion, is used
in providing drinking water and
wastewater services each year.
What’s the Cost

Future Energy Demand
• Energy demand increase » 20% - 30% in 15 years
• Population & more stringent regulations • Aging infrastructure • Increasing threats to watersheds and aquifers • Changing compliance and public health standards • “Rising cost” industry • Higher customer expectations • Emerging contaminants (pharmaceuticals) • Increasing competition for raw water
sources

Water & Energy Efficiency
Becoming water and energy efficient provides a
wide range of benefits—for utilities, consumers,
businesses and the community as a whole.
Using less water means moving and
treating less water, reducing the strain on
our water supplies, drinking water and
wastewater infrastructure.

Energy Use
Source: US Geological Survey 2005

What Can the Water Supplier Do?
System owners and operators can pursue
best industry practices for water efficiency,
such as:
– System-wide water loss accounting
– Leak detection and repair
–Benchmark energy consumption

Grant History
In February 2012 the U.S. Department of Energy (DOE)
issued a competitive funding opportunity announcement
(FOA) to states to advance policies, programs, and market
strategies that accelerate job creation and reduce energy
bills while achieving energy and climate security for the
nation.
The focus : To advance Energy Efficiency in Public
Facilities to assist states to develop holistic, whole-
building, deep retrofit programs and strategies
across as broad a segment of public facilities as
possible to achieve significant energy and cost
savings.

Pumps in Water & Wastewater
• Water Distribution Pumps
– Booster Station:
700 – 1,200 kWh/MG
– Well Pumps:
1,000 – 1,800 kWh/MG
• Waste Water Treatment Plants
– System:
1,000 – 3,500 kWh/MG
Pumps in Water
& Wastewater
facilities account
for (1/7) of Arizona
state energy
consumption

Water Energy Nexus
The EPA estimated that on average, 2 gallons
of water are lost to evaporation for each kWh
consumed at the point of end use This number
varies state by state, depending on the energy-
mix. In Arizona, for example, 7.85 gallons of
water are lost to evaporation per kWh
consumed.

Arizona Facts
• 6th Largest State • 15 Counties • 30 State Parks • 20 Native
American Tribes

Arizona Utility Map

WEAP Goals
Determine where Arizona stands with respect to
per capita energy consumption compared to the
best plants, and how to make facility more energy
efficient and save water.
Goal #1 – Benchmarking 100 water & wastewater
facilities in Arizona
Goal #2 – Determine possible savings potential
Goal #3 – Recommend & assist in implementation solutions
to reduce energy costs

Water Energy Partnership in Arizona Activities
INVESTIGATION
- Facility Identification
-Benchmarking
- Education/Training
TECHNICAL ASSISTANCE
- Needs Assessment
- Funding Options
-Education/Training
IMPLEMENTATION
- Project Upgrades
- Education/Training
Coordination/Collaboration

Starting Point
We are not the water experts - seek assistance!

Who are the Experts
• State Agencies
• Federal Agencies
• Utility Companies
• Design, Manufacturing & Engineering
Companies
• Energy Service Companies
• Professional Organizations
Train Staff


Why Coordination and Collaboration?
Energy issues are here to stay and will only get
more serious—no quick fixes!
• Individual projects and technologies are fine, but something is
needed to pull it all together (a process)
• Systematic process will provide a focus on energy
efficiency
• Reduce operating costs
• Financial savings can be reinvested back into system
• Less pressure on resources
• Less strain on current energy grid
Create Resource Teams Develop teams to assist facilities as they provide
information to elected officials and the general
public.

Keys to Successful Communication

Grant Application Partners
State:
Arizona Department of Environmental Quality
Water Infrastructure Finance Authority
Federal:
U.S. Department of Agriculture Rural
Development
Private:
Arizona Public Service
Honeywell
Lincus Energy
Rural Community Assistance Corporation

Current Partners State: AZ Department of Environmental Quality, Water Infrastructure
Finance Authority, AZ Department of Water Resources, AZ
State Parks, AZ Department of Transportation
Federal: USDA Rural Development, EPA, U.S. Bureau of
Reclamation
Utility: Arizona Public Service, Unisource, Salt River Project,
Sulphur Springs, AZ Electric Power Cooperative, Mohave
Electric Co-op
Private: Honeywell, Lincus Energy, AMERSCO, TRANE, NCS
Engineering, Chelsea Group, Border Environment Cooperation
Commission (BECC)
Professional Organizations: AZ Planning Association, AZ Water
Association, Rural Water Association, AZ Co-op Association

Successful Partnerships
Formed around specific issues or areas of concern
• Take time
• Understanding of the partner organizations
goals/mission
• On-going communication

Challenge

Thank You
Lisa Henderson Arizona Governor’s Office of Energy Policy Community Energy Program Manager 1700 W. Washington Phoenix, AZ 602 771-1134 [email protected]

56
Peter V. Cavagnaro, P.E., BCEE
Johnson Controls, Inc.
Madelene Rafalko, P.E.
City of Fort Worth
City of Fort Worth
Village Creek
Water Reclamation Facility
Journey towards Net Zero Energy
September 11, 2013

57
Outline
• Overview
• Project Description
• Technology
• Project Drivers
• The State Energy Conservation Office
• Performance Contracting (ESPC)
• Financing
• Savings & Payback

58
Overview
• Village Creek Water Reclamation Facility
– Fort Worth, Texas
– Service area 450 square miles
– 166 MGD permitted capacity
– Regional facility serving more than 1 million
people in 22 entities
– One of the nation’s fastest growing cities

5
9
59
Project Description
FIM #3A: Codigestion
FIM #4: SCADA System
FIM #6E: HVAC
Improvements
FIM #6D:
Pump Operation
Improvements
FIM #6H:
Power
Factor
Correction
FIM #1:
Aeration Diffusers
FIM #5: Anoxic Zones FIM #6A: Aeration
Control Improvements
FIM #2: Heat
Recovery
FIM #3B: Linear
Motion Mixers

AERATION
BASINS AB 1-
AB6 AERATION
BASINS AB 9-
AB13
Technologies Used
REPLACED 65,752 DIFFUSERS IN 13 AERATION BASINS

Dedicated High Strength
Waste Receiving Facility:
• Truck unloading pad
• 30,000 gal mix tank
• Two 8,000 gal batch tanks
• Recirculation, transfer and feed
pumps (six total)
• PLC control feeds each digester
once/hour
• Receiving up to 9 x 6,000 gal
trucks / day
Six digesters cleaned, and
new mixers installed
VCWRF Co-Digestion System
61 Photo courtesy of Freese & Nichols, Inc.

Heat Recovery Steam
Generator (HRSG) on turbine
exhaust generates steam
62
Waste Heat Recovery
Duct burner uses biogas to
boost the temperature and
produce steam that powers two
steam turbines
Waste Heat Recovery
Duct Burner

Steam Turbine Powered Blowers
63
2 unused 1200 HP 31,000 cfm blowers
Rehabilitated and equipped with steam turbine drivers

Anoxic Zones & Nitrate Rich Recycle
64

SCADA System Replacement
Project included the replacement of the existing Johnson
Yokogawa SCADA system with a new Emerson Ovation
SCADA Distributed Control System
65

66
Project Drivers
• City wide effort to comply with Texas State
Legislation to improve air quality by
conserving electricity
– Federal Clean Air Act
– Texas Emission Reduction Plan
• Village Creek project is phase V of city’s
seven phase program to reduce annual
electric consumption by 5% per year

67
Internal Project Drivers
Water, 31%
Wastewater, 16%
Other, 53%
2007 City of Fort Worth Energy Consumption
The Fort Lewis Water Department has been a major consumer of electricity

Compelling Event
• Recognition that energy savings could be
used as an alternative source of project
funding
• An existing Energy Savings Performance
Contract (ESPC) that had been used to
develop and implement energy projects
throughout the city
68

Instrumental to Fort Worth in implementing
conservation efforts through
• Technical Assistance – SECO assisted Fort Worth with the “how to” of
Conservation Projects to help start the program in 2001
• Financial Assistance
– SECO provided $10 million in low-interest
loans for phases one through three
The Texas
State Energy Conservation Office
(SECO)

Performance Contracting
• Alternate Procurement Mechanism
• Regulated by State Government Code 302
– Requires guaranteed savings through
• Cost-effective energy conservation
• Operations and maintenance savings
– Requires an independent third party review of
projected savings
• Single point of responsibility by the Energy
Services Company (ESCO)

Energy Conservation Program
Financing • Energy Savings Performance Contract
– > $59-million contract over 7-phases (2003 - 2013)
– Secured approximately $900K in utility rebates
• Over $10-million from SECO
• $5.2-million EECBG Department of Energy Grant
• $16-million Capital Funding
• $27-million Municipal Leases
72
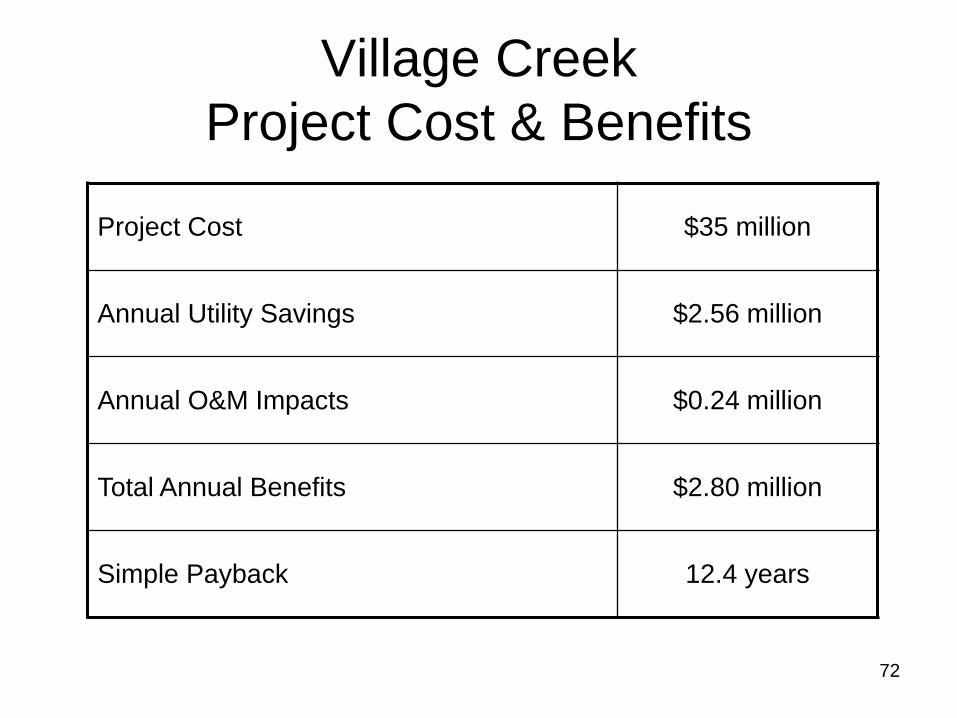
Village Creek
Project Cost & Benefits
Project Cost $35 million
Annual Utility Savings $2.56 million
Annual O&M Impacts $0.24 million
Total Annual Benefits $2.80 million
Simple Payback 12.4 years

73
Village Creek Progress to Net Zero
Energy
Total Electric Consumption
• 240,000 kWh per day
With 5 MW on-site generation
• Reduced to 150,000 kWh
Reclaiming Waste Heat
• Reduces to 110,000 kWh
Energy Conservation
• Reduces to 35,000 kWh

74
Project Contributors
And Others

75
Thank You
Peter V. Cavagnaro, P.E., BCEE
Johnson Controls, Inc.
734-255-5523 [email protected]
Madelene Rafalko, P.E
City of Fort Worth
817-392-8215 [email protected]


92
Questions?
Lisa Henderson
Governor's Office of Energy Policy
Community Energy Program
Manager
602.771.1134
Fax: 602.771.1203
[email protected] cell at 602 903-8211
Barry Liner, Ph.D., P.E.
Director, Water Science & Engineering
Center
Water Environment Federation
WEF601 Wythe Street
Alexandria, VA 22314
703-684-2435 (office)
703-727-8781 (mobile)
Madelene Rafalko, P.E.
Senior Professional Engineer (project manager)
City of Fort Worth, TX
Water Department
817-392-8215 desk
817-991-8098 cell
Peter V. Cavagnaro, P.E., BCEE
Project Development Consultant - Water
Johnson Controls, Inc.
2444 Placid Way
Ann Arbor, MI 48105
work cell: 734-255-5523
Joe Gierlach
Mayor of the Town of Nederland, Colorado
www.nederlandco.org 303-275-7467