the effects of peer-to-peer (p2p) lending on competition
TRANSCRIPT

1
The Effects of Peer-to-Peer (P2P) Lending on Competition, Discrimination, and Financial
Stability
Michael S. Padhi1
Department of Finance
Robert H. Smith School of Business
University of Maryland
4458 Van Munching Hall
College Park, MD 20742
First Draft: July 15, 2017
Revised: October 31, 2017
1 DataLab USA and Equifax generously supplied to me the average credit data aggregated at the zip-code level, which
were critical to this study.

2
The Effects of Peer-to-Peer (P2P) Lending on Competition, Discrimination, and Financial
Stability
Abstract
Using loan application and origination data reported by the largest peer-to-peer (P2P) lender, Lending
Club, I test whether P2P lending expands access to credit for households and small businesses,
whether its lending criteria has a disparate impact on communities based on race, and how competition
with P2P lenders may make banks’ loan portfolios riskier. I find strong support for the expansion of
credit by P2P lending by mitigating lack of competition due to a concentrated banking market. I find
some support for expansion of credit by overcoming discrimination in terms of approvals for
applicants in areas with more black residents. However, I also find striking evidence of the P2P lender
assigning lower loan ratings (higher interest rates) to approved borrowers living in areas with more
black residents. I also find that competition from P2P lenders could leave a riskier pool of potential
borrowers for banks, thus threatening financial stability. An important control in these tests are the
average credit attributes aggregated over the same areas in which bank structure, income, and
demographic variables are constructed.

3
1. Introduction
Peer-to-Peer (P2P) lending is a new source of credit that is based on financial technology (FinTech)
that combines algorithms to assess credit risk and the internet to match borrowers and investors. The
intermediary, the P2P lender, receives loan applications, assesses risk, offers the loan to applicants,
seeks funding from investors, and services the loan. If no investor funds the loan within a period of
time, then the loan is not originated. This innovation in lending has the promise of expanding access
to credit to households and small businesses as an alternative to traditional banks and finance
companies. The two largest P2P lenders in the U.S., Lending Club and Prosper, originated $10 billion
in loans in 2015 and doubled its annual originations every year since their start in 2007 (U. S.
Department of Treasury 2016, p. 11).
The novelty and rapid growth of P2P lending has raised serious questions about its benefits and costs.
This study addresses some of these questions with individual loan data made publicly available by the
largest P2P lender in the United States, Lending Club. The characteristics of these loans at the time
of application and at origination are analyzed in the context of the traditional banking system. First,
I test the hypothesis that P2P lending expands access to credit by making credit available in greater
quantity and at lower cost in concentrated banking markets and high minority areas, where credit is
more likely to be restricted because of factors other than the risk and demand of potential borrowers.
Second, I test the hypothesis that P2P lending criteria effectively discriminates against applicants who
live in high minority areas (“redlining”), which is contrary to the first hypothesis of expanding credit.
Third, I test the hypothesis that P2P lending threatens financial stability via “cherry picking” the best
borrowers in an area, leaving a riskier pool for banks to lend to and thus increase the credit risk of
banks’ loan portfolios.
While the promise of expanded access to credit is the major potential benefit of P2P lending cited in
policymaker reports, the same reports also raise fair lending and financial stability concerns (e.g., U.S.

4
Department of Treasury 2016, Bank of International Settlements Financial Stability Board 2017). The
fair lending concern arises because P2P lenders are not subject to the regulations on depository
institutions, and therefore P2P lending may have a disparate impact based on race that would more
likely be detected and prevented in bank lending. A recent Wall Street Journal article documented in
“Online Finance’s Uses of Geography is a Grey Area” that P2P loan investors directly use geography
in their models of loan performance when they fund loans (Dugan and Demos 2016). However,
avoiding lending to a person or business in an area because the average default rate is high without
regard to the individual merits of the potential borrower (redlining) is strictly forbidden for banks,
particularly under the Community Reinvestment Act of 1977. One such investor in The Wall Street
Journal article even wrote a blog article entitled “The Joy of Redlining”. This is particularly
troublesome because the redlined areas often have high minority populations. Whereas investors
admit to using geography in making their funding decisions, how the P2P lender may use geography
is not known. Lending Club only generally describes its proprietary models as using “economic” and
“other” variables without directly stating it uses geography even though it does collect the geographic
data of its borrowers (LendingClub Corporation 2017). Lending Club may use geography directly in
its models for approving and rating loans; its models may also be indirectly influenced by geography
as they are responsive to the willingness of investors to fund loans in certain areas. Lending Club does
acknowledge that pricing for a given loan rating is influenced by investor demand for certain types of
loans.
By competing with depository institutions, P2P lenders could also cause banks to take on more risk
and thus threaten systemic risk since banks are financed with deposits, are connected to each other,
and still are the major component of the financial system. The Office of Comptroller of the Currency,
the United States’ national bank regulator, included P2P lenders in its spring 2017 risk assessment of
banks. Whereas P2P loans are sold off to investors who can hold diversified portfolios, banks by their

5
nature do hold loans on their balance sheets and are financed with leverage (deposits). The P2P lender
can be more nimble in where it lends, whereas banks are required by the Community Reinvestment
Act to lend in the same communities where they take deposits (Kessler 2016). So, if loans become
riskier, the P2P lender can more easily shift where it lends. The consequences of the source of funds
differ, too. The share of P2P loans in an investor’s diversified portfolio is small, whereas a higher
than expected rate of defaults could erode a significant enough amount of a bank’s capital to trigger a
failure of an entire bank and threaten other banks through contagion.
The existing literature is rich on the special role of banks in lending to households and small
businesses, the structure and competition of banking markets, discrimination in bank lending, and
whether there is a relationship between bank competition and financial stability. The purpose of this
study is to fit understanding of P2P lending into this existing literature on traditional banking.
Therefore, I combine local banking, income, demographic, and credit data with Lending Club’s public
dataset on all of its loan applications and approved loans. All data are for 2013. With these data, I
run regression models of application rates by local area, average credit risk of applications by local
area, approvals of individual applications, and P2P loan rating (“grade”). These regressions are used
to test whether P2P lending expands access to credit (Expansion of Credit Hypothesis),
perpetuates/reinstitutes redlining (Redlining Hypothesis), and threatens financial stability (Financial
Instability Hypothesis). I test all of these hypotheses by controlling for individual level variables of
applications and approved loans as well as the average credit risk of the areas in which the
applicants/borrowers live.
I conclude that P2P lending expands access to credit where bank concentration is great and
competition is therefore likely to be low. This expansion of credit is evidenced by higher application

6
rates, lower credit risk of applications, higher approval rates, and better loan credit ratings where bank
concentration is higher.
The results are mixed with regard to racial and ethnic composition of the local area. Application rates
and average credit quality increase with the Hispanic population, and approval rates increase with the
black population, all of which support the hypothesis that P2P loans supply a need for credit in areas
that are more likely to have experienced discrimination. Furthermore, these findings show that the
P2P lender does not discriminate against these areas in terms of marketing and approving applications.
On the other hand, borrowers receive worse loan ratings (“grades”) the greater the size of the black
population of the area in which they live, supporting the hypothesis that the P2P lender “redlines” in
the form of higher interest rates in areas with more black residents.
I also find support for the view that P2P lenders disproportionately receive applications and make
loans where the remaining pool of potential borrowers are riskier than elsewhere. Applications are
more likely to come from areas with greater average credit risk, and applications’ credit risk is better
than their areas’ average credit risk. Approvals are more likely to be made in areas where the average
credit risk is worse. I conclude from these results that P2P lenders do “cherry pick” the best loans in
areas where the remaining pool has greater average credit risk, making the portfolio of banks’ loans
riskier. On the other hand, the pricing of P2P loans are less competitive (receive worse loan ratings
and higher interest rates) where the average credit risk is greater, which tempers the amount of
competition that P2P lenders could be providing against banks for good quality loans.
2. Literature Review
Households and small businesses traditionally and primarily depend on local banks for credit (Amel
and Star-McCluer 2001, Kwast, Star-McCluer, and Wolken 1997, Heitfield 1999). Because
information about their risks is not easily measured, they rely on qualifying for credit through

7
relationships with banks (Petersen and Rajan 1994). The relationship generates “soft information”
that enables the bank to assess risk and extend further credit. Soft information includes direct
knowledge of the character of the borrower, payment history on previous loans, and observation of
past cash flows via deposit accounts. Banks are able to develop this relationship by locating branches
geographically close to their customers. Therefore, standard theory on banking markets is that they
are local, typically defined as the metropolitan statistical area in the case of an urban market and as
one to three counties in the case of a rural market. Standard theory also defines the product market
of banks to be a cluster of services, e.g., various deposit accounts and loans. Therefore, market shares
in one product is indicative of the market shares of all the products in the market. In the U.S., a bank’s
market share is usually measured by the percentage of deposits collected by branch located within a
geographic banking market (Holder 1993).
Technology, however, can reduce households’ and small businesses’ reliance on local banks to access
credit (Petersen and Rajan 2002). For example, credit scoring allows a lender to measure the
probability of default of a potential borrower without a physical presence close to the borrower. By
using the “hard information” supplied by the borrower’s credit report, the lender can make a loan on
terms (i.e., loan amount, maturity, and interest rate) that are appropriate for the risk of the borrower.
Much empirical research has already provided evidence that credit scoring expands the access to credit
to borrowers who otherwise would depend on a local bank for financing. The application of credit
scoring models to small business lending has been found to increase the amount of banks’ total small
business loan portfolios (Frame, Srinivasan, and Woosley 2001) and the likelihood and amount of
lending outside of the local banking markets where the banks have branches (Frame, Padhi, and
Woosley 2004, Berger, Frame, and Miller 2005).

8
More recent innovations have built on credit scoring. The internet allows for borrowers to more easily
apply for loans from lenders who use credit scoring models to make approval decisions (“online
lending”). Peer-to-peer (P2P) lending is a type of online lending with the difference that the lender
primarily finances the loans by investors funding the loan also via the internet. Since the public are
invited to invest in individual loans, a great amount of information on the borrowers are made public,
allowing the market to determine which loans get funded at particular interest rates. Research on P2P
lenders’ impact on the traditional banking market is very nascent.
Access to credit in certain banking markets may be particularly constrained due to lack of competition
among banks, which is usually measured with the deposit Hirschman-Herfindahl Index (HHI).
According to the structure-conduct-performance theory in industrial organization, the degree of
market power possessed by firms in a market enables them to maximize profits by reducing supply
and thus raising the market price. Studies have found support for a negative relationship between a
local area’s HHI and deposit rates (Heitfield and Prager, 2004).
Discrimination based on race or ethnicity may also restrict access to credit. Discrimination could be
in the form of either denying credit or lending at more adverse terms (like higher interest rate) explicitly
because of the race or ethnicity of the person seeking credit. Good research into discrimination
attempt to control for legitimate variables such as risk. Boehm, Thistle, and Schlottmann (2006) and
Courchane and Nickerson (1997) find that blacks pay higher mortgage rates than whites. Black,
Boehm, and DeGennaro (2003) find that after controlling for bargaining, the difference in mortgage
rates paid by blacks and whites disappear, but Hispanics do pay higher rates. Crawford and Rosenblatt
(1999), Duca and Rosenthal (1994), and Getter (2006), on the other hand, do not find evidence of
racial discrimination in mortgage rates. Bostic and Lampani (1999) find evidence of higher denial
rates of black applicants for small business loans. P2P lending and other forms of distance lending

9
could solve the problem of racial discrimination against a borrower since race cannot be observed by
the P2P lender or investor.
However, discrimination by lenders including P2P lenders could also be in the form of redlining,
which is the deliberate refusal to make loans in geographic areas regardless of the creditworthiness of
an individual loan applicant. These redlined areas, even if avoided due to higher average past default
rates, are usually characterized by high minority populations. Many studies claim that redlining has
been practiced by banks in mortgage lending (e.g., Munnell, Tootell, Browne, and McEneaney 1996,
Ladd 1998, Lacour-Little 1999, Ross 2006). Cohen-Cole (2011) provides evidence of redlining in
credit cards. Though most redlining studies focus on loan approvals, there have been recent studies
that indicate that attention also should be brought to the cost of approved loans based on the
geographic racial composition. Kau, Keenan, and Munneke (2012) find that borrowers in
predominantly black neighborhoods pay higher mortgage rates after controlling for subsequent
performance of those loans. Nothaft and Perry (2002) find that borrowers in predominantly Hispanic
neighborhoods pay higher mortgage rates. Other studies find evidence that borrowers living in
predominantly minority areas pay higher rates on auto loans (Cohen 2007, Charles, Hurst, and
Stephens 2008) and on consumer loans generally (Edelberg 2007). However, Holmes and Horvitz
(1994) caution that studies on redlining must make sure to control for relevant variables such as risk
and demand for loans; they conclude much research into redlining prior to theirs fail to account
adequately for these variables.
Laws, particularly the Community Reinvestment Act of 1977, were passed to combat redlining by
depository institutions. However, whether P2P lenders counteract the remaining effects on
underserved areas due to a history of redlining or actually engage in it themselves redlining needs to

10
be researched, particularly because laws such as CRA do not apply to P2P lenders as they are not
depository institutions.
If P2P lending benefits households and small businesses by expanding access to credit, this
competition from P2P lenders may also adversely affect financial stability. There is already a debate
on whether competition within a banking market increases or decreases financial stability. One side
is the “competition-fragility” view that greater competition (less concentration) causes banks to suffer
from a smaller buffer against adverse shocks via lower profits and induce them to take more risk (Allen
and Gale 2004). The other side is the “competition-stability” view that greater competition reduces
interest rates, which makes borrowers less likely to default (Caminal and Matutes 2002) and increases
the pool of better quality borrowers (Boyd and De Nicoló 2005). Berger, Klapper, and Turk-Ariss
(2008) find support for both views, that competition increases the overall risk-exposure of banks while
decreasing banks’ loan portfolio risk. With regard to P2P lenders, there is also the question of whether
P2P lending and its growth could threaten financial stability by forcing banks to make riskier loans.
There is very little existing research to answer this outstanding question.
3. Data
Data supplied by Lending Club are matched with average credit, income, demographic, and banking
data aggregated by zip code. Lending Club only makes its loan data available at the three-digit zip
code level. Therefore, the geographic data are aggregated to the three-digit zip code level even though
they are made available at smaller zip code levels by some data sources. The attributes by the sources
are explained below.
3.1 Lending Club Data
Lending Club makes available two datasets. The first is its approved loans that includes information
on the borrower’s characteristics at the time of origination, the loan terms, and subsequent loan

11
performance. The approved loan file includes credit score and numerous credit bureau attributes such
as financial inquiries and length of credit history, debt payment to income percentage, loan application
purpose descriptor fields, three-digit zip code, length of employment, type of employment, annual
income, and homeownership. The second file contains its denied loans that includes less fields on
the applicant’s characteristics than the approved loan dataset, but nevertheless includes credit score,
debt payment to income percentage, loan application title, three-digit zip code, and length of
employment. In this study, loans applied for and originated in 2013 are used.
3.2 Equifax Aggregated Credit Data
Credit bureau attributes averaged at the nine-digit-zip code level are supplied by DataLab USA and
Equifax. The average attributes used in this study are total credit balances, number of revolving
bankcards, total installment loan balances, total balances that are delinquent, number of delinquent
revolving bankcards, and total installment loan balances that have derogatory items. The data are
provided as of June 30, 2013.
3.3 IRS Statistics of Income
The IRS provides total items from individual tax returns by five-digit-zip code. Total reported income
broken down by wages, social security, pension, and other retirement distributions are used as well as
total number of returns. The 2013 tax return data are used. The total balances data from the
aggregated credit data are divided by the total nonfinancial income (total income in exclusion of
dividends, interest, capital gains, and business income) to obtain the average debt balances to annual
income in a zip code.
3.4 Census 2010 Profile of General Population and Housing Characteristics

12
The Census Bureau supplies the total population, number of black residents, and number of Hispanic
residents in a “zip code tabulation area”, which is an approximation of a five-digit zip code. Since
Census population data are collected by Census-defined geographic areas (Census tracts and block
numbering areas) and not by zip code, the Census Bureau can only approximately aggregate population
by zip-code. These data collected in the 2010 Census are used to calculate the percent black population
and percent Hispanic population.
3.5 FDIC Summary of Deposits
Banks and thrifts are required to report their total deposits by branch to the FDIC as of June 30 of
every year to the FDIC. These data are reported in the FDIC’s Summary of Deposits. Deposits of
banks and thrifts as of June 30, 2013 are aggregated by three-digit zip code and used to construct
market shares per institution. Market shares are defined at the top institutional level of ownership
(bank or banking holding company). The market shares are used to calculate the Hirschman-
Hefindahl Index (HHI) by three-digit zip code to measure concentration in the banking market. Total
number of branches is also used.
Two concerns have to be addressed concerning the use of the three-digit zip code to define a banking
market. First, is the three-digit zip code a contiguous area? The U. S. Postal Service’s sorting central
facilities (level above the local post office) serve all post offices with zip codes having the same first
three digits. Therefore, it is likely that zip codes with the same first three digits are geographically
close and connected in order to facilitate efficient sorting of mail. Second, is the three-digit zip code
an appropriate approximation for a local banking market? While the government defines the local
banking market as an area smaller than the three-digit zip code, some research concludes that the
actual local banking market is larger. Radecki (2004) argues that the true local banking market is as
large as a state. Heitfield and Prager (2004) conclude that the true banking market is more local than

13
statewide but also not as local as the traditional geographic definition of the banking market as the
metropolitan statistical area for urban markets and the county for rural markets. Considering that
there are 50 states, 891 three-digit zip codes and 2,294 traditionally defined banking markets, the three
digit-zip code my actually approximate the intermediate size that Heitfield and Prager (2004) advocate.
So, even though the use of the three-digit zip code is driven primarily by a data limitation in this study,
there is some research that supports its use as a plausible approximation for the true banking market.
4. Hypotheses
I test three hypotheses about P2P lending: Expansion of Credit Hypothesis, Redlining Hypothesis,
and Financial Instability Hypothesis.
The Expansion of Credit Hypothesis says that households and small businesses have less access to
credit in more concentrated banking markets due to lack of competition or in higher minority areas
due to discrimination. Since they find difficulty accessing credit apart from their individual risk
characteristics, the Expansion of Credit Hypothesis predicts that application rates and the credit
quality of seekers and recipients of P2P loans are higher in these areas. U.S. banking antitrust policy
defines the geographic banking market to be local and the measure of market share to be the percent
of deposits held by local bank branches. Therefore, in highly concentrated banking markets, P2P
lending may ameliorate the lack of traditional banking competition. History of discrimination by
banks against minorities and people living in predominantly minority areas also present more
opportunities for P2P lending in such areas. The Expansion of Credit Hypothesis will be tested both
with respect to banking structure and to the size of the minority population.
The Redlining Hypothesis says that rather than expanding credit in high minority areas, P2P lending
actually perpetuates or reinstitutes redlining by using the zip code in the approval and credit rating
decision in a way that is adverse to areas with high minority populations. The geographic area of the

14
borrower may be used by the P2P lender in various ways. Most simply and straightforwardly, historical
default rates per zip code could enter into the approval and grading algorithms. The P2P lender may
also use local economic data to predict future default rates as well. Even if the P2P lender does not
intentionally redline, it would be of public interest if it systematically rewards or penalizes an applicant
or borrower because she lives in an area that has a high minority population.
The Financial Instability Hypothesis is a claim that competition from P2P lenders threaten the
financial stability of traditional banks by “cherry picking” borrowers with better credit, leaving a riskier
pool of potential borrowers for banks to lend to and causing banks’ loan portfolios to become riskier.
Note that these hypotheses are not mutually exclusive with the exception of the Redlining Hypothesis
and Expansion of Credit Hypothesis with regard to minority areas. These three hypotheses are tested
in regressions of application rates, application credit risk relative to the community, approvals, and
loan grade (credit rating) on individual borrower/loan variables and on area variables.
4.1 Application Rates and Relative Credit Risk
The hypotheses are first tested in regressions of application rates by area. The following regression is
estimated:
𝐴𝑃𝑃𝐿𝐼𝐶𝐴𝑇𝐼𝑂𝑁_𝑅𝐴𝑇𝐸𝑎
= 𝛿0 + 𝛿1𝑊𝐴𝐺𝐸𝑎 + 𝛿2𝑃𝐶_𝐵𝐿𝐴𝐶𝐾𝑎 + 𝛿3𝑃𝐶_𝐻𝐼𝑆𝑃𝐴𝑁𝐼𝐶𝑎 + 𝛿4𝐻𝐻𝐼𝑎
+ 𝛿5𝐵𝑅𝐴𝑁𝐶𝐻_𝐷𝐸𝑁𝑆𝐼𝑇𝑌𝑎 + 𝛿6𝐷𝐸𝐿𝐼𝑁𝑄_𝐼𝑁𝐷𝐸𝑋𝑎 + 𝛿7𝐷𝑇𝐼𝑎 + 휀𝑎
Each observation is on the area (three-digit zip code) level, a. The application rate, number of
applications divided by households, is the dependent variable. The explanatory variables are a
constant, average area wages (WAGEa), percent black (PC_BLACKa), percent Hispanic
(PC_HISPANICa), bank HHI (HHIa), number of bank branches per 100,000 households

15
(BRANCH_DENSITYa), an index of area delinquency on credit (DELINQ_INDEXa), and area debt
balances to income (DTIa). The Expansion of Credit Hypothesis would be supported by positive
coefficients on HHIa, PC_BLACKa, and PC_HISPANICa. The Redlining Hypothesis would not be
strongly accepted or rejected based on applications other than if applications are affected by marketing
by the P2P lender, in which case the coefficients on PC_BLACKa and PC_HISPANICa would be
negative.
To isolate what types of lenders within an area are applying for P2P loans, regressions of relative credit
risk are run on the area income, demographic, and banking variables. There are two measures of
relative risk, the difference in delinquency rates (REL_DELINQa) of applicants and of the area
average and the difference in the debt to income (REL_DTIa) of applicants and of the area average.
Details of how these two measures are constructed are provided in the relevant portion of the Results
section. The following regressions are run, where Relative Credit Riska represents either
REL_DELINQa or REL_DTIa:
𝑅𝑒𝑙𝑎𝑡𝑖𝑣𝑒 𝐶𝑟𝑒𝑑𝑖𝑡 𝑅𝑖𝑠𝑘𝑎
= 𝜌0 + 𝜌1𝑊𝐴𝐺𝐸𝑎 + 𝜌2𝑃𝐶_𝐵𝐿𝐴𝐶𝐾𝑎 + 𝜌3𝑃𝐶_𝐻𝐼𝑆𝑃𝐴𝑁𝐼𝐶𝑎 + 𝜌4𝐻𝐻𝐼𝑎
+ 𝜌5𝐵𝑅𝐴𝑁𝐶𝐻_𝐷𝐸𝑁𝑆𝐼𝑇𝑌𝑎 + 𝜗𝑎
According to the Expansion of Credit Hypothesis, bank concentration (lack of competition) and/or
discrimination limits access to credit. Therefore, the average credit risk of those seeking credit outside
of the local banking market are expected to be lower because they would have obtained credit in a
more competitive market. The coefficients on PC_BLACKa, PC_HISPANICa, and HHIa for both
relative credit risk dependent variables are expected to be negative. There are no predictions of the
Redlining Hypothesis for the relative credit risk regressions. According to the Financial Instability
Hypothesis, the credit risk of applicants are better than the average of their communities. The

16
constant (ρ0) for both relative credit risk regressions would be negative under the Financial Instability
Hypothesis.
4. 2 Loan Approvals
Next, the approval decision on applications are regressed on individual application variables and area
variables. The following logistic regression is estimated:
APPROVALi = f(SCOREi, SCORE_SQi, DTIi, DTI_SQi, EMP_YRSi, Purpose Dummiesi, WAGEa,
PC_BLACKa, PC_HISPANICa, HHIa, BRANCH_DENSITYa, DELINQ_INDEXa,
DTIa).
Each observation is an individual loan application i of a borrower who lives in the three-digit zip code
area a. APPROVALi has the value of 1 if the loan was made and 0 if the loan was denied. The
individual application variables are credit score (SCOREi), credit score squared (SCORE_SQi),
monthly debt payments excluding mortgage to income (DTIi), the individual debt-to-income squared
(DTI_SQi), the length of borrower’s employment in years (EMP_YRSi), and 13 dummy variables of
the purpose of loan like debt consolidation/refinancing, home improvement, and small business. I
use three fields supplied by Lending Club to construct the purpose variables: “purpose”, “description”
and “title”. I use key words to categorize loans rather than simply using the values supplied in the
“purpose” field. Therefore, an individual application may have more than one purpose dummy
variables with a value of one. For example, if an applicant states that she will use her loan to pay
medical bills and refinance credit card debt, then both the debt consolidation/refinance and medical
dummy variables would be assigned with a value of one. The excluded purpose variable is either
reported as “other” or not easily categorized. The area variables have the same meaning as in the
application rate regression.

17
The Expansion of Credit Hypothesis predicts that the coefficients on HHIa, PC_BLACKa, and
PC_HISPANICa would be positive, indicating that applicants living in areas where credit is
constrained apart from their own risk are more likely to qualify for loans. The Redlining Hypothesis
predicts the opposite signs on race and ethnicity: PC_BLACKa and PC_HISPANICa would have
negative signs as the lender denies loans from applicants living in higher minority areas at a greater
rate after controlling for applicants’ risk. The Financial Instability Hypothesis says that P2P lenders
are making loans in areas where the left-over borrowers are riskier. Therefore, the Financial Instability
Hypothesis predicts that the coefficients on SCOREi to be positive and DTIi to be negative while
coefficients on area credit risk variables DELINQ_INDEXa and DTIa to be positive.
4.3 Loan Credit Grade
The last regression tests the determinants on the grade assigned by the P2P lender on an approved
loan. The grade is important because the same interest rate is applied to the same grade at a given
time. The grade (LOAN_GRADEi), is assigned a number from 1 to 35, where 1 corresponds to the
best grade and therefore the lowest interest rate. It is regressed on the variables in the approval
regression plus more variables that Lending Club makes available for originated loans:
𝐿𝑂𝐴𝑁_𝐺𝑅𝐴𝐷𝐸𝑖
= 𝛽0 + 𝛽1𝐿𝑂𝐴𝑁_𝐴𝑀𝑇𝑖
+ 𝛽2𝐿𝑂𝐴𝑁_𝑀𝐴𝑇𝑈𝑅𝐼𝑇𝑌𝑖 + 𝛽3𝑆𝐶𝑂𝑅𝐸𝑖 + 𝛽4𝑆𝐶𝑂𝑅𝐸_𝑆𝑄𝑖 + 𝛽3𝐷𝑇𝐼𝑖 + 𝛽4𝐷𝑇𝐼_𝑆𝑄𝑖
+ 𝛽5𝐼𝑁𝑄𝑈𝑅𝐼𝐸𝑆𝑖 + 𝛽6𝑃𝑈𝑅𝑃𝑂𝑆𝐸_𝐷𝑈𝑀𝑀𝑀𝑌1𝑖 + ⋯
+ 𝛽18𝑃𝑈𝑅𝑃𝑂𝑆𝐸_𝐷𝑈𝑀𝑀𝑀𝑌13𝑖 + 𝛽19𝐸𝑀𝑃_𝑌𝑅𝑆𝑖 + 𝛽20𝐸𝑀𝑃_𝐷𝑈𝑀𝑀𝑌1𝑖 + ⋯
+ 𝛽34𝐸𝑀𝑃_𝐷𝑈𝑀𝑀𝑌15𝑖 + 𝛽35𝐼𝑁𝐶𝑂𝑀𝐸𝑖 + 𝛽36𝐿𝑂𝐴𝑁_𝑇𝑂_𝐼𝑁𝐶𝑖 + 𝛽37𝑅𝐸𝑁𝑇𝐸𝑅𝑖
+ 𝛽38𝐶𝑅𝐸𝐷𝐼𝑇_𝑌𝑅𝑆𝑖 + 𝛽39𝑊𝐴𝐺𝐸𝑆𝑎 + 𝛽40𝑃𝐶_𝐵𝐿𝐴𝐶𝐾𝑎 + 𝛽41𝑃𝐶_𝐻𝐼𝑆𝑃𝐴𝑁𝐼𝐶𝑎
+ 𝛽42𝐻𝐻𝐼𝑎 + 𝛽43𝐵𝑅𝐴𝑁𝐶𝐻_𝐷𝐸𝑁𝑆𝐼𝑇𝑌𝑎 + 𝛽44𝐷𝐸𝐿𝐼𝑁𝑄_𝐼𝑁𝐷𝐸𝑋𝑎 + 𝛽45𝐷𝑇𝐼𝑎 + 𝜑𝑖

18
Each observation corresponds to an individual loan i made to a borrower living in an area a. The
additional variables used in this regression are 15 employment title dummy variables
(EMP_DUMMY1…EMP_DUMMY15), annual income (INCOMEi), P2P loan to income ratio
(LOAN_TO_INCi), renter dummy variable (RENTERi), and length of oldest credit account on the
credit report (CREDIT_YRSi). I constructed the employment dummy variables by keywords in the
employment title field supplied by Lending Club, which mostly have no values and can either be a job
title or an employer name. For example, the employment dummy variable for banker would receive
a value of one if the employment title field has values such as “bank teller” or “Bank of America”.
According to the Expansion of Credit Hypothesis, the coefficients on PC_BLACKa, PC_HISPANICa,
and HHIa should be negative since a lower grade corresponds to a better rating and lower interest rate.
According to the Redlining Hypothesis, the coefficients on PC_BLACKa and PC_HISPANICa should
be positive, indicating worse credit rating and therefore higher interest rates in higher minority
population areas. According to the Financial Instability Hypothesis, the coefficients on
DELINQ_INDEXa and DTIa should be negative, indicating that loans are made with more
competitive terms (lower interest rates) where the average pool of borrowers to whom banks can lend
is riskier.
5. Results
5. 1 Applications
The demand for P2P loans are primarily measured by the number of loan applications within a three-
digit zip code. Demand is also measured by the relative credit risk of P2P applicants based on the
idea that average credit quality should be greater where demand for alternative sources of credit is
greater. These measures of demand are regressed on area level variables measuring income, banking

19
market characteristics, race, ethnicity, and credit risk. (Credit risk is only an explanatory variable in
the regressions where loan applications per capita is the independent variable.)
5.1.1 Three-Digit Zip Code Area Variables Description
There are 818 three-digit zip code areas for which there are data across all data sources. Univariate
summary statistics of variables at the three-digit-zip code level are presented in Table 1.
Table 1
Area Variable Univariate Statistics
N Mean St. Dev. Min Median Max Application Rate (%)
(APPLICATION_RATEa) 818 0.65382 0.168694 0.014971 0.642904 2 Avg. Application Credit Score
(SCOREi) 818 648.8151 10.94703 568.0157 649.7066 680.5623 Avg. Application Debt
Payment to Income (%) (DTIi) 818 171.7657 1150.766 12.81982 66.00505 22617.43
Number of Applications 818 1093.185 1268.807 15 637 9316
Number of Tax Returns 818 168121.5 181114.7 3200 101170 1341210
Area Wages (WAGEa) 818 40558.52 14225.81 19543.29 36982.84 214563.7 % Population Black
(PC_BLACKa) 818 10.77057 12.29431 0.315372 5.42505 70.33195 % Population Hispanic
(PC_HISPANICa) 818 11.72097 14.086 0.482051 5.936202 89.8226
% Total Balances Delinquent 818 0.729046 0.342067 0.077812 0.704241 2.351427 % Number Credit Cards
Delinquent 818 3.99086 1.066565 1.65735 3.832622 9.429213 % Installment Balances with
Derogatory Item 818 0.986441 0.402289 0.268522 0.932918 3.349414
Area Debt to Income (DTIa) 818 1.439939 0.334188 0.486287 1.393045 2.612821
Bank HHI (HHIa) 818 1519.95 1086.441 335.1245 1241.546 9381.662 Branches Per Capita
(BRANCH_DENSITYa) 818 79.11954 31.28871 16.59751 73.89739 296.4254
The average number of applications per three-digit zip code for a loan from Lending Club was 1,093,
and the average application rate (number of applications / number of tax returns) was 0.65%. There
is a high amount of variation across areas in terms of average wages, racial and ethnic composition,

20
delinquency rates, debt to income ratios, bank HHI, and branches per 100,000 residents (“Branches
Per Capita”). (As a point of reference for the bank HHI statistics, a banking market with an HHI less
than 1,000 is un-concentrated, between 1,000 and 1,800 is moderately concentrated, and greater than
1,800 is highly concentrated according to the U.S. Department of Justice’s Bank Merger Guidelines.)
Correlations among these variables are presented in Table 2.
Table 2
Area Variable Correlations
5.1.2 Application Rate Regressions
The number of applications for loans to Lending Club in 2013 as a percent of personal tax returns in
a 3-digit zip code area is significantly greater where the concentration of bank deposits (HHIa) is
greater after controlling for the number of bank branches and average wage income. Regression
results prior to controlling for average credit risk, shown in Column (1) of Table 3, support the
App. Rate
(%)
Avg. App.
Credit
Score
Avg. App.
Debt
Payment
to Income
(%)
Number of
App.s
Number of
Tax
Returns
Area
Wages
% Pop.
Black
% Pop.
Hispanic
% Total
Balances
Delinquent
% Number
Credit
Cards
Delinquent
% Instal.
Balances
with
Derog.
Item
Area Debt
to IncomeBank HHI
Branches
Per
Capita
App. Rate (%)1.00
Avg. App.
Credit Score0.17 1.00
Avg. App. Debt
Payment to
Income (%)0.00 0.01 1.00
Number of
App.s 0.14 0.02 0.03 1.00
Number of Tax
Returns -0.02 -0.01 0.02 0.97 1.00
Area Wages -0.05 0.25 -0.02 0.23 0.26 1.00
% Pop. Black 0.14 -0.58 0.03 0.23 0.20 -0.03 1.00
% Pop.
Hispanic 0.17 0.10 -0.03 0.33 0.29 0.05 -0.01 1.00
% Total
Balances
Delinquent 0.17 -0.52 0.01 -0.20 -0.22 -0.51 0.29 -0.06 1.00
% Number
Credit Cards
Delinquent 0.35 -0.59 0.00 0.13 0.06 -0.40 0.66 0.20 0.65 1.00
% Instal.
Balances with
Derog. Item 0.16 -0.55 0.01 0.18 0.16 -0.35 0.66 0.13 0.54 0.80 1.00
Area Debt to
Income 0.07 0.29 0.02 0.28 0.26 0.15 -0.02 0.29 -0.66 -0.13 -0.18 1.00
Bank HHI 0.14 0.02 -0.01 -0.06 -0.07 0.16 0.11 0.04 -0.03 0.07 0.09 0.03 1.00
Branches Per
Capita -0.06 0.09 -0.01 -0.44 -0.43 -0.18 -0.29 -0.33 0.18 -0.20 -0.24 -0.41 -0.14 1.00

21
hypothesis that more concentrated banking markets reduce the access to credit and that individuals in
these markets are therefore more likely to turn to P2P lenders for loans.
Table 3
Application Rate OLS Regression Results
Coefficient Estimates (Standard Errors)
Explanatory Variable Without Area Credit Quality Variables
(1)
With Area Credit Quality Variables
(2)
WAGEa -7.95e-07* (4.13e-07)
1.68e-06*** (5.04e-07)
PC_BLACKa .0019422*** (.0004911)
-.0011377* (.000614)
PC_HISPANICa .0021854*** (.0004311)
.0009381** (.0004425)
HHIa .0000217*** (5.37e-06)
.0000209*** (5.16e-06)
BRANCH_DENISITYa .0002587 (.0002068)
.0007298*** (.0002171)
DELINQ_INDEXa .0031742*** (.0003872)
DTIa .1287421*** (.0221684)
Constant .5860923*** (.0301253)
.1498974*** (.0637115)
Observations 818 818 R-Squared 0.0715 0.1450 Adjusted R-Squared 0.0658 0.1376
Note: The dependent variable, APPLICATION_RATEa, and all explanatory variables are aggregated at the three-
digit zip code level a. *, **, and *** denote statistical significance at the 10%, 5%, and 1% levels, respectively.
The number of applications is also significantly greater where the sizes of the black (PC_BLACKa)
and Hispanic (PC_HISPANICa) populations are greater, which is consistent with minorities or
individuals living in high minority areas seeking loans from P2P lenders because of reduced access to
credit. Therefore, prior to controlling for the average credit risk of the area, the Expansion of Credit
Hypothesis with regard to both competition and racial/ethnic discrimination is supported and the
Redlining Hypothesis is not supported.

22
An important omitted characteristic from the regression of Column (1) of Table 3 is the average credit
risk of these areas. This omitted variable problem is frequent in studies attempting to relate average
geographic characteristics with lending decisions (Holmes and Horvitz 1994). Average credit risk may
be correlated with bank concentration and racial/ethnic composition. Indeed, Table 2 shows that the
percent black has correlations of 0.66 with both percent of credit card cards delinquent and percent
of installment balances with derogatory items. Two control variables are therefore added to the
regression, and its results are reported in Column (2) of Table 3. These credit risk variables are the
average debt balances to income ratio for the area (DTIa) and an index of average delinquency rates
for the area (DELINQ_INDEXa). The average delinquency rate is measured as an index, constructed
by taking the average of the percentiles of the three delinquency variables (percent total balances
delinquent, percent number of credit cards delinquent, and percent installment balances with
derogatory items). This index was constructed in this way to have a single measure of delinquency
rates for an area and to allow for an equal weighting of the three measures.
These area credit risk variables are very significant, and they more than double the explanatory power
of the regression. The application rate for P2P loans is significantly greater in markets with high
delinquency rates and high total debt balances to annual income. The significantly positive
relationship with bank concentration (HHIa) is robust to inclusion of these average credit variables.
However, the coefficient on the percent black variable (PC_BLACKa) becomes insignificant at the 5%
level (p = 0.064) and switches sign; and the coefficient on the percent Hispanic variables’ coefficient
(PC_HISPANICa) decreases, and its significance level decreases from the 1% level to the 5% level.
Therefore, ethnicity still does have a relationship - though diminished - to the application rate for P2P
loans, and race does not have a significant relationship after controlling for average credit quality.

23
5.1.3 Relative Credit Risk Regressions
If individuals seek P2P loans in part because the banking market is less competitive and/or because
of discrimination against minorities, then the credit risk of those applying for P2P loans relative to
that of the area average should be lower. In other words, where rationing of credit is high, the relative
credit risk of the rationed individuals ought to be less than where credit rationing is low. To test this,
two dependent variables were constructed based on the data that are available to me.
Whereas the average total debt balances to income is available on the community level, only the debt
payments to income is available on the P2P loan application level. Therefore, I subtract community
debt balance to income percentile from the loan application debt payment to income percentile to obtain
the Relative Debt to Income dependent variable. This is regressed on the income, racial/ethnic, and
banking variables. The results, presented in Column (1) of Table 4, show that the debt to income
levels of P2P applicants are lower than their communities’ average where the banking market is more
concentrated, thus supporting the Expansion of Credit Hypothesis with regard to bank concentration.
Table 4
Relative Average Credit Risk OLS Regression Results
Coefficient Estimates (Standard Errors)
Explanatory Variable Dependent Variable: REL_DTIa
(1)
Dependent Variable: REL_DELINQa
(2)
WAGEa -.000185* (.0000949)
.0002654*** (.0000462)
PC_BLACKa .6285594*** (.1127502)
.3092189*** (.0548607)
PC_HISPANICa -.1413567 (.0989831)
-.3917443*** (.0481621)
HHIa -.0041287*** (.0012327)
-.0011514* (.0005998)
BRANCH_DENISITYa .1832559*** (.0474852)
-.0198553 (.0231048)
Constant -6.396662 -8.001453**

24
(6.916434) (3.365319)
Observations 818 818 R-Squared 0.0776 0.1454 Adjusted R-Squared 0.0719 0.1401
Note: Both dependent variables and all explanatory variables are aggregated at the three-digit zip code level a. *,
**, and *** denote statistical significance at the 10%, 5%, and 1% levels, respectively.
Furthermore, the relative debt to income level is lower where there are fewer branches, indicating that
debt to income levels of P2P applicants are lower where the supply of traditional banking services are
less. With regard to race and ethnicity, however, the results in Column (1) of Table 4 do not support
the Expansion of Credit Hypothesis with regard to discrimination being a cause for reduction in access
to credit: The debt to income levels of P2P applicants are significantly higher in communities with a
greater black population and are insignificant with regard to the Hispanic population. The
insignificant constant term of the relative debt to income regression does not support the Financial
Instability Hypothesis.
For the other average relative credit risk regression, I construct the dependent variable as follows.
Since a credit score corresponds to the likelihood of default, I standardize the average credit score of
loan applicants within the same three-digit zip code to 100 minus the credit score percentile. Next, I
subtract the area delinquency index, DELINQ_INDEXa to create the Relative Delinquency
dependent variable (REL_DELINQa), which is regressed on the income, racial/ethnic, and banking
variables. This variable reflects the difference in delinquency rates, though the measurement period
differs: The P2P applicant’s inverse of the credit score is a forecasted measure of future delinquency
likelihood, and the area’s DELINQ_INDEXa is a backward-looking measure of past delinquencies.
The results of this regression are presented in Column (2) of Table 4. The relative rate of delinquency
is only weakly lesser the greater the banking market concentration (p = 0.055). The presence of bank
branches is not significantly related to relative delinquency. Like the relative debt-to-income
regression, relative delinquency is greater in communities with a greater black population. However,

25
it is significantly negatively related to the size of the Hispanic population. So, the average relative
delinquency regression supports the Expansion of Credit Hypothesis strongly with regard to
PC_HISPANICa weakly with regard to bank concentration, but not at all to PC_BLACKa. The
statistically negative constant in the average relative delinquency regression provides evidence for the
Financial Instability Hypothesis, showing that people with much lower delinquency rates relative to
their communities are more likely to apply for P2P loans.
The following summarizes of the hypothesis tests using the application rate and relative credit risk
regression results. Expansion of Credit Hypothesis of P2P lending is supported consistently due to
concentration in the banking market: The coefficient on HHIa is significantly positive in the
application rate regression and negative in the average credit risk regressions. With regard to the size
of the minority population, the results on applications for P2P loans are limited to the Hispanic
population: Areas with higher Hispanic populations apply for P2P loans at a higher rate and have
better than average delinquency rates for their areas, but higher black populations are associated with
worse than average delinquency rates and debt to income ratios for their areas. The Redlining
Hypothesis is not supported in that there is no evidence of disparate marketing to areas with higher
minority populations. The Financial Instability Hypothesis has mixed support because applications
come from areas with lower average credit quality (statistically positive signs on DELINQ_INDEXa
and DTIa), but those applying for loans have a better than average delinquency rates after controlling
for area variables. The results of the following regressions on approvals and grade will more directly
show what the relative credit risk is of P2P loans, rather than that of just those seeking loans.
5.2 Approvals
The individual loan application data supplied by Lending Club are used to predict loan approvals.
This prediction model is then augmented with the area racial/ethnic and banking variables to discover

26
whether these geographic attributes affect the loan approval decision. To check for whether the
significance of these variables are robust to controlling for area average credit quality, aggregate credit
attributes are then added to the regression.
5.2.1 Individual Loan Application Variable Descriptions
Table 5 provides the univariate statistics on the loan application individual variables, showing that 16
percent of applications were approved. The average requested amount was $13,982. The median
credit score of applications was 661 and median debt payment to income ratio was 19.4%. (There is
a large outlier in debt payment to income, causing the mean to be over 100%.) The average applicant
has been employed for less than two years in her current job. 65% sought a loan to
consolidate/refinance debt, 23% to make a major purchase, 7% to make home improvements, and
3% for a business.
Table 5
Individual Application Variable Univariate Statistics
Variable N Mean St. Dev. Min Median Max
Approved (1=Yes)(APPROVALi) 798313 0.161289 0.367797 0 0 1 Loan Amount (LOAN_AMTi) 798313 13981.58 10439.3 1000 10000 65000
Credit Score (SCOREi) 798313 650.5118 61.56241 390 661 990 Debt Payment/Income (DTIi) 798313 205.8511 10725.39 0.01 19.4 2782032 Employment Years (EMP_YRSi) 798313 1.717774 3.284247 0 0 10
Purpose: Debt 798313 0.65836 0.47426 0 1 1
Purpose: Purchase 798313 0.229966 0.420811 0 0 1
Purpose: Home 798313 0.069121 0.25366 0 0 1 Purpose: Wedding/Vacation 798313 0.018282 0.133971 0 0 1
Purpose: Medical 798313 0.022085 0.146961 0 0 1
Purpose: Moving 798313 0.018636 0.135234 0 0 1
Purpose: Business 798313 0.03076 0.172667 0 0 1
Purpose: Taxes 798313 0.000941 0.030657 0 0 1

27
Purpose: Death 798313 0.000195 0.013978 0 0 1
Purpose: Baby 798313 0.000165 0.012858 0 0 1
Purpose: School 798313 0.002039 0.045113 0 0 1
Purpose: Legal 798313 0.00012 0.010965 0 0 1
Purpose: Bills 798313 0.007473 0.086124 0 0 1
Table 6
Individual Application Variable Correlations
5.2.2 Approval Decision Regression on Individual Application Variables Only
Apart from geographic variables, loan applicants’ individual attributes account for the majority of the
approval decision. Of the variables that Lending Club makes available, approvals are lower for higher
requested loan amount and greater debt payment to income ratio. Approvals are higher for greater
credit scores and years employed. A stated purpose for the loan also makes approval more likely. The
omitted “purpose” dummy variable is for a loan without a stated purpose or for a purpose that is
difficult to categorize. Among the loan applications with a stated purpose, paying legal bills, bills in
general, and expenses related to the birth of a baby provide the greatest likelihood of approval. Making
a major purchase and financing a business provide the lowest likelihood of approval. Lending Club’s
publicly available loan denials dataset, however, may not provide all of the variables that it uses when
Approved
(1=Yes)
Loan
Amount
Credit
Score
Debt
Payment/
Income
Employme
nt Years
Purpose:
Debt
Purpose:
Purchase
Purpose:
Home
Purpose:
Wedding/
Vac
Purpose:
Medical
Purpose:
Moving
Purpose:
Business
Purpose:
Taxes
Purpose:
Death
Purpose:
Baby
Purpose:
School
Purpose:
Legal
Purpose:
Bills
Approved
(1=Yes) 1
Loan Amount 0.0361 1
Credit Score 0.3456 0.3244 1
Debt
Payment/Income -0.0077 0.0099 0.0109 1
Employment
Years 0.601 0.0804 0.3118 -0.0089 1
Purpose: Debt 0.1912 0.2482 0.2462 0.006 0.079 1
Purpose:
Purchase 0.1373 0.0437 0.1307 0.0126 0.0563 0.1266 1
Purpose: Home 0.0559 0.0305 0.026 -0.0024 0.0409 -0.3176 -0.1013 1
Purpose:
Wedding/Vac 0.0064 -0.0812 -0.0283 -0.0018 -0.0111 -0.1661 -0.0577 -0.0292 1
Purpose:
Medical 0.0018 -0.0904 -0.0616 -0.002 -0.0083 -0.1718 -0.0536 -0.031 -0.0166 1
Purpose:
Moving -0.0315 -0.106 -0.0934 -0.0014 -0.0397 -0.1819 -0.0693 -0.0313 -0.0167 -0.0193 1
Purpose:
Business -0.0397 0.0672 -0.0172 -0.0005 -0.0243 -0.2367 -0.0899 -0.0463 -0.0224 -0.0251 -0.0234 1
Purpose: Taxes0.0605 0.0046 0.0239 -0.0005 0.0405 0.0049 0.0114 0.0063 0.0019 0.0107 -0.0006 0.0004 1
Purpose: Death0.027 -0.0002 0.0119 -0.0002 0.0212 0.0006 0.0066 0.0043 0.0034 0.0119 -0.0019 -0.002 0.0054 1
Purpose: Baby 0.0267 0.0013 0.0109 -0.0002 0.0149 0.0029 0.0078 0.0096 0.0033 0.006 0.0011 -0.0006 -0.0004 0.0068 1
Purpose:
School 0.0728 0.0043 0.036 -0.0008 0.0435 0.0115 0.0314 0.0001 0.0036 0.004 -0.0005 -0.005 0.0113 0.0033 0.0124 1
Purpose: Legal0.0222 -0.0025 0.0097 -0.0002 0.0144 -0.0037 0.0005 -0.0003 -0.0006 0.003 0.001 0.0007 0.0108 0.008 -0.0001 -0.0005 1
Purpose: Bills0.1774 0.0065 0.0632 -0.0015 0.1303 0.0423 0.0441 0.0112 0.0042 0.0943 -0.0084 -0.0115 0.032 0.0134 0.0147 0.0244 0.0136 1

28
making an approval decision. Therefore, the stated purpose of the loan may be significant because of
a correlation with credit attributes besides the credit score and debt payment to income ratio. The
loan approval regression results using only the individual variables are shown in Column (1) of Table
7.
Table 7
Loan Approval Decision Logistic Regression Results
Coefficient Estimates
(Standard Errors)
Explanatory Variable
Individual Variables
Only (1)
Individual and Area Variables
Excluding Average Area Credit Risk
(2)
Individual and Area Variables
Including Average Area Credit Risk
(3)
LOAN_AMTi -5.3E-05*** -5.4E-05*** -5.4E-05*** (5.26E-07) (5.28E-07) (5.28E-07)
SCOREi 0.588872*** 0.5895*** 0.589492*** (0.0041992) (0.0042045) (0.0042045)
SCORE_SQi -0.0004*** -0.0004*** -0.0004*** (2.97E-06) (2.97E-06) (2.97E-06)
DTIi -0.05362*** -0.05166*** -0.05167*** (0.0004217) (0.0004252) (0.0004261)
DTI_SQi 1.93E-08*** 1.86E-08*** 1.86E-08*** (1.52E-10) (1.53E-10) (1.54E-10)
EMP_YRSi 0.352002*** 0.354416*** 0.354393*** (0.0012419) (0.0012489) (0.0012489)
Purpose Dummy: Debt 2.722187*** 2.725108*** 2.72478*** (0.0170594) (0.0170915) (0.0170919)
Purpose Dummy: Purchase 0.63268*** 0.630569*** 0.63084*** (0.0103467) (0.0103687) (0.0103702)
Purpose Dummy: Home Improvement 2.301935*** 2.316891*** 2.316723*** (0.0225336) (0.0225826) (0.0225854)
Purpose Dummy: Wedding/Vacation 2.0967*** 2.082281*** 2.082774*** (0.0392918) (0.0393365) (0.039341)
Purpose Dummy: Medical 1.69851*** 1.690933*** 1.690243*** (0.0442751) (0.044352) (0.0443553)
Purpose Dummy: Moving 1.692314*** 1.670874*** 1.671357*** (0.0491519) (0.0492814) (0.0492839)
Purpose Dummy: Business 1.147383*** 1.136843*** 1.137018*** (0.0365188) (0.0365747) (0.0365752)
29
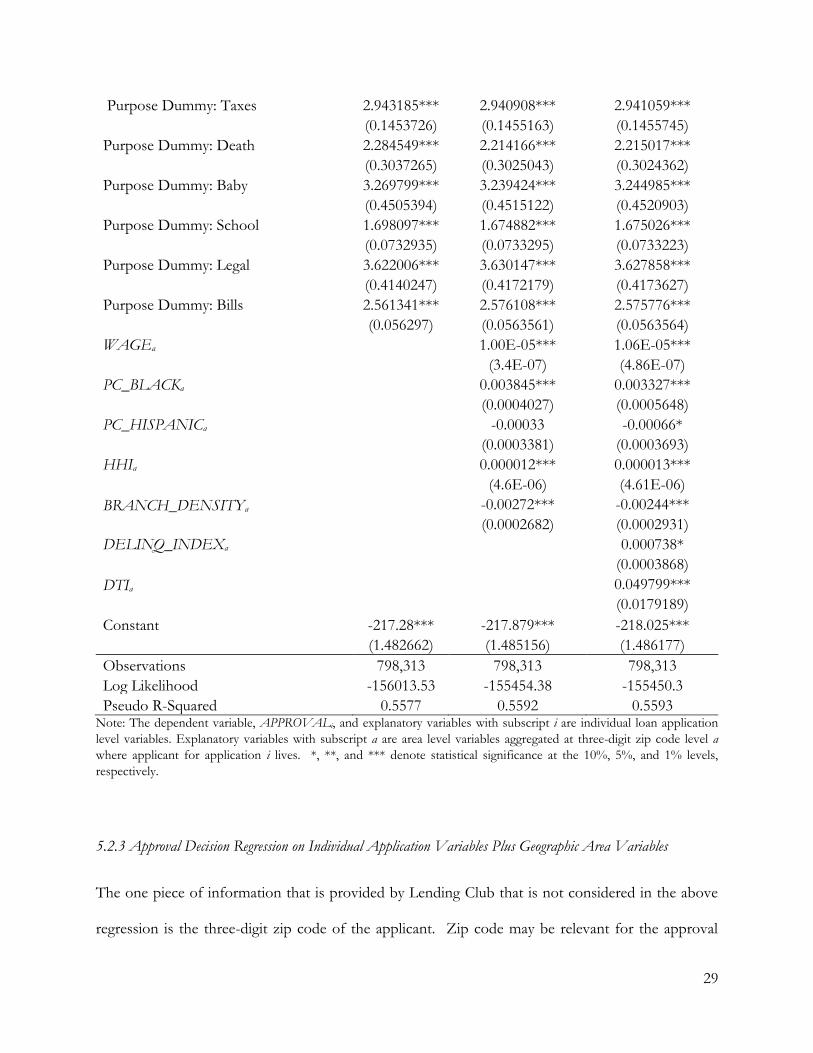
Purpose Dummy: Taxes 2.943185*** 2.940908*** 2.941059*** (0.1453726) (0.1455163) (0.1455745)
Purpose Dummy: Death 2.284549*** 2.214166*** 2.215017*** (0.3037265) (0.3025043) (0.3024362)
Purpose Dummy: Baby 3.269799*** 3.239424*** 3.244985*** (0.4505394) (0.4515122) (0.4520903)
Purpose Dummy: School 1.698097*** 1.674882*** 1.675026*** (0.0732935) (0.0733295) (0.0733223)
Purpose Dummy: Legal 3.622006*** 3.630147*** 3.627858*** (0.4140247) (0.4172179) (0.4173627)
Purpose Dummy: Bills 2.561341*** 2.576108*** 2.575776*** (0.056297) (0.0563561) (0.0563564)
WAGEa 1.00E-05*** 1.06E-05***
(3.4E-07) (4.86E-07)
PC_BLACKa 0.003845*** 0.003327***
(0.0004027) (0.0005648)
PC_HISPANICa -0.00033 -0.00066*
(0.0003381) (0.0003693)
HHIa 0.000012*** 0.000013***
(4.6E-06) (4.61E-06)
BRANCH_DENSITYa -0.00272*** -0.00244***
(0.0002682) (0.0002931)
DELINQ_INDEXa 0.000738*
(0.0003868)
DTIa 0.049799***
(0.0179189)
Constant -217.28*** -217.879*** -218.025***
(1.482662) (1.485156) (1.486177)
Observations 798,313 798,313 798,313
Log Likelihood -156013.53 -155454.38 -155450.3
Pseudo R-Squared 0.5577 0.5592 0.5593 Note: The dependent variable, APPROVALi, and explanatory variables with subscript i are individual loan application
level variables. Explanatory variables with subscript a are area level variables aggregated at three-digit zip code level a
where applicant for application i lives. *, **, and *** denote statistical significance at the 10%, 5%, and 1% levels,
respectively.
5.2.3 Approval Decision Regression on Individual Application Variables Plus Geographic Area Variables
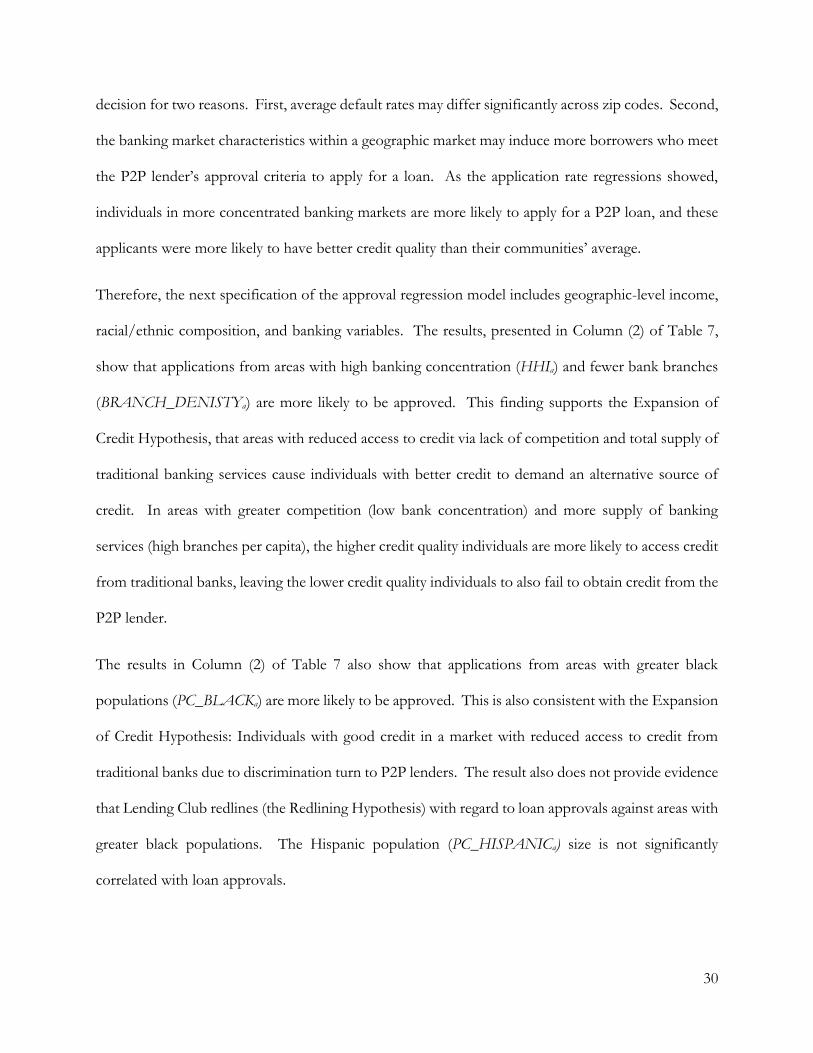
The one piece of information that is provided by Lending Club that is not considered in the above
regression is the three-digit zip code of the applicant. Zip code may be relevant for the approval
30
decision for two reasons. First, average default rates may differ significantly across zip codes. Second,
the banking market characteristics within a geographic market may induce more borrowers who meet
the P2P lender’s approval criteria to apply for a loan. As the application rate regressions showed,
individuals in more concentrated banking markets are more likely to apply for a P2P loan, and these
applicants were more likely to have better credit quality than their communities’ average.
Therefore, the next specification of the approval regression model includes geographic-level income,
racial/ethnic composition, and banking variables. The results, presented in Column (2) of Table 7,
show that applications from areas with high banking concentration (HHIa) and fewer bank branches
(BRANCH_DENISTYa) are more likely to be approved. This finding supports the Expansion of
Credit Hypothesis, that areas with reduced access to credit via lack of competition and total supply of
traditional banking services cause individuals with better credit to demand an alternative source of
credit. In areas with greater competition (low bank concentration) and more supply of banking
services (high branches per capita), the higher credit quality individuals are more likely to access credit
from traditional banks, leaving the lower credit quality individuals to also fail to obtain credit from the
P2P lender.
The results in Column (2) of Table 7 also show that applications from areas with greater black
populations (PC_BLACKa) are more likely to be approved. This is also consistent with the Expansion
of Credit Hypothesis: Individuals with good credit in a market with reduced access to credit from
traditional banks due to discrimination turn to P2P lenders. The result also does not provide evidence
that Lending Club redlines (the Redlining Hypothesis) with regard to loan approvals against areas with
greater black populations. The Hispanic population (PC_HISPANICa) size is not significantly
correlated with loan approvals.

31
To address the concern that the significant geographic-level variables are proxies for average credit
risk, the three-digit zip code average delinquency index (DELINQ_INDEXa) and debt balance to
income (DTIa) variables are added to the regression model. This regression’s results are presented in
Column (3) of Table 7. The inclusion of these variables does not change the significance or sign on
the banking and racial/ethnic variables. The geographic credit risk variables are positively correlated
with approvals and significantly so (at 1% level) for DTIa and weakly significant for
DELINQ_INDEXa (p = 0.056). In other words, applications from areas with higher average
delinquency and higher debt balance to income are more likely to be approved. This finding is
consistent with the Financial Instability Hypothesis, showing that the P2P applicants are more likely
to be approved in areas where the average credit risk is greater.
The following summarizes of the hypothesis tests using the approval regression results. The
Expansion of Credit Hypothesis is supported with regard to banking market concentration:
Applications in areas with high HHIs are more likely to be approved after controlling for individual
application level variables. The Expansion of Credit Hypothesis is also supported with regard to the
black population size but not the Hispanic population size. The Redlining Hypothesis is not
supported, as applications from areas with greater black residents are more likely to be approved, and
there is no significant relationship with the Hispanic population. The Financial Instability Hypothesis
is supported: Applicants with higher credit scores and lower debt-to-income ratios are more likely to
be approved, whereas the areas in which approved applicants live tend to have higher debt-to-income
ratios and higher rates of delinquency (though the coefficient on DELINQ_INDEXa is just below the
5% level of significance with a p-value of 0.056). While this may be evidence of the P2P lender “cherry
picking” the better credit risks, leaving worse ones for local banks, it may also suggest that traditional
lenders avoid areas where the average credit quality of the individuals are poorer. Considering that
applicants are more likely to be approved where credit rationing is likely to be greater (Expansion of

32
Credit Hypothesis), the availability of a P2P loan enables the better quality individuals in markets
where there is no alternative source of credit.
5.3 Loan Grade
After Lending Club approves an application, the applicant is presented with these loan options: loan
amount, loan term, and interest rate. Borrowers who choose to borrower more and at a longer term
pay a higher interest rate. The interest rate offered at various loan amounts and terms are based on
the borrower’s credit score, monthly debt payments excluding mortgage to income, employment
length, number of recent credit inquiries, macroeconomic conditions, and “other” variables. After
the borrower chooses her loan amount and terms, Lending Club assigns her one of 35 alphanumeric
grades from A1 (best) through G5 (worst), which is based on the borrower’s credit quality and her
loan amount and term selection. The grade solely determines the interest rate. I converted these
grades into numbers from one through 35 (LOAN_GRADEi), where one corresponds to the best
grade, A1, and 35 corresponds to the worst grade, G5.
If Lending Club uses past performance by geography in its algorithm for predicting default and
therefore assigning a grade, then geographic variables should be significantly related to the grade after
controlling for the characteristics of the individual loan. Of particular interest is whether the
geographic component of the assignment of grade can be explained by the local banking structure,
racial/ethnic composition, and average credit risk. As a baseline, the loan grade is regressed on the
individual loan variables such as credit score, debt to income, and annual income of the borrower.
Then, the area racial/ethnic population variables, area average income, and area bank structure
variables augment these explanatory variables in the second regression specification. Finally, a third
regression includes the average credit risk variables to check for whether the racial/ethnic and banking
33
variables just proxy for average credit for the area. The average credit risk variables also serve to test
the Financial Instability Hypothesis.
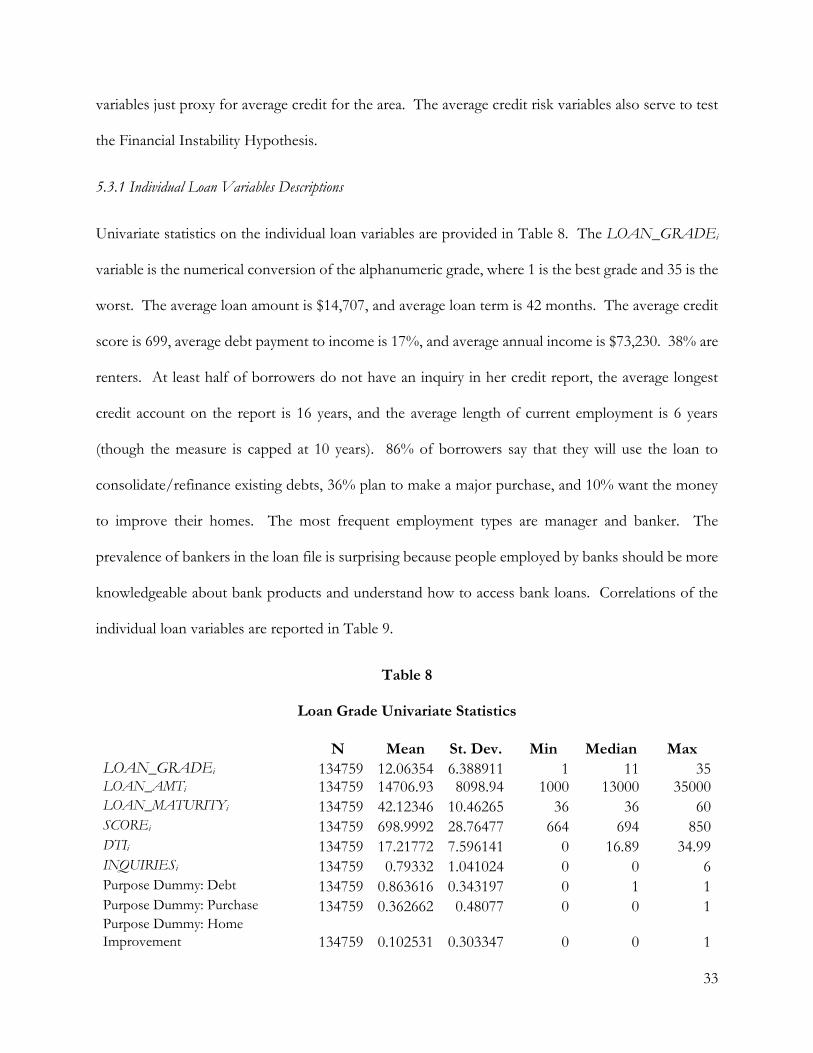
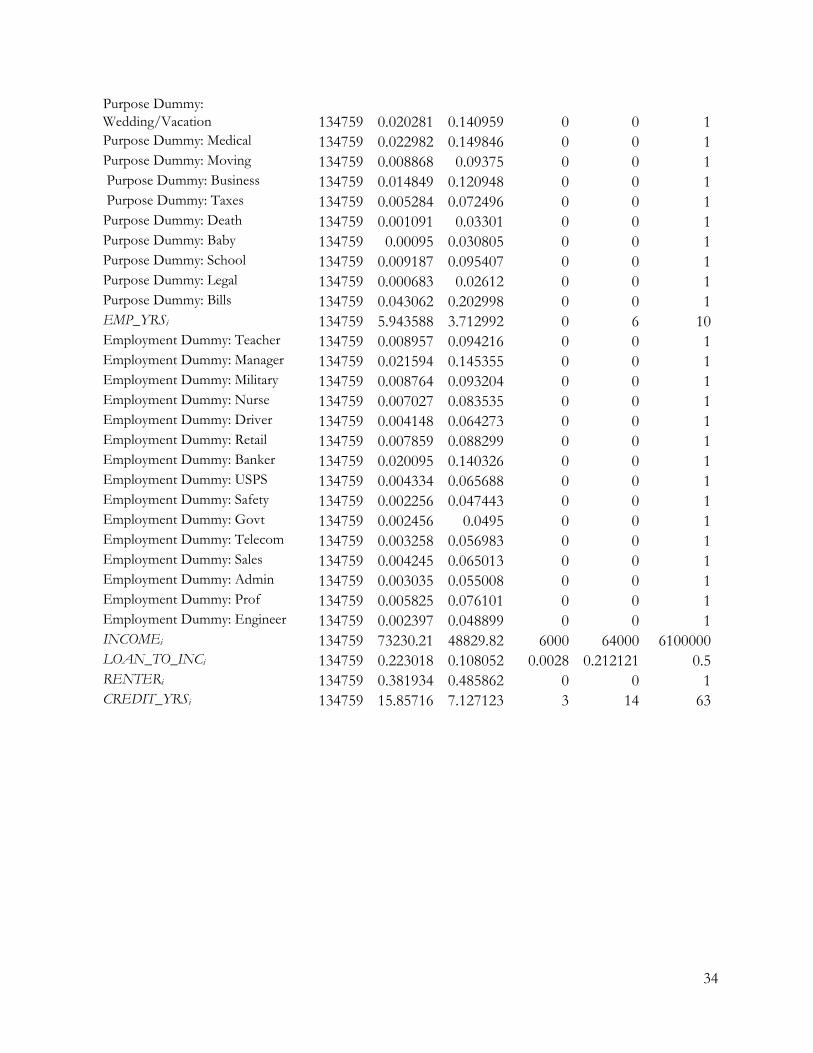
5.3.1 Individual Loan Variables Descriptions
Univariate statistics on the individual loan variables are provided in Table 8. The LOAN_GRADEi
variable is the numerical conversion of the alphanumeric grade, where 1 is the best grade and 35 is the
worst. The average loan amount is $14,707, and average loan term is 42 months. The average credit
score is 699, average debt payment to income is 17%, and average annual income is $73,230. 38% are
renters. At least half of borrowers do not have an inquiry in her credit report, the average longest
credit account on the report is 16 years, and the average length of current employment is 6 years
(though the measure is capped at 10 years). 86% of borrowers say that they will use the loan to
consolidate/refinance existing debts, 36% plan to make a major purchase, and 10% want the money
to improve their homes. The most frequent employment types are manager and banker. The
prevalence of bankers in the loan file is surprising because people employed by banks should be more
knowledgeable about bank products and understand how to access bank loans. Correlations of the
individual loan variables are reported in Table 9.
Table 8
Loan Grade Univariate Statistics
N Mean St. Dev. Min Median Max
LOAN_GRADEi 134759 12.06354 6.388911 1 11 35 LOAN_AMTi 134759 14706.93 8098.94 1000 13000 35000 LOAN_MATURITYi 134759 42.12346 10.46265 36 36 60 SCOREi 134759 698.9992 28.76477 664 694 850 DTIi 134759 17.21772 7.596141 0 16.89 34.99 INQUIRIESi 134759 0.79332 1.041024 0 0 6 Purpose Dummy: Debt 134759 0.863616 0.343197 0 1 1 Purpose Dummy: Purchase 134759 0.362662 0.48077 0 0 1 Purpose Dummy: Home
Improvement 134759 0.102531 0.303347 0 0 1
34
Purpose Dummy:
Wedding/Vacation 134759 0.020281 0.140959 0 0 1 Purpose Dummy: Medical 134759 0.022982 0.149846 0 0 1 Purpose Dummy: Moving 134759 0.008868 0.09375 0 0 1 Purpose Dummy: Business 134759 0.014849 0.120948 0 0 1 Purpose Dummy: Taxes 134759 0.005284 0.072496 0 0 1 Purpose Dummy: Death 134759 0.001091 0.03301 0 0 1 Purpose Dummy: Baby 134759 0.00095 0.030805 0 0 1 Purpose Dummy: School 134759 0.009187 0.095407 0 0 1 Purpose Dummy: Legal 134759 0.000683 0.02612 0 0 1 Purpose Dummy: Bills 134759 0.043062 0.202998 0 0 1 EMP_YRSi 134759 5.943588 3.712992 0 6 10 Employment Dummy: Teacher 134759 0.008957 0.094216 0 0 1 Employment Dummy: Manager 134759 0.021594 0.145355 0 0 1 Employment Dummy: Military 134759 0.008764 0.093204 0 0 1 Employment Dummy: Nurse 134759 0.007027 0.083535 0 0 1 Employment Dummy: Driver 134759 0.004148 0.064273 0 0 1 Employment Dummy: Retail 134759 0.007859 0.088299 0 0 1 Employment Dummy: Banker 134759 0.020095 0.140326 0 0 1 Employment Dummy: USPS 134759 0.004334 0.065688 0 0 1 Employment Dummy: Safety 134759 0.002256 0.047443 0 0 1 Employment Dummy: Govt 134759 0.002456 0.0495 0 0 1 Employment Dummy: Telecom 134759 0.003258 0.056983 0 0 1 Employment Dummy: Sales 134759 0.004245 0.065013 0 0 1 Employment Dummy: Admin 134759 0.003035 0.055008 0 0 1 Employment Dummy: Prof 134759 0.005825 0.076101 0 0 1 Employment Dummy: Engineer 134759 0.002397 0.048899 0 0 1 INCOMEi 134759 73230.21 48829.82 6000 64000 6100000 LOAN_TO_INCi 134759 0.223018 0.108052 0.0028 0.212121 0.5 RENTERi 134759 0.381934 0.485862 0 0 1 CREDIT_YRSi 134759 15.85716 7.127123 3 14 63

35
Table 9
Loan Grade Variable Correlations
Grade Loan Amount Term
(Months) FICO
Debt
Payment/Inc
ome
Inquiries
(6 Mos.)
Purpose:
Debt
Purpose:
Purchase
Purpose:
Home
Purpose:
Wedding/Vac
Purpose:
Medical
Purpose:
Moving
Purpose:
Business
Purpose:
Tax
Purpose:
Death
Purpose:
Baby
Purpose:
School
Purpose:
Legal
Purpose:
Bills
Employment
Years
Grade 1.00
Loan Amount 0.12 1.00
Term (Months) 0.46 0.43 1.00
FICO -0.46 0.12 0.00 1.00
Debt
Payment/Income 0.14 0.04 0.09 -0.07 1.00
Inquiries (6
Mos.) 0.27 0.02 0.04 -0.05 0.01 1.00
Purpose: Debt -0.14 0.16 0.04 -0.10 0.12 -0.07 1.00
Purpose:
Purchase -0.13 0.00 -0.06 0.00 0.00 -0.03 0.13 1.00
Purpose: Home -0.03 0.01 0.01 0.09 -0.09 0.07 -0.43 -0.05 1.00
Purpose:
Wedding/Vac 0.07 -0.07 -0.03 0.01 -0.01 0.01 -0.18 -0.02 -0.01 1.00
Purpose:
Medical 0.05 -0.04 -0.01 0.00 0.00 0.01 -0.08 0.04 0.00 0.00 1.00
Purpose:
Moving 0.06 -0.05 -0.02 0.00 -0.02 0.01 -0.13 -0.03 0.01 0.00 0.00 1.00
Purpose:
Business 0.09 0.02 0.00 0.03 -0.04 0.02 -0.20 -0.04 -0.03 0.00 -0.01 0.00 1.00
Purpose: Tax 0.02 0.00 0.00 0.00 -0.01 0.00 -0.02 0.01 0.01 0.00 0.03 0.01 0.01 1.00
Purpose: Death0.00 0.00 0.00 0.00 0.00 0.00 -0.01 0.01 0.01 0.01 0.03 0.00 0.00 0.01 1.00
Purpose: Baby 0.00 0.00 0.00 0.01 0.00 0.00 -0.01 0.01 0.02 0.01 0.01 0.01 0.00 0.00 0.01 1.00
Purpose:
School -0.02 0.00 -0.02 0.00 0.00 -0.01 0.03 0.06 0.00 0.01 0.01 0.01 0.00 0.01 0.00 0.01 1.00
Purpose: Legal0.01 -0.01 0.00 0.00 0.00 0.00 -0.02 0.00 0.00 0.00 0.01 0.01 0.00 0.01 0.01 0.00 0.00 1.00
Purpose: Bills0.03 -0.01 0.01 -0.03 0.02 0.00 0.05 0.05 0.00 0.01 0.24 -0.01 -0.01 0.02 0.01 0.01 0.01 0.01 1.00
Employment
Years 0.00 0.12 0.09 0.02 0.02 -0.01 0.03 -0.02 0.01 -0.02 0.00 -0.04 -0.01 -0.01 0.00 -0.01 -0.03 0.00 0.02 1.00
Employment:
Teacher -0.01 0.00 0.00 0.00 0.02 0.00 0.00 -0.01 0.00 0.00 0.00 0.00 0.00 0.00 0.00 0.00 0.00 0.00 -0.01 0.04
Employment:
Manager 0.00 0.01 0.01 0.00 0.00 0.01 0.01 -0.01 -0.01 0.00 0.00 -0.01 0.00 -0.01 0.00 0.00 -0.01 0.00 -0.01 0.03
Employment:
Military 0.04 0.04 0.03 -0.01 0.05 0.00 0.00 -0.02 0.00 0.00 -0.01 0.01 0.00 -0.01 0.00 0.00 0.00 0.01 0.00 0.06
Employment:
Nurse 0.00 0.01 0.00 0.00 0.00 0.01 0.00 -0.01 0.00 0.00 0.00 0.00 -0.01 0.00 0.01 0.00 0.00 0.00 0.00 -0.01
Employment:
Driver 0.01 -0.01 0.00 -0.01 0.00 0.00 0.00 0.00 0.00 0.00 0.00 0.00 0.00 0.00 0.00 0.00 0.00 0.00 0.00 0.00
Employment:
Retail 0.01 -0.03 -0.01 -0.01 0.01 0.00 0.00 0.00 -0.01 0.00 0.00 0.00 0.00 0.00 0.00 0.00 0.00 0.00 0.01 0.02
Employment:
Banker 0.01 0.00 0.01 0.00 0.00 0.00 0.01 0.00 0.00 0.00 0.00 0.00 -0.01 0.00 0.00 0.00 0.00 0.00 -0.01 -0.02
Employment:
USPS 0.01 0.00 0.01 0.00 0.00 0.00 0.00 0.00 0.01 0.00 0.00 0.00 0.00 0.00 0.00 0.00 0.00 0.00 0.01 0.05
Employment:
Safety 0.00 0.01 0.01 0.01 -0.01 0.00 0.00 0.00 0.00 0.00 0.00 0.00 0.00 0.00 0.00 0.00 0.00 0.00 0.00 0.02
Employment:
Govt 0.01 0.01 0.01 0.00 0.00 0.00 0.00 0.00 0.00 0.01 0.00 0.00 0.00 0.00 0.01 0.00 0.00 0.00 0.00 0.03
Employment:
Telecom 0.01 0.01 0.01 0.00 0.00 0.01 0.00 0.00 0.00 0.00 0.00 0.00 0.00 0.00 0.01 0.00 -0.01 0.00 0.01 0.03
Employment:
Sales 0.00 0.00 0.00 -0.01 0.00 0.00 0.00 0.00 0.00 0.00 0.00 0.00 0.00 0.00 0.00 0.00 0.00 0.00 0.00 -0.01
Employment:
Admin 0.01 -0.01 0.00 0.00 0.01 -0.01 0.00 0.00 -0.01 0.00 0.00 0.00 0.00 0.00 0.00 0.00 0.00 0.00 0.00 0.01
Employment:
Prof -0.01 0.01 0.01 0.01 -0.01 0.01 0.00 0.00 0.00 0.00 0.00 0.00 0.00 0.00 0.00 0.00 0.00 0.00 0.00 -0.02
Employment:
Engineer -0.01 0.01 0.00 0.01 -0.01 0.00 0.00 0.00 0.00 0.00 0.00 0.00 0.01 0.00 0.00 0.00 0.00 0.00 -0.01 -0.01
Annual Income -0.05 0.39 0.08 0.12 -0.21 0.10 -0.05 -0.02 0.08 -0.01 -0.01 0.00 0.04 0.04 0.00 0.00 0.00 0.00 -0.03 0.09
P2P Loan
Amt/Income 0.16 0.58 0.36 0.00 0.26 -0.09 0.22 0.02 -0.06 -0.07 -0.04 -0.05 -0.02 -0.03 0.00 0.00 0.01 -0.01 0.03 0.01
Renter 0.13 -0.19 -0.11 -0.14 0.00 -0.09 0.04 0.02 -0.16 0.03 0.01 0.06 0.01 -0.01 0.00 0.00 0.03 0.00 0.00 -0.18
Credit History
(Yrs) -0.11 0.18 0.06 0.14 0.03 0.00 0.02 0.00 0.02 -0.02 0.01 -0.02 -0.01 0.03 0.00 -0.01 -0.01 0.00 0.00 0.15
Employment:
Teacher
Employment:
Manager
Employment:
Military
Employment:
Nurse
Employment:
Driver
Employment:
Retail
Employment:
Banker
Employment:
USPS
Employment:
Safety
Employment:
Govt
Employment:
Telecom
Employment:
Sales
Employment:
Admin
Employment:
Prof
Employment:
Engineer
Annual
Income
P2P Loan
Amt/Inco
me
Renter
Credit
History
(Yrs)
Employment:
Teacher 1.00
Employment:
Manager -0.01 1.00
Employment:
Military -0.01 -0.01 1.00
Employment:
Nurse -0.01 -0.01 -0.01 1.00
Employment:
Driver -0.01 -0.01 -0.01 -0.01 1.00
Employment:
Retail -0.01 -0.01 -0.01 -0.01 -0.01 1.00
Employment:
Banker -0.01 -0.02 -0.01 -0.01 -0.01 -0.01 1.00
Employment:
USPS -0.01 -0.01 -0.01 -0.01 0.00 -0.01 -0.01 1.00
Employment:
Safety 0.00 -0.01 0.00 0.00 0.00 0.00 -0.01 0.00 1.00
Employment:
Govt 0.00 -0.01 0.00 0.00 0.00 0.00 -0.01 0.00 0.00 1.00
Employment:
Telecom -0.01 -0.01 -0.01 0.00 0.00 -0.01 -0.01 0.00 0.00 0.00 1.00
Employment:
Sales -0.01 -0.01 -0.01 -0.01 0.00 -0.01 -0.01 0.00 0.00 0.00 0.00 1.00
Employment:
Admin -0.01 -0.01 -0.01 0.00 0.00 0.00 -0.01 0.00 0.00 0.00 0.00 0.00 1.00
Employment:
Prof -0.01 -0.01 -0.01 -0.01 0.00 -0.01 -0.01 -0.01 0.00 0.00 0.00 -0.01 0.00 1.00
Employment:
Engineer 0.00 -0.01 0.00 0.00 0.00 0.00 -0.01 0.00 0.00 0.00 0.00 0.00 0.00 0.00 1.00
Annual Income -0.01 0.02 0.00 0.01 -0.02 -0.04 0.01 -0.01 0.01 0.01 0.01 0.01 -0.02 0.02 0.02 1.00
P2P Loan
Amt/Income 0.01 -0.02 0.03 -0.01 0.00 0.01 0.00 0.01 -0.01 0.00 0.00 -0.01 0.01 -0.01 -0.02 -0.31 1.00
Renter -0.01 -0.02 0.01 -0.01 -0.01 0.01 0.01 -0.01 -0.01 0.00 0.00 0.00 0.01 0.00 0.00 -0.17 0.00 1.00
Credit History
(Yrs) 0.03 0.00 -0.03 0.00 -0.01 -0.02 -0.02 0.01 0.00 0.01 0.00 0.00 0.01 0.00 -0.01 0.18 0.00 -0.20 1.00
36
5.3.2 Loan Grade Regression on Individual Loan Variables Only
The numerical grades (LOAN_GRADEi) are regressed on credit, income, home ownership,
employment, and loan purpose variables. Since the worse credit grades are assigned higher numbers,
a positive coefficient implies the variable corresponds to a worse grade and therefore a higher interest
rate. The results of the first regression, which use only individual level variables, are shown in Column
(1) of Table 10. They demonstrate that the loan grade prediction model accounts for 58% of the
variation. The loan terms, credit, and income variables are all significant with the expected signs:
Borrowers with higher credit scores (SCOREi), lower debt payment to income ratios (DTIi), lower
loan amounts (LOAN_AMTi), short loan terms (LOAN_MATURITYi), higher annual income
(INCOMEi), longer credit histories (CREDIT_YRSi), owned homes (RENTERi), and fewer credit
bureau inquiries (INQUIRIESi) have better grades.
Loan purpose variables are significant also. Borrowers who reportedly borrow to refinance or
consolidate debt, make a major purchase, improve their homes, and pay for school are more likely to
receive better grades. Notably, a desire to refinance or consolidate debt improves the rating by almost
four grades. Borrowers who reportedly borrow to finance a wedding or vacation, pay medical bills,
pay moving expenses, invest in a business, pay taxes, pay legal bills, or pay bills in general are more
likely to receive worse grades. The rating is about three grades worse for business borrowers. People
borrowing to pay the expenses for a birth or death do not have significantly better or worse grades
than those not reporting a purpose.
Employment variables are also significant. The number of years employed (EMPLOYMENT_YRSi)
has a surprising positive coefficient; a borrower with more years of employment is more likely to
receive a worse grade. The data that Lending Club makes available is capped at 10 years, which may
have a bearing on how this variable corresponds to the grade. The type of employment is important,

37
too. Teachers, managers, nurses, salesmen, professionals (e.g., doctors, lawyers, accountants), and
engineers all receive better grades. However, military servicemen, workers in retail stores, and
administrative assistants all receive worse grades.
Table 10
Loan Grade OLS Regression Results
Coefficient Estimates
(Standard Errors)
Variable Individual
Variables Only (1)
Individual and Area Variables
Excluding Average Area Credit Risk
(2)
Individual and Area Variables Including
Average Area Credit Risk
(3)
LOAN_AMTi 0.0000742*** 0.000076*** 7.65E-05*** (2.70E-06) (2.71E-06) (2.71E-06)
LOAN_MATURITYi 0.276271*** 0.2761422*** 0.276114*** (0.0012343) (0.0012347) (0.0012344)
SCOREi -0.6955712*** -0.6958744*** -0.69597*** (0.012699) (0.0126949) (0.0126919)
SCORE_SQi 0.0004158*** 0.000416*** 0.000416*** (8.83E-06) (8.83E-06) (8.83E-06)
DTIi -0.0349578*** -0.0358318*** -0.03574*** (0.0065361) (0.0065401) (0.0065398)
DTI_SQi 0.0029564*** 0.002963*** 0.002948*** (0.0001778) (0.0001778) (0.0001778)
EMP_YRSi 0.0127075*** 0.0121273*** 0.012459*** (0.0033844) (0.003391) (0.0033906)
INQUIRIESi 1.425196*** 1.424235*** 1.422743*** (0.01124) (0.0112385) (0.0112375)
Purpose Dummy: Debt -3.800473*** -3.794288*** -3.79288*** (0.0414163) (0.0414223) (0.0414129)
Purpose Dummy: Purchase -0.9655853*** -0.9625357*** -0.96294*** (0.0242987) (0.0242936) (0.0242877)
Purpose Dummy: Home Improvement -1.718457*** -1.721986*** -1.72113*** (0.0434629) (0.0434548) (0.0434447)
Purpose Dummy: Wedding/Vacation 1.964739*** 1.966347*** 1.969556*** (0.0837045) (0.0836767) (0.0836588)
Purpose Dummy: Medical 1.386622*** 1.389475*** 1.38861*** (0.0801872) (0.0801617) (0.0801444)

38
Purpose Dummy: Moving 2.15548*** 2.162151*** 2.162024*** (0.1238116) (0.1238556) (0.1238255)
Purpose Dummy: Business 2.985541*** 2.978748*** 2.977878*** (0.097505) (0.0974565) (0.097433)
Purpose Dummy: Taxes 1.521769*** 1.523449*** 1.530179*** (0.1606759) (0.1605946) (0.160558)
Purpose Dummy: Death 0.3806025 0.3830097 0.373575 (0.3543831) (0.354212) (0.3541285)
Purpose Dummy: Baby 0.0286938 0.0596974 0.062893 (0.3740477) (0.373863) (0.3737784)
Purpose Dummy: School -0.3546805*** -0.357719*** -0.3607*** (0.1188433) (0.1187927) (0.118765)
Purpose Dummy: Legal 1.066245** 1.040976** 1.031843** (0.4429592) (0.4427374) (0.4426327)
Purpose Dummy: Bills 0.4589723*** 0.4472278*** 0.448775*** (0.0591886) (0.059174) (0.0591599)
Employment Dummy: Teacher -0.6221464*** -0.6301454*** -0.63194*** (0.1195957) (0.119543) (0.119514)
Employment Dummy: Manager -0.1859025** -0.1877966** -0.18883** (0.0775273) (0.0774882) (0.0774694)
Employment Dummy: Military 0.6897627*** 0.6624474*** 0.682149*** (0.1209792) (0.1214324) (0.1214494)
Employment Dummy: Nurse -0.3538729*** -0.3651699*** -0.36665*** (0.1347534) (0.1347117) (0.1346814)
Employment Dummy: Driver 0.1369869 0.131582 0.126136 (0.1750462) (0.1749761) (0.1749348)
Employment Dummy: Retail 0.2910239 0.2912707 0.295863** (0.1276765) (0.1276177) (0.1275886)
Employment Dummy: Banker 0.0023907 0.0094412 0.004963 (0.0803273) (0.0803212) (0.0803039)
Employment Dummy: USPS 0.1294391 0.1280816 0.133929 (0.1714862) (0.171398) (0.1713583)
Employment Dummy: Safety -0.2192177 -0.2269381 -0.21894 (0.2371288) (0.2370254) (0.2369964)
Employment Dummy: Govt 0.3722054 0.3796375* 0.421573* (0.2273062) (0.2272648) (0.2272696)
Employment Dummy: Telecom 0.2178039 0.2120319 0.211955 (0.1974857) (0.1974163) (0.1973703)
Employment Dummy: Sales -0.409861** -0.4270984** -0.43252** (0.1728848) (0.1729506) (0.1729103)
Employment Dummy: Admin 0.908647*** 0.9112985*** 0.907604*** (0.2043409) (0.2044971) (0.2044593)
Employment Dummy: Prof -0.5473082*** -0.5453169*** -0.54243***
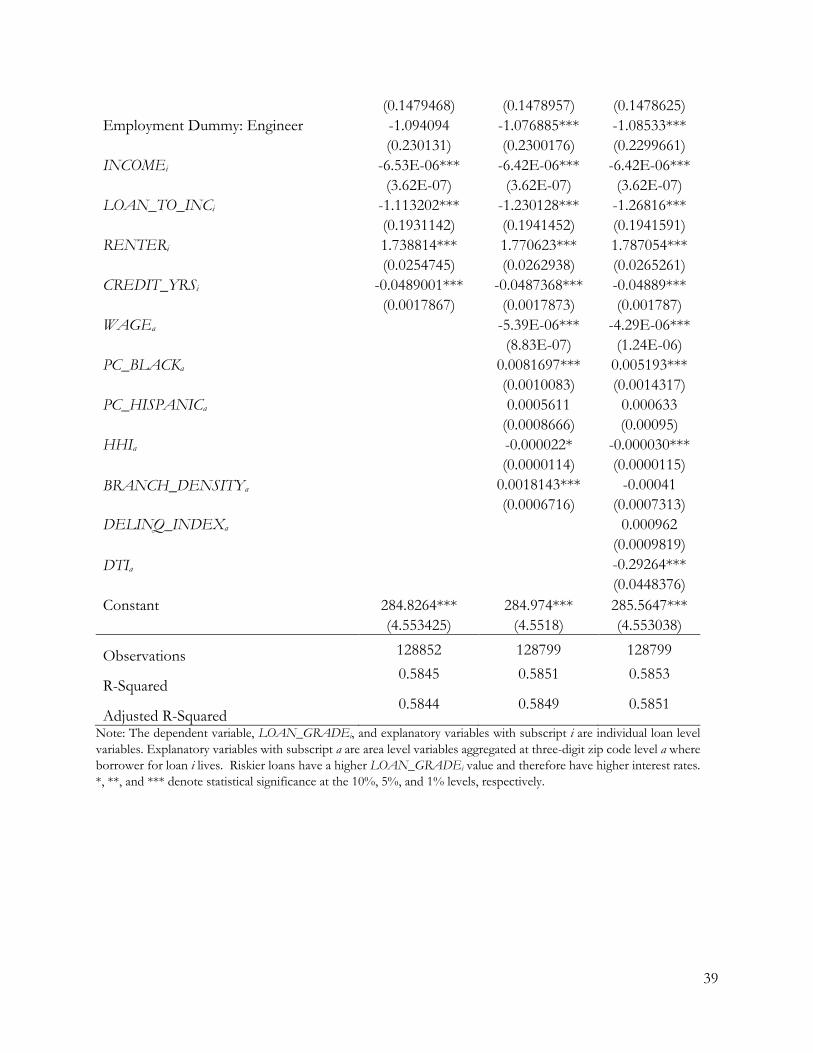
39
(0.1479468) (0.1478957) (0.1478625)
Employment Dummy: Engineer -1.094094 -1.076885*** -1.08533*** (0.230131) (0.2300176) (0.2299661)
INCOMEi -6.53E-06*** -6.42E-06*** -6.42E-06*** (3.62E-07) (3.62E-07) (3.62E-07)
LOAN_TO_INCi -1.113202*** -1.230128*** -1.26816*** (0.1931142) (0.1941452) (0.1941591)
RENTERi 1.738814*** 1.770623*** 1.787054*** (0.0254745) (0.0262938) (0.0265261)
CREDIT_YRSi -0.0489001*** -0.0487368*** -0.04889*** (0.0017867) (0.0017873) (0.001787)
WAGEa -5.39E-06*** -4.29E-06***
(8.83E-07) (1.24E-06)
PC_BLACKa 0.0081697*** 0.005193***
(0.0010083) (0.0014317)
PC_HISPANICa 0.0005611 0.000633
(0.0008666) (0.00095)
HHIa -0.000022* -0.000030***
(0.0000114) (0.0000115)
BRANCH_DENSITYa 0.0018143*** -0.00041
(0.0006716) (0.0007313)
DELINQ_INDEXa 0.000962
(0.0009819)
DTIa -0.29264***
(0.0448376)
Constant 284.8264*** 284.974*** 285.5647*** (4.553425) (4.5518) (4.553038)
Observations 128852 128799 128799
R-Squared 0.5845 0.5851 0.5853
Adjusted R-Squared 0.5844 0.5849 0.5851
Note: The dependent variable, LOAN_GRADEi, and explanatory variables with subscript i are individual loan level
variables. Explanatory variables with subscript a are area level variables aggregated at three-digit zip code level a where
borrower for loan i lives. Riskier loans have a higher LOAN_GRADEi value and therefore have higher interest rates.
*, **, and *** denote statistical significance at the 10%, 5%, and 1% levels, respectively.

40
5.3.3 Loan Grade Regression on Individual Loan Variables Plus Geographic Area Variables
To test the Expansion of Credit and the Redlining Hypotheses, the area-level income, race/ethnicity,
and banking variables are added to the previous regression. The results, in Column (2) of Table 10,
show that these area-level variables are statistically significant.
Borrowers in more concentrated banking markets receive better grades, but not quite at the 5% level
of significance (p=0.054). Those in banking markets with fewer branches also receive better grades,
which is significant at the 1% level. The signs on both of these coefficients indicate that borrowers
in areas where credit may be rationed due to less competition and possibilities to develop banking
relationships turn to the P2P lender, thus supporting the Expansion of Credit Hypothesis. If less
competition and supply of local banking services are less, then individuals have less opportunity to
establish relationships with local banks and rely on the soft information that is not reflected in hard
information like credit bureau reports and income. On the other hand, borrowers in competitive
banking markets and in markets with many bank branches have more opportunity to establish
relationships and rely on soft information to get loans. The ones who cannot obtain loans with
favorable terms in such markets may pose worse risks than what is reflected in their hard data. As
P2P lenders gain experience lending in different areas, it may become apparent that average loans to
concentrated banking markets and to markets with fewer branches perform better. Therefore,
regression results support the standard belief in banking antitrust about banking market concentration
and competition (structure-conduct-performance theory). They also support the innovation of P2P
lending as expanding access to credit.
Borrowers in areas with higher black populations (PC_BLACKi) are more likely to receive worse
grades, and the relationship to the Hispanic population (PC_HISPANICi) is insignificant. The find
on PC_BLACKi is of particular concern because it supports the Redlining Hypothesis with respect to

41
the cost of approved loans in areas where there are more blacks. This finding also does not support
the Expansion of Credit Hypothesis with respect to racial/ethnic discrimination.
Finally, to address the same concern in the applications and approvals regressions about the area
variables, average credit risk, the area’s delinquency index (DELINQ_INDEXa) and debt to income
ratio (DTIa) are added to the above regression. These results of this regression are shown in Column
(3) of Table 10. After controlling for these average credit risk variables, the coefficient on bank
concentration becomes larger in magnitude and significance, thus strengthening the evidence for the
Expansion of Credit Hypothesis with respect to bank concentration. However, the branch variable
becomes insignificant; the significantly positive effect of area average debt to income on grade may
indicate that banks open fewer branches in areas with higher average debt to income, as is evident in
the -0.41 correlation between area debt to income and branch density (Table 2). So, even though the
branch variable is insignificant in this regression, the direction of the relationship between grade and
area debt to income plus the stronger significance of the bank concentration variable support the
conclusion from the previous regression that P2P lending expands access to credit where there is less
competition and less overall supply of local branches.
In the presence of these area average credit quality variables, the coefficient on the percent black
population remains significantly related to receiving a worse grade, though the magnitude is reduced
by about 40%. Therefore, the support for the Redlining Hypothesis is robust to controlling for the
area’s average credit risk.
The insignificance of the coefficient on the area delinquency rate variable (DELINQ_INDEXa) and
statistically significant negative sign of the coefficient on area debt to income (DTIa) do not support
the Financial Instability Hypothesis. The area’s residents’ credit quality is no worse (and even better

42
in the debt to income ratio) where P2P borrowers receive better grades and therefore lower interest
rates.
The following summarizes the hypothesis tests using the loan grade regression results. The Expansion
of Credit Hypothesis is supported with respect to bank concentration: P2P borrowers in more
concentrated (less competitive) banking markets qualify for lower interest rate loans via better loan
grades. The Expansion of Credit Hypothesis is not supported with respect to the size of the area’s
minority population, and the Redlining Hypothesis is supported: P2P borrowers in areas with more
black residents receive worse loan grades and therefore pay higher interest rates. The Financial
Instability Hypothesis is not supported: P2P borrowers living in areas with lower debt to income
ratios receive better loan grades and therefore pay lower interest rates. The other borrowers in the
areas have better than average credit for local banks to lend to where the P2P borrower is charged a
lower interest rate.
5.4 Results Summary
The Expansion of Credit Hypothesis with regard to bank concentration receives the strongest support
among the hypotheses tested in this study. P2P applicants living in more concentrated banking
markets are more numerous, have better credit quality relative to the area’s average, are more likely to
be approved, and qualify for lower interest rates if approved after controlling for all available relevant
individual and area average credit variables.
The Expansion of Credit Hypothesis with regard to the minority population receives mixed support.
Supportive findings are that P2P loan applicants living in areas with more Hispanics are more
numerous, applicants from higher Hispanic areas have better credit quality relative to the area’s
average, and P2P loan applicants in areas with more blacks are more likely to be approved. Contrary
findings are that P2P applicants living in areas with more blacks have worse credit quality relative to

43
the area’s average and that P2P loan borrowers living in areas with more black residents pay higher
interest rates on approved loans. Findings that are neither supportive nor contrary are that people in
areas with more black residents are not more or less likely to apply for P2P loans and people in areas
with more Hispanic residents are not any more or less likely to be approved or qualify for lower
interest rates if approved.
The Redlining Hypothesis is not supported with respect to application rates and approvals. To the
contrary, applications from areas with more black residents are more likely to be approved. However,
there is evidence for the Redlining Hypothesis in the loan grades assigned to approved loans: After
controlling for relevant individual and area credit variables, borrowers in areas with large black
populations are more likely to receive worse loan grades and therefore pay higher interest rates on
P2P loans.
The Financial Instability Hypothesis has support in terms of who are seeking P2P loans and are
approved for P2P loans. Applicants for P2P loans have lower delinquency rates in comparison to
their areas in which they live. More importantly, the likelihood of approval for P2P loans are greater
for applicants who live in areas with higher debt to income ratios (and to a slightly significant degree,
higher delinquency rates, too). In other words, P2P loans are disproportionately made to areas with
worse credit quality, leaving a riskier-than-average pool for banks to lend to. However, the cost of
the P2P loans tend to be lower where the average debt-to-income ratio is lower, suggesting that P2P
loan interest rates are more competitive where credit quality is better.
6. Conclusion The major conclusion of this study is that high concentration banking markets have a higher rate of
applications for P2P loans, better credit quality applications relative to the area, more P2P lender
approvals, and lower P2P loan interest rates (better grades). The second conclusion with mixed

44
support is that race or ethnicity of an area correspond to more P2P loan applications and approvals
but higher interest rates on approved P2P loans (worse grades). Overall, I conclude that P2P lending
expands access to credit in areas due to banking market structure and possibly discrimination
(Expansion of Credit Hypothesis), but at a higher cost in areas with more black residents. This latter
qualification provides compelling evidence that the P2P lender may commit redlining by providing
worse loan terms to areas with more black residents (Redlining Hypothesis) even though applications
from such areas are more likely to be approved. The competition that results from expansion of credit
may also have destabilizing effects on the financial system by “cherry picking” the best loans away
from banks and causing bank loan portfolio risk to worsen (Financial Instability Hypothesis). Though,
the competition may be tempered by the tendency to assign better loan grades to areas with better
than average credit risk.
Even though P2P lending has been rapidly growing, it is still small enough that it may not impact
banks greatly at this moment. The concern for P2P lending and banking is for the near future. As
policymakers aim to respond to P2P lending, the findings of this study are important for providing
evidence of its benefits and costs. The benefit of expanded access to credit in particular due to lack
of competition from banks is strongly supported. But, the major cost of P2P lending is the ability to
use geography in assigning default probabilities, resulting in borrowers living in higher black
population areas paying higher interest rates. As P2P lenders take an increasing share of the market
for consumer and small business loans, policymakers should deal with this prospect of a new type of
redlining. With regard to the impact on financial stability, the considerations for P2P lending’s impact
is far ranging while this study concentrated just on the how competition from P2P lending may impact
stability through the banking system. There are other dimensions of P2P lending’s potential impact
on financial stability that should be weighed against these findings. For example, does greater diversity
in the types of suppliers of credit reduce the likelihood of a sudden pullback in credit if there is a

45
shock to only one type of supplier? Would the supply of credit more easily dry up if supplied in a
system dominated by the P2P lending model, and does that have a greater compounding effect in an
economic downturn than in a system dominated by traditional banks?
Though the findings of this study are significant, there are plenty of more research opportunities due
to the amount of data that may be accessed. This study can be extended to include all years of available
data, going back to 2007, and of the next major P2P lenders such as Prosper and SoFi. Another
extension of this study would be to test the actual performance of these loans: Do P2P loan default
rates of borrowers differ by racial composition after controlling for the loan grade? As P2P lending
develops, P2P lenders are also offering differentiated products; for example after the year studied here,
Lending Club started offering a small business credit line. So, further research needs to be done on
these separate P2P loan products. Despite all of these avenues for future research, the results found
in this study provide strong evidence that addresses the major policy questions surrounding P2P
lending and also provide a solid foundation for future research.

46
References
Allen, Franklin and Douglas Gale. (2004) “Competition and financial stability.” Journal of Money, Credit,
and Banking, 36, 433-480.
Amel, D. and Starr-McCluer, J. (2001) Market definition in banking: Recent evidence. Federal Reserve
Board Finance and Economics Discussion Series (2001), 2001-2016
Bank for International Settlements Financial Stability Board. (2017) “FinTech Credit: Market
Structure, Business Models and Financial Stability Implications, May 2017, http://www.fsb.org/wp-
content/uploads/CGFS-FSB-Report-on-FinTech-Credit.pdf.
Berger, Allen N., W. Scott Frame, and Nathan H. Miller. (2005) “Credit Scoring and the Availability,
Price, and Risk of Small Business Credit.” Journal of Money Credit and Banking, 37, 191-222.
Berger, Allen N., Leora F. Klapper, and Rima Turk-Ariss. (2008) “Bank Competition and Financial
Stability.” Journal of Financial Services Research, 35, 99-118.
Black, Harold A., Thomas P. Boehm, and Raymond P. DeGenarro. (2003) “Is There Discrimination
in Mortgage Pricing? The Case of Overages” Journal of Banking and Finance, 27, 1139-1165.
Bostic, Raphael and K. Patrick Lampani. (1999) “Racial Differences in Patterns of Small Business
Finance: The Importance of Local Geography.” Federal Reserve Bank of Chicago Proceedings, March
1999, 149-179.
Boyd, John H., De Nicolo, Gianni. (2005) “The theory of bank risk-taking and competition revisited.”
Journal of Finance, 60, 1329-1343.
Caminal, Ramon and Carmen Matutes. (2002) “Market power and banking failures.” International
Journal of Industrial Organization, 20, 1341-1361
Charles, Kerwin K, Erik Hurst, and Melvin Stephens. (2008) “Rates for Vehicle Loans: Race and Loan
Source.” American Economic Review: Papers and Proceedings, 98, 315-320.

47
Cohen, Mark. (2007) “Imperfect Competition in Auto Lending: Subjective Markup, Racial Disparity,
and Class Action Litigation.” Vanderbuilt Law and Economics Research Paper No. 07-01.
Cohen-Cole, Ethan. (2011) “Credit Card Redlining.” Review of Economics and Statistics, 93, 700-713.
Courchane, Marsha and David Nickerson. (1997) “Discrimination Resulting from Overage Practices.”
Journal of Financial Services Research, 11, 133-151.
Crawford, Gordon W. and Eric Rosenblatt. (1999) “Differences in the Cost of Mortgage Credit:
Implications for Discrimination.” Journal of Real Estate, Finance, and Economics, 19, 147-159.
Dick, Astrid A. (2007) “Market Size, Service Quality and Competition in Banking.” Journal of Money,
Credit and Banking, 39, 49-81.
Duca, John V. and Stuart S. Rosenthal. (1994) “Do Mortgage Rates Vary Based on Household Default
Characteristics? Evidence on Rate Sorting and Credit Rationing.” Journal of Real Estate, Finance, and
Economics, 8, 99-113.
Dugan, Ianthe J. and Telis Demos. (2016) “Online Finance’s Use of Geography is Gray Area.” The
Wall Street Journal, March 9, 2016, C1.
Edelberg, Wendy M. (2007) “Racial Dispersion in Consumer Credit Interest Rates.” Board of
Governors of the Federal Reserve System Finance and Economics Discussion Series 2007-28.
Frame, W. Scott, Michael Padhi, and Lynn Woosley. (2004) “Credit Scoring and the Availability of
Small Business Credit in Low- and Moderate-Income Areas.” Financial Review, 39, 34-54.
Frame, W. Scott, Aruna Srinivasan, and Lynn Woosley. (2001) “The Effect of Credit Scoring on Small
Business Lending.” Journal of Money, Credit and Banking, 33, 813-825.
Getter, Darryl E. (2006) “Consumer Credit Risk and Pricing.” The Journal of Consumer Affairs, 40, 41-
63.
Heitfeld, Erik A. (1999) “What Do Interest Rate Data Say about the Geography of Retail Banking
Markets?” Antitrust Bulletin, 44, 333-347.
48
Heitfield, Erik A., and Robin A. Prager. (2004) “The Geographic Scope of Retail Deposit Markets.”
Journal of Financial Services Research, 25, 37-55.
Holder, Christopher. (1993) “Competitive Considerations in Bank Mergers and Acquisitions:
Economic Theory, Legal Foundations, and the Fed.” Federal Reserve Bank of Atlanta Economic Review,
78, 23-36.
Holmes, Andrew and Paul Horvitz. (1994) “Mortgage Redlining: Race, Risk, and Demand.” Journal of
Finance, 49, 81-99.
Kau, James B., Donald C. Keenan, and Henry J. Munneke. (2012) “Racial Discrimination and
Mortgage Lending”, Journal of Real Estate, Finance, and Economics, 45, 289-304.
Kessler, Andy. (2016) “The Weekend Interview with Mike Cagney: The Uberization of Banking.” The
Wall Street Journal, April 30, 2016, A11.
Kwast, Myron, M. Starr-McCluer, J. Wolken. (1997) Market definition and the analysis of antitrust in
banking. The Antitrust Bulletin, 42, pp. 973-995.
Lacour-Little, Michael (1999) “Discrimination in Mortgage Lending: A Critical Review of the
Literature.” Journal of Real Estate, Finance, and Economics, 7, 15-49.
Ladd, Helen F. (1998) “Evidence on Discrimination in Mortgage Lending.” Journal of Economic
Perspectives, 12, 41-62.
LendingClub Corporation. (2017) Form 10-K. Securities and Exchange Commission. December 31,
2016.
Munnell, Alicia H., Geoffrey M. B. Tootell, Lynn E. Browne, and James McEeaney. (1996) “Mortgage
Lending in Boston: Interpreting the HMDA Data.” American Economic Review, 86, 25-53.
Nothaft, Frank E. and Vanessa G. Perry. (2002) “Do Mortgage Rates Vary by Neighborhood?
Implications for Loan Pricing and Redlining.” Journal of Housing Economics, 11, 244-265.
49
Office of the Comptroller of the Currency. (2017) “Semiannual Risk Perspective.” Spring 2017,
https://www.occ.treas.gov/publications/publications-by-type/other-publications-reports/semiannual-risk-
perspective/semiannual-risk-perspective-spring-2017.pdf
Petersen, Mitchell A., and Raghuram G. Rajan. (1994) “The Benefits of Lending Relationships:
Evidence from Small Business Data.” Journal of Finance, 49, 3-37.
Petersen, Mitchell A., and Raghuram G. Rajan. (2002) “Does Distance Still Matter? The Information
Revolution and Small Business Lending.” Journal of Finance, 57, 2533-2570.
Radecki, Lawrence J. “Competition in Shifting Product and Geographic Markets.” Antitrust Bulletin,
45, 571-613.
Ross, Stephen L. (2005) “The Continuing Practice and Impact of Discrimination.” University of
Connecticut Working Paper.
U. S. Department of the Treasury. (2016) “Opportunities and Challenges in Online Marketplace
Lending.” May 2016,
https://www.treasury.gov/connect/blog/Documents/Opportunities_and_Challenges_in_Online_Marketplace_
Lending_white_paper.pdf.