the effects of mathematics instruction …etd.lib.metu.edu.tr/upload/12616054/index.pdf ·...
TRANSCRIPT

THE EFFECTS OF MATHEMATICS INSTRUCTION SUPPORTED BY
DYNAMIC GEOMETRY ACTIVITIES ON SEVENTH GRADE STUDENTS’
ACHIEVEMENT IN AREA OF QUADRILATERALS
A THESIS SUBMITTED TO
THE GRADUATE SCHOOL OF SOCIAL SCIENCES
OF
MIDDLE EAST TECHNICAL UNIVERSITY
BY
BĠLAL ÖZÇAKIR
IN PARTIAL FULFILLMENT OF THE REQUIREMENTS
FOR
THE DEGREE OF MASTER OF SCIENCE
IN
THE DEPARTMENT OF
ELEMENTARY SCIENCE AND MATHEMATICS EDUCATION
JULY 2013

Approval of the Graduate School of Social Sciences
_____________________
Prof. Dr. Meliha ALTUNIġIK
Director
I certify that this thesis satisfies all the requirements as a thesis for the degree of
Master of Science.
_____________________
Prof. Dr. Jale ÇAKIROĞLU
Head of Department
This is to certify that we have read this thesis and that in our opinion it is fully
adequate, in scope and quality, as a thesis for the degree of Master of Science.
_____________________
Assoc. Prof. Dr. Erdinç ÇAKIROĞLU
Supervisor
Examining Committee Members
Assoc. Prof. Dr. Mine IġIKSAL BOSTAN (METU, ELE) .
Assoc. Prof. Dr. Erdinç ÇAKIROĞLU (METU, ELE) .
Assist. Prof. Dr. Çiğdem HASER (METU, ELE) .
Assist. Prof. Dr. Didem AKYÜZ (METU, ELE) .
Assist. Prof. Dr. Muharrem AKTÜMEN (AEU, ELE) .

iii
M
PLAGIARIS
I hereby declare that all information in this document has been obtained and
presented in accordance with academic rules and ethical conduct. I also declare
that, as required by these rules and conduct, I have fully cited and referenced
all material and results that are not original to this work.
Name, Last name: Bilal ÖZÇAKIR
Signature:

iv
ABSTRACT
THE EFFECTS OF MATHEMATICS INSTRUCTION SUPPORTED BY
DYNAMIC GEOMETRY ACTIVITIES ON SEVENTH GRADE STUDENTS’
ACHIEVEMENT IN AREA OF QUADRILATERALS
ÖZÇAKIR, Bilal
M.S., Department of Elementary Science and Mathematics Education
Supervisor: Assoc. Prof. Dr. Erdinç ÇAKIROĞLU
July 2013, 143 pages
The aim of this study was to investigate the effects of mathematics instruction
supported by dynamics geometry activities on students’ achievement in area of
quadrilaterals and students’ achievements according to their van Hiele geometric
thinking levels. The study was conducted in a public elementary school in KırĢehir in
2012 – 2013 spring semester and lasted two weeks. The participants in the study
were 76 seventh grade students. The study was examined through nonrandomized
control group pretest-posttest research design. In order to gather data, Readiness Test
for Area and Perimeter Concepts (RTAP), Area of Quadrilaterals Achievement Test
(AQAT) and van Hiele Geometric Thinking Level Test (VHLT) were used. A two-
way analysis of variance (ANOVA) procedure was employed to answer research

v
questions. The result of the study indicated that there was a significant interaction
between the effects of method of teaching and van Hiele geometric thinking level on
scores of AQAT. In addition, mathematics instruction supported by dynamic
geometry activities had significant effects on seventh grade students’ achievement on
area of quadrilaterals topic. The results also revealed that students in experimental
group were significantly more successful in AQAT than students in comparison
group when the students were in second level of van Hiele geometric thinking.
Keywords: Mathematics Education, Dynamic Geometry Software, GeoGebra, van
Hiele Geometric Thinking Levels, Area of Quadrilaterals.

vi
ÖZ
DĠNAMĠK GEOMETRĠ ETKĠNLĠKLERĠ ĠLE DESTEKLENEN MATEMATĠK
ÖĞRETĠMĠNĠN YEDĠNCĠ SINIF ÖĞRENCĠLERĠNĠN DÖRTGENLERDE ALAN
KONUSUNDAKĠ BAġARILARINA ETKĠSĠ
ÖZÇAKIR, Bilal
Yüksek Lisans, Ġlköğretim Fen ve Matematik Eğitimi Bölümü
Tez Yöneticisi: Doç. Dr. Erdinç ÇAKIROĞLU
Temmuz 2013, 143 sayfa
Bu çalıĢma, dinamik geometri etkinlikleri ile desteklenen matematik öğretiminin
yedinci sınıf öğrencilerinin dörtgenlerde alan konusundaki baĢarılarına etkisini ve bu
öğrenci baĢarılarının van Hiele düzeylerine göre değiĢimini incelemeyi amaçlamıĢtır.
ÇalıĢma, 2012 – 2013 öğretim yılı bahar döneminde KırĢehir ilindeki bir devlet
okulunda eğitim görmekte olan 76 yedinci sınıf öğrencisi ile iki hafta süresince
yürütülmüĢtür. Bu çalıĢmada yarı deneysel araĢtırma desenlerinden denk olmayan
gruplu ön test – son test deneysel deseni kullanılmıĢtır. Veri toplama araçları olarak
bu çalıĢmada Çevre ve Alan Kavramları için HazırbulunuĢluk Testi, Dörtgenlerde
Alan BaĢarı Testi ve van Hiele Geometrik DüĢünme Düzeyi Testi kullanılmıĢtır.
Toplanan veriler iki yönlü varyans analizi (Two Way ANOVA) ile incelenmiĢtir.
vii
Analiz sonuçlarına göre, uygulanan öğretim yöntemleri ile van Hiele düzeylerinin
öğrenci baĢarısına etkileri arasında bir iliĢki olduğu görülmüĢtür. Ayrıca, dinamik
geometri etkinlikleri ile desteklenen matematik öğretiminin öğrenci baĢarısı üzerine
anlamlı bir etkisi olduğu bulunmuĢtur. Bunlara ek olarak, ikinci van Hiele geometrik
düĢünme düzeyinde olan öğrencilerin baĢarı seviyelerinde deney ve karĢılaĢtırma
grubu arasında anlamlı bir fark bulunmuĢtur.
Anahtar Kelimeler: Matematik Eğitimi, Dinamik Geometri Yazılımı, GeoGebra, van
Hiele Geometrik DüĢünme Düzeyleri, Dörtgenlerde Alan.

viii
DEDICATION
To My Grandmother

ix
ACKNOWLEDGEMENTS
There are many people who I would like to thank for their helps during my master
study. First of all, I am thankful to my supervisor Assoc. Prof. Dr. Erdinç Çakıroğlu
for his guidance, valuable comments, feedbacks and edits during my study.
Moreover, I would like to thank to the members of committee, Assoc. Prof. Dr. Mine
IĢıksal Bostan, Assist. Prof. Dr. Muharrem Aktümen, Assist. Prof. Dr. Çiğdem Haser
and Assist. Prof. Dr. Didem Akyüz for their helpful comments and guidance.
I am grateful to my colleagues at Ahi Evran University who have helped and
provided suggestion throughout the completion of thesis.
I especially owe my thanks to ġenol Namlı, AyĢe Yolcu, Rukiye Ayan, Duygu
Aydemir, AyĢegül Çabuk, Selin Tülü, Metin OdabaĢ, Ardak Kashkynbayev, F.
TuğĢat ġaĢmaz, Halime Samur, AyĢe Ulus and Rezzan Doktoroğlu for their
encouragements, suggestions and moral support.
Finally, I would like to express my sincere appreciation to my parents Kadriye and
Mehmet Ali Özçakır, and my brothers Ömer Yasin and Ahmet Özçakır for their
support, encouragement, patience and helps. Without their unconditional love and
their pray, I cannot achieve to be here.

x
TABLE OF CONTENTS
PLAGIARISIM ........................................................................................................... iii
ABSTRACT ................................................................................................................ iv
ÖZ ............................................................................................................................... vi
DEDICATION .......................................................................................................... viii
ACKNOWLEDGEMENTS ........................................................................................ ix
LIST OF TABLES .................................................................................................... xiii
LIST OF FIGURES .................................................................................................. xiv
LIST OF ABBREVIATIONS .................................................................................... xv
CHAPTER
1. INTRODUCTION ................................................................................................... 1
1.1. Students’ Achievement in Geometry and Measurement Concepts .................. 4
1.2. Technology and Mathematics .......................................................................... 6
1.3. Purpose of the Study ........................................................................................ 7
1.4. Research Questions of the Study ...................................................................... 7
1.5. Significance of the Study ................................................................................. 8
1.6. Hypotheses of the Study ................................................................................. 10
1.7. Definition of the Important Terms ................................................................. 10
2. REVIEW OF THE RELATED LITERATURE .................................................... 12
2.1. Geometric Thinking of Students .................................................................... 12
2.2. Quadrilaterals and Their Classification .......................................................... 15
2.3. Area Measurement ......................................................................................... 18
2.4. Studies Related with Dynamic Geometry Software ....................................... 20
2.5. Summary of the Literature Review ................................................................ 23
3. METHODOLOGY ................................................................................................. 25
3.1. Design of the Study ........................................................................................ 25
3.2. Participants ..................................................................................................... 25
3.3. Instruments ..................................................................................................... 26
3.3.1. Readiness Test for Area and Perimeter Concepts ..................................... 26

xi
3.3.1.1. Pilot Study of RTAP ........................................................................... 27
3.3.2. Area of Quadrilaterals Achievement Test ................................................. 28
3.3.2.1. Pilot Study of AQAT .......................................................................... 29
3.3.3. Van Hiele Geometric Thinking Level Test ............................................... 30
3.4. Variables ......................................................................................................... 32
3.4.1. Independent Variables ............................................................................... 33
3.4.2. Dependent Variable ................................................................................... 33
3.4.3. Covariate .................................................................................................... 33
3.5. Procedure ........................................................................................................ 33
3.6. Treatment ....................................................................................................... 35
3.6.1. Treatment in the Comparison Group ......................................................... 35
3.6.2. Treatment in the Experimental Group ....................................................... 37
3.7. Data Analysis ................................................................................................. 45
3.8. Internal Validity ............................................................................................. 46
3.9. External Validity ............................................................................................ 46
3.10. Limitations of Study ....................................................................................... 47
4. RESULTS .............................................................................................................. 48
4.1. Descriptive Statistics and Data Cleaning ....................................................... 48
4.1.1. Descriptive Statistics of RTAP and AQAT for Comparison and
Experimental Groups .......................................................................................... 48
4.1.2. Descriptive Statistics of RTAP and AQAT for VHLT Categories ........... 49
4.1.3. Descriptive Statistics of RTAP and AQAT for VHLT Categories in
Comparison and Experimental Groups ............................................................... 51
4.1.4. Data Cleaning ............................................................................................ 54
4.2. Inferential Statistics ........................................................................................ 57
4.2.1. Missing Data Analysis ............................................................................... 57
4.2.2. Determination of Analysis ......................................................................... 58
4.2.3. Assumptions of ANOVA .......................................................................... 58
4.2.4. Analysis of Variance ................................................................................. 59
4.2.5. Follow-up Analysis ................................................................................... 63
4.3. Summary ........................................................................................................ 64
5. DISCUSSION AND IMPLICATIONS ................................................................. 65
xii
5.1. Discussion of the Results ............................................................................... 65
5.2. Implications .................................................................................................... 68
5.3. Recommendations for Further Research ........................................................ 69
REFERENCES ........................................................................................................... 71
APPENDICES ........................................................................................................... 82
Appendix A: Former Version of Readiness Test for Area and Perimeter
Concepts ................................................................................................................ 82
Appendix B: Final Version of Readiness Test for Area and Perimeter Concepts . 86
Appendix C: Former Version of Area of Quadrilaterals Achievement Test .......... 90
Appendix D: Final Version of Area of Quadrilaterals Achievement Test ............. 98
Appendix E: Van Hiele Geometric Thinking Level Test ..................................... 104
Appendix F: Analysis for Pilot Study of RTAP ................................................... 108
Appendix G: Analysis for Pilot Study Of AQAT ................................................ 109
Appendix H: Student Worksheets ........................................................................ 110
Appendix I: Geogebra Screen Views ................................................................... 129
Appendix J: GeoGebra Manual ............................................................................ 137
Appendix K: Tez Fotokopisi Ġzin Formu ............................................................. 143

xiii
LIST OF TABLES
TABLES
Table 3.1 Research Design of the Study .................................................................... 25
Table 3.2 Groups distributions ................................................................................... 26
Table 3.3 Distribution of questions of RTAP in listed objectives ............................. 27
Table 3.4 Distributions of questions of AQAT in terms of objectives ...................... 30
Table 3.5 Distribution of questions in to the van Hiele Levels .................................. 31
Table 3.6 Scoring van Hiele Geometric Thinking Level Test ................................... 31
Table 3.7 Modified van Hiele Level .......................................................................... 32
Table 3.8 Outline of the procedure of the Study ........................................................ 35
Table 3.9 Brief explanation about the activities and their objectives Hata! Yer işareti
tanımlanmamış.
Table 3.10 The roles and environments in the experimental and comparison groups45
Table 4.1 Descriptive statistics related to the RTAP and AQAT for comparison and
experimental groups ................................................................................................... 48
Table 4.2 Descriptive statistics related to the scores from RTAP and AQAT for all
students together in VHLT categories........................................................................ 50
Table 4.3 Descriptive statistics related to RTAP for VHLT categories in comparison
and experimental groups ............................................................................................ 52
Table 4.4 Descriptive statistics related to AQAT for VHLT categories in comparison
and experimental groups ............................................................................................ 52
Table 4.5 The results of independent sample t-test for RTAP scores for before and
after deleting subject 50. ............................................................................................ 56
Table 4.6 Descriptive statistics for AQAT after deletion of the extreme outlier ....... 57
Table 4.7 The results of the independent sample t-test for RTAP scores .................. 58
Table 4.8 Levene’s Test of Equality Error Variances for AQAT .............................. 59
Table 4.9 The results of two-way analysis of variance for scores of AQAT ............. 61
Table 4.10 Simple main effects analysis .................................................................... 63

xiv
LIST OF FIGURES
FIGURES
Figure 2.1 An exclusive hierarchy of quadrilaterals with five special types of
quadrilaterals. ............................................................................................................. 16
Figure 2.2 An inclusive hierarchy of quadrilaterals with five special types of
quadrilaterals. ............................................................................................................. 17
Figure 3.1 Area of parallelogram in comparison group ............................................. 36
Figure 3.2 Students were working on an activity in EG ............................................ 37
Figure 3.3 Geogebra screen for area of parallelogram activity .................................. 42
Figure 3.4 GeoGebra screen for area of rhombus activity ......................................... 43
Figure 3.5 GeoGebra screen for area of trapezoid activity ........................................ 43
Figure 4.1 The box plot for RTAP and AQAT for groups......................................... 49
Figure 4.2 The box plot for RTAP and AQAT for VHLT categories........................ 51
Figure 4.3 The box plot for RTAP and AQAT for VHLT categories in comparison
and experimental groups ............................................................................................ 54
Figure 4.4 Cook’s distance for the scores of AQAT for VHLT categories in
comparison and experimental groups ........................................................................ 55
Figure 4.5 Interaction of groups and scores of VHLT in terms of scores of AQAT. 62

xv
LIST OF ABBREVIATIONS
AQAT Area of Quadrilaterals Achievement Test
CAS Computer Algebra Systems
CG Comparison Group
DGS Dynamic Geometry Software
EG Experimental Group
ESMC Elementary School Mathematics Curriculum
MoNE Ministry of National Education
MSMC Middle School Mathematics Curriculum
NCTM National Council of Teachers of Mathematics
OECD Organisation for Economic Co-operation and Development
RTAP Readiness Test for Area and Perimeter Concepts
PISA Programme for International Student Assessment
TC Technology Class
TIMSS Trends in International Mathematics and Science Study
VHGT Van Hiele Geometric Thinking
VHLT Van Hiele Geometric Thinking Level Test

1
CHAPTER 1
INTRODUCTION
Geometry is one of the important fields of mathematics. Most of the goods and
structures in our physical environment are geometric shapes and objects. Geometry
can be used solving problems not only in other areas of mathematics but also in
science, art and daily life (AktaĢ & Cansız-AktaĢ, 2012). According to National
Council of Teachers of Mathematics (NCTM, 2000), geometry provides describing,
analyzing and understanding the world around us. Suydam (1985) stated that
geometry is also an important thing as a skill of mathematics. Learning geometry
develops students’ logical thinking abilities, spatial intuition about the real world,
and knowledge for studying higher level mathematical concepts, and reading and
understanding of mathematical arguments.
In middle schools, students deal with geometric shapes and structures, their
characteristics and relationships with one another in geometry concepts (Umay,
2007). In addition, according to Umay (2007), geometric concepts and geometric
thinking are very useful to provide visual representations for other areas of
mathematics as well as for daily life situations. The general objectives of geometry
education can be defined as: student should use geometry within the process of
problem solving, understanding and explaining the physical world around them
(Baki, 2001). In order to achieve general objectives of geometry education, learning
environments for geometry should be prepared to provide opportunities to students
for classifying geometric objects and making deductive reasoning. Understanding of
geometry takes very critical role for people’s cultural and aesthetic values similar as
for understanding mathematics (Baki, 2001; Boyraz, 2008).
Measurement is another important field of mathematics. Measurement is used in
many fields in human’s life and it has a significance place in communication with
other people specifically when describing properties of something with numbers

2
(Altun, 2008; Tan-ġiĢman & Aksu, 2009). Moreover, measurement provides
important contributions to science and many occupations (Altun, 2008). It connects
mathematics to social sciences, science and art (Umay, 2007).
In middle schools, the concepts and skills related to measurement include basic skills
and knowledge that students can encounter with them in daily life frequently (Tan-
ġiĢman & Aksu, 2012). In addition, learning measurement has an important place in
using mathematics in daily life and in developing many concepts and skills of
mathematics (Tan-ġiĢman & Aksu, 2009, 2012). According to Tan-ġiĢman and Aksu
(2009), taking into account the roles of measurement in mathematics, other sciences
and daily life, students should understand means of measuring as well as how to
measure.
Measurement and geometry are content areas of Elementary School Mathematics
Curriculum (ESMC) (Ministry of National Education [MoNE], 2009a). In ESMC,
these content areas listed separately. The ESMC involves five content standards for
elementary mathematics which are Numbers, Geometry, Measurement, Probability
and Statistics, and Algebra. These five content areas of middle school mathematics
are not completely separated from each other. In other words, these content areas are
interconnected. For example, Numbers content area is a base for all areas of
mathematics. Similarly, some measurement topics are extensions of geometry topics.
Altun (2008) stated that geometric skills are needed to measure perimeter, area,
length and volume. In other words, most measurement topics in middle school
mathematics are related with learning of students in geometry. Some classification
and applications of geometry depend on measurement concepts. In addition,
measurement concepts involve some applications of mathematics such as number
and operations, and it forms a basis for science for students (Altun, 2008; NCTM,
2000).
In early 2013, Ministry of National Education (MoNE) has published a new
curriculum for middle school mathematics. In Middle School Mathematics
Curriculum (MSMC), geometry and measurement are combined in a single content
area, but probability and statistics are separated into two content areas which are

3
Processing Data and Probability (MoNE, 2013). The current study was conducted
with seventh grade students in spring semester of 2012 – 2013 academic year. Since,
the MSMC will be implemented to seventh grades in 2015 – 2016 academic year, the
study followed the ESMC.
Both ESMC and MSMC are based on a student centered approach (MoNE, 2009a,
2013). Main purpose of these curricula is to help student to construct their own
mathematical meanings by their experiences and intuitions, and define concrete and
abstract structure of mathematics by using their knowledge (MoNE, 2009a, 2013). In
order to prepare suitable learning environments to achieve main purpose of these
curriculums, ESMC and MSMC suggest that learning and teaching mathematics
should start with concrete experiences and meaningful learning should be aimed.
Moreover, these curricula emphasize considering students’ motivation and using
technology effectively in instructional phases. Collaborative learning and associating
learning with other topic and areas are the other important suggestions of ESMC and
MSMC.
According to Umay (2007), students need to understand mathematics in order to
construct mathematical knowledge and understanding mathematics is achieved with
active participation of students. Active learning is the learning process in which
students take responsibilities for their own learning, make decisions about the
learning process and make self-regulation in the process (Umay, 2007). In other
words, active learning can be anything course related which students are active
participants of the learning rather than only working, listening and taking notes
(Felder & Brent, 2009). The nature of mathematics is suitable this educational
perspective. Collaborative learning activities are mostly used in active learning and
students have a chance to see different perspectives and solutions of other groups for
a situation with collaborative learning (Umay, 2007).
The current study focused on geometry and measurement content standards of
middle school mathematics, specifically area concept. Teaching of measuring area
concept begins at third grade with non-standard units and beginning from fifth grade,

4
teaching of this concept continues with calculation of area by using standard units
(MoNE, 2009a, 2009b, 2013).
1.1. Students’ Achievement in Geometry and Measurement Concepts
Middle school students have problems with understanding of area and perimeter
concepts, especially situations in which they had to explain or justify their answers
(Huang & Witz, 2013; Tan-ġiĢman & Aksu, 2009, 2012; Zacharos, 2006). In
addition, Tan-ġiĢman and Aksu (2012) stated that seventh grade students have
difficulties in using formulas for area effectively. They often understand the concept
of area as a multiplication of the length of two sides of a polygon (Kordaki & Potari,
2002; Tan-ġiĢman & Aksu, 2012). Tan-ġiĢman and Aksu (2012) also stated that
students have misconceptions with area conservation of a shape which is cut into two
or more parts and recombined. In addition, the most of the relationships between
quadrilaterals are the other concepts that students have difficulty to understand
(Fujita & Jones, 2007).
Moreover, there have been several international studies that measure and compare
students’ achievement and performance in mathematics (Tutak & Birgin, 2008).
Trends in International Mathematics and Science Study (TIMSS) and Program for
International Student Assessment (PISA) results indicated that the geometry and
measurement achievements of Turkish middle school students are lower than the
international average (Ubuz, Üstün & ErbaĢ, 2009). In TIMSS-R 1999, Turkey
ranked 34th
for geometry achievement and ranked 32nd
for measurement achievement
in 38 participating countries (Mullis et al., 2000). In TIMSS 2007, Turkey ranked
30th
for general mathematics achievement in 48 participating countries (Uzun,
Bütüner & Yiğit, 2010). In PISA 2009, Turkey’s average scores in overall were
below the Organisation for Economic Co-operation and Development (OECD)
average. In PISA 2006, Turkey was 29th
in 30 participating OECD countries
(Köseleci-Blanchy & ġaĢmaz, 2011).
According to Berberoğlu (2004), students in Turkey can perform lower achievement
level than students in European Union, and the reasons of this low level achievement
can be students’ misconceptions, obtaining relevant information for geometry from a

5
single source, and memorizing lots of geometric concepts. Therefore, students cannot
see the relationship and implications at given situation and many students are not
learning geometry and measurement as they are expected to learn (Berberoğlu, 2004;
Mayberry, 1983). Therefore, many students graduated from elementary school
without enough knowledge about geometry related topics (Clements & Battissa,
1992; Ubuz & Üstün, 2004). According to Fidan and Türnüklü (2010), a reason for
these difficulties and misconceptions can be that geometric thinking level of students
are not considered while preparing learning environments.
Literature review revealed that the van Hiele geometric thinking theory is the most
common used theory to describe of students’ thinking about two-dimensional
geometry (Batista, 2002; Olkun, Sinoplu & Deryakulu, 2005). If learning
environments prepared by considering students’ geometric thinking levels, they can
learn geometric concepts sufficiently (Choi-Koh, 1999). In light of these arguments,
one aim of the current study is to consider students’ geometric thinking levels as
independent variable.
In order to deal with these difficulties and misconceptions, Tan-ġiĢman and Aksu
(2012) suggested teaching concepts of measurement rather than formulas,
administrating experience-based activities and activities for conservation of area
which include cutting and recombining polygons, and forming formulas for area after
learning concepts with these activities. In adittion, Fidan and Türnüklü (2010) stated
that concepts should be not given directly to students, activities that provide
opportunities to students to construct these concepts by their own should be used in
learning process. Furthermore, Fujita and Jones (2007) suggested that activities,
which provide realizing hierarchical relationships of quadrilaterals and provide
opportunities to students for making deductive reasoning, can be used in learning
environments. Therefore, learning activities which provide these opportunities were
prepared for the current study.
In the current study, learning environments were prepared to make students active
participants of learning process and to support collaborative learning. Activities used
in the study were prepared considering the suggestions of Fujita and Jones (2007)

6
and Tan-ġiĢman and Aksu (2012). These activities involve not only relationships
between quadrilaterals but also conservation of area concepts. The activities were
designed as experience-based activities. In these activities, students formed formulas
for area of quadrilaterals after exploring of area concept and observing the situations
given in activities. Computer technology can provide such rich activities for
addressing these relationships and rules conceptually.
1.2. Technology and Mathematics
In recent decades, the use of technology has increased and changed our life. In every
part of our life, we use computers, mobile phones, etc. (Wilken & Goggin, 2012).
With the changes in computer technology, educators have started to deal with how
computer technology can be integrated into education. Computers can concretize an
abstract concept of mathematics by transferring it to screen visually (Tutak & Birgin,
2008). Students can construct their knowledge by using technological educational
tools (Tutkun et al., 2012). In mathematics, we can specify technological educational
tools as Computer Algebra Systems (CAS), and Dynamic Geometry Software (DGS)
(Ruthven, 2009).
The first DGS, called “Geometric Supposer”, was developed for the Apple II
microcomputer (Oldknow, 2007). Some well-known DGS are GeoGebra, Cabri, and
Geometer's Sketchpad (Aytekin & Özçakır, 2012). DGS are tools for
mathematicians, like telescope and microscope for scientists, to make new
discoveries and test theorems (Oldknow, 2007). Geometry becomes a practical
science for also students with the help of DGS. Students can observe, record,
manipulate, and predict geometric objects and concepts. In addition, students can test
beliefs, ideas and theorems with DGS. (Forsythe, 2007; Hill & Hannafin, 2001).
According to Dye (2001), “DGS provides an ideal medium for learning geometry”.
The most important characteristic of DGS in contrast to traditional tools is that
objects, drawn or constructed, can be moved and resized interactively. The other
important characteristics of DGS is that objects constructed with DGS keep their
geometric properties while manipulating, such as, a rectangle, constructed correctly
by its basic properties will remain a rectangle even its vertices or sides are moved

7
(Dye, 2001). In other words, students can manipulate the geometric shape by not
changing its basic properties and can observe changes with real-time measures
(Aydoğan, 2007).
One of the DGS is GeoGebra which was developed by Markus Hohenwarter.
GeoGebra is an interactive geometry software for education in schools
(Hohenwarter, Hohenwarter & Lavicza, 2010). GeoGebra is a very useful
educational tool for nearly all subjects and all levels of mathematics. Because,
GeoGebra covers algebra, geometry and calculus (Akkaya, Tatar & Kağızmanlı,
2011; Hohenwarter & Jones, 2007). Geogebra is an open-source and free tool. It has
multi-language support. In addition, GeoGebra can be used by basic computer skills
(Hohenwarter, Hohenwarter & Lavicza, 2010).
1.3. Purpose of the Study
The purpose of this research is to investigate effects of mathematics instruction
supported by dynamic geometry activities and van Hiele geometric thinking levels on
students’ achievement in area of quadrilaterals.
1.4. Research Questions of the Study
The study focused on the following research questions.
Problem 1. What are the effects of instruction based on dynamic geometry activities
compared to traditional instruction method and van Hiele geometric thinking levels
on seventh grade students’ achievement in area of quadrilaterals?
Sub-problem 1.1. What are the effects of instruction based on dynamic geometry
activities compared to traditional instruction method on seventh grade students’
achievement in area of quadrilaterals?
Sub-problem 1.2. What is the interaction between effects of instruction based on
dynamic geometry activities compared to traditional instruction method and van
Hiele geometric thinking levels on seventh grade students’ achievement in area
of quadrilaterals?

8
Sub-problem 1.3. What are the effects of instruction based on dynamic geometry
activities compared to traditional instruction method on achievement of seventh
grade students, at van Hiele geometric thinking level 0, in area of quadrilaterals?
Sub-problem 1.4. What are the effects of instruction based on dynamic geometry
activities compared to traditional instruction method on achievement of seventh
grade students, at van Hiele geometric thinking level 1, in area of quadrilaterals?
Sub-problem 1.5. What are the effects of instruction based on dynamic geometry
activities compared to traditional instruction method on achievement of seventh
grade students, at van Hiele geometric thinking level 2, in area of quadrilaterals?
1.5. Significance of the Study
One of the basic suggestions of Mathematics Curriculum of Turkey is usage of
technology effectively in instructional phase (MoNE, 2009a, 2013). According to
this basis, Ministry of National Education (MoNE) place emphasis on the integration
of Information and Communications Technology with education to sustain
memorability of information. For this purpose, MoNE has started to set up
Technology Classes (TC) in schools (Çelen, Çelik & Seferoğlu, 2011). In addition to
TC, MoNE has started a pilot study of F@TIH Project which is about enhancing
usage of technology in schools (Tezci, 2011). Instructional technology will be used
more efficiently in Elementary and Secondary Schools through the F@TIH Project.
As a result of these, instructional tools which based on computer technology will be
used in lessons (MoNE, 2011). Although these progresses can provide using
computer technology in lessons, useful and various activities based on computer
technology for all content areas of mathematics are needed. Considering these
developments in the educational policies, this study aimed to develop and use
activities about area of quadrilaterals based on dynamic geometry software.
Previous studies indicated that middle school students have problems with
understanding of area and perimeter concepts, and have misconceptions with
conservation of area (Huang & Witz, 2013; Tan-ġiĢman & Aksu, 2009, 2012;
Zacharos, 2006).

9
Choi-Koh (1999), and Fidan and Türnüklü (2010) stated that students can learn
geometric topics as expected if the learning activities were prepared according to
their geometric thinking levels. In addition, Fujita and Jones (2007) stated that
activities, which provide realizing hierarchical relationships of quadrilaterals and
provide opportunities to students for making deductive reasoning, can be a bridge
between van Hiele Level 1 and Level 2. In this sense, in the current study effects of
the learning activities were determined. In this way, it was aimed to determine
students with which van Hiele geometric thinking level benefits from this type of
learning activities. The activities used in the current study generally include
hierarchical relationships of quadrilaterals. In this study, van Hiele hierarchy was
used as an independent variable in order to investigate whether the hierarchical
relationships of quadrilaterals has an effect on students’ achievement about area of
quadrilaterals or not by providing a bridge between van Hiele Level 1 and Level 2 as
Fujita and Jones (2007) stated.
Previous studies indicated that dynamic geometry software or computer based
instruction improved students’ achievement in mathematics and improved interests
and participation to mathematics (Aydoğan, 2007; Baki, Kosa & Güven, 2011;
Doğan & Ġçel, 2011; Gecü, 2011; Güven & KarataĢ, 2009; Hohenwarter,
Hohenwarter & Lavicza, 2010; ġataf, 2011; Toker-Gül, 2008). However, few of
them (IĢıksal & AĢkar, 2005; Kurak, 2009; Selçik & Bilgici, 2011; Ubuz, Üstün &
ErbaĢ, 2009; Yılmaz et. al., 2009) focused on the effects of dynamic geometry
software or computer based instruction on seventh grade students’ achievement in
mathematics. There still occurs a need to understand how technology enhances
seventh grade students’ achievement in mathematics.
This study is planned to provide a framework analysis about how technology
enhance students’ learning in area of quadrilaterals and some information about
students’ achievements in area of quadrilaterals according to their Van Hiele
Geometric Thinking Level. This study addresses the effects of mathematics
instruction supported by dynamic geometry activities and van Hiele geometric
thinking levels on students’ achievement in area of quadrilaterals.

10
1.6. Hypotheses of the Study
These null hypotheses were used to answer the research question.
Null Hypothesis 1: There is no significant mean difference between the comparison
and experimental groups, and van Hiele geometric thinking levels on the population
means of students’ scores on Area of Quadrilateral Achievement Test.
Null Hypothesis 1.1: There is no significant mean difference between the
comparison and experimental groups on the population means of students’
scores on Area of Quadrilateral Achievement Test.
Null Hypothesis 1.2: There is no significant interaction effect of treatments and
van Hiele geometric thinking levels on the population means of students’ scores
on Area of Quadrilateral Achievement Test.
Null Hypothesis 1.3: There is no significant mean difference between the
comparison and experimental groups on the population means of scores of
students, at van Hiele geometric thinking level 0, on Area of Quadrilateral
Achievement Test.
Null Hypothesis 1.4: There is no significant mean difference between the
comparison and experimental groups on the population means of scores of
students, at van Hiele geometric thinking level 1, on Area of Quadrilateral
Achievement Test.
Null Hypothesis 1.5: There is no significant mean difference between the
comparison and experimental groups on the population means of scores of
students, at van Hiele geometric thinking level 2, on Area of Quadrilateral
Achievement Test.
1.7. Definition of the Important Terms
Quadrilateral: A quadrilateral is a polygon with four sides and corners. It is a closed
four sided plane figure (Usiskin et al, 2008).
11
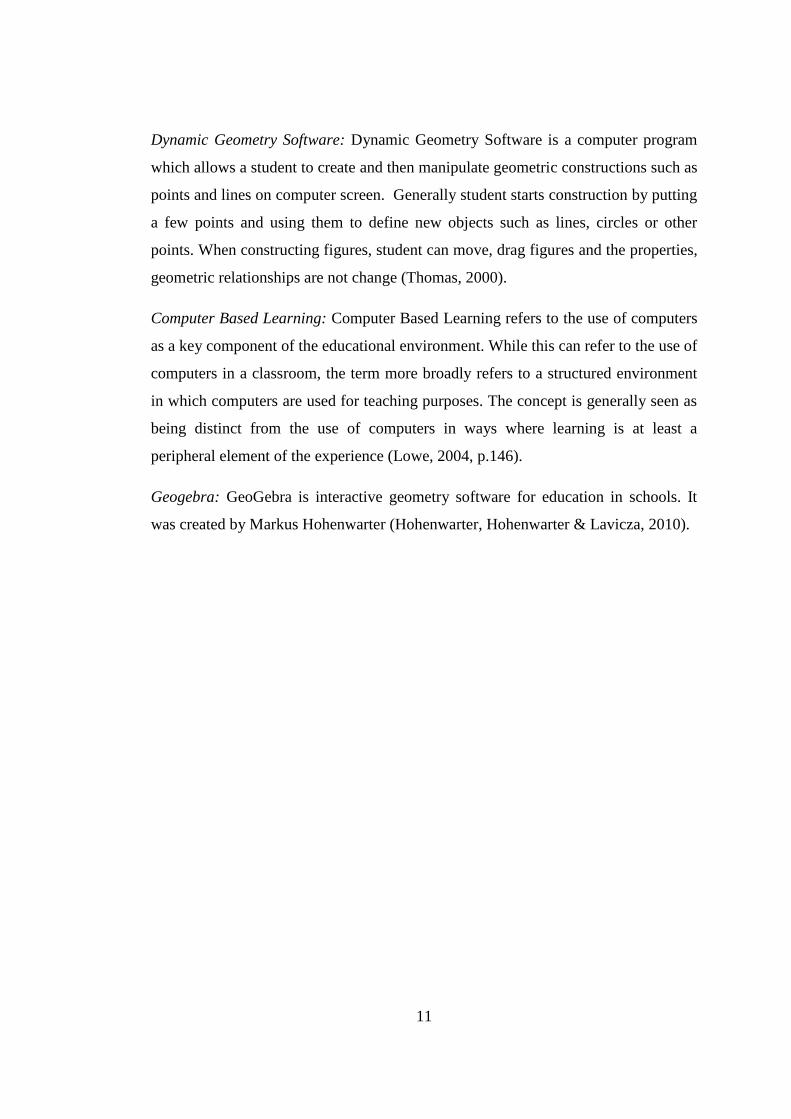
Dynamic Geometry Software: Dynamic Geometry Software is a computer program
which allows a student to create and then manipulate geometric constructions such as
points and lines on computer screen. Generally student starts construction by putting
a few points and using them to define new objects such as lines, circles or other
points. When constructing figures, student can move, drag figures and the properties,
geometric relationships are not change (Thomas, 2000).
Computer Based Learning: Computer Based Learning refers to the use of computers
as a key component of the educational environment. While this can refer to the use of
computers in a classroom, the term more broadly refers to a structured environment
in which computers are used for teaching purposes. The concept is generally seen as
being distinct from the use of computers in ways where learning is at least a
peripheral element of the experience (Lowe, 2004, p.146).
Geogebra: GeoGebra is interactive geometry software for education in schools. It
was created by Markus Hohenwarter (Hohenwarter, Hohenwarter & Lavicza, 2010).

12
CHAPTER 2
REVIEW OF THE RELATED LITERATURE
The goal of this study is to investigate the effects of geometry instruction supported
by dynamic geometry activities and van Hiele geometric thinking levels on seventh
grade students’ achievement in area of quadrilaterals. This chapter is devoted to the
review of literature related to this study. The concepts which were covered in this
chapter are; geometric thinking of students, quadrilaterals and their classification,
area measurement and studies related with Dynamic Geometry Software.
2.1. Geometric Thinking of Students
The difficulties that the students have in learning geometry were noticed by Pierre
van Hiele and his wife, Dina van Hiele-Geldof (Mason, 1998; Usiskin, 1982). The
van Hieles began thinking the concept, they tried to teach, could be too advanced for
their students (Malloy, 2002). In order to deal with students’ difficulties in learning
geometry, they started to explore the prerequisite reasoning abilities needed for
successfully understanding the geometric concepts (Malloy, 2002; Mason, 1998).
After their observation, they developed a theory involving students understanding
levels of geometry. This theory explains why students encounter difficulties in
learning geometry (Malloy, 2002; Usiskin, 1982). According to Crowley (1987), this
theory consists of five levels of understanding geometry. These levels are
visualization, analysis, informal deduction, formal deduction and rigor. A brief
explanation about these levels is presented below (Crowley, 1987; Duatepe, 2004;
Malloy, 2002; Mason, 1998; Orton, 2004; Pegg, 1992; Toker-Gül, 2008; Usiskin,
1982).
Level 0 – Visualization: This level is the initial stage of students understanding of
geometry. In this level students can name and recognize shapes by their appearance,
but cannot specifically identify properties of shapes. For example, student may

13
recognize a geometric figure such as rectangle by it appearances without knowing
their properties. Also, he can copy given shapes on paper or geoboard. However, he
cannot say that this shape has right angels or has parallel sides.
Level 1 – Analysis: This level is also named as description level. At this level,
students begin to identify properties of shapes and learn to use appropriate
vocabulary related to properties. However, they cannot make connections between
different shapes and their properties. For example, a student at his level can classify a
square by some properties, such as having right angles or equal sides. However, they
cannot see interrelationships between and among properties, yet.
Level 2 – Informal Deduction: Students in this level are able to recognize
relationships between properties (e.g. if in a quadrilateral, opposite angles are equal
then opposite sides are parallel) and among properties (e.g. a rectangle is a
parallelogram since its opposite sides are parallel). In addition, they are able to
follow logical arguments using such properties. Therefore, students can see figures in
a hierarchical order if they can achieve this level. Moreover, they can classify figures
with minimum sets of properties.
Level 3 – Deduction: At this level, students can go beyond just identifying
characteristics of shapes or classifying shapes with a hierarchical order. They are
able to construct proofs, using postulates or axioms and definitions, in more than one
way.
Level 4 – Rigor: This level is the highest level of thought in the van Hiele hierarchy.
Students at this level can work in different geometric or axiomatic systems. They can
study with non-Euclidean geometries and different systems.
According to Mason (1998), progress from one level to next level is more related
with students’ educational experiences than with age or maturation of them, and a
student if has not mastered all previous levels, he/she cannot achieve next level.
Understanding students’ knowledge at each van Hiele level is important to develop
suitable teaching materials, activities and instructions, since students’ perception to

14
geometrical concepts is different at all levels (Malloy, 2002; Pegg, 1992). Students at
middle grades can be at different levels of understanding. In order to deal with this
differentiation, Malloy (2002) suggests that learning activities should include
concrete tools, drawing stages and symbolic notations. In brief, in order to develop
students understanding in geometry, teachers need to understand the van Hiele levels
of their students and they should help them advance through these levels with
appropriate learning tools (Malloy, 2002; Mason, 1998; Pegg, 1992).
In geometry and measurement subcategories of TIMSS and geometry of space and
figures subcategory of PISA, students in Turkey performed lower level achievement
than average achievement level (Mullis et al., 2000; Ubuz, Üstün & ErbaĢ, 2009;
Uzun, Bütüner & Yiğit, 2010). The most important reason of this is that students’
geometric thinking levels are not considered while teaching geometry, therefore,
students cannot learn geometric concepts sufficiently (Fidan & Türnüklü, 2010).
Choi-Koh (1999) stated that if geometric concepts are taught to students by
considering their geometric thinking level, they can succeed in geometry.
According to NCTM (2010), student should be achieve first level of van Hiele (Level
0) hierarchy at kindergarten to second grade, second level (Level 1) at third grade to
fifth grade, and third level (Level 2) at sixth grade to eight grade. In order to
understand mathematical proofs in high school mathematics, students should have
achieved third level of van-Hiele hierarchy at elementary school (Cansız-AktaĢ &
AktaĢ, 2012). Fujita and Jones (2007) suggest that hierarchical classification of the
quadrilaterals can be used to help students to achieve informal deduction level of
van-Hiele geometric thinking.
The van Hiele geometric thinking model has been subject of critics for researchers
across the globe (Atebe, 2009; Pegg, 1992). One of the discussions is attaining
students into discrete five levels (Pegg, 1992). Although there are evidences that
support hierarchical nature of the van Hiele levels (Mayberry, 1983; Pegg, 1992;
Usiskin, 1982) there are some opinions about continuity of levels (Atabe, 2009;
Pegg, 1992). Moreover, students can be at different levels for different concepts
(Pegg, 1992). Other discussions are about difficulties of testing the rigor level of van

15
Hiele hierarchy and need for a level below the visualization level. In study of Usiskin
(1982) 75% of students could be assigned to a level. Usiskin (1982) and Mayberry
(1983) were found numbers of students who cannot meet even visualization level of
van Hiele hierarchy in their studies. According to Clements and Battista (1992),
some of the geometric thinking of students can be primitive than visualization level
of van Hiele geometric thinking model. They propose a level which they called as
pre-recognition level. Students at this level can realize different between curvilinear
and rectilinear shapes but cannot differentiate shapes in same class. In addition,
Usiskin (1982) stated that “Level 5 either does not exist or is not testable” about
existence or non-existence of rigor level of van Hiele model. Another critique is that
if students are assigned into van Hiele levels based on certain criteria, levels of
students can change by changing these criteria. Usiskin (1982) demonstrated that a
student’s level change based on the criteria used, even tasks or questions are still
same.
In spite of all these criticisms, the researchers remain optimistic about the possibility
of finding ways of improving the geometric understanding of students by considering
van Hiele geometric thinking levels (Orton, 2004, p. 183).
2.2. Quadrilaterals and Their Classification
Geometry content area of Elementary School Mathematics Curriculum (ESMC) is
focused on developing the relationship between geometric figures by thinking their
basic properties. Hence, students should classify geometric figures by using their
minimal needed characteristics (i.e. rectangle is a parallelogram with right angles)
(MoNE, 2009a). According to Cansız-AktaĢ and AktaĢ (2012) students can achieve
seeing relationships between geometric figures at 3rd
van Hiele level. At that level,
students recognize square as a special type of rectangle or parallelogram or rhombus.
According to Cansız-AktaĢ and AktaĢ (2012), ESMC covers the hierarchical
relationships of quadrilaterals. In curriculum, rhombus is defined as a parallelogram
with perpendicular diagonals, square is defined as a special type of rectangle, and
rectangle is defined as a parallelogram with right angles. In addition, in Elementary
Mathematics Textbook written by Aygün and others (2011), parallelogram, square

16
and rectangle are defined as a type of trapezoid (p. 221, p. 231). Therefore, we can
say that inclusive definition of trapezoid is accepted by ESMC.
Identifying mathematical objects with definitions is very important to develop
deductive reasoning and proving of students, since the definitions assign properties
to objects and understanding definition of an object requires representing the figure
of this object and neighboring objects in order to see similarities and differents
(Fujita & Jones, 2007).
According to Usiskin and others (2008), there are two definitions of trapezoid that
can be found in mathematics textbooks. First definition is that “A trapezoid is a
quadrilateral with exactly one pair of parallel sides”. This definition called as
exclusive definition. Because, according to this definition, parallelograms are not
under of trapezoid in hierarchy of quadrilaterals.
Figure 2.1 An exclusive hierarchy of quadrilaterals with five special types of
quadrilaterals.
Second definition of it is that “A trapezoid is quadrilateral with at least one pair of
parallel sides”. It is inclusive definition of trapezoid and according to this all
parallelograms are special type of trapezoid. (Usiskin, et al., 2008).
Qu
adri
late
rals
Trapezoids
Parallelograms
Rectangles
Squares Rhombus
Squares

17
Figure 2.2 An inclusive hierarchy of quadrilaterals with five special types of
quadrilaterals.
According to inclusive hierarchy, quadrilaterals can be classified as;
Square is a regular quadrilateral. All sides and also all angles of it are equal.
It is an equiangular and also an equilateral quadrilateral.
Rectangle is other equiangular quadrilateral. All angles of rectangle are equal.
Rhombus is a type of equilateral quadrilateral. All sides of rhombus are
equal.
Opposite sides of square, rectangle and rhombus are parallel.
A quadrilateral with opposite sides parallel is known as parallelogram.
A quadrilateral with one pair of sides parallel is trapezoid. (Usiskin, et al.,
2008; De Villiers, 1996).
The hierarchical classification of quadrilaterals requires logical deduction and
suitable interactions between concepts and images (Fujita & Jones, 2007). In other
words, students can classify quadrilaterals by their basic properties and can see their
relationships, when they achieved the Level 2 of van-Hiele geometric thinking levels
(Cansız-AktaĢ & AktaĢ, 2012). ESMC suggests that student should construct their
own knowledge. In order to achieve this, students should attach their former
knowledge with newer concepts by recognizing the relationships (MoNE, 2009a).
Especially perimeter and area topics in measurements contents area of ESMC,
students should be classify and see the relationships of quadrilaterals to find
perimeter and area formulas of quadrilaterals. However, according to Olkun and
Qu
adri
late
rals
Trapezoids Parallelograms Rectangles
Squares Rhombus
Squares

18
Aydoğdu (2003) and AktaĢ and Cansız-AktaĢ (2012), some seventh and eighth grade
students cannot see the relationships of quadrilaterals. They have imperceptions to
see square or rectangle as a type of parallelogram.
2.3. Area Measurement
Measurement is an essential part of mathematics and it plays an important role in
daily life. It is also significant for understanding shapes, determining locations of
objects in coordinate system and finding size of an object (Battista, 2007). In other
words, measurement can connect not only content areas of mathematics with each
other but also mathematics with science and daily life (Altun, 2008; Battista, 2007;
Umay, 2007). In addition, learning measurement provides to see usage of
mathematics in real world and to develop many skills and concepts of mathematics
(Tan-ġiĢman & Aksu, 2012). In spite of these roles of measurement, students should
understand not only meaning of measurement but also doing measurement (Battista,
2007; Chambers, 2008; Tan-ġiĢman & Aksu, 2009).
Measuring is a process of filling, covering or matching an attribute of an object with
a unit of measure with same attribute (Olkun & Toluk Uçar, 2009; Van de Walle,
2007). Measuring has three steps. These are deciding on attribute to be measured,
selecting a unit with same attribute, and comparing the units by filling, covering or
matching with the attribute of the object which was decided to be measured (Van de
Walle, 2007). In other words, firstly students need to decide which attribute of an
object to be measured. The attribute can be height, area, volume, weight or time.
When they decided on an attribute, they need to select a unit with same attribute to
measure. Lastly, they compare the units with the attribute of the object by lining up
the units for height, covering the base of the object for area or filling inside of the
object with the units for volume (Altun, 2008; Van de Walle, 2007).
One of the mostly used concepts of measurement is measuring area. Area can be
defined as “the amount of surface that is enclosed within a boundary” (Baturo &
Nason, 1996, p. 238). Area measurement connects numbers content area and
measurement content area like other concepts of measurement (Kordaki & Potari,
2002; Tan-ġiĢman & Aksu, 2009, 2012). According to Reynold and Wheatley

19
(1996), area measurement has four assumptions. First assumption is that a suitable
two-dimensional region is selected as a unit, and secondly, congruent regions of unit
have equal areas. Then, the region, which was selected to be measured, is covered by
unit regions disjointly (no overlapping). Finally, the sum of areas of unit regions is
the area of the union of these disjoint unit regions.
Understanding of area measurement requires comprehending the attribute of area and
conservation of area when same region is moved or reshaped, in addition, it requires
understanding to measure area by iterating units of area, to use numerical process to
determine area for special classes of shapes, and representing the numerical
processes with words and algebra (Battista, 2007). Many students cannot
comprehend the relationship between unit – measure iteration and numerical
measurements (Battista, 2007). Moreover, TIMSS results indicate that students’
performance in measurement is lower than any other topics in the mathematics
curriculum (Van de Walle, 2007). According to Battista (2007), students’ difficulties
in measurement should be considered as worrying, since measuring is important for
most of real life application of geometry. In addition, Battista (2007) stated that area
and surface area performances of students were lower. Similarly, Tan-ġiĢman and
Aksu conducted studies in 2009 with seventh graders and in 2012 with sixth graders
about students’ performance on topics of perimeter and area. The results of these
studies indicated that students have problems with area and perimeter concepts,
especially in situations which they had to explain their answers. Similar results were
founds by Huang and Witz (2013), and Zacharos (2006). Moreover, Tan-ġiĢman and
Aksu (2012) stated that middle grade students have difficulties in using formulas for
area and they have misconceptions with conservation of area which is separated into
parts and rearranged. Students commonly understand area as a multiplication of the
length of two sides.
According to Van de Walle (2007), the ways of teaching and relying on pictures and
worksheets in learning environments rather than hands-on experiences may cause
these misunderstanding and difficulties. Since, students have few opportunities to
develop their understanding, although they can apply the formulas for area of a
polygon in standard problem contexts, they generally cannot apply the formulas in

20
non-standard problem contexts (Battista, 2007; Tan-ġiĢman & Aksu, 2009, 2012;
Zacharos, 2006).
2.4. Studies Related with Dynamic Geometry Software
Dynamic geometry software (DGS) tools are used as classroom tools nowadays.
DGS can be helpful while teaching both two-dimensional and three-dimensional
geometry (Hohenwarter, Hohenwarter & Lavicza, 2010). Several researchers dealt
with the effects of computer based learning with dynamic geometry software. They
found that the use of technology as classroom tools is beneficial for students’
learning, and developing their understanding in geometry. Because students can
explore, conjecture, construct and define geometrical relationship while interacting
with DGS (Jones, 2000).
Students have the opportunity to see and explore different construction of an object.
DGS can give easier access to lots of geometrical concepts and different views of
geometrical constructs than paper and pencil construction. Because students can
change or move the shape that they draw and they can see different aspects of it
(Aarnes & Knudtzon, 2003).
Hohenwarter, Hohenwarter and Lavicza (2010) aimed to assess the usability of the
GeoGebra and to identify features and difficulties of GeoGebra during its
introduction to mathematics teachers in their study. They stated that based on
feedback and ratings of a Likert scale test workshops was rated feasible and
appropriate for the participating teachers. In addition, the participants stated usability
and versatility of GeoGebra as user friendly, easy and intuitive to use and potentially
helpful to mathematics teachers in written response of questionnaires.
There are many studies about the effects of dynamic geometry software to develop
students’ understanding and their achievement in mathematics. These studies
concluded that use of technology in the mathematics classroom as learning tools is
beneficial in developing students’ understandings (Boyraz, 2008; ErbaĢ & Aydoğan -
Yenmez, 2011; Filiz, 2009; Güven & Kosa, 2008; Ġçel, 2011; Köse, 2008; Kurak,
2009; Özen, 2009; Ubuz, Üstün & ErbaĢ, 2009), enhancing their achievements

21
(Aydoğan, 2007; Baki, Kosa & Güven, 2011;Demir, 2010; Doktoroğlu, 2013; Ersoy,
2009; Filiz, 2009; Gecü, 2011; Güven & KarataĢ, 2009; Ġçel, 2011; Kepceoğlu, 2010;
Selçik & Bilgici, 2011; ġataf, 2010; Toker-Gül, 2008; Tutak & Birgin, 2008;
Vatansever, 2007; Yılmaz et. al., 2009; Zengin, 2011), and durability of knowledge
(ErbaĢ & Yenmez, 2011; Ġçel, 2011; Selçik & Bilgici, 2011; Vatansever, 2007).
Kurak (2009) investigated the effects of using DGS on students’ understandings
levels of transformation geometry and their academic successes. The subjects of
study were two different groups of seventh graders in Trabzon. In this study,
researcher applied DGS based instruction to experimental group and traditional
teaching materials based instruction to control group. Results of study showed that
although students’ achievements in transformation geometry were not significantly
different, understanding levels of students in experimental group was higher than
students in control group.
Gecü (2011) investigated the effects of using DGS as a virtual manipulative with
digital photographs on achievement and geometric thinking levels at 4th
and 8th
grade
students. In this study, Gecü (2011) found that using DGS as learning tool facilitated
students’ learning both 4th
and 8th
grade levels, and improves academic achievement
for 4th
grade students.
Baki, Kosa and Guven (2011) examined the effects of using DGS Cabri 3D and
physical manipulative on the spatial visualization skills of pre-service mathematics
teachers. The subjects were selected from undergraduate program in the Department
of Elementary Education at the Karadeniz Technical University. There are three
groups of subjects. The first experimental group used DGS Cabri 3D as a virtual
manipulative, the second experimental group used physical manipulative. The
control group received traditional instruction. The physical manipulative and DGS-
based types of instruction are more effective in developing the students’ spatial
visualization skills than the traditional instruction. In addition, they found that the
students in the DGS-based group performed better than the physical manipulative-
based group.

22
Toker-Gül (2008) conducted a study to investigate the effects of using dynamic
geometry software while teaching by guided discovery compared to paper-and-pencil
based guided discovery and traditional teaching method on sixth grade students’ van
Hiele geometric thinking levels and geometry achievement. The sample of the study
consisted of 47 sixth grade students in private schools of Ankara. There were two
experimental and one control groups. First experimental group received guided
instruction with DGS. Other experimental group received instruction with paper-and-
pencil based guided discovery method. The control group received traditional
instruction. The results of study indicated that there was a significant effect of using
dynamic geometry software while teaching by guided discovery method on students’
geometry achievement.
Ubuz, Üstün and ErbaĢ (2009) conducted a study to compare the effects of
instruction utilizing a dynamic geometry environment to traditional lecture based
instruction on seventh grade students’ learning of line, angle, and polygon concepts.
The sample consisted of 15 girls and 16 boys in the experimental group and 17 girls
and 15 boys in the control group with ages ranging from 12 to 14 years. A geometry
achievement test covering seventh grade geometry topics was prepared to investigate
students’ achievement in geometry as an instrument. This study has shown that, if
used appropriately, dynamic geometry environments as an instruction tool in
geometry instruction can improve student achievement in geometry and enhance
students’ ability of conjecturing, analyzing, exploring, and reasoning.
Aydoğan (2007) conducted a study to investigate the effects of using a dynamic
geometry software environment together with open-ended explorations on sixth
grade students’ performance in polygons and congruency and similarity of polygons.
The students in experimental group studied geometric concepts by open-ended
explorations in a dynamic geometry software environment while the students in the
control group received instruction via traditional methods. Geometry Test and
Computer Attitude Scale were used as data collection instruments. The researcher
stated that by analyzing pre-test scores there was no significant difference between
the groups. On the other hand, the results of the post and delayed posttests which
were analyzed by independent sample t-test showed that the experimental group

23
achieved significantly better than the control group in polygons, and similarity of
polygons concepts. In addition, the researcher observed a statistically significant
correlation between Computer Attitude Scale and Geometry Test. In conclusion, the
researcher stated that dynamic geometry software environment together with open-
ended explorations significantly improved students’ performances in polygons and
similarity of polygons.
Yılmaz et. al. (2009) investigated the effect of dynamic geometry software Cabri’s
on 7th
grade students’ understanding the relationships of area and perimeter topics.
They concluded that a great number of students in treatment group corrected their
misunderstandings which they had before the treatment. In addition to this, dynamic
geometry based activities enhanced academic success level of students.
ġataf (2011) conducted a study about determining the effect of GeoGebra based
instruction on 8th
grade pupils’ achievements and attitudes. As a result of this study
researcher stated that the experimental group achieved high level succession with
Geogebra in transformation geometry.
Ġçel (2011) analyzed the effects of GeoGebra an eighth grade students’ achievements
in the subjects of triangles. Ġçel (2011) stated that GeoGebra has positive effects on
students’ learning and achievement. Moreover, according to results, GeoGebra is
effective DGS tool in enhancing the durability of acquired knowledge.
Selçik and Bilgici (2011) conducted a study to investigate the effect of GeoGebra on
7th
grade students’ achievements in polygons. In this study, the students, participated
GeoGebra based instruction group, showed higher level achievement in the subject
of polygons. In addition, Selçik and Bilgici (2011) stated that GeoGebra based
instruction provides durability of knowledge.
2.5. Summary of the Literature Review
Students’ understanding of geometrical concepts is different at each van Hiele
geometric thinking level. Therefore, considering students’ geometric thinking levels
is important while developing suitable teaching materials, activities and instructions.
In addition, an appropriate instructional design can be used for developing students’

24
geometric thinking and achievement. Literature review revealed that DGS can
provide easier access lots of geometrical concepts and different views of geometrical
shapes than paper and pencil construction. Moreover, previous studies indicated that
using DGS in learning phase is helpful to develop students’ geometric thinking and
achievement in mathematics. However, the dynamic geometry software environment
cannot evolve and cannot become more beneficial to students in their understanding
of geometry without researches that explore the limitations and advantages of them
in specific areas.

25
CHAPTER 3
METHODOLOGY
This chapter explains design of the study, participants, instruments, variables,
procedure, teaching and learning materials, treatment, methods for analyzing data,
and internal validity of the study.
3.1. Design of the Study
This study was conducted with 7th
graders in a public elementary school. Because of
school regulations it was not possible to assign students randomly in two groups, so,
this study conducted with already intact groups. Therefore, the research questions of
the study were examined through nonrandomized control group pretest-posttest
design since this study did not include random assignment of participants to
comparison and experimental group. Table 3.1 describes the design of the study.
Table 3.1 Research Design of the Study
Experimental Group Comparison Group
Pretests Van Hiele Geometric Thinking Level Test
Readiness Test for Area And Perimeter Concepts
Treatment Mathematics instruction
supported by DGS Traditional instruction
Posttests Area of Quadrilateral Achievement Test
3.2. Participants
The participants in the study were 76 seventh grade students in a public elementary
school in KırĢehir. The participants did not learn area of quadrilaterals topic before

26
treatment. This public elementary school was selected for this study conveniently
since this school fit for technological requirements of this study. This school had
enough number of computers in computer laboratory and the hardware of these
computers was sufficient to run GeoGebra effectively. Moreover, mathematics
teacher of this school was willing to integrate the GeoGebra into his curriculum. In
total, two classes out of five 7th
grade classes were selected from this school. In this
school classes were not formed according to students’ achievements. The
distributions of classes in comparison and experimental group and class sizes are
given in Table 3.2.
Table 3.2 Groups distributions
Class Group Number of Boys Number of Girls Total
7/C Comparison Group 17 19 36
7/B Experimental Group 20 20 40
Total Number 37 39 76
3.3. Instruments
In order to gather data, three instruments were used in the study: Readiness Test for
Area and Perimeter Concepts (RTAP), Area of Quadrilaterals Achievement Test
(AQAT), and Van Hiele Geometric Thinking Level Test (VHLT). RTAP and AQAT
were developed by researcher and they were piloted before the study to check their
reliability, appropriateness, clarity of the items, discrimination of items, and to
determine difficulty of questions. The tests and the pilot study are described below.
3.3.1. Readiness Test for Area and Perimeter Concepts
Students’ level of mathematics achievement in measurement content area before the
treatment was assessed by readiness test for area and perimeter concepts (RTAP)
which was a paper-pencil test (Appendix B). The RTAP was developed by researcher
to investigate the students’ readiness to the topic before the treatment. The RTAP
consisted of three objectives of 6th
grade mathematics that were;

27
explain the relationship between polygons' sides and their perimeter.
use strategies to estimate area of plane figures.
solve problems involving area of plane figures.
The RTAP includes 18 multiple-choice questions. The questions of the RTAP were
checked for their appropriateness by four researchers with doctoral degree and four
graduate students in the field of Elementary Mathematics Education and two
elementary mathematics teachers. According to their feedback some changes were
made and the RTAP was made ready for pilot study (Appendix A).
3.3.1.1. Pilot Study of RTAP
Participants of pilot study were 139 eighth grade students from Elmalı (Antalya),
Bala (Ankara), Yenimahalle (Ankara), and Van. These students were selected
conveniently. The eighth graders have learned Area and Perimeter Concepts in sixth
and seventh grade. Therefore, these students were selected as participants of pilot
study.
Distribution of questions of RTAP, which was administrated in pilot study, in
objectives was given in Table 3.3.
Table 3.3 Distribution of questions of RTAP in listed objectives
Objectives Questions
identify relationship between perimeter and
side’s length of polygons 6, 7, 9
use strategies to estimate area of plane figures 1, 2, 3, 15
solve problems involving area of plane
figures
4, 5, 8, 10, 11, 12, 13, 14, 16, 17,
18

28
According to the results of the pilot study, proportion of correct answers,
discrimination index, and point-biserial correlation coefficient of each item were
described in Appendix F.
Item difficulty, defined as proportion of students that correctly answered the item,
should be greater than .20, and item’s discrimination index also should be greater
than .20 (Matlock-Hetzel, 1997; Zimmaro, 2003). In addition, according to Varma
(2006), point-biserial correlation coefficient should be greater than .25 to be a good
classroom test. The difficulty, discrimination-index and point-biserial correlation
coefficient of items in the RTAP satisfy these condition, therefore, this test can be
considered as a good classroom test (Zimmaro, 2003).
In summary, average difficulty (proportion of correct answers) of the RTAP was
found as .54 and discrimination index was found as .53. In addition, the Cronbach
Alpha reliability coefficient was found as .81 for the pilot study, which indicates high
reliability. After the pilot study, final version of the RTAP was formed by ordering
items based on their difficulty levels (Appendix B). The reliability of the test was
found as .76 for the current study.
3.3.2. Area of Quadrilaterals Achievement Test
Students’ level of mathematics achievement in area of quadrilaterals after the
treatment was assessed by Area of Quadrilaterals Achievement Test (AQAT) which
was a paper-pencil test (Appendix D). The AQAT was developed by researcher to
investigate the students’ achievement in the topics after the treatment. The AQAT
consisted of seven objectives of 7th
grade mathematics that were;
use strategies to estimate area of quadrilaterals
form an area formula for parallelogram
form an area formula for rhombus
form an area formula for trapezoid
solve problems involving area of quadrilaterals.
identify relationship between perimeter and side’s length
identify relationship between perimeter and area

29
The AQAT included 33 multiple-choice questions before the pilot study (Appendix
C). The questions of the AQAT was checked for their appropriateness by four
assistant professor, one associated professor, four research assistant and two
elementary mathematics teacher. According to their feedback, some changes were
made and the AQAT was made ready for pilot study.
3.3.2.1. Pilot Study of AQAT
Participants of pilot study were 139 eighth grade students. Participants of pilot study
were 139 eighth grade students from Elmalı (Antalya), Bala (Ankara), Yenimahalle
(Ankara), and Van. These students were selected conveniently. The eighth graders
have learned Area and Perimeter Concepts in sixth and seventh grade. Therefore,
these students were selected as participants of pilot study. Seven of these participants
were not reachable at AQAT pilot study. Therefore the number of students in this
part of pilot study was 132.
According to the results of the pilot study, proportion of correct answers,
discrimination index, and point-biserial correlation coefficient of each item were
described in Appendix G. Average difficulty of the AQAT was found as .42 and
discrimination index was found as .45. In addition, the Cronbach Alpha reliability
coefficient was found as .83 for the pilot study, which indicates high reliability.
However, proportion of correct answers, discrimination index, and point-biserial
correlation coefficient of four items of AQAT was not satisfactory. These questions
were not answered correctly by most of the students. Therefore, these questions were
excluded from the final version of the test.
The final version of the AQAT was formed by ordering questions based on their
difficulty levels (Appendix D). The final version of AQAT included 29 multiple-
choice questions. Distributions of questions of the final version of AQAT in
objectives were given in Table 3.4.

30
Table 3.4 Distributions of questions of AQAT in terms of objectives
Topics Objectives Questions
Area of Quadrilaterals
use strategies to estimate area of
quadrilaterals 15, 17, 23, 29
form an area formula for
parallelogram
1, 2, 4, 8, 10, 11,
14, 16
form an area formula for rhombus 5, 18, 19, 28
form an area formula for trapezoid 6, 9, 13
solve problems involving area of
quadrilaterals. 7, 20, 22, 27
identify relationship between side’s
length and area 3, 12, 24
identify relationship between
perimeter and area 21, 25, 26
Average difficulty of the last version of the test was found as .43, discrimination
index was found as .49, and the Cronbach Alpha reliability coefficient was found as
.85 for the pilot study, which indicates higher reliability than former version of
AQAT (Appendix C). In addition, the reliability of the test was found as .79 for the
current study.
3.3.3. Van Hiele Geometric Thinking Level Test
Students’ geometric thinking levels were assessed by van Hiele Geometric Thinking
Level Test (VHLT). The VHLT was developed by Usiskin (1982), and translated and
validated in Turkish by Duatepe (2000) (Appendix E).

31
The VHLT was administrated as pretest to understand the initial geometric thinking
levels of students before study.
The VHLT consists of 25 multiple-choice questions. Distribution of questions into
the van Hiele levels was given in Table 3.5.
Table 3.5 Distribution of questions in to the van Hiele Levels
Van Hiele Level Questions
Level 0 1, 2, 3, 4, 5
Level 1 6, 7, 8, 9, 10
Level 2 11, 12, 13, 14, 15
Level 3 16, 17, 18, 19, 20
Level 4 21, 22, 23, 24, 25
First 15 questions were considered in the study, since, according to NCTM (2010),
students should achieve first three understanding geometry level of van Hiele at
elementary school. Usiskin (1982) suggested two criteria for scoring this test. These
scoring criteria are three of five correct or four of five correct for each level. In the
current study three of five correct answers in each level were used as scoring
criterion. In this test, each student was assigned a weighted sum score in the
following manner in Table 3.6.
Table 3.6 Scoring van Hiele Geometric Thinking Level Test
Criteria
1 Point Three of first five questions of the test are correct
2 Points Three of second five questions of the test are correct
4 Points Three of third five questions of the test are correct

32
These points were added to give the weighted sum. For example, a score of 3
indicates that a student reached the criterion on levels 0 and 1. In this way a score
clearly indicates reached levels. However, if a student satisfies the criterion at levels
0 and 2, the students would have a weighted sum of 1 + 4 or 5 points. According to
this score, the student cannot be assigned any van Hiele level, since in classical van
Hiele theory, a student if has not mastered all previous levels, he cannot achieve next
level. Therefore, Usiskin (1982) suggested a modified scoring method which was
also used in the current study. In Table 3.7 assigning levels for 25 questions was
described by modified van Hiele Level method.
Table 3.7 Modified van Hiele Level
Weighted Sum
Level 0 1 or 17
Level 1 3 or 19
Level 2 7 or 23
Level 3 15 or 31
This modified scoring method was converted for first 15 questions which were
considered for the current study. According to this scoring method, if student take 1
point or 5 point in this test, he is assigned in Level 0 of van Hiele Geometric
Thinking, if a student take 3 points, he is assigned to Level 1, and if a student take 7
points, he assigned to Level 2. In this test, the maximum score is 7 and minimum is
0. In addition, the Cronbach Alpha reliability coefficients range between .31 to .49 in
the study of Usiskin (1982) and .27 to .35 in this study for each five questions.
According to Usiskin (1982), reason for the low reliabilities is the small number of
items. In this study the reliability of this test for all questions was .72.
3.4. Variables
Variables of this study can be categorized as independent variables, dependent
variable and covariate.

33
3.4.1. Independent Variables
In this study there were two independent variables. One of them was the treatment
which was mathematics instruction supported by dynamic geometry activities and
regular instruction of the class. The other independent variable was the scores of
VHLT. The scores of VHLT were divided into three categories which were van
Hiele geometric thinking Level 0, Level 1 and Level 2.
3.4.2. Dependent Variable
Dependent variable of the study was students’ scores on area of quadrilaterals
achievement test (AQAT).
3.4.3. Covariate
Possible covariate of this study was students’ scores on readiness test for area and
perimeter concepts (RTAP). These scores were analyzed whether a significant
difference between comparison and experimental groups existed or not. The results
were described in Results section.
3.5. Procedure
This study was conducted in a public school, in the context of a seventh grade
mathematics course designed to teach the topic of area of quadrilaterals. The study
was designed as a quasi-experimental study. In this study there were two different
groups – experimental (EG) and comparison group (CG), and accordingly there were
two different teaching and learning environments which were DGS supported
instructional environment for EG and traditional instructional environment for CG.
For this study, GeoGebra software was used as a tool in EG. The students in EG
worked on area of quadrilaterals with GeoGebra based activities. On the other hand,
the CG learned the same topic by traditional instruction environment based on the
official 7th
grade mathematics textbook of MoNE from Semih Ofset / S.E.K Press
(Toker, 2012).

34
Lesson plans and activity sheets were developed by considering the objectives of the
seventh grade mathematics suggested by MoNE. These activities were prepared to
allow students to learn specified topics by manipulating given situation in GeoGebra
and to construct their own knowledge by exploring relationships between polygons
namely quadrilaterals. Lesson in EG was conducted by using the instructional
materials given in Appendix H and Appendix I. These instructional materials were
checked by two elementary mathematics teachers, two graduate students and a
researcher with doctoral degree in the field of elementary mathematics education, in
terms of the clarity of the directions and appropriateness of the content.
The study was carried out in the second semester of the 2012 – 2013 academic year.
The study lasted two weeks. In the CG, teacher taught the topics of area of
quadrilaterals to students by using textbook. In the EG, students worked with the
activity sheets developed by the researcher and GeoGebra. The activities were
studied in computer laboratory. In the first week of the study, GeoGebra preparation
course was implemented for students and teacher in order to teach the basics of the
software. For this purpose, a manual for GeoGebra was prepared by the researcher.
This manual was involved basic features of GeoGebra for doing the activities
(Appendix J).
There were three achievement tests in this study. The readiness test for area and
perimeter concepts (RTAP) was administrated to students as pretest, and the area of
quadrilaterals achievement test (AQAT) was administrated as posttest to both of the
groups to see their accomplishments in the topics. In addition, the van Hiele
geometric thinking level test (VHLT) was administrated to students before the study,
in order to categorize students into the van Hiele geometric thinking levels. RTAP
and AQAT were developed by researcher according to objectives of measurement
content area of mathematics curriculum. Before the main study, a pilot study was
conducted to check appropriateness, clarity, difficulty, discrimination power of items
and to check the reliability of tests. The time allotted for the administration of the
tests was one lesson hour for each. An outline of the procedure of the study is given
in Table 3.8.

35
Table 3.8 Outline of the procedure of the Study
Experimental Group Comparison Group Time Schedule
Before
Study
GeoGebra Preparation
Course 25 / 02 / 2013
Pretests
Van Hiele Geometric Thinking Level Test
Readiness Test for Area and Perimeter
Concepts
26 / 02 / 2013
Treatment Mathematics instruction
Supported by DGS
Traditional
Instruction
01 / 03 / 2013
12 / 03 / 2013
Posttests Area of Quadrilaterals Achievement Test 15 / 03 / 2013
The students in both groups were taught the same mathematical contents with same
pace. Treatment period lasted 8 lesson hours. Lessons of CG were conducted in their
regular classrooms. On the other hand, lessons of EG were conducted in a computer
laboratory.
3.6. Treatment
The students in CG studied the topic of area of quadrilaterals with traditional
instructional environment as usual while the EG learned same topic with GeoGebra
based activities, in the treatment phase. The instructional environments in these
groups are explained in detail in the following section.
3.6.1. Treatment in the Comparison Group
The lessons of comparison group were held in students’ regular classroom. Their
mathematics teacher taught the topics to students. Researcher only observed lessons
in comparison group.
Area of quadrilaterals topic was taught to students in comparison group by following
official 7th
grade textbook of MoNE published by Semih Ofset / S.E.K. Press (Toker,

36
2012). Traditional type of instruction was dominant although the textbook has been
prepared based on the new curriculum (MoNE, 2009). In this textbook there were
many activities based on student centered approach. However, these activities were
not applied in the comparison group. Only some activities about area of
parallelogram, area of rhombus and area of trapezoid were shown to students by
drawing on the board by teacher. For example, in the first lesson, teacher firstly drew
a grid on the board and drew a parallelogram on this grid. He asked students to
estimate the area of parallelogram. After estimations, he drew an altitude to the
parallelogram from one upper vertex to base and showed formed right triangular part
on parallelogram. Then he drew a new triangle, which was congruent to the one that
had been formed on the other side, at the end of the parallelogram and removed the
formed right triangular part (Figure 3.1). After, he asked to students to estimate the
new shape area which was rectangular. He made students to realize the relationship
between parallelogram and rectangle.
Figure 3.1 Area of parallelogram in comparison group
The other activities in the textbook were given as homework assignment to students
in comparison group.
At the beginning of the each new subject, lessons began with discussion. For
instance, teacher encouraged students to discuss about similar questions to these:
“what is the parallelogram?”, “what are the properties of the parallelogram?” and
“how can we measure the area of a figure?” for the subject of area of parallelogram.
Generally, the teacher gave definitions of concepts by writing properties and if
necessary, by drawing figures on the board and then he allowed students to write
them on their notebooks. Then he wrote questions on the board and let students try

37
to solve these questions at their places. In question solving part of lessons, a few
students were volunteers to explain their solutions to class. Some of the volunteers
explained their solutions for questions. Then teacher also explained solutions of the
questions to class. When the subject was completed the activities and exercises in the
textbook were given as homework assignment to students in comparison group.
3.6.2. Treatment in the Experimental Group
Lessons of experimental group were held in the computer laboratory (Figure 3.2). In
the computer laboratory, students explored the topics by using GeoGebra software
with worksheets which were developed by the researcher according to activities in
students’ mathematics textbook (Appendix H).
Figure 3.2 Students were working on an activity in EG
Area of quadrilaterals topic were taught to students in EG with GeoGebra based
activities during the treatment period. In computer laboratory, there were 18
computers. Students worked in groups of 2 and 3. There were 14 two-student groups
and 4 three-student groups. Therefore, the treatment of experimental group may be
affected by collaborative learning.
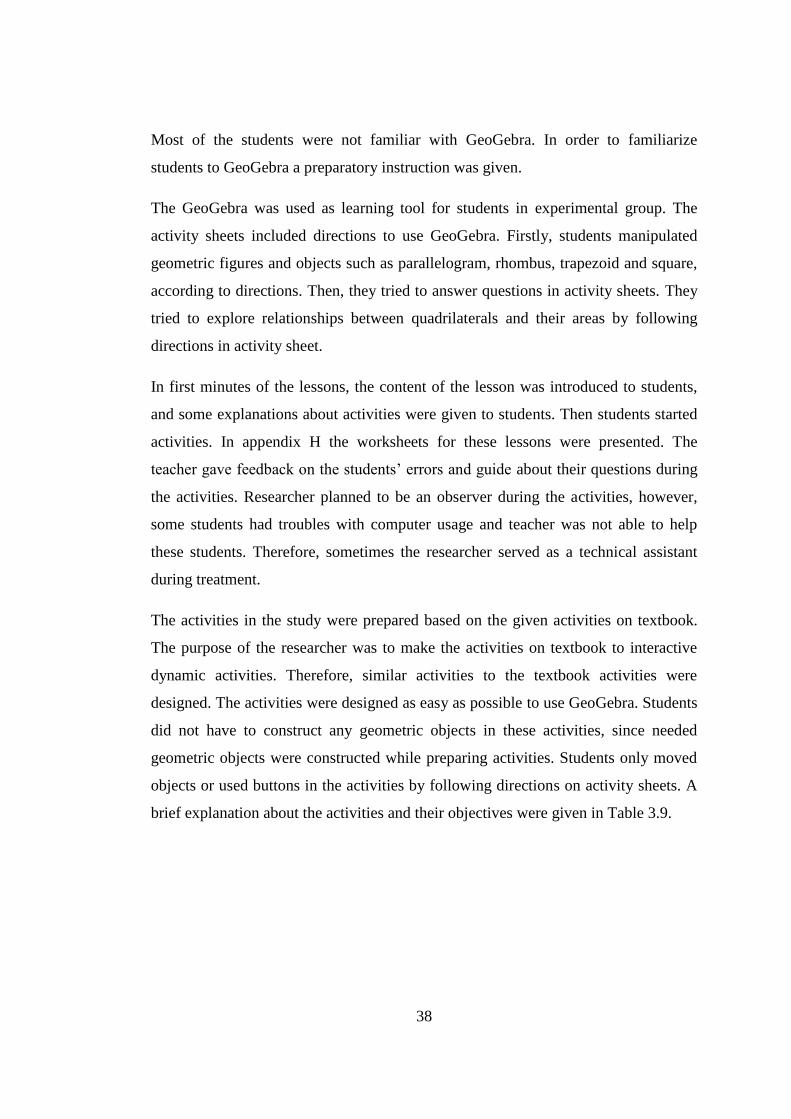
38
Most of the students were not familiar with GeoGebra. In order to familiarize
students to GeoGebra a preparatory instruction was given.
The GeoGebra was used as learning tool for students in experimental group. The
activity sheets included directions to use GeoGebra. Firstly, students manipulated
geometric figures and objects such as parallelogram, rhombus, trapezoid and square,
according to directions. Then, they tried to answer questions in activity sheets. They
tried to explore relationships between quadrilaterals and their areas by following
directions in activity sheet.
In first minutes of the lessons, the content of the lesson was introduced to students,
and some explanations about activities were given to students. Then students started
activities. In appendix H the worksheets for these lessons were presented. The
teacher gave feedback on the students’ errors and guide about their questions during
the activities. Researcher planned to be an observer during the activities, however,
some students had troubles with computer usage and teacher was not able to help
these students. Therefore, sometimes the researcher served as a technical assistant
during treatment.
The activities in the study were prepared based on the given activities on textbook.
The purpose of the researcher was to make the activities on textbook to interactive
dynamic activities. Therefore, similar activities to the textbook activities were
designed. The activities were designed as easy as possible to use GeoGebra. Students
did not have to construct any geometric objects in these activities, since needed
geometric objects were constructed while preparing activities. Students only moved
objects or used buttons in the activities by following directions on activity sheets. A
brief explanation about the activities and their objectives were given in Table 3.9.

39
Tab
le 3
.9 B
rief
ex
pla
nat
ion
ab
ou
t th
e ac
tiv
itie
s an
d t
hei
r o
bje
ctiv
es
Act
ivit
y
Ob
ject
ive
Des
crip
tio
n &
Ad
min
istr
atio
n
Ex
pec
ted
Res
ult
s
Are
a o
f P
aral
lelo
gra
m
form
an
are
a fo
rmu
la
for
par
alle
log
ram
Th
ere
are
thre
e m
ov
able
p
oin
ts in
th
is ac
tiv
ity.
Stu
den
ts m
ov
e p
oin
ts a
cco
rdin
g t
o d
irec
tio
ns
on
acti
vit
y s
hee
t an
d f
ill
tab
les
on
act
ivit
y s
hee
ts w
ith
mea
sure
s o
f le
ngth
s o
f si
des
, al
titu
des
, p
erim
eter
and
are
a.
Stu
den
ts r
eali
ze t
he
rela
tio
nsh
ips
bet
wee
n b
ases
, al
titu
de
and
are
a.
Stu
den
ts
form
an
ar
ea
form
ula
for
par
alle
logra
m
by
anal
yzi
ng
the
dat
a o
n t
he
tab
les.
Th
e R
elat
ion
ship
bet
wee
n
Par
alle
log
ram
an
d
Rec
tan
gle
use
str
ateg
ies
to
esti
mat
e ar
ea o
f
qu
adri
late
rals
Th
ere
are
a p
aral
lelo
gra
m an
d it
s al
titu
de.
B
ase
po
int
of
the
alti
tud
e is
mo
vab
le.
In a
dd
itio
n t
her
e
is
a b
utt
on
fo
r cu
ttin
g
par
alle
logra
m
into
tw
o
pie
ces
acro
ss th
rou
gh
th
e al
titu
de.
A
fter
cu
ttin
g
the
par
alle
logra
m t
her
e w
ill
be
two
fig
ure
s. T
he
figu
re at
th
e le
ft is
m
ov
able
an
d st
ud
ents
m
ove
this
fi
gu
re
by
foll
ow
ing
dir
ecti
on
s o
n
acti
vit
y
shee
t. A
fter
mo
vin
g a
bu
tto
n w
ill
app
ear
wh
ich
is
abo
ut
com
bin
ing t
hes
e fi
gu
res
to f
orm
a r
ecta
ngle
.
Aft
er c
om
bin
ing s
tud
ents
can
sta
rt o
ver
an
d m
ov
e
alti
tud
e to
d
iffe
ren
t p
osi
tio
n
and
ca
n
do
sa
me
thin
gs
for
the
new
po
siti
on
of
alti
tud
e.
Stu
den
ts
esti
mat
e ar
ea
of
par
alle
logra
m
and
ch
eck
th
eir
esti
mat
ion
s fr
om
ar
ea
of
rect
angle
.
Stu
den
ts
un
der
stan
d
area
con
serv
atio
n.
Stu
den
ts r
eali
ze t
he
rela
tio
nsh
ips
bet
wee
n
par
alle
log
ram
an
d
rect
angle
.

40
Tab
le 3
.9 (
Co
nti
nu
ed)
Are
a o
f R
ho
mb
us
form
an
are
a fo
rmu
la
for
rho
mb
us
Th
ere
are
a rh
om
bu
s in
a r
ecta
ngle
an
d a
bu
tto
n
wh
ich
se
par
ate
tria
ngu
lar
par
ts
at
ou
tsid
e th
e
rho
mb
us
fro
m r
ecta
ngle
. A
fter
sep
arat
ion
, an
oth
er
bu
tto
n w
ill
app
ear
wh
ich
ro
tate
s th
ese
tria
ngu
lar
par
ts b
y 1
80°.
Aft
er r
ota
tio
n,
ano
ther
bu
tto
n w
ill
app
ear
wh
ich
co
mb
ine
thes
e re
ctan
gu
lar
par
ts t
o
form
a r
ho
mb
us
ov
er t
he
firs
t rh
om
bu
s. S
tud
ents
answ
er q
ues
tio
ns
on
th
e ac
tiv
ity s
hee
t.
Stu
den
ts r
eali
ze t
he
rela
tio
nsh
ips
bet
wee
n
area
o
f re
ctan
gle
an
d
area
o
f rh
om
bu
s o
r ar
ea
of
tria
ngle
an
d
area
o
f rh
om
bu
s.
Stu
den
ts
form
an
ar
ea
form
ula
for
rho
mb
us
by
usi
ng
thes
e
rela
tio
ns.
Are
a R
elat
ion
ship
bet
wee
n R
ho
mb
us
and
Par
alle
log
ram
use
str
ateg
ies
to
esti
mat
e ar
ea o
f
qu
adri
late
rals
Th
ere
are
a rh
om
bu
s an
d a
bu
tto
n w
hic
h c
op
ies
the
rhom
bu
s. A
fter
co
pyin
g,
a b
utt
on
wil
l ap
pea
r
wh
ich
ro
tate
s rh
om
bu
s b
y f
orm
ing
sim
ilar
vie
w o
f
par
alle
logra
m.
Stu
den
ts a
nsw
er q
ues
tio
ns
on
th
e
acti
vit
y s
hee
t.
Stu
den
ts
esti
mat
es
area
o
f
rho
mb
us
and
ch
eck
th
eir
esti
mat
ion
s fr
om
ar
ea
of
par
alle
logra
m.
Stu
den
ts r
eali
ze t
he
rela
tio
nsh
ips
bet
wee
n
rho
mb
us
and
par
alle
logra
m.
Are
a o
f T
rap
ezo
id
form
an
are
a fo
rmu
la
for
trap
ezo
id
Th
ere
are
fou
r m
ov
able
p
oin
ts
in
this
ac
tiv
ity.
Stu
den
ts m
ov
e p
oin
ts a
cco
rdin
g t
o d
irec
tio
ns
on
acti
vit
y s
hee
t an
d f
ill
tab
les
on
act
ivit
y s
hee
ts w
ith
mea
sure
s o
f le
ngth
s o
f si
des
, al
titu
des
, p
erim
eter
and
are
a.
Stu
den
ts r
eali
ze t
he
rela
tio
nsh
ips
bet
wee
n b
ases
, al
titu
de
and
are
a.
Stu
den
ts
form
an
ar
ea
form
ula
for
trap
ezo
id
by
anal
yzin
g
the
dat
a o
n t
he
tab
les.

41
Tab
le 3
.9 (
Co
nti
nu
ed)
Are
a R
elat
ion
ship
bet
wee
n T
rap
ezo
id
and
Par
alle
logra
m
use
str
ateg
ies
to
esti
mat
e ar
ea o
f
qu
adri
late
rals
Th
ere
are
a tr
apez
oid
an
d a
bu
tto
n w
hic
h c
op
ies
the
trap
ezo
id.
Aft
er c
op
yin
g,
a b
utt
on
wil
l ap
pea
r
wh
ich
ro
tate
s tr
apez
oid
b
y
18
0°.
T
his
ro
tate
d
trap
ezo
id a
t ri
gh
t ca
n b
e m
ov
able
. S
tud
ents
mo
ve
this
fig
ure
acc
ord
ing t
o d
irec
tio
ns
on
th
e ac
tiv
ity
shee
t. S
tud
ents
an
swer
q
ues
tio
ns
on
th
e ac
tiv
ity
shee
t.
Stu
den
ts
esti
mat
es
area
o
f
trap
ezo
id
and
ch
eck
th
eir
esti
mat
ion
s fr
om
ar
ea
of
par
alle
logra
m.
Stu
den
ts r
eali
ze t
he
rela
tio
nsh
ips
bet
wee
n
area
o
f tr
apez
oid
an
d
area
of
par
alle
logra
m.
Th
e R
elat
ion
ship
bet
wee
n A
rea
and
Per
imet
er
iden
tify
rel
atio
nsh
ip
bet
wee
n p
erim
eter
an
d
area
Th
ere
is a
rec
tan
gle
, an
d i
ts u
pp
er r
igh
t v
erte
x c
an
be
mo
vab
le.
Stu
den
ts m
ov
e p
oin
ts ac
cord
ing
to
dir
ecti
on
s o
n
acti
vit
y
shee
t an
d
fill
ta
ble
s o
n
acti
vit
y s
hee
t w
ith
mea
sure
s o
f le
ngth
s o
f si
des
,
per
imet
er a
nd
are
a.
Stu
den
ts r
eali
ze t
he
rela
tio
nsh
ips
bet
wee
n p
erim
eter
an
d a
rea.
Th
e R
elat
ion
ship
bet
wee
n S
ide
Len
gth
and
Are
a
iden
tify
rel
atio
nsh
ip
bet
wee
n s
ide’
s le
ngth
and
are
a
Th
ere
is a
rec
tan
gle
, an
d i
ts u
pp
er r
igh
t v
erte
x c
an
be
mo
vab
le.
Stu
den
ts m
ov
e p
oin
ts ac
cord
ing
to
dir
ecti
on
s o
n
acti
vit
y
shee
t an
d
fill
ta
ble
s o
n
acti
vit
y s
hee
t w
ith
mea
sure
s o
f le
ngth
s o
f si
des
,
per
imet
er a
nd
are
a.
Stu
den
ts r
eali
ze t
he
rela
tio
nsh
ip
bet
wee
n s
ide’
s le
ngth
an
d a
rea.

42
Three activities in experimental group were described below in detail.
First lesson was about area of parallelogram. A sample view of Geogebra screen for
this lesson was shown in Figure 3.3.
Figure 3.3 Geogebra screen for area of parallelogram activity [Çevre: Perimeter;
Alan: Area]
In GeoGebra file for this activity, point A moves upward and downward, point B and
point C moves right and left. When student moves point A, height of parallelogram is
changing but base of this height remains the same. When point B is moved, height
remains same but this time base of this height is changing. If point C is moved both
height and its base remains same, so the area remains same. In activity, it was wanted
to students change all three points in five situation and recode findings in tables. In
this activity some students find a formula to measure area of parallelogram by
analyzing data in the tables in the worksheet. Moreover, few of them realized the
relationship between parallelogram and rectangle, and formed a formula for area of
parallelogram from this relationship. At the end of the activity students let to change
the points freely, and they tried to explore many situations about these points to
verify their formulas.
The activity of third lesson was about area of rhombus. An example of the view of
GeoGebra screen was shown in Figure 3.4.

43
Figure 3.4 GeoGebra screen for area of rhombus activity [Döndür: Rotate]
This activity was different from first activity. This activity involved both relationship
between rectangle and rhombus, and relationship between right triangle and
rhombus. At the end of this activity, some students formed a formula by using area of
right triangles, and few of the formed a formula by using relationship between
rectangle and rhombus.
The fifth lesson was about area of trapezoid. This activity was similar to the first
lesson’s activity which was about area of parallelogram. A sample view of GeoGebra
screen was presented in Figure 3.5.
Figure 3.5 GeoGebra screen for area of trapezoid activity [Çevre: Perimeter;
Alan: Area]

44
In GeoGebra file for this activity, point B, C and D moves rightward and leftward,
and point H moves upward and downward. When student moves point B, upper base
of trapezoid is changing but height and lower base of trapezoid remain same. If point
C is moved, lower base of trapezoid is changing but both height and upper base
remains same. If point H is moved, height of trapezoid is changing but both upper
and lower bases remains same. When student moves point D, upper base, lower base
and height remains same, so the area remains same. In activity, students were asked
to change all four points in five situations and record findings in tables. In this
activity some students find a formula to measure area of trapezoid by analyzing data
in the tables in the worksheet, but they could not clarify their answer. Their
explanation about the area formula was the middle number between lengths of upper
and lower bases multiply with height. In the end of the activity, teacher helped
students to form the formula by asking “How can we find the middle number of two
numbers?”. At the end of the activity students let to change the points freely, and
they tried to explore many situations about these points to verify their formulas. At
this phase of the lesson some students came up with this idea “The quadrilaterals are
similar. I can construct rectangle, parallelogram, rhombus and square by using this
activity. I can compute area of these quadrilaterals by using area formula of
trapezoid”.
In these activities, students did not have any difficulty, in other words, they used the
GeoGebra for these activities, easily. Students were active participants in learning
process. They explored and explained their ideas freely. Therefore, they could
construct their own understanding of geometry. Since these activities were
implemented as group activities, there were both in group discussion and in class
discussion.
The comparison of roles of teacher, roles of researcher, roles of students and
environment in the experimental and comparison groups was given in Table 3.10
briefly.
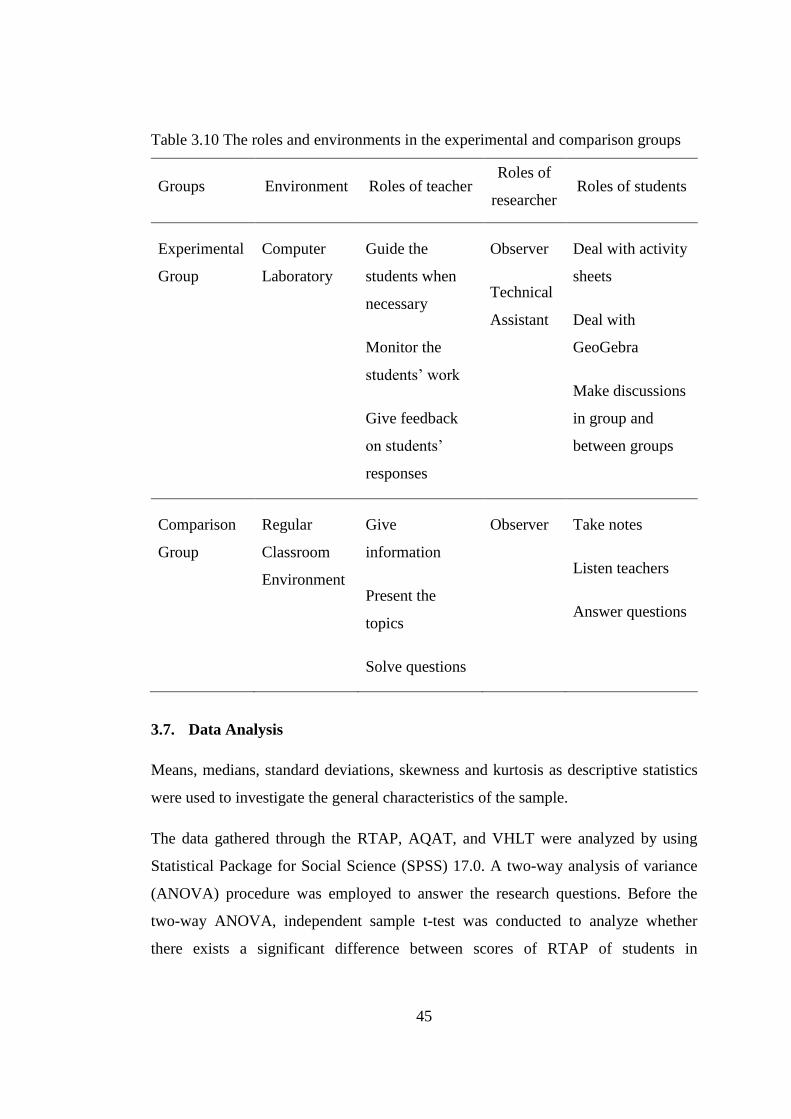
45
Table 3.10 The roles and environments in the experimental and comparison groups
Groups Environment Roles of teacher Roles of
researcher Roles of students
Experimental
Group
Computer
Laboratory
Guide the
students when
necessary
Monitor the
students’ work
Give feedback
on students’
responses
Observer
Technical
Assistant
Deal with activity
sheets
Deal with
GeoGebra
Make discussions
in group and
between groups
Comparison
Group
Regular
Classroom
Environment
Give
information
Present the
topics
Solve questions
Observer Take notes
Listen teachers
Answer questions
3.7. Data Analysis
Means, medians, standard deviations, skewness and kurtosis as descriptive statistics
were used to investigate the general characteristics of the sample.
The data gathered through the RTAP, AQAT, and VHLT were analyzed by using
Statistical Package for Social Science (SPSS) 17.0. A two-way analysis of variance
(ANOVA) procedure was employed to answer the research questions. Before the
two-way ANOVA, independent sample t-test was conducted to analyze whether
there exists a significant difference between scores of RTAP of students in

46
comparison and experimental groups. The hypotheses were tested at 95% confidence
interval.
3.8. Internal Validity
Internal validity refers to the degree to which observed differences on the dependent
variable are directly related to the independent variables not to some other (Frankel
& Wallen, 2009). In this section, a list of possible threats to internal validity and how
they can be controlled are discussed.
In this study, students were not assigned randomly to the experimental and
comparison group which can cause the subject characteristics threat to the study.
Students’ previous achievement in measurement and geometry was determined and
these scores were used to analyze whether any statistically differences between
groups existed or not. In addition, the achievement tests were administrated to all
students in their own regular classes. Therefore, location threat was also reduced by
satisfying similar conditions in all classes during the administrations of the
instruments.
Testing threat may not affect the study, because, different achievement tests were
administrated as pretest and posttest. RTAP was pretest, and AQAT was posttest of
the study.
Since, the treatment period was 8 lesson hours and both groups were treated for same
duration; maturation may not be a threat to internal validity of this study. Therefore,
if there was any maturation threat to the study, it affected all groups.
Attitude of subjects’ threat also affected the study. The researcher was an observer
during treatment to reduce effect of attitude of subjects’ threat. Teachers of
comparison and experimental groups taught lessons and administrated tests.
3.9. External Validity
In this study, subjects selected conveniently; therefore, the generalizability of the
study was limited to subjects who have similar characteristics and similar conditions.
The achievement tests were administrated in students’ regular classroom, and
47
classrooms had similar conditions with each other. Moreover, all instruments and
treatments were administrated regular lesson hours of students’ mathematics lessons.
Therefore, ecological threats to validity were controlled. Researcher was an observer
during the treatment phases; therefore, experimenter effect may not threat the study.
3.10. Limitations of Study
The study is not a true experimental study since the participants were not assigned to
the experimental and the comparison groups randomly. The study was conducted on
seventh grade students in KırĢehir. The activities in learning environment were based
on GeoGebra. Students worked in groups for experimental group, since the class was
relatively crowded and computers were not enough. If it were less crowded, students
might have more experiences with GeoGebra. On the other hand, working in groups
might have provided them a discussion environment. The results of the study are
limited to the population with similar characteristics and similar environments.

48
CHAPTER 4
RESULTS
This chapter presents descriptive and inferential statistics related to research
questions.
4.1. Descriptive Statistics and Data Cleaning
4.1.1. Descriptive Statistics of RTAP and AQAT for Comparison and
Experimental Groups
Descriptive statistics related to the Readiness Test for Area and Perimeter Concepts
(RTAP) and Area of Quadrilaterals Achievement Test (AQAT) for comparison and
experimental groups were presented in the Table 4.1.
Table 4.1 Descriptive statistics related to the RTAP and AQAT for comparison and
experimental groups
Groups N Min. Max. Mean Median SD Skewness Kurtosis
RTAP CG 36 8 18 13,33 14 3,171 -,233 -1,113
EG 40 8 18 14,25 15 3,002 -,493 -,826
AQAT CG 36 16 29 22,39 22 3,499 ,007 -0,910
EG 40 14 29 24,57 26 3,915 -1,126 ,451
As seen on the Table 4.1, the mean score of RTAP for experimental group (M =
14.25, SD = 3.00) was relatively higher than the mean score of RTAP for
comparison group (M = 13.33, SD = 3.17). In addition, the mean score of AQAT for
experimental group (M = 24.57, SD = 3.92) was relatively higher than the mean
score of AQAT for comparison group (M = 22.39, SD =3.50).

49
In order to analyze whether there exists any outliers, the clustered boxplot was
drawn. The boxplot for RTAP and AQAT for comparison and experimental groups
was presented in Figure 4.1.
Figure 4.1 The box plot for RTAP and AQAT for groups
As the figure indicated, there was a lower outlier in the AQAT of the EG. In boxplot,
a box represents the scores from the lower to upper quartile, the line in the box
represents the median of the scores, and each T-bars, namely inner fences or
whiskers, represents upper 25% and lower 25% of the scores. The mean of AQAT
for experimental group, which was 24.57, was lower than the median, which was 26.
This outlier may be caused by this lower mean. In addition, median of AQAT for
experimental group was higher than the upper quartile of the AQAT for comparison
group.
4.1.2. Descriptive Statistics of RTAP and AQAT for VHLT Categories
Descriptive statistics related to the RTAP and AQAT for all students in VHLT
categories were presented in the Table 4.2.

50
Table 4.2 Descriptive statistics related to the scores from RTAP and AQAT for all
students together in VHLT categories
Groups N Min. Max. Mean Median SD Skewness Kurtosis
RTAP Level 0 16 8 14 10,31 10 1,887 ,707 -,009
Level 1 28 8 18 13,75 14,5 2,977 -,455 -,702
Level 2 32 11 18 15,63 16 2,012 -,537 -,703
AQAT Level 0 16 14 24 19,31 18,5 2,983 ,033 -1,178
Level 1 28 17 29 22,96 22 3,666 ,040 -1,212
Level 2 32 22 29 26,16 26 1,851 -,341 -,036
According to the Table 4.2, the mean score of RTAP for students in Van Hiele
Geometric Thinking (VHGT) Level 2 (M = 15.63, SD = 2.01) was relatively higher
than the mean score of RTAP for both students in VHGT Level 1 (M = 13.75, SD =
2.98) and students in VHGT Level 0 (M = 10.31, SD = 1.89). In addition, the mean
score of AQAT for students in VHGT Level 2 (M = 26.16, SD = 1.85) was relatively
higher than the mean score for both students in VHGT Level 1 (M = 22.96, SD =
3.67) and students in VHGT Level 0 (M = 19.31, SD = 2.98). Moreover, the
minimum scores of AQAT for students in VHGT Level 2 was 22 out of 29 where the
minimum scores of AQAT for students in VHGT Level 1 was 17 out of 29 and for
Level 0 was 14 out of 29.
In order to analyze whether there exists any outliers, the clustered boxplot was
drawn. The boxplot for RTAP and AQAT for VHLT categories was presented in
Figure 4.2.

51
Figure 4.2 The box plot for RTAP and AQAT for VHLT categories
As the figure indicated, there was no outlier for RTAP and AQAT for VHLT
categories. The medians of RTAP and AQAT for VHGT Level 2 were nearly same
with the upper quartile of the RTAP and AQAT for VHGT Level 1, respectively. In
addition, the lower quartile of RTAP and the median of AQAT for VHGT Level 1
were nearly same with the upper quartile of RTAP and AQAT for VHGT Level 0,
respectively.
4.1.3. Descriptive Statistics of RTAP and AQAT for VHLT Categories in
Comparison and Experimental Groups
Descriptive statistics related to RTAP and AQAT for VHLT categories in
comparison and experimental groups were presented in Table 4.3 and Table 4.4,
respectively.

52
Table 4.3 Descriptive statistics related to RTAP for VHLT categories in comparison
and experimental groups
VHLT N Min. Max. Mean Median SD Skewness Kurtosis
CG Level 0 8 8 14 10,75 10,5 1,151 ,613 -,909
Level 1 14 8 16 12,29 12,5 2,946 -,179 -1,566
Level 2 14 13 18 15,86 16 1,875 -,250 -1,407
EG Level 0 8 8 12 9,88 10 1,458 -,086 -1,187
Level 1 14 11 18 15,21 15 2,259 -,356 -,779
Level 2 18 11 18 15,44 16 2,148 -,655 -,609
Table 4.4 Descriptive statistics related to AQAT for VHLT categories in comparison
and experimental groups
VHLT N Min. Max. Mean Median SD Skewness Kurtosis
CG Level 0 8 16 23 19,88 20 2,748 -,157 -1,779
Level 1 14 17 26 20,57 20 2,503 ,640 ,256
Level 2 14 22 29 25,64 25 1,946 ,78 -,475
EG Level 0 8 14 24 18,75 17,5 3,284 ,359 -,672
Level 1 14 18 29 25,36 26 3,054 -1,095 1,241
Level 2 18 22 29 26,56 26 1,723 -,688 1,709
As seen on the Table 4.3, the mean score of RTAP for students in VHGT Level 2 in
CG (M = 15.86, SD = 1.88) was relatively higher than the mean score for both
students in VHGT Level 1 (M = 12.29, SD = 2.95) and students in VHGT Level 0
(M = 10.75, SD = 1.15). Moreover, the mean score of RTAP for students in VHGT
Level 2 in EG (M = 15.44, SD = 2.15) was relatively same with the mean score of
AQAT for students in VHGT Level 1 (M = 15.21, SD = 2.26), and was relatively

53
higher than students in VHGT Level 0 (M = 9.88, SD = 1.46). In addition to these,
the mean score of RTAP for students in VHGT Level 2 in CG (M = 15.86, SD =
1.88) and VHGT Level 2 in EG (M = 15.44, SD = 2.15) were nearly same. However,
the mean score of RTAP for students in VHGT Level 1 in EG (M = 15.21, SD =
2.26) was relatively higher than the mean score for VHGT Level 1 in CG (M =
12.29, SD = 2.95), and the mean score for students in VHGT Level 0 in EG (M =
9.88, SD = 1.46) was relatively lower than the mean score for VHGT Level 0 in CG
(M = 10.75, SD = 1.15).
According to the Table 4.4, the mean score of AQAT for students in VHGT Level 2
in EG (M = 26.56, SD = 1.72) was relatively higher than the mean score of AQAT
for both students in VHGT Level 1 (M = 25.36, SD = 3.05) and students in VHGT
Level 0 (M = 18.75, SD = 3.28). In addition, the mean score of AQAT for students
in VHGT Level 2 in CG (M = 25.64, SD = 1.95) was relatively higher than the mean
score for both students in VHGT Level 1 (M = 20.57, SD = 2.50) and students in
VHGT Level 0 (M = 19.88, SD = 2.75). Moreover, the mean score of AQAT for
students in VHGT Level 2 (M = 26.56, SD = 1.72) and VHGT Level 1 (M = 25.36,
SD = 3.05) in EG were relatively higher than the mean score of AQAT for students
in VHGT Level 2 (M = 25.64, SD = 1.95) and VHGT Level 1 (M = 20.57, SD =
2.50) in CG, respectively. However, the mean score of AQAT for students in VHGT
Level 0 in CG (M = 19.88, SD = 2.75) was relatively higher than the mean score for
VHGT Level 0 in EG (M = 18.75, SD = 3.28). Moreover, the minimum scores of
AQAT for students in VHGT Level 2, Level 1 and Level 0 in EG were 22, 18 and 14
out of 29 respectively where the minimum scores of AQAT for students in VHGT
Level 2, Level 1 and Level 0 in CG was 22, 17 and 16 out of 29 respectively.
In order to analyze whether there exists any outliers, the clustered box plot was
drawn. The box plot for RTAP and AQAT for VHGT categories in comparison and
experimental groups were presented in Figure 4.3.
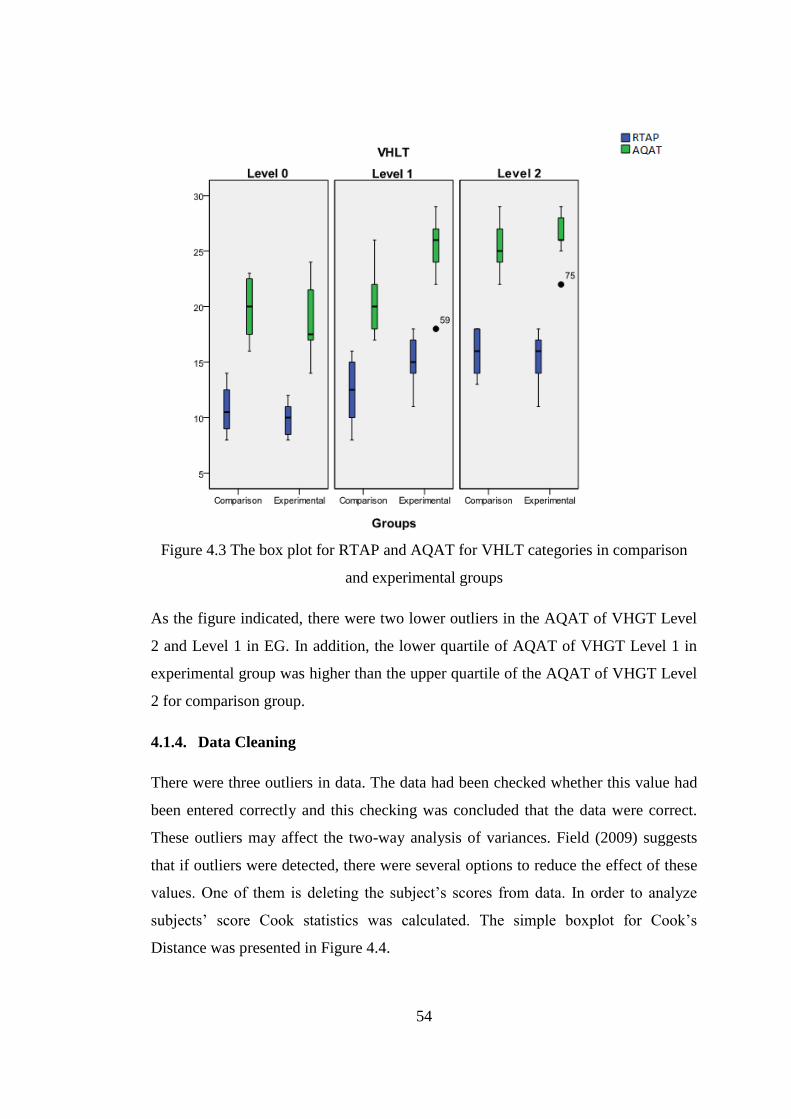
54
Figure 4.3 The box plot for RTAP and AQAT for VHLT categories in comparison
and experimental groups
As the figure indicated, there were two lower outliers in the AQAT of VHGT Level
2 and Level 1 in EG. In addition, the lower quartile of AQAT of VHGT Level 1 in
experimental group was higher than the upper quartile of the AQAT of VHGT Level
2 for comparison group.
4.1.4. Data Cleaning
There were three outliers in data. The data had been checked whether this value had
been entered correctly and this checking was concluded that the data were correct.
These outliers may affect the two-way analysis of variances. Field (2009) suggests
that if outliers were detected, there were several options to reduce the effect of these
values. One of them is deleting the subject’s scores from data. In order to analyze
subjects’ score Cook statistics was calculated. The simple boxplot for Cook’s
Distance was presented in Figure 4.4.

55
Figure 4.4 Cook’s distance for the scores of AQAT for VHLT categories in
comparison and experimental groups
As it was represented in the figure, 50th
subject was an extreme outlier. This value
was considered for deletion. An independent sample t-test was conducted to see how
this outlier affected the study before and after deletion in terms of students’ prior
knowledge. The assumptions of independent sample t-test were described below.
RTAP was scaled as continuous measures, so, all score of the test were in ratio level.
In order to assess normality, skewness and kurtosis values of RTAP were examined
and they were listed in Table 4.1.
According to Cameron (2004), if data are normally distributed, skewness and
kurtosis values should fall in the range from -2 to +2. Since, skewness and kurtosis
values were in acceptable range, normality assumption was satisfied. In the study, the
researcher observed both comparison and experimental groups during administration
of RTAP. All students answered all test by themselves.
The results of independent sample t-test were presented in Table 4.5.

56
Table 4.5 The results of independent sample t-test for RTAP scores for before and
after deleting subject 50.
Levene's
Test t-test for Equality of Means
F Sig. t df Sig.
(2-tailed) Mean Dif.
RTAP
(Before
deletion)
Equal variances
assumed ,164 ,687 -1,294 74 ,200 -,917
Equal variances
not assumed -1,290 72,122 ,201 -,917
RTAP
(After
deletion)
Equal variances
assumed ,513 ,476 -1,546 73 ,127 -1,077
Equal variances
not assumed -1,539 70,643 ,128 -1,077
As seen on Table 4.5, significance values of Levene’s test for equal variances are
larger than .05. Therefore, equal variance assumption was satisfied. Before deleting
the subject’s scores from data, there was no significant mean difference between in
scores of RTAP for comparison group (M = 13.33, SD =3.17, N = 36) and for
experimental group (M = 14.25, SD = 3.00, N = 40), t(74) = -1.29, p = .20.
Similarly, after deleting the subject’s scores from data, there was no significant mean
difference between in scores of RTAP for comparison group (M = 13.33, SD =3.17,
N = 36) and for experimental group (M = 14.41, SD = 2.86, N = 39), t(73) = -1.55, p
= .13. Since, deleting this subject from data was not effect initial status of study, this
subject was deleted from data in order to deal with outlier.
After this changing the descriptive statistics of the data were presented below in
Table 4.6.

57
Table 4.6 Descriptive statistics for AQAT after deletion of the extreme outlier
Categories N Min. Max. Mean SD Skewness Kurtosis
AQAT
Groups
CG 36 16 29 22,39 3,499 ,007 -,910
EG 39 17 29 24,85 3,565 -1,049 ,214
AQAT Level 0 15 16 24 19,67 2,717 ,209 -1,623
VHLT Level 1 28 17 29 22,96 3,666 ,040 -1,212
Level 2 32 22 29 26,16 1,851 -,341 -,036
AQAT Level 0 8 16 23 19,88 2,748 -,157 -1,779
VHLT Level 1 14 17 26 20,57 2,503 ,640 ,256
for CG Level 2 14 22 29 25,64 1,946 ,078 -,475
AQAT Level 0 7 17 24 19,43 2,878 ,690 -1,355
VHLT Level 1 14 18 29 25,36 3,054 -1,095 1,241
for EG Level 2 18 22 29 26,56 1,723 -,688 1,709
4.2. Inferential Statistics
This part covers the missing data analysis, determination of analysis, assumptions of
analysis of variance, results of analysis of variance and the follow-up analysis related
to study.
4.2.1. Missing Data Analysis
There were no missing data in RTAP, VHLT and AQAT. However, there were a few
questions which were not answered by some students. These questions were coded as
wrong answer during the analysis.

58
4.2.2. Determination of Analysis
Before the study, RTAP, which was designed as readiness test, was conducted to
determine previous mathematics success level of students as possible confounding
variable of the study. The scores of RTAP were analyzed whether RTAP can be
taken as covariate in order to adjust the differences between groups.
An independent sample t-test analysis was conducted to understand whether
comparison and experimental groups differed significantly in terms of their RTAP
scores. The result of independent sample t- test for RTAP was presented in Table 4.7.
Table 4.7 The results of the independent sample t-test for RTAP scores
Levene's
Test t-test for Equality of Means
F Sig. t df Sig.
(2-tailed) Mean Dif.
RTAP
Equal variances
assumed ,513 ,476 -1,546 73 ,127 -1,077
Equal variances
not assumed -1,539 70,643 ,128 -1,077
According to this analysis, there was no significant mean difference between in
scores of RTAP for comparison group (M = 13.33, SD =3.17, N = 36) and for
experimental group (M = 14.41, SD = 2.86, N = 39), t(73) = -1.55, p = .13.
Therefore, comparison and experimental groups were not statistically different
before treatment. Since there was no need to adjust scores in groups, scores of RTAP
did not assigned as covariate and a two-way analysis of variance was conducted in
order to answer research questions.
4.2.3. Assumptions of ANOVA
The ANOVA model assumes below-listed properties are verified (Tabachnick &
Fidell, 2007).

59
i. Level of measurement
ii. Normality
iii. Homogeneity of variance
iv. Independence of observations
Both RTAP and AQAT were scaled as continuous measures, so, all score of these
test were in ratio level. In addition, result of VHLT was coded in three discrete
categories. In order to assess normality, skewness and kurtosis values of AQAT were
examined and these values are represented in Table 4.6. According to Cameron
(2004), if data are normally distributed, skewness and kurtosis values should fall in
the range from -2 to +2. Since, skewness and kurtosis values were in acceptable
range, normality assumption was satisfied.
Homogeneity of variance assumption was controlled by Levene’s Test of Equality
Error Variances. The results are listed Table 4.8.
Table 4.8 Levene’s Test of Equality Error Variances for AQAT
F df1 df2 Sig.
AQAT 1,635 5 69 ,162
As seen on Table 4.8, significance value for AQAT is .16 and since, this value is
greater than .05, homogeneity of variance assumption has not been violated.
In the study, the researcher observed both comparison and experimental groups
during all phases of study included administration of pretest and posttest. All
students answered all test by themselves.
4.2.4. Analysis of Variance
The purpose of this research is to provide insight into the effects of mathematics
instruction supported by dynamic geometry activities on students’ achievement in

60
area of quadrilaterals and students’ achievements according to their van Hiele
geometric thinking levels. The following research questions were investigated:
Problem 1. What are the effects of instruction based on dynamic geometry activities
compared to traditional instruction method and van Hiele geometric thinking levels
on seventh grade students’ achievement in area of quadrilaterals?
Sub-problem 1.1. What are the effects of instruction based on dynamic geometry
activities compared to traditional instruction method on seventh grade students’
achievement in area of quadrilaterals?
Sub-problem 1.2. What is the interaction between effects of instruction based on
dynamic geometry activities compared to traditional instruction method and van
Hiele geometric thinking levels on seventh grade students’ achievement in area
of quadrilaterals?
Sub-problem 1.3. What are the effects of instruction based on dynamic geometry
activities compared to traditional instruction method on achievement of seventh
grade students, at van Hiele geometric thinking level 0, in area of quadrilaterals?
Sub-problem 1.4. What are the effects of instruction based on dynamic geometry
activities compared to traditional instruction method on achievement of seventh
grade students, at van Hiele geometric thinking level 1, in area of quadrilaterals?
Sub-problem 1.5. What are the effects of instruction based on dynamic geometry
activities compared to traditional instruction method on achievement of seventh
grade students, at van Hiele geometric thinking level 2, in area of quadrilaterals?
A two-way (2 x 3 factorial) analysis of variance was conducted to assess
effectiveness of using dynamic geometry software in mathematics instruction,
specifically the topics of area of quadrilaterals. The null hypotheses for inferential
statistics were presented below:
Null Hypothesis 1: There is no significant mean difference between the comparison
and experimental groups, and van Hiele geometric thinking levels on the population
means of students’ scores on Area of Quadrilateral Achievement Test.

61
Null Hypothesis 1.1: There is no significant mean difference between the
comparison and experimental groups on the population means of students’
scores on Area of Quadrilateral Achievement Test.
Null Hypothesis 1.2: There is no significant interaction effect of treatment and
van Hiele geometric thinking level on the population means of students’ scores
on Area of Quadrilateral Achievement Test.
Null Hypothesis 1.3: There is no significant mean difference between the
comparison and experimental groups on the population means of scores of
students, at van Hiele geometric thinking level 0, on Area of Quadrilateral
Achievement Test.
Null Hypothesis 1.4: There is no significant mean difference between the
comparison and experimental groups on the population means of scores of
students, at van Hiele geometric thinking level 1, on Area of Quadrilateral
Achievement Test.
Null Hypothesis 1.5: There is no significant mean difference between the
comparison and experimental groups on the population means of scores of
students, at van Hiele geometric thinking level 2, on Area of Quadrilateral
Achievement Test.
An alpha level of .05 was used for the initial analyses. The results of two-way
analysis of variance were listed in Table 4.9.
Table 4.9 The results of two-way analysis of variance for scores of AQAT
Type III Sum
of Squares df Mean Square F Sig.
Partial Eta
Squared
Group 51,299 1 51,299 8,742 ,004 ,112
VHLT 440,801 2 220,400 37,560 ,000 ,521
Group * VHLT 85,801 2 42,900 7,311 ,001 ,175
Error 404,891 69 5,868
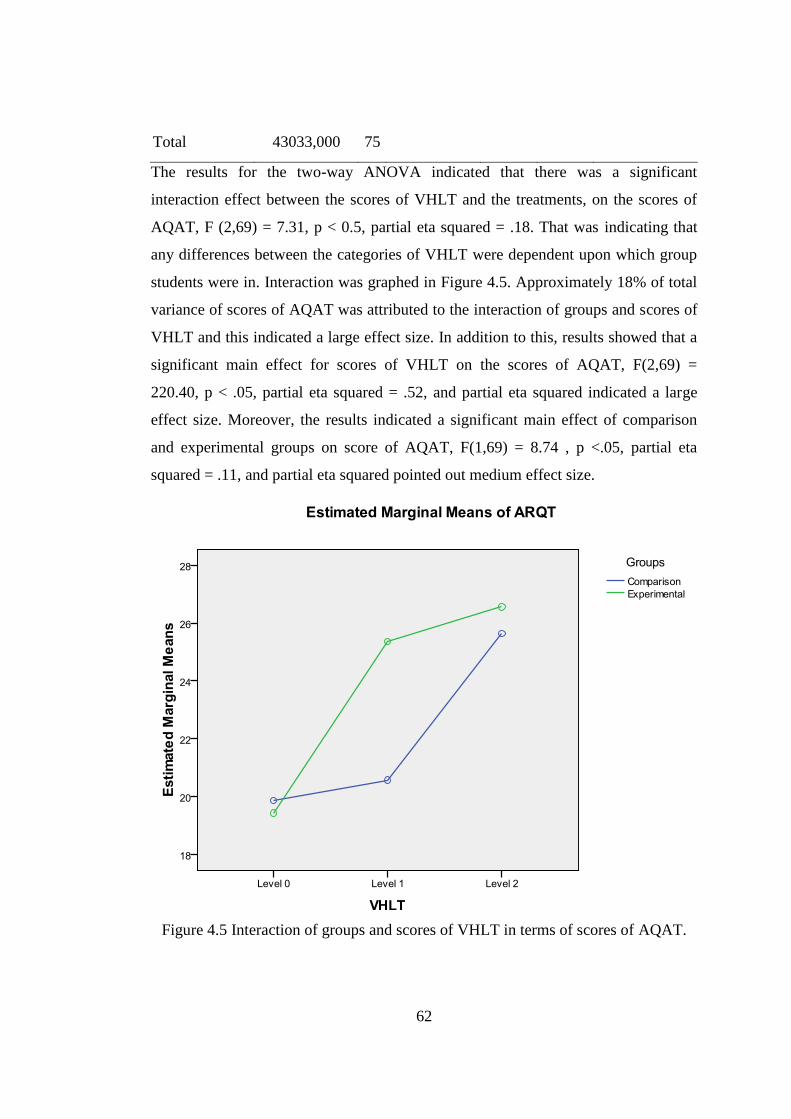
62
Total 43033,000 75
The results for the two-way ANOVA indicated that there was a significant
interaction effect between the scores of VHLT and the treatments, on the scores of
AQAT, F (2,69) = 7.31, p < 0.5, partial eta squared = .18. That was indicating that
any differences between the categories of VHLT were dependent upon which group
students were in. Interaction was graphed in Figure 4.5. Approximately 18% of total
variance of scores of AQAT was attributed to the interaction of groups and scores of
VHLT and this indicated a large effect size. In addition to this, results showed that a
significant main effect for scores of VHLT on the scores of AQAT, F(2,69) =
220.40, p < .05, partial eta squared = .52, and partial eta squared indicated a large
effect size. Moreover, the results indicated a significant main effect of comparison
and experimental groups on score of AQAT, F(1,69) = 8.74 , p <.05, partial eta
squared = .11, and partial eta squared pointed out medium effect size.
Figure 4.5 Interaction of groups and scores of VHLT in terms of scores of AQAT.

63
Figure 4.5 clearly shows that the mean score of AQAT of students in VHGT Level 1
in EG was significantly higher than students in VGHT Level 1 in CG.
4.2.5. Follow-up Analysis
The results of a significant interaction effect were followed up by running tests for
simple interaction effects. The following SYNTAX was used to analyze the mean
difference in scores of AQAT between groups at each van Hiele geometric thinking
level.
UNIANOVA AQAT BY Group VHLT
/EMMEANS TABLES(Group*VHLT) COMPARE(Group)
The univariate test results were shown in Table 4.10.
Table 4.10 Simple main effects analysis
Sum of
Squares Df
Mean
Square F Sig.
Level 0 Contrast ,744 1 ,744 ,127 ,723
Error 404,891 69 5,868
Level 1 Contrast 160,321 1 160,321 27,321 ,000
Error 404,891 69 5,868
Level 2 Contrast 6,560 1 6,560 1,118 ,294
Error 404,891 69 5,868
This table points out whether there are statistical differences in mean score of AQAT
between groups for each van Hiele geometric thinking level. As it is seen on table,
there were no statistically significant mean differences between comparison and
experimental groups’ scores in AQAT when students at VHGT Level 0 (p = .723).
Similarly, there were no statistically significant mean differences between
comparison and experimental groups’ scores in AQAT when students at VHGT
Level 2 (p = .294). However, when students are at VHGT Level 1, there were

64
significant differences between comparison and experimental groups’ scores in
AQAT (p < .05). In summary, this result shows that students in VHGT Level 1 in
EG benefited from the treatment more than students in VGHT Level 0 and Level 2.
4.3. Summary
A two-way ANOVA was conducted to examine the effect of comparison and
experimental groups, and van Hiele geometric thinking level in scores of AQAT. The
dependent variable, scores of AQAT, was normally distributed for groups formed by
the combination of the van Hiele geometric thinking levels, and comparison and
experimental groups as assessed by skewness and kurtosis values. There was
homogeneity of variance between groups as assessed by Levene’s test. The results
indicated a significant main effect of comparison and experimental groups on scores
of AQAT, F (1,69) = 8.74 , p <.05. Moreover, there was a significant interaction
between the effects of comparison and experimental groups, and van Hiele geometric
thinking level on scores of AQAT, F (2,69) = 7.31, p < 0.5. Simple main effects
analysis indicated that students in experimental group were significantly more
successful in AQAT than students in comparison group when in VHGT Level 1 (p <
.05). However, there were no significant mean differences between students in
comparison group and students in experimental group when in VHGT Level 0 (p =
.723) or VHGT Level 2 (p = .294).

65
CHAPTER 5
DISCUSSION AND IMPLICATIONS
This chapter was devoted to present the discussion of the results, implications, and
recommendations for further studies.
5.1. Discussion of the Results
The purpose of this research was to investigate the effects of mathematics instruction
supported by dynamic geometry activities on students’ achievement in area of
quadrilaterals and on students’ achievements according to their van Hiele geometric
thinking levels. GeoGebra was used as dynamic geometry software for this study.
The topic of area of quadrilaterals at 7th
grade mathematics curriculum was covered
in this study. The topic of area of quadrilaterals involved area of parallelograms, area
of rhombus, area of trapezoids, relationship between perimeter and area and
relationship between side length and area subtopics.
There were eight activities for these subtopics in the study. The worksheets and
GeoGebra screen views of these activities were presented in the Appendix H and
Appendix I. In this study, the subjects were categorized by using two independent
variables which were treatments and van Hiele geometric thinking levels.
One of the findings of the study indicated that the usage of dynamic geometry
software (DGS) in mathematics instruction had a positive effect on students’ scores
in the Area of Quadrilaterals Achievement Test (AQAT) in favor of the mathematics
instruction supported by dynamic geometry activities. The possible reasons of this
enhancement can be that the activities were designed in order to maximize usability
of GeoGebra easily and the usage of its dynamic features. In addition, the activities
were prepared to make the manipulation of the figures easy. According to Jones
(2000), students can explore, conjecture, construct and realize geometrical

66
relationships while interacting with DGS. In addition to this, students have a chance
to see different views of an object in DGS easily in comparison to paper and pencil
construction (Aarnes & Knudtzon, 2003). In activities, students in experimental
group (EG) had a chance to see different views of parallelograms, rhombuses and
trapezoids. They explored relationships between quadrilaterals by following
directions which listed in worksheets and also freely at the end of the all lessons. All
of the activities were about relationships among quadrilaterals and their connections
to each other. These explorations the relationships and connections among
quadrilaterals through GeoGebra resulted in higher level of achievement in the topic
of area of quadrilaterals for students in EG. This result was consisted with the results
of Yılmaz and others (2009) who investigated the effect of DGS on 7th
grade students
understanding the relationship of area and perimeter topics. They found that with
help of DGS, a great number of students had corrected their misunderstanding and
their success level in area and perimeter topics increased.
The other finding of the study was that, there was a significant interaction between
the effects of treatments and van Hiele geometric thinking (VHGT) level on scores of
AQAT. Clearly, this result indicates, if there is a significant differences between
experimental group and comparison group, this different depends on students’ van
Hiele geometric thinking levels. This result was followed up and this follow up
analysis revealed that students in EG were significantly more successful in area of
quadrilaterals than students in comparison group (CG) who were at VHGT Level 1.
However, there was no significant mean difference in scores of AQAT between
students in CG and students in EG who were at VHGT Level 0. Similarly, there was
no significant mean difference in scores of AQAT between students in CG and
students in EG who were at VHGT Level 2.
Students in VHGT Level 0, namely Visual Level, can identify shapes according to
their examples and appearances; in Level 1, Analysis or Description Level, can
identify given figure and describe its properties, and in Level 2, Abstract or Informal
Deduction Level, can identify relationships between shapes and can produce simple
logical deduction. The hierarchical relationships of quadrilaterals can be regarded as
a difficult task for students in Level 0 and Level 1 (Fujita & Jones, 2007). The

67
hierarchical relationships require seeing relationships among figures, so logical
deduction. Fujita and Jones (2007) suggested that hierarchical relationships of the
quadrilaterals can be used to help students to move from shape properties to
geometrical properties, namely relationship among shapes and their properties. The
activities in the current study were about relationship among quadrilaterals. For
example, the first and second activities involved relationships between parallelogram
and rectangle, the third activity involved relationships between rhombus and
rectangle, the forth activity involved relationships between rhombus and
parallelogram, the fifth activities involved relationships between trapezoid,
parallelogram and rectangle, and the sixth activities involved relationships between
trapezoid and parallelogram. In addition, the first and fifth activities involved
manipulating side lengths of parallelogram or trapezoid by preserving their basic
properties. Moreover, the fourth and sixth activities covered different views of
rhombus and trapezoid in order to deal with students’ prototype shapes. All of these
activities were related with the hierarchical relationships of quadrilaterals.
The possible reason of the improvements of the achievements of students at van
Hiele geometric thinking level 1 in EG can be that these activities may help them
progressing from shape properties to geometrical properties by using hierarchical
relationships of quadrilaterals. This result was consisted with the results of Fujita and
Jones (2007). The possible reason of the similar success levels for students at van
Hiele geometric thinking level 2 in CG and EG can be that students in Level 2
already achieved logical deduction level of van Hiele hierarchy and they can see the
interrelationships among shapes. Moreover, they can understand the hierarchical
relationships of quadrilaterals according to classical van Hiele theory (Atebe, 2009;
Usiskin, 1982). Students at van Hiele geometric thinking level 2 in comparison group
learned area of quadrilaterals topic by traditional learning environment nearly same
level with students in experimental group, since they were able to see the
relationships between quadrilaterals. The other result of the follow up analysis was
similar success levels for students at van Hiele geometric thinking level 0 in CG and
EG. The possible reason of these similar success levels can be that these students
were at the visualization level, so they can name shapes by their appearances.

68
Students at van Hiele geometric thinking level 0 in experimental group did not
benefited from treatment sufficiently, since these students were not ready to
understand the hierarchical relationships of quadrilaterals according to classical van
Hiele theory (Atebe, 2009; Usiskin, 1982). Therefore, students’ achievements were
the nearly same level in both groups. In addition, students in level 0 may be
influenced by their prototype images of quadrilaterals.
5.2. Implications
Mathematics curriculum in Turkey suggests using visualization and concrete
representations. Dynamic geometry software (DGS) is a useful tool to make abstract
concepts to concrete representations. In addition, different views of a shape or
relationships among shapes can be explored by manipulating shapes in DGS. DGS
also provides real time measures for perimeter, area or angles for manipulated
shapes. Therefore, students can easily explore and analyze how the shapes change or
what measures change when manipulating, and they can understand the relationships
among shapes which is the basic requirement for van Hiele geometric thinking level
2.
In this study, the results indicated that using GeoGebra in area of quadrilaterals
improved students’ achievements. In addition to this, using GeoGebra activities
which based on hierarchical classification of quadrilaterals had positive effects on
students’ achievements, specifically at van Hiele geometric thinking level 1. Clearly,
according to Fujita and Jones (2007) and the results of this study, the usage of
GeoGebra activities based on hierarchical classification of quadrilaterals can be
considered a bridge between van Hiele geometric thinking level 1 and level 2.
Therefore, teachers can apply dynamic activities based on GeoGebra or other
dynamic geometry software in instructional phase while teaching area of
quadrilaterals topic in order to improve both students’ achievements and geometric
thinking especially when their students are at van Hiele geometric thinking level 1.
In the mathematics curriculum and F@TIH Project, effective technology usage is
emphasized. However, there is not enough activities which integrate technology in
teaching and learning process. As the results indicated the usage of DGS in

69
mathematics instruction is helpful to improve students’ understanding and
achievement in Mathematics, specifically in the topic of area of quadrilaterals.
Therefore, curriculum developers and textbook writers should develop more
computer based activities or examples how teachers should integrate technology in
teaching and learning process. In addition to them, the GeoGebra activities took time
during the students reach generalizations by exploring and building their own
knowledge. The presented lesson hours for objectives in mathematics curriculum
were nearly sufficient to administrate the activities. Therefore, in order to use
GeoGebra or other DGS based activities in teaching and learning process the
presented lesson hours for objectives should be revised for this manner.
5.3. Recommendations for Further Research
This study provides a framework analysis about how technology enhances students’
learning of some mathematical concepts and some information about students’
achievements in mathematics according to their van Hiele geometric thinking level,
and how technological tools such as GeoGebra may influence students’
understanding of geometry. This study focused on area of quadrilaterals topic of
seventh grade mathematics. Therefore, this study only included the usage of dynamic
geometry software in the topic of area of quadrilaterals and achievements of the
seventh grade students. In order to analyze the effects of GeoGebra in other topics
and other grade levels, further research should be conducted. In addition, this study
examined the effect of GeoGebra to students’ achievement according to their van
Hiele geometric thinking levels. In this study, GeoGebra activities had effects only
students at van Hiele geometric thinking level 1. In order to examine the effects of
GeoGebra to other van Hiele geometric thinking levels different activities should be
developed and research should be conducted.
GeoGebra which is a DGS was used as a learning tool in this study. The effect of
other DGS in same topic and same grade should be examined to understand their
effects on seventh grade students’ achievements on area of quadrilaterals.

70
This study was lasted for eight lesson hours. Therefore, the long-term effects of using
GeoGebra on students’ achievements in mathematics and their achievements
regarding van Hiele hierarchy should be investigated in further research.
Since this study did not include random sampling methods, its results were limited to
similar conditions and this study was conducted relatively small number of
participants. Therefore, new studies should be conducted with larger and randomly
selected participants in order to test its results for these conditions.
71
REFERENCES
Aarnes, J. F. & Knudtzon, S. H. (2003). Conjecture and discovery in geometry a
dialogue between exploring with dynamic geometric software and
mathematical reasoning. Matematiska Och Systemtekniska Institutionen.
Retrieved September 04, 2012, from: http://vxu.se/msi/picme10/f5aj.pdf.
Akkaya, A., Tatar, E. & Kağızmanlı, T. B. (2011). Using Dynamic Software in
Teaching of the Symmetry in Analytic Geometry: The Case of GeoGebra.
Procedia Social and Behavioral Sciences, 15, 2540–2544.
AktaĢ, D. Y. & Cansız - AktaĢ, M. (2012). Eighth Grade Students’ Understanding
and Hierarchical Classification of Quadrilaterals. Elementary Education
Online, 11(3), 714-728.
Altun M. (2008). İlköğretim İkinci Kademe (6, 7 ve 8. Sınıflarda) Matematik
Öğretimi (6. Baskı). Ġstanbul: Aktüel
Atebe, H. U. (2009). Student's van Hiele levels of geometric thought and conception
in plane geometry: a collective case study of Nigeria and South Africa.
Unpublished doctoral dissertation, Rhodes University, Grahamstown, South
Africa.
Aydoğan, A. (2007). The effect of dynamic geometry use together with open-ended
explorations in sixth grade students’ performances in polygons and similarity
and congruency of polygons. Unpublished master thesis, Middle East
Technical University, Ankara, Turkey.
Aygün Ç. S., Aynur, N., ÇoĢkuntürk, N., Çuha, S. S., Karaman, U., Özçelik, U.,
Ulubay, M. & Ünsal. N. (2011). Matematik 7 Öğretmen Kılavuz Kitabı.
Ankara: MEB.
Aytekin C. & Özçakır B. (2012). Bilgisayar Cebiri Sistemleri ve Dinamik Geometri
Yazılımları Kullanılarak Yapılan AraĢtırmaların Teknolojik Pedagojik Alan

72
Bilgisi Modeli Çerçevesinde Değerlendirilmesi. 6th International Computer
& Instructional Technologies Symposium (ICITS-2012).
Baki, A. (2001). BiliĢim Teknolojisi IĢığı Altında Matematik Eğitiminin
Değerlendirilmesi. Milli Eğitim Dergisi, 149(7), Retrieved October 24, 2012,
from http://yayim.meb.gov.tr/dergiler/149/baki.htm.
Baki, A., Kosa, T., & Guven, B. (2011). A Comparative Study of The Effects of
Using Dynamic Geometry Software and Physical Manipulative on The
Spatial Visualization Skills of Pre-Service Mathematics Teachers. British
Journal of Educational Technology, 42(2), 291-310.
Battista, M. T. (2002). Learning geometry in a dynamic computer environment;
Teaching Children Mathematics, 8(6), 333-339.
Battista, M. T. (2007). The development of Geometric and Spatial Thinking. In F. K.
Lester, Jr., (Ed.), Second Handbook of Research on Mathematics Teaching
and Learning. Charlotte, NC: Information Age Publishing.
Baturo, A., & Nason, R. (1996). Student teachers' subject matter knowledge within
the domain of area measurement. Educational Studies in Mathematics, 31(3),
235-268.
Berberoğlu, G. (2004) Education Sector Study; Student Learning Achievement.
World Blank Report.
Boyraz, ġ. (2008). The Effects Of Computer Based Instruction On Seventh Grade
Students’ Spatial Ability, Attitudes Toward Geometry, Mathematics And
Technology. Unpublished master thesis, Middle East Technical University,
Ankara, Turkey.
Cameron, A. (2004). Kurtosis. In M. Lewis-Beck, A. Bryman, and T. Liao
(Eds.), Encyclopedia of social science research methods. (pp. 544-545).
ThousandOaks, CA: SAGE Publications, Inc.
Cansız - AktaĢ, M., & AktaĢ, D. Y. (2012). Investigating Explanation of Relations
Between Quadrilaterals in The 7th Grade Elementary School Mathematics

73
Curriculum, Textbooks And Students’ Workbooks. e-Journal of New World
Sciences Academy NWSA-Education Sciences, 1C0548, 7(2), 848-858.
Chambers, P. (2008) Teaching Mathematics. Developing as a Reflective Secondary
Teacher. ThousandOaks, CA: SAGE Publications, Inc.
Choi-Koh, S. S. (1999). A Student’s Learning Of Geometry Using The Computer.
Journal of Educational Research, 92(5), 301-311.
Clements, D. H. & Battista, M. T. (1992). Geometry and spatial reasoning. In D. A
Grouws, (ed.), Handbook of Research on Mathematics Teaching and
Learning, pp .420-464. Macmillan, New York.
Crowley, M. L. (1987). The van Hiele Model of the Development of Geometric
Thought. In Learning and Teaching Geometry, K-12, Yearbook of the
National Council of Teachers of Mathematics, edited by Mary Montgomery
Lindquist, pp.1-16. Reston, Va.: National Council of Teachers of
Mathematics.
Çelen, F. K., Çelik, A. & Seferoğlu, S. S. (2011). Türk Eğitim SĠSTEMĠ ve PISA
Sonuçları. XIII. Akademik Bilişim Konferansı, 2-4 ġubat, Ġnönü Üniversitesi,
Malatya.
De Villiers, M. (1996). An Extended Classification of Quadrilaterals (An excerpt
from. Some Adventures in Euclidean Geometry. University of Durban-
Westville) Retrieved November 13, 2012, from
http://mysite.mweb.co.za/residents/profmd/quadclassify.pdf
Demir, V. (2011). Cabri 3D Dinamik Geometri Yazılımının, Geometrik Düşünme ve
Akademik Başarı Üzerine Etkisi. Unpublished master thesis, Marmara
University, Ġstanbul, Turkey.
Doğan, M. & Ġçel, R. (2011). The Role of Dynamic Geometry Software in The
Process of Learning: GeoGebra Example About Triangles. International
Journal of Human Sciences, 8(1), ISSN: 1303-5134.
Doktoroğlu, R. (2013). The Effects of Teaching Linear Equations with Dynamic
Mathematics Software on Seventh Grade Students’ Achievement.

74
Unpublished master thesis, Middle East Technical University, Ankara,
Turkey.
Duatepe, A. (2004). The Effects of Drama Based Instruction on Seventh Grade
Students’ Geometry Achievement, Van Hiele Geometric Thinking
Levels, Attitude Toward Mathematics and Geometry. Unpublished doctoral
dissertation, Middle East Technical University, Ankara, Turkey.
Dye, B. (2001). The Impact Of Dynamic Geometry Software On Learning. Teaching
Mathematics and Its Applications, 20(4).
Erbas, A. K. & Aydogan Yenmez, A. (2011). The Effect of Inquiry-Based
Explorations in a Dynamic Geometry Environment on Sixth Grade Students’
Achievements in Polygons. Computers & Education, 57(4), 2462-2475, ISSN
0360-1315, 10.1016/j.compedu.2011.07.002.
Ersoy, M. (2009). The Effect Of Computer Aided Applications On Elementary
Mathematics Teacher Candidates’ Geometry Success and Their Perceptions
About Learning and Teaching. Unpublished master thesis, Eskisehir
Osmangazi University, EskiĢehir, Turkey.
Felder, R. M., & Brent, R. (2009). Active learning: An introduction. ASQ Higher
Education Brief, 2(4), 122-127.
Fidan, Y. & Türnüklü, E. (2010). Ġlköğretim 5. Sınıf Öğrencilerinin Geometrik
DüĢünme Düzeylerinin Bazı DeğiĢkenler AçıĢından Ġncelenmesi. (Turkish).
Pamukkale University Journal of Education, 27, 185-197.
Field, A. (2009). Discovering statistics using SPSS. (3rd
Ed.) London: Sage
Publications Ltd..
Filiz, M. (2009). GeoGebra ve Cabri Geometri II Dinamik Geometri Yazılımlarının
Web Destekli Ortamlarda Kullanılmasının Öğrenci Başarısına Etkisi.
Unpublished master thesis, Karadeniz Technical University, Trabzon, Turkey.
Fraenkel, J. R. & Wallen, N. E. (2009). How to Design and Evaluate Research in
Education. (7th
Ed.). NY: McGraw-Hill.
75
Forsythe, S. (2007) Learning geometry through dynamic geometry software,
Mathematics Teaching, 202, 31-35.
Fujita, T. & Jones, K. (2007). Learners’ Understanding of The Definitions and
Hierarchical Classification of Quadrilaterals: Towards A Theoretical
Framing. Research in Mathematics Education, 9(1 and 2), 3-20. ISSN: 1479-
4802; ISBN: 0953849880.
Gecü, Z. (2011). Fotoğrafların Dinamik Geometri Yazılımı ile Birlikte
Kullanılmasının Başarıya ve Geometrik Düşünme Düzeyine Etkisi.
Unpublished master thesis, Marmara University, Ġstanbul, Turkey.
Güven, B. & KarataĢ, Ġ. (2009). The Effect of Dynamic Geometry Software (CABRI)
on Pre-Service Elementary Mathematics Teachers' Academic Achievement
About Locus Problems. Ankara Üniversitesi Eğitim Bilimleri Fakültesi
Dergisi, 42(1), 1.
Güven, B. & Kosa, T. (2008). The Effect of Dynamic Geometry Software on Student
Mathematics Teachers' Spatial Visualization Skills. The Turkish Online
Journal of Educational Technology, 7(4).
Hill, J. R. & Hannafin, M. J. (2001). Teaching and Learning in Digital
Environments: The Resurgence of Resource-based Learning. Educational
Technology Research and Development, 49(3), 37-52.
Hohenwarter, J., Hohenwarter, M. & Lavicza, Z. (2010). Evaluating Difficulty
Levels of Dynamic Geometry Software Tools to Enhance Teachers'
Professional Development. International Journal for Technology in
Mathematics Education, 17(3), 127-134.
Hohenwarter, M. & Jones, K. (2007). Ways of linking geometry and algebra: the
case of Geogebra. Proceedings of the British Society for Research into
Learning Mathematics, 27(3), 126-131.
Huang, H. M. E., & Witz, K. G. (2013). Children’s Conceptions of Area
Measurement and Their Strategies for Solving Area Measurement Problems.
Journal of Curriculum and Teaching, 2(1), p10.

76
IĢıksal, M. & AĢkar, P. (2005). The Effect of Spreadsheet and Dynamic Geometry
Software on The Achievement and Self-Efficacy of 7th-Grade Students.
Educational Research, 47(3), 333-350.
Ġçel, R. (2011). Bilgisayar Destekli Öğretimin Matematik Başarısına Etkisi:
GeoGebra Örneği. Unpublished master thesis, Selcuk University, Konya,
Turkey.
Jones, K. (2000). Providing a Foundation for Deductive Reasoning: Students’
Interpretations When Using Dynamic Geometry Software. Educational
Studies in Mathematics, 44(1 and 2), 55-85.
Kepceoğlu, Ġ. (2010). GeoGebra Yazılımıyla Limit ve Süreklilik Öğretiminin
Öğretmen Adaylarının Başarısına ve Kavramsal Öğrenmelerine Etkisi.
Unpublished master thesis, Marmara University, Ġstanbul, Turkey.
Kordaki, M. & Potari, D. (2002). The Effect of Area Measurement Tools on Students
Strategies: The Role of Computer Microworld. International Journal of
Computers for Mathematical Learning, 7(1), 65-100.
Köse, N. (2008). İlköğretim 5. Sınıf Öğrencilerinin Dinamik Geometri Yazılımı Cabri
Geometriyle Simetriyi Anlamlandırmalarının Belirlenmesi: Bir Eylem
Araştırması. Unpublished master thesis, Anadolu University, EskiĢehir,
Turkey.
Köseleci-Blanchy N. ve ġaĢmaz A. (2011). PISA 2009: Where does Turkey Stand?.
Turkish Policy Quarterly, 10(2).
Kurak, Y. (2009). Dinamik Geometri Yazilimi Kullanımının Öğrencilerin Dönüşüm
Geometri Anlama Düzeylerine ve Akademik Başarılarına Etkisi. Unpublished
master thesis, Karadeniz Technical University, Trabzon, Turkey.
Lowe, J. S. (2004). A Theory of Effective Computer-Based Instruction for Adults.
Unpublished doctoral dissertation, Louisiana State University, Louisiana,
USA.
Malloy, C. (2002). The van Hiele Framework in Navigating Through Geometry in
Grades 6-8. Reston, VA: NCTM.

77
Mason, M. M. (1998). The van Hiele Levels of Geometric Understanding. The
Professional Handbook for Teachers: Geometry. Boston: McDougal-Littell /
Houghton-Mifflin, p. 4-8.
Matlock-Hetzel, S. (1997). Basic Concepts in Item and Test Analysis. Southwest
Educational Research Association, Austin.
Mayberry, J. (1983). The Van Hiele Levels of Geometric Thought in Undergraduate
Pre-Service Teachers. Journal for Research in Mathematics Education, 14,
58-69.
Ministry of National Education, (2009a). İlköğretim Matematik Dersi (6 - 8. Sınıflar)
Öğretim Programı. Retrieved June 12, 2012, from TTKB website:
http://ttkb.meb.gov.tr/dosyalar/programlar/ilkogretim/matematik6_8.rar.
Ministry of National Education, (2009b). İlköğretim Matematik Dersi (1 - 5. Sınıflar)
Öğretim Programı. Retrieved June 12, 2012, from TTKB website:
http://ttkb.meb.gov.tr/dosyalar/programlar/ilkogretim/matematik1_5.rar
Ministry of National Education, (2013). Ortaokul Matematik Dersi (5 - 8. Sınıflar)
Öğretim Programı. Talim Terbiye Kurulu BaĢkanlığı, Ankara.
Ministry of National Education, (2011). Fatih projesi – proje hakkında. Retrieved
September 15, 2012 from website:
http://fatihprojesi.meb.gov.tr/tr/icerikincele.php?id=6.
Mullis, I. V. S., Martin, M. O., Gonzales, E. J., Gregory, K. D., Garden, R. A.,
O’Connor, et al. (2000). TIMSS 1999 International Mathematics Report:
Findings from IEA’s Repeat of the Third International Mathematics and
Science Study at the Eighth Grade. Chestnut Hill, MA: Boston College.
Retrieved November 13, 2012, from
http://timss.bc.edu/timss1999i/pdf/T99i_Math_All.pdf.
National Council of Teachers of Mathematics. (2000). Curriculum And Evaluation
Standards For School Mathematics. Reston, VA: Author.
Oldknow, A. (2007). Researching with software - CAS, DGS and Cabri 3D.
ICTMT7, Bristol, Angleterre.

78
Olkun, S. & Aydoğdu, T. (2003). Üçüncü Uluslararası Matematik ve Fen AraĢtırması
(TIMSS) Nedir? Neyi Sorgular? Örnek Geometri Soruları ve Etkinlikleri,
İlköğretim-Online, 2(1), 28-35.
Olkun, S., Sinoplu, N. B., & Deryakulu, D. (2005). Geometric Explorations with
Dynamic Geometry Applications based on van Hiele Levels. International
Journal for Mathematics Teaching and Learning, 6, 1-12.
Olkun, S. & Toluk Uçar, Z. (2009). İlköğretimde Etkinlik Temelli Matematik
Öğretimi (4. Baskı), Maya Akademi, Ankara.
Orton, A. (2004). Learning mathematics: Issues, theory and practice. London:
Continuum.
Özen, D. (2009). İlköğretim 7. Sınıf Geometri Öğretiminde Dinamik Geometri
Yazılımlarının Öğrencilerin Erişi Düzeylerine Etkisi ve Öğrenci Görüşlerinin
Değerlendirilmesi. Unpublished master thesis, Dokuz Eylul University,
Ġzmir, Turkey.
Pegg, J. E. (1992). Students’ understanding of geometry: theoretical perspectives’.
Space: The first and final frontier, Mathematics Education Research Group
of Australasia, 18-36.
Reynolds, A., & Wheatley, G. H. (1996). Elementary students' construction and
coordination of units in an area setting. Journal for Research in Mathematics
Education, 27(5), 564-581.
Ruthven, K. (2009). Towards a naturalistic conceptualization of technology
integration in classroom practice: The example of school
mathematics. Education & Didactique, 3(1), 131-152.
Selçik, N. & Bilgici, G. (2011). The Effects of the GeoGebra Software on Students’
Academic Achievement. Kastamonu Eğitim Dergisi, 19(3), 913-924.
Suydam, M. N. (1985). The Shape of Instruction in Geometry. Some Highlights
From Research, Mathematics Teacher, 7, 481-486.
ġataf, H. A. (2010). Bilgisayar Destekli Matematik Öğretiminin İlköğretim 8.Sinif
Öğrencilerinin “Dönüşüm Geometrisi” ve “Üçgenler” Alt Öğrenme

79
Alanındaki Başarısı ve Tutuma Etkisi (Isparta Örneği). Unpublished master
thesis, Sakarya University, Sakarya, Turkey.
Tabachnick, B.G. & Fidell, L.S. (2007). Using Multivariate Statistics (5th
Ed.). New
York: Allyn and Bacon.
Tan-ġiĢman, G., & Aksu, M. (2009). Yedinci Sınıf Öğrencilerinin Alan ve Çevre
Konularındaki BaĢarıları. İlköğretim Online, 8(1), 243-253.
Tan-ġiĢman, G., & Aksu, M. (2012). Sixth Grade Students’ Performance on Length,
Area, and Volume Measurement. Education and Science, 37(166).
Tezci, E. (2011). Turkish Primary School Teachers’ Perceptions of School Culture
Regarding ICT Integration. Education Technology & Research Development,
59(1), 429–443.
Thomas, M. J. & Auckland Inst. of Tech. (New, Z.). (2000). Proceedings of the
International Conference on Technology in Mathematics Education
(Auckland, NZ, December 11-14, 2000).
Toker, Z. (2012). İlköğretim Matematik Öğretmen Kılavuz Kitabı 7. Ankara: Semih
Ofset.
Toker-Gül, Z. (2008). The Effect of Using Dynamic Geometry Software While
Teaching by Guided Discovery on Students Geometric Thinking Levels and
Achievement [Electronic resource]. Unpublished master thesis, Middle East
Technical University, Ankara, Turkey.
Tutak, T. & Birgin, O. (2008). The Effects of Geometry Instruction with Dynamic
Geometry Software on The Students’ Van Hiele Geometric Thinking Level.
International Educational Technologies Conference. Retrieved October 16,
2012, from http://ietc2008.home.anadolu.edu.tr/ietc2008/207.DOC
Tutkun, O. F., Güzel, G., Köroğlu, M. & Ġlhan, H. (2012). Bloom’s Revised
Taxonomy and Critics on It. The Online Journal of Counseling and
Education - July 2012, 1(3).

80
Ubuz, B. & Üstün, I. (2004). Figural and Conceptual Aspects in Defining and
Identifying Polygons. Eurasian Journal of Educational Research, 16, 15-26.
Ubuz, B., Üstün, I. & ErbaĢ, A. (2009). Effect of Dynamic Geometry Environment
on Immediate and Retention Level Achievements of Seventh Grade Students.
Eurasian Journal of Educational Research (EJER), (35), 147-164.
Umay, A. (2007). Eski ArkadaĢımız Okul Matematiğinin Yeni Yüzü, Ankara: Aydan
Web Tesisleri.
Usiskin, Z. (1982). Van Hiele Levels And Achievement In Secondary School
Geometry. Chicago: University of Chicago.
Usiskin, Z., Griffin, J., Witonsky, D. & Wilmore, E. (2008). The Classification of
Quadrilaterals: A Study of Definition. (p. 86). Information Age Pub Inc.
Uzun, S., Bütüner, S.Ö. & Yiğit, N. (2010). 1999-2007 TIMSS Fen Bilimleri ve
Matematik Sonuçlarının KarĢılaĢtırılması: Sınavda En BaĢarılı Ġlk BeĢ Ülke-
Türkiye Örneği. İlköğretim Online, 9(3), 1174-1188.
Van de Walle, J. A. (2007). Elementary and middle school mathematics: Teaching
developmentally, (6th
ed.). Boston: Pearson Education, Inc.
Varma, S. (2006). Preliminary item statistics using point-biserial correlation and p-
values. Educational Data Systems Inc.: Morgan Hill CA. Retrieved, 16(07).
Vatansever, S. (2007). İlköğretim 7. Sınıf Geometri Konularını Dinamik Geometri
Yazılımı Geometer’s Sketchpad ile Öğrenmenin Başarıya, Kalıcılığa Etkisi ve
Öğrenci Görüşleri. Unpublished master thesis, Dokuz Eylul University,
Ġzmir, Turkey.
Wilken, R. & Goggin, G. (2012). Mobile Technology and Place. New York:
Routledge, 2012.
Yılmaz, G., ġahin, S., Çakıroğlu, P. & Güven, B. (2009). The Effect on Dynamic
Geometry Software Cabri’s 7th Grade Pupils’ Understanding The
Relationship of Area-Perimeter Subject. 3th International Computer And
Instructional Technologies Symposium, Trabzon. Retrieved February 14,
2013 from

81
http://www.pegem.net/akademi/sempozyumbildiri_detay.aspx?id=107759
Zacharos, K. (2006). Prevailing educational practices for area measurement and
students’ failure in measuring areas. The Journal of Mathematical Behavior,
25(3), 224-239.
Zengin, Y. (2011). Dinamik Matematik Yazılımı GeoGebra’nın Öğrencilerin
Başarılarına ve Tutumlarına Etkisi. Unpublished master thesis,
KahramanmaraĢ Sutcu Imam University, KahramanmaraĢ, Turkey.
Zimmaro, D. M. (2003). Test Item Analysis & Decision Making. Retrieved May 09,
2012, from http://ctl.utexas.edu/assets/Evaluation-Assessment/Test-Item-
Analysis-and-Decision-Making-8-25-03.pdf

82
APPENDICES
APPENDIX A
FORMER VERSION OF READINESS TEST FOR AREA AND PERIMETER
CONCEPTS

83

84

85

86
APPENDIX B
FINAL VERSION OF READINESS TEST FOR AREA AND PERIMETER
CONCEPTS

87

88

89

90
APPENDIX C
FORMER VERSION OF AREA OF QUADRILATERALS ACHIEVEMENT
TEST
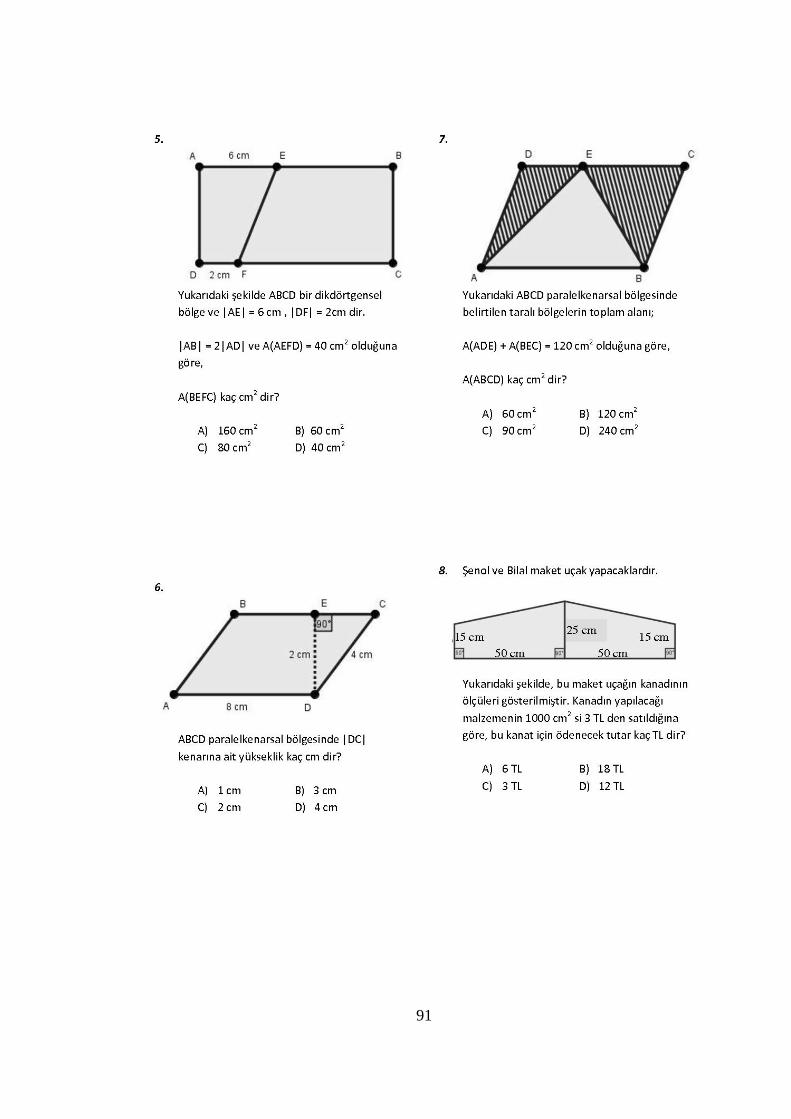
91

92

93

94

95

96

97

98
APPENDIX D
FINAL VERSION OF AREA OF QUADRILATERALS ACHIEVEMENT
TEST

99

100

101

102

103

104
APPENDIX E
VAN HIELE GEOMETRIC THINKING LEVEL TEST

105

106

107

108
APPENDIX F
ANALYSIS FOR PILOT STUDY OF RTAP
Item Proportion of
Correct Answers
Discrimination
Index
Point Biserial
Correlation Coefficient
1 0,65 0,58 0,53
2 0,80 0,43 0,52
3 0,64 0,49 0,43
4 0,83 0,36 0,45
5 0,45 0,61 0,49
6 0,78 0,48 0,43
7 0,71 0,50 0,49
8 0,37 0,52 0,45
9 0,45 0,66 0,58
10 0,37 0,61 0,54
11 0,24 0,44 0,44
12 0,57 0,72 0,58
13 0,53 0,68 0,58
14 0,57 0,61 0,53
15 0,29 0,39 0,43
16 0,69 0,64 0,53
17 0,35 0,37 0,35
18 0,40 0,41 0,38
Average 0,54 0,53 0,49

109
APPENDIX G
ANALYSIS FOR PILOT STUDY OF AQAT
Item Proportion of
Correct Answers
Discrimination
Index
Point Biserial
Correlation Coefficient
1 0,43 0,51 0,41
2 0,33 0,37 0,39
3 0,52 0,44 0,41
4 0,51 0,62 0,47
5 0,45 0,42 0,41
6 0,48 0,20 0,17
7 0,50 0,60 0,51
8 0,39 0,54 0,41
9 0,49 0,57 0,47
10 0,43 0,54 0,45
11 0,31 0,28 0,29
12 0,33 0,43 0,42
13 0,23 0,32 0,26
14 0,43 0,52 0,45
15 0,22 0,17 0,16
16 0,33 0,19 0,20
17 0,45 0,58 0,48
18 0,48 0,65 0,59
19 0,49 0,79 0,62
20 0,52 0,65 0,52
21 0,43 0,72 0,59
22 0,56 0,63 0,52
23 0,30 0,52 0,47
24 0,46 0,74 0,59
25 0,40 0,40 0,31
26 0,64 0,59 0,47
27 0,37 0,38 0,37
28 0,46 0,31 0,30
29 0,33 0,26 0,20
30 0,33 0,30 0,29
31 0,32 0,21 0,20
32 0,55 0,56 0,46
33 0,23 -0,12 -0,11
Average 0,42 0,45 0,39

110
APPENDIX H
STUDENT WORKSHEETS
Student Worksheet 1: Area of Parallelogram
Paralelkenarsal Bölgede Alan
Bu etkinlikte paralelkenarsal bölgenin alan bağıntısını, bilinen alan bağıntıları yardımıyla
oluşturmaya çalışacağız.
“1.1. Paralelkenar – Öğrenci.ggb” dosyasını açınız.
Etkinliğe Hazırlık
1. Bu etkinlikte verilen ABCD paralelkenarsal bölgesinde;
A noktası yukarıya ve aşağıya,
B ve C noktaları ise sağa ve sola hareket etmektedir.
Etkinlik
2. Aşağıdaki adımları uygulayarak gerçekleşen değişimleri gözlemleyip not alınız.
a. A noktasını hareket ettirerek beş farklı konumda oluşan değerleri aşağıdaki
tabloya yazınız.
Konum 1 Konum 2 Konum 3 Konum 4 Konum 5
|BC| (= |DA|)
|AB| (= |CD|)
Yükseklik
Çevre
Alan

111
b. B noktasını hareket ettirerek beş farklı konumda oluşan değerleri aşağıdaki
tabloya yazınız.
Konum 1 Konum 2 Konum 3 Konum 4 Konum 5
|BC| (= |DA|)
|AB| (= |CD|)
Yükseklik
Çevre
Alan
c. C noktasını hareket ettirerek beş farklı konumda oluşan değerleri aşağıdaki
tabloya yazınız.
Konum 1 Konum 2 Konum 3 Konum 4 Konum 5
|BC| (= |DA|)
|AB| (= |CD|)
Yükseklik
Çevre
Alan
3. Bu adımların;
a. Hangisinde paralelkenarsal bölgenin alan ölçüsünde bir değişim gerçekleşti, ve
sizce neden alan ölçüsü değişti?

112
b. Hangisinde paralelkenarsal bölgenin alan ölçüsünde değişim olmadı, ve sizce
neden alan ölçüsü değişmedi?
4. Bu etkinlikteki verileriniz ile paralelkenarsal bölge için bir alan bağıntısı oluşturunuz.

113
Student Worksheet 2: The Relationship between Parallelogram and Rectangle
Paralelkenarsal Bölge ve Dikdörtgensel Bölge Arasındaki İlişki
Bu etkinlikte paralelkenarsal bölge ile dikdörtgensel bölgenin benzer özelliklerini bulmaya
çalışacağız.
“1.2. Paralelkenar ve Dikdörtgen.ggb” dosyasını açınız.
Etkinliğe Hazırlık
1. ABCD paralelkenarsal bölgesinin alanını tahmin ediniz. Tahmin stratejinizi açıklayınız.
2. (“Uzaklık ve ya Uzunluk”) aracından yararlanarak paralelkenarsal bölgenin kenar
uzunlukları ve yükseklik (|EH|) uzunluğunu bulunuz. ( aracını seçtikten sonra
kenar uzunluğunu öğrenmek istediğiniz kenarı seçin.)
3. (“Uzaklık ve ya Uzunluk”) aracından yararlanarak paralelkenarsal bölgenin
çevresini bulunuz. ( aracını seçtikten sonra çokgenin iç bölgesini seçin.)
4. (“Alan”) aracından yararlanarak paralelkenarsal bölgenin alanını bulunuz (
aracını seçtikten sonra çokgenin iç bölgesini seçmeniz yeterlidir.)
5. Hesaplanan Alan ve Çevre ölçülerini aracını seçtikten sonra seçip sürükleyerek
çokgen dışına taşıyınız.
6. Aşağıdaki tabloyu doldurunuz.
Paralelkenar
Yükseklik
Çevre
Alan

114
Etkinlik
7. |EH| yüksekliği boyunca paralelkenarsal bölgeyi kesiniz. (“|EH| Boyunca Kes”
butonuna tıklayarak paralelkenarsal bölgeyi iki parçaya ayırın.)
8. Elde ettiğiniz iki çokgeni bir dikdörtgen oluşturacak şekilde birleştiriniz. (Sol tarafta yer
alan çokgeni fare ile taşıyabilirsiniz. Bir dikdörtgenin oluşabileceği durumlarda ekranın
sağ altında “Birleştir” butonu görünecektir. Bu buton yardımıyla çokgenlerden bir
dikdörtgen oluşturabilirsiniz.)
9. Oluşturduğunuz dikdörtgensel bölgenin alanını tahmin ediniz. Tahmin stratejinizi
açıklayınız.
10. Oluşan dikdörtgensel bölgenin alanını (“Alan”) aracından yararlanarak bulun. (
aracını seçtikten sonra çokgenin iç bölgesini seçmeniz yeterlidir.)
11. (“Uzaklık ve ya Uzunluk”) aracından yararlanarak dikdörtgensel bölgenin kenar
uzunluklarını bulun. ( aracını seçtikten sonra kenar uzunluğunu öğrenmek
istediğiniz kenarı seçin.)
12. (“Uzaklık ve ya Uzunluk”) aracından yararlanarak dikdörtgensel bölgenin
çevresini bulunuz. ( aracını seçtikten sonra çokgenin iç bölgesini seçin.)
13. Hesaplanan Alan ve Çevre ölçülerini aracını seçtikten sonra seçip sürükleyerek
çokgen dışına taşıyınız.
14. Bulunan değerlerle ve ilk tablodaki bilgilerle aşağıdaki tabloyu doldurunuz.
Paralelkenar Dikdörtgen
Yükseklik
Çevre
Alan

115
15. Oluşturulan dikdörtgensel bölgenin alanı ile paralelkenarsal bölgenin alanı arasında bir
fark var mıdır? Açıklayınız.
16. Oluşturulan dikdörtgensel bölgenin yüksekliği ile paralelkenarsal bölgenin yüksekliği
arasında bir fark var mıdır? Açıklayınız.
17. Oluşturulan dikdörtgensel bölgenin çevresi ile paralelkenarsal bölgenin çevresi
arasında bir fark var mıdır? Açıklayınız.
18. “Bu ilişkinin gerçekleşmesi için, yükseklik paralelkenarsal bölgenin bir köşesinden
geçmesi gerekmektedir” diye belirtilmiş bir ifade doğru mudur? Yoksa herhangi bir
noktadan tabana dik olarak çizilen her doğru parçasında da aynı ilişkiyi görebilir miyiz?
Açıklayınız.
(“Başa Dön” butonu ile ilk ekrana geri gelerek, “H” noktasını fare ile
seçip sürükleyerek |EH| doğru parçasını taşıyabilir ve bu ifadenin
doğruluğunu test edebilirsiniz.)

116
Student Worksheet 3: Area of Rhombus
Eşkenar Dörtgensel Bölgede Alan
Bu etkinlikte eşkenar dörtgensel bölgenin alan bağıntısını bilinen diğer alan bağıntıları
yardımıyla oluşturmaya çalışacağız.
“2.1. Eşkenar Dörtgen - Öğrenci.ggb” dosyasını açın.
Etkinliğe Hazırlık
5. Sağ altta yer alan “Çalıştır” butonu yardımıyla eşkenar dörtgensel bölgenin çizim
aşamalarını gözlemleyiniz.
6. Şekilde E, F, G ve H noktaları dikdörtgensel bölgenin kenarlarının orta noktalarıdır, k
ve j eşkenarsal bölgenin köşegenleridir.
Etkinlik
7. Dikdörtgensel bölgenin alan bağıntısını yazınız.
8. Şekilde verilen ABCD dikdörtgensel bölgesinin alanı nedir?
9. “Ayır” butonu yardımıyla dikdörtgensel bölge içine çizilen eşkenar dörtgensel bölge
ile oluşan dik üçgenleri birbirinden ayırınız.
10. Ayrılan dik üçgensel bölgelerin dik kenar uzunluklarını “Uzaklık veya Uzunluk” (
) aracı ile ölçün ve aşağıda yer alan tabloya yazın. ( aracını seçtikten sonra kenar
uzunluğunu öğrenmek istediğiniz kenarı seçin.)
11. Ayrılan üçgensel bölgelerin alanlarını “Alan” ( ) aracı ile ölçün ve aşağıda yer
alan tabloya yazın. ( aracını seçtikten sonra alanı ölçülmek istenen çokgenin iç
bölgesini seçin.)
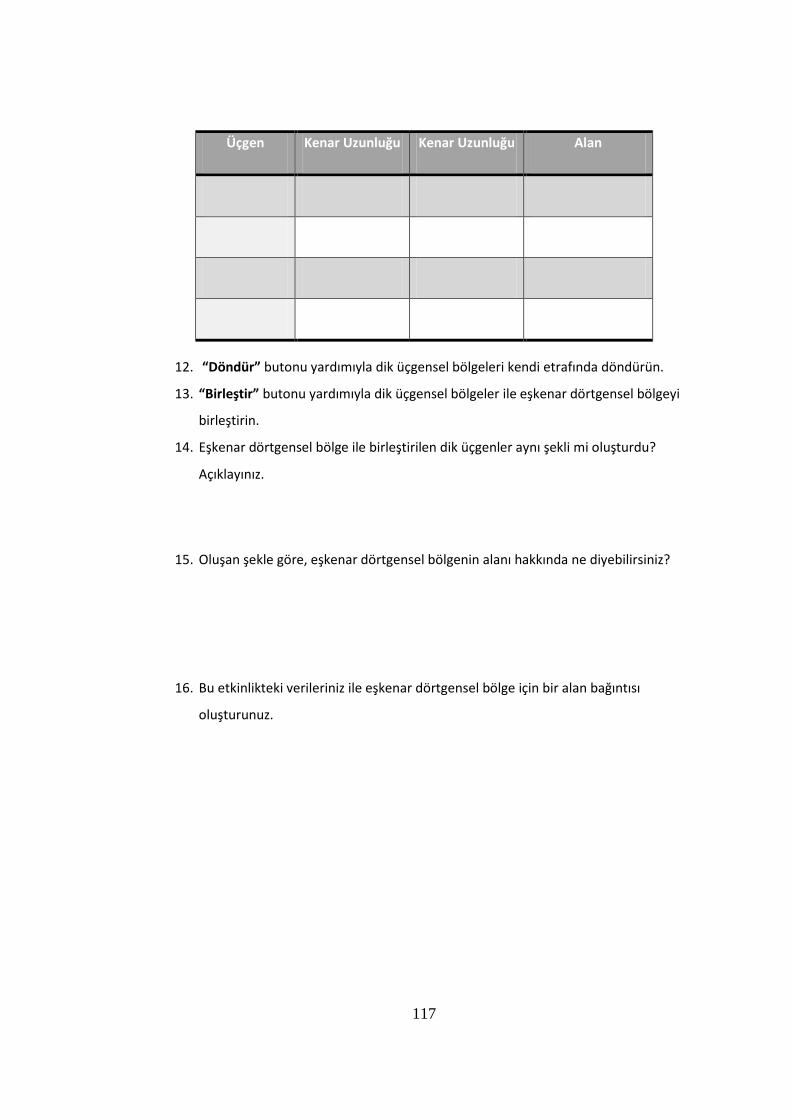
117
Üçgen Kenar Uzunluğu Kenar Uzunluğu Alan
12. “Döndür” butonu yardımıyla dik üçgensel bölgeleri kendi etrafında döndürün.
13. “Birleştir” butonu yardımıyla dik üçgensel bölgeler ile eşkenar dörtgensel bölgeyi
birleştirin.
14. Eşkenar dörtgensel bölge ile birleştirilen dik üçgenler aynı şekli mi oluşturdu?
Açıklayınız.
15. Oluşan şekle göre, eşkenar dörtgensel bölgenin alanı hakkında ne diyebilirsiniz?
16. Bu etkinlikteki verileriniz ile eşkenar dörtgensel bölge için bir alan bağıntısı
oluşturunuz.
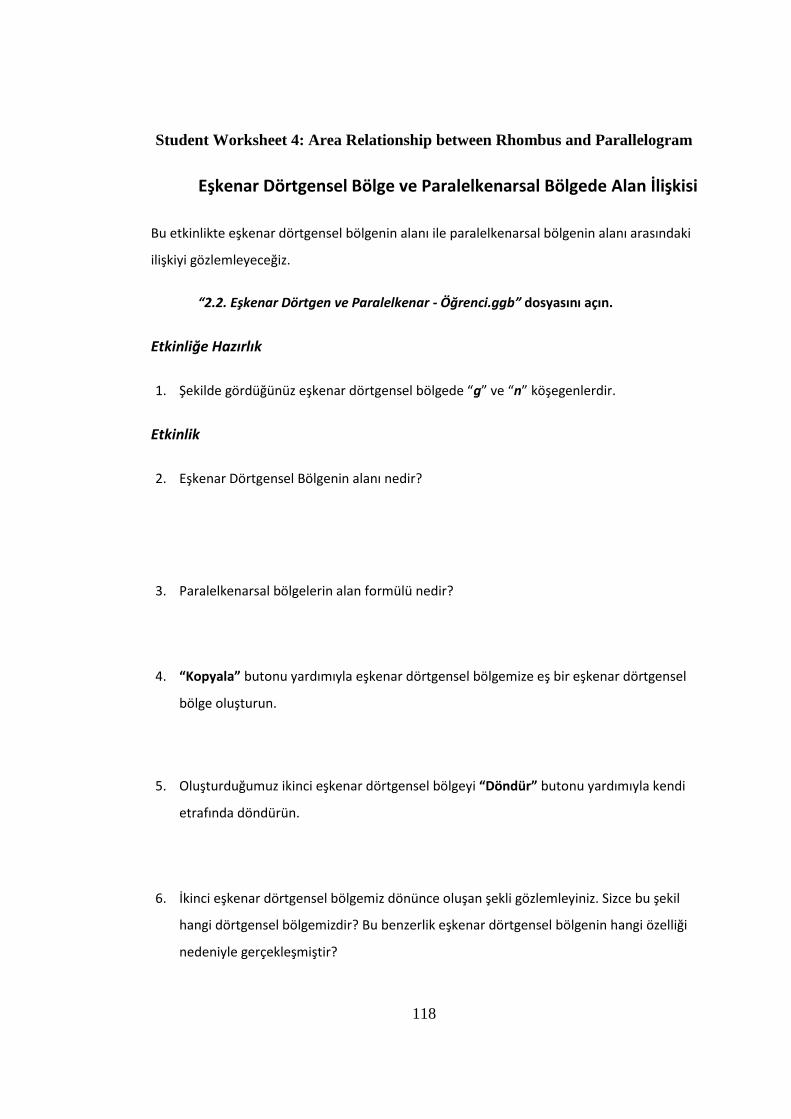
118
Student Worksheet 4: Area Relationship between Rhombus and Parallelogram
Eşkenar Dörtgensel Bölge ve Paralelkenarsal Bölgede Alan İlişkisi
Bu etkinlikte eşkenar dörtgensel bölgenin alanı ile paralelkenarsal bölgenin alanı arasındaki
ilişkiyi gözlemleyeceğiz.
“2.2. Eşkenar Dörtgen ve Paralelkenar - Öğrenci.ggb” dosyasını açın.
Etkinliğe Hazırlık
1. Şekilde gördüğünüz eşkenar dörtgensel bölgede “g” ve “n” köşegenlerdir.
Etkinlik
2. Eşkenar Dörtgensel Bölgenin alanı nedir?
3. Paralelkenarsal bölgelerin alan formülü nedir?
4. “Kopyala” butonu yardımıyla eşkenar dörtgensel bölgemize eş bir eşkenar dörtgensel
bölge oluşturun.
5. Oluşturduğumuz ikinci eşkenar dörtgensel bölgeyi “Döndür” butonu yardımıyla kendi
etrafında döndürün.
6. İkinci eşkenar dörtgensel bölgemiz dönünce oluşan şekli gözlemleyiniz. Sizce bu şekil
hangi dörtgensel bölgemizdir? Bu benzerlik eşkenar dörtgensel bölgenin hangi özelliği
nedeniyle gerçekleşmiştir?

119
7. Oluşan şeklin alan formülü nedir?
8. Oluşan şeklin alanını bu formül yardımıyla bulunuz.
9. Bu etkinlik sonucunda eşkenar dörtgensel bölgelerle ilgili neler diyebiliriz? Bir önceki
etkinliğimizde bulduğumuz alan bağıntısının yanı sıra bu etkinlikteki verileriniz ile alan
bağıntısı oluşturunuz.

120
Student Worksheet 5: Area of Trapezoid
Yamuksal Bölgede Alan
Bu etkinlikte yamuksal bölgenin alan bağıntısını, yamuksal bölge ile etkileşime girerek
oluşturmaya çalışacağız.
“3.1. Yamuksal Bölgenin Alanı - Öğrenci.ggb” dosyasını açınız.
Etkinliğe Hazırlık
1. Bu etkinlikte verilen ABCD yamuksal bölgesinde H noktası yukarıya ve aşağıya, B, C ve
D noktaları ise sağa ve sola hareket etmektedir.
Etkinlik
2. Aşağıdaki adımları uygulayarak gerçekleşen değişimleri gözlemleyip not alınız.
a. B noktasını hareket ettirerek beş farklı konumda oluşan değerleri aşağıdaki
tabloya yazınız.
Konum 1 Konum 2 Konum 3 Konum 4 Konum 5
|AB|
|BC|
|CD|
|DA|
Yükseklik
Çevre
Alan
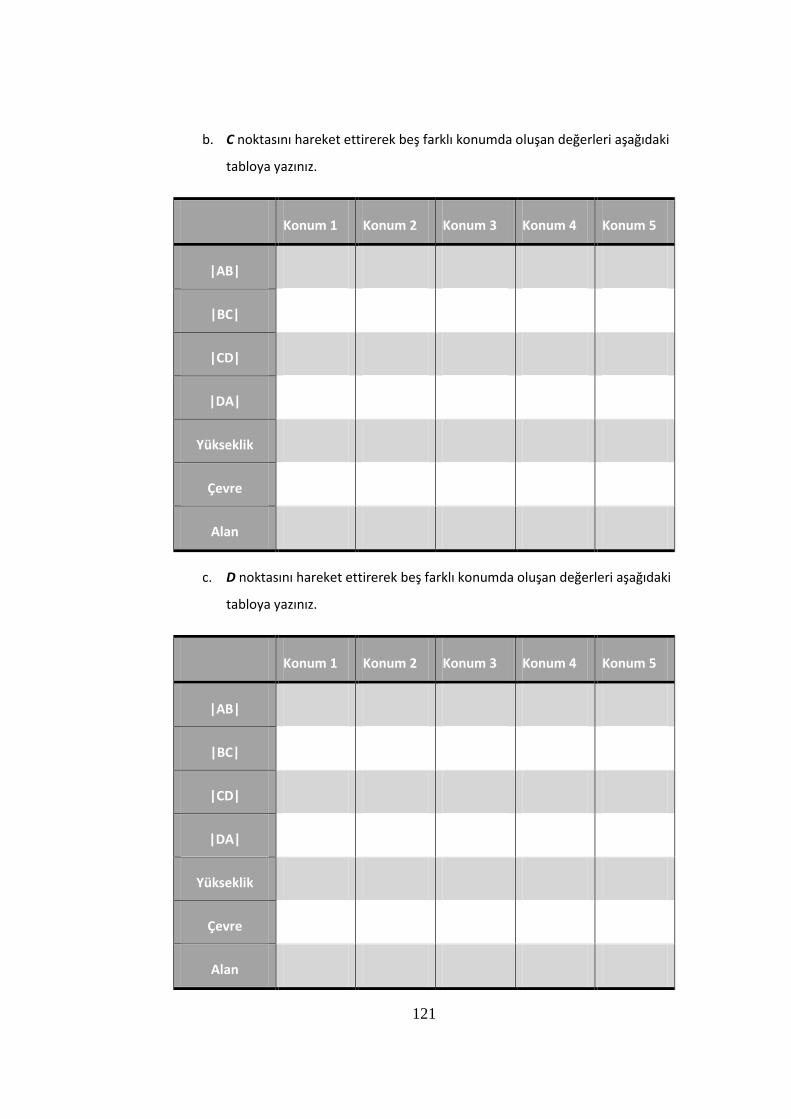
121
b. C noktasını hareket ettirerek beş farklı konumda oluşan değerleri aşağıdaki
tabloya yazınız.
Konum 1 Konum 2 Konum 3 Konum 4 Konum 5
|AB|
|BC|
|CD|
|DA|
Yükseklik
Çevre
Alan
c. D noktasını hareket ettirerek beş farklı konumda oluşan değerleri aşağıdaki
tabloya yazınız.
Konum 1 Konum 2 Konum 3 Konum 4 Konum 5
|AB|
|BC|
|CD|
|DA|
Yükseklik
Çevre
Alan

122
d. H noktasını hareket ettirerek beş farklı konumda oluşan değerleri aşağıdaki
tabloya yazınız.
Konum 1 Konum 2 Konum 3 Konum 4 Konum 5
|AB|
|BC|
|CD|
|DA|
Yükseklik
Çevre
Alan
3. Bu adımların;
a. Hangisinde yamuksal bölgenin alan ölçüsünde bir değişim gerçekleşti, ve sizce
neden alan ölçüsü değişti?
b. Hangisinde yamuksal bölgenin alan ölçüsünde değişim olmadı, ve sizce neden
alan ölçüsü değişmedi?
4. Bu etkinlikteki verileriniz ile yamuksal bölge için bir alan bağıntısı oluşturunuz.

123
Student Worksheet 6: Area Relationship between Trapezoid and Parallelogram
Yamuksal Bölge ve Paralelkenarsal Bölgelerde Alan İlişkisi
Bu etkinlikte yamuksal bölgenin alanı ile paralelkenarsal bölgenin alanı arasındaki ilişkiyi
keşfedeceğiz.
“3.2. Yamuk ve Paralelkenar - Öğrenci.ggb” dosyasını açın.
Etkinliğe Hazırlık
1. Şekilde gördüğünüz yamuksal bölgede “a” ve “b” taban kenarları, “h” ise yüksekliktir.
Etkinlik
2. Paralelkenarsal bölgelerin alan formülü nedir?
3. “Kopyala” butonu yardımıyla yamuksal bölgemize eş bir yamuksal bölge oluşturun.
4. Oluşturduğumuz ikinci yamuksal bölgeyi “Döndür” butonu yardımıyla kendi etrafında
döndürün.
5. İkinci yamuksal bölgemizi döndürdükten sonra ilk yamuksal bölgemizle bir
paralelkenarsal bölge oluşturacak şekilde birleştirin. Bunun için ikinci yamuksal
bölgemizi fare ile taşıyınız. Paralelkenarsal bir bölge elde ettiğiniz zaman şekillerin üst
tarafında “Birleştir” butonu gözükecek ve bu buton yardımıyla şekilleri birleştiriniz.
6. Oluşan paralelkenarsal bölgenin taban kenarı uzunluğu nedir?
7. Oluşan paralelkenarsal bölgenin yüksekliği nedir?
8. Oluşan paralelkenarsal bölgenin alanını alan formülü yardımıyla ifade edin.

124
9. Bu paralelkenarsal bölgenin alanı ilk yamuksal bölgemizin alanının kaç katıdır?
10. Bu bilgiler yardımıyla yamuksal bölgenin alan bağıntısını nasıl ifade edebiliriz?

125
Student Worksheet 7: The Relationship between Area and Perimeter
Alan ve Çevre Arasındaki İlişki
Bu etkinlikte bir dikdörtgensel bölgenin alanı ve çevresi arasındaki ilişkiyi keşfetmeye
çalışacağız.
“4.1. Alan ve Çevre İlişkisi – Öğrenci.ggb” dosyasını açınız.
Etkinliğe Hazırlık
1. Bu etkinlikte ABCD dikdörtgensel bölgesi verilmiştir. Bu dikdörtgensel bölgenin alanı 36
br2 dir.
2. Bu etkinlikte verilen dikdörtgensel bölgede, “C” noktasının hareket ettirilmesi ile alan
ölçüsü değişmemektedir.
Etkinlik
3. Aşağıdaki adımları uygulayarak gerçekleşen değişimleri gözlemleyip not alınız.
a. C noktasını hareket ettirerek altı farklı konumda oluşan değerleri aşağıdaki
tabloya yazınız.
Konum 1 Konum 2 Konum 3 Konum 4 Konum 5 Konum 6
|BC| (= |DA|)
|AB| (= |CD|)
Çevre
Alan
4. Bu hareketlerde değişen veriler hangileridir?
126
5. Alan ölçüsü değişmemesine rağmen bu hareketler sonucu kenar uzunlukları
toplamında herhangi bir değişim gerçekleşti mi? Eğer gerçekleştiyse neden sizce bu
değişim gerçekleşti?
6. Bulduğunuz verilere dayanarak dikdörtgensel bölgenin alanı ve kenar uzunlukları
toplamı arasında nasıl bir ilişki vardır? Açıklayınız.
7. Alan ölçüsü sabit kalmak şartıyla verilen dikdörtgensel bölgelerde en büyük kenar
uzunlukları toplamına ve en küçük kenar uzunluklarına sahip bölgelerin kenar
uzunlukları arasında nasıl bir ilişki vardır? Açıklayınız.

127
Student Worksheet 8: The Relationship between Side Length and Area
Kenar Uzunluğu ve Alan Arasındaki İlişki
Bu etkinlikte bir dörtgensel bölgedeki kenar uzunluğu ve alan arasındaki ilişkiyi keşfetmeye
çalışacağız.
“4.2. Kenar Uzunluğu ve Alan İlişkisi – Öğrenci.ggb” dosyasını açınız.
Etkinliğe Hazırlık
1. Bu etkinlikte ABCD dikdörtgensel bölgesi verilmiştir. Bu dikdörtgensel bölgenin kenar
uzunlukları toplamı 24 br dir.
2. Bu etkinlikte verilen dikdörtgensel bölgede, “C” noktasının hareket ettirilmesi ile kenar
uzunlukları toplamı değişmemektedir.
Etkinlik
3. Aşağıdaki adımları uygulayarak gerçekleşen değişimleri gözlemleyip not alınız.
a. C noktasını hareket ettirerek altı farklı konumda oluşan değerleri aşağıdaki
tabloya yazınız.
Konum 1 Konum 2 Konum 3 Konum 4 Konum 5 Konum 6
|BC| (= |DA|)
|AB| (= |CD|)
Çevre
Alan
4. Bu hareketlerde değişen veriler hangileridir?

128
5. Kenar uzunlukları toplamı değişmemesine rağmen bu hareketler sonucu Alan
ölçüsünde herhangi bir değişim gerçekleşti mi? Eğer gerçekleştiyse neden sizce bu
değişim gerçekleşti?
6. Bulduğunuz verilere dayanarak kenar uzunlukları ve alan ölçüsü arasında nasıl bir ilişki
vardır? Açıklayınız.
7. Kenar uzunlukları toplamı sabit kalmak şartıyla verilen dikdörtgensel bölgelerde en
büyük alan ölçüsüne ve en küçük alan ölçüsüne sahip bölgelerin kenar uzunlukları
arasında nasıl bir ilişki vardır? Açıklayınız.

129
APPENDIX I
GEOGEBRA SCREEN VIEWS
Activity 1: Area of Parallelogram

130
Activity 2: The Relationship between Parallelogram and Rectangle

131
Activity 3: Area of Rhombus

132
Activity 4: Area Relationship between Rhombus and Parallelogram
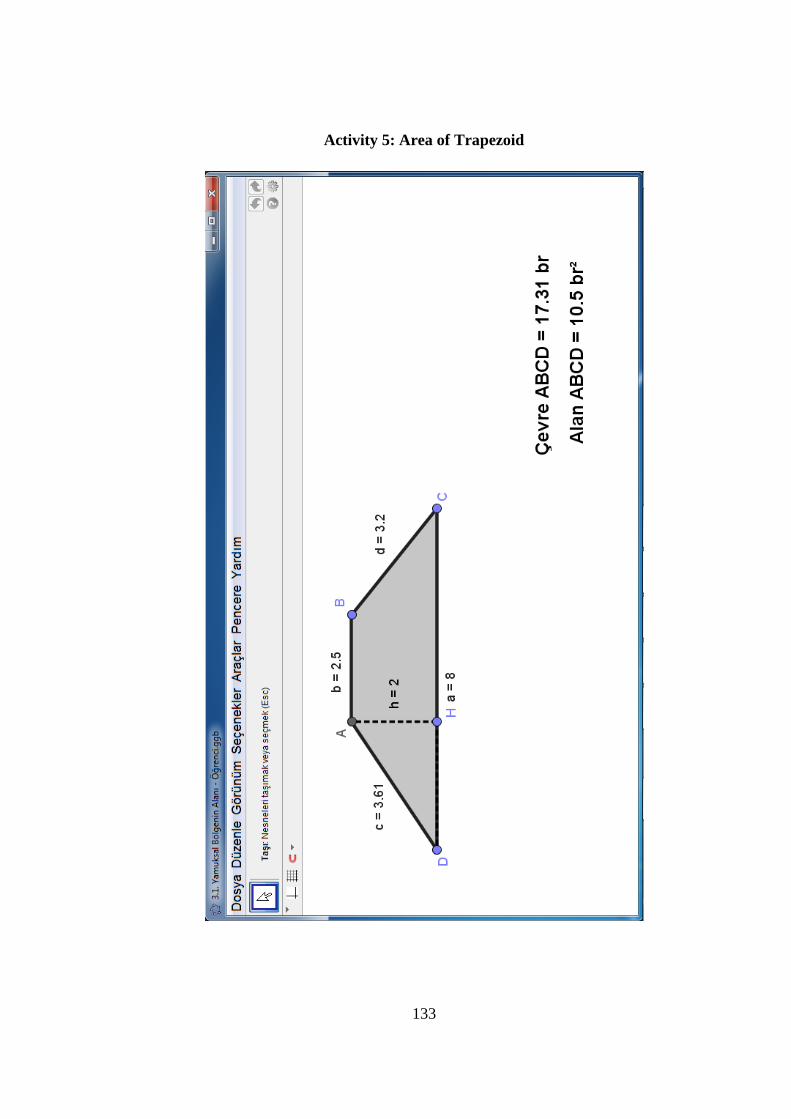
133
Activity 5: Area of Trapezoid

134
Activity 6: Area Relationship between Trapezoid and Parallelogram

135
Activity 7: The Relationship between Area and Perimeter

136
Activity 8: The Relationship between Side Length and Area

137
APPENDIX J
GEOGEBRA MANUAL
Bu ders sürecinde Matematik derslerini GeoCebir Programı ile işleyeceğiz. Bu kılavuz ders
sürecinde sizlere kolaylık sağlamak için hazırlanmıştır.
GeoCebir Programı
Grafik Alanı: Etkinlikler süresince dörtgensel bölgelerin çizimleri ve gösterimlerinin yer
alacağı bölüm.
Araç Çubuğu: Etkinliklerde “Çevre Uzunluğu”, “Alan Ölçüsü”, “Kenar Uzunluğu”, vb. ölçüleri
bulmamız istendiğinde kullanacağımız araçların yer aldığı bölüm.
1. Verilen Şeklin Kenar ya da Köşe Noktaları Hareket Ettireceğimiz Durumlar:
GeoCebir Programında verilen bir çokgenin köşe noktalarının hareket edebildiği ve hangi
yönlere hareket edebildiği belirtildiyse,
Bahsedilen noktayı fare yardımıyla seçerek (fareyi nokta üzerine getirip sol tuşa
basılı tutarak) belirtilen yöne doğru sürükleyerek, gerçekleşen değişimleri
gözlemleyebiliriz.
Grafik Alanı
Araç Çubuğu

138
Hareket ettirme işlemini tamamladıktan sonra farenin sol tuşunu bırakabilirsiniz.
Hareket ettirme işlemine başlamadan önce araç çubuğundan “Taşı” aracının seçili
olması gerekmektedir. Bu yüzden hareket ettirme işleminden önce araç
çubuğundan “Taşı” aracını seçiniz.
2. Noktaları Hareket Ettirilebilen Şekillerin Çevre, Kenar ve Alan Ölçüleri:
GeoCebir ile işlenen Matematik dersleri boyunca verilen şeklin noktalarını
sürükleyerek, konumlarını değiştirdikten sonra Çevre, Kenar ve Alan ölçülerindeki
değişimleri gözlemleyerek sizlere dağıtılan çalışma kağıtlarında ilgili tablolara
yazmanız istenecektir.

139
Yukarıdaki şekilde Kenar, Çevre ve Alan ölçülerindeki değişimleri
gözlemeyebileceğiz alanlar gösterilmiştir.
3. Kenar Uzunluğu ve Çevre Uzunluğu Ölçme:
Araç Çubuğunda yer alan “Uzaklık veya Uzunluk” aracını kullanarak verilen çokgenin
kenar ve çevre uzunluğunu ölçebiliriz.
Alan ve Çevre
Değerleri Kenar Uzunlukları

140
Çokgenin bir kenarının uzunluğunu ölçmek için “Uzaklık veya Uzunluk” aracı
seçildikten sonra ölçülmek istenen kenar fare ile seçilir.
Çokgenin kenar uzunluklarının toplamını ölçmek için ise “Uzaklık veya Uzunluk”
aracı seçildikten sonra çokgenin iç bölgesi fare ile seçilir.
6
BC Kenarının Uzunluğunu
öğrenmek için, Fare ile BC kenarı
seçilir.
Çevre (ABC) = 14
Kenar uzunluklarının
toplamını ölçmek için
çokgenin iç bölgesi
seçilir.

141
4. Alanı Ölçme:
Araç çubuğunda yer alan “Alan” aracını kullanarak verilen çokgenin alanını
ölçebiliriz.
Çokgenin alanını ölçmek için “Alan” aracı seçildikten sonra çokgenin iç bölgesi fare
ile seçilir.
Alan (ABC) = 8
Çokgenin alanını
ölçmek için
çokgenin iç bölgesi
seçilir.

142
5. Ölçülen Değerleri Boş Alanlara Taşıma:
Araç çubuğunda yer alan “Taşı” aracını kullanarak ölçülen değerlerin yer
aldığı yazıları boş alanlara taşıyabiliriz.
Alan (ABC) = 8 Alan (ABC) = 8

143
APPENDIX K
TEZ FOTOKOPİSİ İZİN FORMU
ENSTİTÜ
Fen Bilimleri Enstitüsü
Sosyal Bilimler Enstitüsü
Uygulamalı Matematik Enstitüsü
Enformatik Enstitüsü
Deniz Bilimleri Enstitüsü
YAZARIN
Soyadı : ÖZÇAKIR Adı : Bilal Bölümü : İlköğretim Fen ve Matematik Eğitimi
TEZİN ADI : The Effects of Mathematics Instruction Supported by Dynamic Geometry Activities on Seventh Grade Students’ Achievement in Area of Quadrilaterals
TEZİN TÜRÜ : Yüksek Lisans Doktora
1. Tezimin tamamından kaynak gösterilmek şartıyla fotokopi alınabilir.
2. Tezimin içindekiler sayfası, özet, indeks sayfalarından ve/veya bir
bölümünden kaynak gösterilmek şartıyla fotokopi alınabilir.
3. Tezimden bir (1) yıl süreyle fotokopi alınamaz.
TEZİN KÜTÜPHANEYE TESLİM TARİHİ: