the effects of daily ration on growth and smoltification ... ration paper... · surviving umg fish...
TRANSCRIPT

1
The effects of daily ration on growth and smoltification in 0+ and 1+
Atlantic salmon (Salmo salar) parr.
Berrill, I. K. a *, Porter, M. J. R. b and Bromage, N. R. a
a Institute of Aquaculture, University of Stirling, Scotland, FK9 4LA. b School of Aquaculture, University of Tasmania, Launceston, 7250, Tasmania,
Australia.
* Corresponding author. Current address: School of Ocean Sciences, University of
Wales, Bangor, Menai Bridge, Anglesey, LL59 5AB. UK. Tel.: +44 1248 351151
Fax: +44 1248 716367. E-mail: [email protected]

2
Abstract
The effects of long-term variations in feed ration were studied during two
experiments on Atlantic salmon parr. In the first experiment, three duplicate groups of
approximately 500 salmon parr were fed at rates of 100%, 66% or 33% of the
manufacturer’s recommendation from shortly after first feeding. Each group were
exposed to a photoperiod regime which was expected to result in smoltification 9
months after first feeding. In the second experiment, three duplicate groups of 550
fish were fed 100%, 66% or 33% of the manufacturer’s recommendation from first
feeding and exposed to a simulated natural photoperiod, which was expected to result
in smoltification 13 months after first feeding.
In both experiments fish size increased with ration, with recruitment to the upper
modal group (UMG) of the population also related to ration (85-96%, 64-88% and 28-
42% UMG fish for the full, two-thirds and one-third ration groups respectively,
recorded at the conclusion of each experiment). Throughout each experiment the full
and two-thirds ration fish maintained similar whole body lipid concentrations,
although lipid concentrations in the one-third ration fish were generally lower. At the
conclusion of experiment 1, gill Na+, K+-ATPase activity in UMG fish fed full rations
reached 9.5 µmol ADP hydrolysed. mg-1. protein-1. h-1, whereas ATPase activities
were lower in the other ration groups. In experiment 2, all groups had similar gill Na+,
K+,-ATPase activities at the conclusion of the experiment (6.4-9.3 µmol ADP
hydrolysed. mg-1. protein-1. h-1). Following 24h seawater challenges, conducted
during the parr-smolt transformation, UMG fish from the full and two-thirds groups
of experiment 1 displayed high survival rates (100%) and low serum osmolalities
(335 mOsm.kg-1), with lower survival rates (75%) and higher serum osmolalities (370
3
mOsm.kg-1) recorded in the one-third ration fish. In experiment 2 similar survival
rates (100%) and serum osmolalities (350 mOsm.kg-1) were found in all ration
groups.
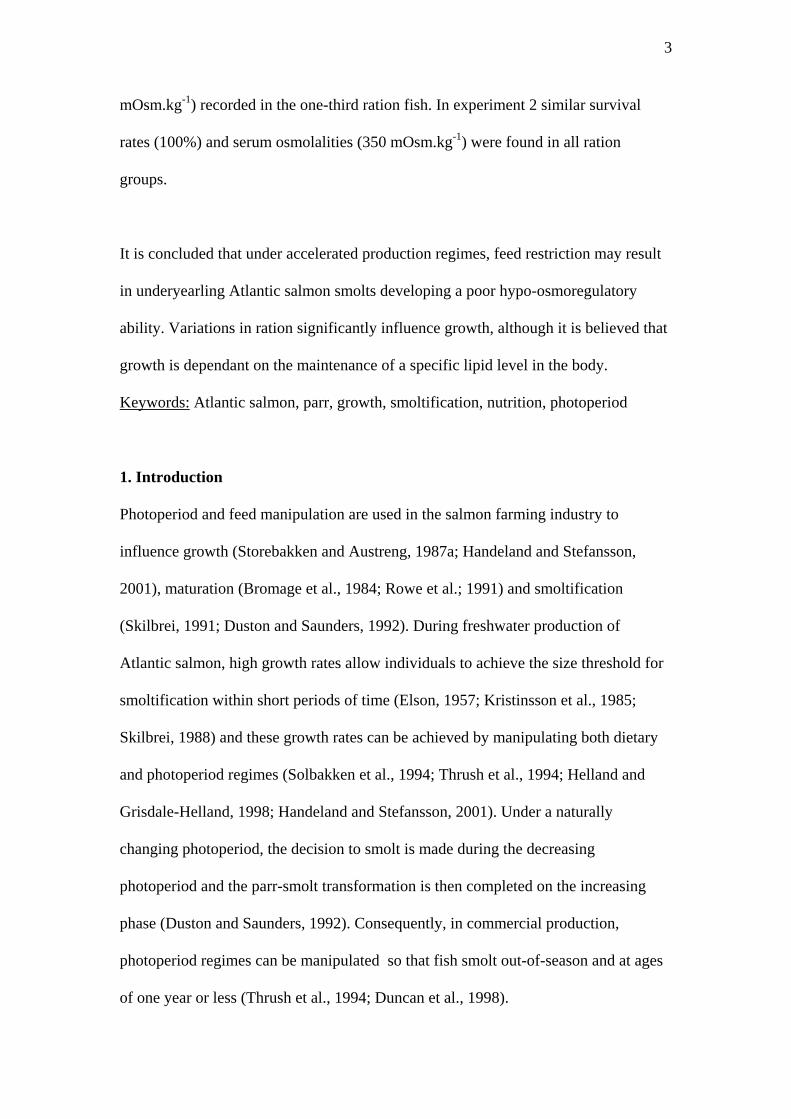
It is concluded that under accelerated production regimes, feed restriction may result
in underyearling Atlantic salmon smolts developing a poor hypo-osmoregulatory
ability. Variations in ration significantly influence growth, although it is believed that
growth is dependant on the maintenance of a specific lipid level in the body.
Keywords: Atlantic salmon, parr, growth, smoltification, nutrition, photoperiod
1. Introduction
Photoperiod and feed manipulation are used in the salmon farming industry to
influence growth (Storebakken and Austreng, 1987a; Handeland and Stefansson,
2001), maturation (Bromage et al., 1984; Rowe et al.; 1991) and smoltification
(Skilbrei, 1991; Duston and Saunders, 1992). During freshwater production of
Atlantic salmon, high growth rates allow individuals to achieve the size threshold for
smoltification within short periods of time (Elson, 1957; Kristinsson et al., 1985;
Skilbrei, 1988) and these growth rates can be achieved by manipulating both dietary
and photoperiod regimes (Solbakken et al., 1994; Thrush et al., 1994; Helland and
Grisdale-Helland, 1998; Handeland and Stefansson, 2001). Under a naturally
changing photoperiod, the decision to smolt is made during the decreasing
photoperiod and the parr-smolt transformation is then completed on the increasing
phase (Duston and Saunders, 1992). Consequently, in commercial production,
photoperiod regimes can be manipulated so that fish smolt out-of-season and at ages
of one year or less (Thrush et al., 1994; Duncan et al., 1998).

4
Increases in feed ration enhance growth (Reinitz, 1983; Storebakken and Austreng,
1987a; Silverstein et al., 1998) as well as increasing lipid deposition (Reinitz, 1983;
Johansson et al., 1995; Hillestad et al., 1998). Smoltification results in a reduction in
body lipid (Saunders and Henderson, 1978; Woo et al., 1978; Rowe et al., 1991), and
a nutritional threshold may influence which individuals can successfully undergo the
parr-smolt transformation (Thorpe, 1986; Shearer, 1994). However, although the
effects of growth on smoltification are well documented (Kristinsson et al., 1985;
Skilbrei, 1988), the direct effects of feed ration are poorly understood and previous
studies have focused on the effects of ration during the parr-smolt transformation
rather than during the preceding year (c.f. Dickhoff et al., 1989; Larsen et al., 2001).
Consequently, the current study aimed to test the hypothesis that daily feed rations
applied throughout freshwater development do not influence smoltification in Atlantic
salmon. In order to investigate this and to identify possible mechanisms linking feed
ration, growth and smoltification, groups of salmon were fed one of three daily rations
from early development onwards. Furthermore, these groups were also exposed to one
of two commercially important photoperiod regimes, which resulted in different
growth rates and yearly timings of smoltification.
2. Materials and methods
2.1. Fish stock and rearing conditions: Atlantic salmon (Salmo salar) of a Scottish
stock were maintained at the Niall Bromage Freshwater Research Facility, Scotland
(56°N) under ambient water temperatures, except during early development when
water temperatures were artificially elevated (Fig. 1). Water flow rates were

5
approximately 1 l.s-1, oxygen concentrations were >8mg.l-1 and fish were fed
commercial feed (EWOS Micro; EWOS Ltd., Scotland, UK), supplied throughout the
light phase of the photoperiod using automatic feeders. The daily feed ration for each
tank of fish was re-calculated at two week intervals. Daily feed rates were based on
feed tables recommended by the manufacturer and were calculated from fish weights
taken at the sampling points or by batch weighing. In order to minimise the
development of feeding hierarchies and inter-individual size differences in the groups,
feed was supplied continuously throughout the light phase of the photoperiod and
water flow rates were adjusted to improve the dispersal of food in the tank.
Experiment 1: The fish in this experiment were destined to become 0+ smolts and to
aid their development in less than 1 year the eggs were fertilised at the beginning of
the spawning season. First feeding occurred on 10th March 2001 and from that point
approximately 2500 fish were reared in each of two, 2m square tanks. Due to
hatchery constraints, experimental feed regimes could not be applied from first
feeding and the fish were fed at the manufacturers’ recommended rate. On 29th May,
500 fish were placed into each of six, 1m square tanks. Duplicate groups were then
fed at 100%, 66% or 33% of the daily ration recommended by the feed manufacturer
until the conclusion of the experiment in mid December. All groups were exposed to
LD24:0 from first feeding until mid August, when they were exposed to an 8 week
period of short days (LD7:17) (Fig. 1). In mid October all groups were returned to
LD24:0 and held for a further 8 weeks, after which the experiment was terminated.
Experiment 2: The fish in this experiment were destined to become 1+ smolts and
consequently they developed from eggs that were fertilised during the middle of the

6
spawning season. First feeding occurred on 22nd April 2001 and from that point 2500
fish were placed into each of three, 1m square tanks. From first feeding each group
was fed at 100%, 66% or 33% of the daily ration recommended by the feed
manufacturer. In late June, 550 fish from each treatment were placed into each of two,
1m square tanks. Fish were maintained on their originally designated rations until the
conclusion of the experiment in mid May. All groups were exposed to LD24:0 until
late June after which they were exposed to a simulated natural photoperiod (Fig. 1).
2.2. Sampling regime: Batch weighings of each treatment group were taken at
monthly intervals from first feeding until mid May and late June in experiments 1 and
2 respectively. Subsequently, 50 individual fork length (±1mm) and weight (±0.1g)
measurements were taken per tank at either two week (experiment 1) or monthly
(experiment 2) intervals. At each sample point, 6 samples per tank were taken for
analysis of whole body lipid concentration, using the Soxhlet extraction method.
Individual fish were typically used for each sample, although in some cases fish had
to be pooled to gain the necessary tissue weight for analysis. Fish taken for whole
body fat determination were dried to a constant mass at 100oC and then homogenised
prior to analysis. The lipid was then extracted using petroleum ether (Fisher
Scientific; Loughborough, UK). Due to the high number of samples taken, each
sample extraction was not replicated, with the six samples taken for each tank used to
gain an appropriate tank mean.
Gill samples were taken for the determination of Na+, K+-ATPase using the method
detailed by McCormick (1993). In experiment 1, gill samples were taken in mid
September and at two week intervals from mid October until the conclusion of the

7
experiment. In experiment 2, an initial sample was made in mid February and then at
two week intervals from mid March until the conclusion of the experiment. At each
sample point 10 randomly selected individuals were removed from the population.
Gill samples were then taken from all of the upper modal group (UMG) fish in the
sub-sample. UMG fish were determined based on their size relative to other fish in
their tank as well as the presence of body silvering. Gill Na+, K+-ATPase activities
were determined for individual fish and tank means were then derived from these
values.
At two week intervals from late September (experiment 1) and mid February
(experiment 2) 15 randomly selected individuals per treatment were given a
standardised seawater challenge similar to that outlined by Clarke and Blackburn
(1977; 1978). Although the effects of the seawater challenge were only to be
investigated in UMG fish, a random selection of fish from each treatment were tested
in order to avoid the population structures of the experimental groups being affected.
The test was conducted for 24h in 50l of 10oC aerated seawater (35‰), made using
artificial sea salt (Instant Ocean; Animal House, Batley, UK). Following the
challenge, all fish were removed and the numbers of surviving UMG fish counted. All
surviving UMG fish were culled and blood was removed from the caudal vein and
centrifuged at 2500rpm for 15 min. at 4oC. Serum was removed and stored at -80oC
until analysis, when osmolality was determined using a freezing point depression
osmometer (Advanced Instruments Inc.; Massachusetts, USA). Due to constraints of
space, individuals from both treatment replicates were challenged in the same tank
and consequently, for analytical purposes, individual fish constitute the statistical
unit.

8
At the final sample point of each experiment the remaining fish were culled, with the
numbers of upper (UMG) and lower (LMG) modal group fish recorded based on size
(experiment 1: UMG fish>140mm, experiment 2: UMG fish>110mm) and the
presence of body silvering.
2.3. Calculations and statistical analysis: Condition factor (CF) was calculated as:
weight (g).fork length (cm)-3.100. Data were analysed using Minitab v14. Changes in
weight, condition factor, whole body lipid concentration, gill Na+, K+-ATPase, serum
osmolality and population structure were compared using a General Linear Model.
Tank means were was used as the statistical unit except for serum osmolality data,
where space constraints led to individuals being used as the statistical unit. To analyse
the seawater survival data, 95% confidence intervals were calculated (Fowler and
Cohen, 1987) and compared such that if the confidence intervals did not over lap the
proportions were considered significantly different (P<0.05). To improve statistical
analysis, natural log transformations were used for the weight data with arcsine
transformations used for the whole body lipid concentration and population structure
data. Residual plots were used to confirm normality and homogeneity of variance. A
significance level of 5% was applied to the statistical tests (Zar, 1999).
3. Results
3.1. Growth:
Fish in all groups increased in weight over time (P<0.001) (Fig. 2). In experiment 1,
fish in the full and two-thirds ration groups were heavier than those in the one-third
ration group (P<0.05) from late June onwards (Fig. 2a) and the fish fed full rations

9
were heavier than those given two-thirds rations from late July (P<0.05). In
experiment 2, the full and two-thirds ration fish were heavier than the one-third ration
fish from late July (P<0.001) and the full ration fish were heavier than the two-thirds
ration fish from mid August (P<0.001) (Fig. 2b).
In experiment 1, the CF of fish from the full and two-thirds ration groups increased
from early June to peak levels in early and late September respectively (P<0.01) (Fig.
3a). The CF of both groups then declined (P<0.001). For fish in the one-third ration
group, CF declined over time (P<0.001). The full and two-thirds ration fish had
similar CF’s at each of the sample points throughout the experiment and their CF’s
were significantly higher than those in the one-third ration group from early July
onwards (P<0.05).
In experiment 2, the CF of all groups initially increased (P<0.001) and then declined
with the passage of time (Fig. 3b) (P<0.001). At each sampling point the full and two-
thirds ration fish had CF’s that were similar to each other. The CF’s of the one-thirds
ration fish were similar to those of the full and/or the two-thirds ration fish during the
majority of the experiment, with the exceptions of late July, early September, early
October and early April (P<0.05).
3.2. Percentage whole body lipid:
In experiment 1, the percentage body lipid of fish from the full and two-third ration
groups increased from early June to peak levels (P<0.001) in late September and early
October respectively (Fig. 4a). Percentage body lipid in the one-third ration fish
increased less dramatically (P<0.01) and peaked in late October. Percentage body

10
lipid in all groups then decreased during the latter stages of the experiment (P<0.05).
At each sample point throughout the experiment the full and two-thirds ration fish had
similar percentage body lipids, although the lipid concentration of the one-third ration
fish was lower from early July onwards (P<0.01), with the exceptions of late July,
mid August and late October.
In experiment 2, relative lipid content reached a peak in all groups in early October
(P<0.001) and subsequently declined (P<0.001) (Fig. 4b). At each time point
throughout the experiment, the full and two-thirds ration fish had similar lipid
concentrations. The full ration fish had higher percentage lipid than the one-third
ration fish at each time point from late July until early January and then from early
April until the conclusion of the experiment (P<0.05) with that of the two-thirds
ration fish higher between late July and early November (P<0.01).
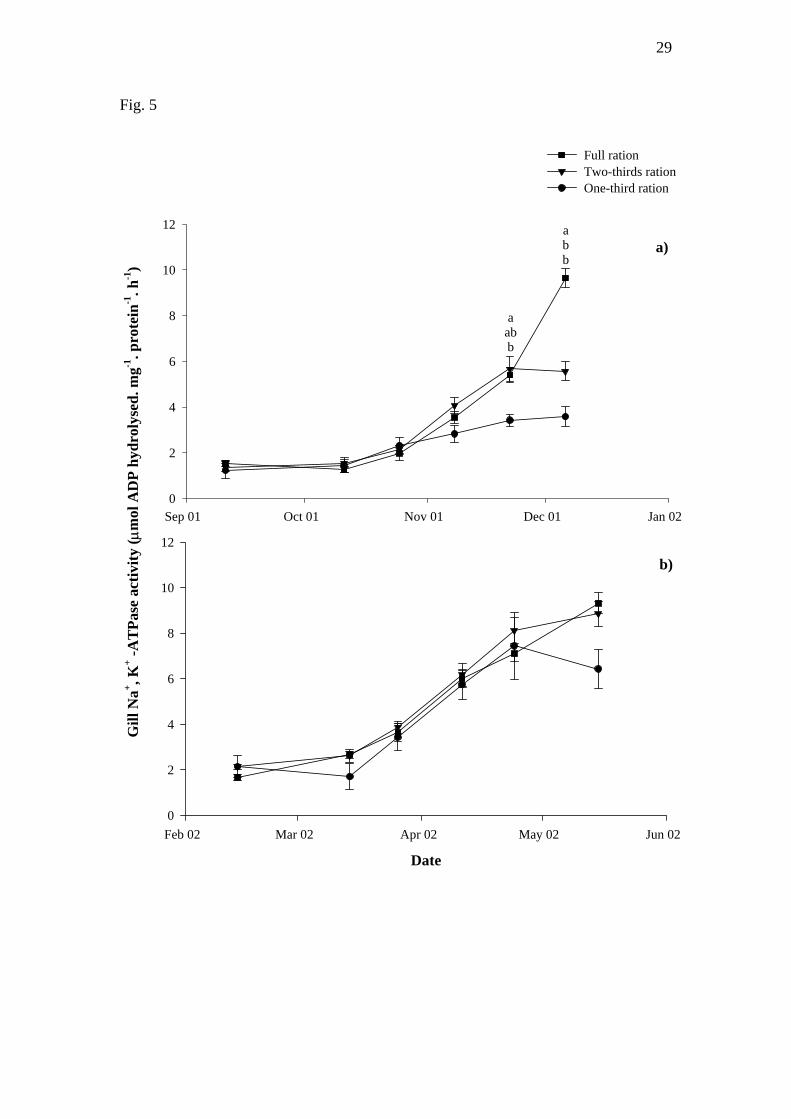
3.3 Gill Na+, K+ -ATPase activity:
The gill Na+, K+-ATPase activity of upper modal group fish from all groups increased
during the respective sampling periods of each experiment (P<0.05) (Fig. 5). In
experiment 1, all groups initially had similar gill Na+, K+-ATPase activities at the
respective sample points (Fig. 5a). Then in late November gill Na+, K+ -ATPase
activity in the two-thirds ration fish became higher than in the one-third ration fish
(P<0.05) and at the conclusion of the experiment the gill Na+, K+ -ATPase activity of
the full ration fish was higher than both the two- and one-third ration fish (P<0.001).
In experiment 1, at each sampling point during the experiment, all groups had similar
gill Na+, K+-ATPase activities (Fig. 5b).

11
3.4 Seawater survival and serum osmolality:
In experiment 1, the seawater survival of UMG fish increased in all groups over the
course of the sampling period (P<0.05) (Fig. 6a). Survival reached 100% in the full
and two-thirds ration fish in mid and late October respectively, with the survival of
the one-third ration fish reaching a maximum of 75% in late November. With the
exception of mid October, the survival of the full and two-thirds ration UMG fish
remained similar at each respective sample point, whereas survival in the one-third
ration group was lower at all time points (P<0.05) except in mid and late November.
In experiment 2, survival reached 100% in mid March for the full and two-thirds
ration fish and in late March for the one-third ration group (Fig. 6b). From late March
onwards survival rates were similar in all groups.
In experiment 1, serum osmolality decreased in all groups over the course of the
experiment (P<0.001) reaching a minimum in late November (Fig. 6a). Serum
osmolality then increased in all groups although this rise was not significant. Serum
osmolality was typically similar at each sampling point for the full and two-thirds
ration UMG fish, with levels in the one-third ration fish generally higher (P<0.05). In
experiment 2, serum osmolality declined in all treatments over the experiment
(P<0.05) (Fig. 6b) and osmolality was generally the same in all treatments at each
time point.
3.5. UMG/LMG ratio:
In both experiments, the proportion of UMG fish present at the conclusion of the
experiment (Fig. 7) increased with ration. UMG fish predominated in the full and
two-thirds ration groups of both experiments (P<0.05). For the one-third ration

12
groups, in experiment 1 there were similar percentages of UMG and LMG fish,
whereas in experiment 2, LMG fish predominated.
4. Discussion
The present study has shown that variations in daily feed ration throughout freshwater
development can influence smoltification in Atlantic salmon parr and that the effects
of ration are also influenced by the photoperiod production regime used in fresh
water.
In the current study ration was found to influence the growth of fish as well as affect
the incidence of fish entering the upper modal group of the population, and
consequently the number of individuals choosing to undergo smoltification. In both
experiments growth was correlated with ration, with groups fed the respective rations
rapidly diverging in weight, and indeed similar findings are well documented
(Storebakken and Austreng, 1987a, Stead et al., 1996; Shearer et al., 1997).
Furthermore, in both experiments the incidence of UMG fish was higher in the high
ration groups. With a size threshold believed to influence smoltification (Elson, 1957;
Kristinsson et al., 1985; Skilbrei, 1988) it is likely that the differential growth of
individuals within the respective ration treatments directly affected the number of
individuals attaining the size threshold for entry into the UMG and hence the number
of smolting individuals.
The current study lends support that lipid accumulation is influenced by ration
(Reinitz, 1983; Storebakken and Austreng, 1987a; Silverstein et al., 1998) and the
suggestion that a lipostatic mechanism influences growth in salmon (Silverstein et al.,

13
1997; Jobling and Johansen, 1999; Johansen et al., 2001) has been discussed
previously in relation to the 1+ fish (see Berrill et al., 2004). In both experiments, the
full and two-thirds ration fish maintained similar lipid contents, whilst exhibiting
distinct differences in size, which suggests that growth is dependent on the
maintenance of a certain lipid level. However, although the lipid concentration of the
one-third ration fish from experiment 1 was generally lower than for fish from the
other ration groups, in experiment 2 concentrations were only lower until December.
Clearly in experiment 1 the one-third ration fish were not able to reach the required
lipid level regulated by the lipostatic mechanism, despite large reductions in body
size, but for the fish in experiment 2 it seems that this was possible from December
onwards. It is difficult to conclude with certainty why this difference has occurred,
but it may be that differences in experiment duration, rearing temperature or
photoperiod may have been influential.
Previously, reductions in condition have been used as an indicator of smoltification
(Solbakken et al., 1994; Duncan and Bromage, 1998). In both experiments, the
condition of the full and two-thirds ration fish decreased during the parr-smolt
transformation and in both ration groups a high incidence of smoltification was found.
However, reductions in condition were also observed in the one-third ration fish and
in particular in those from experiment 1, where their condition profile was similar to
the full and two-thirds ration fish. In the one-third ration groups smoltification rates
(i.e. UMG fish) and smolt status (based on gill Na+, K+-ATPase and serum
osmolality) were low but it seems likely the individuals had been influenced to some
degree by the stimulatory winter photoperiod, which resulted in a decline in
condition. This implies that the size or nutritional threshold for smoltification (Elson,

14
1957; Skilbrei, 1988; Shearer, 1994) may be low, or rather that such thresholds may
be more a measure of those fish that will complete the parr-smolt transformation as
opposed to those which could display a reduction in condition as a result of the
smoltification stimuli. However, given that condition factor has been shown to be
correlated with lipid content (Herbinger and Friars, 1991), it is also possible that
combined with a reduction linked to smoltification (Komourdjian et al, 1976;
Saunders and Henderson, 1978), condition may have decreased as a result of a
reduction in fat content that, in particular for the experiment 2 fish, could have
resulted from low rates of feed intake during winter (Metcalfe and Thorpe, 1992).
Consequently, for experiments that consider a range of photoperiod manipulations, it
may not be appropriate to use condition as an accurate measure of smoltification.
In both experiments upper modal group full ration fish, as well as two-thirds ration
fish from experiment 2, achieved gill Na+, K+-ATPase activities that are indicative of
smoltification (Handeland and Stefansson, 2001). However, there were clear
differences in the gill Na+, K+-ATPase activities recorded in the two experiments. At
the conclusion of experiment 1 the ATPase activities of the two- and one-third ration
UMG fish were lower than in the full ration fish, whereas in experiment 2 all groups
maintained similar enzyme activities. Furthermore, following seawater exposure,
survival rates in the UMG one-third ration fish from experiment 1 were lower than the
other ration groups, with serum osmolality found to be higher in these fish. In
experiment 2 both survival and serum osmolality following seawater challenge were
similar in all groups. This all implies that the development of hypo-osmoregulatory
ability in UMG fish from experiment 1 was lower in the feed restricted groups
compared to the full ration fish. It therefore seems that the accelerated production

15
regime used restricted the development of hypo-osmoregulatory ability in some way.
Furthermore, in experiment 1, the serum osmolality of all groups increased slightly at
the conclusion of the experiment. Although this increase was not significant, it may
imply that under the accelerated production regime of experiment 1, the UMG fish
passed through the window when smoltification is possible more rapidly than in the
production regime used in experiment 2.
It is difficult to find reasoning for the differences in hypo-osmoregulatory ability
between the UMG fish from experiments 1 and 2. However, the observed differences
in lipid concentration may provide some insight into this finding. The lipid content of
UMG fish from experiment 1 decreased less significantly than in those from
experiment 2 during their respective spring photoperiods. Similarly Nordgarden et al.
(2002) did not observe a change in the levels of muscle or body lipid during
smoltification in 0+ Atlantic salmon smolts, although for smolts produced under a
natural photoperiod reductions in muscle, liver and visceral fat are well documented
during smoltification (Woo et al.; 1978; Helland and Grisdale-Helland, 1998).
Therefore it may be that accelerated production regimes do not allow individuals to
mobilise long-term lipid reserves to aid the development of hypo-osmoregulatory
mechanisms, favouring short-term stores such as the liver, which is known to increase
in weight with feed ration (Storebakken and Austreng, 1987b). Consequently if feed
is restricted in 0+ smolts, insufficient energy may be available for the development of
full hypo-osmoregulatory ability.
In summary, the effects that long–term variations in daily feed ration have on the
incidence of smoltification appear to be mediated through changes in growth.

16
However, in situations where feed is a limiting factor, the use of photoperiod
manipulation may result in hypo-osmoregulatory ability being compromised. The
mechanisms which result in the poor development of hypo-osmoregulatory ability in
feed restricted underyearling smolts are not clear, but in order to understand these
processes further it will be important to consider the role of different energy stores in
smolt development, and whether these stores are used differentially under different
production regimes.
Acknowledgements
The authors would like to thank the staff at the Niall Bromage Freshwater Research
Facility, and Allan Porter for advice on whole body lipid determination. This work
was supported by a NERC CASE award to IB and NERC ROPA and Marine Harvest
Scotland grants to NB and MP.
References
Berrill, I. K., Porter, M. J. R., Bromage, N. R., 2004. The influence of dietary lipid
inclusion and dietary ration on growth and smoltification in 1+ Atlantic salmon
(Salmo salar) parr. Aquaculture 242, 513-528.
Bromage, N.R., Elliott, J.A.K., Springate, J.R.C., Whitehead, C., 1984. The effects of
constant photoperiods on the timing of spawning in the rainbow trout.
Aquaculture 43, 213-223.
Clarke, W. C., Blackburn, J., 1977. A seawater challenge test to measure smolting of
juvenile salmon. Fish. Mar. Serv.Res. Dev. Tech. Rep. No. 705: 11pp.
Clarke, W. C., Blackburn, J., 1978. Seawater challenge tests performed on hatchery

17
stocks of chinook and coho salmon in 1977. Mar. Fish. Serv. Tech. Rep., No. 761:
19pp
Dickhoff, W.W., Mahnken, C.V.W., Zaugg, W.S., Waknitz, W.F., Bernard, M.G.,
Sullivan, C.V., 1989. Effects of temperature and feeding on smolting and seawater
survival of Atlantic salmon (Salmo salar). Aquaculture 82, 93-102.
Duncan, N.J., Bromage, N.R., 1998. The effect of different periods of constant short
day on smoltification in juvenile Atlantic salmon (Salmo salar). Aquaculture 168,
369-386.
Duncan, N.J., Auchinachie, N., Robertson, D., Murray, R., Bromage, N., 1998.
Growth, maturation and survival of out-of-season 0+ and 1+ Atlantic salmon
(Salmo salar) smolts. Aquaculture 168, 325-339.
Duston, J., Saunders, R.L., 1992. Effect of 6-, 12-, and 18-month photoperiod cycles
on smolting and sexual maturation in juvenile Atlantic salmon (Salmo salar). Can.
J. Fish. Aquat. Sci. 49, 2273-2280.
Elson, P.F., 1957. The importance of size in the change from parr to smolt in Atlantic
salmon. Can. Fish Cult. 21, 1-6.
Fowler, J., Cohen, L., 1987. Statistics for Ornithologists. British Trust for
Ornithology, Guide 22, 175pp.
Handeland, S.O., Stefansson, S.O., 2001. Photoperiod control and influence of body
size on off-season parr-smolt transformation and post-smolt growth. Aquaculture
192, 291-307.
Helland, S.J., Grisdale-Helland, B., 1998. The influence of replacing fish meal in the
18
diet with fish oil on growth, feed utilisation and body composition of Atlantic
salmon (Salmo salar) during the smoltification period. Aquaculture 162, 1-10.
Herbinger, C.M., Friars, G.W., 1991. Correlation between condition factor and total
lipid content in Atlantic salmon, Salmo salar L. parr. Aquacult. Fish. Manage. 22,
527-529.
Hillestad, M., Johnsen, F., Austreng, E., Asgard, T., 1998. Long-term effects of
dietary fat level and feeding rate on growth, feed utilisation and carcass quality of
Atlantic salmon. Aquacult. Nutn. 4, 89-97.
Jobling, M., Johansen, S.J.S., 1999. The lipostat, hyperphagia and catch-up growth.
Aquacult. Res. 30, 473-478.
Johansen, S.J.S., Ekli, M., Stangnes, B., Jobling, M., 2001. Weight gain and lipid
deposition in Atlantic salmon, Salmo salar, during compensatory growth: evidence
for lipostatic regulation? Aquacult. Res. 32, 963-974.
Johansson, L., Kiessling, A., Asgard, T., Berglund, L., 1995. Effects of ration level in
rainbow trout, Oncorhynchus mykiss (Walbaum), on sensory characteristics, lipid
content and fatty acid composition. Aquacult. Nutn. 1, 59-66.
Komourdjian, M.P., Saunders, R.L., Fenwick, J.C., 1976. Evidence for the role of
growth hormone as a part of a "light-pituitary axis" in growth and smoltification of
Atlantic salmon (Salmo salar). Can. J Zool. 56, 544-551.
Kristinsson, J.B., Saunders, R.L., Wiggs, A.J., 1985. Growth dynamics during the
development of bimodal length-frequency distribution in juvenile Atlantic salmon
(Salmo salar L.). Aquaculture 45, 1-20.

19
Larsen, D.A., Beckman, B.R., Dickhoff, W.W., 2001. The effect of low temperature
and fasting during the winter on growth and smoltification of coho salmon. N.
Am. J. Aquacult. 63, 1-10.
McCormick, S.D., 1993. Methods for nonlethal gill biopsy and measurement of Na+,
K+-ATPase activity. Can. J. Fish. Aquat. Sci. 50, 656-658.
Metcalfe, N. B., Thorpe, J. E., 1992. Anorexia and defended energy levels in over-
wintering juvenile salmon. J. Anim. Ecol. 61, 175-181.
Nordgarden, U., Hemre, G.-I., Hansen, T., 2002. Growth and body composition of
Atlantic salmon (Salmo salar L.) parr and smolt fed diets varying in protein and
lipid contents. Aquaculture 207, 65-78.
Reinitz, G., 1983. Relative effect of age, diet, and feeding rate on the body
composition of young rainbow trout (Salmo gairdneri). Aquaculture 35, 19-27.
Rowe, D.K., Thorpe, J.E., Shanks, A.M., 1991. Role of fat stores in the maturation of
male Atlantic salmon (Salmo salar) parr. Can. J. Fish. Aquat. Sci. 48, 405-413.
Saunders, R.L., Henderson, E.B., 1978. Changes in gill ATPase activity and smolt
status of Atlantic salmon (Salmo salar ). J. Fish. Res. Board. Can. 35, 1542-1546.
Shearer, K.D., 1994. Factors affecting the proximate composition of cultured fish
with emphasis on salmonids. Aquaculture 119, 63-88.
Shearer, K.D., Silverstein, J.T., Dickhoff, W.W., 1997. Control of growth and
adiposity of juvenile chinook salmon (Oncorhynchus tshawytscha). Aquaculture
157, 311-323.

20
Silverstein, J.T., Shimma, H., Ogata, H., 1997. Early maturation in Amago salmon
(Oncorhynchus masu ishikawai): An association with energy storage. Can. J. Fish.
Aquat. Sci. 54, 444-451.
Silverstein, J.T., Shearer, K.D., Dickhoff, W.W., Plisetskaya, E.M., 1998. Effects of
growth and fatness on sexual development in chinook salmon (Oncorhynchus
tshawytscha) parr. Can. J. Fish. Aquat. Sci. 55, 2376-2382.
Skilbrei, O.T., 1988. Growth pattern of pre-smolt Atlantic salmon (Salmo salar L.):
the percentile increment method (PIM) as a new method to estimate length-
dependant growth. Aquaculture 69, 129-143.
Skilbrei, O.T., 1991. Importance of threshold length and photoperiod for the
development of bimodal length-frequency distribution in Atlantic salmon (Salmo
salar). Can. J. Fish. Aquat. Sci. 48, 2163-2172.
Solbakken, V.A., Hansen, T., Stefansson, S.O., 1994. Effects of photoperiod and
temperature on growth and parr-smolt transformation in Atlantic salmon (Salmo
salar L.) and subsequent performance in seawater. Aquaculture 121, 13-27.
Stead, S.M., Houlihan, D.F., McLay, H.A., Johnstone, R., 1996. Effect of ration and
seawater transfer on food consumption and growth of Atlantic salmon (Salmo
salar) smolts. Can. J. Fish. Aquat. Sci. 53, 1030-1037.
Storebakken, T., Austreng, E., 1987a. Ration level for salmonids I. Growth, survival,
body composition, and feed conversion in Atlantic salmon fry and fingerlings.
Aquaculture 60, 189-206.
Storebakken, T., Austreng, E., 1987b. Ration level for salmonids II. Growth, feed

21
intake, protein digestibility, body composition, and feed conversion in rainbow
trout weighing 0.5-1.0kg. Aquaculture 60, 207-221.
Thorpe, J.E., 1986. Age at first maturity in Atlantic salmon, Salmo salar: Freshwater
period influences and conflicts with smolting. In: Meerburg, D.J., (Ed.) Salmonid
Age at Maturity. Canadian Special Publication of Fisheries and Aquatic Science.,
pp. 7-14.
Thrush, M.A., Duncan, N.J., Bromage, N.R., 1994. The use of photoperiod in the
production of out-of-season Atlantic salmon (Salmo salar) smolts. Aquaculture
121, 29-44.
Woo, N.Y.S., Bern, H.A., Nishioka, R.S., 1978. Changes in body composition
associated with smoltification and premature transfer to seawater in coho salmon
(Oncorhynchus kisutch) and king salmon (O. tshawytscha). J. Fish Biol. 13, 421-
428.
Zar, J.H., 1999. Biostatistical Analysis. 4th Ed., Prentice Hall, New Jersey. 662pp.
Fig. 1. Water temperatures and photoperiod regimes experienced by Atlantic salmon
parr reared using either a 0+ (a) or 1+ (b) photoperiod regime. Between ‘x’ and ‘y’

22
water temperatures were elevated above ambient.
Fig. 2. Changes in weight of Atlantic salmon parr fed different daily rations from
early development and reared using either a 0+ (a) or 1+ (b) photoperiod regime
(mean ± S.E.M., n=2). Figure legends denote the daily rations experienced in the
respective experiments. The 0+ photoperiod regime has been shown to aid
interpretation. Different lettering denotes statistical differences (P<0.05). Where
lettering has been stacked it is displayed in the same order as the graph lines.
Fig. 3. Changes in condition factor of Atlantic salmon parr fed different daily rations
from early development and reared using either a 0+ (a) or 1+ (b) photoperiod regime
(mean ± S.E.M., n=2). Figure legends denote the daily rations experienced in the
respective experiments. The 0+ photoperiod regime has been shown to aid
interpretation. Different lettering denotes statistical differences (P<0.05). Where
lettering has been stacked it is displayed in the same order as the graph lines.
Fig. 4. Changes in the whole body lipid concentration of Atlantic salmon parr fed
different daily rations from early development and reared using either a 0+ (a) or 1+
(b) photoperiod regime (mean ± S.E.M., n=2). Figure legends denote the daily rations
experienced in the respective experiments. The 0+ photoperiod regime has been
shown to aid interpretation. Different lettering denotes statistical differences
(P<0.05). Where lettering has been stacked it is displayed in the same order as the
graph lines.

23
Fig. 5. Changes in the gill Na+, K+-ATPase activity of upper modal group juvenile
Atlantic salmon fed different daily rations from early development and reared using
either a 0+ (a) or 1+ (b) photoperiod regime (mean ± S.E.M., n=2). Figure legends
denote the daily rations experienced in the respective experiments. Different lettering
denotes statistical differences (P<0.05). Where lettering has been stacked it is
displayed in the same order as the graph lines.
Fig. 6 Changes in the serum osmolality and survival of seawater challenged (35‰ for
24h) upper modal group juvenile Atlantic salmon that were fed different daily rations
from early development and reared using either a 0+ (a) or 1+ (b) photoperiod regime
(mean ± S.E.M., n=1-15). Figure legends denote the daily rations experienced in the
respective experiments. Closed, black symbols relate to changes in serum osmolality,
Open, grey symbols relate to changes in survival. Different lettering denotes
statistical differences (P<0.05). Where lettering has been stacked it is displayed in the
same order as the graph lines.
Fig. 7 The structure of Atlantic salmon parr populations recorded at the conclusion of
experiments in which groups were fed different daily rations from early development
and reared using either a 0+ (a) or 1+ (b) photoperiod regime. Figure legends denote
the daily rations experienced in the respective experiments. Closed bars denote the
length-frequency structure of a population sample (n=100), open bars denote the
percentage of upper (UMG) and lower (LMG) modal group fish from the entire
population (mean ± S.E.M., n=2). Differences in lettering denotes statistical
differences (P<0.05). Capital lettering denotes between treatment differences in either
UM or LM groups, lower case lettering denotes within treatment differences between

24
UM and LM groups.

25
Fig. 1
Date
Mar 01 May 01 Jul 01 Sep 01 Nov 01 Jan 02 Mar 02 May 02 Jul 02
Tem
pera
ture
(o C)
0
2
4
6
8
10
12
14
16
x
y
Day
leng
th (h
. day
-1)
06 08 10 12 14 16 18 20 22 0024
68
1012141618202224
Rationsapplied
Rationsapplied/
first feeding
Experimentterminated
Experimentterminated
Firstfeeding
a)
b)

26
Fig. 2 W
eigh
t (g) 0
10
20
30
40
50
60
70
Rationsapplied
Date
Mar 01 May 01 Jul 01 Sep 01 Nov 01 Jan 02 Mar 02 May 02 Jul 02 0
10
20
30
40
50
60
70
Full rationTwo-thirds rationOne-third ration
a)
b)
Rationsapplied a
ab
abc
abc
aa a
a aa
aa
bb b
b bb
bb
c c c c c c cc
aab
aab
abc
a
aa a
a
a
aa
b
b
bb b
b bb
c cc c c c c c
Photoperiodregime
LD24:0
LD7:17
LD24:0

27
Fig. 3 C
ondi
tion
fact
or
0.9
1.0
1.1
1.2
1.3
1.4
Rationsapplied
Date
May 01 Jul 01 Sep 01 Nov 01 Jan 02 Mar 02 May 02 Jul 02 0.9
1.0
1.1
1.2
1.3
1.4
Full rationTwo-thirds rationOne-third ration
a)
b)
aab
aabb
aab
aab
aab
aab
aab a
ab
aab
aaa
aab
aabb
b
b
abb
Photoperiodregime
LD24:0
LD7:17
LD24:0
aab

28
Fig. 4 W
hole
bod
y lip
id c
onen
trat
ion
(% w
et w
eigh
t)
0
2
4
6
8
10
12
Rationsapplied
Date
Mar 01 May 01 Jul 01 Sep 01 Nov 01 Jan 02 Mar 02 May 02 Jul 02 0
2
4
6
8
10
12
Full rationTwo-thirds rationOne-third ration
a)
b)
Rationsapplied
a
a
b
a
a
b
a
a
b
a
a
b
a
a
b
a
ab
b
aab
a
ab
b
b
aa
aab
aab
aa
aa
aa a
abaa a
aaa
bb b
b
bb
b
b b b
Photoperiodregime
LD24:0
LD7:17
LD24:0
aa
b
29
Fig. 5
Sep 01 Oct 01 Nov 01 Dec 01 Jan 02
Gill
Na+ , K
+ -AT
Pase
act
ivity
( µm
ol A
DP
hydr
olys
ed. m
g-1. p
rote
in-1
. h-1
)
0
2
4
6
8
10
12
Date
Feb 02 Mar 02 Apr 02 May 02 Jun 02 0
2
4
6
8
10
12
Full rationTwo-thirds rationOne-third ration
a)
b)
aabb
abb

30
Fig. 6
a)
Sep 01 Oct 01 Nov 01 Dec 01 Jan 02
Seru
m o
smol
ality
(mO
sm.K
g-1)
300
350
400
450
500
Surv
ival
(%)0
20
40
60
80
100
Full rationTwo-thirds rationOne-third ration
b)
Date
Feb 02 Mar 02 Apr 02 May 02 Jun 02 300
350
400
450
500
0
20
40
60
80
100
aa
b
a
b
c
aa
b
aa
b
bb
a
a
aa
a
b
c
a
b
bb ab
a
b
b
a
ab

31
Fig. 7
0
20
40
60
80
100
0
20
40
60
80
100
Length (mm)
50 70 90 110 130 150 170 190 210 2300
20
40
60
80
100
Aa
Ab
Aa
Ab
Ba
Ba
a)
Fullration
0
20
40
60
80
100
Two-thirdsration
0
20
40
60
80
100
One-thirdration
Length (mm)
50 70 90 110 130 150 170 190 210 2300
20
40
60
80
100
Freq
uenc
y (%
)
Aa
Ab
Ba
Ab
Bb
Ca
b)
Fullration
Two-thirdsration
One-thirdration
Freq
uenc
y (%
)