the effect of shear walls positions and dimensions
TRANSCRIPT

International Journal of Scientific Engineering and Research (IJSER) ISSN (Online): 2347-3878
Impact Factor (2018): 5.426
Volume 7 Issue 2, February 2019
www.ijser.in Licensed Under Creative Commons Attribution CC BY
The Effect of Shear Walls Positions and Dimensions
Variation on the Analysis of Multi-Story Building
Youssef I. Agag1, Mohamed E. El Madawy
2, Raghda I. Halima
3
1Professor of Structural Engineering, Civil Engineering Department, Mansoura University, El-Mansoura, Egypt
youssefagag[at]gmail.com 2Lecturer of Structural Engineering, Civil Engineering Department, Mansoura University, El-Mansoura, Egypt
m_tantawy[at]mans.edu.eg 3Demonstrator in Civil Engineering Department, Delta Higher Institute for Engineering and Technology, El-Mansoura, Egypt
raghdaibrahim26[at]gmail.com
Abstract: Nowadays all regions over the world are exposed to earthquake hazard. So, it is very essential to take the lateral loads effect
into consideration in the design of the multi-story and high-rise buildings. Lateral loads obtained by wind and earthquakes cause high
stresses, develop sway movement and cause great damage to the structure. It is very significant for the structure to have an adequate
strength to resist vertical loads simultaneously with adequate stiffness against lateral forces. Therefore, Shear walls are one of the most
common structural elements used for stabilization of the building structures against lateral forces. Providing the shear walls in
buildings can increase the lateral stability to resist the seismic lateral load. In this present study, a comparative investigation on regular
multi-story reinforced concrete building that consisting of twenty stories is presented to study the behavior of building by varying the
positions, shapes, and dimensions of shear walls in the plan. To study the performance of shear walls at different positions during the
seismic analysis, both Equivalent Static Load Method (Simplified Modal Response Spectrum Method) and Response Spectrum Analysis
are performed. The seismic analysis is performed by using ETABs v. 16.2 software program to study the seismic parameters of the
building such as story displacement, story drift, and Base shear. From the below studies, it has been found that the values of story drifts
are within the Limits as per the Egyptian Code (ECL 201/2012).
Keywords: Shear wall, Multi-story, Seismic analysis, Equivalent Static Load Method, Response Spectrum Method, ETABs, Drift
1. Introduction
The stability of earth is always confused because of the
internal forces which cause jerks in the earth’s crust called an
earthquake. The Earthquake is a natural disaster that is
destructive and unpredictable. During this hazard, seismic
waves are generated that cause many oscillations to the
structure’s base in various directions causing lateral forces on
the building. When the dynamic force subjects structure, it
vibrates causing the structure’s displacement [1]. Recently,
the structures that constructed with good mechanism and
machines have exposed to immense loss of life and property
damage due to earthquakes. Therefore, there are many
reinforced concrete systems used for earthquake resistance to
improve their earthquake resistance behavior. Selection of the
type of lateral force resisting systems is depending on some
factors such as the architectural design, the structure
behavior, the geometry of the structural constraints of
building codes, amount of lateral force, loading composition
and maximum displacement [2]. Reinforced concrete shear
walls are used as one of the most common lateral force
resisting system in multi-story and high rise buildings [3].
Some previous researches have been conducted to investigate
the seismic behavior of the shear wall system [2]-[6], [9]-
[24]. The performance of the shear wall system is much better
than that of the frame system. They have the required
ductility, high stiffness, and large strength that can withstand
the large horizontal load and support the gravity loads
simultaneously [4]. Provision of the shear walls in the
building is found to be effective in enhancing the overall
seismic capacity characteristics of the structure and made
them the most vulnerable type of construction in the
earthquake-prone areas [5]. The locations of shear walls in
the building are dependent on functional requirements,
structural planning, building sites, and architectural interests.
Provision of structural walls as the lateral load resisting
system reduces the overall displacement of buildings and
natural periods of oscillation. Also, they cause a reduction in
shear and moment demands on beams and columns of the
building [6]. To design the structures and evaluate the effect
of the change in the building rigidity to resist earthquakes,
there are essentially four different methods for seismic
response of the structure classified as: linear static analysis
using the Equivalent Lateral Load (ESL), nonlinear static
analysis known as Pushover Analysis (POA), linear dynamic
analysis by the means of the Response Spectrum Analysis
(RSA), and the nonlinear dynamic analysis by the means of
Time History Analysis (THA) [3], [5]. According to the
results obtained from previous researches, the Response
Spectrum Analysis (RSA) is more exact than Equivalent
Static Load. Also, (RSA) is more convenient than the Time
History Analysis (THA). Although, time history method is
considered to be an exact solution for the buildings that
represent any change in the building properties [4]. In this
present study, twenty multi-story reinforced concrete
buildings subjected to earthquake excitations in El-Mansoura
city, Egypt are used to evaluate the accuracy of the
Equivalent Static Analysis and the Response Spectrum
Analysis procedure as per (ECP 203/2017) and (ECL
201/2012) codes respectively using ETABs v.16.2 [7], [8].
Shear walls with different thicknesses are considered in the
comparative investigation. The Egyptian code (ECP
203/2017) indicates that the thickness of the wall shall not be
less than 0.04 of the effective height of the wall or of the
length of the wall section whichever is lower and shall not be
less than 120 mm in any case [7]. The behavior of regular
eight models of the building under seismic loads has been
investigated for different locations, shapes, and dimensions of
Paper ID: IJSER18641 72 of 82
International Journal of Scientific Engineering and Research (IJSER) ISSN (Online): 2347-3878
Impact Factor (2018): 5.426
Volume 7 Issue 2, February 2019
www.ijser.in Licensed Under Creative Commons Attribution CC BY
shear walls. Linear static and Linear Dynamic are presented
to provide a comparison of the seismic response of multi-
story buildings in terms of story displacement, story drift, and
story shear [9]. To obtain the required strength and stiffness
to withstand the lateral load in the building, the cross-
sectional element of the slabs and the vertical elements such
as the columns and the walls have the same value in the eight
models.
2. Literature Review
Er. Raman Kumar, et.al [10] provision of the shear wall at the
internal frame decreased the axial forces, the average
displacement, and the story drift. The Maximum decrease of
shear forces and bending moments for the building were
observed for corner columns when shear walls located at
external frames.
Arafa Elhelloty [11] performed a comparative study to
evaluate the effect of lateral loads resisting systems on the
response of steel frame buildings subjected to dynamic loads
using ANSYS16 program.
Vikas Govalkar, et.al [12] investigated the effectiveness of
reinforced concrete shear wall with different position of shear
wall considering bare frame structural system and in-filled
Frame structural system. The analysis was performed by
program ''STADD V.8i''. The in-filled frame type structural
system became economical as compared to the Bare Frame
structural system. Also, Provision of the shear wall at the
corner on each side the structure gives a better result than the
all position.
J. Tarigan, et.al [13] performed the seismic analysis using the
response spectrum method for different models of structures
by comparing the displacement and story drift. Providing
shear wall at the core of structure symmetrically gives the
best performance to reduce the displacement and story-drift.
Mr. Muralidhar G.B, et.al [14] investigated the seismic
performance of R.C Building with a flat plate influenced by a
shear wall by a linear dynamic method using ''ETABs.15'' to
study the seismic parameters. Concluded that the provision of
shear walls at a diagonal corner increases the stiffness of the
building and thereby decreases the values of the time period,
the displacement and the story drift.
Rupali Goud, et.al [15] analyzed the structural behavior of
multi-story building with different location of lift core shear
wall was performed by an Equivalent static procedure using
''STAAD'' program. Concluded that the lift core should be
provided at the edge of the building to serve its function
efficiently and control the deflection during the earthquake.
Providing lift core at corners or at the edge of the building
have a better drift reduction factor as compared to the core at
the center of the building.
Syed Khasim Mutwalli, et.al [16] studied the seismic
performance of high rise building considering the effect of
concrete core wall and shear wall at different positions.
Linear static, linear dynamic and pushover analysis have been
performed using structural analysis program '' ETABS '' The
model of a bare frame with a shear wall at corners plus lift
core wall shows better performance for minimum values of
structural displacement and roof displacement, also maximum
values of structural acceleration and base shear as compared
to other models.
3. Objective of the Work
The main objectives of this study that has been carried out are
as follows:
Determine the seismic parameters of the structure such as
story displacement, story drift, and base Shear.
Evaluate the performance of the R.C. wall system using a
linear Equivalent Static Load analysis and Response
Spectrum Method.
Obtain the optimum position of the shear wall with uniform
thickness throughout the eight different models presented in
this study [17].
4. Structural Modeling
4.1 Site Location and Structural System
A regular residential multi-story building in the plan was
selected with twenty stories with R.C. structural wall system.
Considering the location of the suggested building is in El-
Mansoura, Egypt with a Seismic Zone (2). The maximum
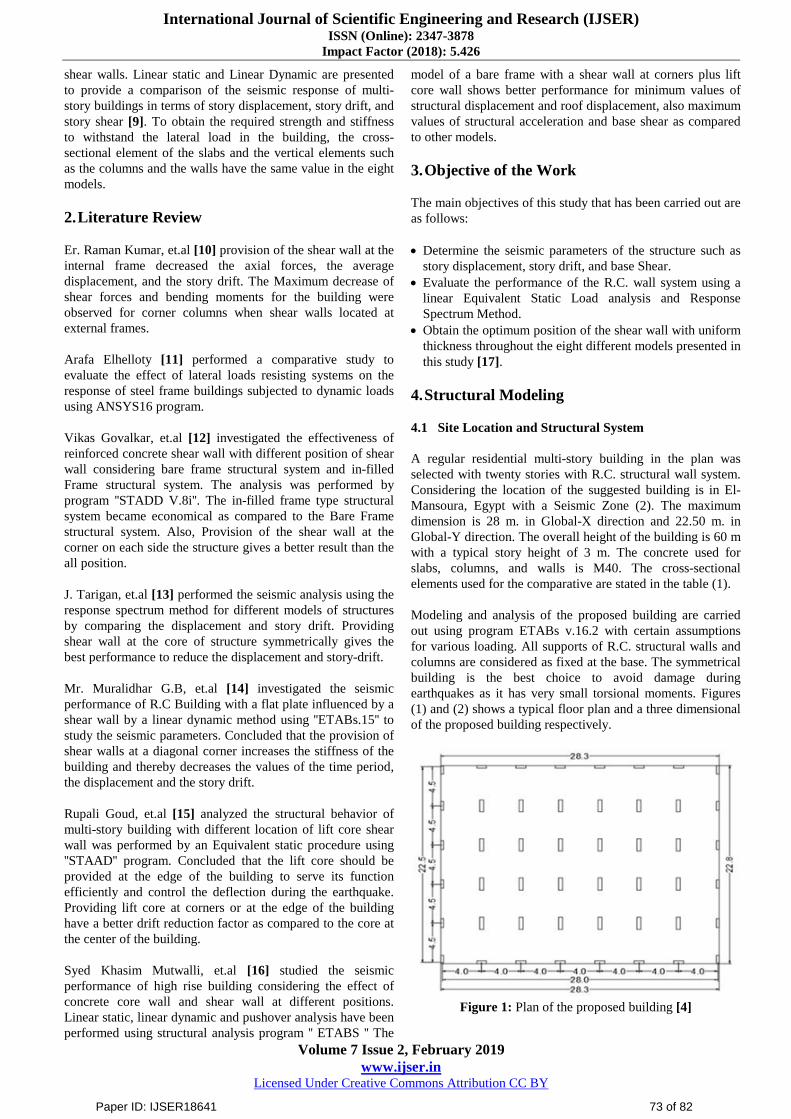
dimension is 28 m. in Global-X direction and 22.50 m. in
Global-Y direction. The overall height of the building is 60 m
with a typical story height of 3 m. The concrete used for
slabs, columns, and walls is M40. The cross-sectional
elements used for the comparative are stated in the table (1).
Modeling and analysis of the proposed building are carried
out using program ETABs v.16.2 with certain assumptions
for various loading. All supports of R.C. structural walls and
columns are considered as fixed at the base. The symmetrical
building is the best choice to avoid damage during
earthquakes as it has very small torsional moments. Figures
(1) and (2) shows a typical floor plan and a three dimensional
of the proposed building respectively.
Figure 1: Plan of the proposed building [4]
Paper ID: IJSER18641 73 of 82

International Journal of Scientific Engineering and Research (IJSER) ISSN (Online): 2347-3878
Impact Factor (2018): 5.426
Volume 7 Issue 2, February 2019
www.ijser.in Licensed Under Creative Commons Attribution CC BY
Model (0) Building with columns and no shear walls
Figure 2: Three Dimensional of the Proposed Building [4]
Table 1: Section Properties
Cross Section Dimension
Slab thickness 200 mm
Shear Wall thickness 200 mm, 300 mm, 400 mm
Columns
300*600 , 300 800 , 300 1000 ,
300*1100 , 400 1400 ,
400*1600 mm
4.2 Material Properties
The structural strength is strongly affected by the strength of
the material [4]. It is specified in the analysis of the structure
and is assigned according to (ECP 203/2017).
4.3 Models Considered for the Analysis
The Building of twenty stories in the plan was modeled as a
fixed base building. Eight regular symmetrical models in the
plan, as well as the elevation, are analyzed with soft
computing program ETABs v.16.2 using the Equivalent
Static analysis and the response spectrum analysis and
compared to model (0) with only column and no shear walls
in the layout. In this study, the eight models are constructed
with different contributions and shapes of shear walls. The
cross-sectional elements of the slabs and the vertical elements
such as columns and walls have the same values in the eight
models in order to make a fair comparison and good results.
Also, the material properties, loading and other data for
seismic forces are the same in the eight models. The eight
models are analyzed for different thicknesses of the shear
wall. The eight models of the building separately for a
comparison of story displacement, story drift, and base shear
are as following:
a) Model (1):
Building with shear walls placed at the central core.
b) Model (2):
Building with (L-shape) shear walls at corners.
c) Model (3):
Building with shear walls at the center of the exterior
perimeter.
d) Model (4):
Building with shear walls at the exterior perimeter parallel to
Y-direction.
e) Model (5):
Building with shear walls at the exterior perimeter parallel to
X- and Y-directions.
f) Model (6):
Building with shear walls at corners as well as the center of
the exterior perimeter.
g) Model (7):
Building with shear walls at the central core as well as the
center of the exterior perimeter.
h) Model (8):
Building with (U-Shape) shear walls at corners.
Models 1, 2, 3, 4, 5, 6, 7 and 8 are shown in figures (3), (4),
(5), (6), (7), (8), (9) and (10) respectively.
Figure 3: Model (1) Building with Central Walls
Paper ID: IJSER18641 74 of 82

International Journal of Scientific Engineering and Research (IJSER) ISSN (Online): 2347-3878
Impact Factor (2018): 5.426
Volume 7 Issue 2, February 2019
www.ijser.in Licensed Under Creative Commons Attribution CC BY
Figure 4: Model (2) Building with (L-shape) shear walls at
Corners
Figure 5: Model (3) Building with Shear Walls at the center
of exterior perimeter
Figure 6: Model (4) Building with Shear Walls at exterior
perimeter parallel to Y-direction.
Figure 7: Model (5) Building with Shear Walls at exterior
perimeter parallel to X-&Y- direction.
Figure 8: Model (6) Building with Shear Walls at Corners as
well as the center of the exterior perimeter
Figure 9: Model (7) Building with Shear Walls at the center
as well as the center of the exterior perimeter
Paper ID: IJSER18641 75 of 82

International Journal of Scientific Engineering and Research (IJSER) ISSN (Online): 2347-3878
Impact Factor (2018): 5.426
Volume 7 Issue 2, February 2019
www.ijser.in Licensed Under Creative Commons Attribution CC BY
Figure 10: Model (8) Building with (U-Shape) Shear Walls
at corners
4.4 Loading considerations
A. Gravity Loads
The gravity loads on the structure considered in this analysis
include dead loads and live loads. The Self-weight of the
structural elements are calculated automatically by the
ETABs program itself. The wall loads are assigned as
uniform area loads on slab elements.
Live loads are assigned as uniform area loads as per the
Egyptian Code for Loads (ECL 201/2012).
A. Earthquake Load
In recent years, earthquake loads of the high-rise buildings
have been a significant concern for designers owing to the
development and the construction. The lateral load of the
earthquake load is calculated according to the Egyptian Code
for Loads (ECL 201/2012).
B. Load Combinations
When calculating the loads on the building, the loading cases
shall be considered to give maximum effect on the structural
elements. Egyptian Code (ECP 203/2017) states that there are
numbers of load combinations which are used in the structural
analysis.
C. Analysis of the Structure
For determining seismic design lateral forces, evaluating
(ECL 201/2012) and the effect of the change in the building
rigidity on seismic actions, the Egyptian code recommended
using different types of earthquake analysis methods.
Static Analysis
Equivalent Static Analysis (Linear Static)
Dynamic Analysis
The Response Spectrum Analysis (Linear Dynamic)
Time History Analysis (Non-Linear Dynamic)
In this present study, the Equivalent Static Load analysis and
the Response Spectrum Analysis are carried out for the
determination of seismic parameters of the building.
All designs against earthquake effects must take the dynamic
nature of the load into consideration. However, Equivalent
static analysis cannot be used if the structure is irregular in
terms of mass distribution, stiffness, strength, and elements
with large ductility or the lateral force resisting system is non-
orthogonal. The Egyptian code for loads (ECL201/2012)
recommends that detailed dynamic analysis should be carried
out depending on the importance of the problems. Also, it
recommends the use of model analysis using the Equivalent
Static Load method and the Response Spectrum Analysis
method for building of height less than 60m in all seismic
zones as safe.
In (ESL) procedure, the distribution of seismic lateral force
on the building depends on the fundamental period of the
structure with some modifiers. The base shear shall be
computed, and then be distributed along the height of the
buildings based on simple formulas for buildings with regular
distribution of stiffness and mass. However, the distribution
of seismic lateral force on the building in the (RSA) is based
on the deformed shapes of natural modes of vibration, which
are obtained from the distribution of mass and stiffness of the
structure [18].
5. Analysis Results
In this context, the analysis output of all models of twenty
stories reinforced concrete building containing the different
shapes, dimensions, and locations of shear walls are
considered. The analysis has been performed by the
Equivalent Static Load and Response Spectrum Analysis as
per the Egyptian Code for Loads (ECL 201/2012) for each
model using ETABs v.16.2 software. Lateral load values and
its distribution along the height have done. The seismic
weight is calculated in (ESL) analysis using the full dead load
plus 25% of the live load. However, the base shear in (RSA)
is scaled to be equal to 85% of the base shear value calculated
using the (ESL) Method. The Results have represented in
comparison forms according to the following seismic
parameters for different stories. These parameters are story
displacement, story drift, and base shear.
5.1 Maximum Story Displacement
Story displacement means the displacement which occurred at
each story level according to the various loading pattern. The
comparative study of the story displacements for each model
along the two directions was represented in the figures (11)-
(23) using the Equivalent Static Load Method and the
Response Spectrum Method respectively.
Paper ID: IJSER18641 76 of 82

International Journal of Scientific Engineering and Research (IJSER) ISSN (Online): 2347-3878
Impact Factor (2018): 5.426
Volume 7 Issue 2, February 2019
www.ijser.in Licensed Under Creative Commons Attribution CC BY
Figure 11: Lateral Maximum Story Displacement in X-dir.
(Equivalent Static Load Method) - (tw =400mm)
Figure 12: Lateral Maximum Story Displacement in Y-dir.
(Equivalent Static Load Method) - (tw =400mm)
Figure 13: Lateral Maximum Story Displacement in X-dir.
(Equivalent Static Load Method) - (tw =300mm)
Figure 14: Lateral Maximum Story Displacement in Y-dir.
(Equivalent Static Load Method) - (tw =300mm)
Figure 15: Lateral Maximum Story Displacement in X-dir.
(Equivalent Static Load Method) - (tw =200mm)
Figure 16: Lateral Maximum Story Displacement in X-dir.
(Equivalent Static Load Method) - ( tw =200mm)
Figure 17: Lateral Maximum Story Displacement in Y-dir.
(Equivalent Static Load Method) - (tw =200mm)
Figure 18: Lateral Maximum Story Displacement in X-dir.
(Response Spectrum Method) - (tw =400mm)
Paper ID: IJSER18641 77 of 82

International Journal of Scientific Engineering and Research (IJSER) ISSN (Online): 2347-3878
Impact Factor (2018): 5.426
Volume 7 Issue 2, February 2019
www.ijser.in Licensed Under Creative Commons Attribution CC BY
Figure 19: Lateral Maximum Story Displacement in X-dir.
(Response Spectrum Method) - (tw =300mm)
Figure 20: Lateral Maximum Story Displacement in Y-dir.
(Response Spectrum Method) - (tw =300mm)
Figure 21: Lateral Maximum Story Displacement in X-dir.
(Response Spectrum Method) - (tw =200mm)
Figure 22: Lateral Maximum Story Displacement in X-dir.
(Response Spectrum Method) - (tw =200mm)
Figure 23: Lateral Maximum Story Displacement in Y-dir.
(Response Spectrum Method) - (tw =200mm)
By comparing the displacement values obtained from the
Equivalent Static Method for all models for the shear wall
thickness of 200 mm, it has been found that model (2), model
(3), model (4), model (5), model (6), model (7), and model
(8) has 65.14%, 73.1%, 10.94%, 75.8% , 47.3%, 73.12% and
59.4% respectively less displacement values as compared to
the model (0) in X- direction and in Y- direction model (2),
model (3), model (4), model (5), model (6), model (7), and
model (8) has 61.19% , 77.08% , 79.66% , 66.97% , 48.65%,
51.36%, and 67.56% respectively less displacement values as
compared to the model (0) . For the shear wall thickness of
300 mm, model (2), model (3), model (4), model (5), model
(6), and model (7) has 44.96%, 62.84%, 1.99% , 62.8% ,
27.89%, and 62.75% respectively less displacement values as
compared to the bare frame model (0) in X- direction and in
Y- direction model (2), model (3), model (4), model (5),
model (6) and model (7) has 32.95 % , 52.46 % , 64.98%,
46.83%, 24.7%, and 24.14% respectively less displacement
values as compared to the model (0).
In the Response Spectrum Analysis, it has been found that
model (2), model (3), model (4), model (5), model (6), model
(7) and model (8) has 77.7%, 82.9%, 20.9%, 83.8%, 65.9 %,
82.4% and 73.6% respectively less displacement values as
compared to the model (0) in X- direction for shear wall
thickness of 200 mm. For thickness for shear wall of 300 mm,
model (2), model (3), model (4), model (5), model (6), and
model (7) has 64.5%, 74.05% , 34.05%, 75.08%, 52.6%
and75.4% respectively less displacement values as compared
to the model (0) in X- direction.
5.2 Maximum Story Drift
Story drift is the relative displacement between any two levels
of the story between the floor above and below the under
consideration (Story drift is the lateral displacement of one
level relative to the level above or below it).
Story drift ratio = difference between the displacement of two
Stories / height of one story [19]
As per (ECL 201/2012), the story drifts in any story due to
the specified design lateral force shall not exceed the
permissible inter-story drift that is limited to 0.005 times the
story height.
Paper ID: IJSER18641 78 of 82
International Journal of Scientific Engineering and Research (IJSER) ISSN (Online): 2347-3878
Impact Factor (2018): 5.426
Volume 7 Issue 2, February 2019
www.ijser.in Licensed Under Creative Commons Attribution CC BY
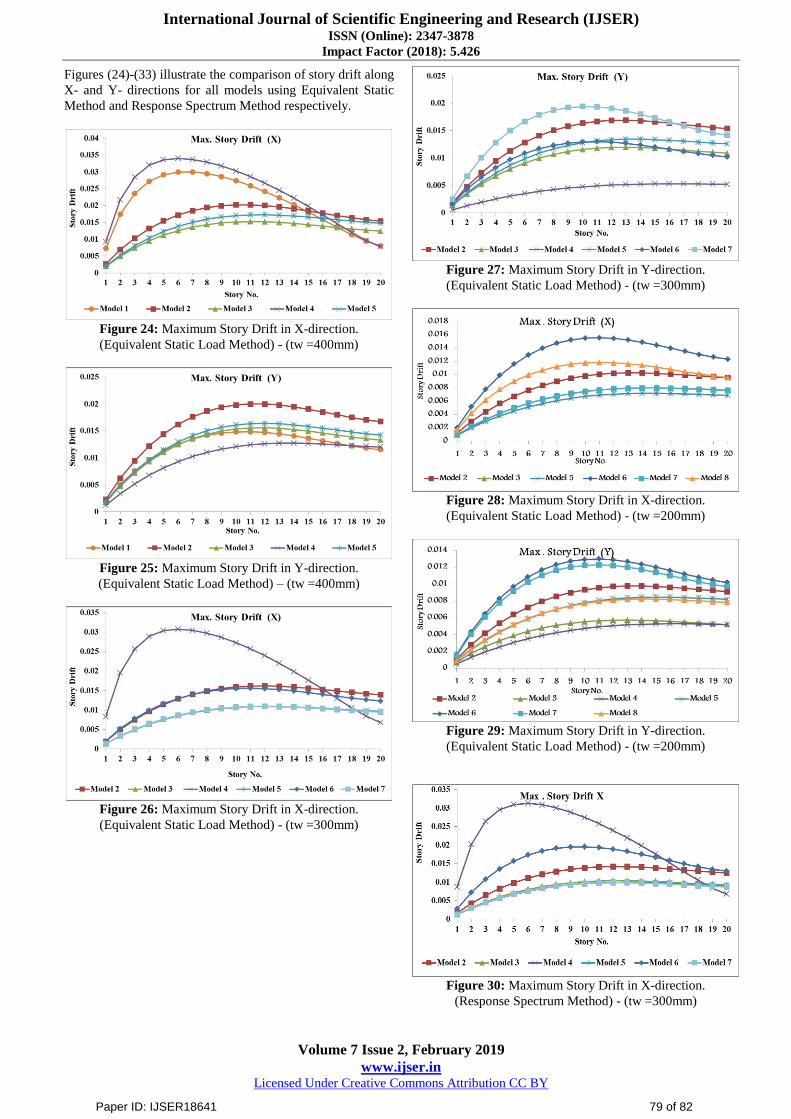
Figures (24)-(33) illustrate the comparison of story drift along
X- and Y- directions for all models using Equivalent Static
Method and Response Spectrum Method respectively.
Figure 24: Maximum Story Drift in X-direction.
(Equivalent Static Load Method) - (tw =400mm)
Figure 25: Maximum Story Drift in Y-direction.
(Equivalent Static Load Method) – (tw =400mm)
Figure 26: Maximum Story Drift in X-direction.
(Equivalent Static Load Method) - (tw =300mm)
Figure 27: Maximum Story Drift in Y-direction.
(Equivalent Static Load Method) - (tw =300mm)
Figure 28: Maximum Story Drift in X-direction.
(Equivalent Static Load Method) - (tw =200mm)
Figure 29: Maximum Story Drift in Y-direction.
(Equivalent Static Load Method) - (tw =200mm)
Figure 30: Maximum Story Drift in X-direction.
(Response Spectrum Method) - (tw =300mm)
Paper ID: IJSER18641 79 of 82

International Journal of Scientific Engineering and Research (IJSER) ISSN (Online): 2347-3878
Impact Factor (2018): 5.426
Volume 7 Issue 2, February 2019
www.ijser.in Licensed Under Creative Commons Attribution CC BY
Figure 31: Maximum Story Drift in Y-direction.
(Response Spectrum Method) - (tw =300mm)
Figure 32: Maximum Story Drift in X-direction.
(Response Spectrum Method) - (tw =200mm)
Figure 33: Maximum Story Drift in Y-direction.
(Response Spectrum Method) - (tw =200mm)
From the figures (24)–(33), it can be noticed that when
decreasing the thickness of shear walls, the story drifts of all
models can achieve the permitted value as specified by code
(ECL 201/ 2012). The maximum permitted drift is 0.005
times the height of the story equal 0.015 m.
From the above comparison, the increase in the height of the
building increased the story drift. It is worth mentioning that
the story drift is low in bottom stories, high in the middle
stories and finally reduces towards the upper stories.
By comparing the drift values obtained from the Equivalent
Static Method for all models for the shear wall thickness of
200 mm, it has been found that model (2), model (3), model
(4), model (5), model (6), model (7), and model (8) has 16.23
%, 32.56 %, 40.33%, 39.59%, -8.32%, 33.06%, and 16.03%
respectively less drift values as compared to the model (0) in
X- direction and in Y- direction model (2), model (3), model
(4), model (5), model (6), model (7), and model (8) has
30.7%, 60.5% , 60.44%, 37.7%, 22.39%, 26.08%, and
40.47% respectively less drift values as compared to the
model (0) . For the shear wall thickness of 300 mm, model
(3), model (4), model (5) and model (7) has 16.35%, 35.59
%, 15.36%, and 16.97% respectively less drift values as
compared to the model (0) in X- direction and in Y- direction
model (2), model (3), model (4), model (5), model (6), and
model (7) has -16.72%, 17.22%, 33.83%, 4.23%, 22.39%,
and -7.74% respectively less drift values as compared to the
model (0).
In the Response Spectrum Analysis, it has been found that
model (2), model (3), model (4), model (5), model (6), model
(7) and model (8) has 49.94 %, 59.92%, 54.46% , 62.47%,
34.13%, 59.08%, and 48.69% respectively less drift values as
compared to the model (0) in X- direction for shear wall
thickness of 200 mm. For thickness for shear wall of 300 mm,
model (2), model (3), model (4), model (5), model (6), and
model (7) has 25.98%, 45.47%, 60 %, 46.2 %, 23.28%, and
48.6% respectively less drift values as compared to the model
(0) in X- direction.
Finally, from the above results, it could be seen that the
maximum reduction in story drift values was obtained for
Models (3), (5), and (7) when compared to that model with
columns only.
5.3 Base Shear
Base shear is the maximum predictable lateral force that will
happen due to seismic ground motion at the base of the
structure. For the analysis, the codes required the use of the
equivalent static force procedure and a dynamic lateral force
procedure. Hence, the base shear calculated from the dynamic
analysis should be reduced to a certain percentage of the base
shear obtained from the static force procedure [25]. Base
shear scaling is a procedure required that the minimum
strength of a structure designed using the Response Spectrum
Analysis method (RSA) is similar to that strength if the
structure was designed using the Equivalent Static Load
method (ESL) [26]. As per code (ECL 201/2012), using the
(RSA) method reduced the value of the base shear to be equal
to 85% of the value calculated using the (ESL) Method.
From the below table (2) which represents the comparison of
seismic base shear for various models obtained from ESL and
RSA, it can be observed that all of the models approximately
have the same values of the base shear in Equivalent Static
Load Analysis. The same values of the base shear are the
result of the same weight of the cross-sectional element in any
model. Also, it can be observed that the Equivalent Static
Load Analysis yields the largest values of base shear as
compared to that the Response Spectrum Analysis. RSA
yielded more effective base shear values when compared to
ESL.
The base shear for each model is plotted in the figure (34)
using Equivalent Static Load Method (ESL) and Response
Spectrum Method (RSA) respectively.
Paper ID: IJSER18641 80 of 82

International Journal of Scientific Engineering and Research (IJSER) ISSN (Online): 2347-3878
Impact Factor (2018): 5.426
Volume 7 Issue 2, February 2019
www.ijser.in Licensed Under Creative Commons Attribution CC BY
Table 2: Base Shear (KN)
Mo
del
Base Shear [KN]
Linear Static Analysis Linear Dynamic
Analysis
Vx Vy Vx Vy
M 2 4996.5 4996.5 4271.9 4317.1
M 3 4996.5 4996.5 4420.5 4520
M 4 4996.0 4996 4643.5 4445.1
M 5 4996.6 4996.6 4467.6 4461.8
M 6 4996.5 4996.5 4254.7 4301.2
M 7 4936.6 4936.6 4383 4254.5
M 8 4995.1 4995.1 4271.8 4429.4
Figure 34: Base Shear
6. Conclusion
This study has investigated the performance of reinforced
concrete multi-story building with twenty stories influenced
by shear walls. The parametric study is carried out for eight
models for the various arrangement of the shear wall in the
plan configuration. In this study, the analysis of models is
carried out using ETABs v.16.2 software. Shear walls are
provided for lateral stability of the reinforced concrete
structures. The seismic behavior is evaluated for the various
seismic parameters such as story displacement, story drift,
and base shear. So based on the results conclusions were
drawn:
1) The shear walls should be provided in both directions of
buildings in plan configuration not only in one direction
because the behavior of the structure is good in that
direction, but it has no considerable effect in the other
direction as shown in models (1) and (4) in the longitudinal
and transverse directions.
2) Providing the shear wall away from C.G decreases the
displacement and story drift and vice versa when the shear
wall is near C.G, the displacement and story drift is
increasing as in model (1) when compared to other models.
3) From the comparison, providing shear walls at the exterior
perimeter; model (3), or at the exterior perimeter of the
building parallel to longitudinal and transverse directions;
model (5) or at central core as well as the center of the
exterior perimeter; model (7), shows the preference for the
seismic parameters as it improves the behavior of the
structure by decreasing the values of the displacements and
the story drifts when compared to that model (0) with
columns only and no shear walls.
4) The story drifts are within the permissible limits as
specified by code (ECL 201/2012) in both ESL and RSA.
5) Model with (U-shape) shear wall in corners was observed
to have more inter-story drift when compared to that model
in which shear walls are central core as well as the center of
the exterior perimeter; model (7).
6) The results of the Response Spectrum Analysis provided a
more realistic behavior of structure response than the
Equivalent Static Load method.
7) The RSA method yields more effective base shear values
compared to The ESL method.
References
[1] Yousef, A., Lecture Notes on: Earthquake Resistant
Design of Structures. El-Mansoura, Egypt, 2011.
[2] S.A. Halkude, C.G. Konapure and S.M.Birajdar. "Effect
of Location of Shear Walls on Seismic Performance of
Buildings." International Journal of Current Engineering
and Technology, Vol. 5, Issue. 2, PP. 826-833, 2015
[3] Kimleng Khy, Chatpan Chintanapakdee and Pennung
Warnitchai. "Modified response spectrum analysis to
compute shear force in tall RC shear wall buildings."
Engineering Structures - Elsevier, PP. 295-305, 2019.
[4] Le Yee Mon. "Comparative Study on Dynamic Analysis
of Irregular." International Journal of Science and
Engineering Applications, Vol. 3, Issue. 2, PP. 22 - 30 ,
2014.
[5] Lakshmi K.O., Prof. Jayasree Ramanujan, Mrs. Bindu
Sunil, Dr. Laju Kottallil and Prof. Mercy Joseph
Poweth."Effect of shear wall location in buildings
subjected to seismic loads." ISOI Journal of Engineering
and Computer science Vol. 1, Issue.1, PP. 7-17,
December-2014.
[6] Anuja Walvekar and H.S.Jadhav. "Parametric Study Of
Flat Slab Building With And WithoutT Shear Wall To
Seismic Performance." International Journal of Research
in Engineering and Technology , Vol. 4, Issue. 4, PP.
601-607, 2015.
[7] Ministry of housing, Utilities and Urban Communities.
"Egyptian Code for Design and Construction of R.C.
Structures. " Cairo, Egypt, (ECP 203/2017).
[8] Ministry of Housing, Utilities and Urban Communities.
"Egyptian code for calculating loads and forces in
structural work and masonry." Cairo, Egypt, (ECL
201/2012).
[9] Mahdi Hosseini, Dr.Hadi Hosseini and Prof.Tabassum.
"Effective of Earthquake load on Behavior of
Rectangular Shear Wall in RC Frame Building."
American Journal of Engineering Research (AJER), Vol.
4, Issue. 5, PP. 50- 69 , 2015.
[10] Er. Raman Kumar, Er. Shagunveer Singh Sidhu, Er.
Shweta Sidhu, Er. Harjot Singh Gill. "Seismic Behavior
Of Shear Wall Framed Buildings." International Journal
of Engineering Technology, Management and Applied
Sciences, Vol. 2, Issue.1, PP. 28-38, 2014.
[11] Arafa Elhelloty." Effect of Lateral Loads Resisting
Systems on Response of Buildings Subjected to Dynamic
Loads." International Journal of Engineering Inventions
(IJEI), Vol. 6, Issue. 10, PP. 62-76, October- 2017.
[12] Vikas Govalkar, P. J. Salunke and N. G. Gore. "Analysis
of Bare Frame and Infilled Frame with Different Position
of Shear Wall." International Journal of Recent
Paper ID: IJSER18641 81 of 82
International Journal of Scientific Engineering and Research (IJSER) ISSN (Online): 2347-3878
Impact Factor (2018): 5.426
Volume 7 Issue 2, February 2019
www.ijser.in Licensed Under Creative Commons Attribution CC BY
Technology and Engineering (IJRTE), Vol. 3, Issue. 3,
PP. 67-72, July-2014.
[13] J Tarigan , J Manggala and T Sitorus. "The effect of
shear wall location in resisting earthquake." In
Proceedings of IOP Conference Series: Materials
Science and Engineering. PP.1-6, 2018.
[14] Mr. Muralidhar G.B and Mrs. Swathi Rani K.S. "Study
Of Seismic Performance Of RC Building With Flat Plate
Influenced By Concrete Wall." International Research
Journal of Engineering and Technology (IRJET), Vol. 3,
Issue. 1, PP. 357-361, 2016.
[15] Rupali Goud and Sumit Pahwa. "Study of Effect of
Location of Lift Core Shear Wall under Earthquake
Load." International Journal of Science Technology &
Engineering (IJSTE) , Vol. 2, Issue. 7, PP. 10-13 ,
January-2016.
[16] Syed Khasim Mutwalli, Dr. Shaik and Kamal
Mohammed Azam;. "Dynamic Response of High Rise
Structures Under The Influence of Shear Walls." Int.
Journal of Engineering Research and Applications (
Version 6) , Vol. 4, Issue. 9, PP. 87- 96 , September-
2014.
[17] G.S Hiremath and Md Saddam Hussain." Effect of
Change in Shear Wall Location with Uniform and
Varying Thickness in High Rise Building." International
Journal of Science and Research (IJSR), Vol. 3, Issue.
10, PP. 284-288 , October-2014.
[18] Pankaj Agarwal and Manish Shrikhande, Earthquake
Resistant Design of Structures, Eastern Economy
Edition, New Delhi, India, 2006.
[19] Md Irfanullah, Md Irshad Ali and Vishwanath. B .Pat. "
Seismic Evaluation Of R.C. Framed Buildings With
Influence Of Masonry Infill Panel." International Journal
of Research in Engineering and Technology (IJRET),
eISSN: 2319-1163 | pISSN: 2321-7308 , PP. 30-35,
november-2013.
[20] P. Reza, M.F. Wahid and D.M.N. Islam. “Comparative
Study of Bare Frame and Infilled Frame Buildings Due
To Seismic Load.” In Proceedings of 11th Global
Engineering, Science and Technology Conference.
Dhaka, Bangladesh, pp.18-19, December 2015.
[21] Hema Mukundan and S.Manivel. "Effect of Vertical
Stiffness Irregularity on Multi-Storey Shear Wall-framed
Structures using Response Spectrum Analysis."
International Journal of Innovative Research in Science,
Engineering and Technology, Vol. 4, Issue. 3, PP. 1186-
1198, 2015.
[22] Mr.N.B.Baraskar and Prof.U.R.Kawade. "Structural
Performance of RC Structural wall system over
conventional Beam Column System in G+15 storey
Building." International Journal of Engineering Research
and General Science, Vol. 3, Issue. 4, PP. 639-654,
2015.
[23] Raghavendra Rao K. and Dr.M Rame Gowda, "
Comparative Study of Equivalent Static Analysis and
Response spectrum analysis on Flat Slab Using Etabs."
International Research Journal of Engineering and
Technology (IRJET), Vol. 3, Issue. 8, PP. 1649-1653,
Aug-2016.
[24] Md. Rokanuzzaman, Farjana Khanam, Anik Das and S.
Reza Chowdhury." Effective Location Of Shear Wall On
Performance Of Building Frame Subjected To Lateral
Loading." International Journal of Advances in
Mechanical and Civil Engineering, Vol. 4, Issue. 6, PP.
51-54, December-2017.
[25] Structural World. “Scaling of Base Shear Results of
Static and Dynamic Analysiscast, " [Online]. Available:
https://www.thestructuralworld.com/2018/09/15/scaling-
of-base-shear-results-of-static-and-dynamic-analysis.
[Accessed: September 15, 2018].
[26] B. J. Davidson. “Base Shear Scaling.” In Proceedings of
2008 NZSEE Conference. PP.1-18, 2018
Paper ID: IJSER18641 82 of 82