the effect of pt concentration on the hydrogen production
TRANSCRIPT

Hydrogen production affected by Pt concentration on TiO2 produced from the incineration of dye wastewater flocculated sludge using titanium tetrachloride
H.K. Shon*, S. Vigneswaran*, I. El Saliby*, Y. Okour*, In S. Kim**, J. Cho**, H.J. Park***, J.B. Kim**** and J.-H. Kim****
*Faculty of Engineering, University of Technology, Sydney, P.O. Box 123, Broadway, NSW 2007, Australia **Environmental Science and Technology, Gwangju Institute of Science and Technology, Gwangju, Korea ***Photo & Environmental Technology Co., Gwangju 500-460, Korea
****School of Applied Chemical Engineering & The Research Institute for Catalysis, Chonnam National University, Gwangju 500-757, Korea The author to whom all the correspondence should be addressed (Tel.: +61295142641, Fax: +61295142633). Email: [email protected] Abstract TiO2 from the incineration of dye wastewater flocculated sludge using TiCl4 coagulant was produced. Optimal catalyst amount and Pt-loading on TiO2 were studied for the production of H2 by photocatalytic reforming of methanol (6% vol.). On the other hand, BTSE (biologically treated sewage effluent) was flocculated using TiCl4 and produced sludge was incinerated to generate TiO2. TiO2 was loaded with optimum Pt and added to the supernatant in a photocatalytic reactor to test the efficiency of using remaining organics as a “sacrificial reagent” for photocatalytic hydrogen production. Dissolved organic carbon (DOC) and molecular weight distribution (MWD) were measured for nanofiltration (NF) and TiCl4 flocculation followed by photocatalysis. TiO2 (from the incineration of BTSE flocculated sludge using TiCl4) was produced and loaded with 0.5%Pt. Results showed that the optimum concentration of TiO2 (from dye wastewater) for H2 production was 0.3g/L, while the optimum amount of Pt was 0.5%. DOC and MWD removal was similar for the flocculation of BTSE followed by photocatalytic reaction and the NF process. Remaining organic compounds after flocculation could not be used as sacrificial reagent to induce H2 production. Further investigations on studying the UV intensity and/or identifying organic/inorganic scavengers to inhibit H2 production are underway. Keywords: Dye wastewater, hydrogen production, platinum, titanium dioxide.
INTRODUCTION The sustainability of conventional energy sources on earth, mainly fossil fuel, is becoming more and more a doubtful issue and the search for an economically feasible alternative has not yet been achieved. Most of predictions on the depletion of fossil fuel in the past 25 years were either imprecise or missed possible future technology improvement in this field. For instance, presently, 85% of energy consumed on earth is still originated from fossil fuel, while only 5% comes from renewable energy and the rest 10% being from nuclear and hydroelectrical power [1, 2]. The combustion of fossil fuel has contributed significantly to the increase of CO2 concentrations in the atmosphere and consequently created environmental problems. The need for an environmental friendly fuel that reduces the impact of energy production on the natural ecosystem and that does not halt the equilibrium of life on earth is essential. Hydrogen fuel that is extracted from water via biological production, or using electricity (by electrolysis), chemicals (by chemical reduction) or heat (by thermolysis) is considered as the future fuel that meets those criteria. This is mainly because it is produced from clean and renewable energy sources. Among the possible ways of producing environmental friendly H2, the photosplitting of water for producing H2 has gained much attention due to its potential applications as a clean energy source [3].

The photosplitting of water can be divided into: i) the photoelectrochemical system [4-7] and ii) the the photocatalytic suspension system [8,9]. Extensive studies focused in the past decade on improving the production of hydrogen by using the photocatalytic suspension system with TiO2 as catalyst [9-11]. TiO2 is produced by different procedures but a novel synthesis reaction was developed by Shon et al. [12] to produce titania from the incineration of wastewater flocculated sludge using titanium tetrachloride. This methodology had a twofold environmental positive impact which summarized in eliminating the need to dispose of sludge in the natural ecosystem as well as which enabled the production of an essential catalyst for the production of H2 through the photocatalytic suspension system. Presently, the energy conversion efficiency from solar to hydrogen by TiO2 photocatalytic water-splitting is still low, mainly due to the: i) recombination of photo-generated electron/hole pairs; ii) fast backward reaction (recombination of hydrogen and oxygen into water); and iii) inability to utilize visible light [13]. Many efforts have been made to improve the photocatalytic suspension system through noble metal loading on TiO2 surface [14-18] or the use of organic solvents as “sacrificial reagents” [17, 19-22]. However, Ni et al. [13] reported that hydrogen production from pure water-splitting is difficult to achieve even if noble metal loading can reduce recombination to some extent. This is mainly due to: i) recombination cannot be completely eliminated; ii) backward reaction of H2 and O2 to form H2O is thermodynamically favourable. Therefore, the addition of sacrificial electron donor (organic compounds) which becomes progressively oxidized toward CO2 by consuming photogenerated holes and/or oxygen will increase hydrogen production rates [23]. Pastoura et al. [23] found that enhanced hydrogen production process is directly related to the amount of sacrificial reagent present in the suspension of Pt/TiO2 and water. After the complete oxidation of the sacrificial reagent they recorded a drop of the rate of hydrogen production to values comparable to those obtained from pure water. The effects of various sacrificial reagents such as CH3OH, CH2O, Na2S, I− and IO3
−, was investigated by Galinska and Walendziewski [24], who found that methanol is the best capture reagent for the photogenerated holes. In the present study, we have synthesized TiO2 from the incineration of dye wastewater flocculated sludge using TiCl4. The synthesized catalyst was tested for hydrogen production from 6% (v/v) methanol/water solution to determine its optimum concentration. Later on, the identified optimum TiO2 concentration was used to load the catalyst with different Pt concentrations and the resulted catalysts were tested again to estimate hydrogen production using the 6% (v/v) methanol/water solution. The characterization of the generated catalysts was also done. Additionally, photocatalytic organic removal for wastewater reuse with simultaneous photocatalytic hydrogen production was performed and the process efficiency was compared to nanofiltration (NF) membrane process in terms of dissolved organic carbon (DOC) removal and molecular weight distribution (MWD). MATERIALS AND METHODS TiO2 and Pt/TiO2 preparation Dye wastewater (Chemical oxygen demand, suspended solid, total nitrogen, total phosphorus and pH were 448.8 mg/L, 43.3 mg/L, 72.4 mg/L, 3.2 mg/L and 11.7, respectively) collected from Daegu Dyeing Industrial Center, South Korea was used to collect sludge after Ti-salt (TiCl4) flocculation. Flocculated sludge was incinerated at 600°C to produce TiO2 powder [12]. Different concentrations (0.1, 0.3, 0.5, 1 and 2 g/L) of TiO2 were used later on in this study to test their effect on the production of H2 gas and ultimately to determine the optimal concentration for platinum deposition on TiO2. TiO2 powder produced from the incineration of dye wastewater flocculated sludge was used to test the

effect of Pt concentration on the hydrogen production rate of Pt/TiO2. The deposition of Pt on TiO2 surface using the H2 reduction method was performed following the methodology described by Ikuma and Bessho [16]. TiO2 powder was mixed with H2PtCl6 solution and methanol. Solution mixture was continuously stirred while subjected to heating until the liquid was evaporated. After drying, TiO2 powder was heated in H2 atmosphere at a temperature of 425°C to reduce the H2PtCl6 to Pt. Different Pt concentrations (0.01, 0.05, 0.1 and 0.5%) were deposited on TiO2 surface to identify the optimum Pt concentration for hydrogen production. Characterization of TiO2 TiO2 produced from the flocculation of dye wastewater using TiCl4 and Pt/TiO2 were analysed using transmission electron microscope (TEM, Rigaku, Japan). MDI Jade 5.0 (Materials Data Inc., USA) was used to generate X-ray diffraction (XRD) patterns. BET surface area analysis was assessed using an automated surface area analyser (Micromeritics Gemini 2360, USA). Catalytic reaction for hydrogen production Different TiO2 (0.1, 0.3, 0.5, 1 and 2 g/L) amounts were tested to determine the optimum concentration of catalyst that generates the highest H2 production rate. Each concentration was adjusted to be added to 500 ml of 6% (v/v) methanol/pure water solution placed in a glass reactor with a head space of 40 ml. The temperature of the reaction was controlled at 30 °C ± 1 °C using a water condenser submerged in the solution suspension (Figure 1). The solution was stirred using a magnetic stirrer and illuminated using a 15W UVA lamp (365-380 nm). In order to remove dissolved oxygen from the solution and the head space, a flow of dry N2 was purged into the reactor for 30 min prior to illumination. The reaction time was 5 hrs. Gas samples were removed from the reactor at specific time intervals and analysed using a gas chromatograph (GC/TCD) equipped with a capillary column (CP-PoraPLOT Q, 27.5 m x 0.53 mm x 20 µm, #CP7554, Varian Inc., CA, USA). Scotty gas standard was measured by mol % in N2 balance (1% H2, 1% O2, 1% CO2, 1% CH4 and 1% CO). After identifying the optimum concentration (0.3 g/L) of the catalyst, different Pt concentrations of 0.01, 0.05, 0.1 and 0.5% were loaded on the surface of TiO2. In order to determine the optimum Pt deposition amount on TiO2, hydrogen production reaction using different Pt/TiO2 catalysts was performed by following the same procedure described earlier for determining the optimum TiO2 concentration.

Temperature controller
Sampling port
N2 purging port
UV-A lamp
Magnetic bar
Stirrer
Figure 1. Photocatalytic reactor for hydrogen generation Photocatalytic organic removal for wastewater reuse with simultaneous photocatalytic hydrogen production The experiment was carried out using BTSE (biologically treated secondary effluent) drawn from a Gwanju sewage treatment plant (25,000 m3/d). Chemical oxygen demand, total nitrogen, total phosphorus and pH were 23.3 mg/L, 30.5 mg/L, 2.3 mg/L and 7.2, respectively. Ti-salt flocculation was conducted to remove large particle organic matter present in BTSE. After flocculation, sludge was incinerated at 600°C to produce TiO2 nanoparticles, while the supernatant (500 ml) was placed in the reactor used and described earlier in this study for H2 production. Produced TiO2 were loaded with 0.5% of Pt using the H2 reduction method (described before). Optimum Pt/TiO2 amount (0.3 g/L) was added to the supernatant in the H2 production reactor to study the effect of using building block, low MW acid and amphiphilic compounds as sacrificial reagent on the production of H2. The reaction was carried out for 12 hrs. Gas samples were removed from the reactor at specific time intervals and analysed using a gas chromatograph (GC/TCD) equipped with a capillary column (CP-PoraPLOT Q, 27.5 m*0.53 mm*20 µm, #CP7554, Varian Inc., CA, USA). Dissolved organic carbon (DOC) and molecular weight distribution (MWD) Dohrmann Phoenix 8000 UV-persulfate TOC analyzer equipped with an autosampler was used to measure the DOC. All samples were filtered through 0.45 µm membrane prior to the DOC measurement. High performance size exclusion chromatograph (HPSEC, Shimadzu Corp., Japan) with an SEC column (Protein-pak 125, Waters Milford, USA) was used to determine the MW distribution of organic matter. Standard solutions of different polystyrene sulfonates (PSSs) with known MW (210, 1800, 4600, 8000, and 18000 Da) were used to calibrate the equipment. Crossflow filtration set-up Figure 2 shows the schematic diagram of the cross-flow NF experimental setup. A cross-flow membrane filtration unit (Nitto Denko Corp., Japan) was used to determine the DOC and MWD of

particles in BTSE after NF (NE90), the characteristics of which are presented in Table 3. Contact angle measurements using the sessile drop method with a contact angle meter (Tantec, Co., USA) were used to determine membrane polarity; 20 µL of Milli-Q water was dropped onto the dried membrane surface and the contact angle was measured within approximately 10 s. The Zeta potential of membrane was measured by the electrophoresis method (ELS 8000 Otzca, Japan) using polylatex in 10 mM NaCl solution as a standard particle. The pH of the solution was adjusted with 0.1 N HCl and NaOH. The operating transmembrane pressure and cross-flow velocity were controlled at 300 kPa and 0.5 m/s by means of bypass and regulating valves. The Reynold’s number and shear stress at the wall were 735.5 (laminar flow) and 5.33 Pa, respectively. Both permeate and concentrate were recycled back to the feed tank except for the sample withdrawn for DOC and MWD measurement. The characteristics of the feed may be considered as constant during the experiment. The experiment was conducted over a period of 12 hrs.
Feed tank Pump NF unit
P1
Pressure regulating valve
By-pass valve
Flow rate indicatorP2 (pressure gauge)
Permeate
Figure 2. Schematic drawing of cross-flow NF unit Table 3 Characteristics of NF90 membrane used
Code Material MWCO*
(Da)
Contact
angle (°)
Zeta potential at
pH 7 (mV)
Roughness
(nm)
NE90 meta-phertylene diamine
based polyamides 200 50.6 -50.5 43
* MWCO: molecular weight cut off
RESULTS AND DISCUSSION Characteristics of TiO2 and Pt/TiO2 produced from the incineration of dye wastewater TiCl4 flocculated sludge Crystal structures of the catalysts studied (identified by XRD patterns) are shown (comparatively) in Figure 3. XRD patterns were used to identify the particle structure of the TiO2 produced from the incineration at 600oC of dye wastewater TiCl4 flocculated sludge as well as the Pt/TiO2 deposited with different Pt concentrations. Catalysts (TiO2 and 0.01, 0.05, 0.1 and 0.5% Pt/TiO2) showed the dominant anatase peaks at 2θ = 25°, 38°, 48°, 54°, and 55° (Figure 4). It is noteworthy mentioning that no peak of platinum at 2θ = 40° was observed in the case of Pt/TiO2. The surface area of TiO2 nano-particles produced from the incinerated sludge was 71 m2/g.

2 theta
0 20 40 60 80
Inte
nsity
(a.u
.)
0
500
1000
1500
2000
2500
3000
3500
4000
TiO2
0.01%-Pt/TiO2
0.05%-Pt/TiO2
0.1%-Pt/TiO2
0.5%-Pt/TiO2
Figure 3. XRD patterns of TiO2 and 0.01, 0.05, 0.1 and 0.5% Pt/TiO2. The TEM micrograph of the Pt particles is illustrated in Figure 4. The particle size of the Pt particles was measured to be around 3–5 nm. The picture shows a relatively uniform dispersion of tiny platinum particles onto the surface of TiO2 particles. As shown in Figure 4, the larger boundary represents TiO2 with the size distribution of around 100–150 nm in diameter, and the relatively uniform distributed dark patches on the surface of the TiO2 particles are platinum. These two types of particles, i.e., TiO2 and Pt particles can be clearly distinguished because of their different electron density when exposed to electron beam.

(a) 0%
(b) 0.01%
(c) 0.05%
(d) 0.1%
(e) 0.5%
Figure 4. TEM images of TiO2 deposited with (a) 0%, (b) 0.01%, (c) 0.05%, (d) 0.1%, (e) 0.5% of Pt. Hydrogen production using TiO2 and Pt/TiO2 Effect of TiO2 amount Figure 5(a) shows the effect of TiO2 concentration on its photocatalytic activity for H2 production by photocatalytic reforming of methanol. The amount of H2 generated by TiO2 produced from the incineration of dye wastewater flocculated sludge was the highest for the concentration of 0.3 g/L of catalyst. 191 μmol of H2 by photocatalytic reforming of methanol with 0.3 g/L TiO2 was produced after 5 hrs of photocatalytic reaction. A significant increase in hydrogen production was observed when the concentration of catalyst was increased from 0.1 g/L to 0.3 g/L. But when the amount of TiO2 was further increased the production of H2 decreased. This can be caused by: i) the decrease in the availability of active sites on the TiO2 surfaces, ii) or the decrease in light absorption due to high catalyst concentration in the suspension. In the first case, a small portion of TiO2 will be present near the reactor wall and absorb the incident light from lamps, while the rest of particles will be shaded in the middle of the suspension. In the second case, particles agglomeration caused by high TiO2 concentrations will cause light scattering and minimize the light penetration depth in the suspension [21]. Low catalyst concentration (0.1g/L) was insufficient to allow the efficient absorption of the incident light and produce high H2 amounts, while high concentrations (0.5, 1 and 2 g/L) decreased the photonic flux entering the irradiated solution that resulted in low H2 generation. Therefore, 0.3 g/L was found to be the optimum concentration of catalyst for H2 production by photocatalytic reforming of methanol.

Effect of Pt-loading amount Figure 5(b) shows the variation of H2 production by photocatalytic reforming of methanol in relation to Pt deposition concentration on the TiO2 produced from the incineration of dye wastewater flocculated sludge. To prevent the recombination, TiO2 produced from sludge was doped with Pt metal to hold electrons. These Pt-deposited TiO2 nanoparticles were placed in the photoreactor containing pure water and methanol. As the doping concentration of Pt (deposited) on TiO2 produced from dye wastewater sludge was gradually increased from 0.01% to 0.5%, the amount of H2 increased. The H2 amount with 0.5% Pt/TiO2 was 10201 μmol. The increase in H2 production rate in relation to the increased Pt deposition on TiO2 may be due to effective loading of the co-catalyst (Pt) on the catalyst (TiO2) and the formation of increased Schottky barriers (potential barrier formed at a metal-TiO2 junction which has rectifying characteristics) between Pt and TiO2 [21].
Time (hr)
0 1 2 3 4 5
H2 a
mou
nt (m
icro
mol
)
0
50
100
150
2000.1 g/L TiO2
0.3 g/L TiO2
0.5 g/L TiO2
1.0 g/L TiO2
2.0 g/L TiO2
Time (hr)
0 1 2 3 4 5
H2
evol
utio
n (m
icro
mol
)
0
2000
4000
6000
8000
10000
120000.01% Pt/TiO2
0.05% Pt/TiO2
0.1% Pt/TiO2
0.5% Pt/TiO2
(a) (b)
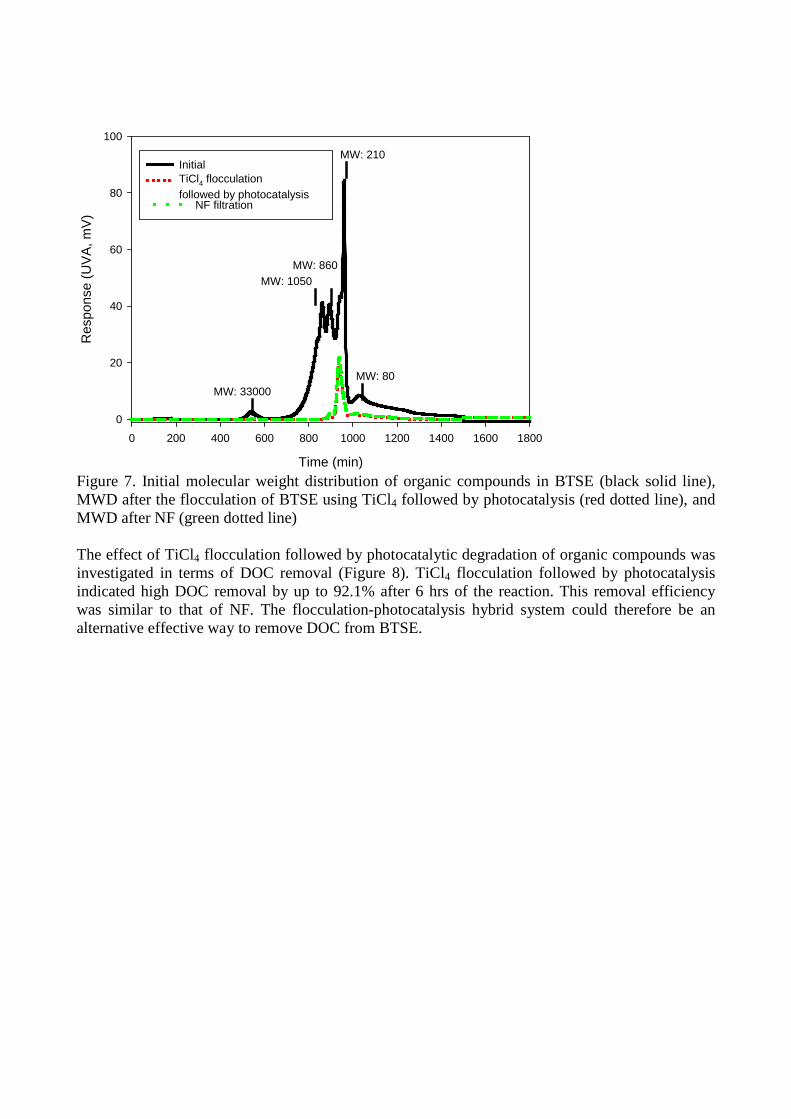
Figure 5. Effect of TiO2 concentration (a) and Pt deposition concentration on TiO2 for H2 production by photocatalytic reforming of methanol (6 vol.%) Photocatalytic organic removal for wastewater reuse with simultaneous photocatalytic hydrogen production MWD of BTSE included 34000 Da (biopolymers), 1100 Da (humic substance), 840 Da (building block), 210 Da (low MW acids) and less than 210 Da (amphiphilic). After Ti-salt flocculation, 34000 Da were completely removed and 1100 Da were partially removed, while the small MW could not be removed by flocculation (Figure 7). Similar findings were also found elsewhere [25]. The photoreactor was used to remove the remaining building block, low MW acids and amphiphilic compounds. After flocculation followed by photocatalytic organic removal, 92% of organic removal was accomplished. The photoreactor preferentially removed the majority of humic substance, building block and amphiphilic, while low MW acids partially remained. The removal trend of MWD of organic matter was compared with (NF) with 200 Da molecular weight cut off, which is the widely used technology for wastewater reuse. NF removed 93% of organic matter, whereas low MW acids slightly remained after NF filtration. This suggests that flocculation followed by photocatalytic organic removal can be an alternative technology to remove organic matter for wastewater reuse.
Time (min)
0 200 400 600 800 1000 1200 1400 1600 1800
Res
pons
e (U
VA, m
V)
0
20
40
60
80
100
MW: 80
MW: 210
MW: 860MW: 1050
MW: 33000
InitialTiCl4 flocculation followed by photocatalysis
NF filtration
Figure 7. Initial molecular weight distribution of organic compounds in BTSE (black solid line), MWD after the flocculation of BTSE using TiCl4 followed by photocatalysis (red dotted line), and MWD after NF (green dotted line) The effect of TiCl4 flocculation followed by photocatalytic degradation of organic compounds was investigated in terms of DOC removal (Figure 8). TiCl4 flocculation followed by photocatalysis indicated high DOC removal by up to 92.1% after 6 hrs of the reaction. This removal efficiency was similar to that of NF. The flocculation-photocatalysis hybrid system could therefore be an alternative effective way to remove DOC from BTSE.

Time (hr)
0 2 4 6 8 10 12
C/C
0 of D
OC
0.0
0.2
0.4
0.6
0.8
1.0
1.2
TiCl4 flocculation followed by photocatalysisNF filtration
Figure 8. C/C0 of DOC variation of TiCl4 flocculation followed by photocatalysis (initial concentration = 6.5 mg/L; Pt/TiO2 concentration = 0.3 g/L; air = 25 L/min) Figure 9 shows the GC/TCD profiles of standard gas and the gas produced from the reaction of photocatalytic organic removal for wastewater reuse with simultaneous photocatalytic hydrogen production using 0.3 g/L of 0.5% Pt/TiO2. A large variety of organic compounds have been used as electron donors for photocatatlytic H2 production to improve H2 production, including alcohols, polyalcohols, sugars and organic acids (Patsoura et al., 2007). A number of previous studies have been conducted with only single organic sacrificial reagent. In this study, H2 production was monitored with simultaneous photocatalytic organic removal by using complex organic contaminants from BTSE. As previously mentioned, the remaining organic compounds after Ti-salt flocculation in BTSE were building block, low MW acid and amphiphilic. These compounds as a sacrificial agent were used to produce H2 in photoreactor. 0.3 g/L of 0.5%-Pt/TiO2 was added in the photoreactor with the supernatant after Ti-salt flocculation of BTSE. H2 production was marginal and CO2 production evolved from the photocatalytic reaction. This suggests that there are organic/inorganic inhibitors that scavenged H2 production.

Retention time (Min)
4 5 6 7 8
Inte
nsity
-600
-400
-200
0
200
400
600
800
1000
1200
0 time
1 hr
3 hr
6 hr
12 hr
O2
CO2
H2
CH4
Figure 9. Gas chromatogram produced measured by GC/TCD from standard gas (compounds are shown in solid vertical lines) and from the reaction of photocatalytic organic removal for wastewater reuse with simultaneous photocatalytic hydrogen production using 0.3 g/L of 0.5% Pt/ TiO2 produced from the incineration of BTSE flocculated sludge. CONCLUSIONS In conclusion, the optimum concentration of TiO2 produced from the incineration of dye wastewater flocculated sludge for H2 production by photocatalytic reforming of methanol (6% vol.) was identified to be 0.3 g/L. Additionally, the optimum amount of Pt deposited on TiO2 surface was determined which was found to be equal to 0.5%Pt/TiO2. The characterization of catalysts (TiO2 and 0.01, 0.05, 0.1 and 0.5% Pt/TiO2) produced from the incineration of the dye wastewater flocculated sludge and loaded with platinum by using the H2 reduction method showed the dominant anatase structure. The surface area of TiO2 produced from dye wastewater was 71 m2/g. TEM images indicated that the particle size of the Pt particles was around 3–5 nm and they were uniformly dispersed onto the surface of TiO2 particles (100–150 nm in diameter). Flocculation of BTSE followed by photocatalytic reaction can be used as an alternative technology for wastewater reuse in terms of organic removal. However, the remaining organic compounds after flocculation cannot be functioned as electron donors to improve H2 production. Further study could settle this issue between the simultaneous photocatalytic H2 production and photocatalytic organic removal while increasing UV intensity and/or identifying organic/inorganic scavengers to inhibit H2 production. Acknowledgements This study was funded by Centre for Seawater Desalination Plant (SeaHERO), ARC and internal
grants. This work was supported by Priority Research Centers Program through the National

Research Foundation of Korea (NRF) funded by the Ministry of Education, Science and
Technology (2009-0094057) and the Center for Photonic Materials and Devices at Chonnam
National University.
References 1. Okkerse C. and Van Bekkum H., Green Chemistry, (1999) 107-114. 2. Shafiee S. and Topal E., Energy Policy, 36 (2008)775-786. 3. Sato S. and White J. M., Chemical physics letters 72 (1980) 83-86. 4. Fujishima A. and Honda K., Nature 238 (1972) 37-38 5. Akikusa J. and Khan S.U.M., International Journal of Hydrogen Energy 22 (1997) 875-882. 6. Mishra P. R., Shukla P. K., Singh A. K. and Srivastava O.N., International Journal of Hydrogen Energy 28 (2003) 1089-1094. 7. Shaban Y. A. and Khan S. U. M., International Journal of Hydrogen Energy 33 (2008) 1118-1126. 8. Ji S. M., Jun H., Jang J. S., Son H. C., Borse P. H. and Lee J. S., Journal of Photochemistry and Photobiology A: Chemistry 189 (2007) 141-144. 9. Bard A. J., Journal of Physical Chemistry 86 (1982) 172-177. 10. Nada A. A., Barakat M. H., Hamed H. A., Mohamed N. R. and Veziroglu T. N., International Journal of Hydrogen Energy 30 (2005) 687-691. 11. Rayalu S. S., Dubey N., Labhsetwar N. K., Kagne S. and Devotta S., International Journal of Hydrogen Energy 32 (2007) 2776-2783. 12. Shon H. K., Vigneswaran S., Kim I. S., Cho J., Kim G. J., Kim J. B. and Kim J. H., Environmental Science and Technology 41 (2007) 1372-1377. 13. Ni M., Leung M. K. H., Leung D. Y. C. and Sumathy K., Renewable and Sustainable Energy Reviews 11 (2007) 401-425. 14. Yang Y. Z., Chang C. -H. and Idriss H., Applied Catalysis B: Environmental 67 (2006) 217-222. 15. Park J.W. and Kang M., International Journal of Hydrogen Energy 32 (2007) 4840-4846. 16. Ikuma Y. and Bessho H. International Journal of Hydrogen Energy 32 (2007) 2689-2692. 17. Alonso F., Riente P., Rodriguez-Reinoso F., Ruiz-Martinez J., Sepulveda-Escribano A. and Yus M., Journal of Catalysis 260 (2008) 113-118. 18. Sun W., Zhang S., Liu Z., Wang C. and Mao Z., International Journal of Hydrogen Energy 33 (2008) 1112-1117. 19. Choi H. J. and Kang M., International Journal of Hydrogen Energy 32 (2007) 3841-3848. 20. Tao C., Guopeng W., Zhaochi F., Gengshen H., Weiguang S., Pinliang Y. and Can L., Chinese Journal of Catalysis 29 (2008) 105-107. 21. Yi H., Peng T., Ke D., Ke D., Zana L. and Yan C., International Journal of Hydrogen Energy 33 (2008) 672-678. 22. Park M. S. and Kang M. Materials letters 62 (2008) 183-187. 23. Patsoura A., Kondarides D. I. and Verykios X. E., Catalysis Today 124 (2007) 94-102. 24. Galinska A. and Walendziewski J., Energy Fuels 19 (2005) 1143-1147. 25. Shon H.K., Vigneswaran S. and Snyder S.A., Critical Reviews in Environmental Science and Technology 36 (2006) 327-374.