determination of hydrogen atom concentration in the chooz
TRANSCRIPT

Determination of hydrogen atom concentration
in the Chooz gadolinium loaded scintillator
B. Lefievre
College de France, Laboratoire de Physique Corpusculaire, IN2P3-CNRS, F-75231 Paris CEDEX 05, France
L. Mikaelyan, V. Sinev
Institute of General and Nuclear Physics RRC "Kurchatov Institute", Kurchatov Sq 1, 123183 Moscow, Russia
Abstract
We report on a method of measurement of the number of hydrogen atoms per cm3 by mean of lifetime of neutrons issued from a 252Cf source, in gadolinium loaded scintillator . This is of great help for estimation of the normalisation of inverse beta-decay reaction induced by antineutrinos, for the experiment setting up now, near the Chooz reactor.
Keywords: Neutrino - Neutrino oscillation - Neutron lifetime - Neutron detector.
Nous presentons ici une methode de mesure du nombre d'atomes d'hydrogene par cm3 it partir de la mesure du temps de vie des neutrons issus d'une source de 252Cf dans une cible de scintillateur dope au gadolinium. Cette information permet un bonne estimation de la normalisation de la reaction beta-inverse induite par les antineutrinos, dans Ie cadre de l'experience d'oscillation des neutrinos pres du reacteur de Chooz.
1

1 Introduction
A precise knowledge of the absolute concentration n[H] of the hydrogen atoms in nuclear reactor antineutrino detectors with the inverse beta-decay
ii + p ~ n + e+
used as a detection reaction is often very important.
In the Rovno integral type detector WIND [1] used also in the IN2P3Kurchatov experiment at BUGEY, (1992-1994), to minimize uncertainties associated with poor knowledge of n[H], distilled water was used as a neutrino target. Neutrino induced neutrons were detected in sHe gas counters.
In case of gadolinium (Gd) loaded scintillator neutrino detectors, sufficient accuracy in n[H] could probably be achieved by the use of chemical methods but in practice these methods are not quite reliable in the hands of a physicist.
In the Rovno neutrino experiments, to find the hydrogen concentration in the Gd loaded scintillator spectrometer RONS, a physical method was used [2,3,4] :
First the detector tank (of 1 mS volume) was filled with the scintillator without Gd and neutron capture time distribution was measured. This measurement was done with the use of 2520f spontaneous neutron fission source situated in the center of the tank. The distribution was found to be exponential, as it should be since the neutron capture cross-section O"H obeys the 1/v law. The time constant of the distribution AH is related to the hydrogen atom density :
(1)
with O"H (0.3326 ± 0.0007) barn for a neutron velocity of Vn == 2200 m/s. Typical value of AH for hydrocarbon scintillators is [(180 - 200)p,S]-1.
In this way the quantity n[H] was found with sufficiently high accuracy and only after that, 4 liters of Gd concentrate soluti9n were added. This rv
addition didn't practically change the hydrogen concentration found in the previous stage.
In the case of the Chooz detector the same sequence of operations may be unrealistic in view of a much larger volume. Hence an attempt should be made to determine the hydrogen concentration in the prepared Gd loaded scintillator.
2

2 Zero approximation
252Cf fission neutron source is put in the center of zone 1 and neutron capture time distribution is measured. Zero time trigger IS given by fission fragrnents, counted in a Silicon detector in coincidence with prompt fission and neutron recoil signal in the scintillator.
In the zero approximation it is assumed :
- All fission neutrons are stopped inside the zone 1., are captured in the Gd or in the hydrogen and give rise to 8 MeV and 2,2rv
MeV gamma rays.
- All neutron capture event amplitudes fall in two separated time dependent peaks : H o(t), 1.0 - 3.0 MeV (neutron capture rate in hydrogen) Go(t), 3.0 - 11.0 MeV (neutron capture rate in gadolinium)
- Delayed 262Cf fission gammas are neglected.
2.1 Method
Evidently:
H o(t) = N(t) X AH , Go(t) = N(t) X AGd (2)
N(t) - number of neutrons in the scintillator at moment t, N(O) nI' , the average number of prompt neutrons per fission, AH is from Eqs (1), AGd(t) - probability per unit time of neutron capture in Gd. The last quantity strongly depends on neutron energy and hence on time during the thermalization period, as it can be seen from the Fig. 2.
There are two different methods to find n[H]. .
I Method.
Note that
(3)
and
d/dt{N x exp(AHt)} = -Go(t) x exp(AHt) (4)
Hence: 001 dt[Go(t) x exp(AHt)] np (5)
In Eqs (4) the only unknown quantity is AH.
3

II Method.
From Eqs. (2) and (3) one gets:
Ho(t) AH (6)Go(t) AGd
dHo(t)/dt _ -A - A (7)Ho(t) - H Gd
dGo(t)/dt == -A - A + d/dt[lnA ] (7')Go(t) H Gd Gd
The last term in (7') vanishes fort> 20JLs. Thus from (6) and (7), both AGd and AH are found. To feel the situation better suppose that the quantities Go and Hoare
measured and following results obtained (Eqs. 6, 7).
AGd 1 AH == 3(±0.S %) , A A == 50 JLs(±O.S %)
H + Gd
the TH == ).~ == 200JLs( ±1.0 %) is found. Note also that 252Cf neutron average number is given by
00
iip 1 dt[Ho(t) +Go(t)] (S)
So, in the framework of zero approximation: The measured quantity Go(t) is inserted in Eq. (5), and then the time
constant AH of Eq. (1) is found; 252Cf neutron multiplicity Tip is assumed to be known (Method ~).
Both Go(t) and H o(t) are measured and from (6) and (7) AH is found. At the same time the value of Tip is independently obtained (Method 2).
4

2.2 Neutron capture spatial and time distributions (Me simulation).
Number of absorbed A bsor bed in the Absorbed not neutrons first 100 ns in (n , ,)
H 24156 63 0 Gd 75641 8 0 C 167 55 22 N 24 2 22 0 12 12 12
Total 100000 140 56
Table 1. : Neutron absorption balance (Total 105 neutrons).
Radius, cm Absorbed outside the sphere Absorbed in the layer
0 99943* -
5 82633 17310 10 42358 40275 15 18638 23720 20 8137 10501 25 3693 4444 30 1783 1910 35 906 877 40 479 427 45 249 230 50 143 106 55 84 59 60 56 28
* 57 neutrons are absorbed via not (n, ,) reaction. Table 2. : Cf neutron absorption spatial distribution in zone 1.
(Total 105 neutrons) Neutrons absorbed in Gd + H through (n, ,) reaction outside concentric
spheres of radii R and in the spherical layers between them.
5

3
As can be seen from Tables 1. and 2., and in Fig 3, "'" 99.7 % of all 2520f neutrons are absorbed in Gd and hydrogen inside zone 1 at time greater than 100 ns after fission, and 99.9 %of them are captured well inside zone 1 of the detector.
Results on the time behaviour of quantities Ho(t), Go(t) andN(t) found by MO simulation are shown in the Fig. 4 a,b. To obtain AH and AGd instead of Eqs. 6 and 7 we use equivalent expressions:
Ho(t) Go(t) AH == N(t) , AGd(t) == N(t) ,
N(t) = to dt[Ho(t) +Go(t)l- N H(t) +NGd(t) (9)
with, N H(t), NGd(t) - total number of neutrons that are captured in H and in Gd in the time interval [t, 00].
Neutron capture in carbon and nitrogen is neglected here. The results for 5 X 10⁵ neutron stories are presented in the Fig. 5. To end this zero approximation Me experiment we consider data of the
Fig. 5 as "measured" and find a weighted average (AH) :
(AH) == (0.00513 ± 0.00002)p.s-l , Tn: == (195,0 ± 0.8)p.s
in good agreement with the "true" value of AH :
1022AH == 7 X X 2.2 X 105 ,X 0.332 X 10-24 == 0.00511p.s-l
Corrections
Effects which violate assumptions of the zero approximation should be considered and estimations of associated corrections done. .
The following problems will be accounted for:
- Mixing of H (n, i) and Gd (n, i) events stemming from resolution effects and i-ray escape off the zones 1 + 2 of the detector and their interaction with the acrylic vessel.
- Perturbations of the neutron, i, and scintillation light fields (shadow effect) caused by the 252Cf source construction materials.
- 252Cf spontaneous fission delayed i emission.
In this note however only the first of the listed problems is discussed.
6

3.1 Effect of resolution, acrylic vessel and escape of ,'s
It is useful to define three energy regions : o- 1 MeV - below the detection threshold.
Numbers ho x Ho of H(n,,) and gox Go of Gd.(n, ,) events here represent the lost neutrons events.
1 - 3 MeV - contains (1 - ho ) x Ho of H(n, ,) and g x Go of Gd(n, ,) events. > 3 MeV - contains (1 - go - g) x Go of Gd (n, ,) events.
Now instead of Eqs. (9) and (9') we have:
A' _ H'(t) (10)
H - N'(t)
where
H'(t) = (l-ho)xHo(t)+gxGo(t),N'(t) = (l-ho)xNH(t)+(I-go)xNGd(t)
Now we neglect terms which contain squares and products of small quantities such as ho,g ... and get:
, h N H(t) NGd(t) Go(t)J (11)AH = AH X l.L - ho x [1 - N(t)] + go x N(t) + 9 x H o(t)
In Eqs. (10,11) H'(t), G'(t),NH(t), NGd(t) and N(t) were have to be measured in the course of experiment.
To find ho,g and go we use Me simulation with Gd neutron capture, spectrum from Ref. [6]. _
The energy error was assumed to be a Gaussian with a mean square 0'(E).
O'(E) = 0.14 x v'E (MeV) (12)
while inhomogeneity of light collection was repres~nted by a Gaussian with a mean square O'in :
O'in = 0.05 x E (MeV) (13)
The scintillation light deficit [4,5] was also taken into account. The results are presented in Fig. 6 a,b and Table 3 which follows:
7

Energy region < 1 MeV 1 - 3 MeV > 3 MeV
hydrogen ho = 0.004 1 - ho 0.996 0 Gadolinium 90 = 0.0005 9 = 0.0075 1 - 90 -9 0.992
Table 3 : H (n, I) and Gd (n, I) events contribution to energy regions.
For Gd concentration 0.05 %, NGd: NH ~ 3 : 1 and Eqs (11) gives:
A~ = AH x(l - 0.75 x ho + 0.75 x 90 +9 x Go(t)J Ho(tY (14)
In Eqs. (11,13) no distinction between Go and G' etc. is done. The last term in Eq.(13) is the largest one. Though small ('" 2.3 %) in comparison with AH it is '" 2.5 times greater than the accuracy of AH we try to achieve.
The confidence in estimations quoted in Table 3 is not very high and corrections may in fact differ from what we expect. In this c.onnection an experimental check is desirable.
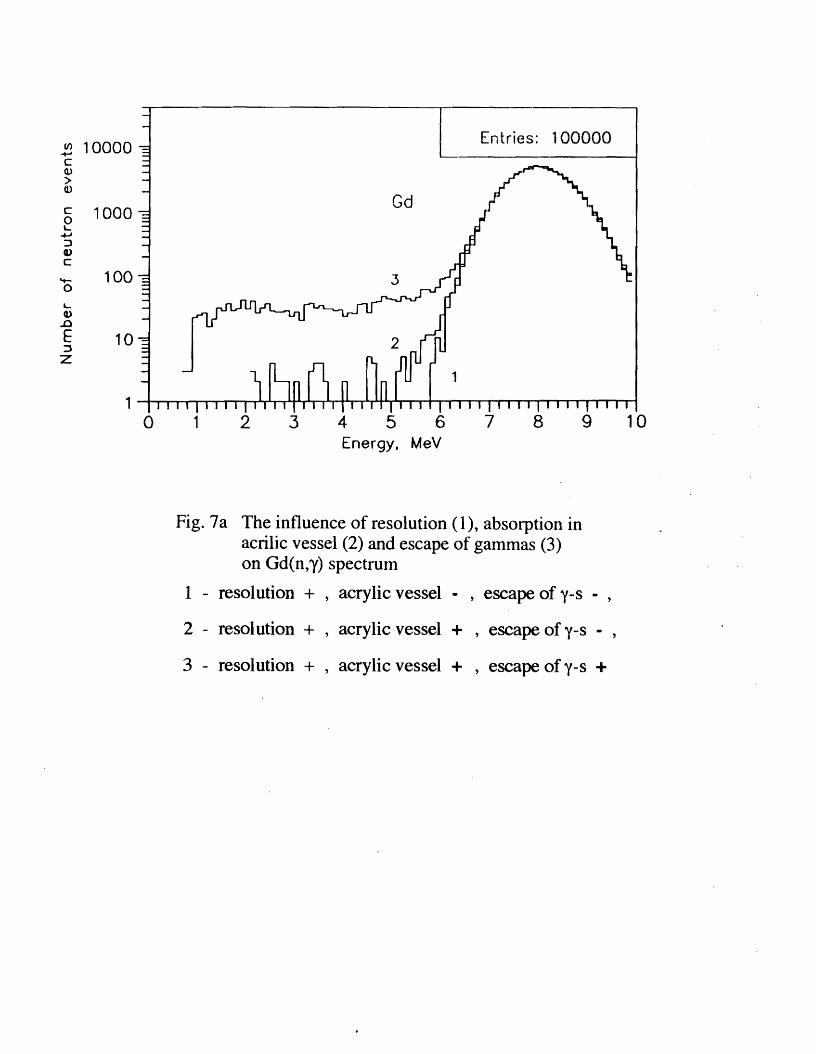
An analysis of the influence on the spectra of resolution effect, absorption of I's in the 8 mm walls of the acrylic vessel a~d their escape off the zones 1 . + 2 of the detector shows (Fig. 7 a,b) that the effect of escape is dominant. Thus an experimental check can be done by means of counting prompt coincidence between the I-spectrum of low-energy events of the zone 1 + 2 and high-energy (>'" 4 MeV) quanta detected in the zone 3. With the expected yield of '" 30 ¢>.e. per MeV in this part of the detector the procedure seems to be feasible.
Another approach to estimating the last term in Eq. (13) is to look for small time variatio~ of A~ in the first 15 JLS after fission which otherwise should be constant. 252Cf delayed fission I - radiation may however complicate this approach.
For the average 252Cf fission prompt-neutron number instead of Eq.(8) we have:
n~ = np x (1 - ath) , ath ~ 0.25ho + 0.75go (15)
with the correction ath ~ 0.001 for the detection threshold Eth = 1 MeV.
8

4
SOllIe data used in Me simulations
- Scintillator atom concentrations and neutron cross sections
Zone 1 scintillator Zone 2 scintillator I Neutron cross sectio:(0.05 % Gd) O'(n, I), b at 2200 mls
AtorIl concentrations, cm-3
H 7.00 X 10²² 7.57 X 10²² 0.332 0 3.62 x 10²² 3.65 X 10²² 0.0034 N 1.41 x 10¹⁹ 4.01 X 10¹⁸ 0.075 0 1.08 x 10²¹ 4.01 X 10¹⁸
Gd 1.62 x 10¹⁸ 0 45 900
2520f fission neutron energy spectrum S(E) :
S(E) I'.; (E)O.5 x exp( -E/1.44) , E in MeV
- Number of ,'s per energy interval (MeV) per 100 neutron captured in Gd:
o - 1 1 - 2 2 - 3 3 - 5 5 - 7 7 - 9 194 117 100 23 34 0.3
Conclusion
We conclude this study by the assumption that, even if we have in the future, to measure the number of protons in scintillator previously loaded with gadolinium, a good precision can be obtained, assuming reasonable resolution on light measurement. This allows us not to rely only on chemical methods, and thus to reduce the uncertainties about the systematics of our experiment.
9

References
1. A. Kuvshinnikov, L. Mikaelyan, S. Nikolaev, M. Skorokhvatov, A. Etenko. Precise measurement of the cross 'section ... JETP Lett., 1991, Vol: 54, N5, 253. :JT I;') LH
2. S. Bogatov, Yu. Dobrynin, L. Mikaelyan. Physical method of determination hydrogen concentration ... IAE-4482/2, 1987.
3. L. Mikaelyan, V. Sinev, V. Kopeikin in Chooz Coll. Meet., CharlevilleMezieres, 7-9 July 1993.
4. L. Mikaelyan in Chooz Coll. Meet., Paris 18-19 February 1994.
5. Yu. Dobrynin, L. Mikaelyan. Scintillation light deficite in hydrocarbons. Kurchatov Inst. preprint IAE-3229/2 1980.
6. Reactor Handbook, sec. edition, v.III, part B "Shielding", Interscience Pub. New York, 1962. and L.V. Groshev et al., Nuc1.Data Tab. A5 (1968).
10

Photomultiplier Gd-Ioaded Acrilic Gd-free scintillator internal vessel scintillator
The Chooz experiment Neutrino Detector Fig. 1

2000 Cf.)
:::i.
N
L.. Cl) a. f/)
1000....... C :J 0
0
o
T = 48.3 ±
50 100
0.1 Jls
2000
1000
0
150 200 250 300 time. J.ls
Fig.2 The neutron rate in Gd, 0.45 gil measured in Rovno, 1 m3 spectometer

----
(I')
c 0 L
-r-J :J Q)
C
'+0
L Q)
.D
E :l z
100000
10000
1000
o 10 20 30
Entries: 500000
a
Radius, em
Entries: 500000
c V) 100000 0 L
+oJ ::J (l)
C b '+- 10000 0
L Q)
.D E :l 1000 Z
o 10 20 30 40 60 Radius, em
Fig. 3 Neutron capture spatial distributions a) Number of neutrons captured in spheric layer (R,R+5 cm) b) Number of neutrons captured outside the sphere of radius R

Entries: 50000010000
L.. Q) a. U) 1000......, C :::l o (J
100
o 20
a
40 60 80 100 120 140
time. J.Ls
UJ C o "
-+J :l Q)
c '+o ' Q)
.D
E :::l Z
40 60 80 100 120 140 time. Jls
Fig. 4 a) Neutron capture rates: 1 - in Hydrogen ( Ho(t) ) 2 - in Gadolinium ( Go{t) )
b) Number of neutrons in the scintillator at time t (N(t) )
100000
Entries: 500000
b
o 20

0.0060
~ 0.0055 c o
+J (f)
C o o 0.0050 v E
+i
~ 0.0045 Ol o "
"U ~
I 0.0040 o
Entries: 500000
Mean AH = (5.13+-0.02) 10-3
20 40 60 80 100 time, J..Ls
Fig. 5 Determination of AH

Entries: 100000(f) +' 10000 C a.> ,, > a.> '",
" 'Ic H 0 1000 ," ,
... ......, ..f
:::J • Q) .'• c
I• 't-0 100 La.> a
Gd
.0 E :J 10z
0 1 2 3 4 5 6 7 8 9 10 Energy, MeV
100000 (f)......, C Q)
> 10000Q)
c 0 +' :J Q) 1000 C
't
0
LQ) 100
..0
E :J
Z 10
•I
•I,--r----------------------, I
I II
I
H I GdI, I I I, bI
I I
I
Entries: 100000
0 1 2 3 4 5 Energy,
6 MeV
7 8 9 10
Fig. 6 Differential (a) and integral (b) spectra of neutron capture gamma events in scintillator
Entries: 100000If)
+-' 10000 C Q)
>Q.)
0 c 1000 '
+J ::l Q) C
"+- 100 0
L.. Q) .0
E 10::l
Z
1 0 1 2 3 4 5 6 7 8 10
Gd
3
9 Energy, MeV
Fig.7a The influence of resolution (1), absorption in acrilic vessel (2) and escape of gammas (3) on Gd( n, y) spectrum
1 - resolution + , acrylic vessel - , escape of y-s • ,
2 - resolution + acrylic vessel + escape of y-s - ,
3 - resolution + , acrylic vessel + , escape of y-s +

en -+J 10000 C Q)
>Q)
c 10000 L.
+-I ::J Q)
C
...... 100 0 L. Q)
..c E 10:l
Z
1 0 1 2 3 4 5 6 7 8 9
Entries: 100000
H
Energy, MeV
Fig. 7b The influence of resolution (1), absorption in acrilic vessel (2) and escape of gammas (3) on H(n;y) spectrum
1 - resolution + , acrylic vessel - , escape of y-s
2 - resolution + , acrylic vessel + , escape of y-s - ,
3 - resolution + , acrylic vessel + , escape of y-s +