the effect of hydrogen ion concentration … · the effect of hydrogen ion concentration and of...
TRANSCRIPT
THE EFFECT OF HYDROGEN ION CONCENTRATION AND OF INHIBITING SUBSTANCES ON UREASE.
FURTHER STUDY ON THE MODE OF ENZYME ACTION.
BY DONALD D. VAN SLYKE AND GOTTHARD ZACHARIAS.
(From the Hospital of the Rockefeller Institute for Medical Research, New York.)
(Received for publication, July 14, 1914.)
It has long been known that some enzymes act best only in alkaline media, others in acid, and still others in neutral, but in recent years the exact work of Sorensen, Michaelis,* and Rona has shown that enzymes are in fact so sensitive to the reaction of the solutions in which they are dissolved that an exact study of their modes of action is hardly possible without taking this factor into account and controlling it by accurate methods. With urease this factor is especially important, because the ammonium carbonate which constitutes the reaction product is decidedly alkaline. Consequently in the case of this enzyme the study of the effect of the reaction products is necessarily bound up with that of the effect of hydrogen and hydroxyl ion concentrations.
Armstrong and Horton2 showed that of the two reaction prod- ucts, ammonia and carbon dioxide, ammonia retarded the action of the enzyme, while carbon dioxide greatly accelerated it. From a study of the effects of amino-acids and other substances, they came to the conclusion that weak acids as a rule accelerate the action of the enzyme.
Marshall has systematically tested the effect of varying con- centrations of hydrochloric acid and sodium hydrate on the action of urease.3 Hydrochloric acid up to 0.001 N concentration did not depress the amount of ammonia formed in an hour by a
1 In Oppenheimer: Handbuch cl. Biochemie, Erggnzungsband, 1913. 2 Armstrong and Horton: Proc. Royal Sot., lxxxv, p. 118, 1912. 3 Marshall: this Journal, xiv, p. 351, April 1914.
181
by guest on July 30, 2018http://w
ww
.jbc.org/D
ownloaded from
I82 Effect of H+ Concentration on Urease
given amount of enzyme acting on an excess of urea, but greater concentrations retarded the action, 0.005 N entirely preventing it. Sodium hydrate in 0.002 N concentration depressed the reaction rate, and the depression increased with alkali concentrations, 0.02 N entirely inhibiting. That the enzyme is destroyed by the higher concentrations of acid and alkali tested was shown by the fact that after neutralization the activity of the enzyme was not restored. The above interesting results do not, however, indi- cate the Hf concentration at which the enzyme acts best, nor the quantitative effect of different degrees of deviation from the optimum. The extract contains salts and is rich in proteins, and, as Marshall points out, some of these acting as buffers could neutralize to a large extent the minute amounts of acid and alkali present. The amounts of hydrochloric acid were, furthermore, so small in proportion to the ammonia formed, that the first trace of the latter would neutralize all of the mineral acid, and the reaction would then go on as though none had been added. The initial rate of the reaction would, therefore, in the acid solutions have to be very greatly depressed in order to markedly affect the final result.
In our work we have used phosphate mixtures to fix the hydrogen ion concentrations, and have controlled the latter in every experi- ment, not only at the beginning, but during the course and at the end of the reaction, by the Sorensen calorimetric method.4 Only when working in this manner can one accurately interpret results when dealing with a reaction that yields an alkaline product.
The primary purpose of our work was to determine the nature of the effect of the reaction product, ammonium carbonate, on the enzyme. Armstrong and Horton5 plotted the time curve of the reaction, and showed that the latter runs at a progressively slower rate for some time, after which the rate becomes nearly constant. Ammonium carbonate formation soon depresses the rate to a certain fraction of the initial velocity, but can not depress it much below this fraction. This fact is shown more fully in the pre- ceding paper.
4 Ergeb. cl. Physiol., xii, 1912. 5 Proc. Roy. Sot., lxxxv, p. 109, 1912.
by guest on July 30, 2018http://w
ww
.jbc.org/D
ownloaded from
D. D. Van Slyke and G. Zacharias ‘83
For this behavior two explanations were possible: 1. The ammonium carbonate has a specific action on the
enzyme, which it combines with or changes into a modified form only a fraction as reactive as the unaffected enzyme.
When the ammonium carbonate concentration has increased sufficiently to make the change complete, further formation of ammonium carbonate would naturally have no further effect and the velocity would approach a constant rate, as was found to be the case. Work which is reported in the following pages leaves no doubt, however, that the following explanation is the true one.
2. The ammonium carbonate effect is chiefly one of alkalinity. The carbonate renders the solution too alkaline for optimum activity of the enzyme. The fact that as the ammonium car- bonate concentration becomes greater the effect of a given added amount becomes less and less, until finally the reaction rate becomes almost independent of further ammonium carbonate increase, can be explained from the nature of the carbonate as a “buffer” salt. As is well known, the H+ concentration of solutions of these salts or mixtures (phosphates, acetates, etc.), .which owe their acidity or alkalinity to the weakness of either the basic or acid radicle, is but little affected by increasing the concen- tration beyond a certain point. Both the chemical nature of ammonium carbonate and its effect on the urease lead us to expect from it a similar behavior.
In order to test the point experiments were necessary to deter- mine :
1. The H+ concentrations of ammonium carbonate solutions in concentrations ranging over those obtained by the enzyme action.
2. The effect on the enzyme of the H+ concentrations obtained. The most direct and satisfactory means of testing the first point
were offered by determining directly the H+ concentration of reacting urea-enzyme solutions. Determinations on solutions of so-called ‘(pure” ammonium carbonate are not satisfactory, be- cause the prepared carbonate is a mixture of carbonate, bicar- bonate, and carbamate.
by guest on July 30, 2018http://w
ww
.jbc.org/D
ownloaded from
134 Effect of H+ Concentration on Urease
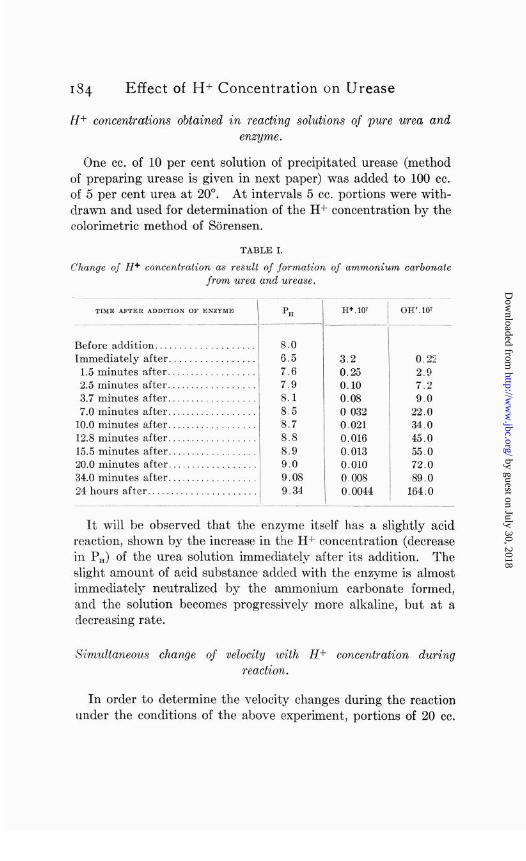
El+ concentrations obtained in reacting solutions of pure urea and enzyme.
One cc. of 10 per cent solution of precipitated urease (method of preparing urease is given in next paper) was added to 100 cc. of 5 per cent urea at 20”. At intervals 5 cc. portions were with- drawn and used for determination of the H+ concentration by the calorimetric method of Sbrensen.
TABLE I.
Change of H+ concentration as result of formation of ammonium carbonate from urea and urease.
TIME AFTER ADDITION OF ENZYME PSI H+ ,107
-
Before addition .................... Immediately after .................
1.5 minutes after. ................. 2.5 minutes after .................. 3.7 minutes after .................. 7.0 minutes after ..................
10.0 minutes after .................. 12.8 minutes after .................. 15.5 minutes after ................. 20.0 minutes after ................. 34.0 minutes after ................. 24 hours after .....................
8.0 6.5 7.6 7.9 8.1 8.5 8.7 8.8 8.9 9.0 9.08 9.34
3.2 0.25 0.10 0.08 0 032 0.021 0.016 0.013 0.010 0.008 0.0044
I- OH’.lO’
0.22 29 7.2 90
22.0 34.0 45 0 55.0 72.0 89.0
164.0
It will be observed that the enzyme itself has a slightly acid reaction, shown by the increase in the H+ concentration (decrease in P,) of the urea solution immediately after its addition. The slight amount of acid substance added with the enzyme is almost immedia,tely neutralized by the ammonium carbonate formed, and the solution becomes progressively more alkaline, but at a decreasing rate.
Simultaneous change of velocity with Hf concentration during reaction.
In order to determine the velocity changes during the reaction under the conditions of the above experiment, portions of 20 cc.
by guest on July 30, 2018http://w
ww
.jbc.org/D
ownloaded from
D. D. Van Slyke and G. Zacharias 185
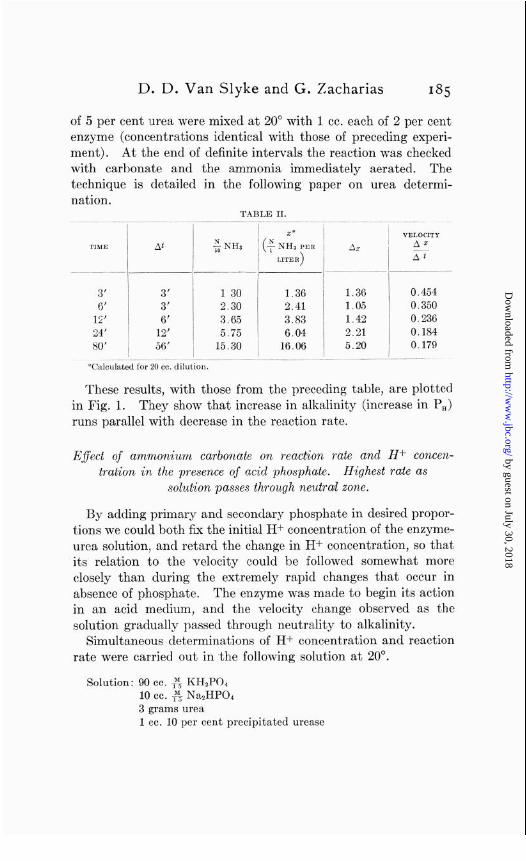
of 5 per cent urea were mixed at 20” with 1 cc. each of 2 per cent enzyme (concentrations identical with those of preceding experi- ment). At the end of definite intervals the reaction was checked with carbonate and the ammonia immediately aerated. The technique is detailed in the following paper on urea determi- nation.
TABLE II. -
TIME At ; NHa
3’ 3’ 6’ 3’
If’ 6’ 24’ 80’ j ii:
*Calculated for 20 DC. dilu
1 30 2.30 3.65 5.75
15.30
/( !-
’ 1.36 I 36 2.41 1 05 3.83 1.42 6.04 2.21
16.06 5.20
0.454 0.350 0.236 0.184 0.179
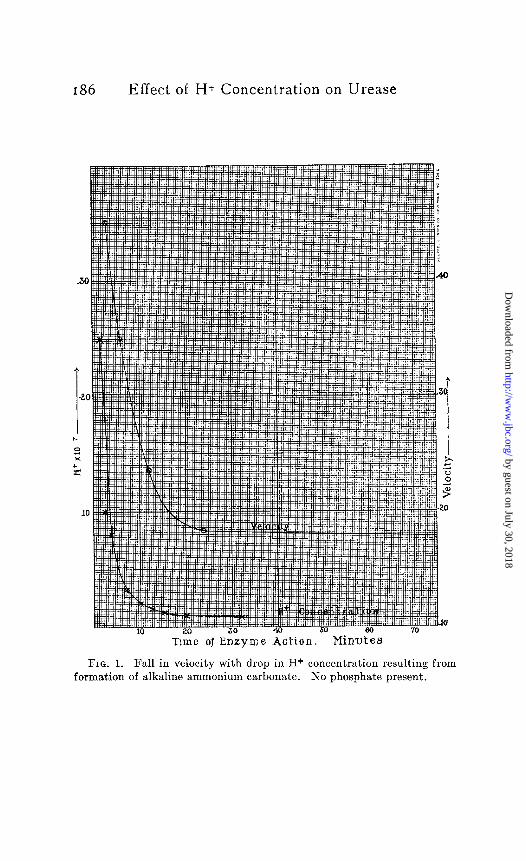
These results, with those from the preceding table, are plotted in Fig. 1. They show that increase in alkalinity (increase in P,) runs parallel with decrease in the reaction rate.
E$ect of ammonium carbonate on reaction rate and H+ concen- tration in the presence of acid phosphate. Highest rate as
solution passes through neutrad zone.
By adding primary and secondary phosphate in desired propor- tions we could both fix the initial H+ concentration of the enzyme- urea solution, and retard the change in H+ concentration, so that its relation to the velocity could be followed somewhat more closely than during the extremely rapid changes that occur in absence of phosphate. The enzyme was made to begin its action in an acid medium, and the velocity change observed as the solution gradually passed through neutrality to alkalinity.
Simultaneous determinations of H+ concentration and reaction rate were carried out in the following solution at 20“.
Solution: 90 cc. $$ KHtPO, 10 cc. & NasHPOd 3 grams urea 1 cc. 10 per cent precipitated urease
by guest on July 30, 2018http://w
ww
.jbc.org/D
ownloaded from
186 Effect of H+ Concentration on Urease
Trme of Enzyme Action. Minwt es
FIG. 1. Fall in velocity with drop in H+ concentration resulting from formation of alkaline ammonium carbonate. No phosphate present.
by guest on July 30, 2018http://w
ww
.jbc.org/D
ownloaded from
D. D. Van Slyke and G. Zacharias 187
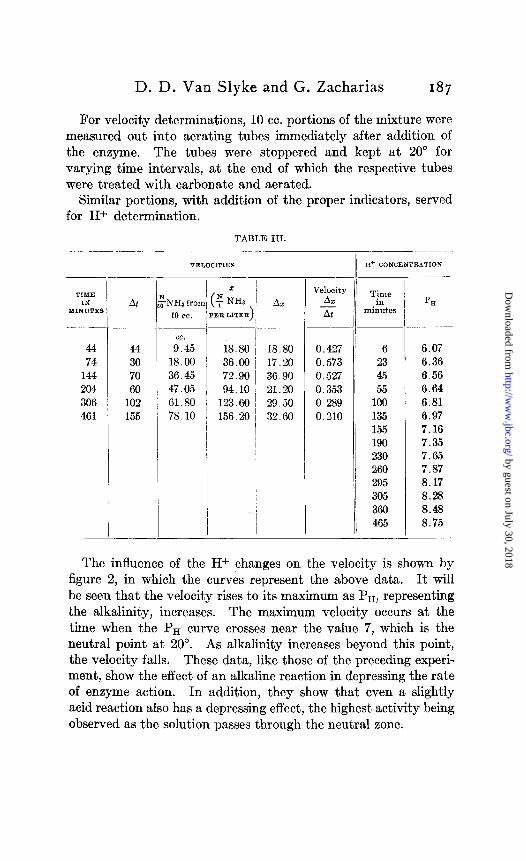
For velocity determinations, 10 cc. portions of the mixture were measured out into aerating tubes immediately after addition of the enzyme. The tubes were stoppered and kept at 20’ for varying time intervals, at the end of which the respective tubes were treated with carbonate and aerated.
Similar portions, with addition of the proper indicators, served for H+ determination.
TABLE III.
At
44 44 74 30
144 70 204 60 306 102 461 155
‘NHzfrom 1 10 cc. x
cc.
9.45 18.00 36.45 47.05 61.80 78.10
18.80 / 18.80 0.42 36.00 I 17.20 0.57 72.90 1 36.90 0.52 94.10
1 21.20 0.35
123.60 29.50 0 28 156.20 / 32.60 0.21
Veloci AZ - At
Time in
minutes
6 6.07 23 6.36 45 6.56 55 6.64
100 6.81 135 6.97 155 7.16 190 7.35 230 7.65 260 7.87 295 8.17 305 8.28 360 8.48 465 8.75
PIi
The influence of the H+ changes on the velocity is shown by figure 2, in which the curves represent the above data. It will be seen that the velocity rises to its maximum as Pn, representing the alkalinity, increases. The maximum velocity occurs at the time when the Pn curve crosses near the value 7, which is the neutral point at 20”. As alkalinity increases beyond this point, the velocity falls. These data, like those of the preceding experi- ment, show the effect of an alkaline reaction in depressing the rate of enzyme action. In addition, they show that even a slightly acid reaction also has a depressing effect, the highest activity being observed as the solution passes through the neutral zone.
by guest on July 30, 2018http://w
ww
.jbc.org/D
ownloaded from
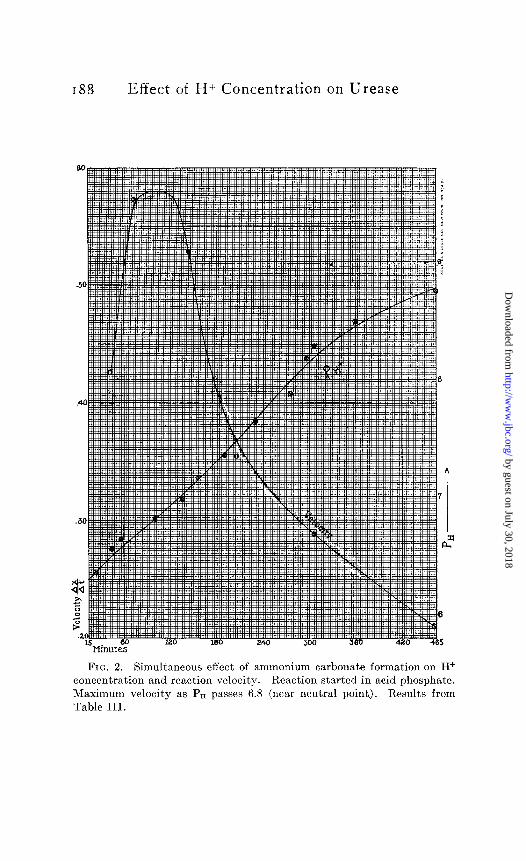
188 Effect of H+ Concentration on Urease
FIG. 2. Simultaneous effect of ammonium carbonate formation on H+ concentration and reaction velocity. Reaction started in acid phosphate. Maximum velocity as P, passes 6.8 (near neutral point). Results from Table III.
by guest on July 30, 2018http://w
ww
.jbc.org/D
ownloaded from
D. D. Van Slyke and G. Zacharias 189
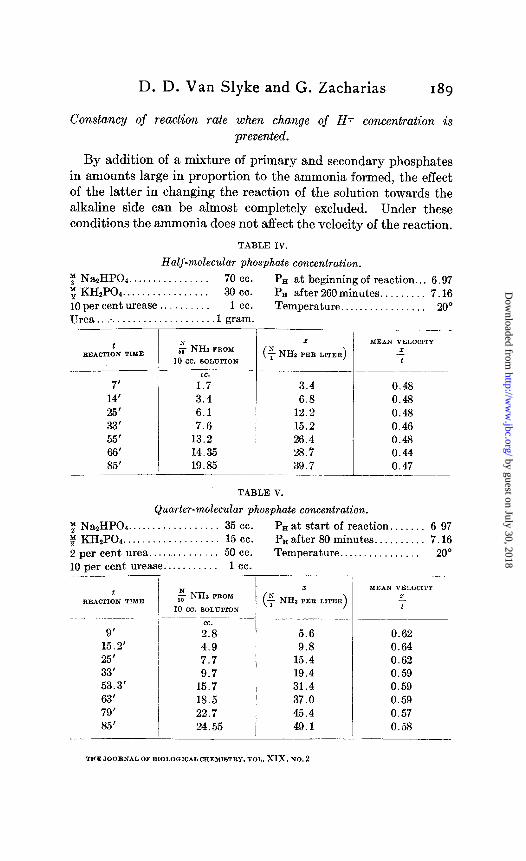
Constancy of reaction rate when change of H+ concentration is prevented.
By addition of a mixture of primary and secondary phosphates in amounts large in proportion to the ammonia formed, the effect of the latter in changing the reaction of the solution towards the alkaline side can be almost completely excluded. Under these conditions the ammonia does not affect the velocity of the reaction.
TABLE IV.
Half-molecular phosphate concentration. F NalHP04.. . . . 70 cc. P, at beginning of reaction.. . 6.97 ; KHIPOd.. . . . . . 30 cc. P= after 260 minutes.. . 7.16 10 per cent urease . . 1 cc. Temperature.. . . . . . . 20” Urea.. :_ . . . . 1 gram.
t RlCAclTON TIME
- -~
7’ 14’ 25’ 33’ 55’ 66’ 85’
$ NHs FROM IO cc. BOLUTION
cc. 1.7 3.4 6.1 7.6
13.2 14.35 19.85
3.4 6.8
12.2 15.2 26.4 28.7 39.7 .-
0.48 0.48 0.48 0.46 0.48 0.44 0.47
TABLE V.
Quarter-molecular phosphate concentration.
; NalHP04 .................. 35 cc. PH at start of reaction ....... 6 97 f KH2P04 ................... 15 cc. Pa after 80 minutes .......... 7.16 2 per cent urea .............. 50 cc. Temperature ................ 20” 10 Der cent urease ........... 1 cc.
t
REACTION TIME
9’ 15.2’ 25’ 33’ 53.3’ 63’ 79’ 85’
lfc;:;;-s,N (+ NHa is, LITER)
cc. 2.8 5.6 4.9 9.8 7.7 15.4 9.7 19.4
15.7 31.4 18.5 37.0 22.7 45.4 24.55 49.1
0.62 0.64 0.62 0.59 0.59 0.59 0.57 0.58
by guest on July 30, 2018http://w
ww
.jbc.org/D
ownloaded from
190 Effect of H+ Concentration on Urease
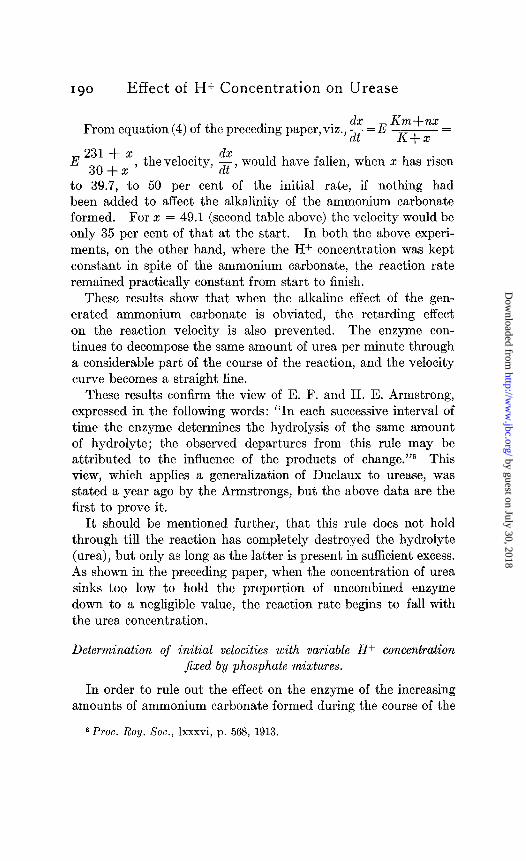
From equation (4) of the preceding paper, viz., X = ax EZgL
E ?:&I<, thevelocity, $, would have fallen, when x has risen
to 39.+, to 50 per cent of the initial rate, if nothing had been added to affect the alkalinity of the ammonium carbonate formed. For x = 49.1 (second table above) the velocity would be only 35 per cent of that at the start. In both the above experi- ments, on the other hand, where the H+ concentration was kept constant in spite of the ammonium carbonate, the reaction rate remained practically constant from start to finish.
These results show that when the alkaline effect of the gen- erated ammonium carbonate is obviated, the retarding effect on the reaction velocity is also prevented. The enzyme con- tinues to decompose the same amount of urea per minute through a considerable part of the course of the reaction, and the velocity curve becomes a straight line.
These results confirm the view of E. F. and H. E. Armstrong, expressed in t.he following words: “In each successive interval of time the enzyme determines the hydrolysis of the same amount of hydrolyte; the observed departures from this rule may be attributed to the influence of the products of change.“” This view, which applies a generalization of Duclaux to urease, was stated a year ago by the Armstrongs, but the above data are the first to prove it.
It should be mentioned further, that this rule does not hold through till the reaction has completely destroyed the hydrolyte (urea), but only as long as the latter is present in sufficient excess. As shown in the preceding paper, when the concentration of urea sinks too low to hold the proportion of uncombined enzyme down to a negligible value, the reaction rate begins to fall with the urea concentration.
Determination of initial velocities with variable H+ concentration jixed by phosphate mixtures.
In order to rule out the effect on the enzyme of the increasing amounts of ammonium carbonate formed during the course of the
6 Proc. Roy. Sot., lxxxvi, p. 568, 1913.
by guest on July 30, 2018http://w
ww
.jbc.org/D
ownloaded from
D. D. Van Slyke and G. Zacharias 191
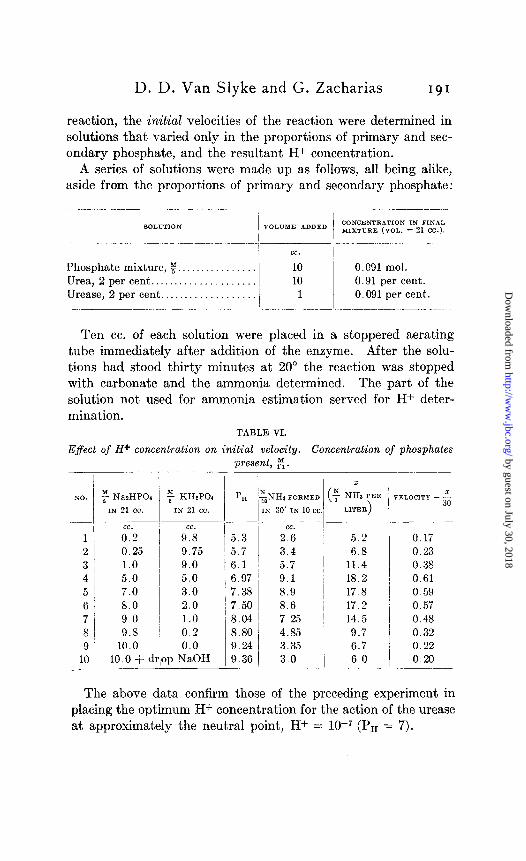
reaction, the initial velocities of the reaction were determined in solutions that varied only in the proportions of primary and sec- ondary phosphate, and the resultant Hf concentration.
A series of solutions were made up as follows, all being alike, aside from the proportions of primary and secondary phosphate:
SOLUTION VOLUME ADDED CONCENTRATION IN FINAL MIXTURE (VOL. = 21 cc.).
I
cc.
Phosphate mixture, y.. 10 O.CQl mol. Urea, 2 per cent.. . 10 0.91 per cent. Urease, 2 per cent.. .I 1 0.091 per cent.
Ten cc. of each solution were placed in a stoppered aerating tube immediately after addition of the enzyme. After the solu- tions had stood thirty minutes at 20” the reaction was stopped with carbonate and the ammonia determined. The part of the solution not used for ammonia estimation served for Hf deter- mination.
TABLE VI.
EF$ect of H+ concentration on initial velocity. Concentration of phosphates
50.
present, FT.
$ NmHP04 $ HHzPO4
IN 21 cc. IN 21 cc.
I 2 3 4 5 6 7
’ 1 lo I 10.0 + drop NaOH __~ .~ ------L.
cc.
0.2 0.25 1.0 5.0 7.0 8.0 90 9.8
10.0
cc. 9.8 9.75 9.0 5.0 3.0 2.0 1.0 0.2 0.0
P,
5.3 5.7 6.1 6.97 7.38 7.50 8.04 8.80 9.24 9.36
cc.
2.6 3.4 5.7 9.1 8.9 8.6 7 25 4.85 3.35 3.0
z
“- NHs PER 1 LITER >
5.2 6.8
11.4 18.2 17.8 17.2 14.5
9.7 6.7 6.0
O.li 0.23 0.35 0.61 0.59 0.57 0.48 0.32 0.22 0.20
The above data confirm those of the preceding experiment in placing the optimum H+ concentration for the action of the urease at approximately the neutral point, H+ = lo-’ (Pn = 7).
by guest on July 30, 2018http://w
ww
.jbc.org/D
ownloaded from
192 Effect of Hi- Concentration on Urease
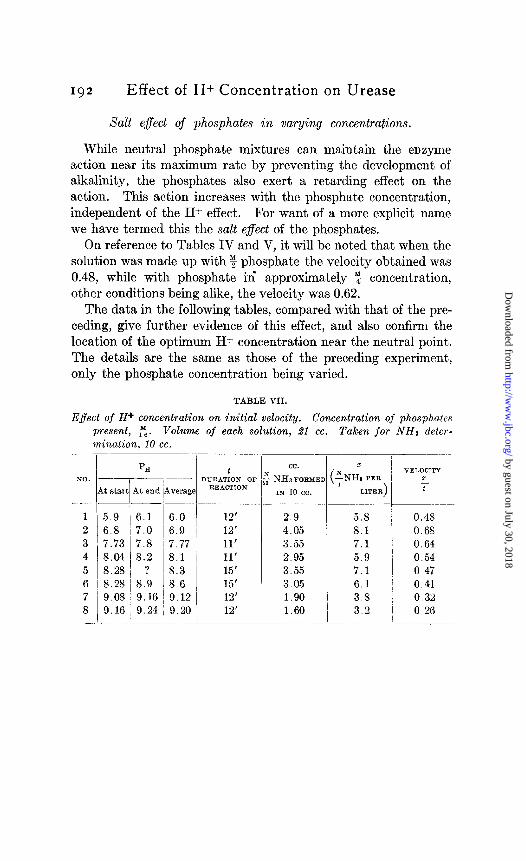
Salt e$ect of phosphates in varying concentrations.
While neutral phosphate mixtures can maintain the enzyme action near its maximum rate by preventing the development of alkalinity, the phosphates also exert a retarding effect on the action. This action increases with the phosphate concentration, independent of the H+ effect. For want of a more explicit name we have termed this the salt e$ect of the phosphates.
On reference to Tables IV and V, it will be noted that when the solution was made up with % phosphate the velocity obtained was 0.48, while with phosphate in’ approximately “y concentration, other conditions being alike, the velocity was 0.62.
The data in the following tables, compared with that of the pre- ceding, give further evidence of this effect, and also confirm the location of the optimum H+ concentration near the neutral point. The details are the same as those of the preceding experiment, only the phosphate concentration being varied.
TABLE VII.
Effect of H+ concentration on initial velocity. Concentration of phosphates
present, PC. Volume of each solution, di cc. Taken for NH3 deter- mination. 10 cc.
so.
1 2 3 4 5 6 7 8 .-
.- I P,
59 16.1 6.8 i 7.0
’ 7.73 7.8 8.04 8.2 8.28 / ? 8.28 i 8.9 9.08 9.16 9.16 9.24
6.0 6.9 7.77 8.1 8.3 8.6 9.12 9.20
1
e
I
i
t
D”RATIm-4 OF REACTION
.__--
12’ 12’ 11’ 11’ 15’ 15’ 12’ 12’
N so
_____ l- 2.9 5.8 i 4.05 8.1 )
3.55 7.1 2.95 5.9 I
3.55 7.1 , 1
3.05 6.1 1.90 3.8 1.60 I 3.2 1
0.48 0.68 0.64 0.54 0 47 0.41 0.32 0 26
by guest on July 30, 2018http://w
ww
.jbc.org/D
ownloaded from
D. D. Van Slyke and G. Zacharias 193
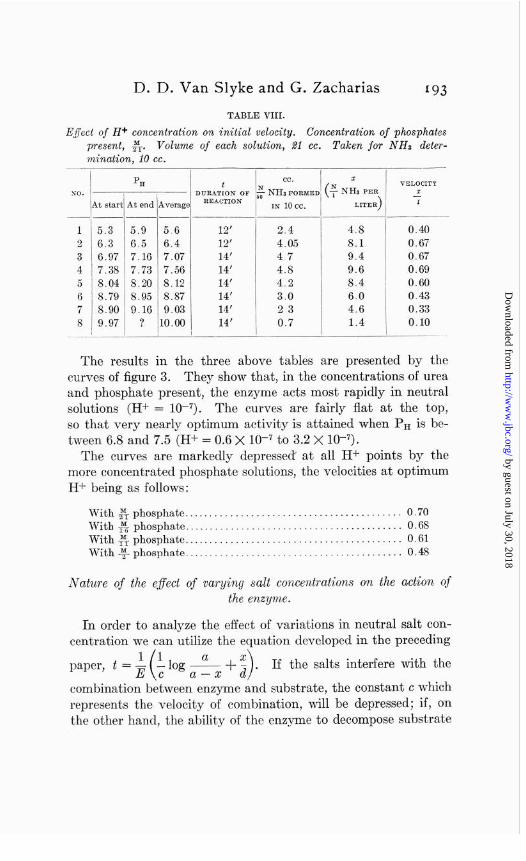
TABLE VIII.
E#ect of H+ concentration on initial velocity. Concentration of phosphates present, &. Volume of each solution, 21 cc. Taken for NH1 deter- mination, 10 cc.
I
Lt star1
NO.
A -_
1 2 3 4 5 6 7 8
4t end Averagt __-
5.9 5.6 6.5 6.4 7.16 7.07 7.73 7.56 8.20 8.12 8.95 8.87 9.16 9.03
? 10.00
t cc.
,URATION OF ; NHa FORM REACTION
IN 1occ.
5.3 6.3 6.97 7.38 8.04 8.79 8.90 9.97
12' 2.4 12' 4.05 14' 47 14' 4.8 14' 4.2 14' 3.0 14' 23 14' 0.7
4.8 0.40 8.1 0.67 9.4 0.67 9.6 0.69 8.4 0.60 6.0 0.43 4.6 0.33 1.4 0.10
~.-~~
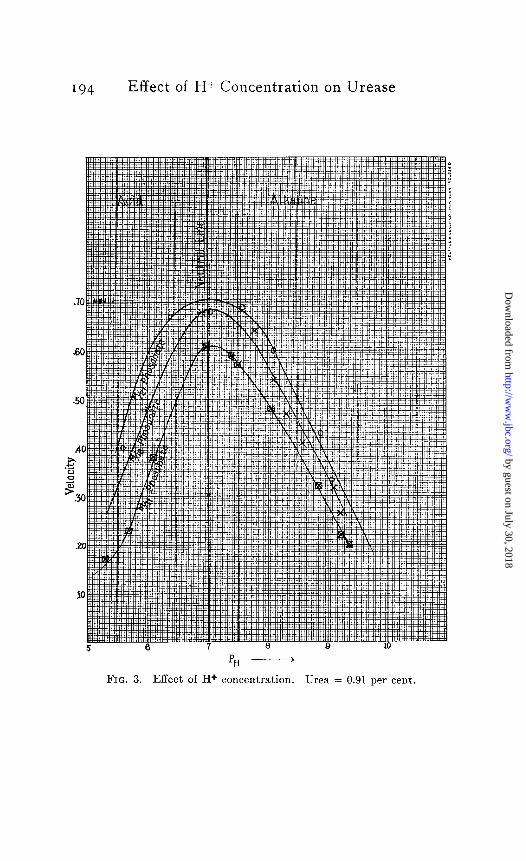
1 ‘h e results in the three above tables are presented by the curves of figure 3. They show that, in the concentrations of urea and phosphate present, the enzyme .acts most rapidly in neutral solutions (H+ = lo-‘). The curves are fairly flat at the top, so that very nearly optimum activity is attained when Pn is be- tween 6.8 and 7.5 (Hf = 0.6 X lo--’ to 3.2 X lo-‘).
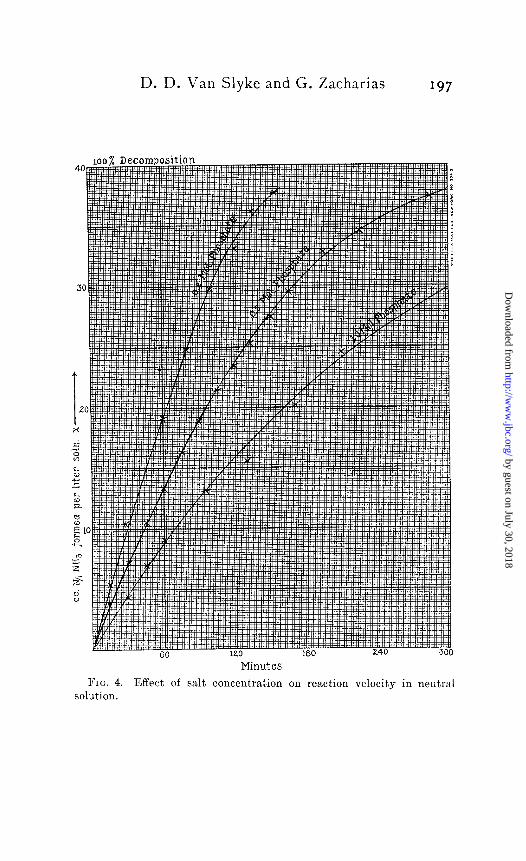
The curves are markedly depressed at all H+ points by the more concentrated phosphate solutions, the velocities at optimum H+ being as follows:
With & phosphate.. . . . . . . ................. 0.70 With & phosphate.. . . . . ................. 0.68 With & phosphate.. ................. 0.61 With -%j- phosphate.. . . . . ................. 0.48
Nature of the e$ect of varying salt concentrations on the action of the enzyme.
In order to analyze the effect of variations in neutral salt con- centration we can utilize the equation developed in the preceding
If the salts interfere with the
combination between enzyme and substrate, the constant c which represents the velocity of combination, will be depressed; if, on the other hand, the ability of the enzyme to decompose substrate
by guest on July 30, 2018http://w
ww
.jbc.org/D
ownloaded from
I94 Effect of H+ Concentration on Urease
FIG. 3. Effect of H+ concentration. Urea = 0.91 per cent.
by guest on July 30, 2018http://w
ww
.jbc.org/D
ownloaded from
D. D. Van Slyke and G. Zacharias 195
after combining with it is affected, the constant d, representing the velocity of the decomposition phase of the reaction, will be depressed. Complete inactivation of a portion of the enzyme will result in a proportional depression of both c and d.
The following series of experiments show that neutral phosphate depresses the combining constant c in direct proportion to the salt concentration. Sodium chloride also shows its effect almost entirely on c.
In each experiment 0.240 gram of urea with equimolecular amounts of KHzP04 and KzHP04 in the desired concentration, a,nd in the molecular proportions 1: 2 respectively, were dissolved in a 200 cc. flask, and diluted to 198 cc. The solution was brought to 20” in the bath, and 2.00 cc. of a 10 per cent solution of urease were added, the urease being the same preparation employed in the determination of c and d in the previous paper. The solution was mixed, and portions of 10 cc. were pipetted at once into 100 cc. test tubes which had already been brought to 20” in the bath. After varying intervals the tubes were removed from the bath and aerated into standard acid for a half minute (see technique of urine analysis, next paper). The enzyme action was then checked by addition of potassium carbonate, and the ammonia determined. The concentration of urea was 0.02 molecular, so the urea in 10 cc. would, if completely decomposed, yield 40 cc. of $5 ammonia, equivalent to 40 cc. of T ammonia from a liter. Therefore, in each series a = 40.
For determination of d (see preceding paper) the conditions were the same, except that the urea concentration was molecular (6 per cent). It was found that, under the conditions of all four series, this urea concentration is sufficiently high to be within the range where further increase is without effect on the velocity.
Under these conditions d = gL = fiG.
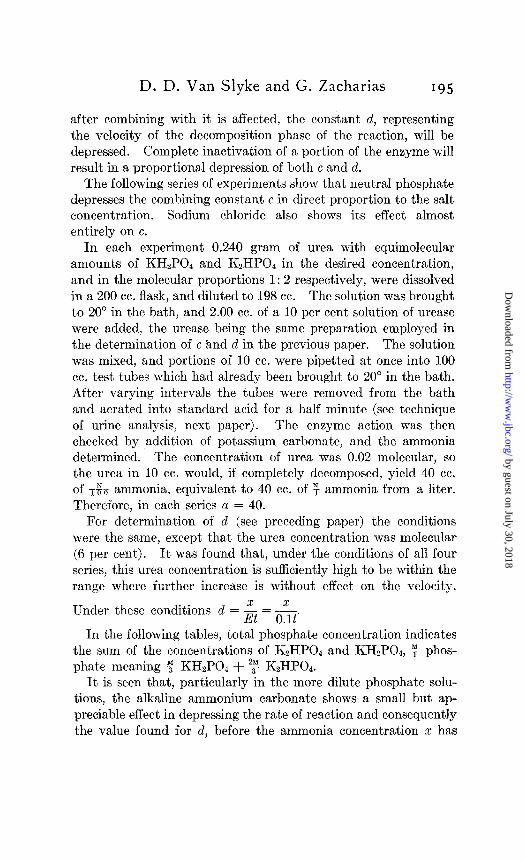
In the following tables, total phosphate concentration indicates the sum of the concentrations of KzHP04 and KHZPOI, 7 phos- phate meaning $ KHtPOk + “$ KZHPOJ.
It is seen that, particularly in the more dilute phosphate solu- tions, the alkaline ammonium carbonate shows a small but ap- preciable effect in depressing the rate of reaction and consequently the value found for d, before the ammonia concentration x has
by guest on July 30, 2018http://w
ww
.jbc.org/D
ownloaded from
196 Effect of H+ Concentration on Urease
TABLE IX.
Effect of salt concentration on value of d in the equation
t2 E ilog-&+; . ( >
a=2000.
A log a is negligible. c a-x
a==$= 5.
t x ’ d
30' 16.0 ! 5.34 60' 29.0 1 4.84 90' 44.6 j 4.95 ~.--___ dforx = 20,5.1
/- t 2 d1t x d t 5 d
20' 10.54 5.27 / 30' 12.4 4.12 35' 16.2 4.61 60' 31.00 5.17 60' 23.4 3.90 90' 41.2 4.58
137' 65.80 4.80 170' 62.2 3.66 140' , 62.6 4.46 ~___
dforx=20,5.2 \dforx=20,4.0 \dforx=20,4.6
TABLE X.
Effect of salt concentration on values of c in equation t = 0
a = 40 in all cases. E = 0.1. c = EdCx log 5. a-x -~--___--
t 2 c t X c t x c t x C
15 3.8 0.0058 301 4.4 0.00266 20 4.6 0.0053 30 7.24 0.0058 451 7.0 0.00303 40 9.2 0.0057 45 10.52 0.0055 60 9.1 0.00301 70 14.8 0.0055 60 13.28 0.0052 95 13.2 0.00280 loo 20.8 0.0058
80 24.8 0.0134 75 16.30 0.0052 130 15.5 0.00244 140 27.6 0.0063 100 29.8 0.0142 90 18.90 0.0050 170 20.2 1180 0.0067 0.00256 31.6 121 33.0 0.0135105 21.50, 0.0052
23.40' 0.0052 210, 24.5 0.00277 1317 38.0 0.0058
135 36.2 0.0159120 155 37.7 0.0153135 25.361 0.0051
13101 31.1 I+----~ 0.00280 1367 32.2 Average 0.0058 0.00247
~- 150 27.54 0.0053 'I-- Average. 0.0140165 29.58 0.0055 Average 0.0027 195 32.80 0.0057 /
225 34..54 0.0055 1 /
285 37.40 0.0056 1
by guest on July 30, 2018http://w
ww
.jbc.org/D
ownloaded from
D. D. Van Slyke and G. Zacharias ‘97
Mind es FIG. 4. Effect of salt concentration on reaction velocity in neutral
solution.
by guest on July 30, 2018http://w
ww
.jbc.org/D
ownloaded from
198 Effect of H+ Concentration on Urease
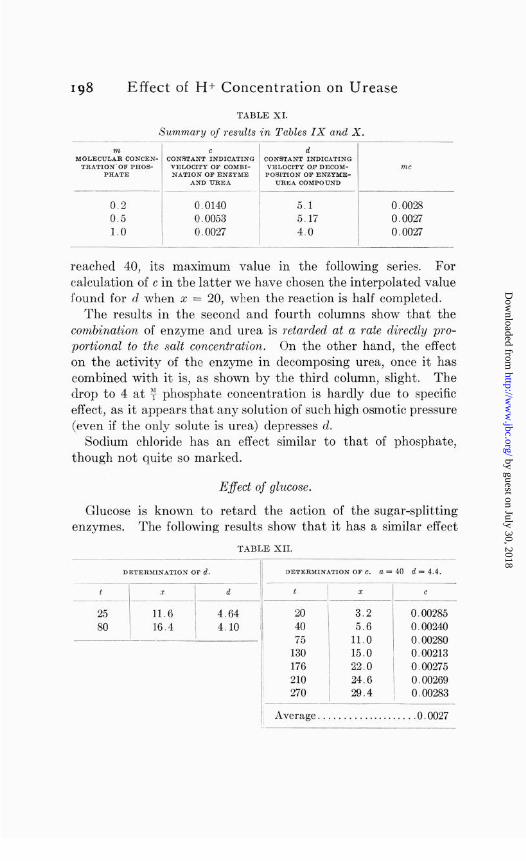
TABLE XI.
Summary of results in Tables IX and X.
0.2 0.0140 5.1 0.0028 0.5 0.0053 5 17 O.OQ27 1.0 0.0027 40 0.0027
reached 40, its maximum value in the following series. For calculation of c in the latter we have chosen the interpolated value found for d when II: = 20, when the reaction is half completed.
The results in the second and fourth columns show that the combination of enzyme and urea is retarded at a rate directly pro- portional to the salt concentration. On the other hand, the effect on the activity of the enzyme in decomposing urea, once it has combined with it is, as shown by the third column, slight. The drop to 4 at 7 phosphate concentration is hardly due to specific effect, as it appears that any solution of such high osmotic pressure (even if the only solute is urea) depresses d.
Sodium chloride has an effect similar to that of phosphate, though not quite so marked.
E$ect of glucose.
Glucose is known to retard the action of the sugar-splitting enzymes. The following results show that it has a similar effect
TABLE XII.
DETERMINATION cm d. DETERXMINbTION cm e. a = 40 d = 4.4.
1 z z /L-XII
25 11.6 3.2 0.00285 80 16.4 5.6 0.00240
11.0 0.00280
176 I 210 24.6 0.00269 270 , 29.4 , 0.00283
Average....................0.0027
by guest on July 30, 2018http://w
ww
.jbc.org/D
ownloaded from
D. D. Van Slyke and G. Zacharias I99
on urease, and that the retardation affects, as in the case of the salt effect, the process of combination of enzyme with urea.
Glucose was added in F concentration to a solution prepared as in the preceding experiments, and containing phosphate in $! concentration.
The glucose depresses c from 0.0053 to 0.0027, approximately one-half.
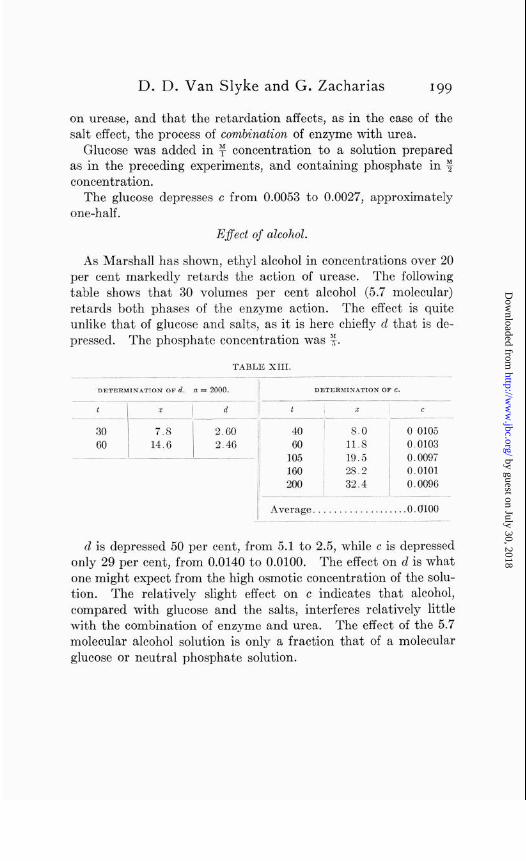
&$ect of alcohol.
As Marshall has shown, ethyl alcohol in concentrations over 20 per cent markedly retards the action of urease. The following table shows that 30 volumes per cent alcohol (5.7 molecular) retards both phases of the enzyme action. The effect is quite unlike that of glucose and salts, as it is here chiefly d that is de- pressed. The phosphate concentration was T.
TABLE XIII.
DETERMIN.~TION OF a. a = 2000.
t z I d (-.--
30 7.8 2.60 60 14.6 2.46
40 ’ SO 6o 11.8
105 ~ 19.5 160 / 28 2 200 1 32.4
c
0 0105 0.0103 0.0097 0.0101 0.0096
Average. . . . . . . . . .O .UlOO
d is depressed 50 per cent, from 5.1 to 2.5, while c is depressed only 29 per cent, from 0.0140 to 0.0100. The effect on d is what one might expect from the high osmotic concentration of the solu- tion. The relatively slight effect on c indicates that alcohol, compared with glucose and the salts, interferes relatively little with the combination of enzyme and urea. The effect of the 5.7 molecular alcohol solution is only a fraction that of a molecular glucose or neutral phosphate solution.
by guest on July 30, 2018http://w
ww
.jbc.org/D
ownloaded from
200 Effect of H+ Concentration on Urease
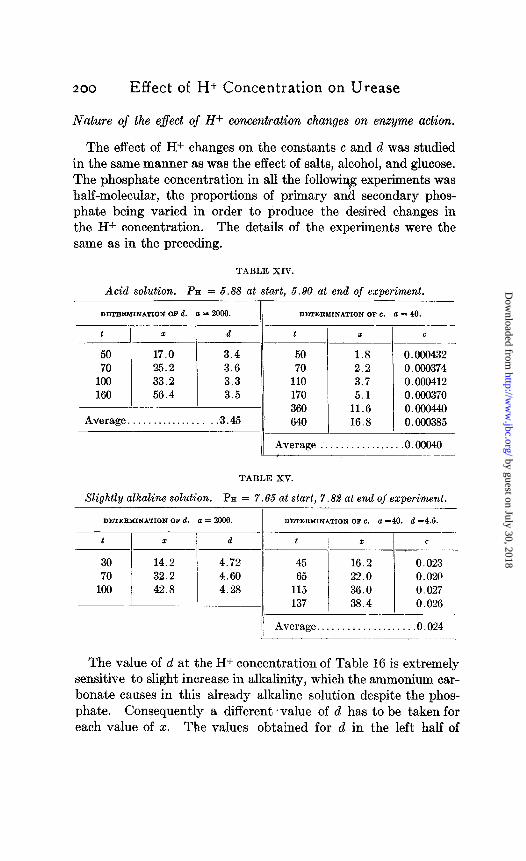
Nature of the e$ect of H+ concentration changes on enzyme action.
The effect of Hf changes on the constants c and d was studied in the same manner as was the effect of salts, alcohol, and glucose. The phosphate concentration in all the following experiments was half-molecular, the proportions of primary and secondary phos- phate being varied in order to Produce the desired changes in the Hf concentration. The details of the experiments were the same as in the preceding.
TABLE XIV.
Acid solution. Pa = 5.88 at start, 5.90 at end of experiment.
DETERMINATION OF d. Q = 2000. jl DETEBMIN*TLTION OF c. a = 40.
c z d I t = -A.__
50 17.0 3.4 50 1.8 0.000432 70 25.2 3.6 70 2.2 0.000374
100 33.2 3.3 110 3.7 0.000412 160 56.4 3.5 170 5.1 0.000370
360 11.6 0.00044G Average. . . . . . .3.45 G40 16.8 0.000385
/ Average . . . . . . . . . . . . . . ...0.00040
TABLE XV.
Slightly alkaline solution. Pa = 7.65 at start, 7.88 at end of experiment.
DETEnMIN*ThTION OF a. DETERMIN*TION OF e. a =40. d =4.6.
i 1, Average.. . . . . . . .0.024
The value of d at the H+ concentration of Table 16 is extremely sensitive to slight increase in alkalinity, which the ammonium car- bonate causes in this already alkaline solution despite the phos- phate. Consequently a different ‘value of d has to be taken for each value of z. The values obtained for d in the left half of
by guest on July 30, 2018http://w
ww
.jbc.org/D
ownloaded from
D. D. Van Slyke and G. Zacharias 201
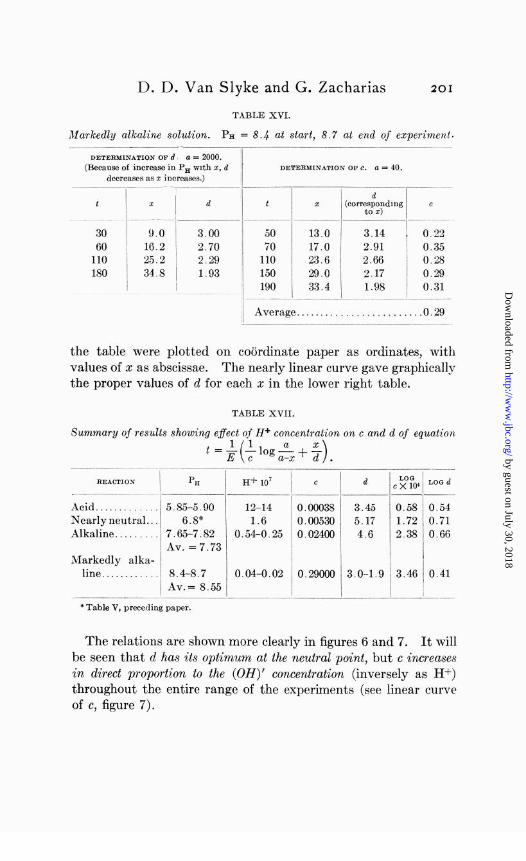
TABLE XVI.
Markedly alkaline solution. PH = 8.4 at start, 8.Y at end of experiment.
DETERMINATION wd. a= 2000. (Because of increase in PH mth 2, d DETERMINhTION OFC. a= 40.
decreases as 2 increases.)
,..-I I
d t z d t
’ I 5 (corresponding c
i--__-i to 2)
30 9.0 3.00 ~ 50 13.0 3.14 0.22 60 2.70 ~ 70 17.0 2.91 0.35
110 2.29 ~ 110 23.6 2.66 0.28 180 1.93 ~ 150 29.0 2.17 0.29
190 33.4 1.98 0.31 ~ -.-~__-._ __-_
I Average.........................0.29
the table were plotted on coiirdinate paper as ordinates, with values of 2 as abscissae. The nearly linear curve gave graphically the proper values of d for each x in the lower right table.
TABLE XVII.
Summary of results showing effect o.f H+ concentration on c and d of equation
t =& >.
REACTION i
PH Fc+ 10’ / c d L”“Lood e x 10’
-__--~ -~ I- Acid. . 5.85-5.90 12-14 0.00038 3.45 0.58 0.54 Nearly neutral.. 6.8% 1.6 0.00530 5.17 1.72 0.71 Alkaline.. 7.65-7.82 0.54-0.25 0.02400 4.6 2.38 0.66
Av. = 7.73 Markedly alka-
line . . . . . .._.__ 8.4-8.7 0.04-0.02 0.29000 3.0-1.9 I 3.46 0.41 Av.= 8.55
I I - *Table V, preceding paper.
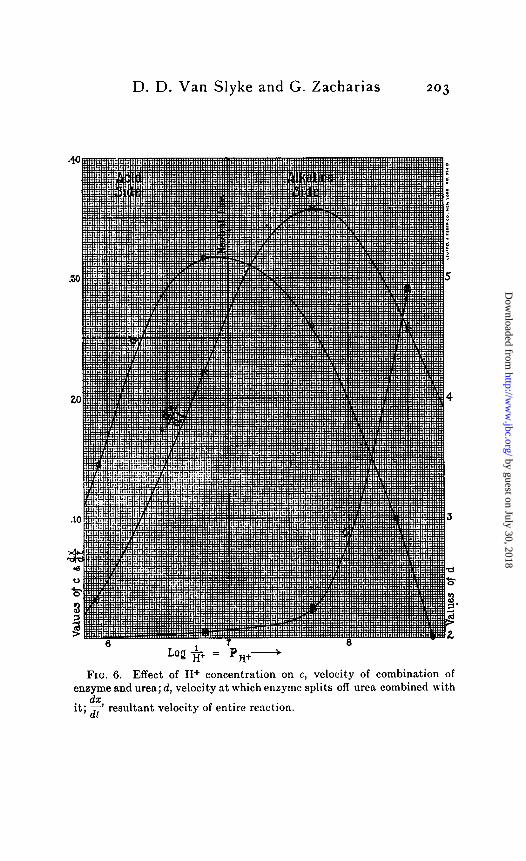
The relations are shown more clearly in figures 6 and 7. It will be seen that d has its optimum at the neutral point, but c increases in direct proportion to the (OH)’ concentration (inversely as H+) throughout the entire range of the experiments (see linear curve of c, figure 7).
by guest on July 30, 2018http://w
ww
.jbc.org/D
ownloaded from
202 Effect of H+ Concentration on Urease
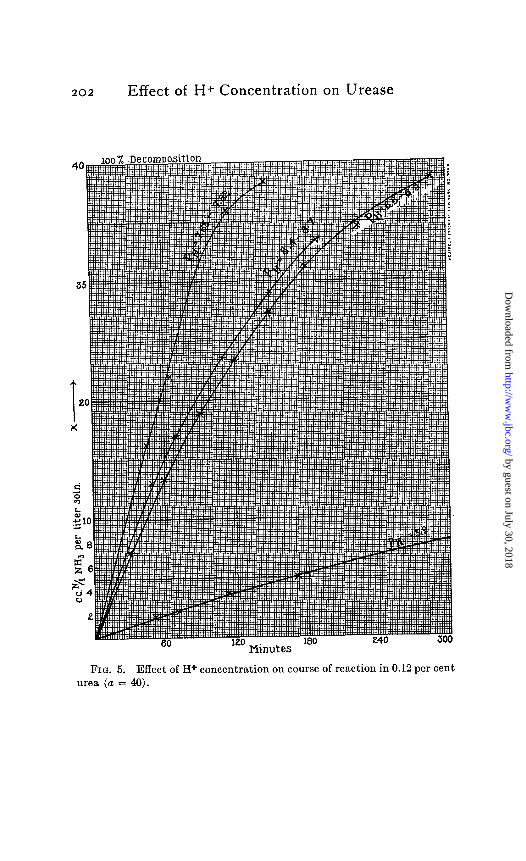
FIG. 5. Effect of H+ concentration on course of reaction in 0.12 per cent urea (a = 40).
by guest on July 30, 2018http://w
ww
.jbc.org/D
ownloaded from
D. D. Van Slyke and G. Zacharias 203
”
LOQ + =
FIG. 6. Effect of H+ concentration on c, vc1ocit.y of combinat.ion of enzyme and urea; d, velocity at which enzyme splits off urea combined with
dx it; z’ resultant velocity of entire reaction.
by guest on July 30, 2018http://w
ww
.jbc.org/D
ownloaded from
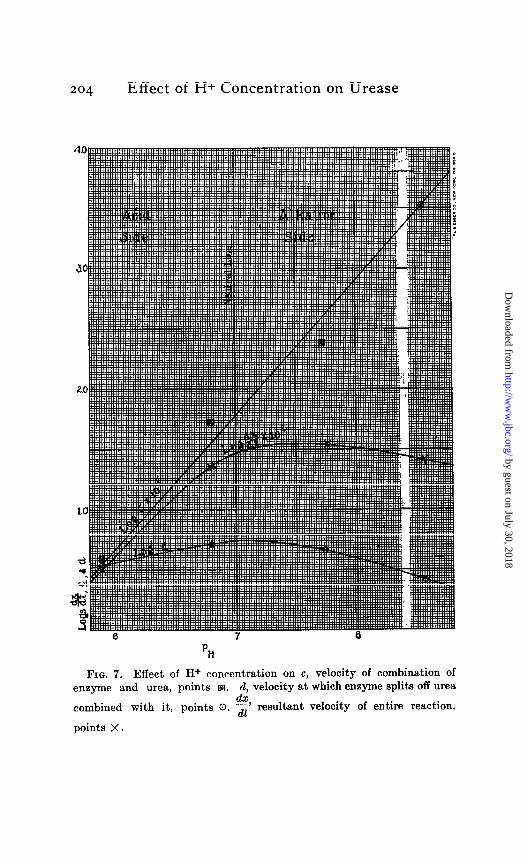
204 Effect of H+ Concentration on Urease
FIG. 7. Effect of H+ concentration on c, velocity of combination of enzyme and urea, points W. d, velocity at which enzyme splits off urea
dx combined with it, points 0. z’ resultant velocity of entire reaction,
points X.
by guest on July 30, 2018http://w
ww
.jbc.org/D
ownloaded from
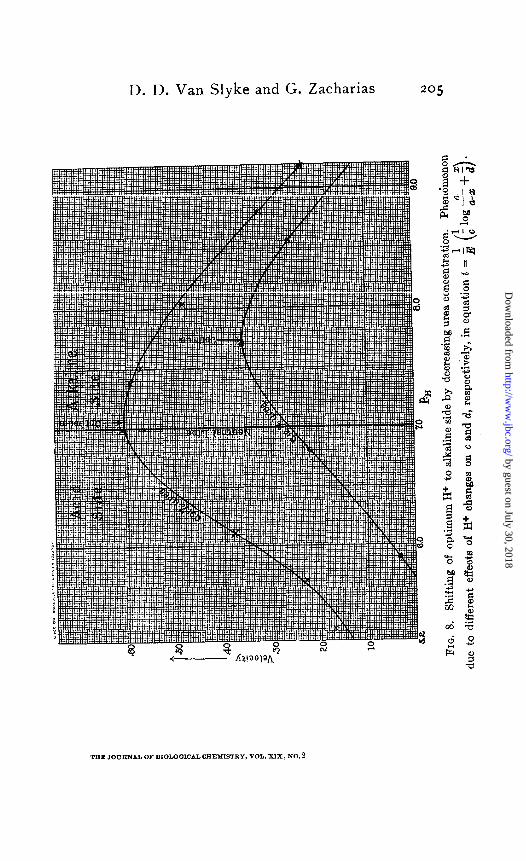
D. D. Van Slyke and G. Zacharias 205
by guest on July 30, 2018http://w
ww
.jbc.org/D
ownloaded from
206 Effect of Hf Concentration on Urease
Theoretical consideration of the efect of Hf ion concentration and of inhibiting substances and products.
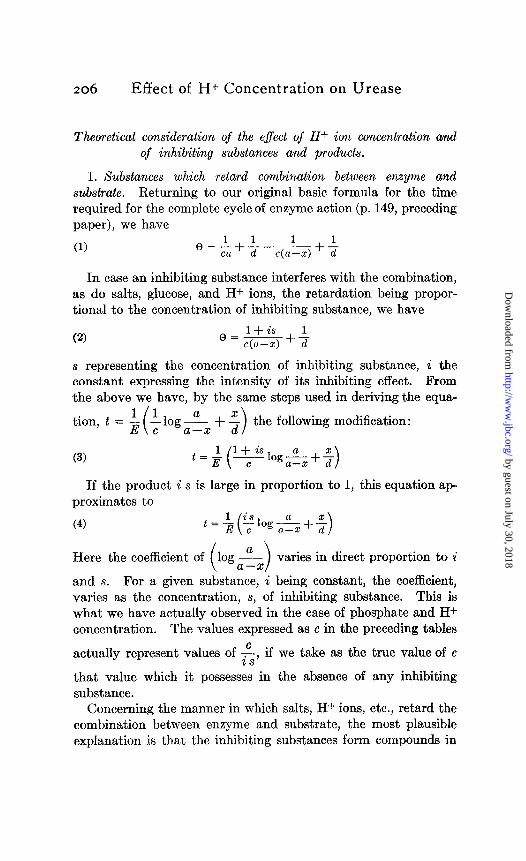
1. Substances which retard combination between enzyme and substrate. Returning to our original basic formula for the time required for the complete cycle of enzyme action (p. 149, preceding paper), we have
In case an inhibiting substance interferes with the combination, as do salts, glucose, and Hf ions, the retardation being propor- tional to the concentration of inhibiting substance, we have
(‘4 I+~++ s representing the concentration of inhibiting substance, i the constant expressing the intensity of its inhibiting effect. From the above we have, by the same steps used in deriving the equa-
(3)
+ i the following modification:
& 1+is (
--log~z+~ E c >
If the product i s is large in proportion to 1, this equation ap- proximates to
(4)
Here the coefficient of logaAX ( >
varies in direct proportion to i
and s. For a given substance, i being constant, the coefficient, varies as the concentration, s, of inhibiting substance. This is what we have actually observed in the case of phosphate and H+ concentration. The values expressed as c in the preceding tables
actually represent values of &, if we take as the true value of c
that value which it possesses in the absence of any inhibiting substance.
Concerning the manner in which salts, H+ ions, etc., retard the combination between enzyme and substrate, the most plausible explanation is that the inhibiting substances form compounds in
by guest on July 30, 2018http://w
ww
.jbc.org/D
ownloaded from
D. D. Van Slyke and G. Zacharias 207
equilibrium with the enzyme, so that the latter is divided between substrate and inhibiting substance in proportion to the concen- tration of each, in accordance with the law of mass action.
By a study of the action of inhibiting substances of different chemical nature, it should be possible to obtain data that will indicate the nature of the chemical group or groups by which dif- ferent enzymes combine with their substrates. Thus, the effect of H+ ions on urease indicates that the combining group, the “adductor” of Armstrong, is basic.
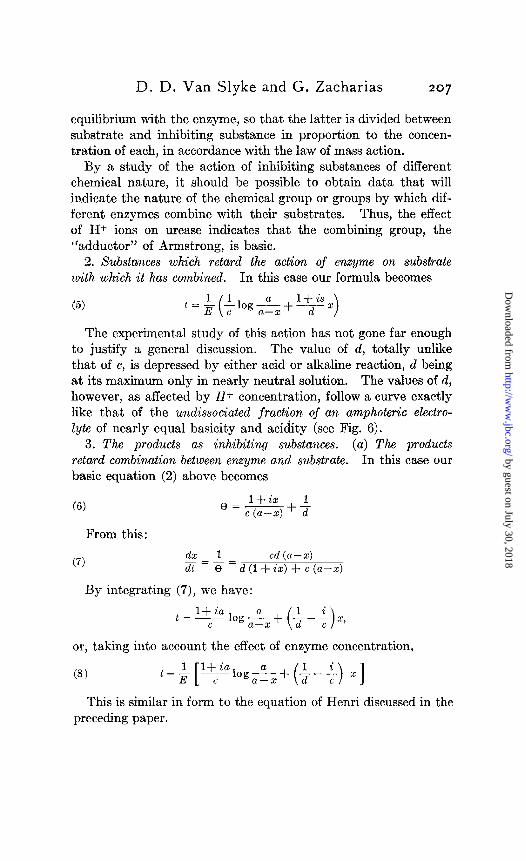
2. Substances which retard the action of enzyme on substrate with which it has combined. In this case our formula becomes
t=& +~+_;i-x ( 1+ is
a-x >
The experimental study of this action has not gone far enough to justify a general discussion. The value of d, totally unlike that of c, is depressed by either acid or alkaline reaction, d being at its maximum only in nearly neutral solution. The values of d, however, as affected by H+ concentration, follow a curve exactly like that of the undissociated fraction of an amphoteric electro- lyte of nearly equal basicity and acidity (see Fig. 6).
3. The products as inhibiting substances. (a) The products retard combination between enzyme and substrate. In this case our basic equation (2) above becomes
From this:
(7) dx 1 cd (a-x) -=-= dt 8 d (1 + ix) + c (a-x)
By integrating (7), we have:
or, taking into account the effect of enzyme concentration,
This is similar in form to the equation of Henri discussed in the preceding paper.
by guest on July 30, 2018http://w
ww
.jbc.org/D
ownloaded from
208 Effect of H+ Concentration on Urease
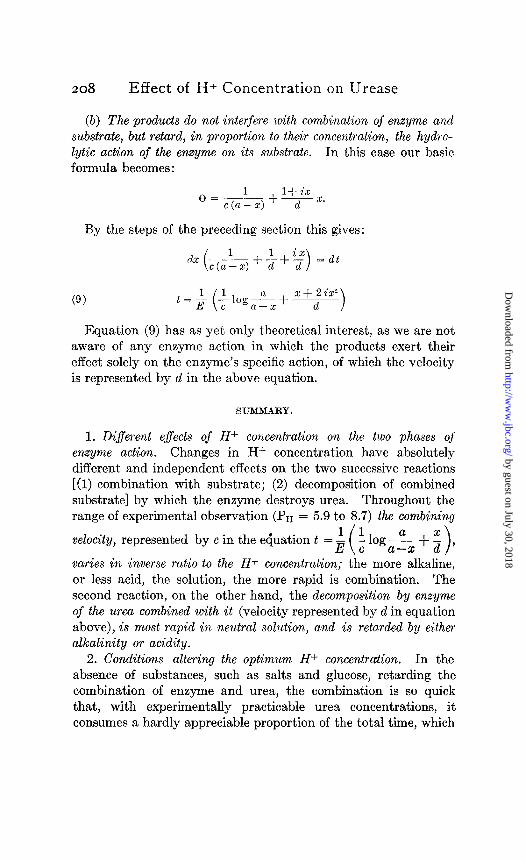
(b) The products do not interfere with combination of enzyme and substrate, but retard, in proportion to their concentration, the hydro- lytic action of the enzyme on its substrate. In this case our basic formula becomes:
By the steps of the preceding section this gives:
dX (
&j+++y) =dt
t=$ +y-x+i- ( x+ 2ix2 ) Equation (9) has as yet only theoretical interest, as we are not
aware of any enzyme action in which the products exert their effect solely on the enzyme’s specific action, of which the velocity is represented by d in the above equation.
SUMMARY.
1. Di$erent e$ects of Hf concentration on the two phases of enzyme action. Changes in Hf concentration have absolutely different and independent effects on the two successive reactions [(l) combination with substrate; (2) decomposition of combined substrate] by which the enzyme destroys urea. Throughout the range of experimental observation (Pn = 5.9 to 8.7) the combining
velocity, represented by c in the e4uation t = )
varies in inverse ratio to the H+ concentration; the more alkaline, or less acid, the solution, the more rapid is combination. The second reaction, on the other hand, the decomposition by enzyme of the urea combined with it (velocity represented by d in equation above), is most rapid in neutral solution, and is retarded by either alkalinity or acidity.
2. Conditions altering the optimum H+ concentration. In the absence of substances, such as salts and glucose, retarding the combination of enzyme and urea, the combination is so quick that, with experimentally practicable urea concentrations, it consumes a hardly appreciable proportion of the total time, which
by guest on July 30, 2018http://w
ww
.jbc.org/D
ownloaded from
D. D. Van Slyke and G. Zacharias 209
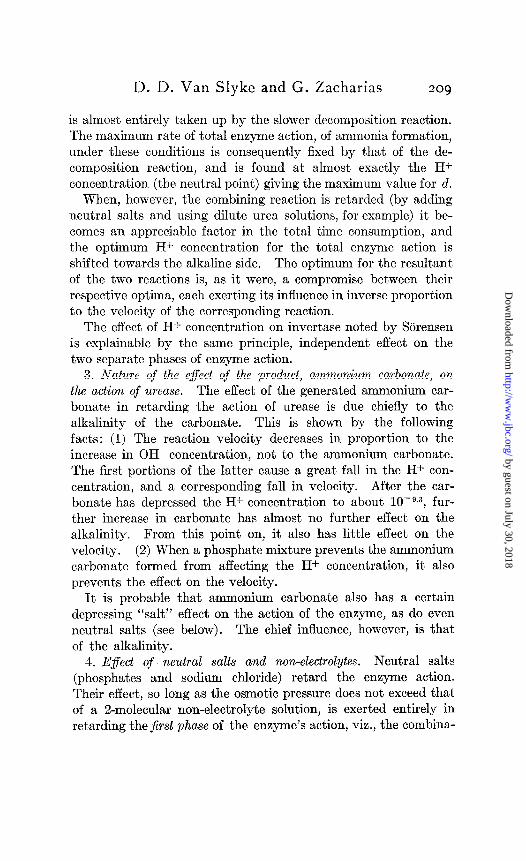
is almost entirely taken up by the slower decomposition reaction. The maximum rate of total enzyme action, of ammonia formation, under these conditions is consequently fixed by that of the de- composition reaction, and is found at almost exactly the H+ concentration (the neutral point) giving the maximum value for d.
When, however, the combining reaction is retarded (by adding neutral salts and using dilute urea solutions, for example) it be- comes an appreciable factor in the total time consumption, and the optimum Hf concentration for the total enzyme action is shifted towards the alkaline side. The optimum for the resultant of the two reactions is, as it were, a compromise between their respective optima, each exerting its influence in inverse proportion to the velocity of the corresponding reaction.
The effect of H+ concentration on invertase noted by Siirensen is explainable by the same principle, independent effect on the two separate phases of enzyme action.
3. Nature of the effect of the product, ammonium carbonate, on the action of urease. The effect of the generated ammonium car- bonate in retarding the action of urease is due chiefly to the alkalinity of the carbonate. This is shown by the following facts: (1) The reaction velocity decreases in proportion to the increase in OH concentration, not to the ammonium carbonate. The first portions of the latter cause a great fall in the H+ con- centration, and a corresponding fall in velocity. After the car- bonate has depressed the Hf concentration to about 10-g.3, fur- ther increase in carbonate has almost no further effect on the alkalinity. From this point on, it also has little effect on the velocity. (2) When a phosphate mixture prevents the ammonium carbonate formed from affecting the H+ concentration, it also prevents the effect on the velocity.
It is probable that ammonium carbonate also has a certain depressing ‘<salt” effect on the action of the enzyme, as do even neutral salts (see below). The chief influence, however, is that of the alkalinity.
4. Effect of neutral salts and non-electrolytes. Neutral salts (phosphates and sodium chloride) retard the enzyme action. Their effect, so long as the osmotic pressure does not exceed that of a 2-molecular non-electrolyte solution, is exerted entirely in retarding the jirst phase of the enzyme’s action, viz., the combina-
by guest on July 30, 2018http://w
ww
.jbc.org/D
ownloaded from
210 Effect of H+ Concentration on Urease
tion of enzyme and urea. The decomposition of urea after it has combined with enzyme is not affected.
Neutral phosphate mixtures have, therefore, a double effect on the enzyme. They maintain the reaction rate by preventing the alkalinity that would otherwise develop as soon as ammonium carbonate is formed, and consequently they act as accelerators. On the other hand, they themselves depress the activity of the enzyme by retarding its combination with substrate. This ef- fect is the greater the more dilute the urea. Salts consequently retard especially the decomposition of the last traces of urea. Urease, therefore, shows its highest activity in the presence of the lowest concentration of phosphates that will maintain approx- imate neutrality.
Glucose retards the enzyme action in the same manntr as neutral salts. Alcohol in 30 per cent concentration (5.7 molecularj depresses both phases of the enzyme’s action.
Both electrolytes and non-electrolytes in osmotic concentra- tions much exceeding 2-molecular retard the enzyme action m its second phase, viz., the decomposition of urea after it has combined with enzyme. The effect is evident from a depression of d in the above equation, d being the velocity constant of the decomposition phase of the action.
5. Formulation of the efects of inhibiting substances a?Ld prod- ucts. The general mass action formula for enzyme action, t =
, derived in the preceding paper, is here further
developed to include the effects of inhibiting substances on enzyme action, and the effect of products which influence either phase of the action.
by guest on July 30, 2018http://w
ww
.jbc.org/D
ownloaded from
Donald D. Van Slyke and Gotthard ZachariasMODE OF ENZYME ACTION
UREASE: FURTHER STUDY ON THE INHIBITING SUBSTANCES ON
CONCENTRATION AND OF THE EFFECT OF HYDROGEN ION
1914, 19:181-210.J. Biol. Chem.
http://www.jbc.org/content/19/2/181.citation
Access the most updated version of this article at
Alerts:
When a correction for this article is posted•
When this article is cited•
alerts to choose from all of JBC's e-mailClick here
ml#ref-list-1
http://www.jbc.org/content/19/2/181.citation.full.htaccessed free atThis article cites 0 references, 0 of which can be
by guest on July 30, 2018http://w
ww
.jbc.org/D
ownloaded from