the effect of macro economy and financial …
TRANSCRIPT
Volume 1, Issue 2, May 2020 E-ISSN : 2721-303X, P-ISSN : 2721-3021
Available Online: https://dinastipub.org/DIJEFA Page 275
THE EFFECT OF MACRO ECONOMY AND FINANCIAL PERFORMANCE ON
STOCK PRICE WITH EARNING PER SHARE AS THE INTERVENING
VARIABLE (A STUDY ON RETAIL TRADING COMPANY IN IDX IN 2011-2018)
Rendra Rahadian Rachman1)
, Sudjono2)
, Ahmad Badawy Saluy3)
1)
Mercu Buana University, Jakarta, Indonesia 2)
Mercu Buana University, Jakarta, Indonesia 3)
Mercu Buana University, Jakarta, Indonesia
ARTICLE INFORMATION
Received: 30th
March 2020
Revised: 25th
April 2020
Issued: 15th
May 2020
Corresponding author:
Rendra Rahadian Rachman
E-mail:
DOI:10.31933/DIJEFA
Abstract: The present study aimed to analyze a macro
economic effect - proxied by BI rate, exchange rate,
Foreign Direct Investment (FDI)- and financial
performance - proxied by current ratio (CR), net profit
margin (NPM), and debt to equity ratio (DER)- on
stock price, using Earning per Share (EPS) as the
intervening variable. The object of the study was retail
company listed on Indonesia Stock Exchange in 2011-
2018. The study used data from financial statement, BI
rate fluctuation, rupiah exchange rate, FDI volume,
and stock price in 2011-2018. In this study, path
analysis and linear regression analysis were done using
SPSS 21. The result of the study showed that, partially,
BI rate and EPS positively and significantly affected
stock price. While exchange rate, FDI, NPM, and DER
positively, yet not significantly. Whereas Current ratio
negatively and not significantly affect the stock prices.
The path analysis result showed that it was only CR
and DER that affected stock prices through EPS.
Keywords: Stock Price, Macro Economy, Financial
Performances, Retail Company
INTRODUCTION
Investment is an activity that brings future profit. In recent years, investment begins to
draw the public‟s attention due to ease of access to information and technology advancement.
From a global perspective, Indonesia has a quite friendly investment climate for investors.
Based on the Ease of Doing Business (EODB) index issued by the World Bank, Indonesia
continues to show significant year-over-year rank improvement.
The retail trade industry is one of the industries that experience a significant increase
every year. Following the survey in the third quarter of 2019, the real sales index exhibit a
9.3% increase year on year (Bank Indonesia, 2019). In other words, this sector becomes one
of the sectors that gives a vast contribution to economic growth in Indonesia.
Volume 1, Issue 2, May 2020 E-ISSN : 2721-303X, P-ISSN : 2721-3021
Available Online: https://dinastipub.org/DIJEFA Page 276
The phenomenon that occurs in the last five years is the reduction of retail store
numbers in Indonesia due to the shifting of shopping method, lifestyle, and needs fulfillment.
The retailers should anticipate this phenomenon in order to compete for both on a domestic
and global scale. Therefore, capital addition through stocks is needed, either issuing new
stock or other financial products such as obligation.
Stock price is one of the indicators reflecting the performance and credibility of an
issuer. Public views that high stock price means that the issuer has a good credibility and
good business prospects. (Imoney, 2013). Using top-down analysis, the factor affecting stock
price, from the broadest scope (macro) to the smallest part (micro), is examined.
BI rate, as the benchmark rate in Indonesia, is a part of macro factors since it cannot be
controlled by issuers; so is the rupiah exchange rate and the government‟s policy regarding
foreign investment. Issuers can manage financial performance, in other words, a company
could issue some policies such as adjusting its capital effectiveness, increasing sales rate,
increasing company‟s liquidity, and balancing debt proportion in order to expand the
company, which will improve the company‟s value from the investor‟s and public‟s point of
view. Based on the description above, the author conducted a study entitled “The effect of the
macroeconomy and financial performance on the stock price by using EPS as the intervening
variable (A case study in Retail companies listed in IDX 2011-2018 period)”.
Statement of Problem
Based on the background described above, the followings are the statement of problems:
1. Does BI rate affect stock price?
2. Does exchange rate affect stock price?
3. Does Foreign Direct Investment (FDI) affect stock price?
4. Does Current Ratio (CR) affect stock price?
5. Does Net Profit Margin (NPM) affect stock price?
6. Does Debt to Equity Ratio (DER) affect stock price?
7. Does Earning Per Share (EPS) affect stock price?
8. With Earning Per Share (EPS) as the intervening variable, does BI rate affect stock
price?
9. With Earning Per Share (EPS) as the intervening variable, does Exchange rate affect
stock price?
10. With Earning Per Share (EPS) as the intervening variable, does Foreign Direct
Investment (FDI) stock price?
11. With Earning Per Share (EPS) as the intervening variable, does Current Ratio stock
price?
12. With Earning Per Share (EPS) as the intervening variable, does Net Profit Margin
(NPM) affect stock price?
13. With Earning Per Share (EPS) as the intervening variable, does Debt to Equity Ratio
(DER) affect stock price?
The Purpose of The Study
The purposes of the study were:
1. To prove the effect of BI rate on the stock price;
2. To prove the effect of Exchange rate on the stock price;
3. To prove the effect of Foreign Direct Investment (FDI) on the stock price;
Volume 1, Issue 2, May 2020 E-ISSN : 2721-303X, P-ISSN : 2721-3021
Available Online: https://dinastipub.org/DIJEFA Page 277
4. To prove the effect of Current Ratio (CR) on the stock price;
5. To prove the effect of Net Profit Margin (NPM) on the stock price;
6. To prove the effect of Debt to Equity Ratio (DER) on the stock price;
7. To prove the effect of Earning Per Share (EPS) on the stock price;
8. To prove the effect of BI rate on the stock price when EPS serves as the intervening
variable;
9. To prove the effect of Exchange rate on the stock price when EPS serves as the
intervening variable;
10. To prove the effect of Foreign Direct Investment (FDI) on the stock price when EPS
serves as the intervening variable;
11. To prove the effect of Current Ratio (CR) on the stock price when EPS serves as the
intervening variable;
12. To prove the effect of Net Profit Margin (NPM) on the stock price when EPS serves as
the intervening variable;
13. To prove the effect of Debt to Equity Ratio (DER) on the stock price when EPS serves
as the intervening variable; and to find out the partial effect of BI Rate, Exchange Rate,
FDI,CR, NPM, DER, and EPS on stock price, as well as to find out the effect of BI
rate, exchange rate, FDI, CR, NPM, and DER on stock price when EPS serves as the
intervening variable.
Significance of the study
The benefits of the study could be described as follow:
For the company, the present study can be used as a consideration to make policy or decision
on the variables examined in this study, particularly financial performance, in order to
increase the company‟s value. Thus, the company may attract more investors to make an
investment.
For the academicians, the present study is expected to contribute to the development of
theory relating to the macroeconomy and financial performance and its implication on the
stock price. For investors, the present study is expected to be a reference in making an
investment decision, particularly in making investment for issuer in the retail trading sector.
LITERATURE REVIEW
Investment
Investment is a term containing a number of definitions related to finance and economy. It is
associated with the accumulation of an asset and expect to gain future profit (Sukirno, 2011).
BI Rate
The Benchmark rate is a form of monetary policy prevailing in a country. In Indonesia, the
benchmark rate is determined by Bank Indonesia. It is usually called BI rate. It functions to
control the distribution of money among the community (Rismawati, 2010).
Exchange Rate
The theory underpinning the determination of the value of currency stems from the
emergence of money theory. Money basically functions as a medium of exchange, counting
unit, value keeping, and other subfunctions (Darsono & Rahman, E, 2018). The function is, at
its core, to support the economic activities of a country. Needs on foreign exchange market
emerges when economic activities involve international transactions that use different
currencies.
Volume 1, Issue 2, May 2020 E-ISSN : 2721-303X, P-ISSN : 2721-3021
Available Online: https://dinastipub.org/DIJEFA Page 278
Government's Policy
The government‟s policy is basically made based on a broad consideration (Parjiono et al.,
2018). One of the policies is economic policy. It refers to a government‟s policy in making a
decision for the economic sector. This policy may cover a system to set a taxation system,
foreign investment rate policy, the government‟s budget and employment market, national
possession, and regional autonomy of government‟s intervention into the economy.
Foreign Investment
The government‟s policy is basically made based on a broad consideration (Parjiono et al.,
2018). One of the policies is economic policy. It refers to a government‟s policy in making a
decision for the economic sector. This policy may cover a system to set a taxation system,
foreign investment rate policy, the government‟s budget and employment market, national
possession, and regional autonomy of government‟s intervention into the economy.
Current Ratio
Current ratio refers to a ratio for measuring a company‟s ability to pay short-term obligations
(Harmono, 2013). In other words, it refers to the current asset that is available to pay short-
term obligations.
Net Profit Margin
Net Profit Margin refers to a ratio for measuring the percentage of profit (Harmono, 2013).
This ratio is calculated by dividing net income with total sales revenue. Net profit is
calculated as a result of subtracting pre-tax profit by income tax.
Debt To Equity Ratio
This ratio describes relative portion between equity and debt used to fund assets asset. DER
compares liabilities to equity (Harmono,2013). Debt should not be bigger than equity. A
lower ratio indicates better company‟s condition due to smaller portion of debt to equity.
Stock Price
Stock price is a closing price of stocks used as sample during the research period, its
movement is always monitored by investors (Brigham & Houston, 2010). The stock price is
fluctuating due to a number of factors. These factors include macroeconomic factors such as
the condition of a country and micro factors such as company performance.
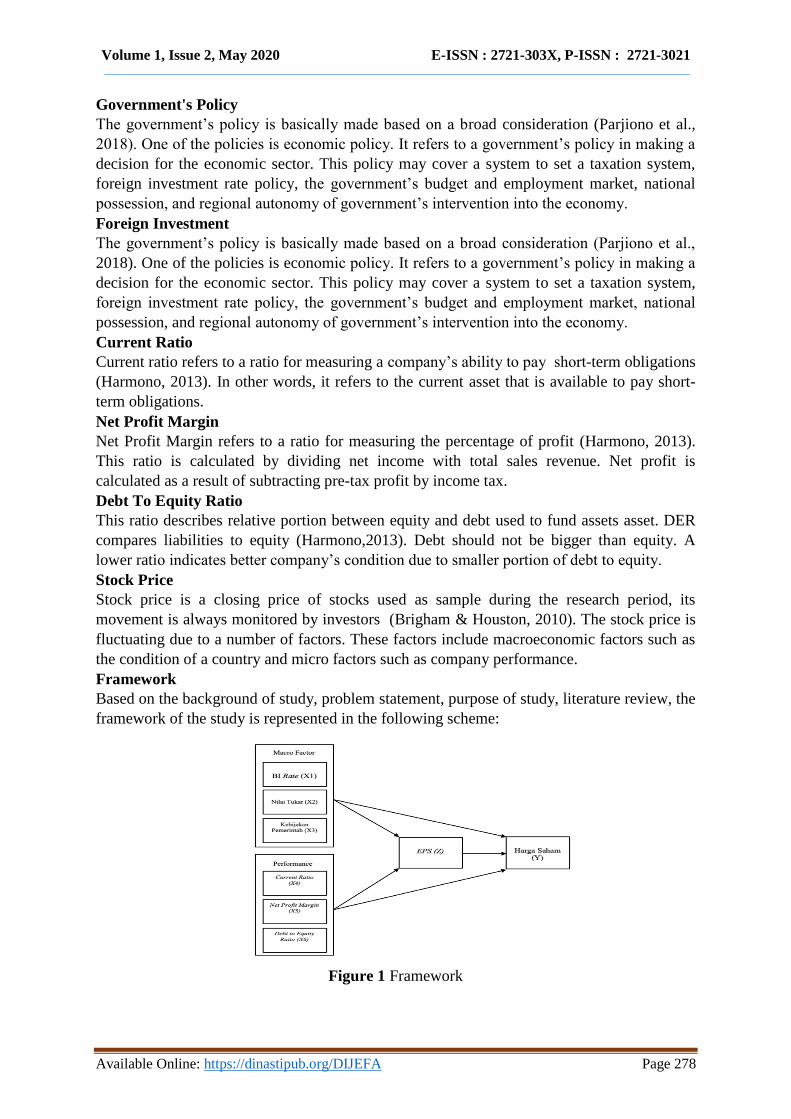
Framework
Based on the background of study, problem statement, purpose of study, literature review, the
framework of the study is represented in the following scheme:
Figure 1 Framework

Volume 1, Issue 2, May 2020 E-ISSN : 2721-303X, P-ISSN : 2721-3021
Available Online: https://dinastipub.org/DIJEFA Page 279
RESEARCH METHODS
Research Design
The present study is categorized as associative study. It refers to a study aiming at finding out
the effect or relationship between two or more variables. The present study is more complex
than descriptive and comparative methods because, based on this study, a theory can be built
to explain, forecast, and control a phenomenon. (Sugiyono, 2003).
Variable Measurement
Independent variable, dependent variable, and intervening variable were measured as follow:
Table 1 Variable Measurement
Population and Sample
The population of the study was retail companies listed in Indonesia Stock Exchange in the
2011-2018 period. The samples of the study were selected using purposive sampling method.
This method sets certain criteria. The criteria of samples of the study were as follow:
1. Retail trading companies that are listed in IDX in 2011-2018.
2. Retail trading companies that publish its financial statement in 2011-2018.
3. Retail trading companies whose business units are not digital or service-based products.
4. Retail trading company with complete data needed by the present study.
Based on the criteria above, sixteen retail trading companies were selected.
No Variable Indicator Measuring
Scale
1 BI rate
Ratio
2 Exchange
Rate
Ratio
3 Foreign
Direct
Investment
Ratio
4 Current Ratio
Ratio
5 Net Profit
Margin
Ratio
6 Debt to
Equity Ratio
Ratio
7 Earning per
Share
Ratio
8 Stock Price Stock Price = Closing price at the end of annual period Ratio
Volume 1, Issue 2, May 2020 E-ISSN : 2721-303X, P-ISSN : 2721-3021
Available Online: https://dinastipub.org/DIJEFA Page 280
Data Collection Method
In the present study, we employed secondary data of BI rate and exchange rate obtained from
Bank Indonesia‟s official website. Data on FDI were obtained from Investment Coordinating
Board (BKPM). Data on CR, NPM, DER, and EPS of the companies were obtained from the
companies‟ financial statement. Data on stock price were obtained from Indonesia Stock
Exchange.
Data Analysis Method
The data of the study were analyzed using descriptive statistics, classical assumption test,
regression analysis, path analysis (t-test), and R2 determination test.
FINDINGS AND DISCUSSION
Descriptive Analysis
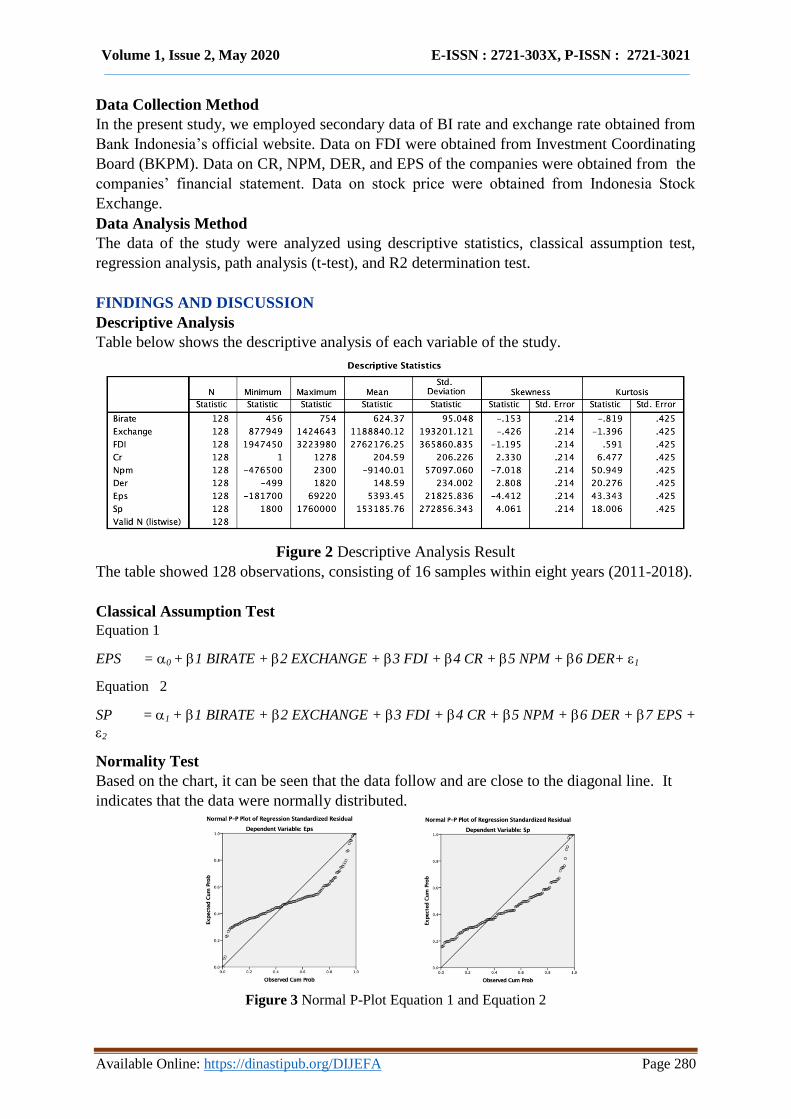
Table below shows the descriptive analysis of each variable of the study.
Figure 2 Descriptive Analysis Result
The table showed 128 observations, consisting of 16 samples within eight years (2011-2018).
Classical Assumption Test
Equation 1
EPS = 0 + 1 BIRATE + 2 EXCHANGE + 3 FDI + 4 CR + 5 NPM + 6 DER+ 1
Equation 2
SP = 1 + 1 BIRATE + 2 EXCHANGE + 3 FDI + 4 CR + 5 NPM + 6 DER + 7 EPS +
2
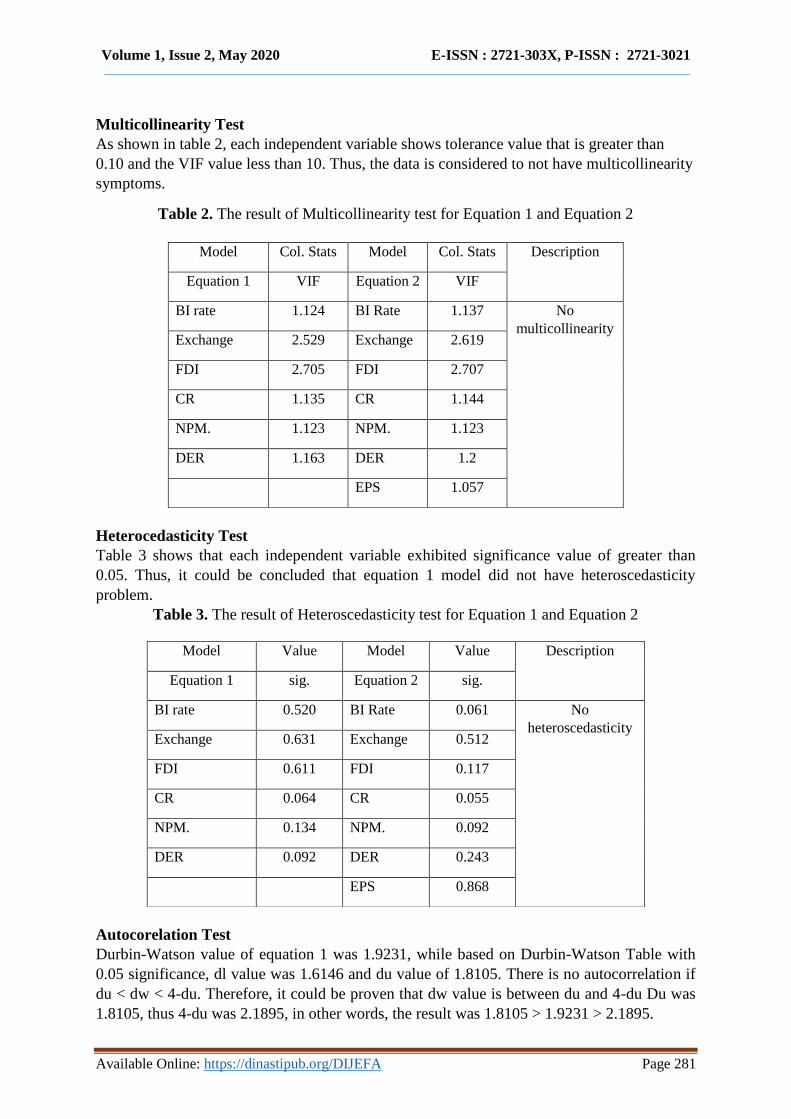
Normality Test
Based on the chart, it can be seen that the data follow and are close to the diagonal line. It
indicates that the data were normally distributed.
Figure 3 Normal P-Plot Equation 1 and Equation 2
Volume 1, Issue 2, May 2020 E-ISSN : 2721-303X, P-ISSN : 2721-3021
Available Online: https://dinastipub.org/DIJEFA Page 281
Multicollinearity Test
As shown in table 2, each independent variable shows tolerance value that is greater than
0.10 and the VIF value less than 10. Thus, the data is considered to not have multicollinearity
symptoms.
Table 2. The result of Multicollinearity test for Equation 1 and Equation 2
Heterocedasticity Test
Table 3 shows that each independent variable exhibited significance value of greater than
0.05. Thus, it could be concluded that equation 1 model did not have heteroscedasticity
problem.
Table 3. The result of Heteroscedasticity test for Equation 1 and Equation 2
Autocorelation Test
Durbin-Watson value of equation 1 was 1.9231, while based on Durbin-Watson Table with
0.05 significance, dl value was 1.6146 and du value of 1.8105. There is no autocorrelation if
du < dw < 4-du. Therefore, it could be proven that dw value is between du and 4-du Du was
1.8105, thus 4-du was 2.1895, in other words, the result was 1.8105 > 1.9231 > 2.1895.
Model Col. Stats Model Col. Stats Description
Equation 1 VIF Equation 2 VIF
BI rate 1.124 BI Rate 1.137 No
multicollinearity Exchange 2.529 Exchange 2.619
FDI 2.705 FDI 2.707
CR 1.135 CR 1.144
NPM. 1.123 NPM. 1.123
DER 1.163 DER 1.2
EPS 1.057
Model Value Model Value Description
Equation 1 sig. Equation 2 sig.
BI rate 0.520 BI Rate 0.061 No
heteroscedasticity Exchange 0.631 Exchange 0.512
FDI 0.611 FDI 0.117
CR 0.064 CR 0.055
NPM. 0.134 NPM. 0.092
DER 0.092 DER 0.243
EPS 0.868
Volume 1, Issue 2, May 2020 E-ISSN : 2721-303X, P-ISSN : 2721-3021
Available Online: https://dinastipub.org/DIJEFA Page 282
Durbin-Watson value of equation 1 was 1.308, while based on Durbin-Watson Table with
0.05 significance, dl value was 1.5979 and du value of 1.8280. There is no autocorrelation if
du < dw < 4-du. Therefore, it could be proven that dw value is between du and 4-du Du was
1.8280, thus 4-du was 2.1720, in other words, the result was 1.8280 > 1.9981 > 2.1720.
Table 4. The result of Heteroscedasticity test for Equation 1
REGRESSION ANALYSIS
Regression Model 1
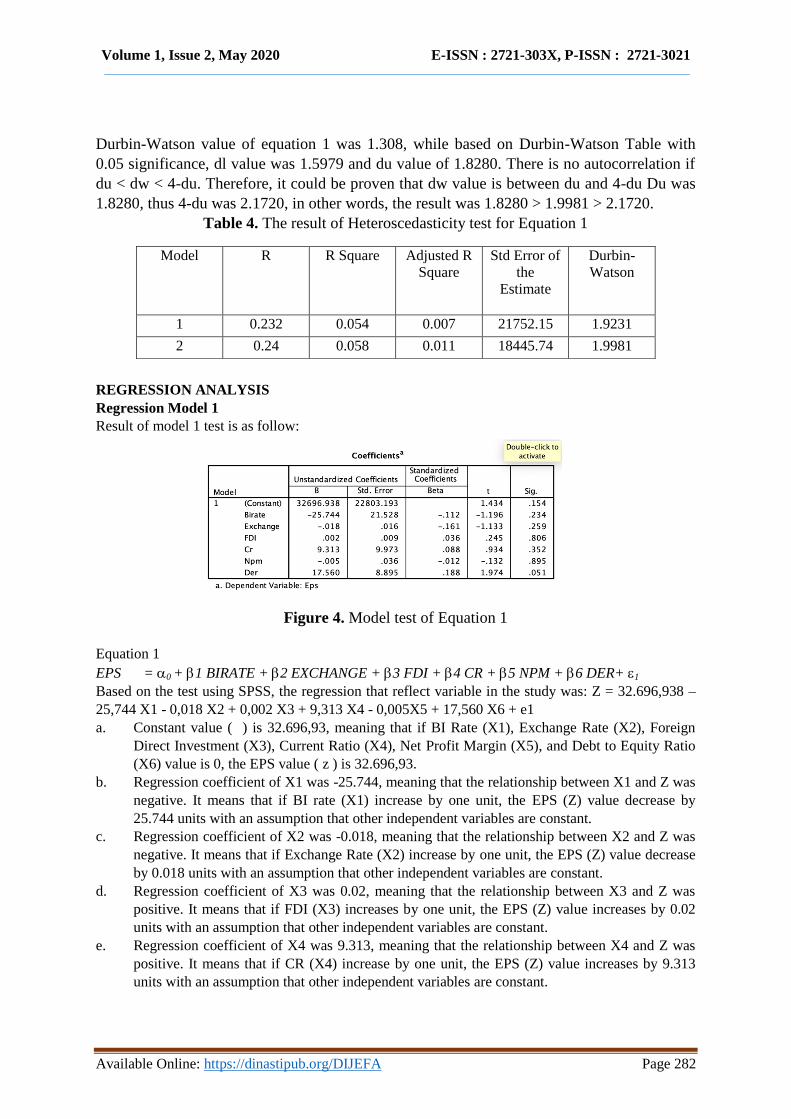
Result of model 1 test is as follow:
Figure 4. Model test of Equation 1
Equation 1
EPS = 0 + 1 BIRATE + 2 EXCHANGE + 3 FDI + 4 CR + 5 NPM + 6 DER+ 1
Based on the test using SPSS, the regression that reflect variable in the study was: Z = 32.696,938 –
25,744 X1 - 0,018 X2 + 0,002 X3 + 9,313 X4 - 0,005X5 + 17,560 X6 + e1
a. Constant value ( ) is 32.696,93, meaning that if BI Rate (X1), Exchange Rate (X2), Foreign
Direct Investment (X3), Current Ratio (X4), Net Profit Margin (X5), and Debt to Equity Ratio
(X6) value is 0, the EPS value ( z ) is 32.696,93.
b. Regression coefficient of X1 was -25.744, meaning that the relationship between X1 and Z was
negative. It means that if BI rate (X1) increase by one unit, the EPS (Z) value decrease by
25.744 units with an assumption that other independent variables are constant.
c. Regression coefficient of X2 was -0.018, meaning that the relationship between X2 and Z was
negative. It means that if Exchange Rate (X2) increase by one unit, the EPS (Z) value decrease
by 0.018 units with an assumption that other independent variables are constant.
d. Regression coefficient of X3 was 0.02, meaning that the relationship between X3 and Z was
positive. It means that if FDI (X3) increases by one unit, the EPS (Z) value increases by 0.02
units with an assumption that other independent variables are constant.
e. Regression coefficient of X4 was 9.313, meaning that the relationship between X4 and Z was
positive. It means that if CR (X4) increase by one unit, the EPS (Z) value increases by 9.313
units with an assumption that other independent variables are constant.
Model R R Square Adjusted R
Square
Std Error of
the
Estimate
Durbin-
Watson
1 0.232 0.054 0.007 21752.15 1.9231
2 0.24 0.058 0.011 18445.74 1.9981
Volume 1, Issue 2, May 2020 E-ISSN : 2721-303X, P-ISSN : 2721-3021
Available Online: https://dinastipub.org/DIJEFA Page 283
f. Regression coefficient of X5 was -0.005, meaning that the relationship between X5 and Z was
negative. It means that if NPM (X5) increases by one unit, the EPS (Z) value decreases by
0.005 units with an assumption that other independent variables are constant.
g. Regression coefficient of X6 was 17.560, meaning that the relationship between X6 and Z was
positive. It means that if DER (X6) increases by one unit, the EPS (Z) value increases by
17.560 units by an assumption that other independent variable is constant.
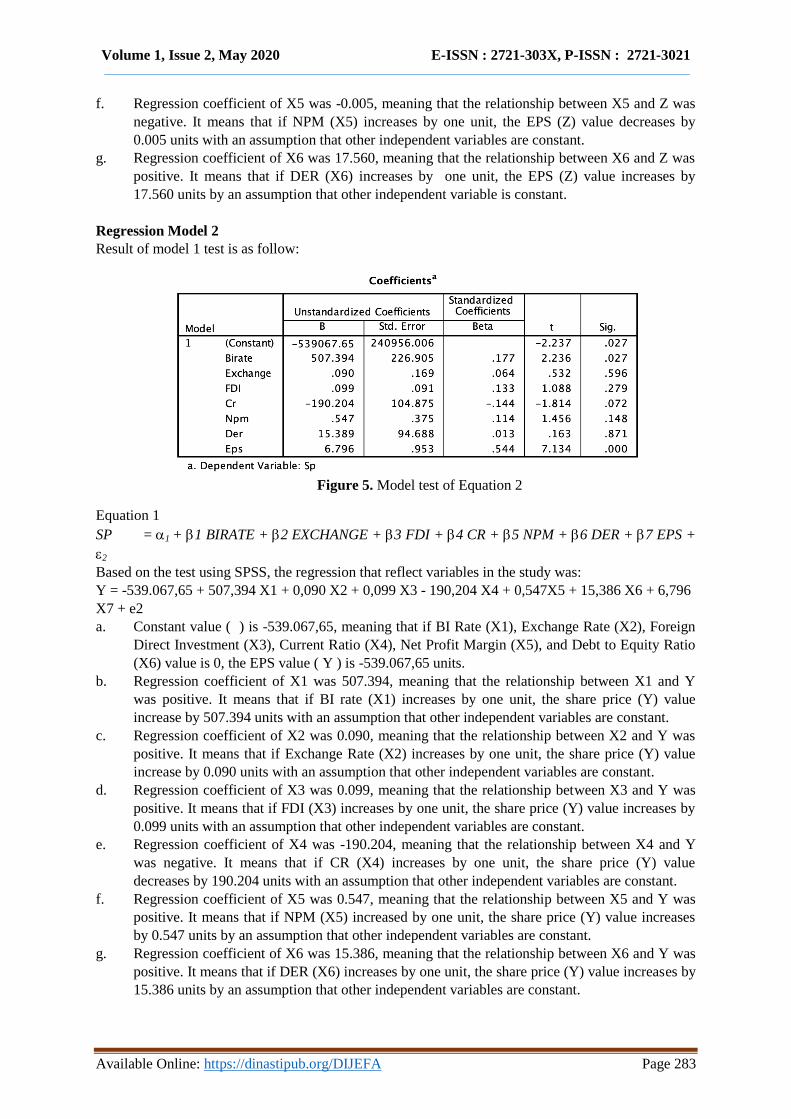
Regression Model 2
Result of model 1 test is as follow:
Figure 5. Model test of Equation 2
Equation 1
SP = 1 + 1 BIRATE + 2 EXCHANGE + 3 FDI + 4 CR + 5 NPM + 6 DER + 7 EPS +
2
Based on the test using SPSS, the regression that reflect variables in the study was:
Y = -539.067,65 + 507,394 X1 + 0,090 X2 + 0,099 X3 - 190,204 X4 + 0,547X5 + 15,386 X6 + 6,796
X7 + e2
a. Constant value ( ) is -539.067,65, meaning that if BI Rate (X1), Exchange Rate (X2), Foreign
Direct Investment (X3), Current Ratio (X4), Net Profit Margin (X5), and Debt to Equity Ratio
(X6) value is 0, the EPS value ( Y ) is -539.067,65 units.
b. Regression coefficient of X1 was 507.394, meaning that the relationship between X1 and Y
was positive. It means that if BI rate (X1) increases by one unit, the share price (Y) value
increase by 507.394 units with an assumption that other independent variables are constant.
c. Regression coefficient of X2 was 0.090, meaning that the relationship between X2 and Y was
positive. It means that if Exchange Rate (X2) increases by one unit, the share price (Y) value
increase by 0.090 units with an assumption that other independent variables are constant.
d. Regression coefficient of X3 was 0.099, meaning that the relationship between X3 and Y was
positive. It means that if FDI (X3) increases by one unit, the share price (Y) value increases by
0.099 units with an assumption that other independent variables are constant.
e. Regression coefficient of X4 was -190.204, meaning that the relationship between X4 and Y
was negative. It means that if CR (X4) increases by one unit, the share price (Y) value
decreases by 190.204 units with an assumption that other independent variables are constant.
f. Regression coefficient of X5 was 0.547, meaning that the relationship between X5 and Y was
positive. It means that if NPM (X5) increased by one unit, the share price (Y) value increases
by 0.547 units by an assumption that other independent variables are constant.
g. Regression coefficient of X6 was 15.386, meaning that the relationship between X6 and Y was
positive. It means that if DER (X6) increases by one unit, the share price (Y) value increases by
15.386 units by an assumption that other independent variables are constant.
Volume 1, Issue 2, May 2020 E-ISSN : 2721-303X, P-ISSN : 2721-3021
Available Online: https://dinastipub.org/DIJEFA Page 284
h. Regression coefficient of X7 was 6.796, meaning that the relationship between X7 and Y was
positive. It means that if EPS (X7) increased by one unit, the share price (Y) value increases by
6.796 units by an assumption that other independent variables are constant.
PATH ANALYSIS
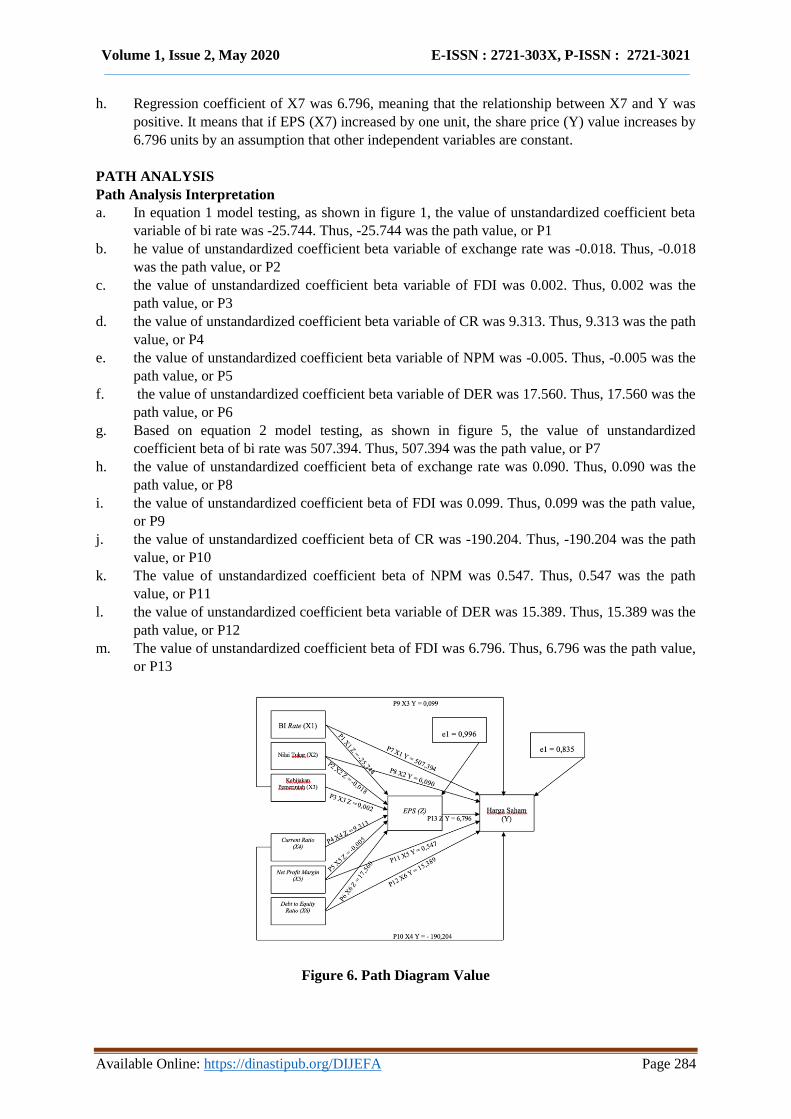
Path Analysis Interpretation
a. In equation 1 model testing, as shown in figure 1, the value of unstandardized coefficient beta
variable of bi rate was -25.744. Thus, -25.744 was the path value, or P1
b. he value of unstandardized coefficient beta variable of exchange rate was -0.018. Thus, -0.018
was the path value, or P2
c. the value of unstandardized coefficient beta variable of FDI was 0.002. Thus, 0.002 was the
path value, or P3
d. the value of unstandardized coefficient beta variable of CR was 9.313. Thus, 9.313 was the path
value, or P4
e. the value of unstandardized coefficient beta variable of NPM was -0.005. Thus, -0.005 was the
path value, or P5
f. the value of unstandardized coefficient beta variable of DER was 17.560. Thus, 17.560 was the
path value, or P6
g. Based on equation 2 model testing, as shown in figure 5, the value of unstandardized
coefficient beta of bi rate was 507.394. Thus, 507.394 was the path value, or P7
h. the value of unstandardized coefficient beta of exchange rate was 0.090. Thus, 0.090 was the
path value, or P8
i. the value of unstandardized coefficient beta of FDI was 0.099. Thus, 0.099 was the path value,
or P9
j. the value of unstandardized coefficient beta of CR was -190.204. Thus, -190.204 was the path
value, or P10
k. The value of unstandardized coefficient beta of NPM was 0.547. Thus, 0.547 was the path
value, or P11
l. the value of unstandardized coefficient beta variable of DER was 15.389. Thus, 15.389 was the
path value, or P12
m. The value of unstandardized coefficient beta of FDI was 6.796. Thus, 6.796 was the path value,
or P13
Figure 6. Path Diagram Value
Volume 1, Issue 2, May 2020 E-ISSN : 2721-303X, P-ISSN : 2721-3021
Available Online: https://dinastipub.org/DIJEFA Page 285
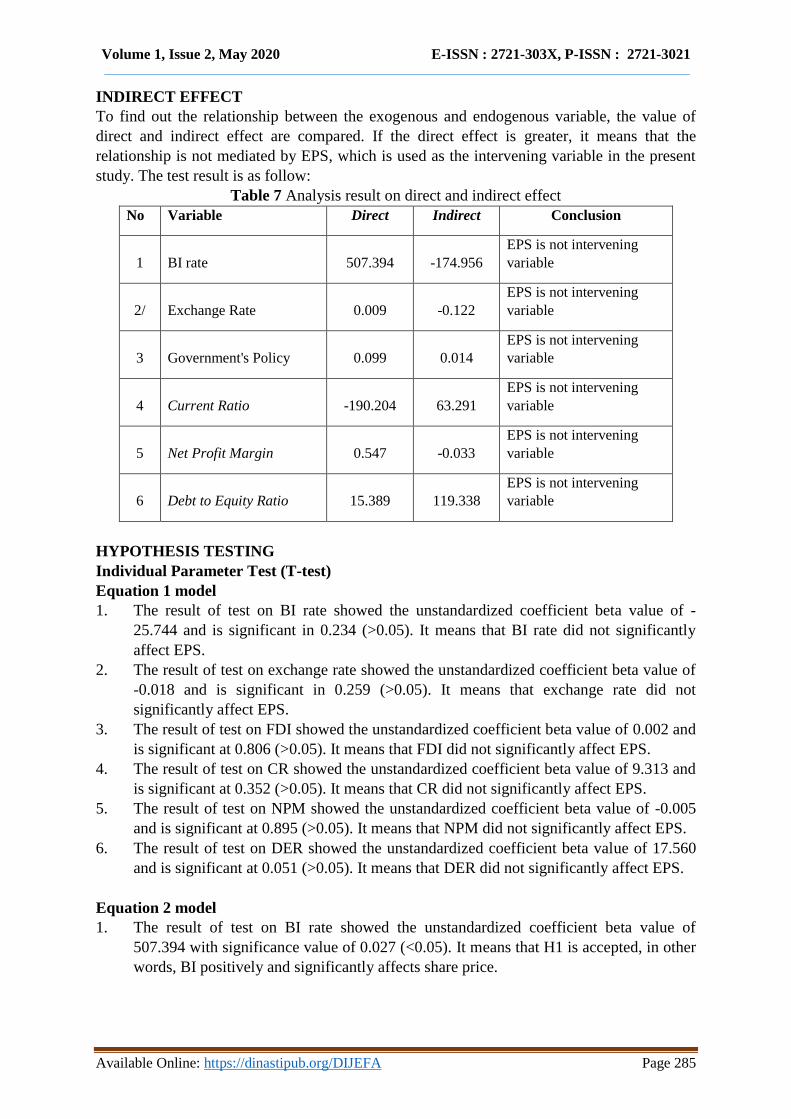
INDIRECT EFFECT
To find out the relationship between the exogenous and endogenous variable, the value of
direct and indirect effect are compared. If the direct effect is greater, it means that the
relationship is not mediated by EPS, which is used as the intervening variable in the present
study. The test result is as follow:
Table 7 Analysis result on direct and indirect effect
No Variable Direct Indirect Conclusion
1 BI rate 507.394 -174.956
EPS is not intervening
variable
2/ Exchange Rate 0.009 -0.122
EPS is not intervening
variable
3 Government's Policy 0.099 0.014
EPS is not intervening
variable
4 Current Ratio -190.204 63.291
EPS is not intervening
variable
5 Net Profit Margin 0.547 -0.033
EPS is not intervening
variable
6 Debt to Equity Ratio 15.389 119.338
EPS is not intervening
variable
HYPOTHESIS TESTING
Individual Parameter Test (T-test)
Equation 1 model
1. The result of test on BI rate showed the unstandardized coefficient beta value of -
25.744 and is significant in 0.234 (>0.05). It means that BI rate did not significantly
affect EPS.
2. The result of test on exchange rate showed the unstandardized coefficient beta value of
-0.018 and is significant in 0.259 (>0.05). It means that exchange rate did not
significantly affect EPS.
3. The result of test on FDI showed the unstandardized coefficient beta value of 0.002 and
is significant at 0.806 (>0.05). It means that FDI did not significantly affect EPS.
4. The result of test on CR showed the unstandardized coefficient beta value of 9.313 and
is significant at 0.352 (>0.05). It means that CR did not significantly affect EPS.
5. The result of test on NPM showed the unstandardized coefficient beta value of -0.005
and is significant at 0.895 (>0.05). It means that NPM did not significantly affect EPS.
6. The result of test on DER showed the unstandardized coefficient beta value of 17.560
and is significant at 0.051 (>0.05). It means that DER did not significantly affect EPS.
Equation 2 model
1. The result of test on BI rate showed the unstandardized coefficient beta value of
507.394 with significance value of 0.027 (<0.05). It means that H1 is accepted, in other
words, BI positively and significantly affects share price.
Volume 1, Issue 2, May 2020 E-ISSN : 2721-303X, P-ISSN : 2721-3021
Available Online: https://dinastipub.org/DIJEFA Page 286
2. The result of test on exchange rate showed the unstandardized coefficient beta value of
0.090 with significance value of 0.596 (>0.05). It means that H2 is rejected, in other
words, BI did not significantly affect share price.
3. The result of test on FDI showed the unstandardized coefficient beta value of 0.090
with significance value of 0.596 (>0.05).It means that H3 is rejected, in other words,
FDI did not significantly affect share price.
4. The result of test on CR showed the unstandardized coefficient beta value of 190.204
with significance value of 0.072 (>0.05). It means that H4 is rejected, in other words,
CR did not significantly affect share price.
5. The result of test on NPM showed the unstandardized coefficient beta value of 0.547
with significance value of 0.148 (>0.05). It means that H5 is rejected, in other words,
NPM did not significantly affect share price.
6. The result of test on DER showed the unstandardized coefficient beta value of 15.386
with significance value of 0.871 (>0.05). It means that H6 is rejected, in other words,
DER did not significantly affect share price.
7. The result of test on EPS showed the unstandardized coefficient beta value of 6.796
with significance value of 0.000 (<0.05). It means that H7 is accepted, in other words,
Earning per Share positively and significantly affects share price.
Coefficient of Determination
Equation 1 model shows R square of 0,007 or 0.7%. It means that EPS is accounted for by BI
rate, exchange rate, FDI, CR, NPM, DER by 0.7%, and the rest 97.3% is accounted for by
other variables outside the model.
Equation 2 model shows R square of 0,302 or 30.2%. It means that stock price is accounted
for by BI rate, exchange rate, FDI, CR, NPM, DER by 30.2%, and the rest 69.8% is
accounted for by other variables outside the model.
Hypothesis testing on Path Analysis
1. As shown in table 7, the value of indirect effect of BI rate (X1) was -174.956 and the
value of direct effect of BI rate (XI) was 507.394. It means that H8 is rejected.
2. The value of indirect effect of exchange rate (X2) was -0.122 and the value of direct
effect of exchange rate (XI) was 0.090. It means that H9 is rejected.
3. The value of indirect effect of government's policy (X3) was 0.014 and the value of
direct effect of exchange rate (X3) was 0.099. It means that H10 is rejected.
4. The value of indirect effect of CR (X4) was 63.291 and the value of direct effect of CR
(X4) was -190.204. It means that H11 is accepted.
5. The value of indirect effect of NPM (X5) was -0.033 and the value of direct effect of
NPM (X5) was 0.547. It means that H12 is rejected.
6. The value of indirect effect of DER (X6) was 119.338 and the value of direct effect of
DER (X6) was 15.389. It means that H13 is accepted.
DISCUSSION
The Effect of BI Rate on Stock Price
The result of the present study showed that BI rate has direct, positive effect on the stock
price of issuers in retail sector listed in IDX. Typically, when interest rate increase, the
economy will contract and the stock price tends to decrease. However for issuers in retail
Volume 1, Issue 2, May 2020 E-ISSN : 2721-303X, P-ISSN : 2721-3021
Available Online: https://dinastipub.org/DIJEFA Page 287
trading sector, especially those with imported capital goods, the increase of interest rate will
increase its stock value because if the benchmark rate increase, the rupiah's value against
dollar is strengthened because interest rate is able to strengthen the position of a country's
currency against other country's currency. Thus, the company can save its cost of capital for
importing goods.
The Effect of BI Rate on Stock Price with EPS as the Intervening Variable
EPS, in the present study, did not mediate the relationship between BI rate and stock price.
This is shown the by value of indirect effect of BI rate on stock price through EPS that is
smaller than the direct effect of BI rate on stock price.
The Effect of Exchange Rate on Stock Price
The result of the study showed that exchange rate did not have direct effect on stock price.
Exchange rate affects the stock of issuers who perform export-import activity. When rupiah
weakens against dollar, the cost to buy a product or service in an importing activity will
increase. This condition, of course, will affect the company's expense. However, it does not
affect the stock price. It is assumed that most of issuers in retail sector do not perform
transaction activity using USD, thus, exchange rate does not significantly affect the stock
price of issuers in retail sector.
The effect of Exchange rate on stock price with EPS as the intervening variable
EPS, in the model of the present study, did not mediate the relationship between exchange
rate and stock price of issuers in retail trading sector. EPS does not cause exchange rate to
affect the stock price. This is shown the by value of indirect effect of exchange rate on stock
price through EPS that is smaller than the direct effect of exchange rate on stock price.
The Government's Policy on Stock Price
The result of the present study showed that the government's policy did not directly affect the
stock price of issuers in retail sector listed in IDX. FDI did not partially affect the stock price.
The government‟s policy, particularly regarding a business can trigger or accelerate the
economic activity of a country, including Indonesia. In this study, the government‟s policy,
especially foreign investment, did not affect the stock price. In this case, foreign investment
did not only focus on retail trading sector, accordingly it did not affect the stock price of the
issuers in retail trading sector.
The effect of Government’s Policy on stock price with EPS as the intervening variable
EPS, in the present study, did not mediate the relationship between the government's policy
and stock price. EPS does not make government's policy affect the stock price. This is shown
the by value of indirect effect of Government's Policy on stock price through EPS that is
smaller than the direct effect of Government's Policy on stock price.
The Effect of Current Ratio on Stock Price
The result of the study showed that CR did not have direct effect on stock price. In a stock
exchange, a company's liquidity is one of the fundamental factors to determine the quality of
a stock. However, it does not indicate whether or not it is capable of making profit in the
future. High liquidity can also indicate that the company has current assets that is not
managed optimally, this may reduce the company's profit making ability. Thus, it may lead to
decrease the company‟s stock price because its liquidity value does not reflect the company‟s
ability of consistently making profit. This condition causes investors not to include current
ratio as an indicator when making an investment decision, and causes current ratio to not
affect the company's stock price.
Volume 1, Issue 2, May 2020 E-ISSN : 2721-303X, P-ISSN : 2721-3021
Available Online: https://dinastipub.org/DIJEFA Page 288
The Effect of Current Ratio on Stock Price with EPS as the Intervening Variable
EPS, in the model of the present study, did not mediate the relationship between CR and
stock price of issuers in retail trading sector. EPS does not make CR affect the stock price.
This is shown the by value of indirect effect of CR on stock price through EPS that is smaller
than the direct effect of CR on stock price.
The effect of Net Profit Margin (NPM) on stock price
The result of the present study showed that NPM did not directly affect the stock price of
issuers in retail sector listed in IDX. NPM refers to an amount of profit gained by a company
in a period. Bigger margin means better condition, meaning that the company can optimize
the cost required in making sales. However, NPM does not explain how much profit is gained
for each company‟s capital in each stock sheet. If the margin value is high but the nominal is
low, investors will not make any investment in the company. This is the reason why NPM
did not affect the company's stock price.
The Effect of Net Profit Margin on Stock Price with EPS as the Intervening Variable
EPS, in the model of the present study, did not mediate the relationship between NPM and
stock price of issuers in retail trading sector. EPS does not cause NPM to affect the stock
price. This is shown the by value of indirect effect of NPM on stock price through EPS that is
smaller than the direct effect of NPM on stock price.
The Effect of Debt to Equity Ratio on Stock Price
The result of the study showed that DER did not have direct effect on stock price. DER
represents the amount of debt that serves as the company‟s capital, a higher debt to equity
value of a company means that a company is solved. However, stable DER value is also
interpreted that the company is not in business expansion process, while the expansion is
done to enhance the possibility of greater income, which eventually will affect the company‟s
stock price. There is also possibility that high DER did not increase the company‟s profit due
to company's poor expansion strategy. This condition may cause DER value to not affect the
company‟s price.
The Effect of Debt to Equity Ratio on Stock Price with EPS as the Intervening Variable
EPS, in the present study, mediates the relationship between the DER and stock price. EPS
does not cause DER to affect the stock price. This is shown the by value of indirect effect of
DR on stock price through EPS that is greater than the direct effect of DER on stock price.
The Effect of Earning Per Share (EPS) on stock price
The result of the study showed that EPS positively affects stock price. Earning per share
refers to amount of company‟s profit in one stock sheet in the stock market, bigger EPS is
more attracting for investors. Based on the result of the present study, EPS affects the stock
price of issuers in retail trading sector. This occurs because investors view the company‟s
performance based on its ability to make profit, which is shown by the EPS.
CONCLUSION AND SUGESTION
Conclusion
Based on the result of the study and the discussion, the conclusion can be drawn as follow:
1. BI rate positively and directly affect stock price.
2. BI rate did not indirectly affect stock price
3. Exchange rate did not directly affect stock price.
4. Exchange rate did not indirectly affect stock price.
5. BI rate did not directly affect stock price
Volume 1, Issue 2, May 2020 E-ISSN : 2721-303X, P-ISSN : 2721-3021
Available Online: https://dinastipub.org/DIJEFA Page 289
6. BI rate did not indirectly affect stock price
7. Current ratio did not directly affect stock price.
8. Current ratio indirectly affects stock price
9. Net Profit Margin did not directly affect stock price
10. Net Profit Margin did not indirectly affect stock price.
11. Debt to Equity Ratio did not directly affect stock price
12. Debt to Equity Ratio indirectly affects stock price
13. Earning per Share directly affects stock price.
Suggestion
For Companies
a. BI rate is one of the factors affecting stock price of issuers in retail trading sector. This
benchmark rate is beyond the issuer's control because it is the policy issued by the Indonesian
government. However the issuers can analyze or read opportunities and perform preventive
action when the government is being hawkish. The ability to read opportunities in every
difficulties (blessing in disguise) will make companies in retail sector keep exist as the driver
of economy and make their stock become defensive stock due to their ability to not be
significantly affected by Indonesia‟s macro economy.
b. EPS is also a variable that affects stock price. It is in line with the company's ability to read
every opportunity and perform preventive action to cope with market uncertainty. Improving
performance to gain stable EPS is one of methods to maintain the stability of issuers in retail
trading sector listed in IDX. When these companies manage to show satisfactory performance
in the midst of global uncertainty or technology disruption. Their business can surely grow
and attract any investors, which eventually will strengthen the company's foundation to be a
long-term prospect company.
For Future Researcher
Theoretically, BI rate and EPS are the factors that form the stock price of issuers in retail
trading sector. Using top down analysis, BI rate contributes to the formulation of stock price
in macroeconomic dimension. Fundamentally, EPS serves as one of factor that forms the
company‟s stock price. By using bottom up analysis, other theories can be found to
complement the theory tested in the present study. Thus, each element can understand the
factors affecting the stock price of an issuer, either from business development perspective or
from public perspective.
REFERENCE
Bank Indonesia 2019, Data Survei Penjualan Eceran April 2019, Bank Indonesia, dilihat 20
Juni 2019, https://www.bi.go.id/id/publikasi/survei/penjualan-eceran/Pages/SPE-April-
2019.aspx
Brigham, Eugene F, & Joel F Houston, 2010, Dasar-dasar manajemen keuangan,
Penerjemah: Ali Akbar Yulianto, Edisi 10, Buku 1, Salemba Empat, Jakarta.
Darsono, & Ashari. (2010). Pedoman Praktis Memahami Laporan Keuangan (Tips Bagi
Investor, Direksi, dan Pemegang Saham). Yogyakarta: Andi.
Harmono, Manajemen Keuangan, (Jakarta: Bumi Aksara, 2011), h. 106
https://dosenakuntansi.com/rasio-solvabilitas.
Imoney, 2013, Perusahaan Besar Maka Harga Saham Tinggi ?, 07 Maret 2013, dilihat 20
Juni 2019, < https://www.aturduit.com/articles/perusahaan-besar-harga-saham-tinggi-
anda-salah/>
Volume 1, Issue 2, May 2020 E-ISSN : 2721-303X, P-ISSN : 2721-3021
Available Online: https://dinastipub.org/DIJEFA Page 290
Parjiono, Fithra Faisal, & Wisnu, I. 2018, Kebijakan Multilateral dan Pembangunan
Ekonomi Indonesia, PT Gramedia Pustaka Utama, Jakarta.
Rismawati. 2013, „Pengaruh Pertumbuhan Aset, Tingkat Suku bunga SBI terhadap kebijakan
Deviden dan Nilai Perusahaan pada di BEI‟ Jurnal Fakultas Keuangan Fakultas
Ekonomi dan Bisnis Universitas Udayana, Bali.
Sugiyono, 2003, Metode Penelitian Bisnis, Pusat Bahasa Depdiknas, Bandung.
Sukirno, Sadono. 2011, Makro Ekonomi Teori Pengantar, Edisi Ketiga. Jakarta: Rajawali
Pers.