‘the macro-economic rebound effect and the uk …ukerc.rl.ac.uk/pdf/ee01015_final_b.pdf · the...
TRANSCRIPT

THE MACRO-ECONOMIC REBOUND EFFECT AND THE UK ECONOMY
4CMR Cambridge Centre for Climate Change Mitigation Research,
Department of Land Economy, University of Cambridge,
with
Cambridge Econometrics (CE) Ltd., Policy Studies Institute (PSI), University of Westminster,
and Dr Horace Herring, Open University
Final Report to Defra
18 May 2006

The Macroeconomic Rebound Effect and the UK Economy 4CMR
2
Cambridge Centre for Climate Change Mitigation Research (4CMR) Department of Land Economy, University of Cambridge 4CMR’s overarching objective is ‘To foresee strategies, policies and processes to mitigate human-induced climate change, which are effective, efficient and equitable, including understanding and modelling transitions to low-carbon energy-environment-economy systems.’ To address this objective, expert knowledge from many disciplines is essential, including expertise in communicating between disciplines and in filling poorly researched gaps in knowledge. The disciplines include economics, energy, environment, engineering, politics, systems analysis, applied mathematics and computing. The Centre is inter-disciplinary and its research effort is expected to be at the leading edge of UK and international research in the area of climate-change mitigation. Cambridge Centre for Climate Change Mitigation Research (4CMR), Department of Land Economy, University of Cambridge, 22 Trumpington Street, Cambridge CB2 1QA UK Tel.: +44 (0)1223 764874 E-mail: [email protected] Website: http://www.landecon.cam.ac.uk/4CMR/4CMR.htm This study was undertaken by Cambridge Centre for Climate Change Mitigation Research (4CMR), in collaboration with Cambridge Econometrics (CE) Ltd., Policy Studies Institute (PSI) and Horace Herring from the Open University. The report was primarily written by Terry Barker and Tim Foxon from 4CMR. The following also contributed to the research undertaken and/or specific parts of the report: Jonathan Rubin (4CMR), Sudhir Junankar (CE), Ole Lofnaes (CE), Paul Ekins (PSI), Paolo Agnolucci (PSI) and Horace Herring. The authors are grateful to Tina Dallman from the Department for Environment, Food and Rural Affairs (Defra), who commissioned this report and supported the research, along with her colleagues on the project steering committee: Alistair Rennie (Defra), Carsten Rohr (Defra), Ewa Kmietowicz (DTI) and Salina Ladha (DfT). © 4CMR, Cambridge, May 2006
The Macroeconomic Rebound Effect and the UK Economy 4CMR
3
Contents Executive Summary ............................................................................................................ 4
1. Introduction................................................................................................................. 8
2. Methodology ............................................................................................................. 11
3. Review of Literature on Macroeconomic Rebound Effect ....................................... 13 3.1. The economists’ debate.......................................................................................... 13 3.2. Review of modelling approaches ........................................................................... 15
4. Basic Structure of MDM-E3 Modelling .................................................................... 19 4.1. Overview of MDM-E3............................................................................................ 19 4.2. Modelling the macroeconomic rebound in MDM-E3............................................ 21
5. Description of Policies and Scenarios........................................................................ 26 5.1. UK energy efficiency policies and programmes .................................................... 26 5.2. Scenarios................................................................................................................ 32 5.3. Scenario assumptions............................................................................................. 34 5.4. Including the energy-saving from the policies in MDM-E3 .................................. 37
6. Results........................................................................................................................ 38 6.1. Macroeconomic effects of energy efficiency policies............................................. 39 6.2. Impacts of energy efficiency policies on energy demand and CO2 emissions ....... 42 6.3. Impacts of sector-by-sector energy efficiency policies .......................................... 49 6.4. Calculation of macro-economic rebound effect..................................................... 51
7. Scenario and sensitivity analysis .............................................................................. 57 7.1. Effects of enhancing energy efficiency policies ..................................................... 57 7.2. A comparison of effects of energy efficiency policies and of higher world oil prices....................................................................................................................................... 59 7.3. Comparison of effects of energy efficiency policies and of higher EU ETS allowance prices (EAP) ................................................................................................ 62 7.4. Sensitivity analysis on energy efficiency policies and the rebound effect.............. 64
8. Conclusions............................................................................................................... 66
References......................................................................................................................... 68
Annex 1. Description of energy efficiency policies and related modelling assumptions . 70
Annex 2. MDM-E3 as an Energy-Environment-Economy Model ................................... 85
Annex 3. Questions raised by Defra ................................................................................. 95
Annex 4. Workshop on ‘Macroeconomic Rebound Effect and the UK economy’ .......... 96
Annex 5. Illustrative model for energy savings ................................................................ 98
The Macroeconomic Rebound Effect and the UK Economy 4CMR
4
Executive Summary Purpose of the study The study examines the macroeconomic rebound effect for the UK economy, arising from UK energy efficiency policies and programmes for 2000-2010. The work explores the relationships between energy efficiency, energy consumption, economic growth and policy interventions using a well-established and highly detailed macroeconomic model of the UK economy. The work has been carried out in response to a call from the UK Department for Environment, Food and Rural Affairs (Defra), with the support of Defra’s energy-efficiency policy team. As the focus of this study is to assess the magnitude of the macroeconomic rebound effect, the projections given in the report should not be taken as forecasts of future UK economic or environmental performance, e.g. the projections given here will differ from those in the 2006 Climate Change Programme. The rebound effect The rebound effect refers to the idea that some or all of the expected reductions in energy consumption as a result of energy efficiency improvements are offset by an increasing demand for energy services, arising from reductions in the effective price of energy services resulting from those improvements. The evidence for a rebound effect from improved energy efficiency is the subject of a systematic review by the UK Energy Research Centre’s Technology and Policy Assessment function, which is due to report later in 2006. Based on a review of the literature, they distinguish between three types of rebound effect: direct, indirect and economy-wide. Most of the literature has focused on examining direct rebound effects: the increase in the demand for the same energy service, e.g. home heating, resulting from improvements in energy efficiency for that particular energy service. However, the lower effective price of the energy service leads to indirect rebound effects through changes in the demand for other goods and services or for other factors of production, and economy-wide rebound effects: the cumulative impact of numerous energy efficiency improvements throughout the economy on energy demands and economic growth. These macroeconomic rebound effects are less well-understood. The macroeconomic rebound effect here refers to the combination of the indirect and economy-wide rebound effects. The House of Lords debate on the effect The question of the scale of the macroeconomic rebound effect was raised in a report by the House of Lords Science and Technology Committee in 2005. They noted that the proposition that improvements in energy efficiency can lead to significant reductions in energy demand and hence in greenhouse gas emissions (GHG) remains the subject of debate among economists. The argument that macroeconomic effects are likely to give rise to significant rebound effects or even ‘backfire’, whereby all the expected energy savings are lost, is referred to as the “Khazzoom-Brookes postulate”, after the two economists who put forward this position forcefully in the early 1990s. The counter-position, that macroeconomic rebound effects are likely to be small, and hence that policy-induced energy efficiency will lead to significant reductions in energy demand and GHG emissions, was argued by other energy economists, including Michael Grubb and Amory Lovins. This debate is reviewed in Chapter 3 of this report.

The Macroeconomic Rebound Effect and the UK Economy 4CMR
5
This study of the macroeconomic rebound effect This study contributes to this debate by examining the macro-economic rebound effect on the UK economy from energy efficiency policies and programmes for final energy users, using an energy-environment-economy model of the UK economy. The policies are targeted at improving market performance in energy efficiency through improving information, reducing or removing barriers and correcting for market failures. The modelling allows for the existence of these potential improvements. No assumption is made that the economy is in equilibrium or at full employment of resources. The effects are disaggregated by industry, households, transport and commerce. The study focuses on the macroeconomic implications of energy efficiency policies and programmes, and does not provide an evaluation of their likely effectiveness at a micro level. The macroeconomic rebound effect is investigated using a macroeconomic model of the UK economy (MDM-E3), together with a review of the literature and expert analysis. The Cambridge MDM-E3 model The modelling of the macroeconomic rebound effect uses a version of the Cambridge Multisectoral Dynamic Model of the UK energy-environment-economy (E3) system (MDM-E3), described in Chapter 4 and Annex 2. This is the UK’s most detailed E3 model, designed to analyse and forecast changes in economic structure, energy demand and resulting environmental emissions. The model is a combination of time-series econometric relationships and cross-section input-output relationships. Although it forms aggregate demand in a Keynesian manner, with a consumption function and investment equations, it also includes equations for the supply and price of labour, e.g. for average earnings by industry and region. In particular, MDM-E3 incorporates detailed energy systems and electricity-sector modelling, partly based on the approach adopted by the UK Department of Energy (now a branch of the DTI), but using co-integrating techniques to distinguish the short-term dynamic responses from the long-term relationships. The richness of the model enables analysis of interactions and feedback effects between different sectors – industries, consumers, government – and the overall macroeconomy. This enables assessment of the impact of government energy efficiency policies and programmes on energy inputs and environmental emissions throughout the UK economy. The effects of the energy efficiency policies are calculated by comparing dynamic model solutions 2000-2100 with and without the policies. Estimates of the effects of energy efficiency policies and the direct rebound effect As the focus of this study is on macroeconomic effects, the direct effects on energy savings and costs of UK energy efficiency policies and programmes have been estimated from the literature and engineering studies, principally the evaluations carried out by Future Energy Solutions (FES) and the Policy Studies Institute (PSI) on the domestic, industry and commerce sector policies and by the Department for Transport on the voluntary agreement package for the transport sector. These evaluations also included estimates of the direct rebound effect for each policy measure, so-called ‘comfort taking’, and these estimates are incorporated exogenously into the macroeconomic model.

The Macroeconomic Rebound Effect and the UK Economy 4CMR
6
The scenarios used in the modelling reflect the set of UK energy efficiency policies and programmes for the different sectors of the economy for the period 2000-2010, and are described in Chapter 5. These policies cover the domestic sector: Building Regulations (domestic), Energy Efficiency Commitment (EEC), Energy Efficiency Levy – Northern Ireland, Warm Front, Community Energy and the Market Transformation Programme; the business sector: Climate Change Agreements, and the Carbon Trust’s Reducing Carbon Emissions Now and Developing Low Carbon Technologies Programmes; for the commercial and public sector: Building Regulations (non-domestic) and Public Sector targets; and the transport sector: Voluntary Agreement Package (including Company Car Tax and Graduated Vehicle Excise Duty). These are the main energy-efficiency policy measures in the UK Government’s Climate Change Programme, the 2003 Energy White Paper and the 2004 Energy Efficiency Action Plan. These policies are together expected in the 2006 Climate Change Programme to lead to reductions in CO2 emissions by 2010 of around 12 mtC, relative to a baseline without these policies. Results of modelling energy efficiency policies The main modelling results of this study are given in Chapter 6, presented as the difference between a base case, which includes all the above energy efficiency policies, and a reference case, without these policies. Overall, we find that the policies lead to a saving of about 8% of the energy which would otherwise have been used by 2010 and a reduction in CO2 emissions of 10% (or 14 mtC) by 2010, which is higher than the official projections. There are also positive macroeconomic effects: firstly lower prices and lower inflation, as the production system requires fewer inputs to produce the same output; and secondly higher output and growth, partly the consequence of the lower inflation, as households spend more in response to their higher imputed income when their energy bills are reduced for the same level of energy services provided. We find a 0.3 percentage point (pp) reduction in the annual growth rate of prices for 2005-10 and a 0.1pp increase in the annual GDP growth rate for 2005-10. The reduction in energy demand varies between sectors, with the household sector showing the largest reduction in absolute terms, and the energy-intensive industries showing the largest relative reduction, as a percentage of their energy demand, at 15%, compared with 10% for households, 6% for road transport, 5% for commerce. This is expected as the strongest energy efficiency policies are the Climate Change Agreements (CCAs) targeted at energy-intensive industries, and those focused on the household sector, notably the Energy Efficiency Commitment. The largest reductions in CO2 emissions are from power generation, reflecting reductions in final electricity demand in the household and industrial sectors. We also find that no major interactions between policies, that is we find much the same effects when the policies are applied separately, sector-by-sector, as opposed to being applied for all the sectors together. Estimates of the macroeconomic rebound effect We find that the macroeconomic rebound effect arising from UK energy efficiency policies for the period 2000-2010 is around 11% by 2010, averaged across sectors of the economy. When this is added to the (assumed) direct rebound effect of around 15%, this gives a total rebound effect of around 26% arising from these policies. The

The Macroeconomic Rebound Effect and the UK Economy 4CMR
7
decomposition of these effects is interesting. The largest direct rebound effects are for the road transport and household sectors, whereas the largest indirect and economy-wide rebound effects are for the energy-intensive and other industry sectors, with small direct, indirect and economy-wide rebound effects for the commerce sector. Thus, the findings of our study support the argument that energy efficiency improvements, for both consumers and producers, stimulated by policy incentives do not give rise to a large macroeconomic rebound effect. The effects of scaling up the energy efficiency policies In Chapter 7, we report further scenario and sensitivity analysis. A scenario enhancing energy efficiency policies, by scaling the existing policies with an additional 50% strength across the board, leads to effects on the key macroeconomic variables that are close to an additional 50% of the effects of actual energy efficiency policies, and to a greater than 50% additional reduction in energy demand and CO2 emissions. Carbon saving by energy efficiency versus higher oil, gas and EU ETS allowance prices Scenarios for higher oil and gas prices, and higher EU ETS allowance prices (EAP) were calibrated to produce the same CO2 savings as for the energy efficiency policy base case. This highlights the finding that the macroeconomic effects are completely different, though the results have to be interpreted with strong qualifications because monetary and fiscal policies are not adjusted to accommodate the price changes (so the price effects will be overstated and the growth effects understated). The higher oil (from $40 to $57/bl) and gas prices lead to a 1pp increase in the annual growth rate of prices for 2005-10 and a 0.3pp decrease in the annual GDP growth rate for 2005-10; if interest rates were higher to choke off the extra inflation, growth would be depressed even more. An increase in the EAP in phase 2 of the ETS (from €32 to €79/tCO2) leads to a 0.7pp increase in the annual growth rate of prices for 2005-10 and a 0.2pp decrease in the annual GDP growth rate for 2005-10. The EAP targets carbon use in the electricity and energy-intensive sectors, so CO2 emissions are reduced more than fuel use. Sensitivity analysis The sensitivity of the effects of energy efficiency policies to different oil, gas and EU ETS allowance prices was tested and we found that the policies become even more effective under more inflationary conditions because they reduce cost pressures and promote industry transformation. The sensitivity of the base-case total rebound effect (direct plus macroeconomic) was analysed for four scenarios: (1) the enhanced energy efficiency policy case, (2) the case with all energy efficiency policies for the period 2000-2010 being brought in at 2000, (3) the sensitivity test for higher oil and gas prices and (4) the sensitivity test for higher EU ETS Allowance prices. There is some sensitivity of the macro-economic rebound effects to these changes, with the estimates for the total rebound effect in the range 22% to 29%. These results are conditional on the assumptions that the various estimated price and income elasticities and other parameters in the model are fixed, as well as on the general econometric approach and the estimates we have used for the direct rebound effect. The sensitivity analysis suggests that concerns about the macroeconomic rebound effect should not prevent further strengthening of UK energy efficiency policies.
The Macroeconomic Rebound Effect and the UK Economy 4CMR
8
1. Introduction The main objective of this work is to examine the macro-economic rebound effect on the UK economy from energy efficiency policies and programmes. The work explores the relationships between energy efficiency, energy consumption, economic growth and policy interventions using a well-established and highly detailed macroeconomic model of the UK economy. This work has been carried out in response to a call from Defra, with the support of Defra’s energy efficiency policy team. The question of the scale of the macro-economic rebound effect was raised in a report by the House of Lords Science and Technology Committee:-
‘The Government’s proposition that improvements in energy efficiency can lead to significant reductions in energy demand and hence in greenhouse gas emissions remains the subject of debate among economists. The “Khazzoom-Brookes postulate”, while not proven, offers at least a plausible explanation of why in recent years improvements in “energy intensity” at the macroeconomic level have stubbornly refused to be translated into reductions in overall energy demand. The Government has so far failed to engage with this fundamental issue, appearing to rely instead on an analogy between micro- and macroeconomic effects.’ (HoL Science and Technology Committee, 2005, Paragraph 7)
The rebound effect refers to the idea that some or all of the expected reductions in energy consumption as a result of energy efficiency improvements are offset by an increasing demand for energy services, arising from reductions in the effective price of energy services arising from those improvements. The UK Energy Research Centre (UKERC)’s Technology and Policy Assessment function is undertaking a systematic review of “The Evidence for a Rebound Effect from Improved Energy Efficiency”, which is to be completed in summer 2006 (Sorrell and Dimitropoulos, 2005). That review follows Greening et al. (2000) to distinguish between three types of rebound effect:
• Direct rebound effects: Improved energy efficiency for a particular energy service will decrease the effective price of that service and should therefore lead to an increase in consumption of that service. This will tend to offset the expected reduction in energy consumption provided by the efficiency improvement. The direct rebound effect is confined to the energy required to provide the relevant energy service. Moreover, it is highly specific to the sector to which a particular energy efficiency measure applies, details of the technologies involved, the energy services demanded by the social groups affected and the income levels of the group. For example, the direct rebound effect is likely to be much higher for low-income groups for whom energy expenditures are a large proportion of their total expenditure as they are likely to take efficiency benefits in the form of higher levels of energy service (e.g. heating house to a higher temperature).

The Macroeconomic Rebound Effect and the UK Economy 4CMR
9
• Indirect rebound effects: For consumers, the lower effective price of the energy service will lead to changes in the demand for other goods and services. To the extent that these require energy for their provision, there will be indirect effects on aggregate energy consumption. For example, the cost savings obtained from a more efficient central heating system may be put towards an overseas holiday, with a consequent impact on kerosene consumption. Analogous indirect effects apply to producers, where efficiency improvements lead to changes in demand for other factors of production. At the same time, the lower cost of outputs from one sector may lower the cost of inputs to another sector and thereby increase both production and consumption throughout the economy. For example, energy efficiency improvements in steel production may reduce the price of steel, which in turn may reduce the price of cars, increase the demand for cars and thereby increase the demand for gasoline.
• Economy wide rebound effects: The indirect effects from individual energy efficiency improvements may be relatively small. However, the cumulative impact of numerous energy efficiency improvements throughout the economy could potentially be large. A fall in the real price of energy services will reduce the price of intermediate and final goods throughout the economy, leading to a series of price and quantity adjustments, with energy-intensive goods and sectors gaining at the expense of less energy-intensive ones. In particular, energy efficiency improvements may be expected to reduce energy prices, which in turn should increase aggregate energy demand1. Energy efficiency improvements may also increase economic growth, which should itself increase energy consumption.
The Khazzoom-Brookes postulate (Saunders, 1992, 2000) is an interpretation of the rebound effect at the macroeconomic level suggesting that all energy efficiency measures might be offset in their effects on aggregate energy saving by associated increases in energy demand. The likely magnitude of this macroeconomic rebound effect is clearly of great interest to UK energy and climate policy, as the majority of the additional measures in the UK Climate Change Programme (Defra, 2000) are aimed at incentivising energy efficiency improvements in the household, business, commercial and public and transport sectors. As the House of Lords Committee notes, this has been the subject of lively debate among economists, largely between those who argue on the basis of neo-classical economic theory that the effect will be large and those who argue on the basis of alternative assumptions and empirical findings that the effect is small. The main objective of our study is to contribute to this debate by examining the macro-economic rebound effect on the UK economy from energy efficiency programmes, using an energy-environment-economy model of the UK economy. We take the macro-economic rebound effect to cover the indirect and economy-wide rebound effects, as defined above.
1 Note that this definition refers to case of global energy efficiency improvements reducing global energy prices. Energy efficiency improvements in the UK are, of course, not likely to affect global energy prices. However, we find that UK energy efficiency improvements reduce costs of energy-intensive industries and so reduce their prices below what they would have been otherwise, which in turn will increase their output and so increase aggregate energy demand.
The Macroeconomic Rebound Effect and the UK Economy 4CMR
10
The effects are disaggregated by:
- industry (with SIC levels stated); - households; - transport; and - commerce.
Note that this study focuses on the macroeconomic implications of energy efficiency policies and programmes for final users of energy, and does not provide an evaluation of their likely effectiveness at a micro level. In addition, the study excludes consideration of energy efficiency policies directed at the energy producers themselves, e.g. best-practice benchmarking policies for the electricity industry. The work is being led by 4CMR (Cambridge Centre for Climate Change Mitigation Research) in the Department of Land Economy, Cambridge University. 4CMR is a new Centre, focusing on energy-environment-economy (E3) econometric and simulation modelling at UK, European and global levels, analysing the detailed implications for national and international energy systems and economies of policies that promote long-term technological change. The Centre works closely with Cambridge Econometrics Ltd., who carried out the detailed macro-economic modelling for this work using the Cambridge Multisectoral Dynamic Model of the British economy (MDM-E3). The synthesising of relevant data was carried out by the Policy Studies Institute (PSI) at the University of Westminster, largely drawing on a previous evaluation of the UK government’s energy efficiency policies and programmes produced by Future Energy Solutions and PSI (FES/PSI, 2005). A review of the literature on the macro-economic rebound effect was carried out by Dr Horace Herring from the Open University, a leading expert in this area. 4CMR are responsible for the overall project co-ordination and production of interim and final reports.
The Macroeconomic Rebound Effect and the UK Economy 4CMR
11
2. Methodology The macroeconomic rebound effect arising from UK energy efficiency policies and programmes is being investigated in this project using a macroeconomic model of the UK economy (MDM-E3), together with a review of the literature and expert analysis, including a specially convened workshop. A review of the literature (Chapter 3) on the macroeconomic rebound effect was undertaken, covering the debate from the early 1990s as to the likely effectiveness of energy efficiency policies in contributing to greenhouse gas emissions reductions, and the three main modelling approaches: growth theory, general equilibrium modelling and energy-economy-environment modelling. The basic structure of the MDM-E3 modelling is described in Chapter 4, together with how the model is used to analyse the macroeconomic rebound effect and key issues to be analysed. In brief, the model has been used with an “open” solution in that fiscal (except energy) policies and monetary policies have been treated as largely exogenous, i.e. tax rates, government expenditures (in volume terms), the exchange rate and interest rates are all fixed at base case levels. The model has been used to explore the implications of energy efficiency policies for energy demand, growth and inflation, assuming there are no specific macroeconomic policy responses from HM Treasury or the Bank of England. The effects of the energy efficiency policies are calculated by comparing model solutions 2000-2100 with and without the policies. The implications for fiscal and monetary policy are discussed in Chapter 6. A more complete description of the modelling approach is given in Annex 2. Chapter 5 gives a description of the scenarios used in the modelling, which reflect the set of UK energy efficiency policies and programmes for the different sectors of the economy for the period 2000-2010. These cover the domestic sector: Building Regulations (domestic), Energy Efficiency Commitment (EEC), Energy Efficiency Levy – Northern Ireland, Warm Front, Community Energy and the Market Transformation Programme; the business sector: Climate Change Agreements, and the Carbon Trust’s Reducing Carbon Emissions Now and Developing Low Carbon Technologies Programmes; for the commercial and public sector: Building Regulations (non-domestic) and Public Sector targets; and for the transport sector: Voluntary Agreement Package (including Company Car Tax and Graduated Vehicle Excise Duty). These are the main energy efficiency policy measures in the UK Government’s Climate Change Programme in 2000 (Defra, 2000), the 2003 Energy White Paper (DTI, 2003), and the 2004 Energy Efficiency Action Plan (Defra, 2004). The expected annual energy savings due to actions taken in response to each of the policies was taken from an evaluation of the Government’s energy efficiency policies and programmes undertaken by Future Energy Solutions and the Policy Studies Institute (FES/PSI, 2005), and a separate evaluation of the Voluntary Agreement Package for the transport sector undertaken by the Department for Transport (DfT, 2005), both undertaken for the Government’s Climate Change Programme Review. These evaluations

The Macroeconomic Rebound Effect and the UK Economy 4CMR
12
include the direct effects on energy savings, the costs to the exchequer, firms and individuals where available, and estimates of any known direct rebound effects, i.e. increase in consumption of the same energy service as a result of the decrease in the effective price of that service arising from energy efficiency measures, also referred to as ‘comfort taking’. A detailed description of each of the policies and programmes covered, together with the assumptions used in the modelling in relation to each policy are given in Annex 1. The macroeconomic rebound effects for the scenarios are then calculated using the MDM-E3 model of Cambridge Econometrics (see Annex 2 for a brief description), which automatically incorporates the macroeconomic and indirect effects through the input-output structure of the model. The findings are described in Chapter 6. The magnitude of the macroeconomic effects can be calculated by the model, provided that the direct effects of energy efficiency measures on the level of consumption of the corresponding energy service (the direct rebound effects) are given. MDM-E3 differentiates a wide range of energy end use activities for industry, households and transport, but these remain broad sectors and the policies are targeted at energy use within these sectors. In addition the model currently specifies energy use in terms of the level of physical energy demand, and not the energy service demand. For these reasons, we have chosen to estimate exogenously the magnitude of the direct rebound effect for a range of industry, household and transport sectors, based on review of the literature and our existing expert knowledge of this literature, and impose them in the model. The macroeconomic rebound effects are calculated by taking the difference between the energy saving projected by the model, taking into account the indirect effects throughout the economy, and the expected net sectoral energy saving (after allowing for the direct rebound effect) projected from energy-engineering studies for the policies. This difference is then expressed as a percentage of the expected gross energy saving from these studies. The formal macroeconomic modelling was supplemented by discussion of key issues relating to the macroeconomic rebound effect and the modelling approach at a workshop held at 4CMR in January 2006 with expert representatives from Defra and the academic community (see Annex 3). To aid the formal modelling, a simple illustrative spreadsheet model for annual energy demand was developed using the same structure for the energy demand equation as used in the full macroeconomic model. This illustrative model is briefly described in Annex 5. The theoretical approach being adopted in the modelling and report is that the economy is characterized by institutional behaviour by social groups in which inertia and convention dominate. Social groups differ in their access to information, and lack information about the future. They also exhibit different responses to uncertainty. It is assumed that technological change underlies much of economic growth and performance in many sectors. Economies of scale and specialization are widespread. In these conditions, many opportunities for energy efficiency will not be taken up for the many reasons outlined in Chapter 3 below. It is assumed that all these features can be measured by econometric techniques, allowing for differences in returns to scale and levels of competition between sectors, and included in a macroeconomic model.

The Macroeconomic Rebound Effect and the UK Economy 4CMR
13
3. Review of Literature on Macroeconomic Rebound Effect This chapter looks at the academic literature on the macro-economic effects of the rebound effect, particularly debates in the early 1990s and more recent modelling work. There is already an extensive literature on the rebound effect which has been summarised by Herring (1998, 2004), in a special issue of Energy Policy (Schipper and Grubb, 2000), by Peter Vikström (2004) and by a UKERC project (Sorrell and Dimitropoulos, 2005). While there is little theoretical dispute about the existence and magnitude of the rebound effect at the micro scale, there is much greater conceptual and empirical controversy over its magnitude at the macro-level. This is because of the difficulty of determining empirically its impact given the host of factors that affect national energy consumption.
3.1. The economists’ debate Debate broke out in the energy economics literature in the early 1990s as to the likely effectiveness of energy efficiency policies in contributing to greenhouse gas (GHG) emissions reductions, given the potential for rebound at the macroeconomic level. Despite further studies in the intervening period, the terms of the debate have changed little since these early exchanges. Both sides of the debate acknowledge that the issue was first raised by British economist William Stanley Jevons in his 1865 book, ‘The Coal Question’ (Jevons, 1865/1905). Jevons argued: ‘It is a confusion of ideas to suppose that the economical use of fuel is equivalent to diminished consumption. The very contrary is the truth’ …. ‘The reduction of the consumption of coal, per ton of iron, to less than one third of its former amount, was followed, in Scotland, by a ten fold increase in total consumption, between the years 1830 and 1863, not to speak of the indirect effect of cheap iron in accelerating other coal-consuming branches of industry'. In other words, an increase in the fuel efficiency of iron production led to increasing production of iron, and hence to a dramatic increase in the consumption of coal. This argument was taken up by Daniel Khazzoom in the U.S. and Len Brookes in the UK. Brookes (1990) argued that significant increases in energy productivity are observed historically, i.e. less energy is needed per unit of output, but that substitution of energy for labour and capital has generally led to more rapid improvements in total factor productivity and hence growth in overall output, resulting in increases in total energy consumption. He concluded that efforts to stimulate energy efficiency improvements could lead to increases rather than decreases in GHG emissions, without accompanying price measures. The counter position was put by Amory Lovins in the U.S. and Michael Grubb in the UK. Grubb (1990) argued that there are significant differences between ‘naturally-occurring’ energy efficiency improvements, i.e. those resulting from normal economic imperatives to reduce costs of production and find new markets, and energy efficiency improvements stimulated by direct incentives. He argued that the latter could focus on areas dominated by market failures/barriers, where the implicit price falls arising from efficiency
The Macroeconomic Rebound Effect and the UK Economy 4CMR
14
improvements would have little effect on activity levels. The existence of such barriers to the take-up of cost effective energy efficiency improvements has been widely argued and generally, though not universally accepted. Grubb (1990) summarises seven types of market barrier: • Lack of knowledge, knowhow and technical skills:
Many economic actors, including households, SMEs and public administrations generally know little about the possibilities for energy saving, or lack the skills to implement them;
• Separation of expenditure and benefit: Often referred to as the ‘tenant/landlord problem’, this refers to the fact that the actor paying for the installation of energy efficient equipment, typically the landlord, is not the person who benefits from the reduction in energy bills, typically the tenant.
• Limited capital, often arising from external restrictions on capital budgets: Particularly for households and SMEs, the amount of funds available for capital expenditure is limited, even when such spending would payback in a short time period.
• Rapid payback requirements: Private households and firms typically have much higher discount rates than the social discount rate, meaning that they require rapid payback times to justify investments.
• Impact of electricity and gas tariff structures: The existence of a fixed part to electricity and gas tariffs means that households would not recover the full benefits of energy efficiency improvements in the form of reduced bills.
• Lack of interest in peripheral operating costs: For many households and large and small firms, energy costs are a small part of total budgets, and so little attention is paid to the potential for cost-effective savings in this area.
• Legal and administrative obstacles: Finally, there may be a number of legal and administrative obstacles in the path of end-use efficiency.
Both sides in this debate agree that energy-saving technological change contributes to economic growth by stimulating ‘structural changes’ in economic activity, i.e. new activities that were not previously economically viable. However, Grubb and Lovins argue that energy efficiency policies primarily address market failures/barriers which prevent currently most energy efficient technology or system being used. Empirical evidence, such as that from The Carbon Trust (2005), suggests that a high level of cost-effective energy efficiency improvements can be found and implemented when attention is focussed on their potential by policy incentives. Hence, this debate raises the question: are (policy-) induced energy efficiency improvements mainly reducing economic inefficiencies through overcoming market barriers, or are they also likely to stimulate significant increased economic activity?
The Macroeconomic Rebound Effect and the UK Economy 4CMR
15
3.2. Review of modelling approaches A web search using Google was undertaken to identify work done on modelling the macro-economic rebound effect. This yielded a few more papers than were in the UKERC literature database, but generally any reference to the rebound effect was incidental to the main purpose of the papers. Overall there about 20 relevant papers, about 5 using growth theory dominated by the work of Harry Saunders, about 10 using a General Equilibrium approach and about 5 using energy-economy-environment models, including MARKAL. 1. Growth theory. The most important theoretical work on the rebound has been done by Harry Saunders:
• Fuel Conserving Production Functions. Draft manuscript, 2003. • A calculator for energy consumption changes arising from new technologies.
Topics in Economic Analysis & Policy 5/1 (2005). 2. General Equilibrium modelling. Important papers here are from:
• Nick Hanley et al. (2005). Do increases in resource productivity improve environmental quality? [Scotland]
• Sverre Grepperud and Ingeborg Rasmussen (2004). A general equilibrium assessment of rebound effects. [Norway]
• Peter Vikström (2004). Energy efficiency and Energy Demand [Sweden]. • Also Washida (2004) on Japan, Nystrom & Wene (1999) on Sweden, Kydes
(1997) on US, and Conrad (1999) a general overview paper. Other work for developing countries which found rebound effects includes Dufournaud et al (1993) on wood consumption in Sudan, Roy (2000) on kerosene use in India, and Glomsrod & Wei (2005) on coal in China.
3. Energy-economy-environment modelling. One example is the Cambridge Econometrics’ MDM-E3 model which is explained in section 4.1.
• Also MARKAL based models have been used to explore rebound effects, as was done by the Energy Research Centre of the Netherlands (ECN, 1995) for the IEA’s energy modelling work (ETSAP, 1997).
• For a general review of such models see Faucheux & Levarlet (1999) and for their application to environmental issues see van Ierland (1999).
Growth theory Saunders (2003) shows mathematically that of the four popular aggregate production function forms -- Cobb-Douglas, CES (Solow), Generalized Leontief, and Translog—nearly are all capable of producing backfire (rebound >1), depending on model parameterization. He remarks: “Most researchers to date have chosen by serendipity just the right model specifications to prevent backfire.” He describes (2005) “a simple, easy-to-use tool, CECANT, that allows policy analysts to calculate the economy-wide or sectoral energy use effects of new or prospective energy efficiency technologies”. This model, whose software is downloadable for free from the publishers website:
• Uses Translog cost function to model technology changes and a Cobb-Douglas utility function for consumer preferences.
The Macroeconomic Rebound Effect and the UK Economy 4CMR
16
• Conforms to the principles of much more complex general equilibrium methods. • Shows rebound effects by sector and factor.
General Equilibrium modelling The most common approach to modelling the rebound effect is with general equilibrium (GE) models. These give mixed results, but all agree that the assumptions on elasticity and substitution are crucial. One of the most explicit attempts is by Nick Hanley and his colleagues who used AMOSENVI, a flexible, energy-economy-environment CGE framework for the Scottish economy that links energy inputs to economic activity and to pollution outputs (Hanley et al., 2005). They found that (in the long term) resource productivity improvement actually increases regional air pollution, entirely due to induced system-wide effects: energy efficiency improvements result in an effective cut in electricity prices, which stimulates the output of electricity, and thus pollution. As they comment: “In our case, we find that an improvement in energy efficiency actually increases pollution over time, since the positive output and substitution effects associated with lower effective energy prices outweigh the direct efficiency effect”. Grepperud & Rasmusen (2004) used a general equilibrium model applied to the national economy of Norway to explore the potential for energy efficiency improvements to trigger economic forces that offset potential savings from using more efficient technologies (rebound effects). Their results were that rebound effects were quite significant (but still <1) for manufacturing sectors (like metals) which had limited substitution possibilities but were much weaker in services, transport and the resource-based sectors (e.g. finance and insurance, road transport and fisheries). Vikstrom (2004) used a historical CGE-model of the Swedish economy calibrated to 1957 to examine the rebound effect, in order to explain the appearance of the Swedish Environmental Kuznets Curve (EKC). His model using historical data found that the rebound effect was about 60%, but the model was a poor predictor of fuel use. As he admits the results must still be regarded as tentative, but this is an innovative paper with a good summary of the rebound effect in section 2. One area where it is agreed backfire could take place is where there is a large unmet demand for energy services, such as exists in developing countries and perhaps among the ‘fuel-poor’ in developed countries. Thus a change in technology leading to a step change in efficiency can lead to an increase in fuel consumption. This was measured by Roy (2000) in rural households in India who switched from kerosene for lighting to solar electric systems. It has also be reported by Dufournaud et al (1993) in their GE modelling of household consumption of wood in Sudan, and by Glomsrød and Wei (2005) in their GE modelling of coal cleaning in China. Energy-economy-environment modelling Perhaps the first work on modelling the macro-economic rebound effect was by the Energy Technology Systems Analysis Programme (ETSAP) of the International Energy Agency in the mid 1990s for its work on climate policy analysis. The ETSAP project used the MARKAL-MACRO model which is an integrated computer model, created by

The Macroeconomic Rebound Effect and the UK Economy 4CMR
17
coupling the systems engineering model MARKAL and the macro-economic growth model MACRO. This was used by the Energy Research Centre of the Netherlands (ECN, 1995) and Swedish modelers to estimate the magnitude of the rebound effect from energy conservation. This was measured by running MARKAL-MACRO with and without conservation technologies in two situations: with restrictions on carbon dioxide emissions and without. In each case, introducing the possibility of conservation up to the level that is cost-effective increased the total useful energy demand. The increase was noticeably greater with restricted emissions. This accords with the hypothesis that rebound can be significant when energy cost or availability is a constraint on activity, in this case through the imposition of emission restrictions (ETSAP, 1997).
Differences between models A useful paper which summarizes the differences between these various types of models used for macroeconomic studies is Section 9.4, ‘Why Studies Differ’, in the contribution of Working Group III: Mitigation for the IPCC report Climate Change 2001 (Metz et al., 2001). The Working Group III in its assessment of the economy-wide effects of mitigation, found that considerable use had been made of top-down models (macroeconomic, general equilibrium, and energy-engineering), and that specific sectoral studies used both top-down and engineering-economic bottom-up models. They reported that critical differences in the results come from the type of model used and its basic assumptions. This is further explored by Repetto and Austin (1997), who in a meta-analysis of model results on the costs of mitigation for the USA, show that 80% of predicted impacts come from choice of assumptions.
Top-down and Bottom-up modelling The Working Group III found that adoption of top-down or bottom-up methods made a significant difference to the results of mitigation studies. In top-down studies the behaviours of the economy, the energy system, and their constituent sectors are analyzed using aggregate data. In bottom-up studies, specific actions and technologies are modelled at the level of the energy-using, GHG-emitting equipment, such as power-generating stations or vehicle engines, and policy outcomes are added up to find overall results. The top-down approach leads easily to a consideration of the effects of mitigation on different broad sectors of the economy (not just the energy and capital goods sectors), so that the literature on these effects tends to be dominated by this approach. Top-down studies have tended to suggest that mitigation policies have economic costs because markets are assumed to operate efficiently and any policy that impairs this efficiency will be costly. Bottom-up studies tend to suggest that mitigation can yield financial and economic benefits, depending on the adoption of best-available technologies and the development of new technologies.
General Equilibrium and time-series econometric modelling There are two main types of macroeconomic models used for medium- and long-term economic projections: resource allocation models (i.e. CGE) and time-series econometric models. Their main differences are the assumptions made about the real measured economy, aggregation, dynamics, equilibrium, empirical basis, and time horizons, among others. The main characteristic of CGE models is that they have an explicit specification

The Macroeconomic Rebound Effect and the UK Economy 4CMR
18
of the behaviour of all relevant economic agents in the economy. In the mitigation applications, they have usually adopted assumptions of optimizing rationality, free market pricing, constant returns to scale, many firms and suppliers of factors, and perfect competition in order to provide a market-clearing equilibrium in all markets. Econometric models have relied more on time-series data methods to estimate their parameters rather than consensus estimates drawn from the literature. Results from these models are explained not only by their assumptions but also by the quality and coverage of their data. It is usually argued that CGE models are more suitable for describing long-run steady-state behaviour, while econometric models are more suitable for forecasting the short-run. However, models have increasingly incorporated both long-run theory and formal econometric methods, and several now include a mix of characteristics, from both resource allocation and econometric models. The treatment of technological change in models is crucial, and results will depend on such assumptions as whether there are constant elasticities of substitution between competing technologies or the impact of ‘learning-by-doing’. As Barker et al. (2005b) comment: “The importance of including a learning curve in the model cannot be overestimated, as the technology costs do not simply decline as a function of time but decrease as experience is gained by using a particular technology. As investment is made in ‘new’ technologies, learning takes place and the cost of the new technology lowers so that it becomes competitive with the ‘old’ technologies.” Thus, the best approach to modelling may be to link a top-down macroeconomic model with a bottom-up model so as to better model technology change. This modelling approach has been reviewed by McFarland (2004) and has the advantages that it avoids the typical optimistic bias often attributed to a bottom-up engineering approach, and the unduly pessimistic bias of typical macroeconomic approaches. It was the focus of a recent Tyndall Center project (Koehler et al., 2005) and the current research under the Energy Systems and Modelling Theme (ESMT) for the UKERC (Barker et al., 2005a).
The Macroeconomic Rebound Effect and the UK Economy 4CMR
19
4. Basic Structure of MDM-E3 Modelling
4.1. Overview of MDM-E3 The modelling of the macroeconomic rebound effect has used a version of the Cambridge Multisectoral Dynamic Model of the UK energy-environment-economy (E3) system (MDM-E3). This is the UK’s most detailed E3 model, designed to analyse and forecast changes in economic structure, energy demand and resulting environmental emissions (see Annex 2 for a detailed model description). To do this, it disaggregates industries, products, and household and government expenditures, as well as foreign trade and investment; in fact it disaggregates all the main variables that are treated as aggregates in most macroeconomic models. The model is a combination of time-series econometric relationships and cross-section input-output relationships. Although it forms aggregate demand in a Keynesian manner, with a consumption function and investment equations, it also includes equations for supply and prices, e.g. for labour participation and average earnings by industry and region. Other aspects of the supply side come in through the export and import equations, in which capacity utilisation affects trade performance, as well as a set of regional employment equations which allow relative wage rates to affect employment and therefore industry-level productivity growth. In MDM, energy modelling is done in energy units (e.g. million therms) and prices (e.g. price per therm) with conversion to thousand or million tonnes of oil equivalent (mtoe or ttoe) for presentation of the results. This model provides the basis for the UK Energy and the Environment forecasts produced by Cambridge Econometrics Ltd., and was used to analyse the economic and environmental implications to 2020 of introducing renewable energy, combined heat and power (CHP) and domestic energy efficiency measures by the Forum for the Future/Cambridge Econometrics Solar Millennium Project in 1999-2001. The version of MDM-E3 used in the study is a regionalised energy-environment-economy model, based on the 1992 Standard Industrial Classification (SIC92), with 1995 as the price base year, and using input-output tables for 1995. The time-series data used for econometric estimation is updated regularly, and the latest energy data are consistent with the 2003 Digest of UK Energy Statistics, and environmental data with the Digest of Environmental Statistics. The energy submodel The energy modelling has been partly based on the approach adopted by the UK Department of Energy (now a branch of the DTI), but uses co-integrating techniques to distinguish the short-term dynamic responses from the long-term relationships. The demand for energy is estimated in two stages. There are equations for aggregate energy demand by fuel users allowing for substitution between energy and other goods and services as a result of relative price changes. At the second stage, the substitution between consumption of different fuels by each user is done by share equations that allow for relative price effects. The total of non-electricity demand from these share equations is then scaled to match the total from the aggregate energy demand less the electricity demand. The projection of fuel use by user and type of fuel is then available to calculate

The Macroeconomic Rebound Effect and the UK Economy 4CMR
20
emissions of carbon dioxide and other gases and particulates to the atmosphere, allowing for different qualities of fuel and different processes of combustion. The econometric ‘top-down’ treatment is supplemented by an engineering ‘bottom-up’ approach in the electricity supply industry (ESI). Submodels within MDM-E3 Sub-models within MDM-E3 represent energy-environment characteristics, and at present the coverage includes energy demand (primary and final), environmental emissions and the electricity supply industry. The richness of the model enables analysis of interactions and feedback effects between different sectors – industries, consumers, government – and the overall macroeconomy. This enables assessment of the impact of government energy efficiency policies and programmes on energy inputs and environmental emissions throughout the UK economy. The CHP submodel enables the examination of a range of economic factors important in the decision to install CHP, including the impact of government support measures for CHP. The CHP submodel is integrated with the electricity supply and energy submodels in MDM-E3. Furthermore, solutions from the CHP submodel are also integrated with the rest of MDM-E3, so that economy-wide implications of CHP for UK are captured. The announcement effects of the Climate Change Levy The announcement effects of the Climate Change Levy, although not the main focus of this study, are included in MDM-E3, through the incorporation of a modelling framework used to analyse the Climate Change Levy (Cambridge Econometrics et al., 2005). The framework takes account of the announcement/attention effects of the CCL (in addition to the price effects) for fuel users liable for the CCL (i.e., excluding electricity generation, transport and households). In addition, the UK voluntary scheme for CO2 emissions permit trading, given an incentive by the Government’s auction in March 2002, has been explicitly modelled in its effects on CHP. Its effects on the energy use and CO2 emissions by industrial and commercial sectors have been treated by raising the price of fuels according to our assumptions on the traded permit price and the carbon content of these fuels. The treatment of the EU Emissions Trading Scheme is similar.

The Macroeconomic Rebound Effect and the UK Economy 4CMR
21
4.2. Modelling the macroeconomic rebound in MDM-E3 Assumptions relating to direct rebound effects The focus of this study is to examine macroeconomic rebound effect using a macroeconomic model applied to the UK economy, MDM-E3. In order to do this, direct rebound effects need to be taken into account in the modelling. This is done exogenously, as follows. The direct rebound effect is specific to a particular policy and energy efficiency measure: "the measure". In order to calculate the effect, it is necessary to specify the sector to which the measure applies, details of the technologies involved, the energy services demanded by the social groups affected and the income levels of the group. An example is provided by the Warm Front Programme affecting the household sector. The significance of this example for the analysis is that the empirical evidence suggests that the direct rebound effect is likely to be much higher for low-income groups for whom energy expenditures are a large proportion of their total expenditure. This is because they are likely to take efficiency benefits in the form of higher levels of energy service (e.g. heating homes to a higher temperature). The modelling based on MDM-E3, undertaken in this study, required the preparation of an inventory of energy efficiency policies, measures and programmes by many characteristics relevant to understanding, analysing and modelling the effects of their effects (see Chapter 5 and Annex 1 for details). These characteristics have included sector, social group, scale and timing. The direct effects on energy savings and costs of these measures have been estimated from the literature and engineering studies, principally the evaluation of UK energy efficiency policies and programmes conducted by FES and PSI (FES/PSI, 2005), and the evaluation of the voluntary agreement package by the Department for Transport (DfT, 2005). These evaluations also included estimates of the direct rebound effect for each policy measure, so-called ‘comfort taking’, and these estimates are incorporated exogenously into the macro-economic modelling. Development of scenarios Scenarios have been developed, as discussed in Chapter 5.2, to allow the calculation of macroeconomic rebound effects by modelling final energy demand by 13 fuel user groups, aggregated to six sectors: energy-intensive industries (basic metals, minerals and chenicals), other industry, road transport, air transport, other final uses (commerce and public sector) and households (dwellings). The definition of these sectors is given in Annex 2. The base case for the modelling includes present and committed energy efficiency policies for the period 2000-2010, including key assumptions (oil price, EU ETS carbon trading price). A reference case was constructed for this period without energy efficiency policies, but including the EU ETS, which is not regarded as an energy efficiency policy. The fuel price assumptions were based on the DTI projections from February 2006. Nine scenarios were developed for the period 2000-10 to assess the macro-economic rebound effect from the energy efficiency policies for the domestic, industry, commerce
The Macroeconomic Rebound Effect and the UK Economy 4CMR
22
and transport sectors, and the extent to which higher carbon prices from the EU ETS offset any macro-economic rebound effect. Within each scenario, the effects of the relevant policy measures are introduced into the model on an annual basis. This is done by including the projected direct energy saving resulting from actions taken as a result of that policy measure, taking into account any projected direct rebound effect, so-called ‘comfort taking’. The relevant assumptions used in relation to each policy measure are described in Annex 1. The projected direct energy and GHG savings in 2010 used as inputs to the modelling are shown in Table 5.1. Input-output structure and macroeconomic effects The macroeconomic rebound effects for these scenarios have been calculated, based on MDM-E3 model which automatically incorporates these macroeconomic effects through the input-output structure of the model and its stochastic equations. The input-output coefficients calculated show the share of gross commodity output absorbed in inputs to production by industries. These coefficients are projected one year at a time and for any year are applied to estimates of gross output for that year to calculate intermediate demand. The projections of coefficients are based on the supply and use tables drawn from official sources and incorporate CE’s view on expected technical and other changes. The main feedback from the energy submodel (including the ESI submodel as described in Annex 2) is to the matrix of input-output coefficients, which are ratios of the input of a commodity to an industry to the output of that industry, both measured in monetary units (see Figure 4.1). The input-output coefficients that are updated are those that correspond to the fuel commodities: coal, manufactured fuels (petroleum products), electricity, and gas supply. Fuel use, which is measured in physical energy units, and prices on the energy-environment model basis are converted back to demand for and prices of MDM-E3 commodities (both measured in monetary units), and fuel users back to MDM-E3 industries (see Annex 2, Table A2.2 for the correspondences). The process is iterative with the energy sub-model (and the associated feedbacks) being solved simultaneously with the main industrial model over the projection period. In the case where several industries have been aggregated into one fuel user, such as ‘other industry’ (ie manufacturing industry excluding the energy intensive sectors, basic metals, chemicals, and mineral products), there is the option to calculate the deviation from the fuel user mean of the different responses of each industry to fuel price changes. The energy submodel also calculates consumers’ expenditure on fuels and petrol.

The Macroeconomic Rebound Effect and the UK Economy 4CMR
23
Figure 4.1: Feedback from the energy submodel in MDM-E3
m ix o f r e g u la t e d
a n d u n r e g u la t e de le c t r ic i t y p r ic e s
c o n s u m e r s ' e x p e n d i t u r eo n f u e ls a n d p e t r o l
in p u t - o u t p u t c o e f f i c ie n t s :e n e r g y t o c o m m e r c e a n d g o v e r n m e n t
in p u t - o u t p u t c o e f f ic ie n t s :e n e r g y t o in d u s t r y
in p u t - o u t p u t c o e f f ic ie n t s :e n e r g y t o e le c t r ic i t y
p r ic e o f e le c t r ic i t yp r ic e s o f f u e l u s e
d o m e s t ic u s e a n dt r a n s p o r t a t io n u s e
in d u s t r ia l a n d t r a n s p o r t u s e
o t h e r f in a l u s e
f u e l u s e b y E S I
f u e l u s e b y u s e r
e le c t r ic i t y s u p p ly in d u s t r y
`
Feedback from the energy submodel
The sectoral breakdown of the macroeconomic rebound effect The macroeconomic effects, reported in Chapter 6, are disaggregated by: - industry (according to broad groups in the SIC classification) - households; - commerce; and - transport. The analysis covered the three types of rebound effects, as described in Chapter 1, in consultation with Defra. The magnitude of the economy-wide and indirect effects by sector were estimated using the MDM-E3 model, once the direct effects of energy efficiency measures on the level of consumption of the corresponding energy service were known. MDM-E3 differentiates a wide range of energy end use activities for industry, households and transport, but currently specifies these in terms of the level of physical energy demand, and not the energy service demand. Hence, the magnitude of the direct rebound effect for a range of industry, household and transport sectors was estimated exogenously to the model, based on review of the literature and our existing expert knowledge of this literature (see Chapter 5). The macroeconomic rebound effects are calculated by taking the difference between the energy saving projected by the model and the expected net energy saving (after allowing for the direct rebound effect) projected from energy-engineering studies for the policies. This difference is then expressed as a percentage of the expected gross energy saving from these studies.

The Macroeconomic Rebound Effect and the UK Economy 4CMR
24
Adapting MDM-E3 to estimate rebound effects The macroeconomic rebound effect is the response of the economy in terms of energy demand stimulated, through indirect and economy-wide effects, by the initial energy savings arising from energy efficiency policies. The effect to be measured by using MDM-E3 is limited to the increase in energy demand from the UK economy. However the full responses also include increases in UK imports (and some exports), hence activity in the rest of the world, implying increased energy demand abroad in addition to the increased demand at home. In the model, the initial effects spread from the energy-using sectors throughout the rest of the economy. A set of initial reductions in net energy demand brought about by energy efficiency programmes is aggregated in terms of the model’s classification and imposed on selected fuel users. The associated increases in investment in energy equipment and buildings (e.g. insulation) are similarly aggregated, converted to 1995 prices, and imposed on investment demands. MDM-E3 uses an error-correction mechanism (ECM) model augmented by time trends or accumulated investment to represent energy efficiency improvements (See Cambridge Econometrics et al., 2005). An explanation of how the energy saving term is incorporated in the energy use estimation equation is given in Annex 5. Energy saving by households in MDM-E3 In the case of extra energy saving in the household sector, the reductions in expenditure on fuels (assuming that fuel prices are unchanged) implies an increase in the real income of consumers. Their nominal incomes are unchanged (at least initially before any wider economic response) and similarly the prices they pay for electricity, gas and other fuels are also unchanged. These effects are modelled by assuming consumers initially maintain the level of energy services received from the fuels, i.e. cut actual spending to receive the same services; however the further response is more complicated. We assume that they behave (1) as if fuel prices had fallen, so that they substitute back towards fuels, depending on their responses to lower effective prices2, and (2) as if they had an increase in real income so that they increase spending on energy and other activities, depending on estimated income elasticities. For (2) the saving ratio is changed so that real expenditures rise by the appropriate amount. The higher consumers’ expenditure on all goods and services, especially energy-intensive ones such as air transport, then raise energy use more generally. Energy saving in production in MDM-E3 The effect of energy saving in production is to reduce the costs of industrial energy use, so leading to reductions in prices and increases in profits of the industries working more efficiently. These lower prices are then passed on to reduce costs for other industries. The process gives rise to a rebound effect in that the initial savings are (partially) offset by
2 Note that this only takes into account indirect and economy-wide effects. The direct rebound effects of lower energy service price on energy consumption are introduced exogenously in the model, as set out in Chapter 2.
The Macroeconomic Rebound Effect and the UK Economy 4CMR
25
increases in energy demands, due to higher demands for the outputs of the industries that have improved their energy efficiency and so reduced their energy costs. There are
1) substitution effects – more energy use and less labour use, depending on estimated price/wage elasticities of energy/labour demand;
2) effects of an overall reduction in unit costs of production on prices and hence on general demand for products.
The lower costs will also be passed on to final consumers, depending on the price behaviour of the industries. When prices are determined on world markets, the prices will remain unchanged and the firms in the industry will take the energy efficiency gains as higher profits. If the prices are determined in the UK market, then some of the fall in costs will be passed on in lower prices, the real incomes of consumers will rise and net export demand will rise. Consumers will substitute spending towards the lower-priced products. Higher consumer and labour demand will increase output (and GDP) more generally and hence lead to higher energy demand.
The Macroeconomic Rebound Effect and the UK Economy 4CMR
26
5. Description of Policies and Scenarios
5.1. UK energy efficiency policies and programmes The focus of this work was to examine the potential scale of the macro-economic rebound effect arising from the UK Government’s policies and programmes aimed at incentivising energy efficiency improvements in the domestic, business and transport sectors. Improving energy efficiency is regarded as providing a significant contribution to the goals of UK climate and energy policy. The 2000 UK Climate Change Programme (Defra, 2000) examined projections of the UK’s CO2 and (basket of 6) greenhouse gas emissions (GHG) out to 2010 and 2020. Taking into account measures already announced (including the Climate Change Levy on use of energy by business and public sector, the fuel duty escalator to 1999, and the Renewables Obligation and other measures designed to achieve the target of 10% renewable electricity generation by 2010), the baseline projection was for UK GHG emissions to reduce from 211.7 MtC in 1990 to 180.2 MtC in 2010, a reduction of 31.5 MtC or 15%. This would enable the UK to meet its target under the Kyoto Protocol of a 12.5% reduction on 1990 levels by 2008-12, but emissions were projected to begin rising after 2010 to 186.2 MtC by 2020 without additional measures. The 2000 Climate Change Programme set out a range of measures to achieve further reductions in GHG emissions beyond the baseline projections. These were intended to achieve an additional reduction of 17.75 MtC in 2010, equivalent to a 23% reduction in GHG emissions or a 19% reduction in CO2 emissions (close to the Government’s self-impose target of 20% reduction in CO2 emissions). These were subsequently elaborated in the 2003 Energy White Paper (DTI, 2003) and the 2004 Energy Efficiency Action Plan(Defra, 2004). In all cases, the additional reductions were assessed relative to the baseline projection in the 2000 Climate Change Programme. The majority of the additional policies measures are aimed at incentivising energy efficiency improvements. It is the macro-economic rebound effect arising from these measures that it is assessed in this report. These policies are described briefly here and more details of the policies and the relevant assumptions used in the modelling are given in Annex 1. Domestic Sector The main energy efficiency policy measures applying to the domestic sector are the Building Regulations, the Energy Efficiency Commitment, the Northern Ireland Energy Efficiency Levy, Warm Front, Community Energy Programme and the Market Transformation Programme (which also covers the commercial sector). Building Regulations (domestic) Building regulations covering the conservation of fuel and power in domestic and non-domestic buildings were amended in 2002 for England and Wales and, separately, for Scotland, bringing both to a similar standard for new buildings. In England and Wales,

The Macroeconomic Rebound Effect and the UK Economy 4CMR
27
existing regulations were tightened in April 2005 to increase the minimum requirements for boilers and will be tightened more generally from April 2006, also to incorporate provisions required under the EU Energy Performance in Buildings Directive (EPBD). Separate legislation will be implemented in Scotland and Northern Ireland to comply with the directive’s deadline of 4 January 2006. Energy Efficiency Commitment The Energy Efficiency Commitment (EEC) replaced the Energy Efficiency Standards of Performance (EESoP), which ran from 1994 until 2002, and operates throughout Great Britain. Under the EEC, electricity and gas suppliers are required to achieve targets for the promotion of improvements in household energy efficiency. They do this by assisting domestic consumers to take up energy efficiency measures. Its objective is the reduction of carbon emissions and the first phase of EEC ran from 2002-2005. A second and proposed third phase will run from 2005-2008 and 2008-2011 respectively, although the EEC will undergo a thorough review before the third tranche commences in 2008. EEC provides a fuel-standardised lifetime-discounted energy saving target for each supplier that must be achieved within the phase - for EEC 2002-2005 the total target saving across all suppliers was 62 fuel-standardised lifetime-discounted TWh. Within this target suppliers must ensure that at least 50% of the improvements must be obtained within ‘Priority Group’ households (lower income households, including those in receipt of income and disability benefits and income related tax credits). The overall target for the second phase of the EEC from 2005-2008 is 130 fuel-standardised lifetime-discounted TWh (but is set on a different basis, i.e. is not directly comparable with the first phase). A supplier’s contribution to the cost of measures varies between different groups. The level of the subsidy or inducement cost will depend on the householder’s willingness and ability to pay. Northern Ireland Energy Efficiency Levy EEC does not extend to Northern Ireland (NI) - instead a separate Energy Efficiency Levy (EEL) programme has been operating since 1997. It is not ‘directly’ comparable to EEC (although it shares similar features), but the EEL does operate in broadly the same manner as the EESoP, which preceded EEC in GB. The EEL was introduced in NI as part of a review of the price controls on Northern Ireland Electricity plc (NIE) by the NI regulator, Ofreg, in 1997. A set levy on energy is charged per annum per household and is set by Ofreg. The levy started at around £1 per household, rose to £2 in 2000, £5 in 2002 and is due to rise to approximately £7 in 2005. NIE is required to use this money to install efficiency measures (similar to those within EEC) with 50% of their activity targeted at fuel-poor dwellings. Warm Front and comparable Devolved Administration schemes (UK fuel poverty schemes) In each of the four countries that constitute the UK there are broadly comparable fuel poverty schemes to provide grants for various insulation and heating measures to households, which receive certain defined benefits. The primary aim of these schemes is to help provide energy efficiency measures to the most vulnerable households and by doing so alleviate fuel poverty. A secondary benefit of this is a carbon reduction from the
The Macroeconomic Rebound Effect and the UK Economy 4CMR
28
associated improvements. In England, the scheme is Warm Front and was introduced in 2000 (previously known as the New Home Energy Efficiency Scheme, which replaced the old HEES – pre 2000). It is only open to private sector households, whether owner-occupiers or in the private rented sector, and provides a range of energy efficient heating and insulation measures, as well as energy advice. In Wales, there are two similar private sector household schemes that commenced in 2001, called HEES (Home Energy Efficiency Scheme) and HEES Plus. There are two schemes in Scotland, Warm Deal (that began in 1999) and the Central Heating Programme (that began in 2001), covering owner-occupiers, private tenants and Local Authority owned housing. In Northern Ireland, the schemes, called Warm Homes and Warm Homes Plus, started in 2001 and are aimed solely at private sector households. Community Energy Programme The Community Energy Programme (CEP) was launched in January 2002 to help support the refurbishment and development of Community Heating (CH) throughout the UK, primarily in the form of Combined Heat and Power (CHP). The programme’s primary goal is carbon reduction but also has a secondary objective of reducing fuel poverty. The programme was originally allocated £50M over 2 years, with approximately £48M to be provided for capital grants (allocated via competitive tender over a number of rounds) and the remainder for supporting activities such as feasibility studies. Subsequent revisions have extended the timescale for allocation of grants up to March 2008. Targets set for the programme include:
• The installation of 130MW of ‘good quality’ CHP; • A reduction in carbon emissions of 150 ktC/yr ; • Lever in private sector ‘match funding’ of £200M; • Help 100,000 people on low-incomes to heat their homes.
Market Transformation Programme The Market Transformation Programme (MTP) is a Government initative that ‘aims to bring forward products, systems and services which do less harm to the environment, using less energy, water and other resources’. This programme is reponsible for delivering the carbon reductions from ‘appliance standards and labelling’ given in the Climate Change Programme and confirmed in the Energy White Paper. It analyses the environmental performance of domestic and non-domestic products and systems: at present it publishes analysis of 12 major sectors, covering 27 product types, which accounts for 96% of domestic and 19% of non-domestic UK energy consumption. This includes all major domestic energy-consuming appliances (lighting, heating, cold, wet, cooking and consumer electronics) and traded goods in the commercial sector (office equipment, motors and drives, lighting, commercial refrigeration and air conditioning). The main activity and value of the MTP is the development and maintenance of a public domain evidence base. Much of this activity will enable other policies to function more efficiently, either allowing more savings or at a lower cost. The MTP is also responsible for implementation of specific policies that reduce carbon emissions, mainly labelling/standards for appliances (usually initiated at the EU level).
The Macroeconomic Rebound Effect and the UK Economy 4CMR
29
Business Sector The main energy efficiency policy measures applying to the business sector are the Climate Change Agreements (CCAs) and the Carbon Trust’s Reducing Carbon Emissions Now and Developing Low Carbon Technologies programmes. Note that the UK and EU Carbon Emissions Trading Schemes (ETS) are regarded here as measures to internalise the cost of carbon and so are not included within energy efficiency policies. Climate Change Agreements (CCAs) The Climate Change Agreements (CCAs), which were agreed between Defra and forty-four energy intensive sectors in March 2001, set quantitative targets for 2010 with milestone targets at two-yearly intervals. Sectors (and constituent firms) were allowed to choose between targets related to carbon emissions or to primary energy consumption and between absolute and relative targets. The large majority chose relative targets for energy consumption – i.e. specific energy consumption (SEC). On achievement of the target, CCA participants are entitled to receive an 80% reduction in the Climate Change Levy (CCL). Participants in the CCAs can also purchase allowances through the UK-ETS in order to meet their targets. Eligibility to enter into a CCA was originally related to sectors covered by the Pollution Prevention and Control Regulations 2000 (PPC) but it was extended in the 2004 Budget to include other sectors that satisfied defined criteria related to energy intensity and international competitiveness. Carbon Trust - Reducing Carbon Emissions Now The Carbon Trust was formally announced in the 2000 Pre-Budget Report and launched in April 2001. The first pillar, Reducing Carbon Emissions Now, builds on the activities of the earlier Energy Efficiency Best Practice Programme (EEBPP). Reducing Carbon Emissions Now originally comprised four main services: • General Service: comprising a telephone helpline, website, publications and events,
that provide advice to organisations regardless of their size and energy consumption; • On-site Surveys: comprising on-site surveys and design advice for buildings for
medium sized energy consumers; • Customised Services: targeted at large energy users; and • Interest Free Loans: providing funding to SMEs in order to assist them to adopt
energy saving equipment. These have now been consolidated into two services: • Save Energy: helping businesses and public sector organisations to save money by
cutting energy use - including free energy surveys and interest free loans • Carbon Management: a service helping private sector companies and public sector
organisations to assess the potential for carbon emissions reductions at a strategic level.
CarbonTrust - Developing Low Carbon Technologies The primary objective of the Carbon Trust’s second pillar, Developing Low Carbon Technologies, is to maximise carbon savings over the medium and long term through investments in low carbon technologies. This is achieved by increasing the development
The Macroeconomic Rebound Effect and the UK Economy 4CMR
30
of low carbon intellectual property, meeting market needs and by accelerating commercialisation of low carbon technologies. This comprises four main services: • Applied Research: grant support for business and academia; • Technology Acceleration: field trials and engineering support; • Incubators: support for early stage companies; • Venture Capital: equity investment. Commercial and Public Sector The main energy efficiency policy measures applying to the commercial and public sectors are Building Regulations (Non-domestic) and the Public Sector Targets, comprising Central Government Estate Energy Efficiency Target, NHS Estates Targets, UK Universities and English Schools. Building Regulations (Non-domestic) As described under the domestic building regulations, the building regulations covering the conservation of fuel and power in non-domestic buildings were amended in 2002 and 2005. Public Sector Targets A range of measures aimed at incentivising energy efficiency improvements in the public sector were set out in the 2000 Climate Change Programme, including Central Government Estate Energy Efficiency Target, NHS Estates Targets, UK Universities and English Schools. However, in the evaluation of the Government’s energy efficiency policies and programmes carried out by FES and PSI in 2005, it was not found to be possible to quantify any energy or carbon savings associated with these targets. Hence, these targets were not included in the assessment carried out in this report. Transport Sector The main energy efficiency policy measures applying to the transport sector are the Voluntary Agreements on vehicle CO2 emissions reductions, Company Car Tax, and the Graduated Vehicle Excise Duty, which are together referred to as the Voluntary Agreement Package. Measures under the Government’s 10 Year Transport Plan in 2000 are also projected to contribute to carbon emissions reductions, but they are not evaluated here. Voluntary Agreements A Voluntary Agreement was signed between the European Commission and the European Association of Car Manufacturers (ACEA) to reduce average CO2 emissions from new cars to 140 g/km by 2008 (equivalent to 25% below 1995 levels). Similarly, Voluntary Agreements were signed between the EC and both the Japanese Automobile Manufacturers Association (JAMA) and the Korean Automobile Manufacturers Association (KAMA) to reduce average CO2 emissions from their new cars to 140 g/km by 2009. These targets are expected to be met by the further incorporation of fuel saving technologies, including direct injection gasoline and direct injection diesel engines, engine improvements, weight reduction, reduced rolling resistance and aerodynamic improvements.

The Macroeconomic Rebound Effect and the UK Economy 4CMR
31
Company Car Tax Company Car taxation was reformed in 2002, so that company cars are taxed on a percentage of their list price according to one of 21 CO2 emissions bands. Vehicle Excise Duty Reforms to Vehicle Excise Duty (VED) - the annual vehicle tax charge – were introduced in 2000, giving a reduced rate of VED for smaller, more fuel efficient cars, and a graduated VED system for new cars, which will be placed in one of four VED rate bands according to their CO2 emissions. The 2004 Energy Efficiency Action Plan The 2003 Energy White Paper (DTI, 2003) identified the efficient use of energy as the most cost-effective way to meet all four of the UK’s energy policy goals:
• reducing carbon emissions over the long-term; • ensuring security of supply; • maintaining competitiveness; • tackling fuel poverty.
The 2004 Energy Efficiency Action Plan (Defra, 2004) set out how the Government will meet the commitments to energy efficiency improvements in the White Paper, particular for the period 2004-2010. This was based on the set of measures described above.
The Macroeconomic Rebound Effect and the UK Economy 4CMR
32
5.2. Scenarios A set of scenarios for the period 2000-2010 were developed to assess the macro-economic rebound effect from the energy efficiency policies for the domestic, industry, commerce and transport sectors, and the extent to which higher carbon prices from the EU ETS offset any macro-economic rebound effect. The details of the scenarios are described below, but first we discuss how they relate to each other. The Base Case for the modelling includes the current and committed energy efficiency policies for the period 2000-2010, setting key assumptions (oil price, EU ETS carbon trading price) at historical levels and at DTI central-case forecasts (March 2006). An alternative Reference Case is constructed for the period without these energy efficiency policies but including the EU ETS, which is not regarded as an energy efficiency policy. Differences between the scenarios are used to assess the impacts of energy efficiency policies on energy demand and CO2 emissions under the different scenario assumptions, taking into account the macroeconomic effects estimated using the model. By comparing these with the imposed estimates for energy and CO2 saving from the earlier evaluation, which did not take the macroeconomic effects into account, estimates of the magnitude of the macroeconomic rebound effect on energy demand and CO2 emissions are calculated. The Reference Case (RR) is constructed to establish a counterfactual history of the UK economy for the period 2000-2010 without the impact of the additional energy efficiency policies implemented over this period. It is a fully dynamic solution of the model over the period, given the year-by-year profile of exogenous variables such as other countries’ output and prices, exchange rates, interest rates and fiscal policies in general. It does not include any explicit energy and carbon saving from the CCAs, which are treated as a key industrial component of the energy efficiency policies. It does however include the impact of other UK energy policy measures, including the Climate Change Levy itself, the Fuel Duty escalator to 1999, and the delivery of the 10% renewable electricity generation target by 2010. It is thus close to the baseline scenario under the 2000 UK Climate Change Programme (Defra, 2000), with the main difference being that, here, the impacts of the UK and EU Emissions Trading Schemes are included within the Reference Case. The Base Case (BR) is an alternative fully dynamic solution, but including the sectoral effects on energy use by assumption, year by year 2000-2010, of all the current and committed UK energy efficiency policies for the domestic, business, commercial and transport sectors, i.e. all the policies discussed in Section 5.1, including the explicit effects of the CCAs. The difference between the Base Case and the Reference Case thus gives a dynamic estimate of the impact of these policies on the UK economy, and will enable calculation of the amount by which the original estimated energy saving of the policies is reduced through the rebound effect. This will include the direct impacts of the policies on the sector targeted and the indirect impacts on the rest of the UK economy. The base case assumes an EU ETS allowance price of €30/tCO2 in phase 2 (2008-2010) and an oil price of $40/bl by 2010 (see Table 5.3 below).
The Macroeconomic Rebound Effect and the UK Economy 4CMR
33
Further scenarios were used to undertake sensitivity analysis and to compare the macroeconomic effects of energy efficiency policies with those similar magnitudes of energy saving arising from higher oil prices or higher EU ETS allowance price. The Scaled EP on Base case (SB) is a counterfactual under which energy efficiency policies are assumed to be enhanced, taking a 50% increase in the strength of policies across the board. Another set of scenarios were constructed to show the effects of sectoral energy efficiency policies imposed independently for each sector of the economy to which the policies primarily apply: Domestic case (DR): Reference + energy efficiency policies for domestic sector, i.e.
Building Regulations (domestic), the Energy Efficiency Commitment, the Northern Ireland Energy Efficiency Levy, Warm Front, Community Energy Programme and the Market Transformation Programme.
Business case (BR): Reference + energy efficiency policies for business sector, i.e. Climate Change Agreements (CCAs) and the Carbon Trust’s Reducing Carbon Emissions Now and Developing Low Carbon Technologies programmes.
Commerce and public sector (Other final users) case (CR): Reference + energy efficiency policies for commerce and public sector, i.e. Building Regulations (Non-domestic).
Transport case (TR): Reference + energy efficiency policies for transport sector, i.e. Voluntary Agreement Package.
Finally other scenarios were constructed for sensitivity analysis:
1) The Oil price alternative (OB) is a projection with a higher oil price calculated so as to lead to the same reduction in CO2 emissions by 2010 as the energy efficiency policies in the base case (with oil price up by 42% over base case from $40/bl to $57/bl by 2010). Another scenario (OR) applies the higher oil price to the reference scenario.
2) The Allowance price alternative (AB) is another projection with a higher EU ETS carbon price calculated so as to lead to the same reduction in CO2 emissions by 2010 as the energy efficiency policies in the base case (with EU ETS allowance price up from €32/t CO2 to €79/t CO2 in phase 2, 2008-2010). Again another scenario (AR) applies the higher allowance price to the reference scenario.
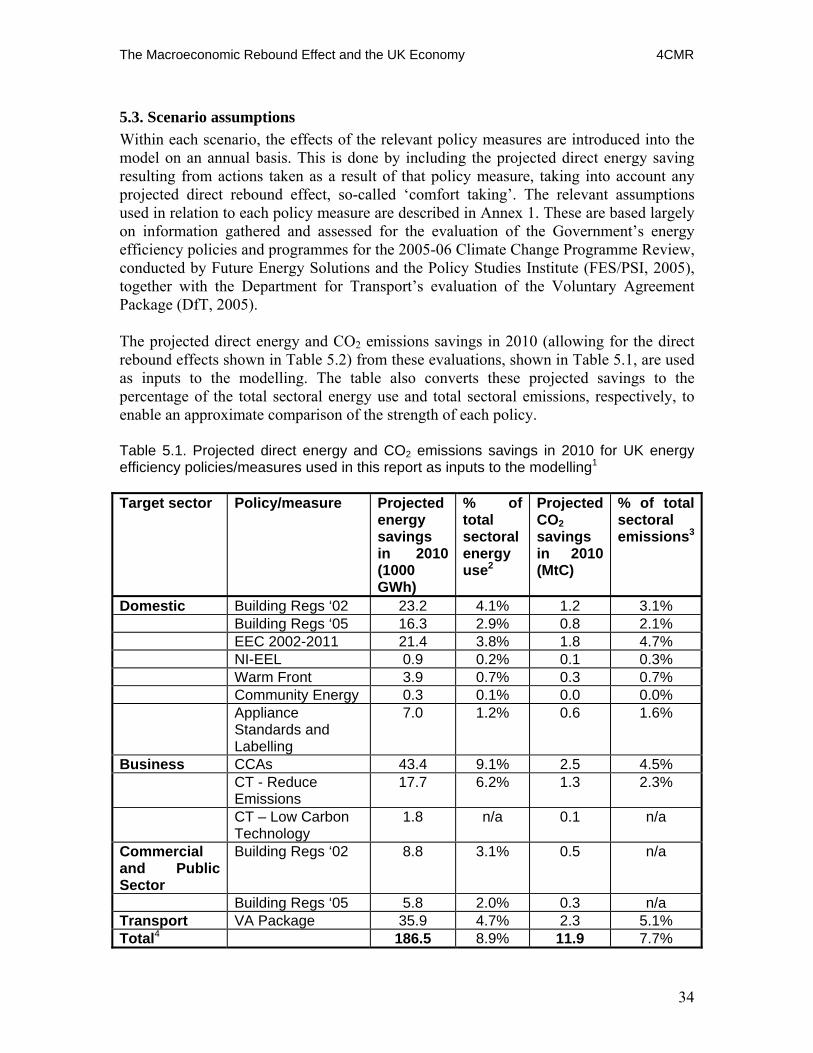
The Macroeconomic Rebound Effect and the UK Economy 4CMR
34
5.3. Scenario assumptions Within each scenario, the effects of the relevant policy measures are introduced into the model on an annual basis. This is done by including the projected direct energy saving resulting from actions taken as a result of that policy measure, taking into account any projected direct rebound effect, so-called ‘comfort taking’. The relevant assumptions used in relation to each policy measure are described in Annex 1. These are based largely on information gathered and assessed for the evaluation of the Government’s energy efficiency policies and programmes for the 2005-06 Climate Change Programme Review, conducted by Future Energy Solutions and the Policy Studies Institute (FES/PSI, 2005), together with the Department for Transport’s evaluation of the Voluntary Agreement Package (DfT, 2005). The projected direct energy and CO2 emissions savings in 2010 (allowing for the direct rebound effects shown in Table 5.2) from these evaluations, shown in Table 5.1, are used as inputs to the modelling. The table also converts these projected savings to the percentage of the total sectoral energy use and total sectoral emissions, respectively, to enable an approximate comparison of the strength of each policy. Table 5.1. Projected direct energy and CO2 emissions savings in 2010 for UK energy efficiency policies/measures used in this report as inputs to the modelling1 Target sector Policy/measure Projected
energy savings in 2010 (1000 GWh)
% of total sectoral energy use2
Projected CO2 savings in 2010 (MtC)
% of total sectoral emissions3
Domestic Building Regs ‘02 23.2 4.1% 1.2 3.1% Building Regs ‘05 16.3 2.9% 0.8 2.1% EEC 2002-2011 21.4 3.8% 1.8 4.7% NI-EEL 0.9 0.2% 0.1 0.3% Warm Front 3.9 0.7% 0.3 0.7% Community Energy 0.3 0.1% 0.0 0.0% Appliance
Standards and Labelling
7.0 1.2% 0.6 1.6%
Business CCAs 43.4 9.1% 2.5 4.5% CT - Reduce
Emissions 17.7 6.2% 1.3 2.3%
CT – Low Carbon Technology
1.8 n/a 0.1 n/a
Commercial and Public Sector
Building Regs ‘02 8.8 3.1% 0.5 n/a
Building Regs ‘05 5.8 2.0% 0.3 n/a Transport VA Package 35.9 4.7% 2.3 5.1% Total4 186.5 8.9% 11.9 7.7%
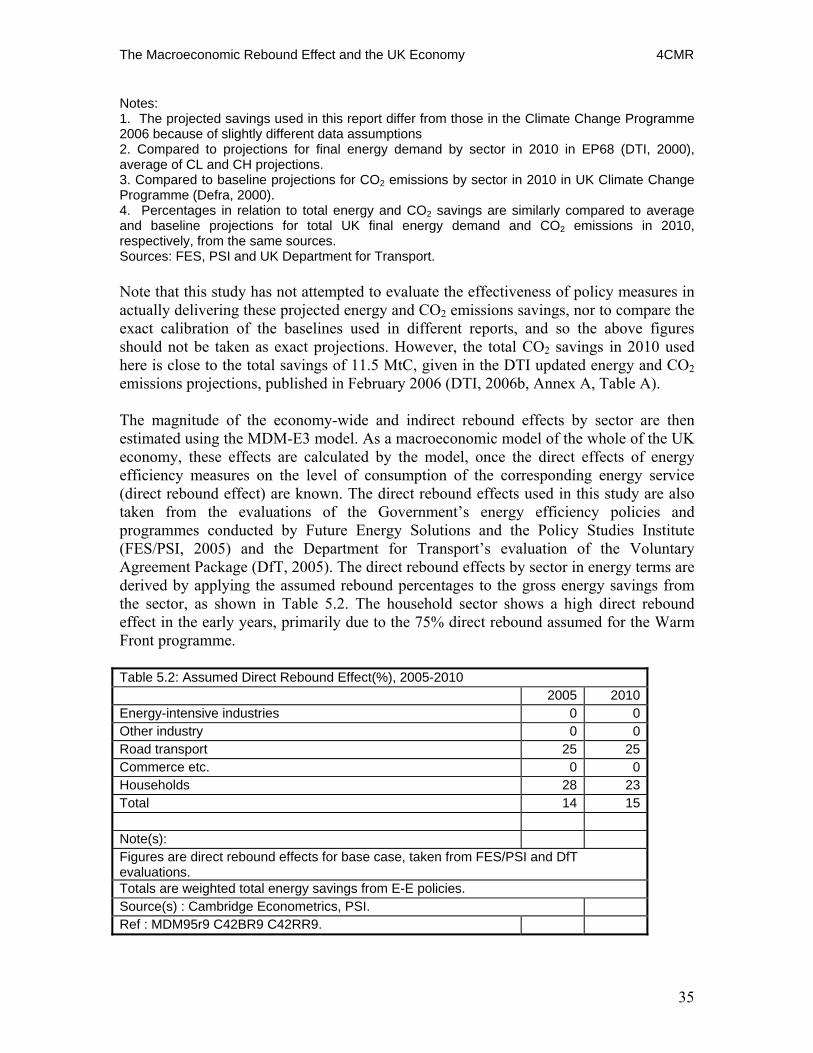
The Macroeconomic Rebound Effect and the UK Economy 4CMR
35
Notes: 1. The projected savings used in this report differ from those in the Climate Change Programme 2006 because of slightly different data assumptions 2. Compared to projections for final energy demand by sector in 2010 in EP68 (DTI, 2000), average of CL and CH projections. 3. Compared to baseline projections for CO2 emissions by sector in 2010 in UK Climate Change Programme (Defra, 2000). 4. Percentages in relation to total energy and CO2 savings are similarly compared to average and baseline projections for total UK final energy demand and CO2 emissions in 2010, respectively, from the same sources. Sources: FES, PSI and UK Department for Transport. Note that this study has not attempted to evaluate the effectiveness of policy measures in actually delivering these projected energy and CO2 emissions savings, nor to compare the exact calibration of the baselines used in different reports, and so the above figures should not be taken as exact projections. However, the total CO2 savings in 2010 used here is close to the total savings of 11.5 MtC, given in the DTI updated energy and CO2 emissions projections, published in February 2006 (DTI, 2006b, Annex A, Table A). The magnitude of the economy-wide and indirect rebound effects by sector are then estimated using the MDM-E3 model. As a macroeconomic model of the whole of the UK economy, these effects are calculated by the model, once the direct effects of energy efficiency measures on the level of consumption of the corresponding energy service (direct rebound effect) are known. The direct rebound effects used in this study are also taken from the evaluations of the Government’s energy efficiency policies and programmes conducted by Future Energy Solutions and the Policy Studies Institute (FES/PSI, 2005) and the Department for Transport’s evaluation of the Voluntary Agreement Package (DfT, 2005). The direct rebound effects by sector in energy terms are derived by applying the assumed rebound percentages to the gross energy savings from the sector, as shown in Table 5.2. The household sector shows a high direct rebound effect in the early years, primarily due to the 75% direct rebound assumed for the Warm Front programme. Table 5.2: Assumed Direct Rebound Effect(%), 2005-2010 2005 2010 Energy-intensive industries 0 0 Other industry 0 0 Road transport 25 25 Commerce etc. 0 0 Households 28 23 Total 14 15 Note(s): Figures are direct rebound effects for base case, taken from FES/PSI and DfT evaluations. Totals are weighted total energy savings from E-E policies. Source(s) : Cambridge Econometrics, PSI. Ref : MDM95r9 C42BR9 C42RR9.
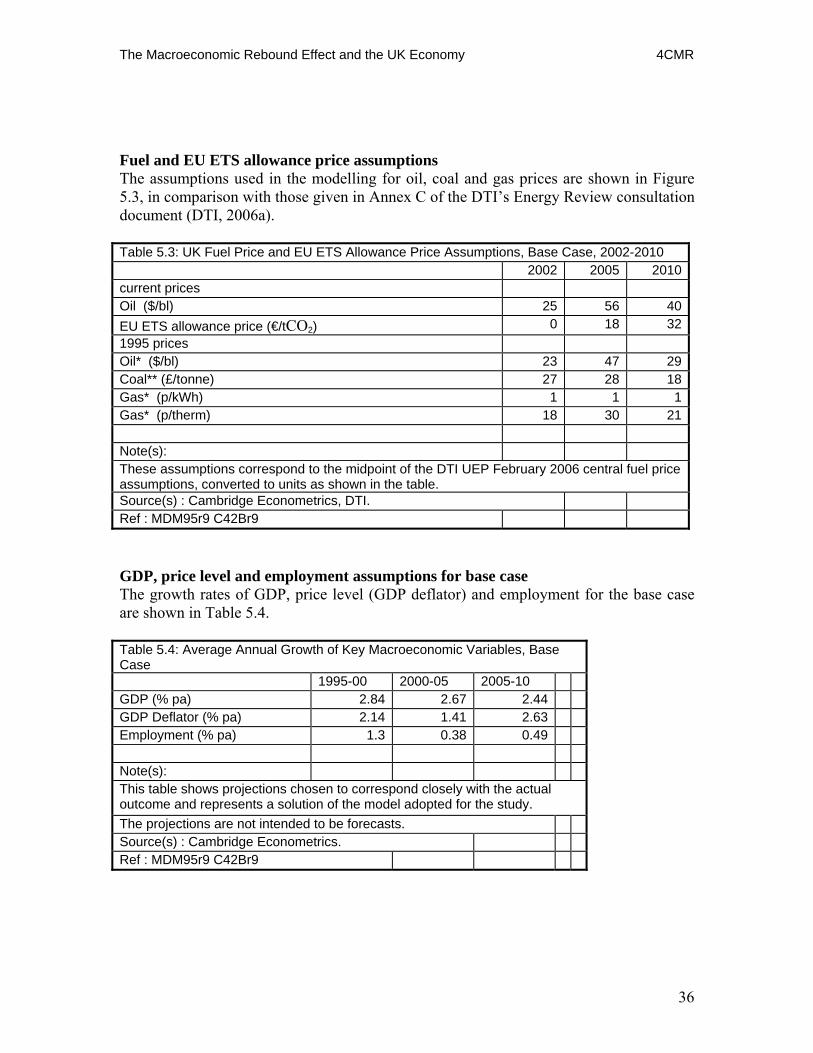
The Macroeconomic Rebound Effect and the UK Economy 4CMR
36
Fuel and EU ETS allowance price assumptions The assumptions used in the modelling for oil, coal and gas prices are shown in Figure 5.3, in comparison with those given in Annex C of the DTI’s Energy Review consultation document (DTI, 2006a). Table 5.3: UK Fuel Price and EU ETS Allowance Price Assumptions, Base Case, 2002-2010 2002 2005 2010current prices Oil ($/bl) 25 56 40EU ETS allowance price (€/tCO2) 0 18 321995 prices Oil* ($/bl) 23 47 29Coal** (£/tonne) 27 28 18Gas* (p/kWh) 1 1 1Gas* (p/therm) 18 30 21 Note(s): These assumptions correspond to the midpoint of the DTI UEP February 2006 central fuel price assumptions, converted to units as shown in the table. Source(s) : Cambridge Econometrics, DTI. Ref : MDM95r9 C42Br9 GDP, price level and employment assumptions for base case The growth rates of GDP, price level (GDP deflator) and employment for the base case are shown in Table 5.4. Table 5.4: Average Annual Growth of Key Macroeconomic Variables, Base Case 1995-00 2000-05 2005-10 GDP (% pa) 2.84 2.67 2.44 GDP Deflator (% pa) 2.14 1.41 2.63 Employment (% pa) 1.3 0.38 0.49 Note(s): This table shows projections chosen to correspond closely with the actual outcome and represents a solution of the model adopted for the study. The projections are not intended to be forecasts. Source(s) : Cambridge Econometrics. Ref : MDM95r9 C42Br9
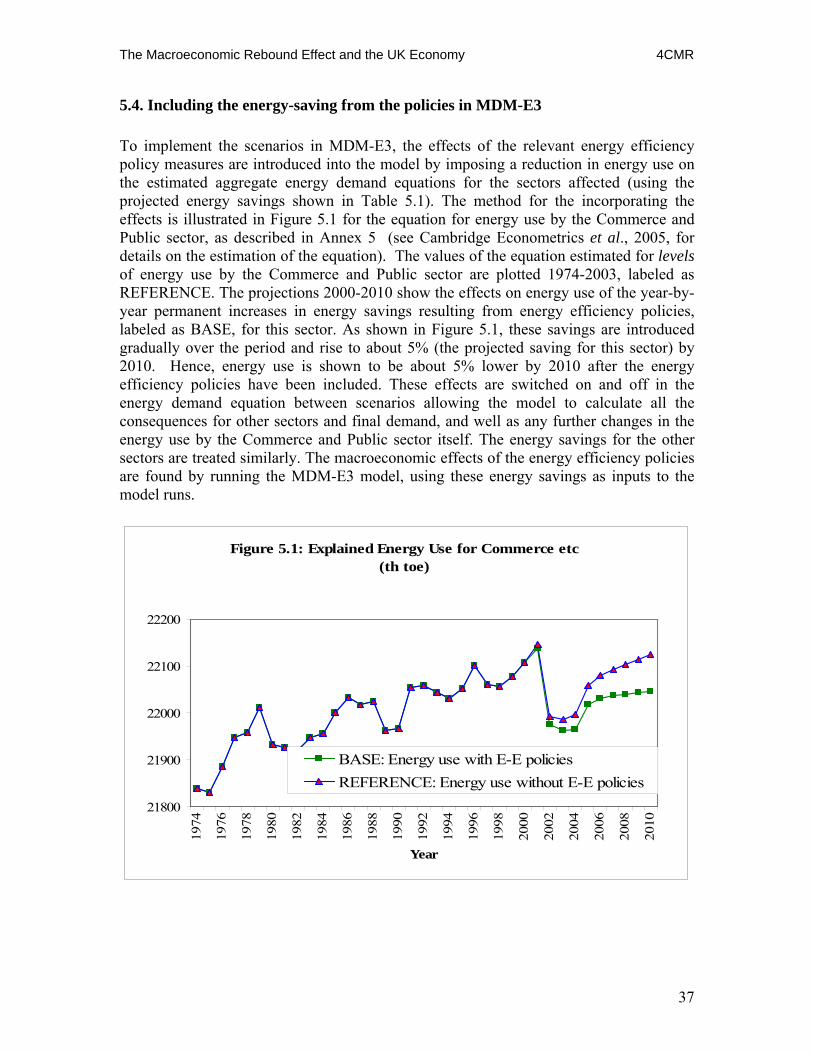
The Macroeconomic Rebound Effect and the UK Economy 4CMR
37
5.4. Including the energy-saving from the policies in MDM-E3 To implement the scenarios in MDM-E3, the effects of the relevant energy efficiency policy measures are introduced into the model by imposing a reduction in energy use on the estimated aggregate energy demand equations for the sectors affected (using the projected energy savings shown in Table 5.1). The method for the incorporating the effects is illustrated in Figure 5.1 for the equation for energy use by the Commerce and Public sector, as described in Annex 5 (see Cambridge Econometrics et al., 2005, for details on the estimation of the equation). The values of the equation estimated for levels of energy use by the Commerce and Public sector are plotted 1974-2003, labeled as REFERENCE. The projections 2000-2010 show the effects on energy use of the year-by-year permanent increases in energy savings resulting from energy efficiency policies, labeled as BASE, for this sector. As shown in Figure 5.1, these savings are introduced gradually over the period and rise to about 5% (the projected saving for this sector) by 2010. Hence, energy use is shown to be about 5% lower by 2010 after the energy efficiency policies have been included. These effects are switched on and off in the energy demand equation between scenarios allowing the model to calculate all the consequences for other sectors and final demand, and well as any further changes in the energy use by the Commerce and Public sector itself. The energy savings for the other sectors are treated similarly. The macroeconomic effects of the energy efficiency policies are found by running the MDM-E3 model, using these energy savings as inputs to the model runs.
Figure 5.1: Explained Energy Use for Commerce etc(th toe)
21800
21900
22000
22100
22200
1974
1976
1978
1980
1982
1984
1986
1988
1990
1992
1994
1996
1998
2000
2002
2004
2006
2008
2010
Year
BASE: Energy use with E-E policies REFERENCE: Energy use without E-E policies
The Macroeconomic Rebound Effect and the UK Economy 4CMR
38
6. Results This Chapter describes and explains the results of the MDM-E3 model runs for base case scenario, which includes the full set of energy efficiency policies for period 2000-2010. The difference between the results for this base case scenario and those for the reference case scenario, which does not include the energy efficiency policies, is used to assess the impacts of these policies. The overall impacts of energy efficiency policies on energy demand, CO2 emissions and key macroeconomic variables, including GDP, price levels and employment, are described in Section 6.1, and the sources of these macroeconomic effects are explained. These effects include the macroeconomic rebound effect, which is calculated and explained in Section 6.4. The sectoral effects of energy efficiency policies on energy demand, CO2 emissions and gross output are described in section 6.2. The impacts of sector-specific policies are given in Section 6.3. Finally, an estimate of the total rebound effect, combining the calculated macroeconomic rebound and assumed direct rebound effects, is given in Section 6.5. The results of further scenario and sensitivity analysis are given in the following Chapter.
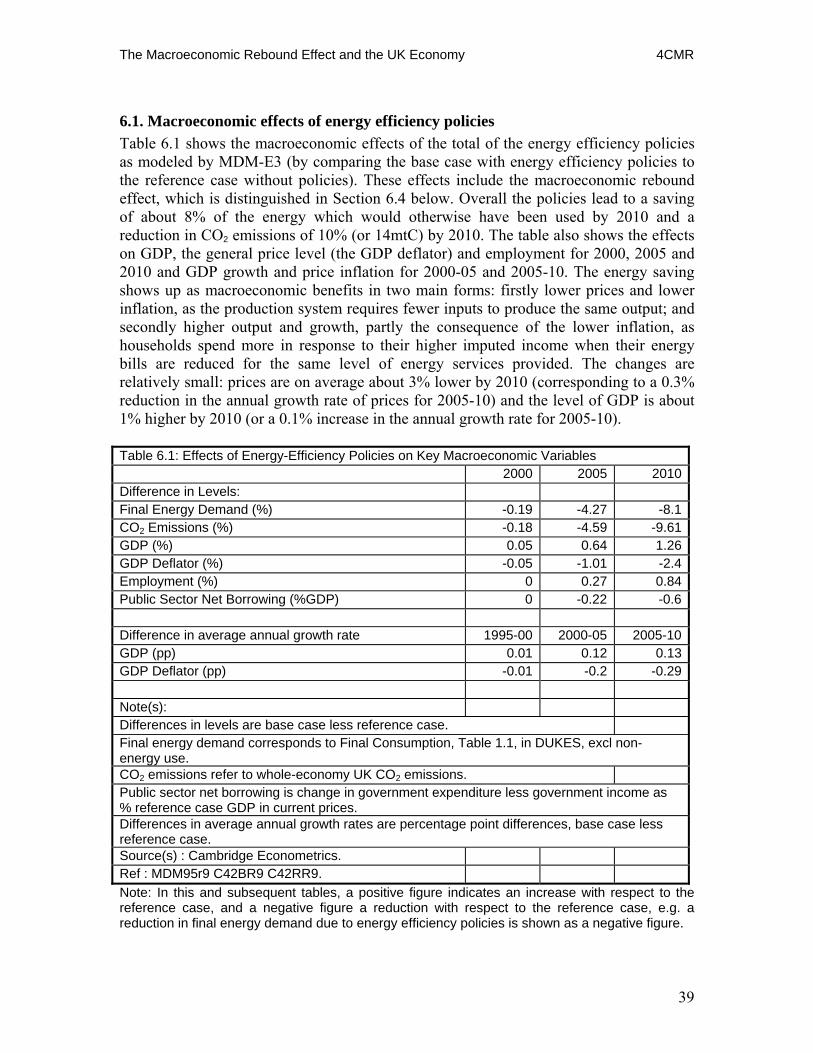
The Macroeconomic Rebound Effect and the UK Economy 4CMR
39
6.1. Macroeconomic effects of energy efficiency policies Table 6.1 shows the macroeconomic effects of the total of the energy efficiency policies as modeled by MDM-E3 (by comparing the base case with energy efficiency policies to the reference case without policies). These effects include the macroeconomic rebound effect, which is distinguished in Section 6.4 below. Overall the policies lead to a saving of about 8% of the energy which would otherwise have been used by 2010 and a reduction in CO2 emissions of 10% (or 14mtC) by 2010. The table also shows the effects on GDP, the general price level (the GDP deflator) and employment for 2000, 2005 and 2010 and GDP growth and price inflation for 2000-05 and 2005-10. The energy saving shows up as macroeconomic benefits in two main forms: firstly lower prices and lower inflation, as the production system requires fewer inputs to produce the same output; and secondly higher output and growth, partly the consequence of the lower inflation, as households spend more in response to their higher imputed income when their energy bills are reduced for the same level of energy services provided. The changes are relatively small: prices are on average about 3% lower by 2010 (corresponding to a 0.3% reduction in the annual growth rate of prices for 2005-10) and the level of GDP is about 1% higher by 2010 (or a 0.1% increase in the annual growth rate for 2005-10). Table 6.1: Effects of Energy-Efficiency Policies on Key Macroeconomic Variables 2000 2005 2010Difference in Levels: Final Energy Demand (%) -0.19 -4.27 -8.1CO2 Emissions (%) -0.18 -4.59 -9.61GDP (%) 0.05 0.64 1.26GDP Deflator (%) -0.05 -1.01 -2.4Employment (%) 0 0.27 0.84Public Sector Net Borrowing (%GDP) 0 -0.22 -0.6 Difference in average annual growth rate 1995-00 2000-05 2005-10GDP (pp) 0.01 0.12 0.13GDP Deflator (pp) -0.01 -0.2 -0.29 Note(s): Differences in levels are base case less reference case. Final energy demand corresponds to Final Consumption, Table 1.1, in DUKES, excl non-energy use. CO2 emissions refer to whole-economy UK CO2 emissions. Public sector net borrowing is change in government expenditure less government income as % reference case GDP in current prices. Differences in average annual growth rates are percentage point differences, base case less reference case. Source(s) : Cambridge Econometrics. Ref : MDM95r9 C42BR9 C42RR9. Note: In this and subsequent tables, a positive figure indicates an increase with respect to the reference case, and a negative figure a reduction with respect to the reference case, e.g. a reduction in final energy demand due to energy efficiency policies is shown as a negative figure.

The Macroeconomic Rebound Effect and the UK Economy 4CMR
40
Fiscal and monetary responses Although these macroeconomic effects are small they raise the issue of whether fiscal and monetary policy would respond. The two rules adopted by HM Treasury for fiscal stability are: the golden rule: over the economic cycle, the Government will borrow only to invest and not to fund current spending; and the sustainable investment rule: public sector net debt as a proportion of GDP will be held over the economic cycle at a stable and prudent level. Since the public-sector costs of energy efficiency policies are justified in cost-benefit terms as investments, a small increase in borrowing would not breach the golden rule. However, the policies are estimated to reduce borrowing (Public Sector Net Borrowing) by about £9bn, or 0.6% of GDP, by 2010, mainly through their effects in lowering costs and prices in general, lowering government current spending by 3% (in current prices by 2010) in particular. The implication for fiscal balance is that other policies could compensate, through lower taxes or higher government expenditures, both of which would be likely to increase growth, although their effect on inflation is ambiguous. The Bank of England is charged with maintaining inflation within a target range around 2.5% pa. The Bank has to anticipate inflation and allow for uncertainties and current economic conditions, and in doing so it does not adopt a simple rule. The implication is that if energy efficiency policies lead to inflation being somewhat lower, the Bank would respond so that interest rates and the exchange rate would be lower. In turn, this would stimulate housing demand and house prices and more export growth and higher imported inflation. The net outcome of both fiscal and monetary responses, although small, suggests that growth and inflation would be higher than without the responses. Higher inflation would reduce the effect of the policies on public borrowing. On trade, import volumes rise more than GDP, but prices fall for both imports and exports, and the balance of payments (exchange rates are fixed) deteriorates by about £3bn by 2010. The results suggest that higher energy efficiencies in the UK would be associated with more inward investment (the economy is more price competitive, with slightly stronger growth prospects). Decomposition of macroeconomic effects Table 6.2 shows the sources of the overall macroeconomic effects estimated for the energy efficiency policies. The table shows the effects by 2010 of % differences, base from reference case decomposed into three sources as follows.
1) The effects of higher imputed incomes for private consumers. A source of macroeconomic effect is the implication of the reduction in energy costs for consumer incomes. With the introduction of tighter building regulations and other policies to improve efficiency by the domestic sector, market energy prices are largely unchanged, but gross energy use falls if the volume of energy services remains the same. The higher real incomes must be imputed and allocated to consumers so that they increase their spending, as if they had an increase in actual income. The table shows that this extra spending leads to slightly higher energy use and emissions, but even higher GDP and consumers’ expenditure in total. In other words, the use of energy and carbon is inelastic to changes in consumer income.

The Macroeconomic Rebound Effect and the UK Economy 4CMR
41
2) The effects of the higher investment directly associated with the energy efficiency policies. Examples are the cost of extra insulation of houses or the extra cost of a fuel-efficient car over another with similar characteristics, but lower efficiency. This extra investment, provided as the costs of the policies to consumers and business associated with the energy efficiency measures, is added to industrial investment for the CCA sectors, to investment in office buildings and dwellings and to the investment in road vehicles by consumers. There is very little effect on energy or CO2 emissions.
3) The effects of the policies in lowering energy use and industrial costs. The lower energy costs for consumers enable them to reallocate spending away from gas and electricity to a wide range of other goods and services, typically with very small energy and carbon content. In industry, the targeted reductions in energy and carbon intensities in the CCA sectors lead to a reduction in industrial costs and therefore prices, and consequently more output and exports. This is the main source of the reduced energy use and CO2 emissions and a major contributor to the reduction below baseline of prices.
Table 6.2: Sources of Macroeconomic Effects of Energy Efficiency Policies: UK 2010 Higher
imputed income
Higher energy efficiency investments
Lower energy use and industrial costs
Total
Final energy 0.0 0.0 -8.1 -8.0 CO2 emissions 0.2 -0.2 -9.5 -9.6 GDP 0.5 0.5 0.3 1.3 GDP deflator -0.8 -0.8 -1.0 -2.4 Note: The table shows contributions to % difference between base case and reference case, from scenarios that decompose the total effects into 3 components. Source: Cambridge Econometrics. Ref.: BRRC9, RCRV9, RVRR9, BRRR9 These results show that the macroeconomic effects are dominated by the effects on consumer and industrial costs, leading to substitution of direct purchases of energy goods by those of other goods and services. The indirect effects on energy from higher imputed incomes and extra investment are very small. A discussion of the implications for the rebound effect is provided in Section 6.4 below.
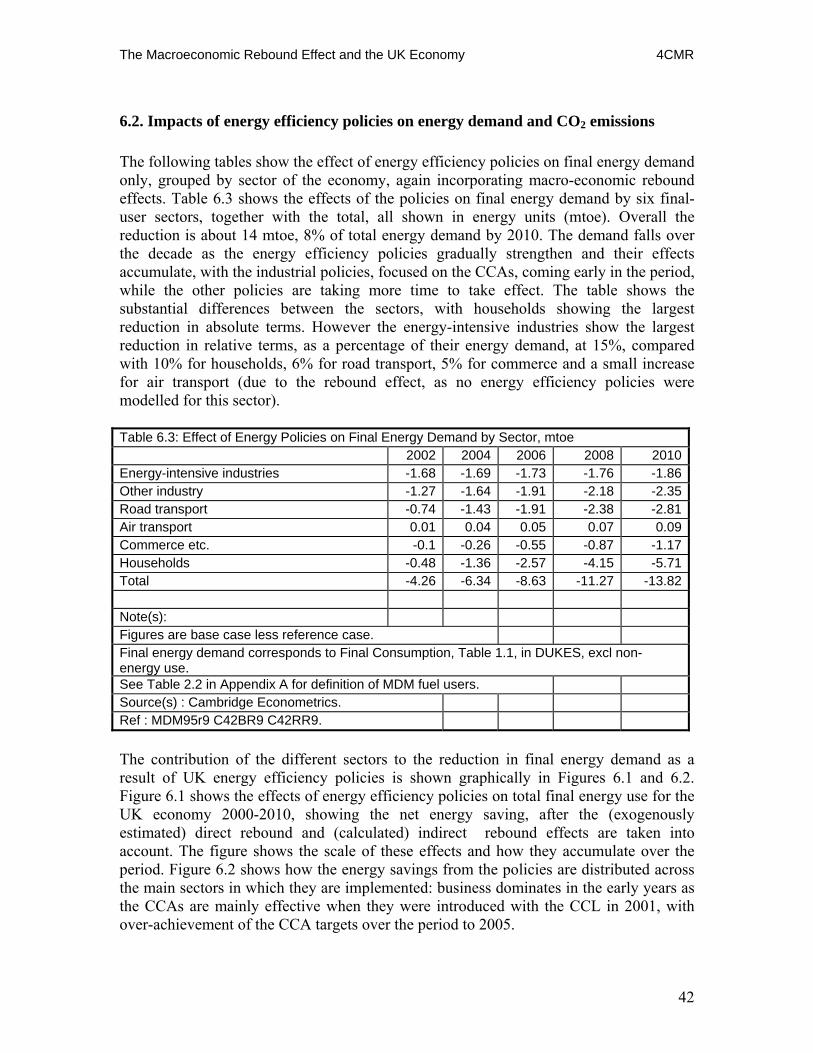
The Macroeconomic Rebound Effect and the UK Economy 4CMR
42
6.2. Impacts of energy efficiency policies on energy demand and CO2 emissions The following tables show the effect of energy efficiency policies on final energy demand only, grouped by sector of the economy, again incorporating macro-economic rebound effects. Table 6.3 shows the effects of the policies on final energy demand by six final-user sectors, together with the total, all shown in energy units (mtoe). Overall the reduction is about 14 mtoe, 8% of total energy demand by 2010. The demand falls over the decade as the energy efficiency policies gradually strengthen and their effects accumulate, with the industrial policies, focused on the CCAs, coming early in the period, while the other policies are taking more time to take effect. The table shows the substantial differences between the sectors, with households showing the largest reduction in absolute terms. However the energy-intensive industries show the largest reduction in relative terms, as a percentage of their energy demand, at 15%, compared with 10% for households, 6% for road transport, 5% for commerce and a small increase for air transport (due to the rebound effect, as no energy efficiency policies were modelled for this sector). Table 6.3: Effect of Energy Policies on Final Energy Demand by Sector, mtoe 2002 2004 2006 2008 2010Energy-intensive industries -1.68 -1.69 -1.73 -1.76 -1.86Other industry -1.27 -1.64 -1.91 -2.18 -2.35Road transport -0.74 -1.43 -1.91 -2.38 -2.81Air transport 0.01 0.04 0.05 0.07 0.09Commerce etc. -0.1 -0.26 -0.55 -0.87 -1.17Households -0.48 -1.36 -2.57 -4.15 -5.71Total -4.26 -6.34 -8.63 -11.27 -13.82 Note(s): Figures are base case less reference case. Final energy demand corresponds to Final Consumption, Table 1.1, in DUKES, excl non-energy use. See Table 2.2 in Appendix A for definition of MDM fuel users. Source(s) : Cambridge Econometrics. Ref : MDM95r9 C42BR9 C42RR9. The contribution of the different sectors to the reduction in final energy demand as a result of UK energy efficiency policies is shown graphically in Figures 6.1 and 6.2. Figure 6.1 shows the effects of energy efficiency policies on total final energy use for the UK economy 2000-2010, showing the net energy saving, after the (exogenously estimated) direct rebound and (calculated) indirect rebound effects are taken into account. The figure shows the scale of these effects and how they accumulate over the period. Figure 6.2 shows how the energy savings from the policies are distributed across the main sectors in which they are implemented: business dominates in the early years as the CCAs are mainly effective when they were introduced with the CCL in 2001, with over-achievement of the CCA targets over the period to 2005.

The Macroeconomic Rebound Effect and the UK Economy 4CMR
43
Figure 6.1. Effects of energy efficiency policies on UK final energy demand 2000-2010 Figure 6.2 Disaggregation of net energy saving from energy efficiency policies 2000-2010
-16000-14000-12000-10000
-8000-6000-4000-2000
02000
2000 2002 2004 2006 2008 2010
th tonnes oil-equivalent
Transport
Commercialetc
Business
Domestic
020000400006000080000
100000120000140000160000180000
2000 2002 2004 2006 2008 2010
th tonnes oil-equivalent
Net energysavingIndirectreboundDirectreboundNo rebound
Reference
Base
-16000-14000-12000-10000
-8000-6000-4000-2000
02000
2000 2002 2004 2006 2008 2010
th tonnes oil-equivalent
Net energy saving shown as reductions in demand
The Macroeconomic Rebound Effect and the UK Economy 4CMR
44
Sectoral effects of energy efficiency policies Effects on gross output The principal measure of production in MDM-E3 is gross output, since this includes industrial demand for products as well as final demand. The effects of energy efficiency policies are calculated by comparing the results from the base scenario (with the policies) with the reference scenario (without the policies). The differences in gross output by 2010 are shown in Figure 6.2 as %, disaggregated by the 50 industrial sectors (see Table A2.2 for the full list). Gross output changes because more energy efficiency reduces industrial costs and prices, and increases industrial investment so raises price and non-price competitiveness. Exports are higher than otherwise, and imports are lower. At the same time the higher energy efficiency in household use of energy increases real consumer incomes, and leads to a switching of expenditures, depending on price and income elasticities (discussed below). The net effect on output and imports is that they are nearly all slightly higher, excluding energy products. Three features stand out in the changes shown in Figure 6.3. First, the large reductions in gas and electricity outputs dominate the sectoral results (changes of -11.4% for gas and -8.9% for electricity). The large changes represent the accumulated effects of all the policies across the economy. Output of manufactured fuel (mainly refined oil) also falls, but much less (a change of -0.5%), because it includes output of aviation and sea transport fuels, for which there are no energy efficiency policies included in the study, so that these outputs rise, offsetting the fall in road fuels. Second, the increases in output are widespread but much smaller. The sectors with higher output are mainly services, especially the most income-elastic, with hotels and catering the highest (2.6%), although there are many sectors with output over 2% higher by 2010. Air transport is included in this group, leading to the small rebound effect for air transport fuels. Third, total gross output is 1.2% above reference case by 2010, compared to 1.3% for GDP, the reason for the smaller gross output response being the reduction in electricity gross output, since electricity has a higher-than-average ratio of gross to net output. Effects on employment Overall a 0.8%, or 271 thousand, higher level of employment is calculated by 2010 as a result of the policies. The extra employment is concentrated in the service industries and construction: Health and social work (higher by 21thousand by 2010), Other business services (22), Miscellaneous services (22), Education (25), Construction (32), Hotels and catering (34). Nearly all the sectors with the larger increases in employment are geographically dispersed, and any extra pressure on wage inflation from these increases and the corresponding decreases in unemployment is likely to be very small. Effect on consumers’ expenditures Figure 6.4 shows the effects on the 51 categories of consumer spending included in the model. Compared to the effects on output these are much larger, with the reductions of between 9 and 15% spread across the energy sectors. The sectors with higher increases are air travel, catering and several other services, but purchases of vehicles is highest, as a result of a high response to incomes and the extra investment by consumers in more fuel-efficiency in private cars.
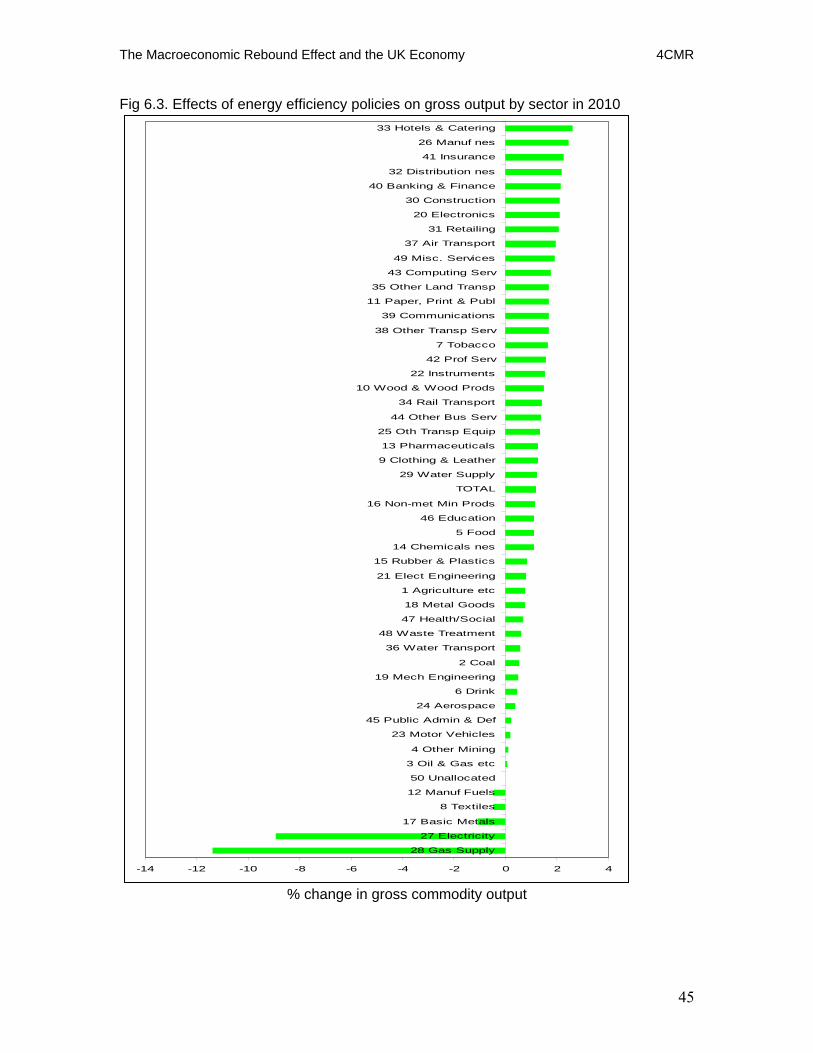
The Macroeconomic Rebound Effect and the UK Economy 4CMR
45
Fig 6.3. Effects of energy efficiency policies on gross output by sector in 2010
-14 -12 -10 -8 -6 -4 -2 0 2 4
28 Gas Supply
27 Electricity
17 Basic Metals
8 Textiles
12 Manuf Fuels
50 Unallocated
3 Oil & Gas etc
4 Other Mining
23 Motor Vehicles
45 Public Admin & Def
24 Aerospace
6 Drink
19 Mech Engineering
2 Coal
36 Water Transport
48 Waste Treatment
47 Health/Social
18 Metal Goods
1 Agriculture etc
21 Elect Engineering
15 Rubber & Plastics
14 Chemicals nes
5 Food
46 Education
16 Non-met Min Prods
TOTAL
29 Water Supply
9 Clothing & Leather
13 Pharmaceuticals
25 Oth Transp Equip
44 Other Bus Serv
34 Rail Transport
10 Wood & Wood Prods
22 Instruments
42 Prof Serv
7 Tobacco
38 Other Transp Serv
39 Communications
11 Paper, Print & Publ
35 Other Land Transp
43 Computing Serv
49 Misc. Services
37 Air Transport
31 Retailing
20 Electronics
30 Construction
40 Banking & Finance
32 Distribution nes
41 Insurance
26 Manuf nes
33 Hotels & Catering
% change in gross commodity output

The Macroeconomic Rebound Effect and the UK Economy 4CMR
46
Fig. 6.4. Effect of energy efficiency policies on consumer’s expenditure by 2010
-20 -15 -10 -5 0 5 10
16 Other fuels
15 Coal & coke
14 Gas
13 Electricity
27 Petrol & oil
50 Foreign tourists exp
6 Tobacco
9 Actual rents for hsg
1 Food
3 Beer
4 Spirits
39 Package holidays
8 Footwear
30 Buses & coaches
10 Imputed rents for hsg
38 Newspapers & books
12 Water & dwelling serv
5 Wine, cider & perry
42 Accommodation servs
21 Tools & equipment
25 Hospital services
29 Rail travel
37 Rec & cultural servs
40 Educational services
11 Maintenance of hsg
2 Non-alcoholic drinks
24 Out-patient services
17 Furniture & carpets
43 Personal care
22 Gds & servs hh maint
33 Communications
7 Clothing
TOTAL
28 Running costs of m/v
49 Expenditure abroad
20 Tableware & hh utens
32 Other travel
44 Personal effects nec
19 Household appliances
36 Other recreational eq
18 Household textiles
23 Medical products & eq
51 NPISH final exp
45 Social protection
31 Air travel
41 Catering services
34 AV, photo & info eq
46 Insurance
35 Other durables
48 Other services nec
47 Financial servs nec
26 Purchase of vehicles
% change in consumers’ expenditure
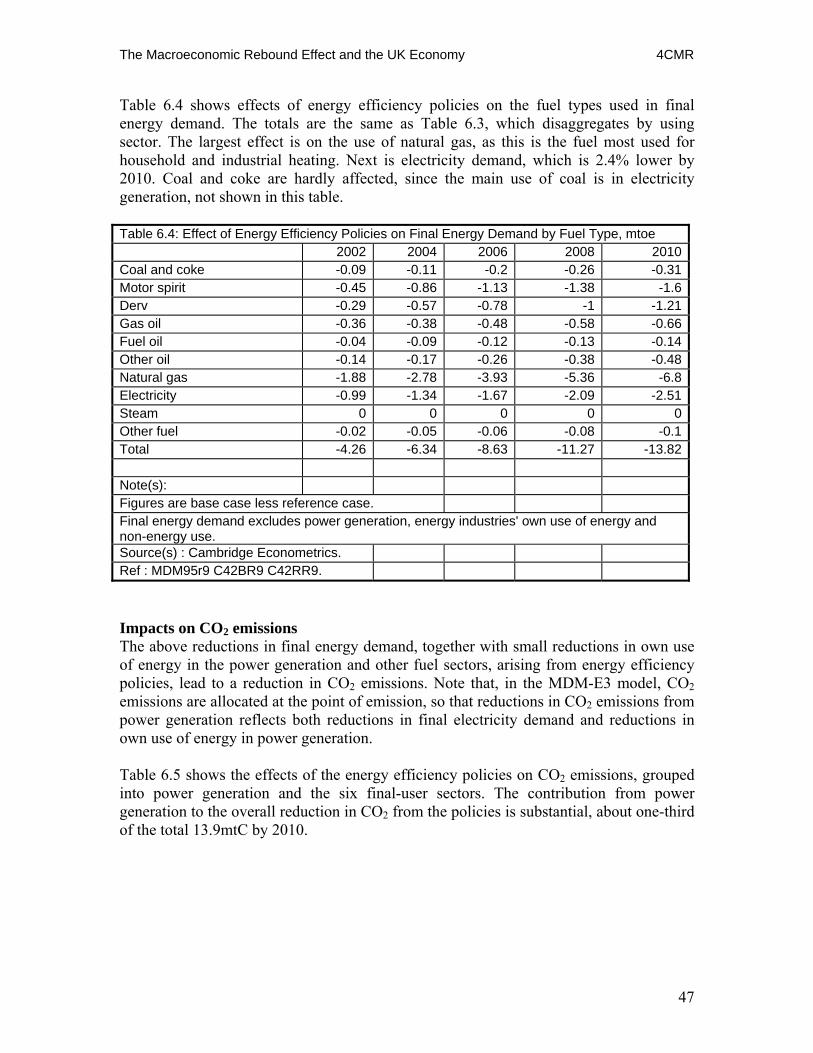
The Macroeconomic Rebound Effect and the UK Economy 4CMR
47
Table 6.4 shows effects of energy efficiency policies on the fuel types used in final energy demand. The totals are the same as Table 6.3, which disaggregates by using sector. The largest effect is on the use of natural gas, as this is the fuel most used for household and industrial heating. Next is electricity demand, which is 2.4% lower by 2010. Coal and coke are hardly affected, since the main use of coal is in electricity generation, not shown in this table. Table 6.4: Effect of Energy Efficiency Policies on Final Energy Demand by Fuel Type, mtoe 2002 2004 2006 2008 2010Coal and coke -0.09 -0.11 -0.2 -0.26 -0.31Motor spirit -0.45 -0.86 -1.13 -1.38 -1.6Derv -0.29 -0.57 -0.78 -1 -1.21Gas oil -0.36 -0.38 -0.48 -0.58 -0.66Fuel oil -0.04 -0.09 -0.12 -0.13 -0.14Other oil -0.14 -0.17 -0.26 -0.38 -0.48Natural gas -1.88 -2.78 -3.93 -5.36 -6.8Electricity -0.99 -1.34 -1.67 -2.09 -2.51Steam 0 0 0 0 0Other fuel -0.02 -0.05 -0.06 -0.08 -0.1Total -4.26 -6.34 -8.63 -11.27 -13.82 Note(s): Figures are base case less reference case. Final energy demand excludes power generation, energy industries' own use of energy and non-energy use. Source(s) : Cambridge Econometrics. Ref : MDM95r9 C42BR9 C42RR9. Impacts on CO2 emissions The above reductions in final energy demand, together with small reductions in own use of energy in the power generation and other fuel sectors, arising from energy efficiency policies, lead to a reduction in CO2 emissions. Note that, in the MDM-E3 model, CO2 emissions are allocated at the point of emission, so that reductions in CO2 emissions from power generation reflects both reductions in final electricity demand and reductions in own use of energy in power generation. Table 6.5 shows the effects of the energy efficiency policies on CO2 emissions, grouped into power generation and the six final-user sectors. The contribution from power generation to the overall reduction in CO2 from the policies is substantial, about one-third of the total 13.9mtC by 2010.

The Macroeconomic Rebound Effect and the UK Economy 4CMR
48
Table 6.5: Effect of Energy Efficiency Policies on CO2 Emissions by Sector, mtC 2002 2004 2006 2008 2010Power generation -1.77 -1.65 -2.65 -3.73 -4.67Energy-intensive industries -1.42 -1.36 -1.37 -1.4 -1.48Other industry -0.63 -0.79 -0.96 -1.1 -1.17Road transport -0.54 -1.04 -1.39 -1.74 -2.05Air transport 0 0 0.01 0.01 0.01Commerce etc. -0.06 -0.14 -0.28 -0.44 -0.58Households -0.24 -0.68 -1.33 -2.17 -3Total -4.91 -6.07 -8.59 -11.4 -13.98 Note(s): Figures are base case less reference case. Total CO2 emissions includes emissions from energy intensive industries' own use of energy, rail transport and water transport. Source(s) : Cambridge Econometrics. Ref : MDM95r9 C42BR9 C42RR9.
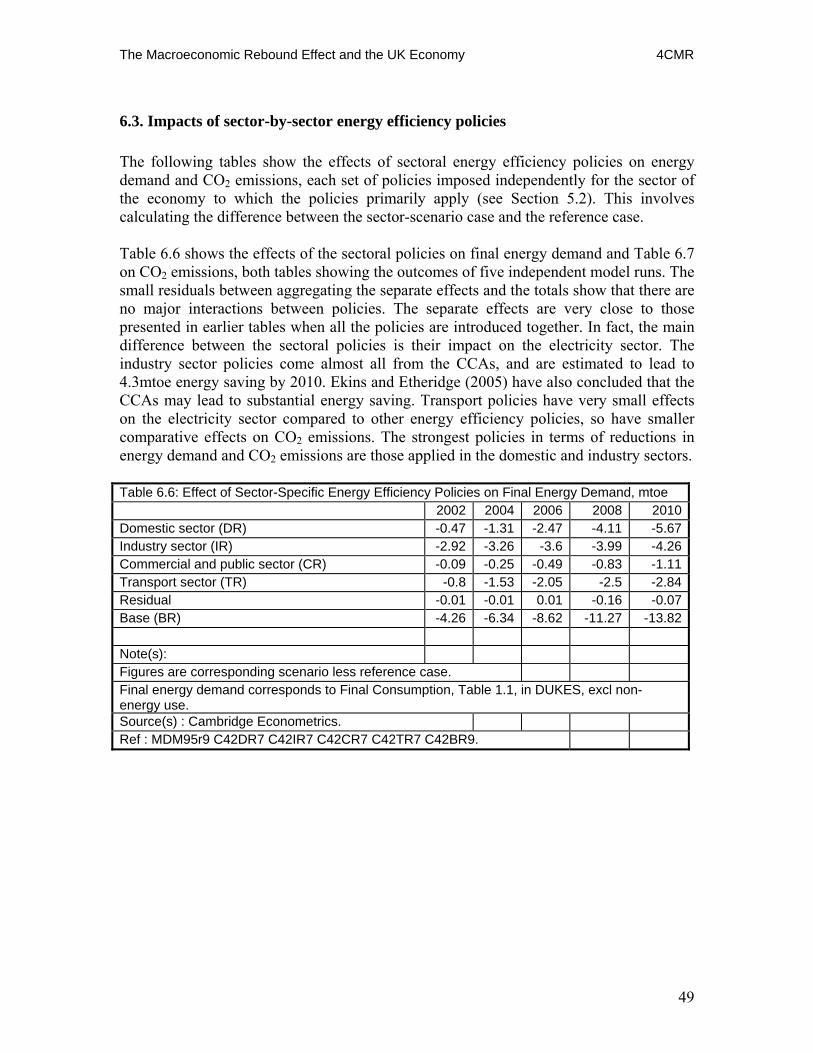
The Macroeconomic Rebound Effect and the UK Economy 4CMR
49
6.3. Impacts of sector-by-sector energy efficiency policies The following tables show the effects of sectoral energy efficiency policies on energy demand and CO2 emissions, each set of policies imposed independently for the sector of the economy to which the policies primarily apply (see Section 5.2). This involves calculating the difference between the sector-scenario case and the reference case. Table 6.6 shows the effects of the sectoral policies on final energy demand and Table 6.7 on CO2 emissions, both tables showing the outcomes of five independent model runs. The small residuals between aggregating the separate effects and the totals show that there are no major interactions between policies. The separate effects are very close to those presented in earlier tables when all the policies are introduced together. In fact, the main difference between the sectoral policies is their impact on the electricity sector. The industry sector policies come almost all from the CCAs, and are estimated to lead to 4.3mtoe energy saving by 2010. Ekins and Etheridge (2005) have also concluded that the CCAs may lead to substantial energy saving. Transport policies have very small effects on the electricity sector compared to other energy efficiency policies, so have smaller comparative effects on CO2 emissions. The strongest policies in terms of reductions in energy demand and CO2 emissions are those applied in the domestic and industry sectors. Table 6.6: Effect of Sector-Specific Energy Efficiency Policies on Final Energy Demand, mtoe 2002 2004 2006 2008 2010Domestic sector (DR) -0.47 -1.31 -2.47 -4.11 -5.67Industry sector (IR) -2.92 -3.26 -3.6 -3.99 -4.26Commercial and public sector (CR) -0.09 -0.25 -0.49 -0.83 -1.11Transport sector (TR) -0.8 -1.53 -2.05 -2.5 -2.84Residual -0.01 -0.01 0.01 -0.16 -0.07Base (BR) -4.26 -6.34 -8.62 -11.27 -13.82 Note(s): Figures are corresponding scenario less reference case. Final energy demand corresponds to Final Consumption, Table 1.1, in DUKES, excl non-energy use. Source(s) : Cambridge Econometrics. Ref : MDM95r9 C42DR7 C42IR7 C42CR7 C42TR7 C42BR9.
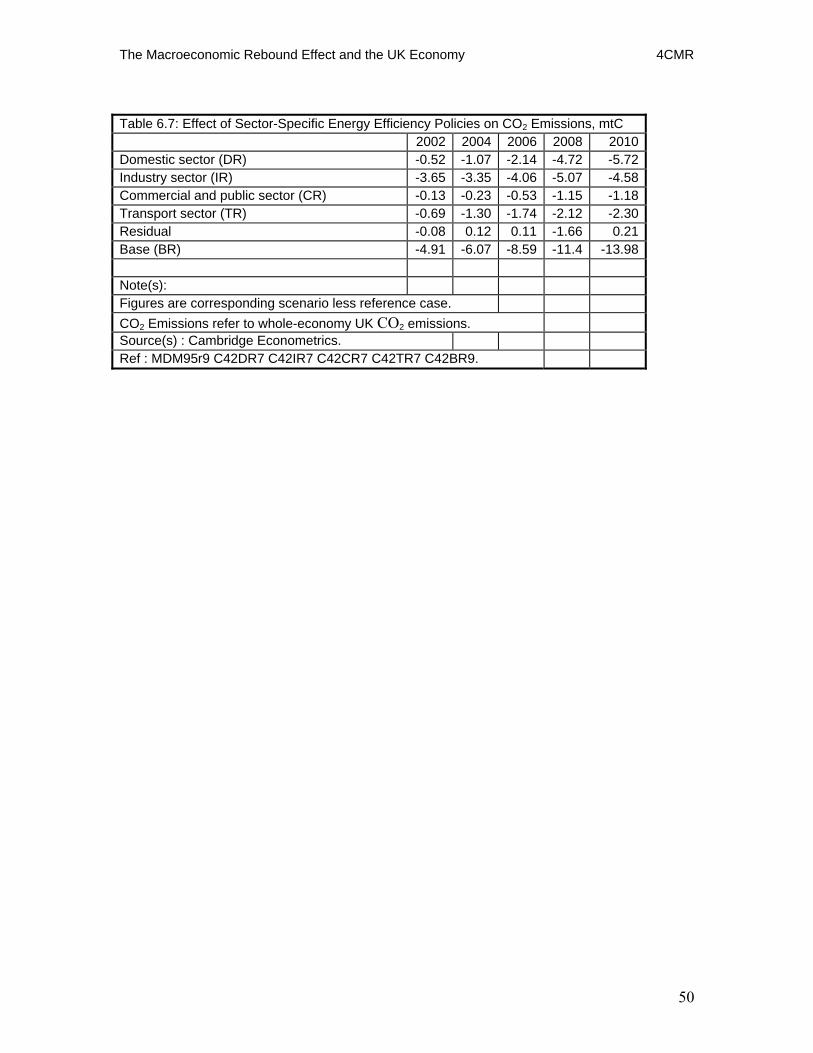
The Macroeconomic Rebound Effect and the UK Economy 4CMR
50
Table 6.7: Effect of Sector-Specific Energy Efficiency Policies on CO2 Emissions, mtC 2002 2004 2006 2008 2010 Domestic sector (DR) -0.52 -1.07 -2.14 -4.72 -5.72 Industry sector (IR) -3.65 -3.35 -4.06 -5.07 -4.58 Commercial and public sector (CR) -0.13 -0.23 -0.53 -1.15 -1.18 Transport sector (TR) -0.69 -1.30 -1.74 -2.12 -2.30 Residual -0.08 0.12 0.11 -1.66 0.21 Base (BR) -4.91 -6.07 -8.59 -11.4 -13.98 Note(s): Figures are corresponding scenario less reference case. CO2 Emissions refer to whole-economy UK CO2 emissions. Source(s) : Cambridge Econometrics. Ref : MDM95r9 C42DR7 C42IR7 C42CR7 C42TR7 C42BR9.
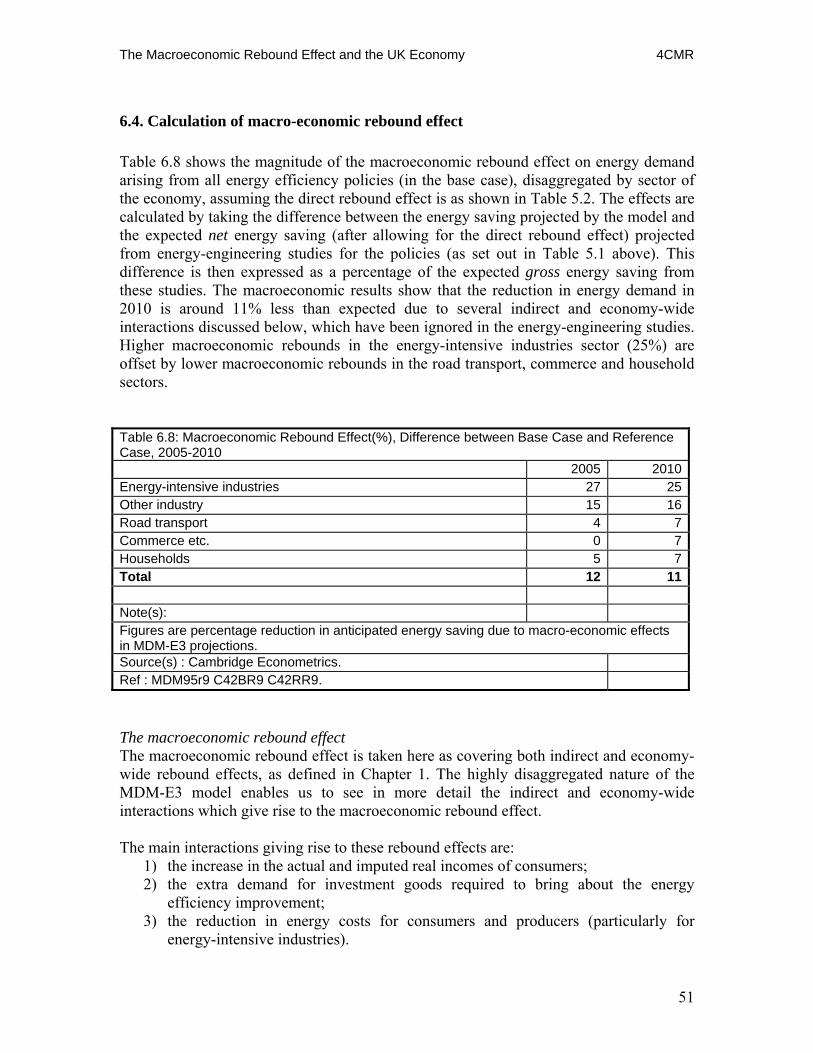
The Macroeconomic Rebound Effect and the UK Economy 4CMR
51
6.4. Calculation of macro-economic rebound effect Table 6.8 shows the magnitude of the macroeconomic rebound effect on energy demand arising from all energy efficiency policies (in the base case), disaggregated by sector of the economy, assuming the direct rebound effect is as shown in Table 5.2. The effects are calculated by taking the difference between the energy saving projected by the model and the expected net energy saving (after allowing for the direct rebound effect) projected from energy-engineering studies for the policies (as set out in Table 5.1 above). This difference is then expressed as a percentage of the expected gross energy saving from these studies. The macroeconomic results show that the reduction in energy demand in 2010 is around 11% less than expected due to several indirect and economy-wide interactions discussed below, which have been ignored in the energy-engineering studies. Higher macroeconomic rebounds in the energy-intensive industries sector (25%) are offset by lower macroeconomic rebounds in the road transport, commerce and household sectors. Table 6.8: Macroeconomic Rebound Effect(%), Difference between Base Case and Reference Case, 2005-2010 2005 2010Energy-intensive industries 27 25Other industry 15 16Road transport 4 7Commerce etc. 0 7Households 5 7Total 12 11 Note(s): Figures are percentage reduction in anticipated energy saving due to macro-economic effects in MDM-E3 projections. Source(s) : Cambridge Econometrics. Ref : MDM95r9 C42BR9 C42RR9. The macroeconomic rebound effect The macroeconomic rebound effect is taken here as covering both indirect and economy-wide rebound effects, as defined in Chapter 1. The highly disaggregated nature of the MDM-E3 model enables us to see in more detail the indirect and economy-wide interactions which give rise to the macroeconomic rebound effect. The main interactions giving rise to these rebound effects are:
1) the increase in the actual and imputed real incomes of consumers; 2) the extra demand for investment goods required to bring about the energy
efficiency improvement; 3) the reduction in energy costs for consumers and producers (particularly for
energy-intensive industries).

The Macroeconomic Rebound Effect and the UK Economy 4CMR
52
The first of these has been discussed in the analysis of the macroeconomic sources of the effects of energy efficiency policies in section 6.2 above. The conclusion from this analysis is that the higher imputed income gives rise to a small rebound effect, with the increase in GDP of 0.4% resulting in a 0.2% increase in final energy demand, compared with the overall change in energy demand of -8.0% from the policies. This is the implication of the long-run parameters included in the aggregate energy equations for the response of energy demand to economic activity. All these activity elasticities are below one in the range 0.75 (basic metals) to 0.1 (chemicals), with road transport 0.7 and households 0.2. Energy demand is therefore partly disengaged from activity in the long run. The low responses are interpreted as the outcome of several features in energy use. Firstly, the activities within each broad sector are typically shifting over time towards more service-based and less material-energy-based activities as incomes rise and quality improves; energy demand will grow more slowly than activities as a result. Secondly, technological progress is taking the diffused form of more control in production and distribution and more precise use of energy in the form of electricity rather than fossil fuels directly; aggregate energy grows less, but the share of electricity rises. Thirdly, much of energy use for heating and cooling of buildings (commercial and household use of energy) is largely an overhead cost, once comfort levels are reached; in consequence, energy use will be associated more with employment and numbers of households, rather than with output and incomes. Employment and numbers of households grow much less than GDP and incomes. The second source of the rebound effect is the increase in investment associated with the energy efficiency measures, also discussed in section 6.2 above. These investments are not obviously energy intensive. Indeed many of them, such as better control systems, and changes in procedures and behaviour may have low energy inputs. The equations for energy use in the model include the effects of technological progress measured as accumulated growth in investment, which has been assumed to be independent of the energy efficiency measures. The outcome is that this potential source of rebound goes in the opposite direction and slightly reduces the overall rebound effect, although it has comparative large macroeconomic effects on growth and inflation. This leaves the third source to account for nearly all the indirect and economy-wide rebound effects. The lower energy costs for consumers lead them to reallocate spending away from gas, electricity and gasoline/diesel to a wide range of other goods and services, typically with very small UK energy and carbon content (hence the rebound effect being so low). A case in point is the rebound effect that might be expected from improvements in insulation and home boilers leading to a re-allocation of household spending. Some of the most energy-intensive and income-elastic items of spending are purchases of vehicles, air travel and foreign tourism. For these, the extra increase in energy use needed to provide the goods and services partly or largely comes from abroad through the energy embodied in the imports of vehicles and tourist services. The energy saving from less use of UK-produced gas and electricity is partly offset by more use of oil-based energy, which is consumed abroad and the rebound effect defined for UK consumption is thereby reduced. The implicit energy content of imported vehicles, travel
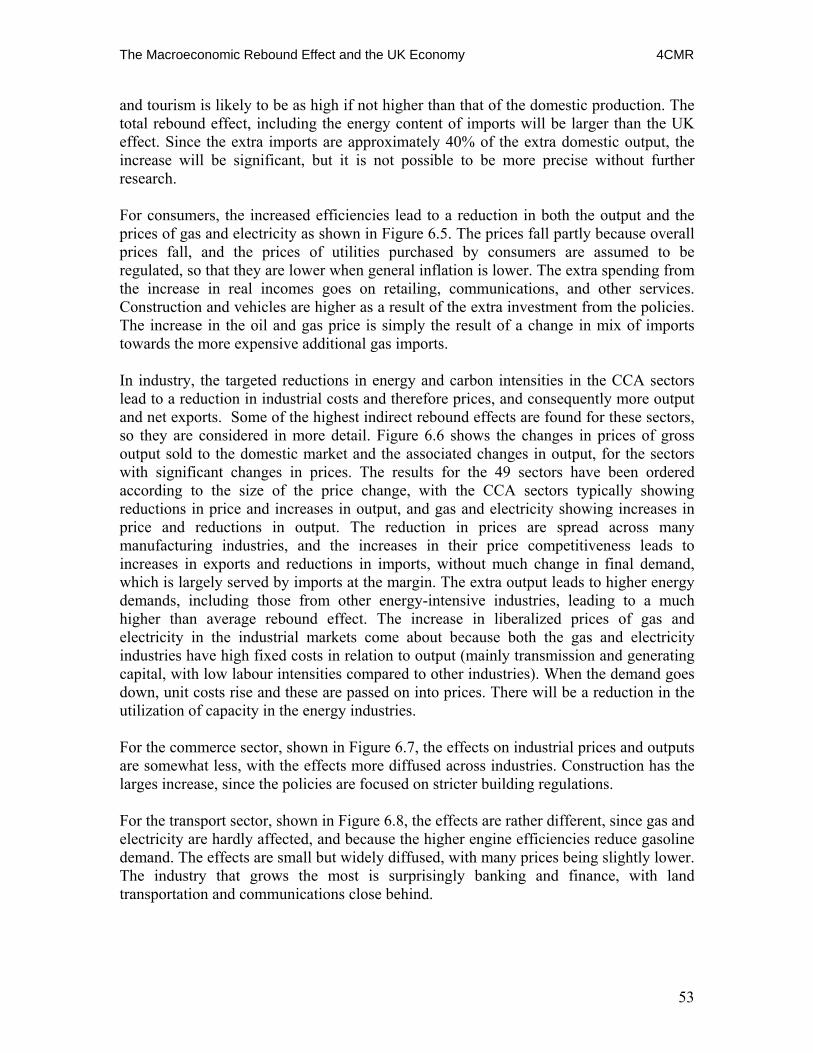
The Macroeconomic Rebound Effect and the UK Economy 4CMR
53
and tourism is likely to be as high if not higher than that of the domestic production. The total rebound effect, including the energy content of imports will be larger than the UK effect. Since the extra imports are approximately 40% of the extra domestic output, the increase will be significant, but it is not possible to be more precise without further research. For consumers, the increased efficiencies lead to a reduction in both the output and the prices of gas and electricity as shown in Figure 6.5. The prices fall partly because overall prices fall, and the prices of utilities purchased by consumers are assumed to be regulated, so that they are lower when general inflation is lower. The extra spending from the increase in real incomes goes on retailing, communications, and other services. Construction and vehicles are higher as a result of the extra investment from the policies. The increase in the oil and gas price is simply the result of a change in mix of imports towards the more expensive additional gas imports. In industry, the targeted reductions in energy and carbon intensities in the CCA sectors lead to a reduction in industrial costs and therefore prices, and consequently more output and net exports. Some of the highest indirect rebound effects are found for these sectors, so they are considered in more detail. Figure 6.6 shows the changes in prices of gross output sold to the domestic market and the associated changes in output, for the sectors with significant changes in prices. The results for the 49 sectors have been ordered according to the size of the price change, with the CCA sectors typically showing reductions in price and increases in output, and gas and electricity showing increases in price and reductions in output. The reduction in prices are spread across many manufacturing industries, and the increases in their price competitiveness leads to increases in exports and reductions in imports, without much change in final demand, which is largely served by imports at the margin. The extra output leads to higher energy demands, including those from other energy-intensive industries, leading to a much higher than average rebound effect. The increase in liberalized prices of gas and electricity in the industrial markets come about because both the gas and electricity industries have high fixed costs in relation to output (mainly transmission and generating capital, with low labour intensities compared to other industries). When the demand goes down, unit costs rise and these are passed on into prices. There will be a reduction in the utilization of capacity in the energy industries. For the commerce sector, shown in Figure 6.7, the effects on industrial prices and outputs are somewhat less, with the effects more diffused across industries. Construction has the larges increase, since the policies are focused on stricter building regulations. For the transport sector, shown in Figure 6.8, the effects are rather different, since gas and electricity are hardly affected, and because the higher engine efficiencies reduce gasoline demand. The effects are small but widely diffused, with many prices being slightly lower. The industry that grows the most is surprisingly banking and finance, with land transportation and communications close behind.
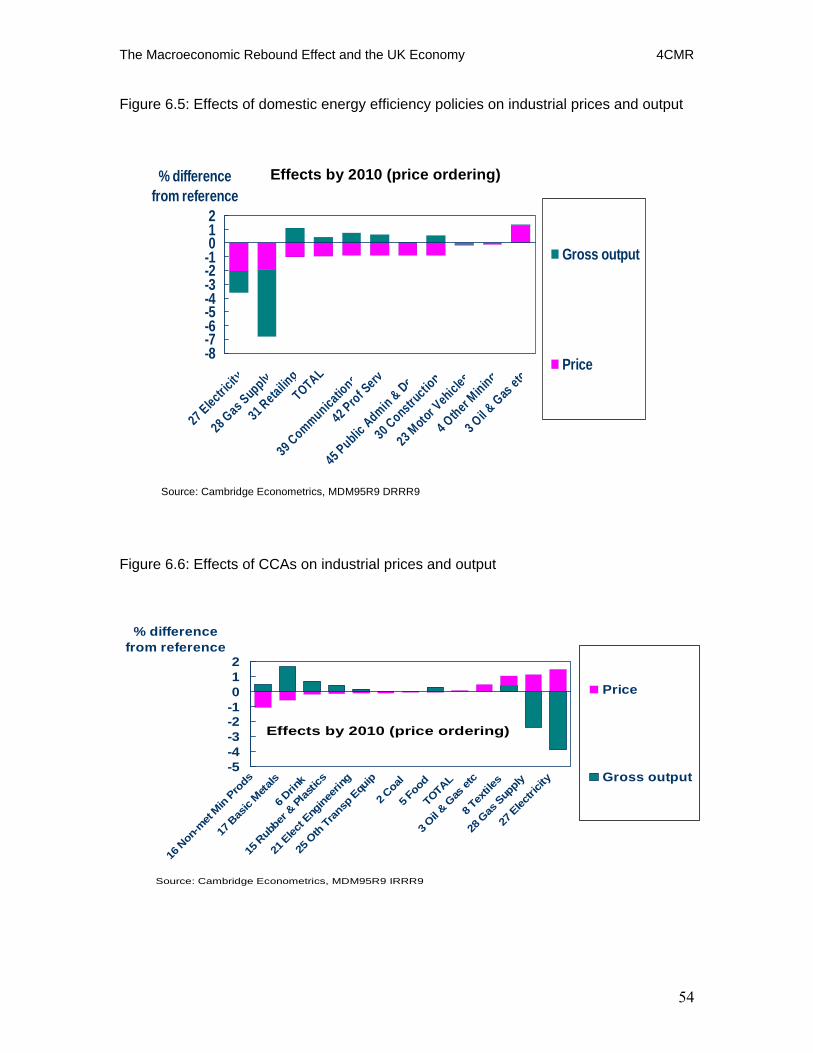
The Macroeconomic Rebound Effect and the UK Economy 4CMR
54
Figure 6.5: Effects of domestic energy efficiency policies on industrial prices and output
-8-7-6-5-4-3-2-1012
27 Electricity
28 Gas Supply
31 RetailingTOTAL
39 Communications
42 Prof Serv
45 Public Admin & Def
30 Constructio
n
23 Motor Vehicles
4 Other Mining
3 Oil & Gas etc
% difference from reference
Gross output
Price
Source: Cambridge Econometrics, MDM95R9 DRRR9
Effects by 2010 (price ordering)
Figure 6.6: Effects of CCAs on industrial prices and output
-5-4-3-2-1012
16 N
on-m
et Min
Prods
17 B
asic
Metals
6 Drin
k
15 R
ubber
& P
lastic
s
21 E
lect E
ngine
ering
25 O
th Tr
ansp
Equ
ip
2 Coa
l
5 Foo
d
TOTA
L
3 Oil &
Gas
etc
8 Tex
tiles
28 G
as S
upply
27 E
lectri
city
% difference from reference
Price
Gross output
Source: Cambridge Econometrics, MDM95R9 IRRR9
Effects by 2010 (price ordering)

The Macroeconomic Rebound Effect and the UK Economy 4CMR
55
Figure 6.7: Effects of energy efficiency policies for the commerce sector on industrial prices and output
-1.5-1
-0.50
0.51
1.5
27 E
lectri
city
43 C
omputing S
erv
31 R
etailin
g
42 P
rof S
erv
40 B
ankin
g & Fi
nance
29 W
ater
Supp
ly
32 D
istrib
ution nes
44 O
ther
Bus S
erv
30 C
onstru
ction
39 C
ommunicatio
ns
45 P
ublic A
dmin & D
ef
TOTAL
28 G
as S
upply
% difference from reference
Price
Gross output
Source: Cambridge Econometrics, MDM95R9 CRRR9
Effects by 2010 (price ordering)
Figure 6.8: Effects of energy efficiency policies for transport on industrial prices and output
-2-1.5
-1-0.5
00.5
11.5
35 Other L
and Transp
39 Communications
45 Public Admin & Def
20 Electronics
46 Education
27 Electricity
47 Health/Social
29 Water
Supply
30 Constructio
n
40 Banking & Finance
43 Computing Serv
TOTAL2 Coal
% difference from reference
Price
Gross output
Source: Cambridge Econometrics, MDM95R9 TRRR9
Effects by 2010 (price ordering)
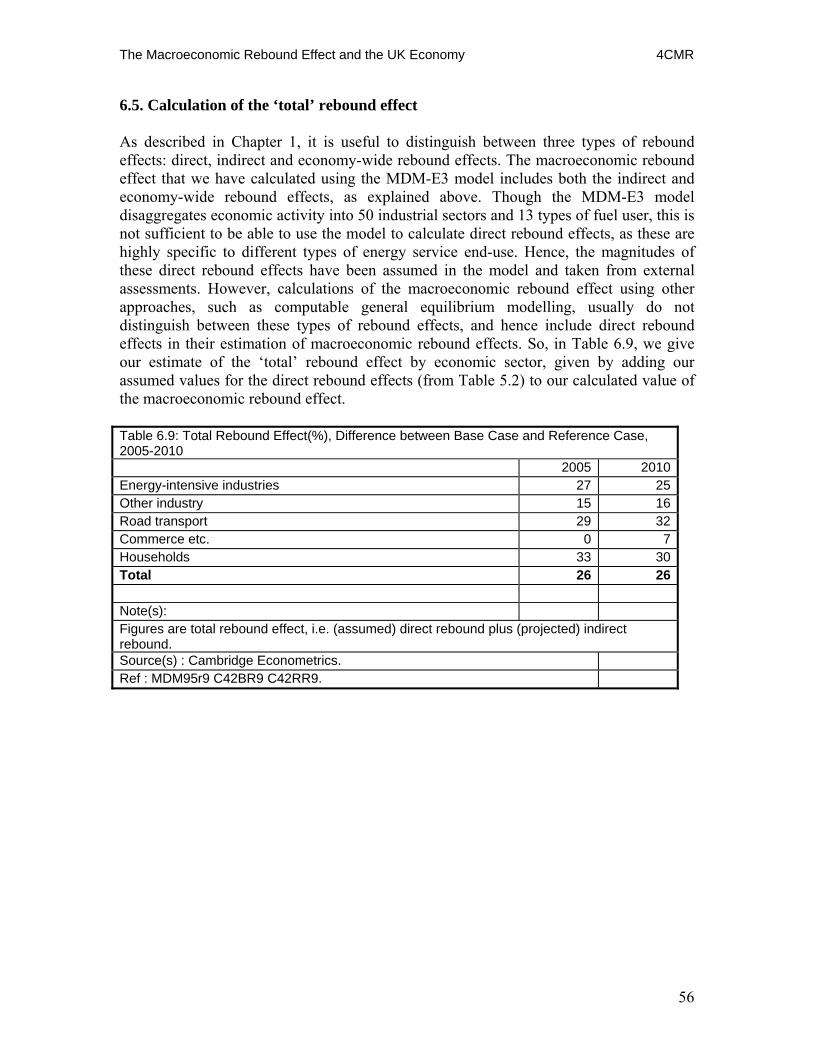
The Macroeconomic Rebound Effect and the UK Economy 4CMR
56
6.5. Calculation of the ‘total’ rebound effect As described in Chapter 1, it is useful to distinguish between three types of rebound effects: direct, indirect and economy-wide rebound effects. The macroeconomic rebound effect that we have calculated using the MDM-E3 model includes both the indirect and economy-wide rebound effects, as explained above. Though the MDM-E3 model disaggregates economic activity into 50 industrial sectors and 13 types of fuel user, this is not sufficient to be able to use the model to calculate direct rebound effects, as these are highly specific to different types of energy service end-use. Hence, the magnitudes of these direct rebound effects have been assumed in the model and taken from external assessments. However, calculations of the macroeconomic rebound effect using other approaches, such as computable general equilibrium modelling, usually do not distinguish between these types of rebound effects, and hence include direct rebound effects in their estimation of macroeconomic rebound effects. So, in Table 6.9, we give our estimate of the ‘total’ rebound effect by economic sector, given by adding our assumed values for the direct rebound effects (from Table 5.2) to our calculated value of the macroeconomic rebound effect. Table 6.9: Total Rebound Effect(%), Difference between Base Case and Reference Case, 2005-2010 2005 2010Energy-intensive industries 27 25Other industry 15 16Road transport 29 32Commerce etc. 0 7Households 33 30Total 26 26 Note(s): Figures are total rebound effect, i.e. (assumed) direct rebound plus (projected) indirect rebound. Source(s) : Cambridge Econometrics. Ref : MDM95r9 C42BR9 C42RR9.

The Macroeconomic Rebound Effect and the UK Economy 4CMR
57
7. Scenario and sensitivity analysis
7.1. Effects of enhancing energy efficiency policies Table 7.1 shows effects of enhancing energy efficiency policies, by scaling the existing policies with an additional 50% strength across the board. The effects on the key macroeconomic variables are close to an additional 50% of the effects of actual energy efficiency policies (shown in Table 6.1), as would be expected. The conclusion from the scenario results is that the 50% increase is not sufficient to push the economy into over –full employment and wage inflation (there are non-linear effects of unemployment in the regional wage equations). Clearly, the modelling suggests that energy efficiency policies could have been considerably strengthened without adverse macroeconomic effects. Whether such scaling up is justified at the level of the individual policies and programmes is another question, which we do not address here. Table 7.1: Effects of Scaled Energy-Efficiency Policies on Base Case Key Macroeconomic Variables 2000 2005 2010Difference in Levels: Final Energy Demand (%) -0.29 -6.57 -12.81CO2 Emissions (%) -0.27 -6.84 -15.29GDP (%) 0.08 1 1.81GDP Deflator (%) -0.08 -1.74 -3.64Employment (%) 0 0.69 1.15Public Sector Net Borrowing (%GDP) 0 -0.37 -0.82 Difference in average annual growth rate 1995-00 2000-05 2005-10GDP (pp) 0.02 0.19 0.16GDP Deflator (pp) -0.02 -0.34 -0.4 Note(s): Differences in levels are scaled EP case less base case. Final energy demand corresponds to Final Consumption, Table 1.1, in DUKES, excl non-energy use. CO2 emissions refer to whole-economy UK CO2 emissions. Public sector net borrowing is change in government expenditure less government income as % reference case GDP in current prices. Differences in average annual growth rates are percentage point differences, scaled EP case less base case. Source(s) : Cambridge Econometrics. Ref : MDM95r9 C42SB9 C42BR9.

The Macroeconomic Rebound Effect and the UK Economy 4CMR
58
Tables 7.2 and 7.3 show effects of enhanced energy efficiency policies on final energy demand and CO2 emissions, by power generation and the six final-user sectors. The 50% addition to energy efficiency policies leads to a greater than 50% additional reduction in energy demand and CO2 emissions. This effect is due to non-linearities in the electricity supply submodel, so that the reduction in electricity demand reduces the use of coal in particular, hence CO2 emissions. Table 7.2: Effect of Scaled Energy Efficiency Policies on Final Energy Demand by Sector, mtoe 2002 2004 2006 2008 2010Energy-intensive industries -2.52 -2.75 -2.86 -2.98 -3.21Other industry -1.88 -2.49 -2.93 -3.4 -3.73Road transport -1.11 -1.64 -2.88 -3.64 -4.31Air transport 0.02 0.2 0.09 0.11 0.13Commerce etc. -0.14 -0.4 -0.8 -1.29 -1.78Households -0.7 -2.07 -3.81 -6.35 -8.95Total -6.33 -9.15 -13.18 -17.54 -21.84 Note(s): Figures are scaled EP base case less base case. Final energy demand corresponds to Final Consumption, Table 1.1, in DUKES, excl non-energy use. See Table 2.2 in Appendix A for definition of MDM fuel users. Source(s) : Cambridge Econometrics. Ref : MDM95r9 C42SB9 C42BR9. Table 7.3: Effect of Scaled Energy Efficiency Policies on CO2 Emissions by Sector, mtC 2002 2004 2006 2008 2010Power generation -2.3 -2.48 -3.72 -6.1 -7.46Energy-intensive industries -2.14 -2.24 -2.28 -2.38 -2.58Other industry -0.94 -1.22 -1.49 -1.73 -1.86Road transport -0.81 -1.19 -2.1 -2.66 -3.15Air transport 0 0.02 0.01 0.01 0.02Commerce etc. -0.09 -0.26 -0.42 -0.65 -0.88Households -0.35 -1 -2 -3.35 -4.72Total -7 -8.95 -12.93 -18.13 -22.26 Note(s): Figures are scaled EP base case less base case. Total CO2 emissions includes emissions from energy intensive industries' own use of energy, rail transport and water transport. Source(s) : Cambridge Econometrics. Ref : MDM95r9 C42SB9 C42BR9.

The Macroeconomic Rebound Effect and the UK Economy 4CMR
59
7.2. A comparison of effects of energy efficiency policies and of higher world oil prices The macroeconomic effects of the energy efficiency policies described in section 6.2 can be compared to those of an increase in imported and domestically produced oil and gas prices of 40-50% above baseline by 2010 ( up by 42% over base case to $57/bl by 2010), calculated to achieve the same reductions in UK CO2 emissions. These are modelled as leading to a reduction in energy demand of 6%, compared to 8% for the energy efficiency policies, but the macroeconomic effects are completely different. However, the results have to be interpreted with strong qualifications, because monetary and fiscal policies are not adjusted to accommodate the price increases, so the price effects will be overstated and the growth effects understated. The higher oil prices are assumed to be accompanied by higher gas prices, and an adjustment has been made to the EU ETS allowance price, which will also be higher as a result of the higher gas prices (to prevent coal becoming more price competitive with gas, so preventing an increase in CO2 emissions). Without interest rate changes, the higher oil prices lead to a GDP deflator 5.7% above base by 2010 (corresponding to a 1.1% increase in the annual growth rate of prices for 2005-10) with the level of GDP down by 1.5% (or a 0.3% decrease in the annual growth rate for 2005-10). If interest rates were to be higher to choke off the extra inflation, growth would be depressed even more. The reductions in energy demand are concentrated in transportation, although there are appreciable reductions in the use of gas and electricity for space heating. The EU ETS allowance price has to rise from €32/tCO2 by 2010 in the reference case to €45/tCO2.
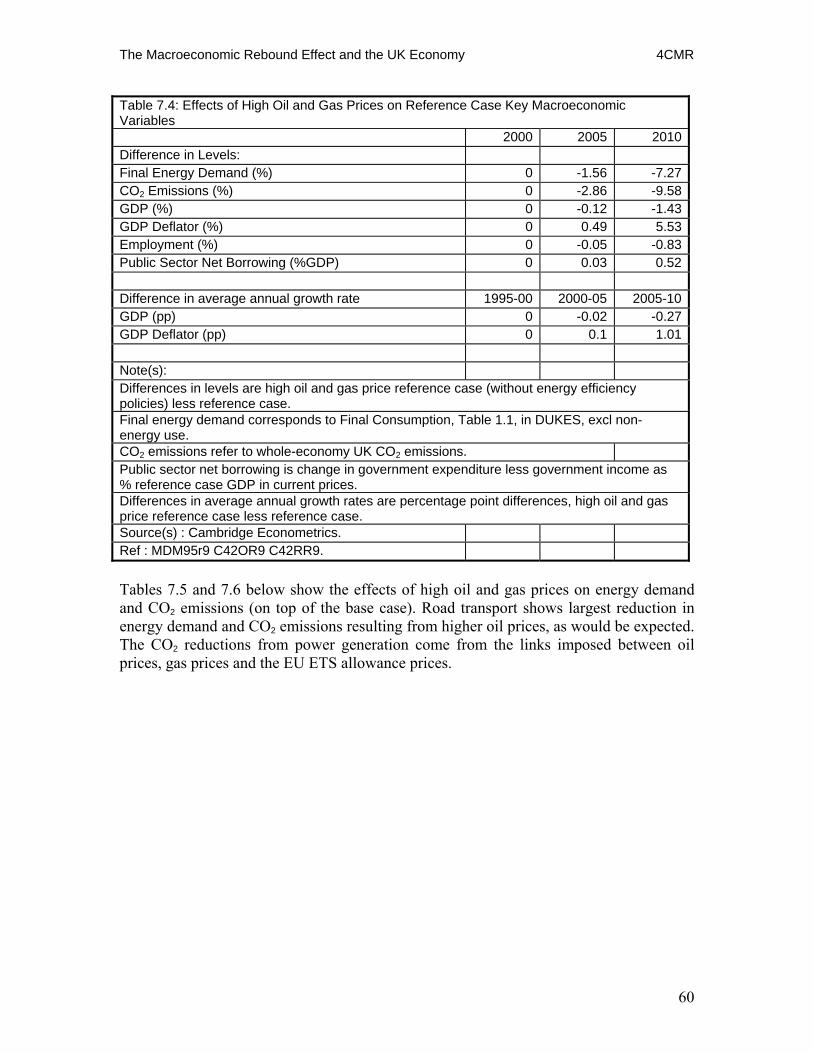
The Macroeconomic Rebound Effect and the UK Economy 4CMR
60
Table 7.4: Effects of High Oil and Gas Prices on Reference Case Key Macroeconomic Variables 2000 2005 2010Difference in Levels: Final Energy Demand (%) 0 -1.56 -7.27CO2 Emissions (%) 0 -2.86 -9.58GDP (%) 0 -0.12 -1.43GDP Deflator (%) 0 0.49 5.53Employment (%) 0 -0.05 -0.83Public Sector Net Borrowing (%GDP) 0 0.03 0.52 Difference in average annual growth rate 1995-00 2000-05 2005-10GDP (pp) 0 -0.02 -0.27GDP Deflator (pp) 0 0.1 1.01 Note(s): Differences in levels are high oil and gas price reference case (without energy efficiency policies) less reference case. Final energy demand corresponds to Final Consumption, Table 1.1, in DUKES, excl non-energy use. CO2 emissions refer to whole-economy UK CO2 emissions. Public sector net borrowing is change in government expenditure less government income as % reference case GDP in current prices. Differences in average annual growth rates are percentage point differences, high oil and gas price reference case less reference case. Source(s) : Cambridge Econometrics. Ref : MDM95r9 C42OR9 C42RR9. Tables 7.5 and 7.6 below show the effects of high oil and gas prices on energy demand and CO2 emissions (on top of the base case). Road transport shows largest reduction in energy demand and CO2 emissions resulting from higher oil prices, as would be expected. The CO2 reductions from power generation come from the links imposed between oil prices, gas prices and the EU ETS allowance prices.

The Macroeconomic Rebound Effect and the UK Economy 4CMR
61
Table 7.5: Effect of High Oil and Gas Prices Excluding Energy Policies on Final Energy Demand by Sector, mtoe 2002 2004 2006 2008 2010Energy-intensive industries 0 -0.41 -0.27 -0.84 -1.33Other industry 0 -0.62 -0.66 -1.37 -2.32Road transport 0 -0.56 -0.89 -1.66 -2.88Air transport 0 -0.19 -0.21 -0.4 -0.74Commerce etc. 0 -0.2 -0.23 -0.62 -1.16Households 0 -0.89 -0.68 -2.02 -3.87Total 0 -2.89 -2.96 -6.98 -12.41 Note(s): Figures are high oil and gas price reference case less reference case. Final energy demand corresponds to Final Consumption, Table 1.1, in DUKES, excl non-energy use. See Table 2.2 in Appendix A for definition of MDM fuel users. Source(s) : Cambridge Econometrics. Ref : MDM95r9 C42OR9 C42RR9. Table 7.6: Effect of High Oil and Gas Prices Excluding Energy Policies on CO2 Emissions by Sector, mtC 2002 2004 2006 2008 2010Power generation 0 -3 -2.43 -7.89 -7.83Energy-intensive industries 0 -0.29 -0.08 -0.51 -0.76Other industry 0 -0.2 -0.1 -0.24 -0.46Road transport 0 -0.41 -0.65 -1.21 -2.1Air transport 0 -0.02 -0.02 -0.05 -0.09Commerce etc. 0 -0.11 -0.07 -0.27 -0.51Households 0 -0.32 -0.18 -0.71 -1.38Total 0 -4.53 -3.71 -11.32 -13.95 Note(s): Figures are high oil and gas price reference case less reference case. Total CO2 emissions includes emissions from energy intensive industries' own use of energy, rail transport and water transport. Source(s) : Cambridge Econometrics. Ref : MDM95r9 C42OR9 C42RR9.

The Macroeconomic Rebound Effect and the UK Economy 4CMR
62
7.3. Comparison of effects of energy efficiency policies and of higher EU ETS allowance prices (EAP) The macroeconomic effects of energy efficiency policies can also be compared to those of higher EAPs. An increase in the EAP in phase 2 of the ETS from €32/t CO2 in the base case to €79/t CO2 is required if the same reduction in CO2 is to be achieved as with energy efficiency policies. The higher allowance price leads to a reduction of 4.8% in energy use, but again, as with the oil price increase, price levels are higher, with the GDP deflator being about 3.4% above baseline by 2010 (corresponding to a 0.7% increase in the annual growth rate of prices for 2005-10), and GDP is lower by about 0.9% below baseline by 2010 (or a 0.2% decrease in the annual growth rate for 2005-10). Table 7.7: Effects of High EU ETS Allowance Prices on Reference Case Key Macroeconomic Variables 2000 2005 2010Difference in Levels: Final Energy Demand (%) 0 -0.48 -4.81CO2 Emissions (%) 0 -0.81 -9.55GDP (%) 0 -0.01 -0.82GDP Deflator (%) 0 0.09 3.24Employment (%) 0 0 -0.46Public Sector Net Borrowing (%GDP) 0 0.22 0.45 Difference in average annual growth rate 1995-00 2000-05 2005-10GDP (pp) 0 0 -0.17GDP Deflator (pp) 0 0.02 0.64 Note(s): Differences in levels are high EU ETS allowance price reference case (without energy efficiency policies) less reference case. Final energy demand corresponds to Final Consumption, Table 1.1, in DUKES, excl non-energy use. CO2 emissions refer to whole-economy UK CO2 emissions. Public sector net borrowing is change in government expenditure less government income as % reference case GDP in current prices. Differences in average annual growth rates are percentage point differences, high EU ETS allowance price reference case less reference case. Source(s) : Cambridge Econometrics. Ref : MDM95r9 C42AR9 C42RR9. Tables 7.8 and 7.9 show the effects of high EU ETS allowance price on energy demand and CO2 emissions (on top of the reference case). The EAP of course targets carbon use in the electricity and energy-intensive sectors of the economy, so CO2 emissions are reduced much more than fuel use. The reductions in energy demand are concentrated in power generation, industry and households, with no effect on that in transportation.
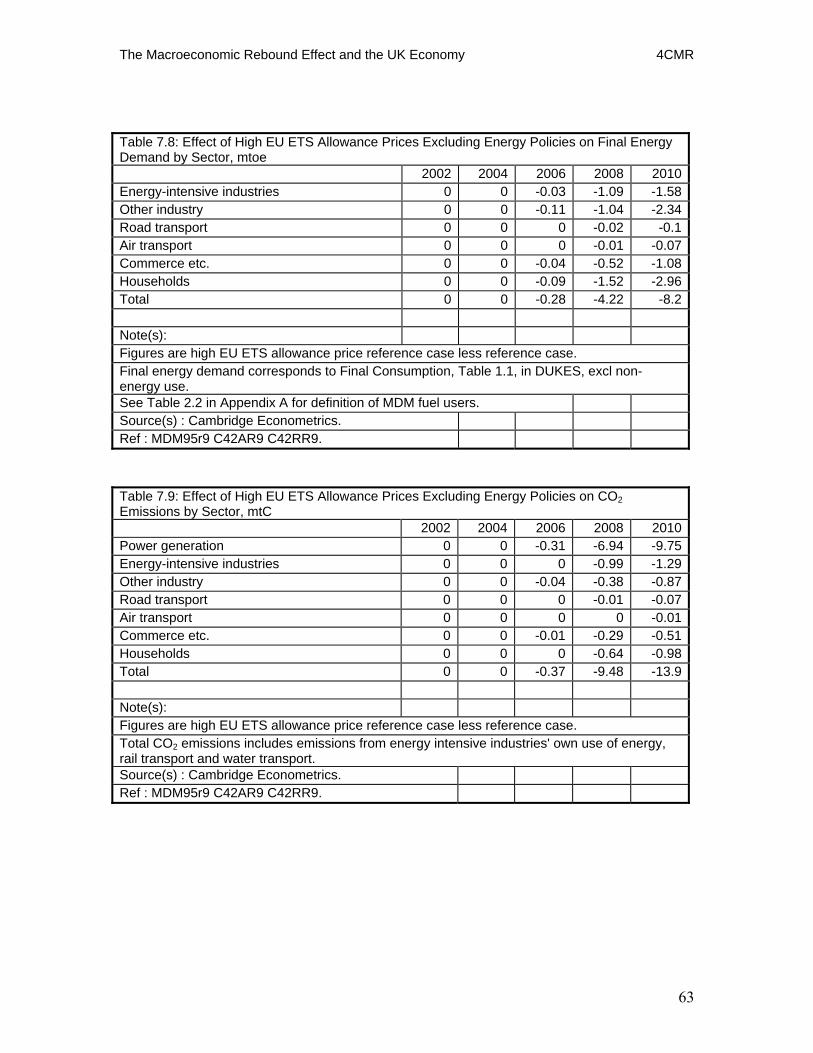
The Macroeconomic Rebound Effect and the UK Economy 4CMR
63
Table 7.8: Effect of High EU ETS Allowance Prices Excluding Energy Policies on Final Energy Demand by Sector, mtoe 2002 2004 2006 2008 2010Energy-intensive industries 0 0 -0.03 -1.09 -1.58Other industry 0 0 -0.11 -1.04 -2.34Road transport 0 0 0 -0.02 -0.1Air transport 0 0 0 -0.01 -0.07Commerce etc. 0 0 -0.04 -0.52 -1.08Households 0 0 -0.09 -1.52 -2.96Total 0 0 -0.28 -4.22 -8.2 Note(s): Figures are high EU ETS allowance price reference case less reference case. Final energy demand corresponds to Final Consumption, Table 1.1, in DUKES, excl non-energy use. See Table 2.2 in Appendix A for definition of MDM fuel users. Source(s) : Cambridge Econometrics. Ref : MDM95r9 C42AR9 C42RR9. Table 7.9: Effect of High EU ETS Allowance Prices Excluding Energy Policies on CO2 Emissions by Sector, mtC 2002 2004 2006 2008 2010Power generation 0 0 -0.31 -6.94 -9.75Energy-intensive industries 0 0 0 -0.99 -1.29Other industry 0 0 -0.04 -0.38 -0.87Road transport 0 0 0 -0.01 -0.07Air transport 0 0 0 0 -0.01Commerce etc. 0 0 -0.01 -0.29 -0.51Households 0 0 0 -0.64 -0.98Total 0 0 -0.37 -9.48 -13.9 Note(s): Figures are high EU ETS allowance price reference case less reference case. Total CO2 emissions includes emissions from energy intensive industries' own use of energy, rail transport and water transport. Source(s) : Cambridge Econometrics. Ref : MDM95r9 C42AR9 C42RR9.

The Macroeconomic Rebound Effect and the UK Economy 4CMR
64
7.4. Sensitivity analysis on energy efficiency policies and the rebound effect Sensitivity analysis of the effects of energy efficiency policies Table 7.12 reports on the sensitivity of the effects of the policies under different assumptions about the levels of oil and gas prices and EU ETS prices in the reference case and the base case. On other words, we are imagining two counterfactuals over 2000-2010 in which the state of the world was different from that assumed in the reference case described above. In the first, oil prices are much higher, at the levels described above for the high oil scenario; in the second counterfactual, the EU ETS allowance price is much higher in phase 2, also at the levels described above. The table reports differences from reference cases for 2010 for the main macroeconomic variables. For all the variables shown, the alternative scenarios, with higher prices, show more exaggerated effects. The differences are small for the real variables, and larger for the price variable (the GDP deflator). With higher energy prices the energy efficiency policies become even stronger in increasing growth and reducing inflation. Table 7.12: Sensitivity Analysis on the Effects of Energy Efficiency Policies, 2010 Base With higher
oil and gas prices
With higher EU ETS allowance prices
Difference in Levels: Final Energy Demand (%) -8.1 -8.43 -8.13CO2 Emissions (%) -9.61 -10.04 -8.79GDP (%) 1.26 1.43 1.39GDP Deflator (%) -2.4 -3.05 -2.86Employment (%) 0.84 0.96 0.91Public Sector Net Borrowing (%GDP) -0.6 -0.69 -0.63 Note(s): Differences in levels are differences between each scenarios' base and reference cases. Final energy demand corresponds to Final Consumption, Table 1.1, in DUKES, excl non-energy use. CO2 emissions refer to whole-economy UK CO2 emissions. Public sector net borrowing is base case change in government expenditure less government income as % reference case GDP in current prices. Source(s) : Cambridge Econometrics. Ref : MDM95r9 BRRR9 OBORR9 ABAR9.

The Macroeconomic Rebound Effect and the UK Economy 4CMR
65
Sensitivity analysis of the rebound effect Table 7.13 shows the total rebound effect (direct plus macroeconomic) for five scenarios: the base case, the enhanced energy efficiency policy case, the case with all energy efficiency policies for the period 2000-2010 being brought in at 2000, the sensitivity test for higher oil and gas prices and the sensitivity test for higher EU ETS Allowance prices. This shows that there is some sensitivity of the macroeconomic rebound effects to changes in strengths of policies. The enhanced policies have a lower rebound, mainly through extra efforts as a result of more stringent CCAs leading to a greater transformation of the energy-intensive industries and even more energy saving. The effect of changing the timing of policies, so that they are all introduced in 2000, is also to reduce the overall rebound effect. The reason for this result is that the earlier introduction of the transport policies leads to a lower general level of inflation, so that the relative effects of the CCAs in making their industries more price competitive is reduced, so that there is less extra output of energy-intensive products and so lower rebound. On the other hand, the rebound effects with higher oil, gas and EU ETS allowance prices are higher because the general price index is higher, making the CCA sectors more price competitive, raising their output and hence energy use. All these results are conditional on the assumptions that the various estimated price and income elasticities and other parameters in the model are fixed, as well as on the general econometric approach. Table 7.13: Total Rebound Effect(%) by scenario 2005 2010 Base Case 26 26 Base Case with Scaled EP 25 22 Base Case with Higher Oil and Gas Prices 26 28 Base Case with Higher EU ETS Allowance Prices 26 29 Base Case with EP policy effects by 2010 brought in at 2000
24 21
Note(s): Source(s) : Cambridge Econometrics. Ref : MDM95r9 C42BR9 C42RR9 C42SB9 ABAR9 OBOR9.

The Macroeconomic Rebound Effect and the UK Economy 4CMR
66
8. Conclusions The findings of this report support the argument that energy efficiency improvements for both consumers and producers stimulated by policy incentives do not give rise to very large macroeconomic rebound effects, i.e. only a relatively small proportion of the expected energy savings are lost due to indirect and economy-wide effects. This result arises partly because the focus of the study has been on actual policies in place for final energy users. Indeed, the results suggest that there may be positive macroeconomic effects in economic terms, with small increases in GDP and employment, and small reductions in prices, alongside significant reductions in final energy demand and CO2 emissions, resulting from energy efficiency policies and programmes (see Table 6.1). We find that the macroeconomic rebound effect arising from announced UK energy efficiency policies and programmes for final energy users over the period 2000-2010 is around 11% by 2010, averaged across sectors of the economy. When this is added to the (assumed) direct rebound effect of around 15%, this gives a total rebound effect of around 26% arising from these policies and programmes. The decomposition of these effects is interesting. The largest direct rebound effects are for the road transport and household sectors, whereas the largest indirect rebound effects are for the energy-intensive and other industry sectors, with small direct and indirect rebound effects for the commerce sector. The direct rebound effects from the Voluntary Agreement Package for road transport arise from three contributions: an increase in mileage due to a fall in the price of driving per km; extra comfort taken when driving, e.g. increasing the use of air-conditioning, seat heaters etc; and choice of a bigger car when making a purchase decision. The direct rebound effects for the household sector arise mainly from comfort taking, which are estimated at around 30% for the Energy Efficiency Commitment (EEC) and 75% for the Warm Front programme, as this is mainly targeted at reducing fuel poverty in badly insulated homes. (These estimates also include an unspecified allowance for ‘general underperformance’ of responses). As described in Chapter 6, the macroeconomic rebound effects arise from three sources: the reduction in energy costs for consumers and producers (particularly for energy-intensive industries); the increase in the actual and imputed real incomes of consumers; and the extra demand for investment goods required to bring about the energy efficiency improvement. The lower energy costs for consumers lead them to substitute away from gas and electricity to a wide range of other goods and services, typically with relatively small energy and carbon content, hence the rebound effect is low. In industry, the targeted reductions in energy and carbon intensities in the CCA sectors lead to a reduction in their industrial costs and therefore prices, and consequently more output and exports. These extra outputs are more energy-intensive than average, so there is a higher rebound effect. With the introduction of tighter building regulations and other policies to improve efficiency by the domestic sector, if market energy prices are largely unchanged, gross

The Macroeconomic Rebound Effect and the UK Economy 4CMR
67
energy use falls provided the volume of energy services remains the same. However, the higher imputed real incomes of consumers lead to an increase in their spending, as if they had an increase in actual income. This extra spending leads to slightly higher energy use and emissions, but even higher GDP and consumers’ expenditure in total. In other words, the use of energy and carbon is inelastic to changes in consumer income. The extra investment directly associated with the energy efficiency policies is added to industrial investment for the CCA sectors, to investment in office buildings and dwellings and to the investment in road vehicles by consumers, but there is very little effect on energy or CO2 emissions. These results show that most of the macroeconomic rebound effect derives from lower direct costs for energy use by consumers and industry, arising from the implicit price reductions of energy services, leading to increases in output and therefore a relative increase in energy demand. The effects on energy demand of higher imputed incomes and extra investment are small by comparison. The relatively small size of the total macroeconomic rebound effect found in our modelling supports the theoretical and empirical arguments that there is a qualitative difference between energy efficiency improvements stimulated by direct incentives and those that occur through the market as a result of technological progress and the normal economic imperatives to reduce costs of production and consumption (see Chapter 3). Policy-induced energy efficiency improvements focus on areas dominated by market failures/barriers, and so the implicit price falls arising from efficiency improvements have relatively little effect on energy-consuming activities. A high level of cost-effective energy efficiency improvements can be found and implemented when attention is focused on their potential by policy incentives. Our modelling also suggests that a significant increase in the strength of energy efficiency policies would lead to further energy and CO2 savings, with the size of the total rebound effect being slightly reduced. The ‘Khazzoom-Brookes postulate’, which states that energy savings from all energy efficiency measures are likely to be offset by associated increases in demand, is based on an extrapolation of simplified theoretical models of the whole economy. Our more detailed macroeconomic model is able to take into account the size and focus of actual energy efficiency policies, relative to the whole national economy. Although we find appreciable macroeconomic rebound effects of the order of 20 to 30% for energy-intensive sectors, those for the other sectors are much smaller, 5 to 10%, because they are much less energy-intensive. Our findings support the view that the Khazzoom-Brookes argument is largely irrelevant to assessing the magnitude of the macroeconomic rebound effect arising from UK energy efficiency policies. Hence, this study supports the argument that improvements in energy efficiency by producers and consumers stimulated by government policy measures will lead to significant reductions in energy demand and hence in greenhouse gas emissions.

The Macroeconomic Rebound Effect and the UK Economy 4CMR
68
References BARKER, T., EKINS, P. & JOHNSONE, N. (1995) Global Warming and Energy Demand, London,
Routledge. BARKER, T., EKINS, P. & STRACHAN, N. (2005a) Energy-Economy-Engineering-Environment: An E4
Representation of the UK Energy System. UKERC Working paper, available at http://www.ukerc.ac.uk/content/view/142/112/ BARKER, T., PAN, H., KOEHLER, J., R.WARREN & WINNE, S. (2005b) Avoiding dangerous climate
change by inducing technological progress: scenarios using a large-scale econometric model. In SCHELLNHUBER, H. J. E. A. (Ed.) Avoiding dangerous Climate Change. cambridge, Cambridge University Press.
BARKER, T. & PETERSON, W. (1987) The Cambridge Multi-Sectoral Model of the British Economy, Cambridge, Cambridge University Press.
BROOKES, L. (1990) The Greenhouse Effect: Fallacies in the energy efficiency solution. Energy Policy, 18, 199-201.
CAMBRIDGE ECONOMETRICS, UNIVERSITY OF CAMBRIDGE & POLICY STUDIES INSTITUTE (2005) Modelling the Initial Effects of the Climate Change Levy, a report submitted to HM Customs and Excise, 8 March 2005. available at http://customs.hmrc.gov.uk/channelsPortalWebApp/downloadFile?contentID=HMCE_PROD1_023971.
CONRAD, K. (1999) Computable General Equilibrium Models for Environmental Economics and Policy Analysis. In VAN DEN BERGH, J. (Ed.) Handbook of Environmetal and Resource Economics. London, Edward Elgar.
DEFRA (2000) Climate Change: the UK Programme. Defra, London. DEFRA (2004) Energy Efficiency: the Government's Plan for Action. Defra, London. DFT (2005) Evaluation of the Voluntary Agreement Package for the Climate Change Programme Review.
DfT, London. DTI (2000) Energy Projections for the UK. The Stationary Office, London. http://www.dti.gov.uk/energy/inform/energy_projections/ep68_final.pdf DTI (2003) Our Energy Future - Creating a Low Carbon Economy. The Stationary Office, London. http://www.dti.gov.uk/energy/whitepaper/ourenergyfuture.pdf DTI (2006a) Our Energy Challenge - Securing Clean Affordable Energy for the Long Term. DTI, London.
http://www.dti.gov.uk/energy/review/energy_review_consultation.pdf DTI (2006b) UK Energy and CO2 Emissions Projections: Updated preojections to 2020. DTI, London.
http://www.dti.gov.uk/energy/sepn/uep_feb2006.pdf DUFOURNAUD, C. M., QUINN, J. T. & HARRINGTON, J. J. (1993) An applied general equilibrium
analysis of a policy designed to reduce household consumption of wood in Sudan. Resource and Energy Economics, 16, 67-90.
ECN (1995) The energy-economy-environment interaction and the rebound-effect., ECN. http://www.ecn.nl/library/reports/1995/i94053.html EKINS, P. & ETHERIDGE, B. (2005) The environmental and Economic Impacts of the UK Climate
Chnage Agreements. Energy Policy, forthcoming. ETSAP (1997) New directions in Energy Modeling. Summary of Annex V (1993-1995). Energy
Technology Systems Analysis Programme ETSAP-97-1. Netherlands: ECN. http://www.etsap.org/annex5/main.html FAUCHEUX, S. & LEVARLET, F. (1999) Energy-economy-environment models In VAN DEN BERGH,
J. (Ed.) Handbook of Environmental and Resource Economics. London, Edgar Elgar. FUTURE ENERGY SOLUTIONS AND POLICY STUDIES INSTITUTE (2005) Evaluation of the
Governments Energy Efficiency Policies and Programmes. Report for Defra as part of the Climate Change Programme Review.
GLOMSROD, S. & WEI, T. Y. (2005) Coal cleaning: a viable strategy for reduced carbon emissions and improved environment in China? Energy Policy, 33, 525-542.
GREENING, L., GREENE, D. L. & DIFIGLIO, C. (2000) Energy Efficiency and Consumption - The Rebound Effect - A Survey. Energy Policy, 28, 389-401.
The Macroeconomic Rebound Effect and the UK Economy 4CMR
69
GREPPERUD, S. & RASMUSSEN, I. (2004) A general equilibrium assessment of rebound effects. Energy Economics, 26, 261-282.
GRUBB, M. (1990) Energy efficiency and economic fallacies. Energy Policy, 18, 783-785. HANLEY, N. & MCGREGOR, P. G. (2005) Do increases in resource productivity improve environmental
quality? Theory and evidence on "rebound" and "backfire" effects from an energy-economy-environment regional computable general equilibrium model of Scotland Department of Economics, University of Stirling.
HERRING, H. (1998) Does energy efficiency save energy? The economists debate. The Open University. http://technology.open.ac.uk/eeru/staff/horace/hh3.htm HERRING, H. (2004) The Rebound Effect and Energy Conservation. In CLEVELAND, C. (Ed.) The
Encyclopedia of Energy. Academic Press/Elsevier Science. JEVONS, W. S. (1865/1905) The Coal Question: An Inquiry Concerning the Progress of the Nation, and
the Probable Exhaustion of our Coal-mines. In FLUX, A. W. & KELLEY, A. M. (Eds.) 3rd Edition 1905 ed. New York.
KOEHLER, J., BARKER, T., PAN, H., AGNOLUCCI, P., EKINS, P., FOXON, T. J., ANDERSON, D., WINNE, S., DEWICK, P. & GREEN, K. (2005) New Lessons for Technology Policy and Climate Change - Investment for Innovation: A briefing document for policy makers. Tyndall Briefing Note 13, Tyndall Centre for Climate Change Research.
http://www.tyndall.ac.uk/publications/briefing_notes/note13.pdf KYDES, A. S. (1997) Sensitivity of energy intensity in U.S. energy markets to technological change and
adoption. Issues in midterm analysis and forecasting 1997. U.S. Department of Energy, Washington DC.
MCFARLAND, J. R., REILLY, J. M. & HERZOG, H. J. (2004) Representing energy technologies in top-down models using bottom-up information. Energy Economics, 26, 685-707.
METZ, B., OGUNLADE, D., SWART, R. & PAN, J. (Eds.) (2001) Climate Change 2001: Mitigation, Cambridge, Cambridge University Press.
http://www.grida.no/climate/ipcc_tar/wg3/374.htm NYSTROM, I. & WENE, C. O. (1999) Energy-economy linking in MARKAL-MACRO: Interplay of
nuclear, conservation and CO2 policies in Sweden. International Journal of Environment and Pollution, 12, 323-342.
REPETTO, R. & AUSTIN, D. (1997) The cost of climate protection: A guide for the perplexed, Washington DC, World Resources Institute.
ROY, J. (2000) The rebound effect: some empirical evidence from India. Energy Policy, 28, 433-438. SAUNDERS, H. (1992) The Khazzoom-Brookes postulate and neoclassical growth. Energy Journal, 13,
131-149. SAUNDERS, H. (2000) A View from the Macro Side: Rebound, Backfire and Khazzoom-Brookes. Energy
Policy, 28, 439-449. SAUNDERS, H. (2003) Fuel Conserving Production Functions. Draft manuscript 2003. SAUNDERS, H. (2005) A calculator for energy consumption changes arising from new technologies.
Topics in Economic Analysis & Policy, 5. http://www.bepress.com/bejeap/topics/vol5/iss1/art15 SCHIPPER, L. & GRUBB, M. (2000) On the rebound? Feedback between energy intensities and energy
uses in IEA countries. Energy Policy, 28, 367-388. SORRELL, S. & DIMITROPOULOS, J. (2005) An assessment of evidence for a 'rebound effect' from
improvements in energy efficiency: Scoping Note. SPRU University of Sussex. http://www.ukerc.ac.uk/content/view/130/187 THE CARBON TRUST (2005) the evidence and theory of corporate energy efficiency: implications for
UK Climate Change Programme. London, Carbon Trust. VAN IERLAND, E. C. (1999) Environment in Macroeconomic modelling. In VAN DEN BERGH, J. (Ed.)
Environment in macroeconomic modelling. Edward Elgar Publishing. VIKSTRÖM, P. (2004) Energy efficiency and energy demand: A historical CGE Investigation on the
rebound effect in the Swedish economy 1957, Umea, Umea University. WASHIDA, T. (2004) Economy-wide Model of Rebound Effect for Environmetal Efficiency. International
workshop on sustainable Consumption University of Leeds.

The Macroeconomic Rebound Effect and the UK Economy 4CMR
70
Annex 1. Description of energy efficiency policies and related modelling assumptions This Annex provides a description of the data and related assumptions for each of the energy efficiency policies that were used as inputs to the macroeconomic modelling. These were taken from an evaluation of the Government’s energy efficiency policies and programmes undertaken by Future Energy Solutions and the Policy Studies Institute (FES/PSI, 2005), and a separate evaluation of the Voluntary Agreement Package for the transport sector undertaken by the Department for Transport (DfT, 2005), both undertaken for the Government’s Climate Change Programme Review. For each policy, the annual energy savings, CO2 savings, costs and benefits were taken from these evaluations. For each year for the period 2000-2020, the actual cumulative annual savings realised by the policy in Year X, i.e. the annual savings in Year X arising from all measures stimulated by the policy from its start to Year X, were taken. The additional savings in each year is then given by the difference between the cumulative savings in that year and those in the previous year. These savings are all calculated against the baseline used in the 2000 UK Climate Change Programme (Defra, 2000). The savings with and without comfort taking (i.e. direct rebound effect) were taken, if available. Methodology followed by FES/PSI evaluation The data and information collected were collated and analysed according to the Inter-departmental Analysts Group (IAG) guidelines. The policies were evaluated on as consistent a basis as possible. Further assumptions made were as follows.
Carbon and energy savings Data has originated either in energy or carbon savings terms. Both were required for the analysis, which meant that appropriate fuel mixes as well as carbon emission factors were required. Where the available data has not included fuel mixes, average fuel mix data for the most appropriate groups as reported in DUKES3 have been employed. Carbon emission factors used are those reported in the Defra Guidelines for Company Reporting on Greenhouse Gas Emissions4. Lifetime savings Lifetime savings relate to the lifetime of the measures implemented or actions taken as a result of the policy intervention. This will vary considerably between the different types of actions/measures. For example people based measures have the shortest lifetimes (2-5 years), followed by management systems (5-10 years), electro-mechanical components (10-15 years), automatic control systems (15-20 years), plant/services (20-25 years) and building fabric (30-40 years), with building structures (40-50 years) having the longest operational lifetimes.
3 Digest of United Kingdom Energy Statistics. DTI. http://www.dti.gov.uk/energy/inform/dukes/index.shtml 4 Guidelines for Company Reporting on Greenhouse Gas Emissions. http://www.defra.gov.uk/environment/envrp/gas/index.htm

The Macroeconomic Rebound Effect and the UK Economy 4CMR
71
Costs and Benefits Costs and benefits in monetary terms have included the following, where possible:
To the exchequer:
Incentive payments, grants and subsidies; Set up and ongoing administrative and management costs; Investment costs to the public sector, Energy cost savings within the public sector.
To firms:
Investment costs; Other compliance costs; Administrative and management costs; The benefits of incentive payments, grants and subsidies from government; Energy costs savings.
To consumers:
Investment costs; Increased prices of goods and services; Energy cost savings.
Policy costs As a general rule, the policy costs to government of the policies analysed have been very well defined and there is little uncertainty in this area.
Investment and management costs The estimates that have been made for the investments made by energy users in reducing energy consumption are much more subject to uncertainty as there is little if any actual data available on what companies and other energy users have spent. This is particularly true of the business and public sectors; investments within the domestic sector are much better defined as generally they are based on the costs and implementation numbers of specific measures. Estimates of investment expenditure have been imputed from energy cost savings and assumed typical payback periods in the relevant sectors. The management costs associated with responding to the policies have simply been estimated from experience.
Energy cost savings The monetary benefits of reduced energy bills as a consequence of reductions in energy use have been estimated by applying typical current energy prices (from DTI) to the derived energy savings, split by fuel. The analysis has generally assumed constant real energy prices rather than employ any particular set of forward projections. The energy price data used has principally been at the overall domestic and business levels, with some further disaggregation for large industrial users where this has been considered sensible.
The Macroeconomic Rebound Effect and the UK Economy 4CMR
72
A1.1. Building Regulations (Domestic and Non-Domestic) Building regulations covering the conservation of fuel and power in domestic and non-domestic buildings fall under separate legislation in England and Wales (combined), Scotland and Northern Ireland. Regulations covering this were amended in 2002 for England and Wales, and in 2002 (via the 6th amendment to the 1990 regulations) for Scotland, bringing both to a similar standard for new buildings. In England and Wales existing regulations were tightened in April 2005 to increase the minimum requirements for boilers and will be tightened more generally from April 2006, also to incorporate provisions required under the EU Energy Performance in Buildings Directive (EPBD). Separate legislation will be implemented in Scotland and Northern Ireland to comply with the directive’s deadline of 4 January 2006. Regulations in Northern Ireland were last updated in 2000 (however, the energy performance standards were last updated in 1998). In the analysis of FES and PSI (2005):
- no comfort taking was assumed; - lifetime of the measures taken by economic actors varies depending on measure; - discount rate is 3.5%; - in general, all other policies should use the most recent building regulations as
their business as usual baseline, and only estimate savings above these standards; - in terms of additionality of the measures implemented, reductions due to
improvement in boilers that would have taken place anyway are taken into account in the baseline;
- fuel mix: almost 100% gas in domestic sector from FES and PSI; fuel mix in non-domestic sector was unstated and was assumed to be the same as that in the domestic sector.
A1.2. Energy Efficiency Commitment The Energy Efficiency Commitment (EEC) replaced the Energy Efficiency Standards of Performance (EESoP), which ran from 1994 until 2002 and operates throughout Great Britain. Under the EEC, electricity and gas suppliers are required to achieve targets for the promotion of improvements in household energy efficiency. They do this by assisting domestic consumers to take up energy efficiency measures. Its objective is the reduction of carbon emissions and the first phase of EEC ran from 2002-2005. A second and proposed third phase will run from 2005-2008 and 2008-2011 respectively, although the EEC will undergo a thorough review before the third tranche commences in 2008. EEC provides a fuel-standardised lifetime-discounted energy saving target for each supplier that must be achieved within the phase - for EEC 2002-2005 the total across all suppliers was 62 fuel standardised lifetime-discounted TWh. Within this target suppliers must ensure that at least 50% of the improvements must be obtained within ‘Priority Group’ households (lower income households, including those in receipt of income and disability benefits and income related tax credits). The overall target for the second phase of the EEC is 130 fuel-standardised lifetime-discounted TWh (but is set on a different basis, i.e. is not directly comparable with the first phase). A supplier’s contribution to the cost of measures varies between different groups. The level of the subsidy or inducement cost will depend on the householder’s willingness and ability to pay.

The Macroeconomic Rebound Effect and the UK Economy 4CMR
73
In the analysis of FES and PSI (2005): The value of comfort taking and general underperformance assumed from insulation measures was originally 45% for the priority group and 15% for the non-priority group in EEC 2002-2005; it was revised to 30% for both groups. The treatment of comfort-taking is an important factor in the evaluation of the benefits. Not all the benefits of installing efficiency measures may be realised as carbon reductions, as consumers may prefer to take some of the benefits as extra comfort. Throughout the report, the benefit of this increased comfort has been monetised on the basis of the level of comfort-taking multiplied by the value of energy. Thus, there is no overall difference to the financial value of the 'energy benefits' from efficiency measures if they are taken as actual energy savings, comfort-taking or a combination of the two. The level of comfort taking does, however, affect the overall level of carbon reduction. Suppliers can interact with Warm Front, and other similar fuel poverty schemes in the devolved administrations, to meet their EEC obligation. In the case of Warm Front, the Scheme Managers use these funds to install further measures in Warm Front eligible households. EEC also overlaps with Decent Homes where there are measures that are co-funded by Local Authorities/RSLs with money from the Decent Homes programme. The carbon savings from these measures are currently attributed to EEC rather than split between the policies. EEC can also provide co-funding for projects that receive a Community Energy Programme grant and receive a proportion of the subsequent carbon savings. This overlap is taken account of in the relevant evaluation for each policy, to avoid double counting of savings; Other assumptions:
- lifetime of the measures taken by economic actors varies depending on measure (12-40 years);
- discount rate is 3.5%; - fuel mix: assume EEC mix.
A1.3. Energy Efficiency Levy (Northern Ireland) EEC does not extend to Northern Ireland (NI) - instead a separate Energy Efficiency Levy (EEL) programme has been operating since 1997. It is not ‘directly’ comparable to EEC (although it shares similar features), but the EEL does operate in broadly the same manner as the EESoP, which preceded EEC in GB. The EEL was introduced in NI as part of a review of the price controls on Northern Ireland Electricity plc (NIE) by the NI regulator, Ofreg, in 1997. A set levy on energy is charged per annum per household and is set by Ofreg. The levy started at around £1 per household, rose to £2 in 2000, £5 in 2002 and is due to rise to approximately £7 in 2005. NIE is required to use this money to install efficiency measures (similar to those within EEC) with 50% of their activity targeted at fuel-poor dwellings.
In the analysis of FES and PSI (2005): - lifetime of the measures taken by economic actors: 16 year average lifetime
assumed;
The Macroeconomic Rebound Effect and the UK Economy 4CMR
74
- discount rate: Northern Ireland Energy internal rate; - overlap with other policies: Energy Saving Trust; - energy price: not stated; - fuel mix: not stated.
A1.4. Warm Front In each of the four countries that constitute the UK there are broadly comparable fuel poverty schemes to provide grants for various insulation and heating measures to households, which receive certain defined benefits. The exact details of eligibility and availability of measures/grants varies by scheme. It should be noted that the primary aim of these schemes is to help provide energy efficiency measures to the most vulnerable households and by doing so alleviate fuel poverty. A secondary benefit of this is a carbon reduction from the associated improvements. In England the scheme is Warm Front and was introduced in 2000 (previously known as the New Home Energy Efficiency Scheme, which replaced the old HEES – pre 2000). It is only open to private sector households, whether owner-occupiers or in the private rented sector, and provides a range of energy efficient heating and insulation measures, as well as energy advice. Warm Front was until June 2005 administered in England by Eaga Partnership (EP) Ltd in three regions (London & South East, North East & North West and South West & West Midlands) and by Powergen Warm Front (PWF) Ltd in one region (Yorkshire, Humberside, East Anglia and the East Midlands). Since June 2005 EP have been administering all regions. In Wales, there are two similar private sector household schemes that commenced in 2001, called HEES (Home Energy Efficiency Scheme) and HEES Plus, which are both administered by EP but which have slightly different eligibility requirements and grant levels. HEES Plus measures can also include gas or electric central heating systems. There are two schemes in Scotland, Warm Deal (that began in 1999) and the Central Heating Programme (that began in 2001) – and are administered by EP, for owner-occupiers and private tenants. These programmes also exist for Local Authority owned housing but are administered by the LAs themselves. Warm Deal provides grants for cavity wall insulation, loft insulation, tank and pipe insulation, draught proofing and low energy lights. The Central Heating Programme provides central heating in the main living areas of the property, insulation for lofts, tanks and walls, carbon monoxide and smoke detectors, cold alarms, CFLs, energy advice and benefits health checks. In Northern Ireland, the schemes started in 2001 and are called Warm Homes and Warm Homes Plus and are also managed by EP, and are aimed solely at private sector households. Warm Homes Plus offers greater funding for an enhanced package of measures, which can include central heating. In the analysis of FES and PSI (2005):
- two levels of comfort taking and general underperformance were assumed: 75% and 50%. The former is considered a more plausible level for fuel poverty households;
- lifetime of the measures: 10-40 years;

The Macroeconomic Rebound Effect and the UK Economy 4CMR
75
- current level of adoption - not known; - the effect of the policy on the take-up of the technology - not known; - measures are assumed to be entirely additional.
A1.5. Community Energy The Community Energy Programme (CEP) was launched in January 2002 to help support the refurbishment and development of Community Heating (CH) throughout the UK, primarily in the form of Combined Heat and Power (CHP). The programme’s primary goal is carbon reduction but also has a secondary objective of reducing fuel poverty. The programme was originally allocated £50M over 2 years, with approximately £48M to be provided for capital grants (allocated via competitive tender over a number of rounds) and the remainder for supporting activities such as feasibility studies. Subsequent revisions have extended the timescale for allocation of grants up to March 2008. Targets set for the programme include:
• The installation of 130MW of ‘good quality’ CHP; • A reduction in carbon emissions of 150 ktC/yr ; • Lever in private sector ‘match funding’ of £200M; • Help 100,000 people on low-incomes to heat their homes
In the analysis of FES and PSI (2005):
- no mention is made of assumptions related to comfort taking; - lifetime of the measures taken by economic actors: not stated; - discount rate: 3.5%; - overlap with other policies: EEC and Decent Homes, but these have been taken
into account; - the calculations did not take account of ‘business as usual’ improvements; - energy price: not stated; - fuel mix: Defra assumption 0.117 kgC/kWh for electricity.
A1.6. Market Transformation Programme Market Transformation Programme: It analyses the environmental performance of domestic and non-domestic products and systems: at present it publishes analysis of 12 major sectors, covering 27 product types, which accounts for 96% of domestic and 19% of non-domestic UK energy consumption. This includes all major domestic energy-consuming appliances (lighting, heating, cold, wet, cooking and consumer electronics) and traded goods in the commercial sector (office equipment, motors and drives, lighting, commercial refrigeration and air conditioning). The main activity and value of the MTP is the development and maintenance of a public domain evidence base. Much of this activity will enable other policies to function more efficiently, either allowing more savings or at a lower cost.

The Macroeconomic Rebound Effect and the UK Economy 4CMR
76
In the analysis of FES and PSI (2005):
- lifetime of the measures taken by economic actors: not stated; - discount rate: 3.5%; - overlap with other policies: it is difficult and potentially contentious to ascribe
impacts upon shifts in sales, energy use or CO2 emissions to any one policy. Closely-related programmes, such as the EU directives, the EST, the Carbon Trust, EESOP/EEC, Building Regulations, MTP and predecessor programmes/policies, might justifiably claim credit for some or all of the savings associated with a particular product, as might other actors within the market such as the product manufacturers, retailers, OFGEM, and individual customers;
- additionality of the measures implemented because of the policy (baseline issue): difficult to establish;
- energy price: not stated; - fuel mix: 100% electricity.
A1.7. Climate Change Agreements (CCAs) Introduction The Climate Change Agreements (CCAs), which were agreed between Defra and forty-four energy intensive sectors in March 2001, set quantitative targets for 2010 with milestone targets at two-yearly intervals. Sectors (and constituent firms) were allowed to choose between targets related to carbon emissions or to primary energy consumption and between absolute and relative targets. The large majority chose relative targets for energy consumption – i.e. specific energy consumption (SEC). On achievement of the target, CCA participants are entitled to receive an 80% reduction in the Climate Change Levy (CCL). Participants in the CCAs can also purchase allowances through the UK-ETS in order to meet their targets. Eligibility to enter into a CCA was originally related to sectors covered by the Pollution Prevention and Control Regulations 2000 (PPC) but it was extended in the 2004 Budget to include other sectors that satisfied defined criteria related to energy intensity and international competitiveness. Methodology and Assumptions 2002 Carbon Savings In relation to Carbon Savings in 2002, FES and PSI (2005) distinguishes between:
- Absolute savings: difference between the emission in a particular year and the baseline year – normally 2000;
- Volume savings, i.e. savings caused by changes in the production volumes of the firms;
- Relative savings: absolute savings minus volume savings. Relative savings do not take into account any reductions in SEC that would have occurred due to BAU improvements, or to the impact of the CCL and/or other measures under the CCP.
In FES and PSI (2005), figures on the improvement in the SEC which would have occurred in a business as usual scenario were taken from the BAU GAD SEC Projections. After considering the sectors for which a BAU GAD SEC was not available, FES and PSI

The Macroeconomic Rebound Effect and the UK Economy 4CMR
77
(2005) concluded that the total incremental reduction was 2.3 MtC on the BAU scenario. This represents the combined impact of the CCL package in 2002. Price Effect Using results from Ekins and Etheridge (2005), FES and PSI (2005) concluded that, in 2002, the reduced CCL on its own has improved the energy intensity by 2%, while the imposition of the full rate would have resulted in a 6.5% improvement. After computing the impact of the full and discounted CCL on each CCA sector, FSE and PSI (2005)concluded that the gross impact of the CCAs in 2002 was a 1.9 MtC reduction in emissions, while the net impact was 1.0 MtC. Carbon Savings in 2010 and Beyond In order to foresee the effect of CCAs up to 2010 and beyond, FES and PSI (2005) assumed that the impact of the CCL versus the BAU trajectory remains constant over time. In addition, FES and PSI (2005) assumed that firms will be exceeding their target in 2010, therefore bringing about a SEC value of 82 (from the value of 84 implied by the target in the agreements). Savings beyond 2010 are caused by the “carry-over” effect of investment and operating decisions made during the life of the agreements. As shown in Figure A1.1, the effect of these decisions diminishes over time, falling to zero after an average of fifteen years Additionality of Implemented Measures The impact of CCAs is influenced by the choice of the counterfactual. In FES and PSI (2005)
- the gross impact describes the savings computed when the discount of the CCL is treated as part of the levy (counterfactual is the expected outcome under the reduced rate of CCL), while
- the net impact describes savings computed when the discount is treated as part of the agreement (counterfactual is the outcome under the full rate of CCL).

The Macroeconomic Rebound Effect and the UK Economy 4CMR
78
100
44
12
00
10
20
30
40
50
60
70
80
90
100
110
2010 2015 2020 2025
MtC
Figure A1.1 Index showing the carry-over impact of CCAs on emissions
Monetary and Physical Energy In FES & PSI (2005) the monetary savings related to lower energy consumption were computed from the forecasted carbon savings by using an average energy price (£2.40 per GJ) and an average emission factor (16 kg per GJ). Investment Costs Since there is no information available about the type of actions undertaken by firms, investment costs were computed under three alternative assumptions about the breakdown of the energy expenditure savings between operational changes, minor investments (e.g. retrofits) and major investments (e.g. new plant). Details are shown in Table A1.1.
Payback (years)1 Attribution of energy savings Management responses Range Average Low Mid High
Operating changes 0 0 65% 33% 10%
Minor investments 1 - 2 1.5 25% 33% 25%
Major investments 2 - 5 2 3.5 10% 33% 65%
Weighted average payback period (years) 0.725 1.667 2.650
Table A1.1 Weighted average payback periods for investments
Transaction Costs Additional costs imposed by the CCAs on the participating sectors and companies include both the costs incurred during the negotiations and the ongoing costs of

The Macroeconomic Rebound Effect and the UK Economy 4CMR
79
administering the agreements. In FES and PSI (2005), the one-off costs are estimated to be £14 million while the ongoing administrative costs are estimated to be £62.5 million per annum (in real terms) in 2002, rising to £76.3 million per annum in 2010. The cost to the Government of negotiating the agreements has been estimated by Defra to be £2.65 million. The ongoing cost to government is estimated to be £ 800-900,000 per annum. Overlap with Other Policies With the exception of the overlap with the CCL Climate Change Levy (CCL), which was discussed above, FES and PSI (2005) attributed to the CCAs all the savings owed to the overlap between CCAs, Carbon Trust and ECA. In the case of the Enhanced Capital Allowances (ECA), there is no information on the scale of the overlap. In the case of the Carbon Trust, the overlap was estimated to be around 0.1-0.2 MtC in 2002. Assuming that the CT client mix remains relatively stable, the scale of the overlap is expected to rise to around 1.1 MtC by 2010. Some of the CCA sectors are also included in Phase 1 of the EU ETS, which runs from 2005 to 2007.
A1.8. Carbon Trust – Reducing Carbon Emissions Now Introduction The Carbon Trust was formally announced in the 2000 Pre-Budget Report and launched in April 2001. The first pillar, Reducing Carbon Emissions Now, builds on the activities of the earlier Energy Efficiency Best Practice Programme (EEBPP). Reducing Carbon Emissions Now originally comprised four main services: General: comprising a telephone helpline, website, publications and events, that
provide advice to organisations regardless of their size and energy consumption; Standard: comprising on-site surveys and design advice for buildings for medium
sized energy consumers. Bespoke (now Carbon Management): targeted at large energy users; and Interest Free Loans: providing funding to SMEs in order to assist them to adopt
energy saving equipment. Methodology and Assumptions In FES and PSI (2005), the estimated carbon savings are derived by projecting forward base year (2003/04) values for real expenditure on each of the services. The rebound effect has not been taken into account throughout the analysis. The impact on emissions in each year is calculated in a three step process:
• Step 1: forecast the real expenditure level for each service; • Step 2: estimate the first-year impact of the expenditure for each service; • Step 3: estimate the total impact of expenditure.
First-year Carbon Savings Data on the expenditure of each service were taken from the Carbon Trust business plan, until 2007, and assumed constant thereafter. In the case of General and Standard, the first-year impact on emissions of the spending was computed by assuming that real expenditure per tonne of implemented CO2 saving remains constant between 2003 and

The Macroeconomic Rebound Effect and the UK Economy 4CMR
80
2010. In the case of Bespoke/Carbon Management, the first-year impact was computed by assuming that real expenditure per tonne of identified CO2 savings declines by 30% by 2010 and that the implementation rate increases from around 6% to 40%. Cumulative Carbon Savings The cumulative, i.e. across time, impact of measures implemented in a certain year has been computed by applying an average decay profile, computed by the Carbon Trust after considering measure-specific persistence factors and the mix of measures implemented in 2003. By applying this average decay profile to all years, FSE and PSI (2005) assume that the mix of measures implemented from 2004 to 2010 is the same as that observed in 2003. Details of the measures implemented in 2003 were not made available by the Carbon Trust. The decay factor is shown in Figure A1.2. Additionality of Implemented Measures With regard to the additionality of the measures implemented by firms working with the Carbon Trust, FES and PSI (2005) followed the approach taken in an evaluation carried out by the Carbon Trust. For Standard and Bespoke/Carbon Management, all savings are assumed to be additional; in the case of General, the evaluation carried out by the Carbon Trust produced an upper and lower bound for the additional carbon savings, based on the level of consumer satisfaction.
0
20
40
60
80
100
120
0 1 2 3 4 5 6 7 8 9 10 11 12 13 14 15 16 17
years after implementation
%
Figure A1.2 Average decay factor for the measures implemented in 2003 in Reducing Carbon Emissions Now. Monetary Energy Savings and Investment Costs In FES & PSI (2005) the monetary savings related to lower energy consumption were computed by multiplying the carbon savings in a particular year by the ratio between monetary energy and CO2 savings observed in 2003 (74.5 £/t CO2). Analogously, the investment costs were computed by multiplying the first-year carbon savings in a particular year by the ratio of investment cost and first-year CO2 saving observed in 2003 (83.6 £/t CO2).

The Macroeconomic Rebound Effect and the UK Economy 4CMR
81
Energy Savings Energy Savings were not computed by FES and PSI (2005). For this study, the energy saved by Reducing Carbon Emissions Now was computed by applying a carbon/energy conversion factor to the estimates of carbon savings from FES and PSI (2005). The carbon/energy conversion factor takes into account historical fuel consumption in the industrial sector and was computed after consulting Future Energy Solutions. Overlap with Other Policies
1) Climate Change Agreements (CCAs). According to data collected by the Carbon Trust, around 40-50% of the savings resulting from Pillar 1 activities in 2003 were achieved at sites covered by a CCA. For this reason, two sets of estimates are given for the emission and energy savings attributable to the Carbon Trust, and the associated financial impacts. The gross estimates include all savings (including those overlapping with the CCA) while the net estimates exclude all overlapping savings.
2) Climate Change Levy (CCL). On the one hand, the incentive to reduce energy
consumption provided by the CCL may have led firms to seek the help of the Carbon Trust. On the other hand, the services provided by the Carbon Trust may have increased the responsiveness of the firms to the CCL. No estimates for this interaction have been produced in FES and PSI (2005).
3) UK-ETS. Participants can obtain advice from the Carbon Trust on how to help
achieve the reductions to which they are committed. As only 1-5% of Carbon Trust’s customers are covered by the UK-ETS, the extent of the overlap is small.
A1.9. Carbon Trust – Developing Low Carbon Technologies Introduction The Carbon Trust was formally announced in the 2000 Pre-Budget Report and launched in April 2001. The primary objective of the second pillar, Developing Low Carbon Technologies, is to maximise carbon savings over the medium and long term through investments in low carbon technologies. This is achieved by increasing the development of low carbon intellectual property, meeting market needs and by accelerating commercialisation of low carbon technologies. Methodology and Assumptions The Carbon Trust evaluated the expected impact of Developing Low Carbon Technologies by considering: (1) the potential emission saving per unit activity; (2) the potential market share of the technologies; and (3) their likelihood of being successful. The multiplication of these three factors together yields an estimate of the expected impact. The time plot of the savings is estimated by applying an “emission saving profile”. The high, low and average values of the emission savings profile is shown in Figure A1.3. As one can see from the figure, the study assumes a seven-year lead-time for investments to have any effect.
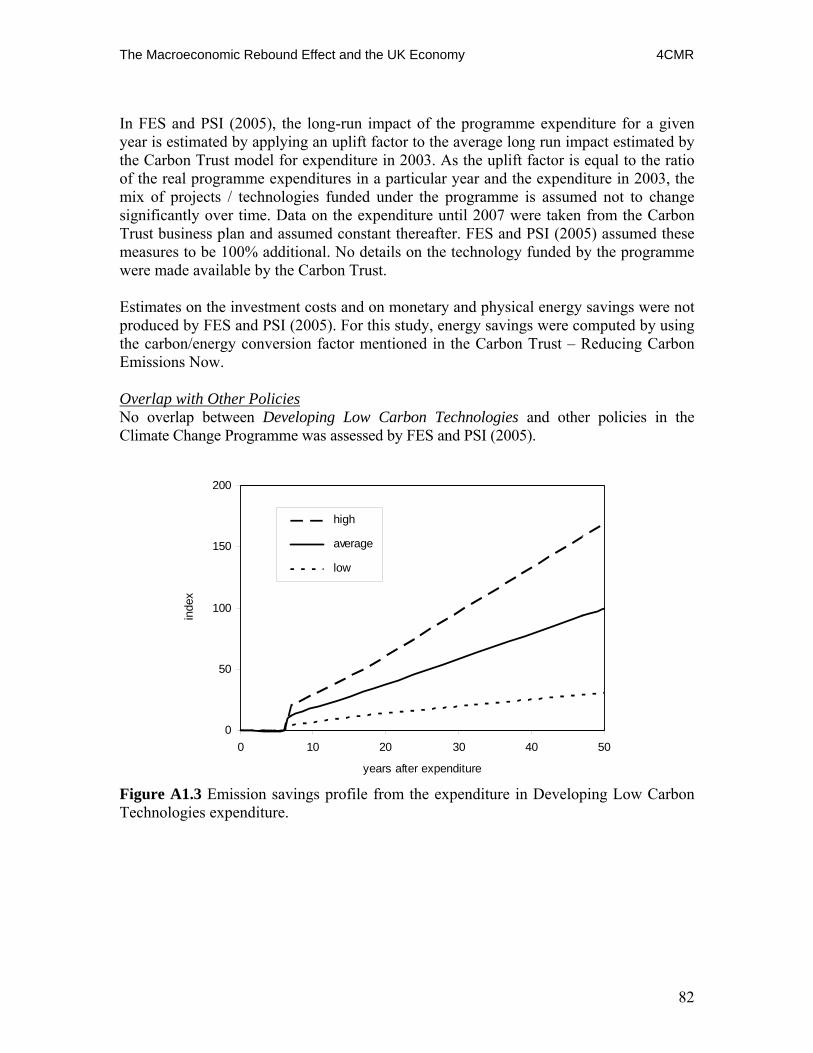
The Macroeconomic Rebound Effect and the UK Economy 4CMR
82
In FES and PSI (2005), the long-run impact of the programme expenditure for a given year is estimated by applying an uplift factor to the average long run impact estimated by the Carbon Trust model for expenditure in 2003. As the uplift factor is equal to the ratio of the real programme expenditures in a particular year and the expenditure in 2003, the mix of projects / technologies funded under the programme is assumed not to change significantly over time. Data on the expenditure until 2007 were taken from the Carbon Trust business plan and assumed constant thereafter. FES and PSI (2005) assumed these measures to be 100% additional. No details on the technology funded by the programme were made available by the Carbon Trust. Estimates on the investment costs and on monetary and physical energy savings were not produced by FES and PSI (2005). For this study, energy savings were computed by using the carbon/energy conversion factor mentioned in the Carbon Trust – Reducing Carbon Emissions Now. Overlap with Other Policies No overlap between Developing Low Carbon Technologies and other policies in the Climate Change Programme was assessed by FES and PSI (2005).
0
50
100
150
200
0 10 20 30 40 50
years after expenditure
inde
x
high
average
low
Figure A1.3 Emission savings profile from the expenditure in Developing Low Carbon Technologies expenditure.

The Macroeconomic Rebound Effect and the UK Economy 4CMR
83
A1.10. Voluntary Agreement Package The package of policies discussed here comprises the Voluntary Agreement, Company Car Tax, and the Graduated Vehicle Excise Duty. The related spreadsheet presents information on a number of items. Below is a description of those items in the spreadsheet which can be unclear.
1) Cost of fuel saving technologies: these are technical costs which occur up-front (in the first year of the cars’ lifetimes) and are not annualised. Examples of fuel saving technology costs include - about £100 for a medium-sized diesel car and £200 for a medium-sized petrol car in 2004. Estimates are from Ricardo.
2) Cost of switching to diesels: estimates from Ricardo indicate that the additional cost of producing a diesel car over a petrol car is £1000. This does not include the extra cost associated with the further expected tightening of EU air quality control standards. It is likely that the VA has encouraged the take up of many more diesel cars than those considered in the counterfactual case, thus it is important to include this effect.
3) Administration Benefits: these benefits are related to the fact that the new CCT regime involves a lower administrative burden on firms than the previous CCT regime.
4) Change in consumer surplus due to increase in fuel efficiency: this term includes the change in fuel costs due to the VA (= change in price of driving 1 km x total km driven) plus the monetised welfare impact of falling fuel prices (= 0.5 x change in price of driving 1 km multiplied by the change in kms after the introduction of the VA). The second component takes into account that, for a given expenditure drivers are able to use their cars more.
Discussion The main components of the costs of the VA package are the increase in congestion due to the rebound effect, the cost of the fuel-saving technology, and the technology cost of the switch to diesel. The main benefits of the policy are the saving of the resource cost of fuel and the social cost of carbon saved, and the extra mileage that can be undertaken due to the fall in the marginal cost of driving. According to the evaluation from DfT, the VA package policy has a net cost to society – with the lifetime cost of abatement being between £374 to £356 per tonne of carbon saved. This evaluation assumes that the policy is not accompanied by measures to counteract the fall in the marginal cost of driving which leads to the increase in congestion costs. If congestion could be avoided, the cost per tonne of carbon would fall to - £13 to -£30, i.e. there would be a benefit instead of a cost. The evaluation is based on the comparison between the actual case and the counterfactual, where the counterfactual represents what would have happened had the VA package not been implemented. There are two counterfactual cases – one where the percentage of diesel in the fleet is assumed to be 14% less than the actual in 2010, and one where the percentage of diesel in the fleet is assumed to be 5% less than in the actual

The Macroeconomic Rebound Effect and the UK Economy 4CMR
84
case. The ‘14% counterfactual’ is the most likely case. Results presented are based on a comparison between the actual and the ‘14% counterfactual’ scenarios.
Assumptions
Actual Counterfactual Percentage of diesel in the fleet
20.8% in 1995 rising to 42% in 2010 20.8% in 1995 rising to 28% in 2010.
Average fuel economy
New car average of 162g CO2/km in 2008 is achieved. It stays constant thereafter
Average fuel economy remains constant at 1995 levels.
Numbers of new cars purchased each year.
It is assumed that the VA package has not changed the number of new cars purchased each year – new car numbers are the same in the actual and both counterfactual scenarios. Data used: Real data from DVLA from 1995-2003 and forecasts from SMMT. The latter show a very small decline in new cars in 2004-2010.
Additional costs of technology to improve fuel economy
Estimates from Ricardo based on the historical cost of mass produced technology from 1995-2004, and projections of the future cost of technology per percentage improvement in fuel economy.
No additional costs of technology to improve fuel economy.
Size profile of cars
The percentage of cars in each size segment is assumed to be the same in the counterfactual as in the actual. Cars are split into small, medium and large segments, based on SMMT data from 1995-2004 (via Ricardo). Changes in the size profile of petrol cars are assumed to continue at half the rate of change between 1995-2004.
Rebound effect Three parts to this effect: a) an increase in mileage due to a fall in the price of
driving per km (estimated as having an elasticity of -0.2)
b) extra comfort taken when driving - e.g. increasing the use of air-conditioning, seat heaters etc and more aggressive driving (estimated as having an elasticity of -0.05)
c) choice of a bigger car when making a purchase decision (this is taken into account in the new car fuel economy averages).
No rebound effect in the counterfactual, as fuel economy is assumed to remain constant.
Please note that, according to evidence from the NTM team, the elasticity of fuel consumption with respect to the price of fuel may be as high as 0.7. However, this includes effects such as the purchase of larger cars - which is already incorporated in the average fuel efficiency figures. In addition, people may be less sensitive to an increase in fuel efficiency, than to a fall in the price of fuel.
The Macroeconomic Rebound Effect and the UK Economy 4CMR
85
Annex 2. MDM-E3 as an Energy-Environment-Economy Model A2.1. Introduction Multisectoral Dynamic Model of the UK economy (MDM-E3) is the UK’s most detailed energy-environment-economy (E3) model, designed to analyse and forecast changes in economic structure, energy demand and resulting environmental emissions. The version of MDM-E3 used for this report is the same as used in CE’s March 2005 report entitled ‘Modelling the Initial Effects of the Climate Change Levy’ for HM Revenue and Customs based on the 1992 Standard Industrial Classification (SIC92), with 1995 as the price-base year, and uses input-output tables for 1995. The endogenous base 2000-10 was used as a framework for estimating the macroeconomic rebound effects. A comprehensive account of an earlier version of the economic model is given in Barker and Peterson (1987). The model has since become a regionalised energy-environment-economy model and most of the equations have been respecified, but the basic structure of the model has remained unchanged. Flows in the economic model are generally in constant prices, while the energy-environment modelling is done in physical units. This modelling is described in Barker et al. (1995). Energy-environment characteristics are represented by submodels within MDM-E3, and at present the coverage includes energy demand (primary and final), environmental emissions, the electricity supply industry and domestic energy appliances. The energy industries are included within the basic input-output structure, and MDM-E3 is a fully-integrated single model, allowing extensive economy-energy-environment interaction The ability to look at interactions and feedback effects between different sectors - industries, consumers, government - and the overall macroeconomy is essential for assessing the impact of government policy on energy inputs and environmental emissions. The alternative, multi-model approach, in which macroeconomic models are combined with detailed industry or energy models, cannot adequately tackle the simulation of ‘bottom-up’ policies. In that approach, these systems are first solved at the macroeconomic level, and then the results for the macroeconomic variables are disaggregated by an industry model but, if the policy is directed at the level of industrial variables, it is very difficult (without substantial intervention by the model operator) to ensure that the implicit results for macroeconomic variables from the industry model are consistent with the explicit results from the macro model. A2.2. The Economic Model The economic model is designed to analyse and forecast changes in economic structure. To do this, it disaggregates industries, commodities, consumers’ expenditure and government expenditure, as well as foreign trade and investment (see Table A2.1 for the main classifications); in fact it disaggregates all of the main variables that are treated as aggregates in most macroeconomic models. The detailed variables are linked together in an accounting framework based on the system of UK National Accounts consistent with the European System of Accounts (ESA95) (see Section 5.5 in the June 1999 edition of
The Macroeconomic Rebound Effect and the UK Economy 4CMR
86
Cambridge Econometrics’ Industry and the British Economy for a description of the framework). This framework ensures consistency and correct accounting balances in the model’s projections and forecasts. The version used for this report incorporates the 1995 price base and the input-output Accounts and associated data from the ONS. The model is a combination of orthodox time-series econometric relationships and cross-section, input-output relationships. Aggregate demand is estimated using a consumption function and investment equations. The supply side comes in through the export and import equations, in which innovation and capacity utilisation affect trade performance, as well as a set of employment equations which allow relative wage rates and interest rates to affect employment and therefore industry-level productivity growth.

The Macroeconomic Rebound Effect and the UK Economy 4CMR
87
table for 1995 estimated from official data and uses the data from the 2003 National
TABLE A2.1: THE MAIN ECONOMIC CLASSIFICATIONS IN MDM-E3 Version 95
Industries and commodities
Investing Household Expenditure Categories
1 Agriculture etc Investment Industries 1 Food 2 Coal 2 Non-alcoholic drinks 3 Oil & Gas etc 1 Agriculture etc 3 Beer 4 Other Mining 2 Oil & Gas 4 Spirits 5 Food 3 Other Mining 5 Wine, cider & perry 6 Drink 4 Manuf Fuels 6 Tobacco 7 Tobacco 5 Chemicals 7 Clothing 8 Textiles 6 Non-Met Min Prods 8 Footwear 9 Clothing & Leather 7 Metals & Metal Prods 9 Actual rents for hsg
10 Wood & Wood Prods 8 Machinery & Equip 10 Imputed rents for hsg 11 Paper, Print & Publ 9 Elec & Optical Equip 11 Maintenance of hsg 12 Manuf Fuels 10 Transport Equipment 12 Water & dwelling serv 13 Pharmaceuticals 11 Food, Drink & Tobacco 13 Electricity 14 Chemicals nes 12 Textiles & Clothing 14 Gas 15 Rubber & Plastics 13 Paper, Print & Publ 15 Coal & coke 16 Non-Met Min Prods 14 Other Manufacturing 16 Other fuels 17 Basic Metals 15 Electricity 17 Furniture & carpets 18 Metal Goods 16 Gas 18 Household textiles 19 Mech Engineering 17 Water 19 Household appliances 20 Electronics 18 Construction 20 Tableware & hh utens 21 Elect Engineering 19 Motor Veh Sales etc 21 Tools & equipment 22 Instruments 20 Wholesale Trade 22 Gds & servs hh maint 23 Motor Vehicles 21 Retail Trade 23 Medical products & eq 24 Aerospace 22 Hotels & Restaurants 24 Out-patient services 25 Other Transp Equip 23 Rail Transport 25 Hospital services 26 Manuf nes 24 Other Land Transport 26 Purchase of vehicles 27 Electricity 25 Water Transport 27 Petrol & oil 28 Gas Supply 26 Air Transport 28 Running costs of m/v 29 Water Supply 27 Other Transp Serv 29 Rail travel 30 Construction 28 Post & telecoms 30 Buses & coaches 31 Retailing 29 Finance & Bus Serv 31 Air travel 32 Distribution nes 30 Public Administration 32 Other travel 33 Hotels & Catering 31 Roads 33 Communications 34 Rail Transport 32 Education 34 AV, photo & info eq 35 Other Land Transp 33 Health & Social Work 35 Other durables 36 Water Transport 34 Waste Treatment 36 Other recreational eq 37 Air Transport 35 Other Services 37 Rec & cultural servs 38 Other Transp Serv 36 Dwelling: public 38 Newspapers & books 39 Communications 37 Dwellings: private 39 Package holidays 40 Banking & Finance 38 Legal Fees etc 40 Educational services 41 Insurance 41 Catering services 42 Prof Serv Investment Types 42 Accommodation servs 43 Computing Serv 43 Personal care 44 Other Bus Serv 1 New Dwellings 44 Personal effects nec 45 Public Admin & Def 2 Other Building 45 Social protection 46 Education 3 Transport equipment 46 Insurance 47 Health/Social 4 Other machinery etc 47 Financial servs nec 48 Waste Treatment 5 Intangible fixed assets 48 Other services nec 49 Misc Services Transfers 49 Expenditure abroad 50 Unallocated 50 Foreign tourists exp 51 NPISH final exp

The Macroeconomic Rebound Effect and the UK Economy 4CMR
88
A2.3 The Energy Submodel The energy submodel determines total secondary energy demand, fuel use by user and prices of fuel use, and also provides the feedback to the main economic framework of MDM-E3. This econometric ‘top-down’ treatment is supplemented by an engineering ‘bottom-up’ approach in a number of submodels, including that of the ESI. All the main equation sets in MDM-E3, including the energy equations, are estimated using a standard cointegrating technique. The equations for final energy demand are estimated on data from the Digest of UK Energy Statistics (DUKES), published annually by the DTI, supplemented by more up-to-date data published monthly in Energy Trends. The data are available in mtoe, original units and, in some cases, monetary units disaggregated by major energy user. Prices are calculated as the ratio of the monetary unit and demand data. The energy user and energy type classifications used in the energy-environment model are based on the classifications used in DUKES. They are listed in Table A2.2, which also shows the correspondence with the industries and commodities in the economic model.

The Macroeconomic Rebound Effect and the UK Economy 4CMR
89
TABLE A2.2: FUEL USER GROUPS AND FUEL TYPES MDM Fuel User MDM Industry MDM Fuel Type MDM Commodity 1 Power generation 27 Electricity 1 Coal and coke 2 Coal 2 Unallocated 2 Motor spirit 12 Manufactured Fuels 3 Own use 2 Coal 3 Derv 3 Oil & Gas etc 4 Gas oil 12 Manufactured Fuels 5 Fuel oil 28 Gas Supply 6 Other refined oils 4 Basic Metals 17 Basic Metals 7 Gas(1) 28 Gas Supply 5 Minerals 4 Other Mining 8 Electricity(2) 27 Electricity 16 Non-metallic Mineral Products 9 Nuclear fuels 6 Chemicals 13 Pharmaceuticals 10 Steam not classified 14 Chemicals nes 11 Renewables 7 Other industry 5 Food 6 Drink 7 Tobacco 8 Textiles 9 Clothing & Leather 10 Wood & Wood Prods 11 Paper, Printing & Publishing 15 Rubber & Plastics 18 Metal Goods 19 Mechanical Engineering 20 Electronics 21 Electrical Engineering 22 Instruments 23 Motor Vehicles 24 Aerospace 25 Other Transport Equipment 26 Manufacturing nes 8 Rail transport 34 Rail Transport 9 Road transport 35 Other Land Transport, consumer demand 10 Water transport 36 Water Transport 11 Air transport 37 Air Transport 12 Households linked to consumers’ expenditure 13 Commerce etc 1 Agriculture etc 29 Water Supply 30 Construction 31 Retailing 32 Distribution nes 33 Hotels & Catering 38 Other Transport Services 39 Communications 40 Banking & Finance 41 Insurance 42 Professional Services 43 Computing Services 44 Other Business Services 45 Public Administration & Defence 46 Education 47 Health & Social Work 48 Waste Treatment 49 Miscellaneous Services 50 Unallocated Note(s) : 1 Natural gas, coke oven gas and town gas. : 2 Secondary use, pumped storage and net trade.
The Macroeconomic Rebound Effect and the UK Economy 4CMR
90
On the supply side, coal, oil and gas price data are available from the OPEC Bulletin, DUKES, Energy Trends and the Financial Times. These are exogenous variables during the forecast period. Assumptions for oil and gas production are based on government expectations given in the DTI’s Energy Report Volume 2 (formerly known as the Brown Book) up to 2010. The projections for UK coal output are based over the short term on company announcements of closures of deep mines, and over the longer term, they are augmented by Cambridge Econometrics’ forecasts of UK coal demand and the extent of the penetration of the home market by imports. Power generation energy demand is calculated by the ESI submodel, as described below, and passed to the energy submodel. The aggregate demand for energy by the other fuel users is dependent on:
- the activity of the fuel user, usually taken to be gross output of the sector, but, in the case of road transport, total output plus consumer demand is used and in the case of households, household expenditure is used;
- technological progress in energy use, which reflects both energy-saving technical progress and the elimination of inefficient;
- the cost of energy relative to other inputs; - changes in temperature; - the ‘announcement’ effect of the Climate Change Levy and the ‘awareness’ effects on
participating industries of the Climate change Agreements have been modelled based on the CE study for HM Customs and Excise (now HM Revenue and Customs) entitled ‘ Modelling the Initial Effects of the Climate Change Levy’ that was cited in the Budget 2005 Report.
This aggregate demand is then shared out among the fuel types. It is assumed that fuel users adopt a hierarchy in their choice of fuels, choosing first electricity for premium uses (light, electrical appliances, motive power, special heating applications), then sharing out non-electric demand for energy between three fossil fuels (coal and coal products, oil products and gas). The specification of these equations follows similar lines to the aggregate energy equations, except that the dependent variable is the fuel share, and the variables are:
- activity; - technology measure; - three price terms - the price of the fuel type in question, the price index of its nearest
competitor, and the general price index of all fuel use; - temperature (where relevant).
The fossil fuel prices faced by the fuel user are based on the assumptions for oil, gas and coal production prices. Electricity prices are calculated by the ESI submodel based on the cost of generation, transmission, distribution and supply. MDM-E3 allows such measures as the fossil fuel levy, VAT on domestic fuels, the escalator in petrol and derv excise duty, and a carbon and/or energy tax to be modelled. Revenues from any taxes on energy may be used in the main model, depending on the assumptions made, to reduce the Government’s borrowing requirement, or to reduce the indirect or direct tax burden
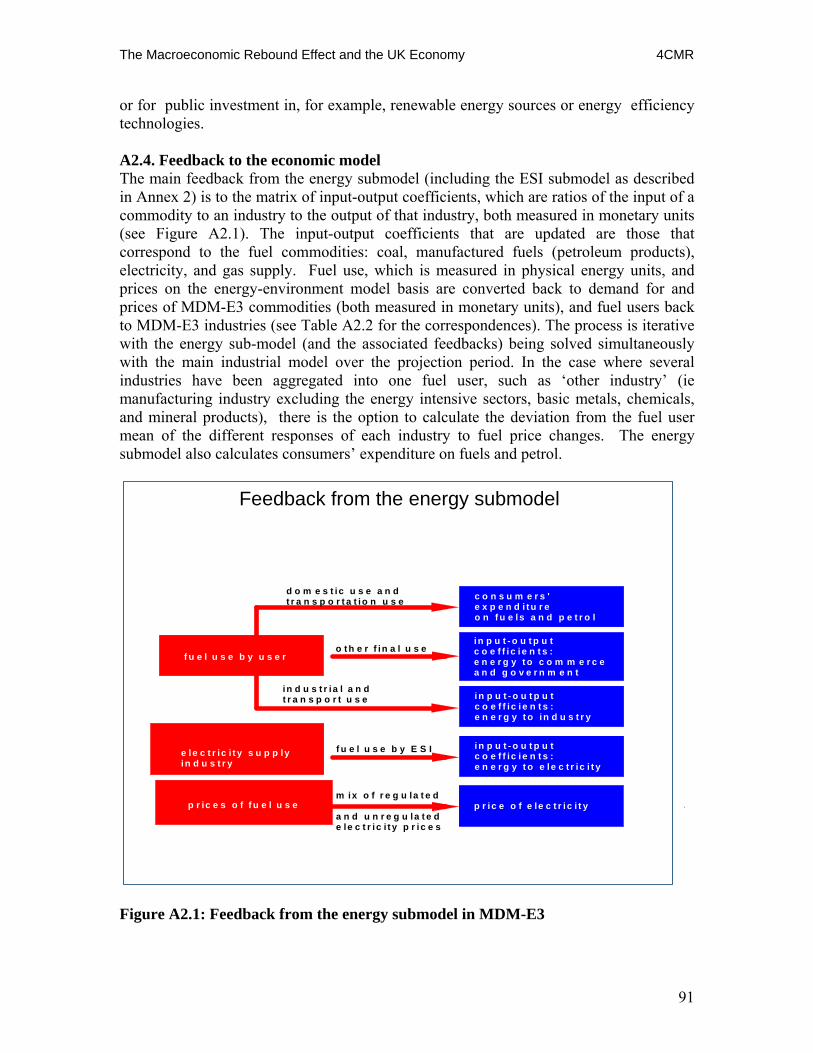
The Macroeconomic Rebound Effect and the UK Economy 4CMR
91
or for public investment in, for example, renewable energy sources or energy efficiency technologies. A2.4. Feedback to the economic model The main feedback from the energy submodel (including the ESI submodel as described in Annex 2) is to the matrix of input-output coefficients, which are ratios of the input of a commodity to an industry to the output of that industry, both measured in monetary units (see Figure A2.1). The input-output coefficients that are updated are those that correspond to the fuel commodities: coal, manufactured fuels (petroleum products), electricity, and gas supply. Fuel use, which is measured in physical energy units, and prices on the energy-environment model basis are converted back to demand for and prices of MDM-E3 commodities (both measured in monetary units), and fuel users back to MDM-E3 industries (see Table A2.2 for the correspondences). The process is iterative with the energy sub-model (and the associated feedbacks) being solved simultaneously with the main industrial model over the projection period. In the case where several industries have been aggregated into one fuel user, such as ‘other industry’ (ie manufacturing industry excluding the energy intensive sectors, basic metals, chemicals, and mineral products), there is the option to calculate the deviation from the fuel user mean of the different responses of each industry to fuel price changes. The energy submodel also calculates consumers’ expenditure on fuels and petrol.
m ix o f r e g u la t e d
a n d u n r e g u la t e de le c t r ic i t y p r ic e s
c o n s u m e r s ' e x p e n d i t u r eo n f u e ls a n d p e t r o l
in p u t - o u t p u t c o e f f i c ie n t s :e n e r g y t o c o m m e r c e a n d g o v e r n m e n t
in p u t - o u t p u t c o e f f ic ie n t s :e n e r g y t o in d u s t r y
in p u t - o u t p u t c o e f f ic ie n t s :e n e r g y t o e le c t r ic i t y
p r ic e o f e le c t r ic i t yp r ic e s o f f u e l u s e
d o m e s t ic u s e a n dt r a n s p o r t a t io n u s e
in d u s t r ia l a n d t r a n s p o r t u s e
o t h e r f in a l u s e
f u e l u s e b y E S I
f u e l u s e b y u s e r
e le c t r ic i t y s u p p ly in d u s t r y
`
Feedback from the energy submodel
Figure A2.1: Feedback from the energy submodel in MDM-E3

The Macroeconomic Rebound Effect and the UK Economy 4CMR
92
A2.5 The Electricity Supply Industry Submodel This section describes the basic structure and operation of the ESI submodel. MDM has also been developed to incorporate a fuller treatment of CHP in a new CHP submodel and the detailed results arising out of this CHP submodel have been aggregated and fed back to the ESI submodel (see UK Energy and the Environment, July 2002, Appendix C). The ESI submodel is a simple treatment of the three electricity generation systems in England and Wales, Scotland and Northern Ireland. Its main purpose is to calculate the annual fuel use by the UK ESI. It does not attempt to forecast plant despatch or the traded price. That is, it is a simulation model rather than an optimisation model. The submodel requires data on the capacity, efficiency and load factor of each power station in the UK. Existing and new station capacities for England and Wales are available in the National Grid’s Seven Year Statement, published annually and in the. Northern Ireland Electricity’s Seven Year Capacity Statement also published annually. These data sources are used for the capacities of existing stations, the existing interconnectors with Scotland and France and the new interconnectors with an overall capacity of 2.3 GW with Norway and the Netherlands. The annual reports of Scottish Power, Scottish Hydro-Electric and British Energy (Scottish Nuclear) are the data sources for Scotland. DUKES contains data by type of fuel burnt aggregated over the whole UK electricity supply industry, and the station and environmental performance reports produced by the generating companies contain some capacity, generation and fuel use data by station. Load factor assumptions are augmented by the Environment Agency’s regulations on emissions from coal and oil-fired power stations: within a single company these require the load factors of non-FGD plants to be restricted and FGD plants to operate at a higher load factor than non-FGD plants according to the so-called 2:1 rule. The demands for plant capacity and generation are at present assumed to grow with electricity demand. The submodel aims to satisfy peak load plus plant margin by building the type of new capacity which is found to have the cheapest overall cost per unit. However, assumptions may be made about expected new build: for example, renewables under the Renewables Obligation or the new CCGTs with planning permission in England and Wales. There are variables for the commissioning year, lifetime, and assumed load factor and efficiency of each existing station and new station type. Plant is not automatically retired early if there is surplus capacity, but station lifetimes may be reduced or increased. The submodel fulfils the requirement for generation by adjusting the load factors of the stations. If there is a surplus of generation, the load factors of the most expensive stations are adjusted down. Conversely, if there is a deficit, the load factors of the cheapest stations are adjusted up to a maximum of 85%. The costs of generation and capacity are dependent on the fuel and non-fuel costs of the different station types. The latter are calculated in the prices of fuels routine and passed to the ESI submodel. The submodel then calculates the thermal input to each station (see Table A2.3 for types of generating plant), and sums to give the thermal requirements of the ESI by fuel type.

The Macroeconomic Rebound Effect and the UK Economy 4CMR
93
A2.6 The Emissions Submodel The emissions classification in MDM-E3 is shown in Table A2.4 (gases 1, 5, 11-14 are the six greenhouse gases, emissions of which are controlled by the Kyoto Protocol). This is based on the availability of data, which are obtained from the National Atmospheric Emissions Inventory (NAEI). Environmental reporting by the ESI has increasingly made data available on a station-by-station basis for emissions such as CO2, SO2, nitrogen oxides, hydrochloric acid and dust. Data for ESI emissions are also available from the Environment Agency and the Scottish Environmental Protection Agency. At present emissions are related to energy demand, and MDM-E3 contains a set of variables (coefficients) which convert between fuel use and environmental emissions. Emissions from alternative (including renewable) sources are treated as a special case. For the most part at present, the emission coefficients are fixed in the forecast period, and therefore do not take account of changing technologies. However, the treatment of the sulphur coefficients takes into account legislation on the sulphur content of fuels and the introduction of emissions abatement technologies, such as flue-gas desulphurisation (FGD) or catalytic converters, which will reduce the emission of sulphur per unit of energy consumed.
TABLE A2.3: EXISTING AND POSSIBLE NEW TYPES OF ELECTRICITY GENERATING PLANTS Existing Plant1 Possible New Plant Nuclear Magnox Planned nuclear AGR Coal Current technology PWR Improved efficiency Coal Large Oil Fuel oil Large Diesel-fired GTs Small Gas-fired CCGTs Base load Duel-fired Coal/Oil Mid-merit order Oil Fuel oil Renewables Diesel-fired GTs CHP Orimulsion Gas-fired CCGTs Hydro Pumped storage Other renewables CHP Note(s) : 1 Existing plant are distinguished by station, except Other renewables and most CHP which are distinguished by type.

The Macroeconomic Rebound Effect and the UK Economy 4CMR
94
A2.7 The Reliability of Projections Using MDM-E3 The reliability of the projections made using MDM-E3 partly reflects the reliability of the available data. There is great potential for inconsistencies between datasets which are collected by different government departments, by different methods, and with different disaggregations. Data are improved through periodic revisions. Aside from the data, there are many other contributors to uncertainty surrounding the projections. While it is not possible to quantify the extent of the uncertainty, it is possible to comment on the validity of the methodology adopted. Compared to other methods, MDM-E3 provides both a very detailed and a comprehensive framework for exploring the prospects for the economy and energy-environment linkages. The model is fully integrated, with feedback occurring between the economy, fuel prices and energy demand. It also contains a high degree of detail, i.e. 49 industries; it is comprehensive, ie covers all aspects of economic activity from government spending and taxation to consumers’ expenditure and industrial energy demand; and it is possible to moderate unsustainable historical trends to give credible outcomes for the projections.
TABLE A2.4: THE EMISSIONS CLASSIFICATION
1 Carbon dioxide (CO2) 2 Sulphur dioxide (SO2) 3 Nitrogen oxides (NOx) 4 Carbon monoxide (CO) 5 Methane (CH4) 6 Black smoke (BS) 7 Volatile organic compounds (VOCs) 8 Nuclear emissions to air 9 Lead emissions to air
10 Chlorofluorocarbons (CFCs) 11 Nitrous Oxide (N2O) 12 Hydrofluorocarbons (HFCs) 13 Perfluorocarbons (PFCs) 14 Sulphur Hexafluoride (SF6)

The Macroeconomic Rebound Effect and the UK Economy 4CMR
95
Annex 3. Questions raised by Defra Key questions relating to the impact of energy efficiency measures to be analysed to be selected from the following:
• What impacts do energy efficiency programmes have on energy prices? • In what way does increased energy efficiency change household behaviour,
beyond the direct rebound effects? • In what way does increased energy efficiency change firm behaviour beyond the
direct rebound effects? • Are there macro-economic rebound effects in the transport sector? Are the effects
different for road freight and private car use? Is the aviation sector a special case (with significant rebound effects)?
• Does the macro-rebound effect, if it exists, mainly manifest itself as increased output or activity levels and hence higher energy intensities or through improved quality and performance e.g. better cars (more air conditioning etc)?
• What impact do energy efficiency programmes have on fuel use, by type? Longer-term effects of energy efficiency measures The longer-term effects analysed in the study to be selected from the following key issues:
• Does regulation to increase energy efficiency by industry result in higher productivity or does it displace first best investment and reduce productivity? If energy efficiency investment is sub-optimal, how can this be measured?
• Do energy efficiency programmes generate transformational effects in the economy (ie when there are long-term changes in the economy caused by changes in technology and consumer preferences that would not have occurred in the absence of the energy efficiency improvements)?
• How large is the rebound effect? What proportion of carbon savings from energy efficiency programmes could be lost?
• How can the rebound effect be expected to change in the future as the structure of the economy changes?
• How should energy efficiency programmes be incorporated in energy and CO2 projections?

The Macroeconomic Rebound Effect and the UK Economy 4CMR
96
Annex 4. Workshop on ‘Macroeconomic Rebound Effect and the UK economy’ Tuesday 17th January, 2006 4CMR – Cambridge Centre for Climate Change Mitigation Research, Dept. of Land Economy, University of Cambridge. Participants: Dr Terry Barker, 4CMR, Univ. of Cambridge Tina Dallman, Defra John Dimitropoulos, SPRU, Univ. of Sussex Dr Tim Foxon, 4CMR, Univ. of Cambridge Dr Horace Herring, Open University Katie Jenkins, 4CMR, Univ. of Cambridge Dr Jonathan Rubin, 4CMR, Univ. of Cambridge Prof. Jim Skea, UKERC Dr Steve Sorrell, SPRU, Univ. of Sussex. The Workshop began with a presentation by Steve Sorrell on ‘Defining the rebound effect from improvements in energy efficiency’, drawing on his study of the evidence for a rebound effect, under the UKERC Technology and Policy Assessment (TPA) function. Steve outlined definitions of direct, indirect and economy-wide rebound effects and the issues arising in relation to each of these.
Tina Dallman outlined Defra’s interest in the macro-economic rebound effect, in terms of its implications for the contribution of energy efficiency policies to reducing UK carbon emissions, for example, the potential need to combine energy efficiency and other policies.
Jim Skea raised the issue of how to define the counter-factual path, compared to which the effectiveness of energy efficiency policies could be compared. It was noted that there is a lack of strong theoretical underpinning for counter-factual paths, and only one study by the IEA was mentioned that discussed this explicitly.
Horace Herring then presented his findings so far on ‘The literature on the macro-economic rebound effect’, covering two main areas. Firstly, growth theory, dominated by the important theoretical work on the rebound by Harry Saunders. Saunders shows mathematically that of the four popular aggregate production function forms -- Cobb-Douglas, CES (Solow), Generalized Leontief, and Translog—nearly all produce backfire (rebound >1), but that most researchers to date have chosen by serendipity just the right model specifications to prevent backfire. Secondly, use of general equilibrium modelling, which produces mixed results, but all agree that assumptions on elasticity and substitution are crucial.
The subsequent discussion focussed on the comparison between rebound effects due to technological progress and those due to energy efficiency, with Tina Dallman stating that attempts to disaggregate these had argued that technological progress is most important.
The Macroeconomic Rebound Effect and the UK Economy 4CMR
97
Terry Barker then presented on ‘Representation of production and modelling the rebound effect in MDM-E3’. This set out how energy demand is represented and the aggregate energy demand equations used in the MDM-E3 econometric modelling. The rebound effect is modelled by imposing the effects of energy efficiency policies, then calculating the dynamic full-model solution. He raised four specific issues:
1) Extra investment in insulation etc (cost of policy?):
- does this investment have an economy-wide effect?
- is there a crowding out effect?
- (no overall fiscal constraints are imposed, as the overall expenditure on energy efficiency policies is small compared to government spending on other areas)
2) Time trend or investment effect? Does it matter?
- does it matter whether energy efficiency is represented as a time trend or investment effect?
3) Response of final consumers to implied extra released spending power is critical (budgetary habits)
- do consumers have fixed budgets which they allocate for different sectors, so that savings made due to energy efficiency policies in one sector will preferentially be allocated to that sector?
4) Does the policy generate regime shifts? E.g. whole-house heating
- do policies result in switching investment or new investment, e.g. in hybrid vehicles?
- is there a rebound quality effect, whereby people buy more energy efficient vehicles, but with additional other features, e.g. enhanced safety, air conditioning?
Discussion:
There followed a general discussion, in which the following points were raised:
- The aim of this type of project should be to identify what is not understood well, and what tools are needed to understand the issues better.
- Sensitivity to structural changes in the economy, e.g. boom in consumer electronics.
- Will energy efficiency policies be over-run by economic growth and technological progress?
- Look for robustness of sector-by-sector rebound effects across different models.
- Draft guidelines have been produced by the inter-departmental analysts group (IAG) so that evaluations and appraisals of greenhouse gas (GHG) policy across Government could be conducted on a common basis to allow for comparison between the cost effectiveness of different policies and measures (to be circulated).
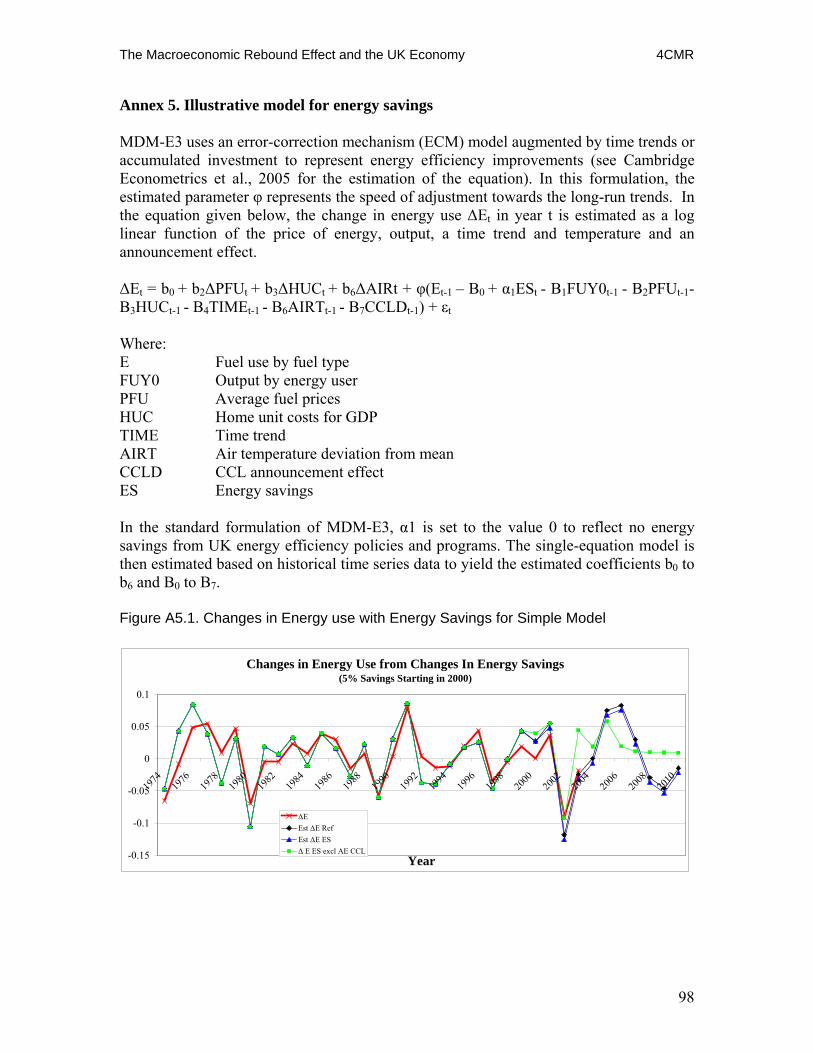
The Macroeconomic Rebound Effect and the UK Economy 4CMR
98
Annex 5. Illustrative model for energy savings MDM-E3 uses an error-correction mechanism (ECM) model augmented by time trends or accumulated investment to represent energy efficiency improvements (see Cambridge Econometrics et al., 2005 for the estimation of the equation). In this formulation, the estimated parameter φ represents the speed of adjustment towards the long-run trends. In the equation given below, the change in energy use ΔEt in year t is estimated as a log linear function of the price of energy, output, a time trend and temperature and an announcement effect. ΔEt = b0 + b2ΔPFUt + b3ΔHUCt + b6ΔAIRt + φ(Et-1 – B0 + α1ESt - B1FUY0t-1 - B2PFUt-1-B3HUCt-1 - B4TIMEt-1 - B6AIRTt-1 - B7CCLDt-1) + εt Where: E Fuel use by fuel type FUY0 Output by energy user PFU Average fuel prices HUC Home unit costs for GDP TIME Time trend AIRT Air temperature deviation from mean CCLD CCL announcement effect ES Energy savings In the standard formulation of MDM-E3, α1 is set to the value 0 to reflect no energy savings from UK energy efficiency policies and programs. The single-equation model is then estimated based on historical time series data to yield the estimated coefficients b0 to b6 and B0 to B7. Figure A5.1. Changes in Energy use with Energy Savings for Simple Model
Changes in Energy Use from Changes In Energy Savings(5% Savings Starting in 2000)
-0.15
-0.1
-0.05
0
0.05
0.1
1974
1976
1978
1980
1982
1984
1986
1988
1990
1992
1994
1996
1998
2000
2002
2004
2006
2008
2010
Year
ΔEEst ΔE RefEst ΔE ESΔ E ES excl AE CCL
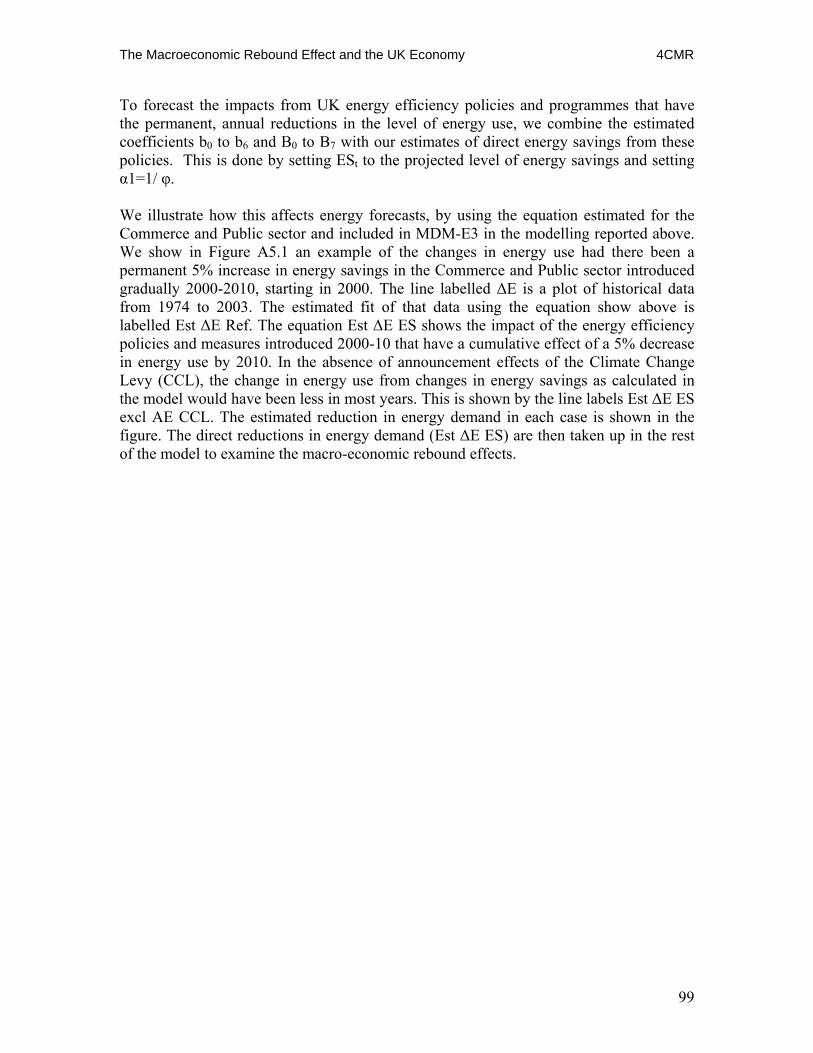
The Macroeconomic Rebound Effect and the UK Economy 4CMR
99
To forecast the impacts from UK energy efficiency policies and programmes that have the permanent, annual reductions in the level of energy use, we combine the estimated coefficients b0 to b6 and B0 to B7 with our estimates of direct energy savings from these policies. This is done by setting ESt to the projected level of energy savings and setting α1=1/ φ. We illustrate how this affects energy forecasts, by using the equation estimated for the Commerce and Public sector and included in MDM-E3 in the modelling reported above. We show in Figure A5.1 an example of the changes in energy use had there been a permanent 5% increase in energy savings in the Commerce and Public sector introduced gradually 2000-2010, starting in 2000. The line labelled ΔE is a plot of historical data from 1974 to 2003. The estimated fit of that data using the equation show above is labelled Est ΔE Ref. The equation Est ΔE ES shows the impact of the energy efficiency policies and measures introduced 2000-10 that have a cumulative effect of a 5% decrease in energy use by 2010. In the absence of announcement effects of the Climate Change Levy (CCL), the change in energy use from changes in energy savings as calculated in the model would have been less in most years. This is shown by the line labels Est ΔE ES excl AE CCL. The estimated reduction in energy demand in each case is shown in the figure. The direct reductions in energy demand (Est ΔE ES) are then taken up in the rest of the model to examine the macro-economic rebound effects.