university of ghana the macro economy and …
TRANSCRIPT

1
UNIVERSITY OF GHANA
THE MACRO ECONOMY AND PERFORMANCE OF GHANA STOCK MARKET
BY
PERCY KWAKU AMANOR SHIAKO
(10638090)
A LONG ESSAY SUBMITTED TO THE UNIVERSITY OF GHANA, LEGON IN
PARTIAL FULFILMENT OF THE REQUIREMENTS FOR THE AWARD OF MASTER
OF BUSINESS ADMINISTRATION DEGREE (FINANCE OPTION)
JULY, 2019
University of Ghana http://ugspace.ug.edu.gh

i
DECLARATION
I, Percy Kwaku Amanor Shiako, do hereby declare that this work is the result of my own research
and has not been presented by anyone for any academic award in this or any other University. All
references used in the work have been fully acknowledged.
……………………………………………. ……………………………………
PERCY KWAKU AMANOR SHIAKO DATE
(10638090)
University of Ghana http://ugspace.ug.edu.gh

ii
CERTIFICATION
I hereby certify that this thesis was supervised in accordance with procedures laid down by the
University.
………………………………………… ……………………………………
DR. VERA OGEH FIADOR DATE
(SUPERVISOR)
University of Ghana http://ugspace.ug.edu.gh

iii
DEDICATION
I dedicate this study to the Almighty God for giving me the strength and the opportunity to go
through this graduate programme. The second dedication also goes to the Shiako family for their
support.
University of Ghana http://ugspace.ug.edu.gh

iv
ACKNOWLEDGEMENT
My deepest gratitude and appreciation is to the Almighty God for all He has done in my life and
for seeing me through this programme successfully.
It is often said that one tree cannot make a forest. This is to say that this excellent study would not
have been successful without the assistance of my honourable supervisor, Dr Vera Ogeh Fiador. I
am grateful for her professional advice.
I would also like to acknowledge my parents and siblings for their support and prayers.
Again, I thank Databank research team for their support with acquiring data for this study.
To my colleagues in the Stanbic Bank Investor Services Operations team, I say thank you for all
the support you have given me during the past two years.
Finally, my earnest appreciation and thanks goes to my friends for their prayers and diverse
support.
God richly bless you.
University of Ghana http://ugspace.ug.edu.gh
v
TABLE OF CONTENTS
DECLARATION ............................................................................................................................. i
CERTIFICATION .......................................................................................................................... ii
DEDICATION ............................................................................................................................... iii
ACKNOWLEDGEMENT ............................................................................................................. iv
TABLE OF CONTENTS ................................................................................................................ v
LIST OF TABLES ....................................................................................................................... viii
LIST OF ABBREVIATIONS ........................................................................................................ ix
ABSTRACT .................................................................................................................................... x
1.1 Background of the Study ....................................................................................................... 1
1.2 Problem Statement ................................................................................................................ 2
1.3 Objectives of the Study ......................................................................................................... 4
1.4 Significance of the Study ...................................................................................................... 4
1.5 Summary of the Proposed Methodology ............................................................................... 4
1.6 Scope and Limitations ........................................................................................................... 5
1.7 Organization of the Work ...................................................................................................... 5
CHAPTER TWO ............................................................................................................................ 6
LITERATURE REVIEW ............................................................................................................... 6
2.1 Introduction ........................................................................................................................... 6
2.2 Theoretical Review ............................................................................................................... 6
2.2.1 Arbitrage Pricing Theorem (APT) .................................................................................. 7
2.2.2 Efficient Market Hypothesis ........................................................................................... 7
2.3 Empirical Review .................................................................................................................. 8
2.3.1 Finance and Economic Growth: Macroeconomic Indicators ....................................... 10
2.3.2 Capital Market and Economic Growth ......................................................................... 11
2.3.3 Impact of Macroeconomic Variables on the Performance of Capital Market .............. 12
University of Ghana http://ugspace.ug.edu.gh
vi
2.4 Chapter Conclusion ............................................................................................................. 12
CHAPTER THREE ...................................................................................................................... 13
METHODOLOGY ....................................................................................................................... 13
3.1 Introduction ......................................................................................................................... 13
3.2 Research Approach ............................................................................................................. 13
3.3 Data and Sources ................................................................................................................. 13
3.4 Model Specification ............................................................................................................ 14
3.5 Description of Variables...................................................................................................... 14
3.5.1 Dependent Variable ...................................................................................................... 15
3.5.2 Independent Variables .................................................................................................. 15
3.6 Estimation Technique .......................................................................................................... 17
3.6.1 Unit Root Test .............................................................................................................. 17
3.6.2 Co-integration Test ....................................................................................................... 17
3.6.3 “Vector Error Correction Model” (VECM) .................................................................. 17
3.6.4 Causality Test ............................................................................................................... 18
CHAPTER FOUR ......................................................................................................................... 19
DATA ANALYSIS AND DISCUSSION OF RESULTS ............................................................ 19
4.1 Introduction ......................................................................................................................... 19
4.2 Descriptive Analysis ........................................................................................................... 19
4.3 Results of Stationarity Test ................................................................................................. 20
4.4 Results of Co-Integration Test ............................................................................................ 22
4.5 Normalized co-integrating Coefficients and “Vector Error Correction Model” Results .... 24
4.6 Wald Test of “Vector Error Correction Model”.................................................................. 27
4.7 Granger Causality Test ........................................................................................................ 28
4.8 Diagnostic Tests .................................................................................................................. 30
CHAPTER FIVE .......................................................................................................................... 31
CONCLUSION AND POLICY RECOMMENDATIONS .......................................................... 31
5.1 Introduction ......................................................................................................................... 31
5.2 Summary ............................................................................................................................. 31
5.3 Conclusions ......................................................................................................................... 32
University of Ghana http://ugspace.ug.edu.gh

vii
5.4 Recommendations ............................................................................................................... 33
REFERENCES ............................................................................................................................. 34
Appendix A: Unit Root Test ......................................................................................................... 38
University of Ghana http://ugspace.ug.edu.gh
viii
LIST OF TABLES
Table 4.1: Summary Statistics of the Variables, 2008-2018 ........................................................ 20
Table 4.2: ADF Unit Root Test at Levels ..................................................................................... 21
Table 4.3: ADF Unit Root Test at first difference ........................................................................ 21
Table 4.4: Results of “VAR Lag Order Selection Criteria”.......................................................... 22
Table 4.5: Johansen Unrestricted Co-Integration Rank Test (Trace) ........................................... 23
Table 4.6: Johansen Unrestricted Co-integration Rank Test (Maximum Eigen value) ................ 24
Table 4.7: Normalized co-integrating Coefficients; Estimated Long-run Model and “Error
Correction Model” for Short-run Dynamics (GSE-ASI is Dependent Variable) .................. 25
Table 4.8: Wald Test of VECM (GSE-ASI is the Dependent Variable) ...................................... 28
Table 4.9: “Pairwise Granger Causality Test” Results ................................................................. 29
University of Ghana http://ugspace.ug.edu.gh
ix
LIST OF ABBREVIATIONS
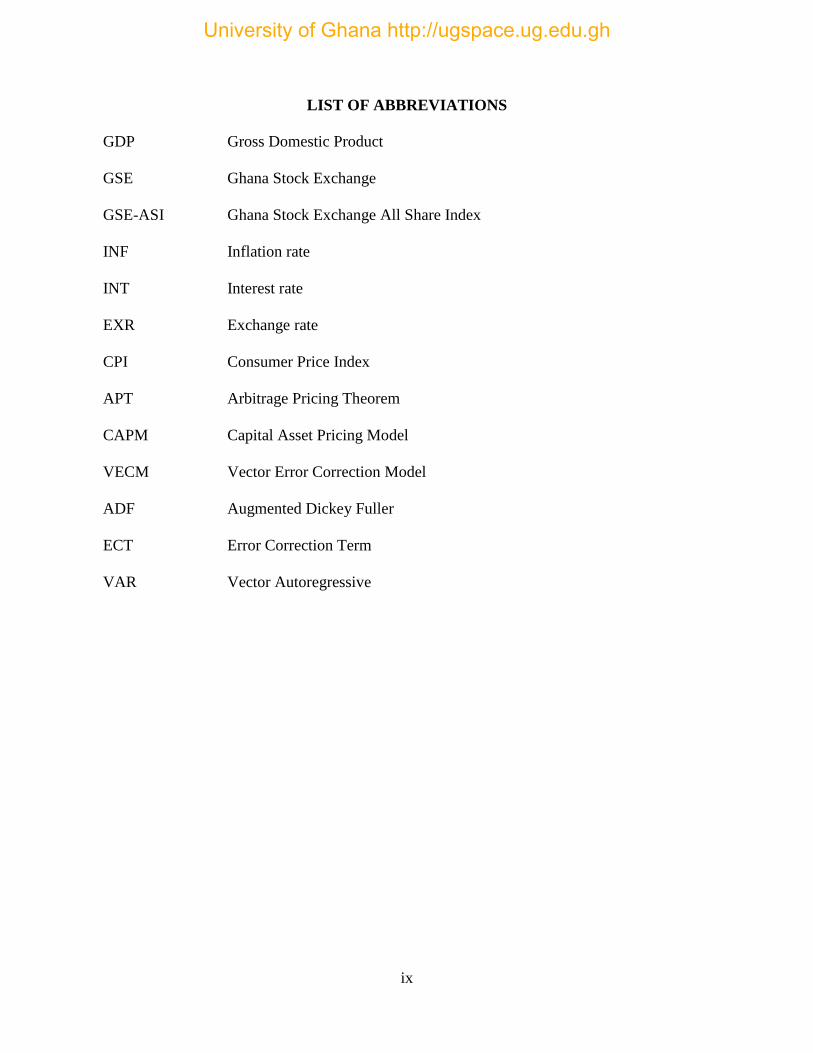
GDP Gross Domestic Product
GSE Ghana Stock Exchange
GSE-ASI Ghana Stock Exchange All Share Index
INF Inflation rate
INT Interest rate
EXR Exchange rate
CPI Consumer Price Index
APT Arbitrage Pricing Theorem
CAPM Capital Asset Pricing Model
VECM Vector Error Correction Model
ADF Augmented Dickey Fuller
ECT Error Correction Term
VAR Vector Autoregressive
University of Ghana http://ugspace.ug.edu.gh
x
ABSTRACT
The study examines the impact of macroeconomic variables (inflation, exchange rate, and interest
rate) on stock market performance in Ghana using quarterly data ranging from 2008 to 2018. Using
time-series techniques of co-integration and vector error correction estimation, the study examines
both the short-run and long-run associations between macroeconomic variables and stock market
performance.
The study uses the GSE all-share index as a dependent variable to measure stock market
performance. Stationarity test done using the Augmented Dickey Fuller (ADF) test shows that the
variables used for the study are all non-stationary at levels but stationary at first difference, hence
justifying the use of the Johansen’s co-integration and Vector Error Correction techniques. The
Johansen’s co-integration test indicates the existence of long-run negative relationships among
GSE all-share index and the macroeconomic variables (inflation rate, exchange rate, and interest
rate) in Ghana, whilst the Vector Error Correction Model reveals no short-run relationship between
these variables. There is also evidence of a uni-directional causative association running from
inflation rate, exchange rate and interest rate to stock market performance using the Granger
causality test. The study shows that macroeconomic variables (inflation, exchange rate, and
interest rate) hinder stock market performance in Ghana in the long-run. All variables are
statistically significant at 5% significance level in the long-run. The speed of adjustment towards
the long-run equilibrium is about 21.3%, indicating that the adjustment is slow. Based on the
findings, the study recommends that in an attempt to encourage the stock exchange market through
various policies, policymakers should try to implement joint policies that will improve both the
stock market and the macroeconomic variables in Ghana.
University of Ghana http://ugspace.ug.edu.gh
1
CHAPTER ONE
INTRODUCTION
1.1 Background of the Study
The financial market is an avenue where financial assets, namely equities, bonds, currencies, and
commodities are traded between buyers and sellers (Abor, 2016). This market literally allows for
enterprises and corporations in need of finances for various projects to meet investors in search of
green pastures to grow their seeds (money). These corporations are supposed to use the funds
obtained productively and, in the process, provide employment among others to promote socio-
economic growth and development. The existence of the financial market is to basically help raise
funds for corporations and transfer risk and liquidity (Saint-Paul, 1992). The financial market,
therefore, helps in channeling surplus funds to deficit units for economic and productive usage. In
other words, financial markets direct the allocation of credit throughout the economy and increase
productivity. The deficit units are the corporations and firms listed on the market whereas the
surplus units refer to the investors. This implies that the market performance is linked to the
performance of the listed corporations, and economic development, as well as investor wellbeing,
is also linked to the financial market and listed companies’ performance (Kabur, Rabia, and Amir,
2016).
Globally, the financial market can be categorized into various forms but the money and the capital
market classification is the most dominant. The money market focuses on short term financing and
investment while the capital market focuses on long term financing. Economically, the capital
market supports growth by; providing investment platforms which raise savings levels, reducing
the pressure on the banking system, ensuring the use of competitive pricing to efficiently allocate
University of Ghana http://ugspace.ug.edu.gh
2
capital, allowing and promoting private sector participation in investments, etc. The capital market
comprises equity and bond markets. The equity market provides financing for corporations and
firms via the issuance of shares/common stock and listing on the exchange for subsequent trading
thereof. The bond market also delivers financing via the issuance of bonds, and facilitate the
subsequent trading thereof. Issuance of bonds is done on the primary market while the subsequent
trading is done on the secondary market. Pagano (1993) questioned how the development of
different financial markets affected economic growth. Extant research found financial markets to
be very important to economic development as Islam et al. (2017) points out that financial markets
play a vital role in economic development by managing the funds and capital of corporations
through its operations. These corporations and firms produce goods and services for consumption
and exportation, provide employment for citizens amongst other activities which helps spin the
wheel of growth and development.
1.2 Problem Statement
Globalization has made it possible and easier for investors around the world to trade and invest in
any capital market in the world. However, the capital markets in some countries are more attractive
and also perform better than that of others. There are several factors and indicators that influence
the performance of every financial market. Macroeconomic variables measure the aggregates of
an economy’s structure, behavior and performance, this means the general performance of any
economy can then be determined by macroeconomic indicators such as unemployment rate,
inflation rate, Gross Domestic Product (GDP), interest or policy rate, exchange rate, etc. Since
stock performance within the capital market affect corporations which in turn affect economic
development; and macroeconomic indicators such as interest rates, inflation rates, and exchange
University of Ghana http://ugspace.ug.edu.gh
3
rates help in measuring the economic performance, it is only right to establish a direct linkage
between the macro economy and the stock market performance in Ghana. This study seeks to
explore the relationship between the macro economy and the performance of stock markets in
Ghana and the extent at which the performance of the capital market is dependent on some of the
key macroeconomic indicators such as the inflation, exchange and interest rates.
This study is necessary because financial markets exist to channel funds from surplus units to
deficit units, this function is crucial for economic growth per available studies (Hearn and Piesse,
2010; OlugBenga and Grace, 2015). Economic growth is positively affected when investors make
good returns tracing back to a good performance from the market and vice versa. The research
question is then raised to try to interrogate the factors that influence the performance of stock
markets in Ghana because failure to understand these performance drivers will mean the inability
to keep the productivity financing machinery (financial markets) functional, which will ultimately
affect economic growth and development of a nation. A case study on the Ghana Stock Exchange
by Kyereboah-Coleman and Agyire-Tettey (2008) investigating the impact of macroeconomic
indicators on stock exchange performance found inflation and lending rates to have negative
effects on stock market performance even though the effects of inflation rates were comparatively
slow allowing for investors to benefit from exchange-rate losses as a result of domestic currency
depreciation. Data used were between 1991 and 2005, and considering that it has been over a
decade, this research aims to re-assess the situation using data between 2008 and 2018.
University of Ghana http://ugspace.ug.edu.gh
4
1.3 Objectives of the Study
The broad objective of this study was to examine the effect of the macro economy on stock markets
in Ghana. Specific objectives of the research are;
i. To examine the long-run and short-run associations between macroeconomic indicators
(inflation, exchange and interest rates) and stock market performance in Ghana
ii. To explore the causal relationship between macroeconomic indicators (inflation, exchange
and interest rates) and stock market performance in Ghana.
1.4 Significance of the Study
It is believed that the growth of any country’s capital market is a sign of good economic growth.
Funds will be raised from the stock market by firms for their business expansion. Once the capital
market is improving, listed firms will be rated as creditworthy which will enhance their financial
status, their productive and expansionary capacity thereby creating more jobs and improving the
economy.
The knowledge of the macroeconomic indicators that affect the equity market in Ghana will
enable policymakers to know where to pay attention to taking economic decisions to achieve
stability and growth. The outcome of this study will inform investors about their investment
destination. This will also add up to the existing study on this topic and will also be a source of
reference for other researchers.
1.5 Summary of the Proposed Methodology
Every research demands that “well-structured approach is followed in the collection of data for
analysis and interpretation”. This study adopted quantitative research and solely depended on
University of Ghana http://ugspace.ug.edu.gh
5
secondary data. The performance of the stock market which is the dependent variable was
measured by using the Ghana Stock Exchange (GSE) All-Share Index and Capitalization from
2008 to 2018. Data on inflation, exchange, interest rates and stocks were obtained from the Bank
of Ghana and the Ghana Stock Exchange.
1.6 Scope and Limitations
Due to time, data limitation and other constraints, data from a ten-year period between 2008 and
2018 was used. With several stock performance indicators available this research chooses GSE
All-Share-Index. This research was also limited in terms of the number of macroeconomic
indicators used. There are several macroeconomic indicators but this study considers inflation,
interest and exchange rates. The research nonetheless achieved its purpose and was applicable in
other developing countries.
1.7 Organization of the Work
This study was divided into five chapters. Chapter one presented a brief introduction to the research
study as well as the background information and its relevant objectives. The literature review
highlighted the works and studies conducted by other researchers in the second chapter. Chapter
three, research methodology explained the research approaches of the study. The third chapter also
described the methods used for data collection and analysis. The fourth chapter focused on the
analysis of the data that were collected. The final chapter of the research presented conclusions
and recommendations.
University of Ghana http://ugspace.ug.edu.gh
6
CHAPTER TWO
LITERATURE REVIEW
2.1 Introduction
Chapter two discusses previous researches relating to and on the impact of macro economy on
capital markets. This section also aims to review relevant theoretical and empirical evidence on
the macroeconomic indicators and how the equity and bond markets are impacted by these
indicators. The organization of this literature is grounded on the study’s objectives and also to
comprehend the topic.
2.2 Theoretical Review
In an attempt to find the link between the macroeconomy and stock market performance, several
frameworks have emerged over time. The Arbitrage Pricing Theorem and efficient Market
Hypothesis were developed by Ross (1976) and Fama (1970) respectively. The macroeconomic
factors established in these studies and others to be determinants of stock market performance were
many, and so were later broadly categorized as policy variables, performance variables and
external variables (Dropsy, 1998). Variables which were measured by Consumer Price Indices
(CPI) or affected by exchange fluctuations such as interest and inflation rates were said to be
performance variables. Whereas GDP growth and monetary policies relating to money supply were
said to be policy variables e.g. fiscal policies. External variables were out of government control
and governments could not do much about such variables e.g. oil prices.
University of Ghana http://ugspace.ug.edu.gh
7
2.2.1 Arbitrage Pricing Theorem (APT)
Like “Capital Asset Pricing Model” (CAPM), APT bases the explanation of asset pricing on mean
standard deviations framework; only that APT employs a multi-factor style whereas CAPM is a
single factor. The volatility of assets is measured by unique coefficients representing
macroeconomic variables. Similar items are then not expected to be traded at distinct prices where
the market is efficient. Indexes taking into consideration predicted and unpredicted events should,
therefore, have a linear correlation with stocks returns (Ross, 1976).
2.2.2 Efficient Market Hypothesis
In this case, asset prices are expected to always take into consideration all historical information
especially where the information is of public knowledge. Since asset prices are supposed to reflect
all available information in efficient markets (Fama,1970), new information should instantly
reflect in the asset prices due to the competition. This allows investors to make a profit if good or
positive information emerges and loses where bad or negative information comes to light.
Recent theories in finance rely on markets being very efficient as investors are opportunists and
rational. Principles such as no-arbitrage, market completeness, united or one price and linear
positive prices are upheld here. These principles bring up absolute and relative pricing models.
Absolute pricing such as consumption-based asset pricing stems on the assets exposure to
underlying macroeconomic risks whereas, in relative pricing, an asset is priced looking at the
prices of related assets; an example of relative pricing is option pricing where the Black Scholes
framework is used. “Theoretical researches relating to inflation rates agree with the argument that
lower liquidity and shrinking stock markets are as a result of higher inflation rates as there is a
University of Ghana http://ugspace.ug.edu.gh

8
non-linear relationship between the financial and stock market development and inflation rates.”
(Huybens & Smith, 1998; Choi et al 1996; Boyd et al., 2001). “On exchange rates, theoretical
literature supports a significant positive relationship between exchange rates and stock market
development as currency fluctuations are inversely related to stock prices” (Jorion, 1991) although
Gavin, (1989) assert that “the relationship between stock prices and exchange rates could go any
direction depending on circumstances.”
2.3 Empirical Review
Grossman and Shiller, (1981) looked at how historical data impacted current and forecasted-prices
and saw proof that it was possible and interest rates changes were one macroeconomic factor which
had some impact on stock price changes. The related study however on the United States stock
market established that oil prices and consumer market indices had no relation to financial markets.
In that study, many macroeconomic factors were used as regressors which saw changes in risk
premiums, yield curves, and industrial growth to have a link with the performance of the stock
market (Chen, et al., 1986). In contrast, a study in Norway by Gjerde and Sarttem (1999) found
“oil prices and real economic activity positively related to stock performance though they
established an insignificant relationship between inflation and stock prices.”
The “Granger non-causality model” was used in India to study and analyze the causal link between
stock performance and macroeconomic variables by Bhattacharya et al., (2001). The findings were
negative as exchange rate, trade balance and foreign exchange reserves had no causal linkage to
the returns on the stock. The “Granger causality test” was also used by Doong et al., (2012) in Asia
to perform similar studies and the results were the same for all the countries used for the research
except for one. They found a negative link between exchange rates and stock performance.
University of Ghana http://ugspace.ug.edu.gh
9
Uddin and Allan (2017) explored the link between changes in share prices and interest rates on the
Bangladesh market and discovered a negative association the interest rates and share price.
Mohammed (2011) also studied “macroeconomic variables and stock market performance in
Bangladesh using monthly data and multi-factor regression model with a Granger causality test
and standard OLS formula. Foreign remittances and inflation were negatively related to stock
prices whereas market capitalization and P/E ratio positively related to stock prices. There were
also indications that the market was informally inefficient.” The Brazilian, Russian, Indian and
Chinese economies were also concluded weakly efficient from the research of Gay (2008). He
concluded that “there was an insignificant relationship between oil prices, exchange rates and the
stock markets of these countries by using Box-Jenkins ARIMA model.”
Using the co-integration tests, Gaetha et al. (2011) proofed only long-term relationship between
inflation, GDP, exchange rates and stock returns in Malaysian, US, and Chinese markets. The VEC
model, however “proved no short-run relationship for the markets under study except for the
Chinese market which proved a short-run relationship between inflation and stock market
performance”.
In Africa, data between 1975 and 2015 was used by Sin-yu (2017) to study “the macroeconomic
determinants of stock market development in South Africa. In the long run, the banking sector
development and economic growth had a positive impact whilst inflation and trade openness had
negative effects on the stock market capitalization. Inflation rates, real interest rates, and current
trade openness were found to have a negative impact on stock market development whereas
economic growth had positive effects on stock markets in the short run. The study applied the
ARDL bounds testing procedure to arrive at the aforementioned results.”
University of Ghana http://ugspace.ug.edu.gh
10
Akinlo & Akinlo (2009) also used the ARDL bounds test in studying “seven sub-Saharan African
countries and detected a positive impact of economic growth on stock market development. Adjasi
& Biekpe (2006) in their research of 14 African economies employing a dynamic panel data
analysis found similar results.” The “banking sector development, household savings and
investment, institutional quality, income level and stock market liquidity had a positive
relationship with stock market growth” in the work of Yartey (2007) using the random and fixed
effects of panel data analysis for thirteen African countries.
Foreign Direct Investment was also seen to exert positive effects on the development of the stock
market by Agbloyor et al. (2013) using the two-stage least square method in studying 16 African
countries and Malik & Amjad (2013) in Pakistan using the “Granger causality test.”
Other studies also associate stock market development and performance to institutional factors
including financial market liberalisation, legal protection for investors, legal origin, integration in
the stock market and corporate governance (Svaleryd & Vlachos, 2002; Shleifer & Vishny, 1997;
Bekaert & Harvey, 2000; Niroomand et al., 2014 etc). The literature suggests that improvements
in the institutional structures to provide favourable environmental law systems can give a notch to
efforts to developing the financial and stock markets.
2.3.1 Finance and Economic Growth: Macroeconomic Indicators
The whole concept of finance revolves around lending or making funds available for deficit
spending individuals, corporations and governments with the promise that they will payback.
Economic growth and development are realized through steady growth in a country’s productive
capacity. For productivity to grow, businesses must be in a position to expand thereby broadening
University of Ghana http://ugspace.ug.edu.gh
11
the industry and causing long-run economic growth and development. Financial capital is usually
a major ingredient in business expansion. Finance makes it possible for firms to acquire capital for
expansion and as Bernanke and Gertler (1989) contend, the inability of finance to play it mediation
role will have serious effects on the economy as there will be macroeconomic fluctuations. The
link between finance and economics is inferred from the fact that “certain external financial
indicators such as corporate bond spreads has substantial predictive content for business cycle
fluctuations” Gertler & Lown (1999); Mody & Taylor (2003). Several macroeconomic indicators
(including interest rates, real exchange rates, and inflation rates) have been acknowledged by
numerous researchers, a few, however, were discussed and applied in this study.
2.3.2 Capital Market and Economic Growth
Arguments in favor of capital markets not imparting economic growth are squashed from studies
undertaken by Arowolo (1971); Agtmael (1984); Drake (1985). In their studies, they link the stock
markets’ underperformance to structural challenges rather than the outright failure of the market.
“The crucial role of stock markets in developing economies has been heightened in several studies”
(Levine & Zervos, 1998; Adjasi & Biekpe, 2006; Hearn & Piesse, 2010). “The stock market roles
mentioned in these works included the provision of development finance by channeling domestic
savings and attracting foreign investment, and the market staying liquid. Apiyeva (2007) studied
ten emerging economies for identifying the major determinants of stock market performance,
which he found that investor’s country rating and financial risk premiums were better market
performance measures compared to other factors such as interest rate, inflation, foreign exchange
rate etc.”
University of Ghana http://ugspace.ug.edu.gh
12
2.3.3 Impact of Macroeconomic Variables on the Performance of Capital Market
Given that several studies have made it clear the importance of the capital markets in developing
economies, it then becomes more important for us to know and understand the determinants and
influencers of the stock market performance. Ita and Joe (2013); Maku and Atanda (2010);
Olugbenga and Grace (2015); Jauhari and Yadav (2014) among others identified inflation rates,
GDP, interest rates, exchange rates to have relationships with the market performance. Several
others studies found many factors affecting “the capital market performance; real economic
activity (Eita, 2012; Rashid, 2008; Rehman et al., 2009), debt/GDP ratio (Hsing, 2014), foreign
reserves (Rehman et al., 2009), capital formation and gold price (Jauhari & Yadav 2014), federal
fund (Yusof & Majid, 2007), net remittance (El-Nadar & Alraimony, 2013).”
2.4 Chapter Conclusion
This chapter demonstrated the significance of the macro economy and the capital market. The
relevant theories underpinning this study was reviewed as well as the empirical literature. This
research will, therefore, add to the extant literature on the topic by looking at some macroeconomic
indicators and the capital market in Ghana and how both the macro economy and capital market
performance influence each other.
University of Ghana http://ugspace.ug.edu.gh
13
CHAPTER THREE
METHODOLOGY
3.1 Introduction
This chapter seeks to discuss the research approach to be adopted, the data to be used, how to
obtain the data, analyzing and interpreting the data to accomplish the study’s objectives. This
section will also address the choice of variables, model specification and sampling technique.
3.2 Research Approach
In order to accomplish the study’s objectives, the appropriate approach to be used is the
quantitative approach. This is because the study is based on numerical secondary data and analyzed
with statistical procedures. Kyereboah-Coleman and Agyire-Tettey (2008); Kabur et al. (2016) in
similar studies also used the quantitative approach. Even though Yauch and Stensel (2003) stressed
on the fact that quantitative researches are limited in that; not all factors are or can be represented
in numeric form rendering the results incomplete; Dudwick et al. (2006) account that, since
quantitative research designs follow certain procedures, errors are relatively reduced compared to
using other approaches.
3.3 Data and Sources
This study employs secondary data from several sources. Since the study is focusing on the impact
of macroeconomic indicators on stock performance in Ghana, the data to be used span from 2008
University of Ghana http://ugspace.ug.edu.gh
14
to 2018. The data on stocks are sourced from Ghana Stock Exchange (GSE), Central Securities
Depository and Data Bank. The inflation, interest and interest rates are obtained from Bank of
Ghana (which we compared with other international data sources like the International Financial
Statistics monthly reports).
3.4 Model Specification
This section looks at the model specification to aid in accomplishing the objectives of the research.
With regards to the objectives, the study models “GSE all share index” as a function of
macroeconomic variables like interest rate, inflation rate and exchange rate. The study replicates
the macro-econometric models of Omole and Falokun (1999); and Kyereboah‐ Coleman and
Agyire‐ Tettey (2008). The empirical model is estimated as:
𝑮𝑺𝑬 − 𝑨𝑺𝑰𝒕 = 𝜷𝟎 + 𝜷𝟏𝑰𝑵𝑭𝒕 + 𝜷𝟐𝑬𝑿𝑹𝒕 + 𝜷𝟑𝑰𝑵𝑻𝒕 + 𝜺𝒕
Where, GSE-ASI, INF, EXR, and INT represent “GSE all share index,” inflation rate, interest rate
and exchange rate. 𝛽0 denotes the intercept, 𝛽1 to 𝛽5 are the estimated parameters, 𝜀𝑡 is the
“random error term” and 𝑡 signifies time.
3.5 Description of Variables
This section details on the variables used in the study in terms of their definitions and
measurement.
University of Ghana http://ugspace.ug.edu.gh
15
3.5.1 Dependent Variable
Ghana Stock Exchange All Share Index (GSE-ASI)
The share index of any market measures the market performance and therefore communicates the
state and position of the market to investors. Several instruments are traded within any given
market; stocks and bonds being the most dominant. An index can therefore be found for any given
set of financial instruments including bonds and stocks, hence the use GSE All Share Index as a
proxy for the Ghana Stock Exchange performance in this research. The GSE-ASI will be a
dependent variable in the research regression analysis measuring the performance of the stock
market and linking it to the interest, inflation and exchange rates which are the independent
variables.
3.5.2 Independent Variables
Inflation Rate
From economic theories, it is expected that demand shifts to consumables as cost of living rises.
Cost of living rises due to high prices of commodities which is a result of high inflation rates. Since
the capital market performance is measured taking into consideration the price and total traded
shares, it is therefore appropriate to note that the stock market performance can be directly or
indirectly be related to the demand for stock market instruments. Considering how influential
inflation can be to the stock market performance, it is only right that it is chosen as an independent
variable in this study. Inflation is therefore expected to affect the equity and bond markets
performance negatively.
University of Ghana http://ugspace.ug.edu.gh
16
Interest Rate
Interest rate is “the cost of capital, the proportion of borrowed funds charged to the borrower. This
study is centered on using a 91-day treasury bill rate as the benchmark for the interest rates due to
data availability and accessibility.” Governments may push up interest rates in their attempt to use
treasury bills in accumulating capital for its policies. Where the government sells T-bills at a rate
higher than what private financial instruments are being offered, the private sector suffers high
costs of capital competing with the government T-bill rates. Attempts to listing most likely fail as
investors will rather invest in the safer government T-bills. In effect, higher interest rates
negatively affect the equity market and cause a fall in equity prices which may not be the same on
the bond market.
Exchange Rate
Exchange rate “is the value of one currency in respect of another.” The World Institute of
Development Economics Research – WIDER (1990) explained that “rapid depreciation causes
both local and foreign investors to redirect their investments to other more susceptible
environments. In essence, the stock market index suffers in terms of volume and value. With
globalization, it is, therefore, necessary to consider the exchange rate in this study as investors will
have the option of investing in countries with favourable exchange rate. The exchange rate is a
very important factor in the decision-making process of any investor.”
University of Ghana http://ugspace.ug.edu.gh
17
3.6 Estimation Technique
3.6.1 Unit Root Test
The Unit-root test is “employed to help in determining the stability of the variables under study.
For the regression to provide meaningful and comprehensible output, it is necessary for Unit-root
tests to be implored where time-series data is involved. Stationarity of variables depends on
whether the properties of the variables such as the mean and variance are constant over time. The
presence of a unit root translates into the null hypothesis whereas the alternative hypothesis is
either explosive root, stationary or trend stationary depending on the test implored.” The
Augmented Dickey-Fuller (ADF)-GLS test is employed in this regard.
3.6.2 Co-integration Test
Co-integration test is necessary to eliminate any case of losing the long-term relationship among
variables. Econometric models sometimes tend to have non-stationary variables, in which case
variables may be differentiated several times and in so doing break down the theories of long-term
response.
3.6.3 “Vector Error Correction Model” (VECM)
This model “is another way to examine the relationship among variables. The error correction term
signifies the long-run link between the variables. For example, ECM combines the long-run and
short-run relationships among the variables in one equation. It confirms the presence of the long-
run connection between the variables if one variable is causing the other variable. The causality
test hence helps to test if a causal link exists between two variables. The error correction term
corrects the deviations from equilibrium towards long-run equilibrium.”
University of Ghana http://ugspace.ug.edu.gh

18
3.6.4 Causality Test
A lot of debates have been put across by different authors with regards to the potential role of stock
market performance in economic development. Even though most trade theories support the stock
market performance-led development hypothesis, others too are in support of development led
stock market performance hypothesis. To find solutions to this issue, the study used the
methodology proposed by Granger (1969). The causality test for “macroeconomic variables and
stock market performance” in the Granger test employs F-test.
University of Ghana http://ugspace.ug.edu.gh
19
CHAPTER FOUR
DATA ANALYSIS AND DISCUSSION OF RESULTS
4.1 Introduction
Chapter four presents the results and the discussion of the research findings. It first presents the
descriptive statistics, stationarity, co-integration tests and then proceeds to present the short run
and long run results of the study. Specifically, the study focuses on the short-run and long-run
associations between the variables of interest of this study, as well as “the causal link between the
macroeconomic variables and stock market performance in Ghana”. The discussion on the model’s
diagnostics tests will end this chapter.
4.2 Descriptive Analysis
This section of the study “presents a brief discussion of the basic descriptive statistics of the
variables used in the model over the period 2008 to 2018. These variables are GSE all share index
(GSE-ASI), Inflation rate (INF), Interest rate (INT) and Exchange Rate (EXR). Among the
summary statistics examined are the standard deviation, mean, maximum and minimum values.
Table 4.1 shows the details: Firstly, the standard deviation column from Table 4.1 measures the
dispersion of the variables from their means. The presence of outliers is indicated by large standard
errors which significantly influence the data. The difference between the minimum and maximum
values of the variables can also help to determine the spread. The bigger the gap of a variable, the
larger the standard deviation of the said variable.”
University of Ghana http://ugspace.ug.edu.gh
20
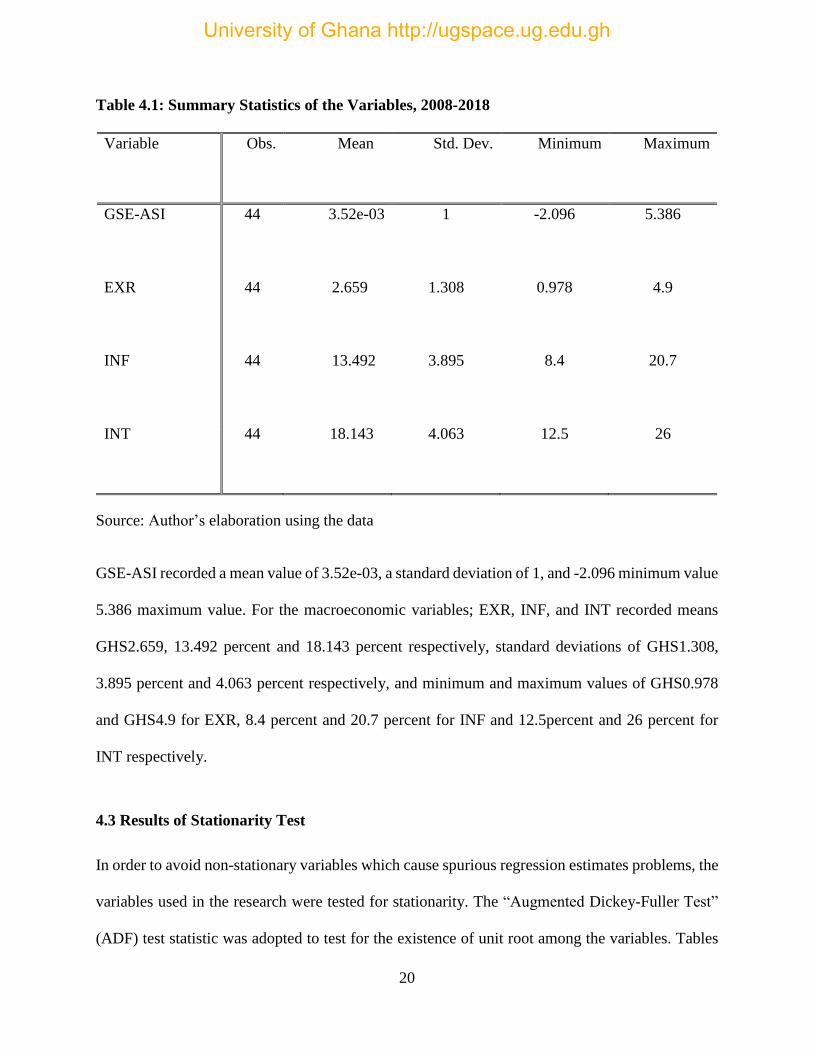
Table 4.1: Summary Statistics of the Variables, 2008-2018
Variable Obs. Mean Std. Dev. Minimum Maximum
GSE-ASI 44 3.52e-03 1 -2.096 5.386
EXR 44 2.659 1.308 0.978 4.9
INF 44 13.492 3.895 8.4 20.7
INT 44 18.143 4.063 12.5 26
Source: Author’s elaboration using the data
GSE-ASI recorded a mean value of 3.52e-03, a standard deviation of 1, and -2.096 minimum value
5.386 maximum value. For the macroeconomic variables; EXR, INF, and INT recorded means
GHS2.659, 13.492 percent and 18.143 percent respectively, standard deviations of GHS1.308,
3.895 percent and 4.063 percent respectively, and minimum and maximum values of GHS0.978
and GHS4.9 for EXR, 8.4 percent and 20.7 percent for INF and 12.5percent and 26 percent for
INT respectively.
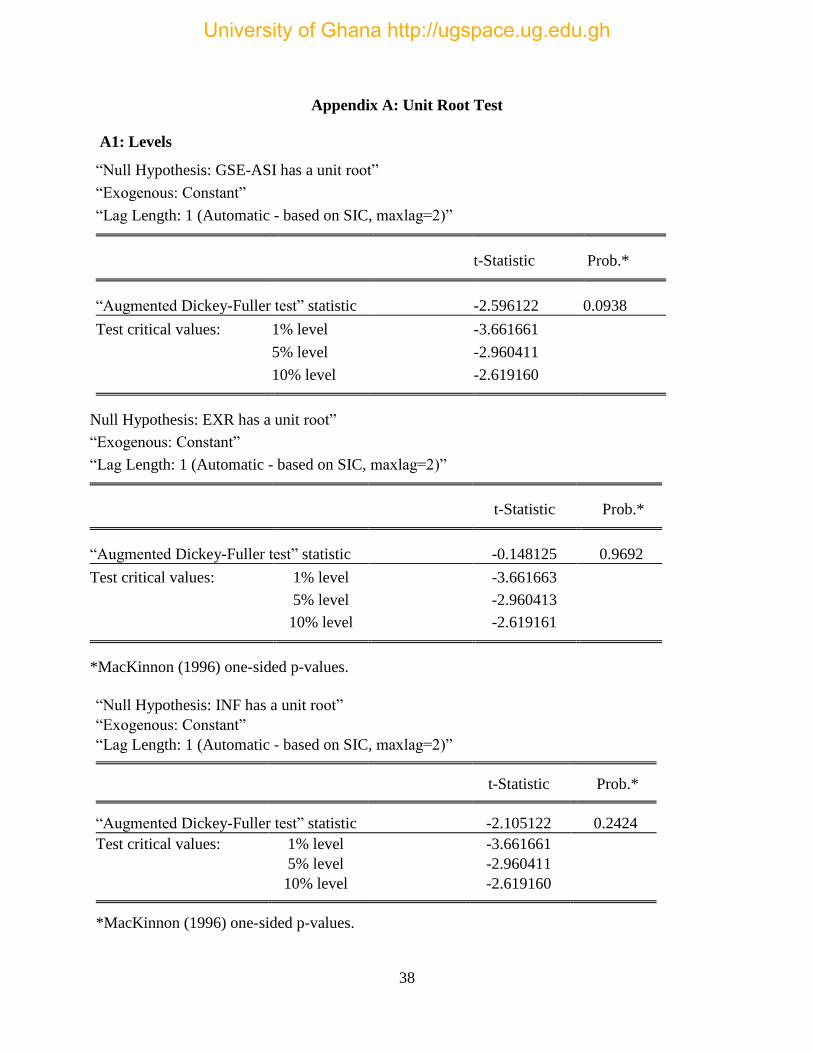
4.3 Results of Stationarity Test
In order to avoid non-stationary variables which cause spurious regression estimates problems, the
variables used in the research were tested for stationarity. The “Augmented Dickey-Fuller Test”
(ADF) test statistic was adopted to test for the existence of unit root among the variables. Tables
University of Ghana http://ugspace.ug.edu.gh
21
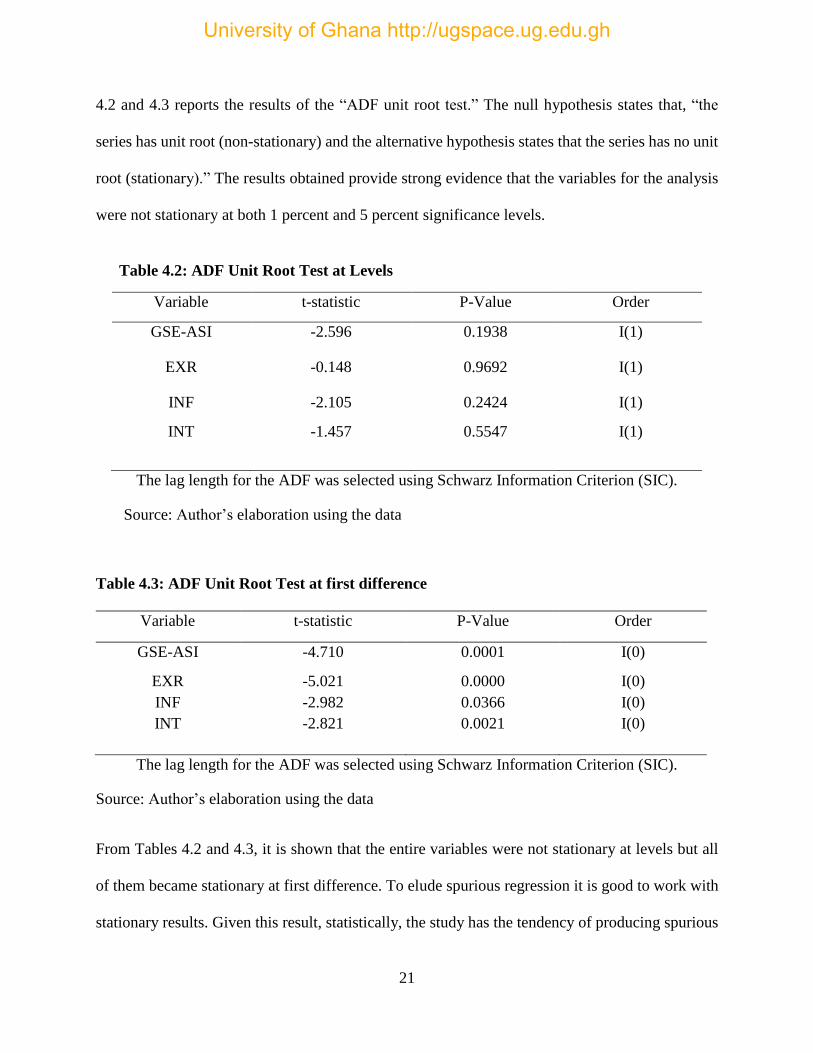
4.2 and 4.3 reports the results of the “ADF unit root test.” The null hypothesis states that, “the
series has unit root (non-stationary) and the alternative hypothesis states that the series has no unit
root (stationary).” The results obtained provide strong evidence that the variables for the analysis
were not stationary at both 1 percent and 5 percent significance levels.
Table 4.2: ADF Unit Root Test at Levels
Variable t-statistic P-Value Order
GSE-ASI -2.596 0.1938 I(1)
EXR -0.148 0.9692 I(1)
INF -2.105 0.2424 I(1)
INT -1.457 0.5547 I(1)
The lag length for the ADF was selected using Schwarz Information Criterion (SIC).
Source: Author’s elaboration using the data
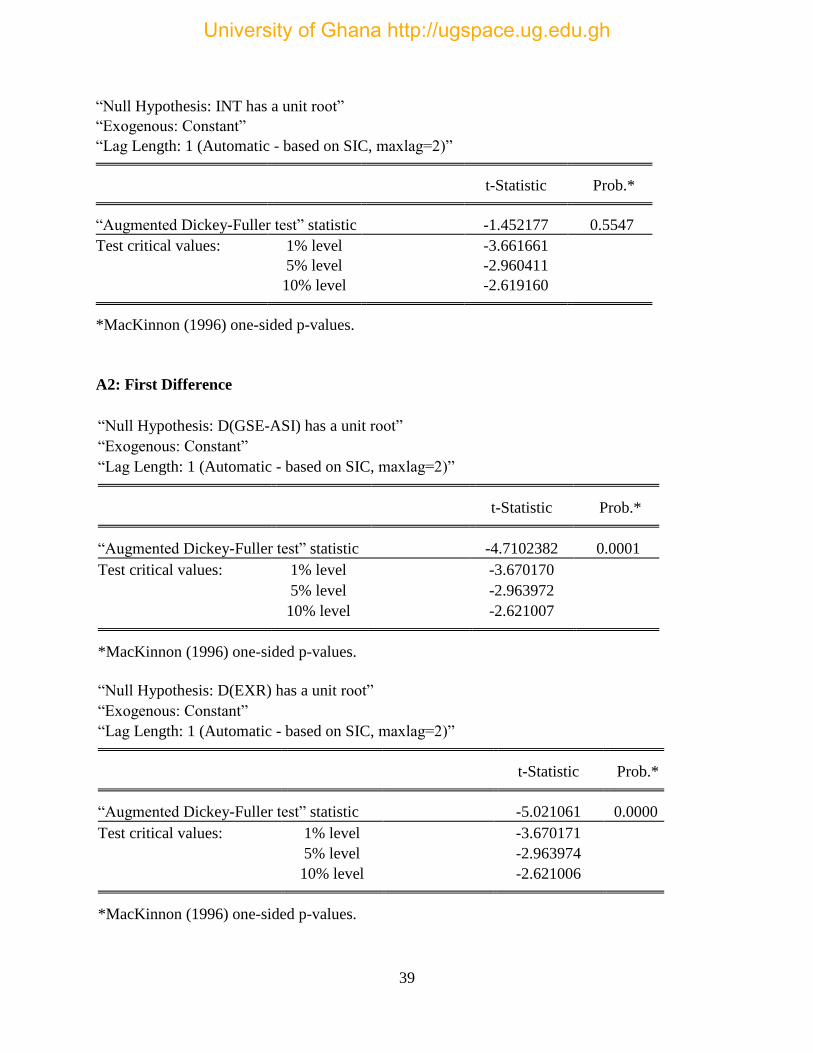
Table 4.3: ADF Unit Root Test at first difference
Variable t-statistic P-Value Order
GSE-ASI -4.710 0.0001 I(0)
EXR -5.021 0.0000 I(0)
INF -2.982 0.0366 I(0)
INT -2.821 0.0021 I(0)
The lag length for the ADF was selected using Schwarz Information Criterion (SIC).
Source: Author’s elaboration using the data
From Tables 4.2 and 4.3, it is shown that the entire variables were not stationary at levels but all
of them became stationary at first difference. To elude spurious regression it is good to work with
stationary results. Given this result, statistically, the study has the tendency of producing spurious
University of Ghana http://ugspace.ug.edu.gh
22
results if it does not first difference the variables. But the study can also test the likelihood of these
non-stationary variables having a long run association. The Johansen method of estimation,
therefore, becomes the appropriate estimation technique to be adopted for the study
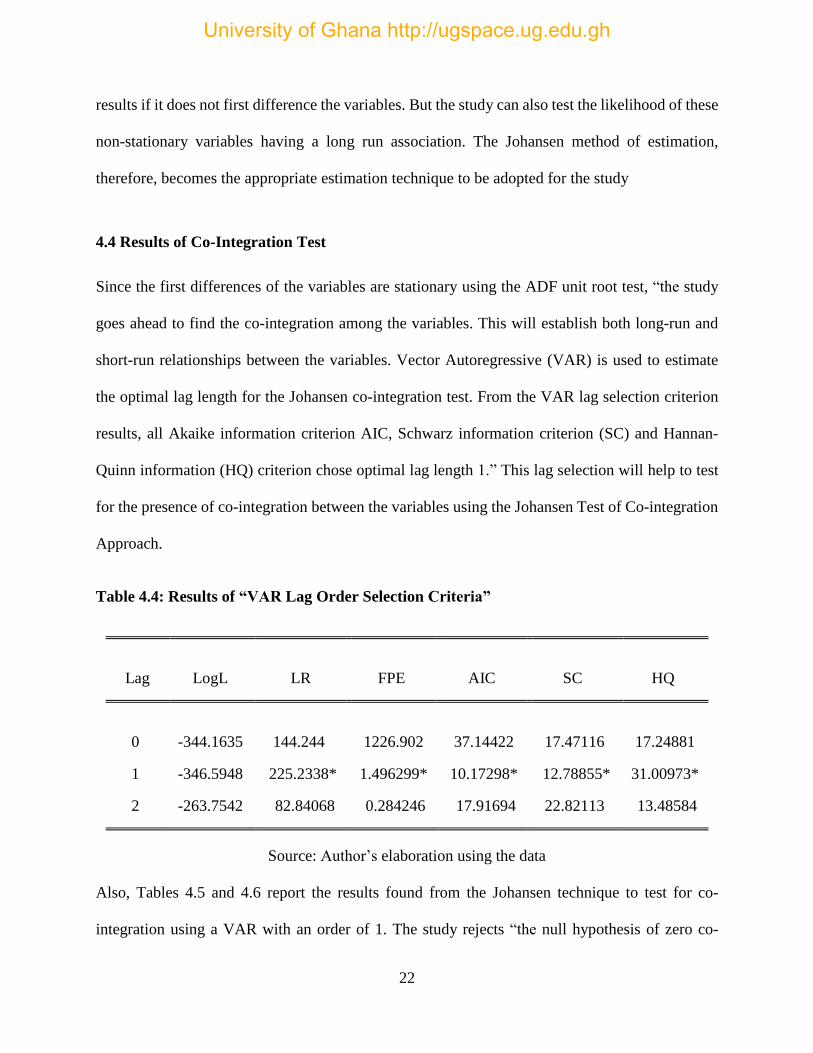
4.4 Results of Co-Integration Test
Since the first differences of the variables are stationary using the ADF unit root test, “the study
goes ahead to find the co-integration among the variables. This will establish both long-run and
short-run relationships between the variables. Vector Autoregressive (VAR) is used to estimate
the optimal lag length for the Johansen co-integration test. From the VAR lag selection criterion
results, all Akaike information criterion AIC, Schwarz information criterion (SC) and Hannan-
Quinn information (HQ) criterion chose optimal lag length 1.” This lag selection will help to test
for the presence of co-integration between the variables using the Johansen Test of Co-integration
Approach.
Table 4.4: Results of “VAR Lag Order Selection Criteria”
Lag LogL LR FPE AIC SC HQ
0 -344.1635 144.244 1226.902 37.14422 17.47116 17.24881
1 -346.5948 225.2338* 1.496299* 10.17298* 12.78855* 31.00973*
2 -263.7542 82.84068 0.284246 17.91694 22.82113 13.48584
Source: Author’s elaboration using the data
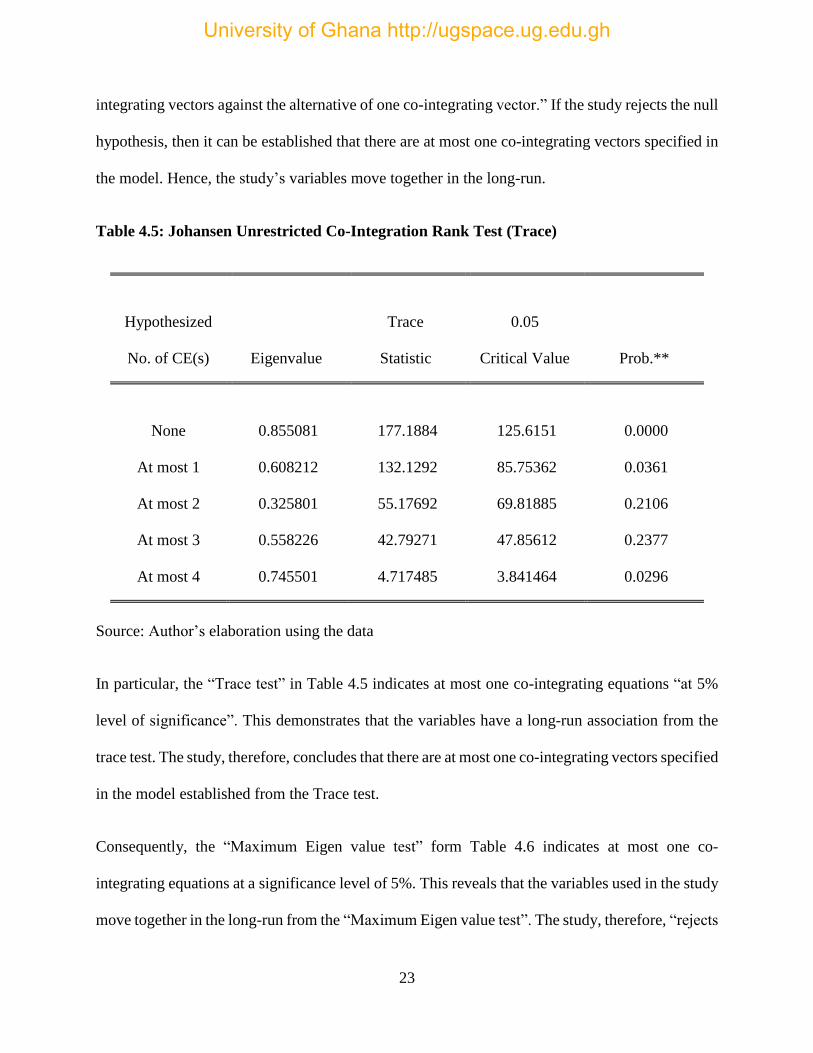
Also, Tables 4.5 and 4.6 report the results found from the Johansen technique to test for co-
integration using a VAR with an order of 1. The study rejects “the null hypothesis of zero co-
University of Ghana http://ugspace.ug.edu.gh
23
integrating vectors against the alternative of one co-integrating vector.” If the study rejects the null
hypothesis, then it can be established that there are at most one co-integrating vectors specified in
the model. Hence, the study’s variables move together in the long-run.
Table 4.5: Johansen Unrestricted Co-Integration Rank Test (Trace)
Hypothesized Trace 0.05
No. of CE(s) Eigenvalue Statistic Critical Value Prob.**
None 0.855081 177.1884 125.6151 0.0000
At most 1 0.608212 132.1292 85.75362 0.0361
At most 2 0.325801 55.17692 69.81885 0.2106
At most 3 0.558226 42.79271 47.85612 0.2377
At most 4 0.745501 4.717485 3.841464 0.0296
Source: Author’s elaboration using the data
In particular, the “Trace test” in Table 4.5 indicates at most one co-integrating equations “at 5%
level of significance”. This demonstrates that the variables have a long-run association from the
trace test. The study, therefore, concludes that there are at most one co-integrating vectors specified
in the model established from the Trace test.
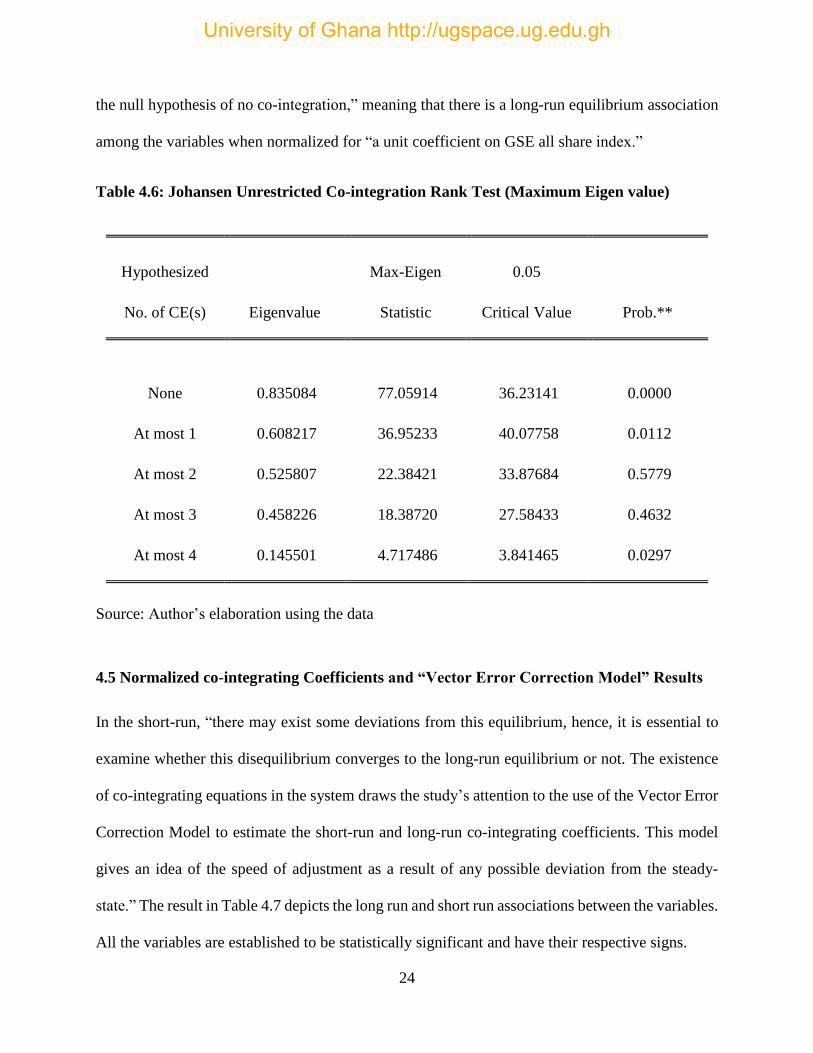
Consequently, the “Maximum Eigen value test” form Table 4.6 indicates at most one co-
integrating equations at a significance level of 5%. This reveals that the variables used in the study
move together in the long-run from the “Maximum Eigen value test”. The study, therefore, “rejects
University of Ghana http://ugspace.ug.edu.gh
24
the null hypothesis of no co-integration,” meaning that there is a long-run equilibrium association
among the variables when normalized for “a unit coefficient on GSE all share index.”
Table 4.6: Johansen Unrestricted Co-integration Rank Test (Maximum Eigen value)
Hypothesized Max-Eigen 0.05
No. of CE(s) Eigenvalue Statistic Critical Value Prob.**
None 0.835084 77.05914 36.23141 0.0000
At most 1 0.608217 36.95233 40.07758 0.0112
At most 2 0.525807 22.38421 33.87684 0.5779
At most 3 0.458226 18.38720 27.58433 0.4632
At most 4 0.145501 4.717486 3.841465 0.0297
Source: Author’s elaboration using the data
4.5 Normalized co-integrating Coefficients and “Vector Error Correction Model” Results
In the short-run, “there may exist some deviations from this equilibrium, hence, it is essential to
examine whether this disequilibrium converges to the long-run equilibrium or not. The existence
of co-integrating equations in the system draws the study’s attention to the use of the Vector Error
Correction Model to estimate the short-run and long-run co-integrating coefficients. This model
gives an idea of the speed of adjustment as a result of any possible deviation from the steady-
state.” The result in Table 4.7 depicts the long run and short run associations between the variables.
All the variables are established to be statistically significant and have their respective signs.
University of Ghana http://ugspace.ug.edu.gh
25
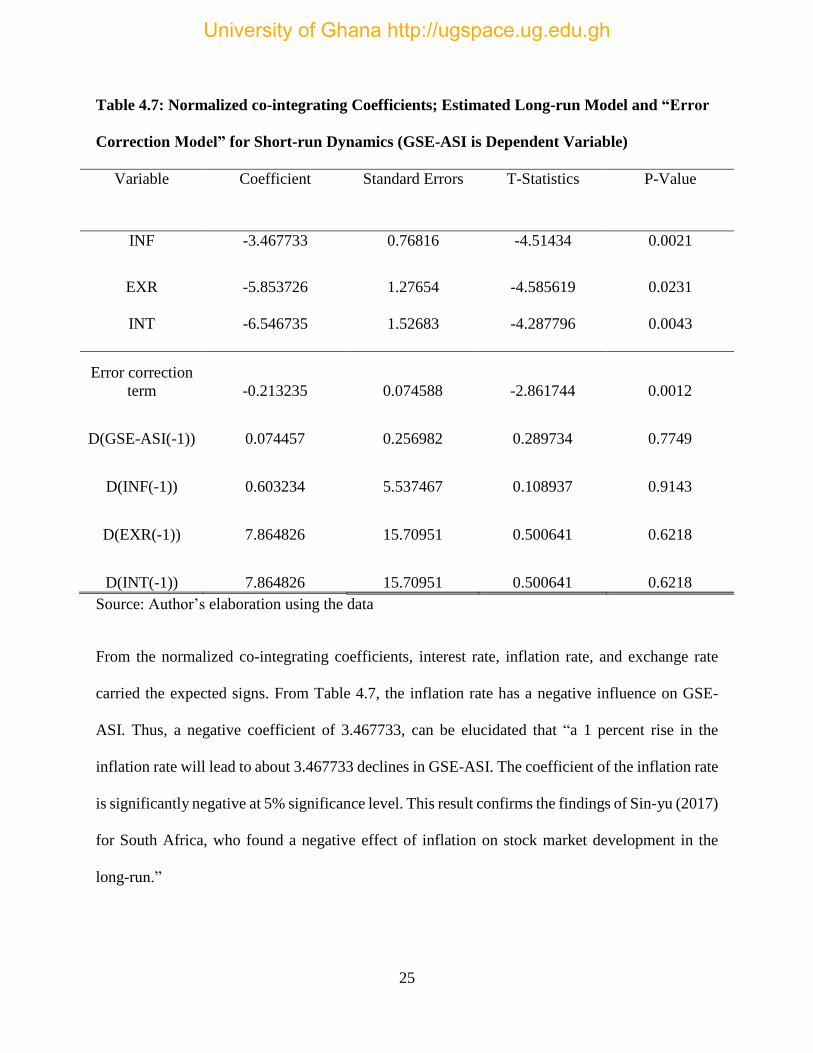
Table 4.7: Normalized co-integrating Coefficients; Estimated Long-run Model and “Error
Correction Model” for Short-run Dynamics (GSE-ASI is Dependent Variable)
Variable Coefficient Standard Errors T-Statistics P-Value
INF -3.467733 0.76816
-4.51434
0.0021
EXR
INT
-5.853726
-6.546735
1.27654
1.52683
-4.585619
-4.287796
0.0231
0.0043
Error correction
term -0.213235 0.074588 -2.861744 0.0012
D(GSE-ASI(-1)) 0.074457 0.256982 0.289734 0.7749
D(INF(-1)) 0.603234 5.537467 0.108937 0.9143
D(EXR(-1)) 7.864826 15.70951 0.500641 0.6218
D(INT(-1)) 7.864826 15.70951 0.500641 0.6218
Source: Author’s elaboration using the data
From the normalized co-integrating coefficients, interest rate, inflation rate, and exchange rate
carried the expected signs. From Table 4.7, the inflation rate has a negative influence on GSE-
ASI. Thus, a negative coefficient of 3.467733, can be elucidated that “a 1 percent rise in the
inflation rate will lead to about 3.467733 declines in GSE-ASI. The coefficient of the inflation rate
is significantly negative at 5% significance level. This result confirms the findings of Sin-yu (2017)
for South Africa, who found a negative effect of inflation on stock market development in the
long-run.”
University of Ghana http://ugspace.ug.edu.gh
26
Also, “the coefficient of the exchange rate is significantly negative at 5% level of significance.
This conforms to the theory. Specifically, a 1 percent rise in the exchange rate will lead to
approximately 5.853726 decreases in GSE-ASI. It can be seen that the exchange rate has a negative
effect on stock market performance in Ghana, in general. This implies that in the long-run, the
growth of exchange rate is detrimental to Ghana’s stock market performance since investors will
have the option of investing in countries with favorable exchange rate.” This result confirms the
findings of Gaetha et al. (2011), who established “a statistically significant long-run association
between growth exchange rate and stock market performance in Malaysia, U.S.A, and China.”
Moreover, the effect of interest rate on GSE-ASI in the long-run “is also significantly negative at
5% level of significance. With a negative coefficient of 6.546735, it is predicted that a 1% rise in
interest rate leads to about 6.546735 decreases in GSE-ASI. This result confirms the findings of
Sin-yu (2017) for South Africa, who found a negative effect of interest rate on stock market
development in the long-run. This implies that in the long-run, an increase in interest rate will be
detrimental to stock market performance in Ghana.”
Consequently, the findings from the short-run estimates illustrated by the “Error Correction Term”
(ECT) replicates “the temporal position of the long-run relationships in the model. The sign and
size of the estimated coefficient of the ECT in the model give the direction and speed of adjustment
corrected from the short-run equilibrium towards the long-run equilibrium.” The condition for
convergence is to have a negative and significant ECT. The coefficient of the ECT is significantly
negative at 5% significance level. A significant ECT coefficient implies that “whenever the actual
value of GSE-ASI falls below the value consistent with its long-term equilibrium relationship,
changes in the explanatory variables help bring it up back to its long-term equilibrium value, all
things being equals.” The size of the coefficient specifies the speed of adjustment towards
University of Ghana http://ugspace.ug.edu.gh
27
equilibrium in the long run whenever there is a shock is approximately 21.3 percent. This is a
relatively a slow-speed of adjustment. This coefficient also establishes that, should there be shocks
that will cause disequilibrium in the economy, 21.3 percent of the errors caused by this
disequilibrium will be corrected.
However, in the short run, the relation between the past one lag periods of GSE-ASI, inflation,
exchange rate, and interest rate are insignificant. Hence, it is concluded that the impact of
macroeconomic variables on stock market performance in Ghana is not immediate.
4.6 Wald Test of “Vector Error Correction Model”
After going through the short-run dynamics, the study proceeds to perform the Wald coefficient
test to know the causality of the explanatory variables on the dependent variable (GSE-ASI) in the
short-run. From Table 4.8, the study uses the Wald test to test the null hypothesis that all lagged
values of the independent variables do not jointly cause GSE All Share Index growth. The result
of the Wald test is illustrated in Table 4.9.
University of Ghana http://ugspace.ug.edu.gh

28
Table 4.8: Wald Test of VECM (GSE-ASI is the Dependent Variable)
Wald Test:
Equation: Untitled
Test Statistic Value Df Probability
F-statistic 4.864323 (5, 44) 0.0015
Chi-square 17.14527 5 0.0024
Source: Author’s elaboration using the data
From Table 4.8, the Wald test result gives the study enough indication to reject the null hypothesis
that inflation, interest and exchange rates do not jointly cause the performance of the stock market
in the short run. Therefore, “all the lagged independent variables can jointly influence stock market
performance and there is a causal link running from the independent variables to stock market
performance in the short-run at 5% level of significance”.
4.7 Granger Causality Test
This test is estimated for the ultimate aim of examining the causality and direction between the
variables employed in the study. “This test tries to examine whether the past values of one variable
can lead to a change in the present values of another variable. The main interest for this study of
causality is to check if there is any Granger causality between the macroeconomic variables and
stock market performance.” In principle, if variations in the macroeconomic variables cause a
change in stock market performance, then the macroeconomic variables “Granger cause” stock
market performance.
University of Ghana http://ugspace.ug.edu.gh
29
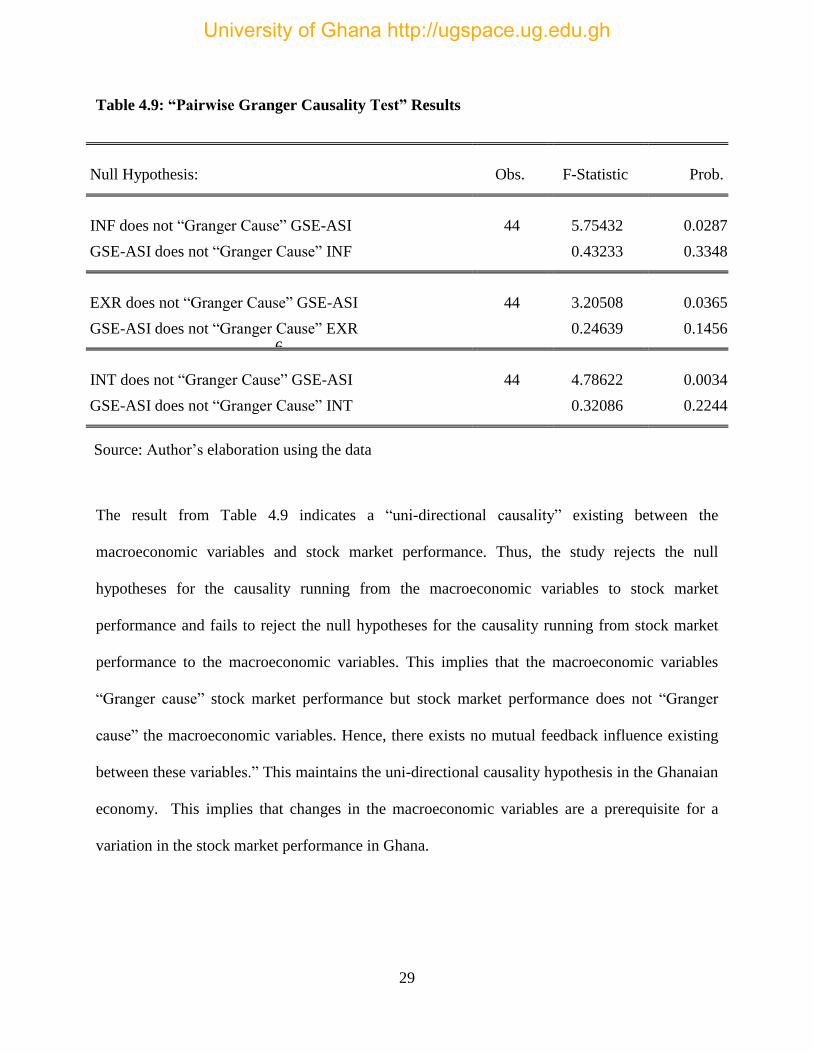
Table 4.9: “Pairwise Granger Causality Test” Results
Null Hypothesis: Obs. F-Statistic Prob.
INF does not “Granger Cause” GSE-ASI 44 5.75432 0.0287
GSE-ASI does not “Granger Cause” INF 0.43233 0.3348
EXR does not “Granger Cause” GSE-ASI 44 3.20508 0.0365
GSE-ASI does not “Granger Cause” EXR 0.24639 0.1456
6
INT does not “Granger Cause” GSE-ASI 44 4.78622 0.0034
GSE-ASI does not “Granger Cause” INT 0.32086 0.2244
Source: Author’s elaboration using the data
The result from Table 4.9 indicates a “uni-directional causality” existing between the
macroeconomic variables and stock market performance. Thus, the study rejects the null
hypotheses for the causality running from the macroeconomic variables to stock market
performance and fails to reject the null hypotheses for the causality running from stock market
performance to the macroeconomic variables. This implies that the macroeconomic variables
“Granger cause” stock market performance but stock market performance does not “Granger
cause” the macroeconomic variables. Hence, there exists no mutual feedback influence existing
between these variables.” This maintains the uni-directional causality hypothesis in the Ghanaian
economy. This implies that changes in the macroeconomic variables are a prerequisite for a
variation in the stock market performance in Ghana.
University of Ghana http://ugspace.ug.edu.gh

30
4.8 Diagnostic Tests
The study has adequately examined and specified models with various diagnostic tests (see
Appendix). These tests include a test for serial correlation, heteroskedasticity and functional form.
The null hypotheses of the various diagnostic tests include:
1. The residuals of the model are not serially correlated.
2. There is no “ARCH effect” (heteroskedasticity).
3. There is a correct functional form of the model.
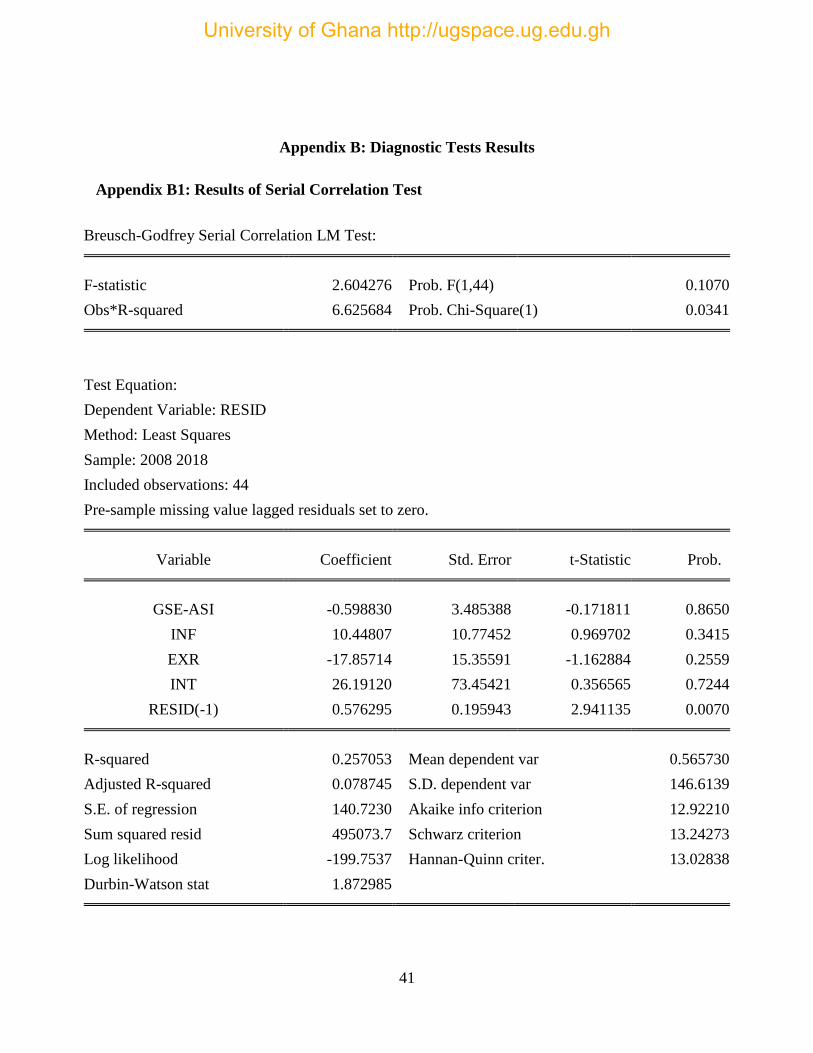
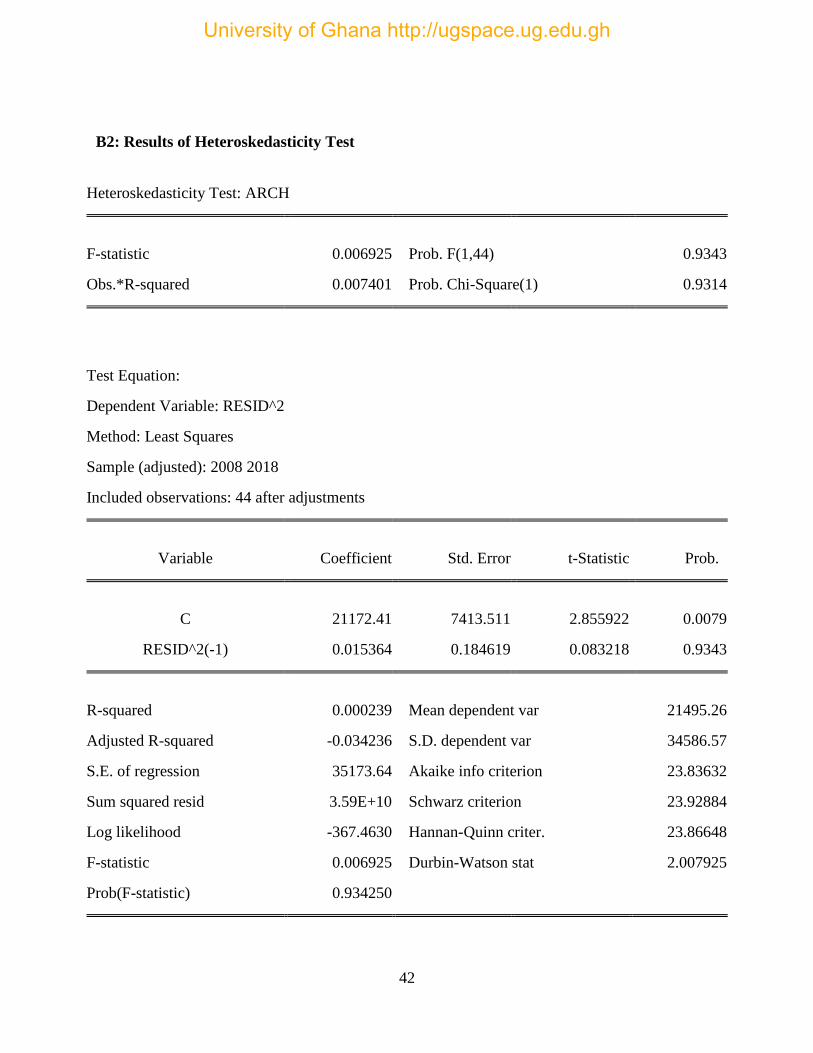
The tests, therefore, failed to reject none of the three null hypotheses (see appendix), which means
that, there is no “ARCH effect” (heteroskedasticity), there is no serial correlation in the model and
also, it is of functional form. Therefore, the diagnostic tests show that the empirical model is valid.
University of Ghana http://ugspace.ug.edu.gh
31
CHAPTER FIVE
CONCLUSION AND POLICY RECOMMENDATIONS
5.1 Introduction
In this section, the study presents the summary, conclusion, and recommendation based on the
outcome of the research.
5.2 Summary
Generally, “the main objective of the study is to analyze the effect of macroeconomic variables
(inflation, exchange rate, and interest rate) on stock market performance in Ghana using quarterly
data ranging from 2008 to 2018. The study explored both the long-run and the short-run
relationship between the macroeconomic variables (inflation rate, exchange rate, and interest rate)
and stock market performance. The study used the GSE all-share index as a dependent variable to
measure stock market performance. As seen in the extant literature, the study controlled for the
phenomena that may affect the dependent variable in the model (i.e. inflation, exchange rate, and
interest rate).”
The study estimated “a time series regression model for the period 2008 to 2018 using data sourced
from the Ghana Stock Exchange (GSE) and Bank of Ghana. The Johansen co-integration analysis
was used to confirm the presence of long-run negative relationships among GSE all-share index
and the macroeconomic variables (inflation rate, exchange rate, and interest rate). The results
suggest that the variables are co-integrated. That is, they move together in the long-run.” However,
when the “vector error correction model was employed to check for the short-run association
between the independent variables and GSE all share index, insignificant results were found. In
University of Ghana http://ugspace.ug.edu.gh
32
particular, even though the variables are co-integrated, the influence of inflation rate, exchange
rate and the interest rate on stock market performance are not immediate”. Also, the Granger
causality test showed a uni-directional causative association running from inflation rate, exchange
rate and interest rate to stock market performance in Ghana.
5.3 Conclusions
Stock market growth is mostly known to be beneficial for economic development. Due to this,
Ghana implemented the stock exchange liberalization policy as part of structural reforms in 1986.
This research, therefore, explored the impact of macroeconomic variables on the stock market
performance of Ghana from 2008 to 2018. The empirical results of the research show that inflation,
interest and exchange rate hinder stock market performance in Ghana in the long-run. As expected,
inflation, interest and exchange rates exerted significantly negative effects on stock market
performance.
Also, the error correction term (a measure of disequilibrium error), was shown to be significantly
negative. The size of the coefficient indicates that the speed of adjustment towards equilibrium in
the long-run, whenever there is a shock, is approximately 21.3%. This is a relatively a slow-speed
of adjustment to long-run equilibrium. This implies that “short-run shocks or disturbances in the
macro economy would slowly move the economy towards the long-run equilibrium”. The VECM
estimates also observed that the influence of the macroeconomic variables (inflation, interest and
exchange rates) on the stock market performance are not immediate in the short-run. Also, the
“Granger causality test” results confirmed a uni-directional causal link running from inflation rate,
exchange rate and interest rate to stock market performance. This means that changes in the
University of Ghana http://ugspace.ug.edu.gh
33
macroeconomic variables are a prerequisite for a change in the stock market performance in
Ghana.
5.4 Recommendations
The following policy recommendations are established on the findings of the research: The study
discovered a negative association between the macroeconomic variables (inflation, interest and
exchange rates) on stock market performance in the long-run. Therefore, policymakers and the
government should continue to implement policies geared towards reducing the policy rate,
inflation rate, and exchange rate since they are detrimental to the performance of the stock market
in the long-run. In an attempt to encourage the stock exchange market through various policies,
the government and Bank of Ghana should try to enforce joint initiatives to improve both the stock
market and the macroeconomic indicators.
This study is limited to three macroeconomic indicators for the past ten years. Further study that
considers more macroeconomic indicators is recommended in order to make better the Ghana stock
market.
University of Ghana http://ugspace.ug.edu.gh
34
REFERENCES
Adjasi, C. K., & Biekpe, N. B. (2006). Stock market development and economic growth: The case
of selected African countries. African Development Review, 18(1), 144-161.
Agtmael, A. V. (1984). Emerging Securities Markets. London: Euromoney.
Apiyeva, D. (2007). The determinants of stock market performance in emerging economies: the
case of Latin America and Asia Pacific (Doctoral dissertation, Middlesex University).
Arowolo, E. A. (1971). The development of capital markets in Africa, with particular reference to
Kenya and Nigeria. Staff Papers, 18(2), 420-472.
Bernanke, B. S. and Gertler, M. (1989), “Agency costs, net worth and business
fluctuations”, American Economic Review, 79 (1), 14‐ 31.
Dornbusch, R., & Fischer, S. (1994). Macroeconomics McGraw-Hill. Inc., New York.
Drake, P.G. (1985), “Some reflections on the problems affecting securities markets in less
developed countries”, Savings and Development, 9 (1), 514
Dudwick, N., Kuehnast, K., Jones, V. N., & Woolcock, M. (2006). Analyzing social capital in
context. A guide to using qualitative methods and data, 1-46.
Eita, J. H. (2012). Modelling macroeconomic determinants of stock market prices: Evidence from
Namibia. The Journal of Applied Business Research, 28(5), 871-884.
El-Nadar, H. M. & Alraimony, A. D. (2013). The Macroeconomic Determinants of Stock Market
Development in Jordon. International Journal of Economics and Finance, 5
University of Ghana http://ugspace.ug.edu.gh
35
Gertler, M. & Lown, C. S. (1999). The information in the high-yield bond spread for the business
cycle: evidence and some implications. Oxford Review of Economic Policy, 15(3), 132-
150.
Hearn, B., & Piesse, J. (2010). Barriers to the development of small stock markets: A case study
of Swaziland and Mozambique. Journal of International Development, 22(7), 1018-1037.
Hsing, Y. (2014). Impacts of Macroeconomic Factors on the Stock Market in Estonia. Journal of
Economics and Development Studies, 2(2), 23-31.
Islam, F. T., Mostofa, M. S., & Tithi, A. A. (2017). Macroeconomic and Institutional Determinants
of Capital Market Performance in Bangladesh: A Case of Dhaka Stock
Exchange. International Journal of Academic Research in Accounting, Finance and
Management Sciences, 7(1), 306-311.
Ita, J. J. and Joe, D. (2013). Macroeconomic Factors that Influence Stock market Development in
Nigeria, International Journal of Business and Management Review, 1(2), 43-56
Jauhari, S., & Yadav, H. S. (2014). Relationship between Stock Index and Macroeconomic
Determinants: A Study of Post Globalization Era. International Journal of Core
Engineering and Management, 1(3), 79-100.
Kabur, M., Rabia, N., & Amir, I. (2016). The Influence of Macroeconomic Factors on Capital
Market Performance in Pakistan. International Journal of Research.
Kyereboah-Coleman, A., & Agyire-Tettey, K. F. (2008). Impact of macroeconomic indicators on
University of Ghana http://ugspace.ug.edu.gh
36
stock market performance: The case of the Ghana Stock Exchange. The Journal of Risk
Finance, 9(4), 365-378.
Kyereboah-Coleman, A. & Agyire-Tettey, K. F. (2008). Impact of macroeconomic indicators on
stock market performance: The case of the Ghana Stock Exchange. The Journal of Risk
Finance, 9(4), 365-378.
Levine, R and Zervos, S. (1998). Stock markets, banks, and growth. American Economic Review,
88(3): pp. 537–558.
Maku, O. E. & Atanda, A. A. (2010). Determinants of stock market performance in Nigeria:
long-run analysis.
Mankiw, N. G. (2006). The macroeconomist as scientist and engineer. Journal of Economic
Perspectives, 20(4), 29-46.
Mody, A., & Taylor, M. P. (2003). The high-yield spread as a predictor of real economic activity:
evidence of a financial accelerator for the United States. IMF Staff Papers, 50(3), 373-402.
OlugBenga, A. A., & Grace, O. O. (2015). Impact of foreign direct investment on Nigerian capital
market development. International Journal of Academic Research in Accounting, Finance
and Management Sciences, 5(1), 103-108.
Omole, D. A., & Falokun, G. O. (1999). The impact of interest rate liberalization on the
corporate financing strategies of quoted companies in Nigeria.
Osei, K. A. (1997). Analysis of factors affecting the development of an emerging capital market:
University of Ghana http://ugspace.ug.edu.gh
37
The case of the Ghana stock market.
Pagano, M. (1993). Financial markets and growth: an overview. European economic review, 37(2-
3), 613-622.
Rahman, A. A., Sidek, N. Z. M., & Tafri, F. H. (2009). Macroeconomic determinants of Malaysian
stock market. African Journal of Business Management, 3(3), 095-106.
Rashid, A. (2008). Macroeconomic Variables and Stock Market Performance: Testing for
Dynamic Linkage with a Known Structural Break. Saving and Investment, 32(1), 77-102.
Saint-Paul, G. (1992). Technological choice, financial markets and economic
development. European Economic Review, 36(4), 763-781.
Strazdiya, V., & Rashal, I. (2003). Status of wheat genetic resources conservation and utilization
in Latvia. In Report of a Working Group on Wheat: First Meeting, 8-10 November 2001,
Prague-Ruzyne, Czech Republic (p. 66). Bioversity International.
Yusof, R. M., & Majid, M. S. A. (2007). Macroeconomic variables and stock returns in Malaysia:
An application of the ARDL bound testing approach. Savings and Development, 449-469.
University of Ghana http://ugspace.ug.edu.gh
38
Appendix A: Unit Root Test
A1: Levels
Null Hypothesis: EXR has a unit root”
“Exogenous: Constant”
“Lag Length: 1 (Automatic - based on SIC, maxlag=2)”
t-Statistic Prob.*
“Augmented Dickey-Fuller test” statistic -0.148125 0.9692
Test critical values: 1% level -3.661663
5% level -2.960413
10% level -2.619161
*MacKinnon (1996) one-sided p-values.
“Null Hypothesis: INF has a unit root”
“Exogenous: Constant”
“Lag Length: 1 (Automatic - based on SIC, maxlag=2)”
t-Statistic Prob.*
“Augmented Dickey-Fuller test” statistic -2.105122 0.2424
Test critical values: 1% level -3.661661
5% level -2.960411
10% level -2.619160
*MacKinnon (1996) one-sided p-values.
“Null Hypothesis: GSE-ASI has a unit root”
“Exogenous: Constant”
“Lag Length: 1 (Automatic - based on SIC, maxlag=2)”
t-Statistic Prob.*
“Augmented Dickey-Fuller test” statistic -2.596122 0.0938
Test critical values: 1% level -3.661661
5% level -2.960411
10% level -2.619160
University of Ghana http://ugspace.ug.edu.gh
39
“Null Hypothesis: INT has a unit root”
“Exogenous: Constant”
“Lag Length: 1 (Automatic - based on SIC, maxlag=2)”
t-Statistic Prob.*
“Augmented Dickey-Fuller test” statistic -1.452177 0.5547
Test critical values: 1% level -3.661661
5% level -2.960411
10% level -2.619160
*MacKinnon (1996) one-sided p-values.
A2: First Difference
“Null Hypothesis: D(GSE-ASI) has a unit root”
“Exogenous: Constant”
“Lag Length: 1 (Automatic - based on SIC, maxlag=2)”
t-Statistic Prob.*
“Augmented Dickey-Fuller test” statistic -4.7102382 0.0001
Test critical values: 1% level -3.670170
5% level -2.963972
10% level -2.621007
*MacKinnon (1996) one-sided p-values.
“Null Hypothesis: D(EXR) has a unit root”
“Exogenous: Constant”
“Lag Length: 1 (Automatic - based on SIC, maxlag=2)”
t-Statistic Prob.*
“Augmented Dickey-Fuller test” statistic -5.021061 0.0000
Test critical values: 1% level -3.670171
5% level -2.963974
10% level -2.621006
*MacKinnon (1996) one-sided p-values.
University of Ghana http://ugspace.ug.edu.gh
40
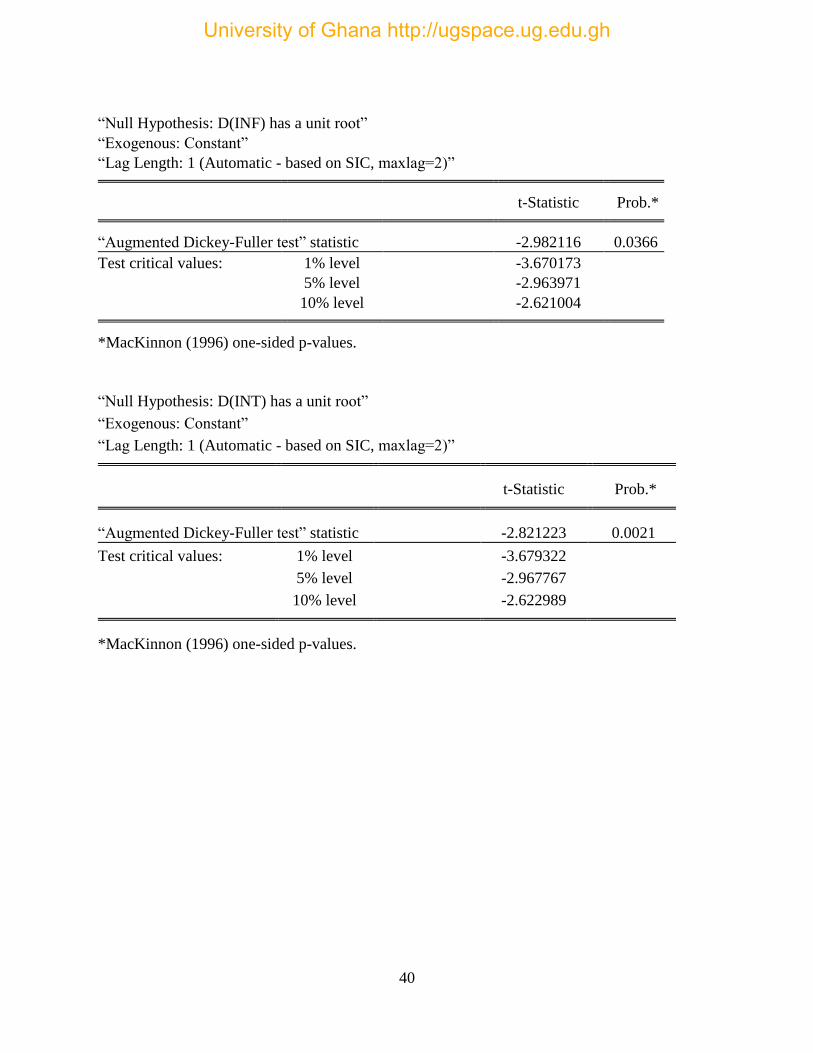
“Null Hypothesis: D(INF) has a unit root”
“Exogenous: Constant”
“Lag Length: 1 (Automatic - based on SIC, maxlag=2)”
t-Statistic Prob.*
“Augmented Dickey-Fuller test” statistic -2.982116 0.0366
Test critical values: 1% level -3.670173
5% level -2.963971
10% level -2.621004
*MacKinnon (1996) one-sided p-values.
“Null Hypothesis: D(INT) has a unit root”
“Exogenous: Constant”
“Lag Length: 1 (Automatic - based on SIC, maxlag=2)”
t-Statistic Prob.*
“Augmented Dickey-Fuller test” statistic -2.821223 0.0021
Test critical values: 1% level -3.679322
5% level -2.967767
10% level -2.622989
*MacKinnon (1996) one-sided p-values.
University of Ghana http://ugspace.ug.edu.gh
41
Appendix B: Diagnostic Tests Results
Appendix B1: Results of Serial Correlation Test
Breusch-Godfrey Serial Correlation LM Test:
F-statistic 2.604276 Prob. F(1,44) 0.1070
Obs*R-squared 6.625684 Prob. Chi-Square(1) 0.0341
Test Equation:
Dependent Variable: RESID
Method: Least Squares
Sample: 2008 2018
Included observations: 44
Pre-sample missing value lagged residuals set to zero.
Variable Coefficient Std. Error t-Statistic Prob.
GSE-ASI -0.598830 3.485388 -0.171811 0.8650
INF 10.44807 10.77452 0.969702 0.3415
EXR -17.85714 15.35591 -1.162884 0.2559
INT 26.19120 73.45421 0.356565 0.7244
RESID(-1) 0.576295 0.195943 2.941135 0.0070
R-squared 0.257053 Mean dependent var 0.565730
Adjusted R-squared 0.078745 S.D. dependent var 146.6139
S.E. of regression 140.7230 Akaike info criterion 12.92210
Sum squared resid 495073.7 Schwarz criterion 13.24273
Log likelihood -199.7537 Hannan-Quinn criter. 13.02838
Durbin-Watson stat 1.872985
University of Ghana http://ugspace.ug.edu.gh
42
B2: Results of Heteroskedasticity Test
Heteroskedasticity Test: ARCH
F-statistic 0.006925 Prob. F(1,44) 0.9343
Obs.*R-squared 0.007401 Prob. Chi-Square(1) 0.9314
Test Equation:
Dependent Variable: RESID^2
Method: Least Squares
Sample (adjusted): 2008 2018
Included observations: 44 after adjustments
Variable Coefficient Std. Error t-Statistic Prob.
C 21172.41 7413.511 2.855922 0.0079
RESID^2(-1) 0.015364 0.184619 0.083218 0.9343
R-squared 0.000239 Mean dependent var 21495.26
Adjusted R-squared -0.034236 S.D. dependent var 34586.57
S.E. of regression 35173.64 Akaike info criterion 23.83632
Sum squared resid 3.59E+10 Schwarz criterion 23.92884
Log likelihood -367.4630 Hannan-Quinn criter. 23.86648
F-statistic 0.006925 Durbin-Watson stat 2.007925
Prob(F-statistic) 0.934250
University of Ghana http://ugspace.ug.edu.gh
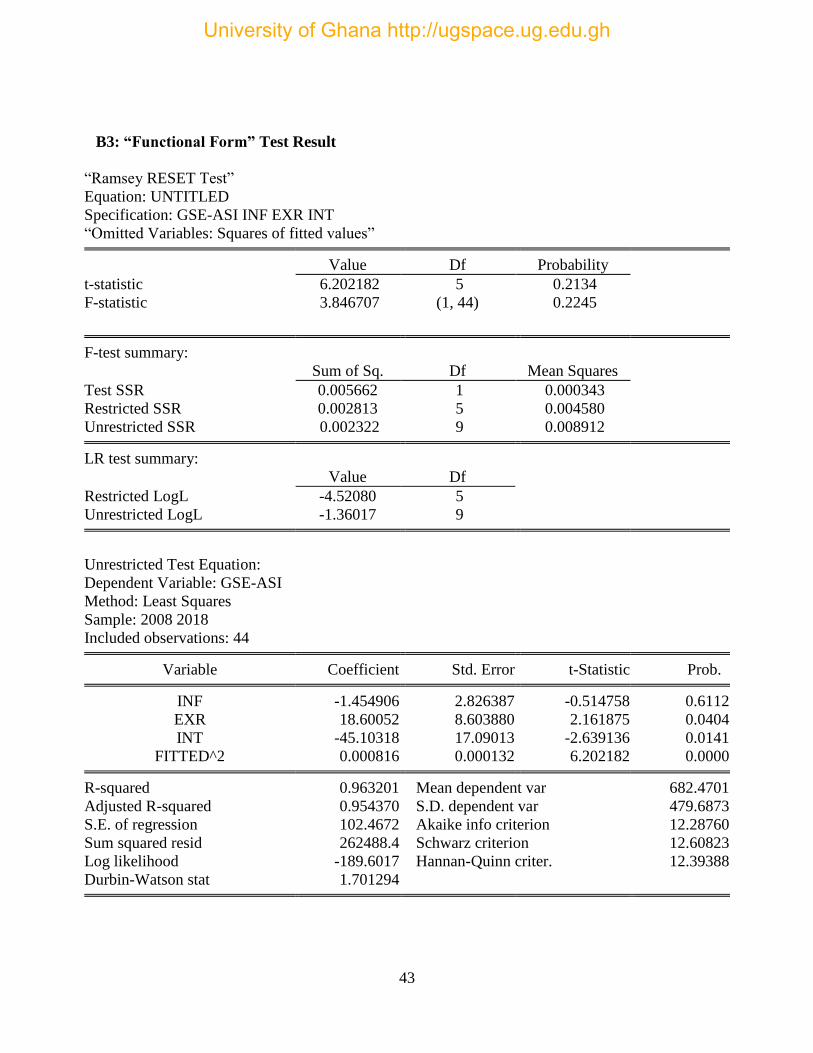
43
B3: “Functional Form” Test Result
“Ramsey RESET Test”
Equation: UNTITLED
Specification: GSE-ASI INF EXR INT
“Omitted Variables: Squares of fitted values”
Value Df Probability
t-statistic 6.202182 5 0.2134
F-statistic 3.846707 (1, 44) 0.2245
F-test summary:
Sum of Sq. Df Mean Squares
Test SSR 0.005662 1 0.000343
Restricted SSR 0.002813 5 0.004580
Unrestricted SSR 0.002322 9 0.008912
LR test summary:
Value Df
Restricted LogL -4.52080 5
Unrestricted LogL -1.36017 9
Unrestricted Test Equation:
Dependent Variable: GSE-ASI
Method: Least Squares
Sample: 2008 2018
Included observations: 44
Variable Coefficient Std. Error t-Statistic Prob.
INF -1.454906 2.826387 -0.514758 0.6112
EXR 18.60052 8.603880 2.161875 0.0404
INT -45.10318 17.09013 -2.639136 0.0141
FITTED^2 0.000816 0.000132 6.202182 0.0000
R-squared 0.963201 Mean dependent var 682.4701
Adjusted R-squared 0.954370 S.D. dependent var 479.6873
S.E. of regression 102.4672 Akaike info criterion 12.28760
Sum squared resid 262488.4 Schwarz criterion 12.60823
Log likelihood -189.6017 Hannan-Quinn criter. 12.39388
Durbin-Watson stat 1.701294
University of Ghana http://ugspace.ug.edu.gh