the effect of fatty acid surfactants on the uptake of
TRANSCRIPT
Atmos. Chem. Phys., 10, 11489–11500, 2010www.atmos-chem-phys.net/10/11489/2010/doi:10.5194/acp-10-11489-2010© Author(s) 2010. CC Attribution 3.0 License.
AtmosphericChemistry
and Physics
The effect of fatty acid surfactants on the uptake of ozone toaqueous halogenide particles
A. Rouviere and M. Ammann
Laboratory for Radio and Environmental Chemistry, Paul Scherrer Institut, 5232 Villigen, Switzerland
Received: 8 June 2010 – Published in Atmos. Chem. Phys. Discuss.: 21 June 2010Revised: 26 October 2010 – Accepted: 23 November 2010 – Published: 3 December 2010
Abstract. The reactive uptake of ozone to deliquesced potas-sium iodide aerosol particles coated with linear saturatedfatty acids (C9, C12, C15, C18 and C20) was studied. Theexperiments were performed in an aerosol flow tube at 293K and atmospheric pressure. The uptake coefficient on puredeliquesced KI aerosol wasγ = (1.10±0.20)×10−2 at 72–75% relative humidity. In presence of organic coatings, theuptake coefficient decreased significantly for long straightchain surfactants (≥C15), while it was only slightly reducedfor the short ones (C9, C12). We linked the kinetic results tothe monolayer properties of the surfactants, and specificallyto the expected phase state of the monolayer formed (liquidexpanded or liquid condensed state). The results showed adecrease of the uptake coefficient by 30% for C12, 85% forC15 and 50% for C18 in presence of a monolayer of a fattyacid at the equilibrium spreading pressure at the air/water in-terface. The variation among C12, C15 and C18 follows thedensity of the monolayer at equilibrium spreading pressure,which is highest for the C15 fatty acid. We also investigatedthe effect of organic films to mixed deliquesced aerosol com-posed of a variable mixture of KI and NaCl, which alloweddetermining the resistance exerted to O3 at the aqueous sur-face by the two longer chained surfactants pentadecanoicacid (C15) and stearic acid (C18). For these, the probabil-ity that a molecule hitting the surface is actually transferredto the aqueous phase underneath wasβC15 = 6.8×10⁻⁴ andβC18 = 3.3×10⁻⁴, respectively. Finally, the effect of two-component coatings, consisting of a mixture of long andshort chained surfactants, was studied qualitatively.
Correspondence to:M. Ammann([email protected])
1 Introduction
Atmospheric aerosols contain a complex mixture of inor-ganic and organic compounds. It has been determined thatorganic species represent a significant percentage (20–90%)of the total mass fraction of the submicron aerosol varyingwith source and location (Zhang et al., 2007; Day et al.,2009; Kanakidou et al., 2004; O’Dowd et al., 2004; Putaudet al., 2004).
Fatty acids come from both anthropogenic (cooking, com-bustion, traffic emission) and biogenic sources (forests,plants, marine biota, biomass burning) (Cheng et al., 2004;Hou et al., 2006; Huang et al., 2006; Pio et al., 2001; Robin-son et al., 2006; Schauer et al., 2001; Simoneit and Mazurek,2007). They are known to act as surfactants in the atmo-sphere (Rudich, 2003; Ellison et al., 1999; Gill et al., 1983).Especially the C12-C19 straight chain fatty acids contributecontribute significantly to the organic coating of sea salt par-ticles (Cavalli et al., 2004; Mochida et al., 2002, 2007; Ter-vahattu et al., 2002a, b, 2005). Tervahattu et al. (2002),have provided evidence that fatty acids are actually locatedat the surface of sea salt particles. We note, however, thatfatty acids form only part of organic matter found in ma-rine aerosol, which consists of a wide range of carbohy-drates, protein residues, lipids (Facchini et al., 2008; Alleret al., 2005; Kuznetsova et al., 2005; Leck and Bigg, 2005;O’Dowd et al., 2004).
Recently, several studies have focused on the influence oforganic surfactant films at the air/water interface in orderto determine their impact on atmospheric chemistry (Don-aldson and Vaida, 2006; Smoydzin and von Glasow, 2007;Gilman et al., 2006). It turns out that an important aspectof organic coatings may be that they reduce the mass trans-fer between the gas and particle phases. Organic coatings onaqueous aerosol particles can also affect the process of CCNformation and growth (Andrews and Larson, 1993; Chuang,2003; Chan and Chan, 2005). In view of its importance to
Published by Copernicus Publications on behalf of the European Geosciences Union.
11490 A. Rouviere and M. Ammann: Effect of fatty acids on O3 uptake
the ozone and halogen budgets in the marine boundary layer,several studies have focused on the reactive uptake of N2O5and have shown a decrease of the reactive uptake of N2O5in presence of monolayers surfactants (Badger et al., 2006;Cosman and Bertram, 2008; Cosman et al., 2008; Knopf etal., 2007; McNeill et al., 2006; McNeill et al., 2007; Parket al., 2007; Riemer et al., 2009; Stewart et al., 2004). Forexample Thornton and Abbatt (2005) demonstrated that thepresence of a monolayer of hexanoic acid inhibits N2O5 up-take by a factor of 3 to 4 on deliquesced sea salt aerosol.McNeill et al (2006) found that the presence of sodium dode-cyl sulfate (SDS) decreases the N2O5 reaction probability ondeliquesced NaCl particles. Stemmler et al. (2008) studiedthe effect of surfactants on the uptake of nitric acid HNO3to deliquesced NaCl aerosol. They showed that the uptakecoefficient was reduced by a factor of 5–50 when the aerosolwas coated with fatty acids. The effect was most pronouncedwith pentadecanoic acid and stearic acid, which they ascribedto the ability of these fatty acids to spontaneously form rel-atively well ordered, dense films. This indicates the impor-tance of the surface phase state of surfactants in determin-ing the phase transfer properties, an observation also made inconjunction with N2O5 uptake (Bertram and Thornton, 2009;Knopf et al., 2007) and with acetic acid uptake (Gilman andVaida, 2006).
However organic coatings can also promote the phasetransfer. Experiments by Glass et al. (2006), Burden etal. (2009) and Park et al. (2009) have shown that solublesurfactants such as butanol or hexanol can enhance the up-take of HCl into sulfuric acid through specific interactions ofthe alcohol head groups with chloride ions. Many uncertain-ties remain with respect to the structure and the phase stateof surfactant films on atmospheric particles and the changesto the properties of the aqueous surface and to what degreethese properties affect the transfer of trace gases from thegas to the liquid phase. One way to explore these is to extendthe range of gas molecules to a less soluble species, one ofthe motivations to study the reactive uptake of ozone to del-iquesced KI and mixed NaCl/KI particles coated with fattyacids.
So far, the effect of surfactant layers on the phase transferof O3 to deliquesced aerosols has not been investigated. Re-cently, the heterogeneous reaction of ozone with aqueous io-dide has been studied in presence of aqueous organic speciessuch as phenols (Hayase et al., 2010), where, however, phe-nols interacted with ozone as a competing reactant ratherthan as inhibitor of phase transfer. Studies of ozone reactingwith oleate covered deliquesced NaCl particles (McNeill etal., 2007) were related to the reaction with the double bond atthe surface in contrast to similar studies with pure oleic par-ticles (Smith et al., 2002; Zahardis and Petrucci, 2007) andnot of direct relevance to the present investigation focusingon the transfer across a layer of saturated fatty acids. Re-cently, we studied the reactive uptake of O3 to deliquescedpotassium iodide and mixed sodium chloride/potassium io-
dide aerosol particles (Rouviere et al., 2010). From theseresults, we obtained an average initial uptake coefficient ofγ
= (1.10±0.20)×10−2 and a bulk accommodation coefficientof αb = 0.6±
0.40.5. Iodide provides a substantial aqueous phase
sink to drive uptake of ozone and is thus ideally suited for thepresent investigation. This reaction is also important in halo-gen activation processes of the marine boundary layer, as itmay initiate halogen activation (Enami et al., 2008). Of somerelevance to the present study is the fact that surfactants mayaffect the interfacial distribution of halogenide ions near theinterface (Tobias and Hemminger, 2008; Krisch et al., 2007;Latif and Brimblecombe, 2004).
Even though the fatty acids chosen for the present study donot represent the breadth of organic species present in marineaerosol, they form reasonably well characterized monolay-ers with predictable properties (Seidl, 2000, and referencestherein). Once in contact with an aqueous solution, theyreadily spread over the solution air interface with spread-ing rates in the seconds range for spatial scales of submicronparticles (Tabazadeh, 2005). Therefore, they form an idealmodel system for the present investigation.
2 Experimental section
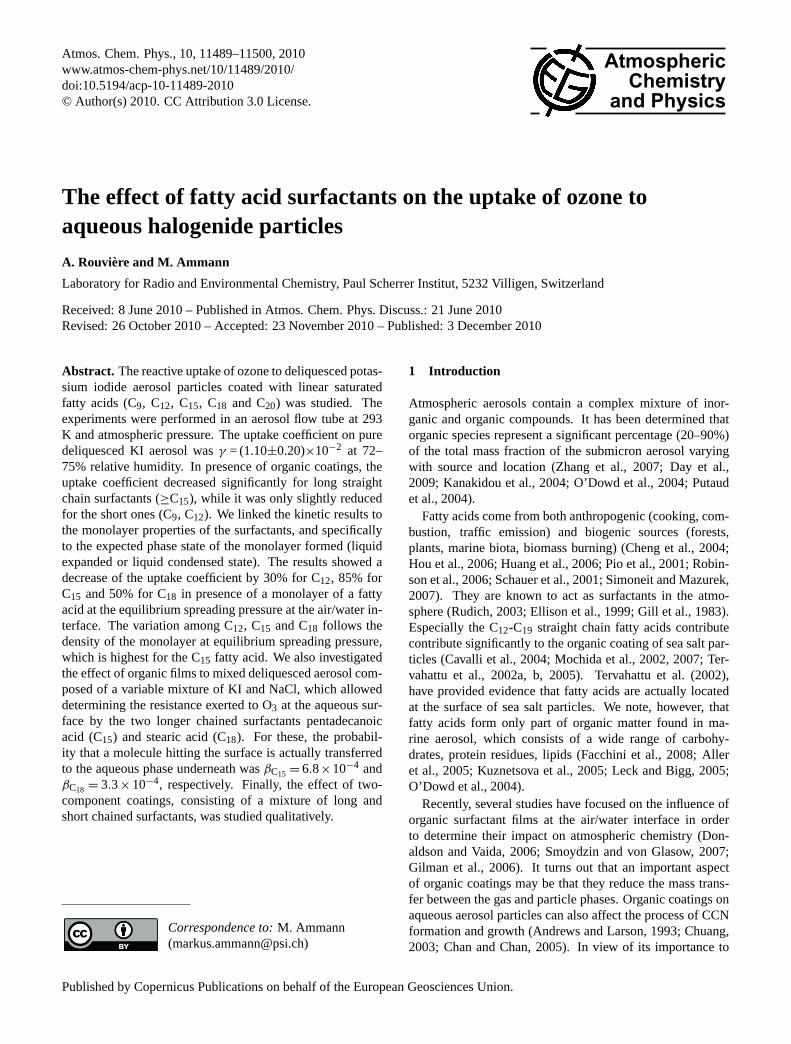
A schematic representation of the experimental setup is givenin Fig. 1, which has been described in detail by Rouviere etal. (2010). Potassium iodide particles were produced by neb-ulising an aqueous solution containing 5 g/L of potassium io-dide salt into 5 L/min dry N2. The aerosol particles emittedwere dried in a silica gel diffusion dryer, exposed to a bipo-lar ion source (85Kr) to obtain an equilibrium charge distri-bution and then passed through an electrostatic precipitatorto remove all charged particles. For hygroscopic characteri-zation experiments and to quantify the amount of fatty acidcondensed on the particles (see below), a first DMA (Differ-ential Mobility Analyzer) could be placed after the ion sourceto obtain a monodispersed aerosol. O3 uptake experimentswere performed with the polydispersed aerosol without thisDMA in line, since the surface area and liquid volume ofthe monodispersed aerosol would not be enough to lead toappreciable ozone losses in the reactor. The aerosol was hu-midified to 75% RH (above the deliquescence humidity ofKI of 67%; Woods et al., 2007). After humidification, KIparticles passed through an equilibrium reactor to allow theparticles to grow (residence time about 1 min). A growth fac-tor of 1.3 was obtained in absence of coating (Rouviere et al,2010) at the same RH, which proves that the particles weredeliquesced. Under the conditions of the present experimentsthus a pure aqueous KI aerosol contained around 7.3 M KI.Ozone was generated by irradiating a flow of a mixture ofO2 and N2 in a quartz tube with an ultra-violet lamp (Pen-Ray 3SC-9, UV Products Ltd., USA), which has a resonanceline at a wavelength of 185 nm. Then the O3/O2/N2 flowwas introduced to the aerosol flow tube through a movable
Atmos. Chem. Phys., 10, 11489–11500, 2010 www.atmos-chem-phys.net/10/11489/2010/
A. Rouviere and M. Ammann: Effect of fatty acids on O3 uptake 11491
30
Figure 1. Fig. 1. Overview of the experimental setup.
injector and diluted by the aerosol flow or N2 (ratio 1/1). Inabsence of particles, the ozone concentration in the reactorwas normally 90 ppb. The aerosol flow tube reactor was apyrex tube, 85 cm long, with an inner diameter of 2.5 cm.The ozone injector, which was kept in the center of the flowtube by means of three PFA legs, could be moved to varythe reaction time from 2 to 25 s to obtain kinetic informa-tion. After the reactor, the aerosol surface concentration wasmeasured with a Scanning Mobility Particle Sizer (SMPS)consisting of a DMA (3071, TSI) and a condensation parti-cle counter (CPC, 3022, TSI, USA) collecting the aerosols atthe exit of the flow tube. Typical particle number, surface andmass concentrations of the polydispersed aerosol in absenceof fatty acids were 5×10⁵ particles/cm3, 1.6×10⁻⁴ cm2/cm3,and 1000 µg/m3, respectively. The concentration of ozonewas measured with a photometric ozone analyzer (model ML9810, Monitor Labs Inc, USA) after separating ozone fromthe particles by diffusion in an annular coflow device. Thisseparation was necessary, because the aerosol interferes withthe photometric ozone detection due to scattering and absorp-tion (see Rouviere et al., 2010, for more details).
In order to investigate the effects of the surfactants on theozone uptake, varying amounts of a specific fatty acid werecondensed on the dry particles. Straight chain C9-C20 fattyacids (FA) were used in the experiments. The effectivenessof the surfactant coatings will be related to their properties,as provided in Gabler and Heumann (1993). The proce-dure to get a reproducible amount of fatty acid on the par-ticles has already been described by Stemmler et al. (2008).An organic vapor was generated by heating 0.5 g of surfac-tant in a temperature controlled reservoir. The coating tookplace after removing charged particles from the aerosol flowand before their humidification (Fig. 1). The aerosol flowpassed over the reservoir through the heated zone and therebygot into contact with the surfactant vapor. In the condensertube downstream of the warm zone, the gas gradually cooledand the vapor condensed onto the surface of the particles.The amount of fatty acid condensed on the particles wascontrolled by changing the evaporator temperature. In or-der to calibrate the size change with evaporator temperature,we switched the additional DMA mentioned above into theaerosol flow to obtain monodispersed particles. For the ex-
31
0 50 100 150 200 2500
1x10⁴
2x10⁴
3x10⁴
4x10⁴
5x10⁴
6x10⁴
Par
ticle
s nu
mbe
r
Particles diameter
without coating T=30°C T=40°C T=50°C T=55°C T=60°C T=65°C T=68°C T=72°C T=75°C T=80°C T=85°C T=87°C
20 30 40 50 60 70 80 90 1000.0
0.2
0.4
0.6
0.8
1.0
20 30 40 50 60 70 80 90 1000.0
0.1
0.2
0.3
0.4
0.5
0.6
0.7
0.8
0.9
1.0
20 30 40 50 60 70 80 90 1000.0
0.2
0.4
0.6
0.8
1.0
20 30 40 50 60 70 80 90 1000.0
0.2
0.4
0.6
0.8
1.0
20 30 40 50 60 70 80 90 1000.0
0.2
0.4
0.6
0.8
1.0
mas
s ra
tio o
f su
rfac
tant
s
T (°C)
Figure 2(a) and 2(b).
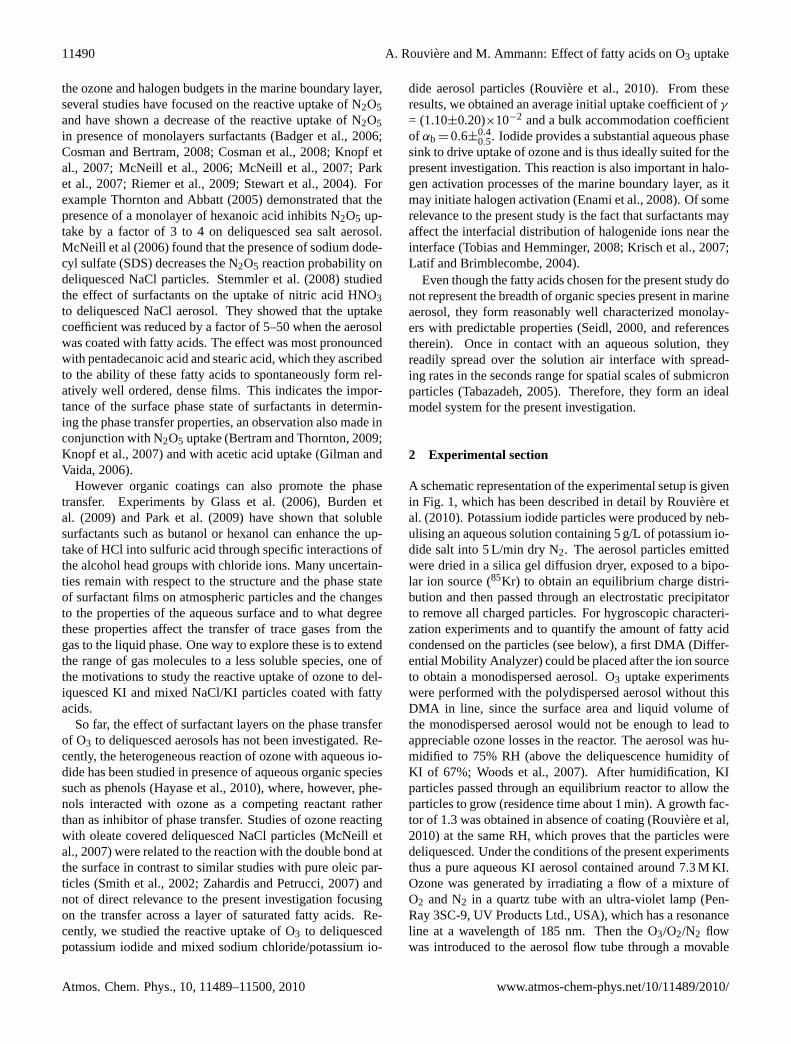
Fig. 2. (a)Particle size distributions of a monodisperse dry aerosol(KI) exposed to lauric acid (C12) in the evaporator at different tem-peratures.(b) Evolution of the mass ratio of surfactants as a func-tion of the evaporator temperature (black crosses: C9, red circles:C12, green triangles: C15, blue squares: C18 and turquoise dia-monds: C20). The solid lines are only guides to the eye.
ample of lauric acid, Fig. 2a demonstrates the increasing par-ticle size of monodispersed KI particles (selected at the modediameter of the polydispersed particle size spectrum) coatedwith increasing amounts of lauric acid (C12) with increasingevaporator temperature. Since the particles were charged toequilibrium with the bipolar ion source, there was always afraction of doubly and triply charged particles, which appearas separate modes after subsequent neutralization and sepa-ration with the second DMA. This is not of further impor-tance, since we only used these measurements to obtain thediameter change due to the organic added. We used the mainmode for this analysis only. The mass ratio of surfactant wasderived from the associated change in particle volume foreach temperature. The volume of fatty acid (VFA) was ob-tained from the difference of the volume of coated particles(VKI+FA) calculated from the corresponding measured diam-eter (Dc) and the volume of the dry particles with diameterD0(VKI ). Using the densities of KI and the fatty acid of inter-est, respectively, we determined the mass ratio of fatty acid(mFA)/(mFA +mKI ). The procedure with the monodispersedaerosol was only used to calibrate the size change with evap-orator temperature more precisely than with the polydisperseaerosol. For the larger organic mass ratios, we could confirmthat the size changes due to the coating measured with the
www.atmos-chem-phys.net/10/11489/2010/ Atmos. Chem. Phys., 10, 11489–11500, 2010
11492 A. Rouviere and M. Ammann: Effect of fatty acids on O3 uptake
polydispersed aerosol were always consistent with the moreprecise calibration using monodispersed particles.
The mass ratios obtained for C9, C12, C15, C18 and C20as a function of the temperature of the evaporator are shownin Fig. 2b. We do not know whether the organics formed ahomogeneous coating on the dry particles or condensed as aseparate droplet or crystal attached to the particle. We there-fore associate a significant uncertainty with these values, aswe do not take into account any shape effects. It serves rea-sonably well to compare among the different fatty acids.
Once the particles were coated they were passing throughthe humidifier and the equilibration reactor to allow them todeliquesce and the organic monolayers to develop. The ex-perimental procedure of the uptake experiments always in-volved first measuring the size distribution of the dry un-coated particles, then that of the dry coated and finally thatof the coated deliquesced particles as they exited the flow re-actor. This allowed routinely checking the diameter growthdue to the humidity change, which was always consistentwith the growth observed in absence of fatty acids. Once afatty acid (liquid for C9 or solid otherwise) is in contact withthe aqueous phase after deliquescence, fatty acid moleculesstart to dissolve from its bulk into the surface and spread intoa monolayer. Aumann and Tabazadeh (2008) report directmeasurements of the spreading rates of crystalline stearicacid over different solutions at room temperature and haveshown that spreading times over the scales of submicron par-ticles are at maximum of the order of a few seconds. In afew own qualitative experiments with bulk solutions in a petridish comparable to those by Aumann and Tabazadeh (2008),we have observed that the C12 and C15 fatty acids spreadeven faster than the C18. Therefore, the residence time of oneminute in our equilibration reactor safely allowed the mono-layers to spread to form a layer on the particle with homoge-neous density. In presence of an excess of the fatty acid, thedensity increases until the so called equilibrium spreadingpressure (see below) is reached, eventually passing through aphase transition before that. The excess remains as is or mayalso restructure into a lens on the surface. The only assertionswe are making are that the fatty acids homogeneously spreadover the deliquesced particle, and, in presence of an excess offatty acid, the monolayer reaches the density correspondingto the equilibrium spreading pressure with a separate bulkphase remaining attached to the droplet.
3 Assessment of monolayer properties
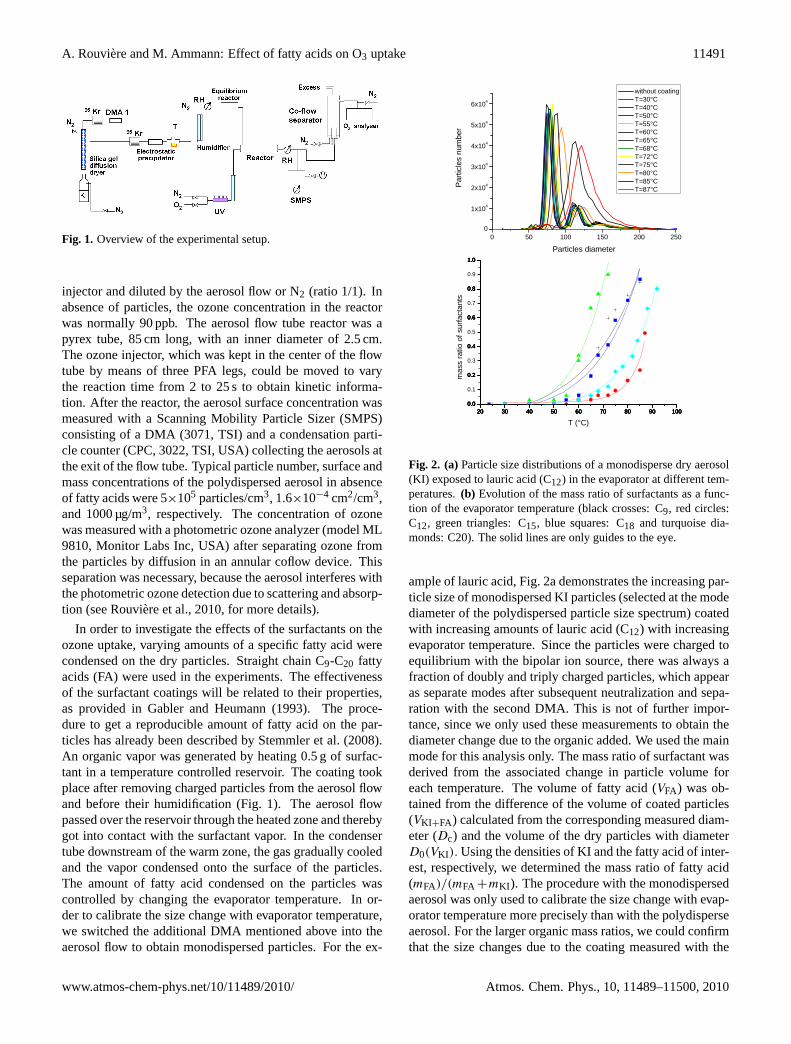
The monolayer properties of the fatty acids of interest herewere explored using the model developed by Seidl (2000).These monomolecular films can exist in three different states:gaseous, expanded and condensed liquid state. The corre-spondingπ -A isotherms are shown in Fig. 3a, where thefilm pressure is represented as a function of the area permolecule. This figure indicates also two essential values for
32
20 25 30 35 40 45 500
5
10
15
20
25
30
35
40
45
50
Film
pre
ssur
e (
mN
/m)
Area per molecule (Å2)
40 45 50 55 60 65 70 75 80 85 90 95-10
0
10
20
30
40
50
60
70
80
Are
a p
er m
ole
cule
(Å
2 )
T(°C)
Figure 3(a) and 3(b).
32
20 25 30 35 40 45 500
5
10
15
20
25
30
35
40
45
50
Film
pre
ssur
e (
mN
/m)
Area per molecule (Å2)
40 45 50 55 60 65 70 75 80 85 90 95-10
0
10
20
30
40
50
60
70
80
Are
a p
er m
ole
cule
(Å
2 )
T(°C)
Figure 3(a) and 3(b).
Fig. 3. (a). π -A isotherms of lauric acid (red line), pentade-canoic acid (green line), stearic acid (blue line) and arachidic acid(turquoise line), according to the model of Seidl (2000). Thecrosses represent the Equilibrium spreading Pressure of an excessbulk phase of the individual fatty acids and the circles illustrate thephase transition film pressure between the expanded and condensedphases.(b). Area per molecule of the fatty acids as a function of theevaporator temperature (black crosses: C9, red circles: C12, greentriangles: C15, blue squares: C18 and turquoise diamonds: C20) ascalculated from the particle growth measurements. The solid linesindicate the expected behavior of the true area per molecule to takeinto account that the monolayers cannot spontaneously get morecompressed than the equilibrium spreading pressure.
the π -A isotherms that are the location of the phase transi-tion from the expanded to the condensed liquid phase state(Fj, expressed as the film pressure, where the phase transi-tion occurs) and the Equilibrium Spreading Pressure (ESP).The ESP is defined as the pressure of the film in equilibriumwith its bulk phase. It may be compared to the solubility ofa compound in solution as the 3-D analogue in that if moreof this compound is available than given by the solubilityand the volume of solution, the excess salt remains as a bulkphase in equilibrium with the solution. Compounds exhibit-ing an ESP> mN/m spread spontaneously over the aqueoussurface. Data concerning Fj and ESP are also reported inTable 1. We assume that if we have deposited fatty acidsin amounts more than the equivalent of the correspondingmonolayer at the ESP on the wet particles, the phase state ofthis monolayer is given by the ESP, while the rest remainsas excess solid or liquid fatty acid attached to the aqueous
Atmos. Chem. Phys., 10, 11489–11500, 2010 www.atmos-chem-phys.net/10/11489/2010/
A. Rouviere and M. Ammann: Effect of fatty acids on O3 uptake 11493
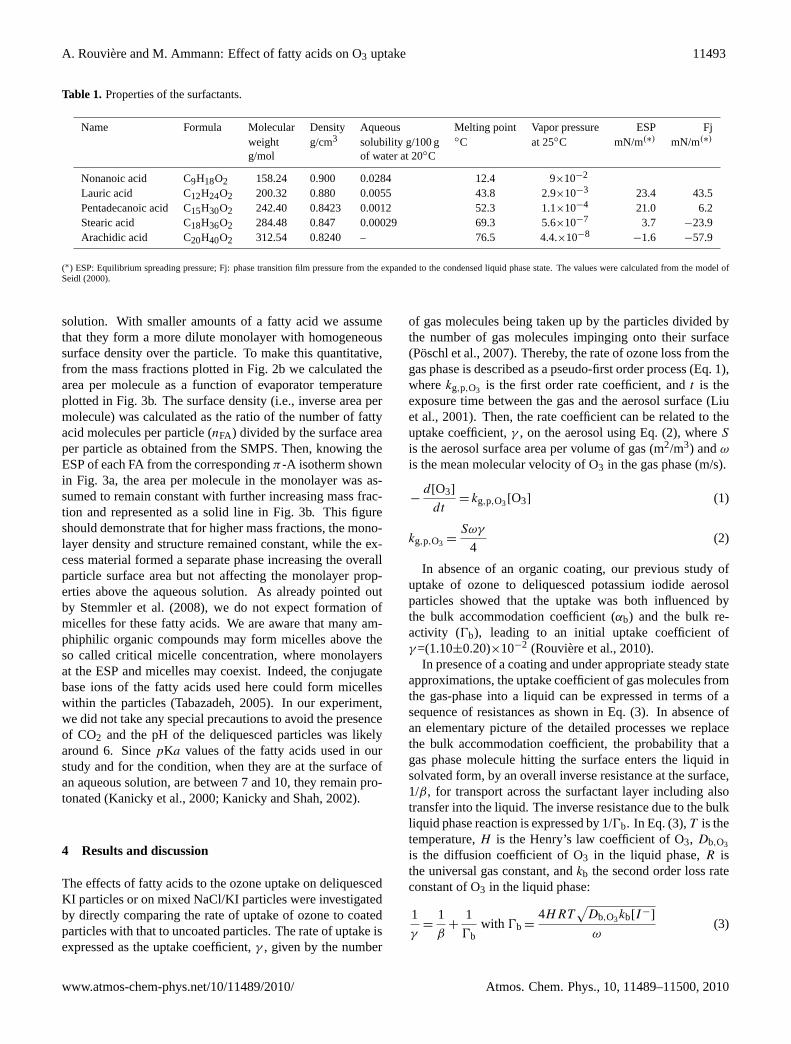
Table 1. Properties of the surfactants.
Name Formula Molecular Density Aqueous Melting point Vapor pressure ESP Fjweight g/cm3 solubility g/100 g ◦C at 25◦C mN/m(∗) mN/m(∗)
g/mol of water at 20◦C
Nonanoic acid C9H18O2 158.24 0.900 0.0284 12.4 9×10⁻²
Lauric acid C12H24O2 200.32 0.880 0.0055 43.8 2.9×10⁻³ 23.4 43.5Pentadecanoic acid C15H30O2 242.40 0.8423 0.0012 52.3 1.1×10⁻⁴ 21.0 6.2Stearic acid C18H36O2 284.48 0.847 0.00029 69.3 5.6×10⁻⁷ 3.7 −23.9Arachidic acid C20H40O2 312.54 0.8240 – 76.5 4.4.×10−8
−1.6 −57.9
(∗) ESP: Equilibrium spreading pressure; Fj: phase transition film pressure from the expanded to the condensed liquid phase state. The values were calculated from the model ofSeidl (2000).
solution. With smaller amounts of a fatty acid we assumethat they form a more dilute monolayer with homogeneoussurface density over the particle. To make this quantitative,from the mass fractions plotted in Fig. 2b we calculated thearea per molecule as a function of evaporator temperatureplotted in Fig. 3b. The surface density (i.e., inverse area permolecule) was calculated as the ratio of the number of fattyacid molecules per particle (nFA) divided by the surface areaper particle as obtained from the SMPS. Then, knowing theESP of each FA from the correspondingπ -A isotherm shownin Fig. 3a, the area per molecule in the monolayer was as-sumed to remain constant with further increasing mass frac-tion and represented as a solid line in Fig. 3b. This figureshould demonstrate that for higher mass fractions, the mono-layer density and structure remained constant, while the ex-cess material formed a separate phase increasing the overallparticle surface area but not affecting the monolayer prop-erties above the aqueous solution. As already pointed outby Stemmler et al. (2008), we do not expect formation ofmicelles for these fatty acids. We are aware that many am-phiphilic organic compounds may form micelles above theso called critical micelle concentration, where monolayersat the ESP and micelles may coexist. Indeed, the conjugatebase ions of the fatty acids used here could form micelleswithin the particles (Tabazadeh, 2005). In our experiment,we did not take any special precautions to avoid the presenceof CO2 and the pH of the deliquesced particles was likelyaround 6. SincepKa values of the fatty acids used in ourstudy and for the condition, when they are at the surface ofan aqueous solution, are between 7 and 10, they remain pro-tonated (Kanicky et al., 2000; Kanicky and Shah, 2002).
4 Results and discussion
The effects of fatty acids to the ozone uptake on deliquescedKI particles or on mixed NaCl/KI particles were investigatedby directly comparing the rate of uptake of ozone to coatedparticles with that to uncoated particles. The rate of uptake isexpressed as the uptake coefficient,γ , given by the number
of gas molecules being taken up by the particles divided bythe number of gas molecules impinging onto their surface(Poschl et al., 2007). Thereby, the rate of ozone loss from thegas phase is described as a pseudo-first order process (Eq. 1),wherekg,p,O3 is the first order rate coefficient, andt is theexposure time between the gas and the aerosol surface (Liuet al., 2001). Then, the rate coefficient can be related to theuptake coefficient,γ , on the aerosol using Eq. (2), whereS
is the aerosol surface area per volume of gas (m2/m3) andω
is the mean molecular velocity of O3 in the gas phase (m/s).
−d[O3]
dt= kg,p,O3[O3] (1)
kg,p,O3 =Sωγ
4(2)
In absence of an organic coating, our previous study ofuptake of ozone to deliquesced potassium iodide aerosolparticles showed that the uptake was both influenced bythe bulk accommodation coefficient (αb) and the bulk re-activity (0b), leading to an initial uptake coefficient ofγ =(1.10±0.20)×10−2 (Rouviere et al., 2010).
In presence of a coating and under appropriate steady stateapproximations, the uptake coefficient of gas molecules fromthe gas-phase into a liquid can be expressed in terms of asequence of resistances as shown in Eq. (3). In absence ofan elementary picture of the detailed processes we replacethe bulk accommodation coefficient, the probability that agas phase molecule hitting the surface enters the liquid insolvated form, by an overall inverse resistance at the surface,1/β, for transport across the surfactant layer including alsotransfer into the liquid. The inverse resistance due to the bulkliquid phase reaction is expressed by 1/0b. In Eq. (3),T is thetemperature,H is the Henry’s law coefficient of O3, Db,O3
is the diffusion coefficient of O3 in the liquid phase,R isthe universal gas constant, andkb the second order loss rateconstant of O3 in the liquid phase:
1
γ=
1
β+
1
0bwith 0b =
4HRT√
Db,O3kb[I−]
ω(3)
www.atmos-chem-phys.net/10/11489/2010/ Atmos. Chem. Phys., 10, 11489–11500, 2010
11494 A. Rouviere and M. Ammann: Effect of fatty acids on O3 uptake
33
09:17:26 10:44:11 12:07:46 13:31:20 14:54:59 16:18:38
1.00E+012
1.50E+012
2.00E+012
2.50E+012
(l)
(k)(j)
(i)(h)
(g)
(f)(e)
(d)(c)(b)
[O3]
(mol
ecul
es/c
m3 )
Time
(a)
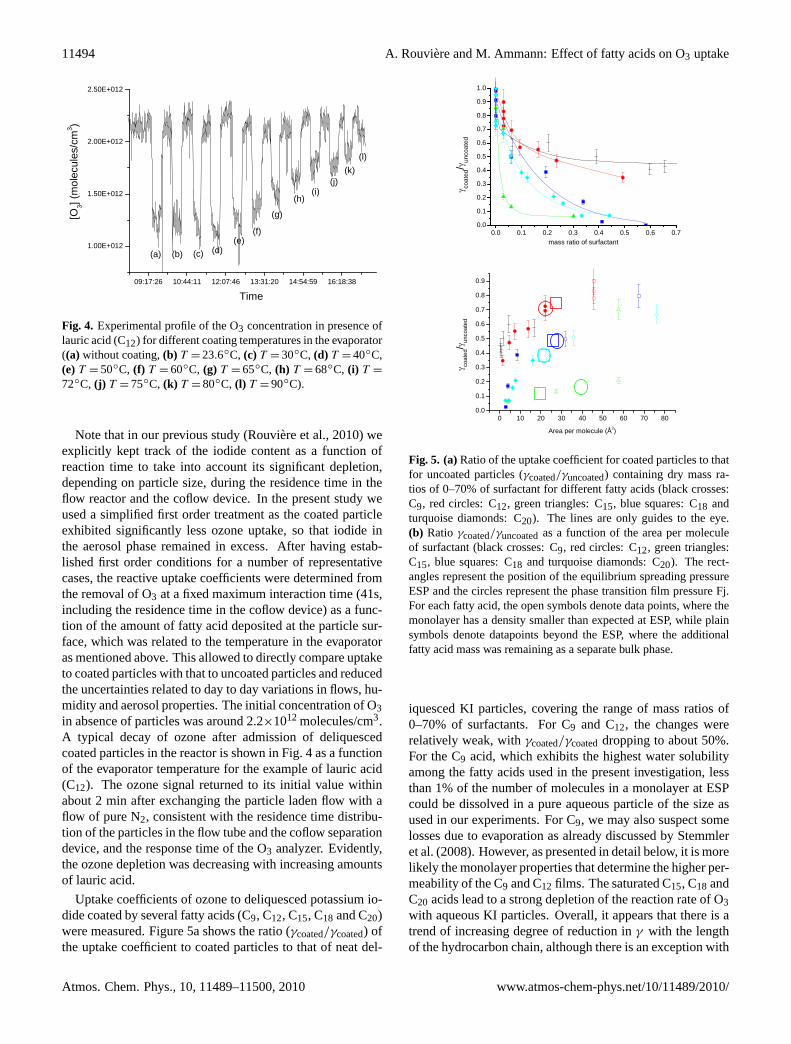
Figure 4. Fig. 4. Experimental profile of the O3 concentration in presence oflauric acid (C12) for different coating temperatures in the evaporator((a) without coating,(b) T = 23.6◦C, (c) T = 30◦C, (d) T = 40◦C,(e) T = 50◦C, (f) T = 60◦C, (g) T = 65◦C, (h) T = 68◦C, (i) T =
72◦C, (j) T = 75◦C, (k) T = 80◦C, (l) T = 90◦C).
Note that in our previous study (Rouviere et al., 2010) weexplicitly kept track of the iodide content as a function ofreaction time to take into account its significant depletion,depending on particle size, during the residence time in theflow reactor and the coflow device. In the present study weused a simplified first order treatment as the coated particleexhibited significantly less ozone uptake, so that iodide inthe aerosol phase remained in excess. After having estab-lished first order conditions for a number of representativecases, the reactive uptake coefficients were determined fromthe removal of O3 at a fixed maximum interaction time (41s,including the residence time in the coflow device) as a func-tion of the amount of fatty acid deposited at the particle sur-face, which was related to the temperature in the evaporatoras mentioned above. This allowed to directly compare uptaketo coated particles with that to uncoated particles and reducedthe uncertainties related to day to day variations in flows, hu-midity and aerosol properties. The initial concentration of O3in absence of particles was around 2.2×10¹² molecules/cm3.A typical decay of ozone after admission of deliquescedcoated particles in the reactor is shown in Fig. 4 as a functionof the evaporator temperature for the example of lauric acid(C12). The ozone signal returned to its initial value withinabout 2 min after exchanging the particle laden flow with aflow of pure N2, consistent with the residence time distribu-tion of the particles in the flow tube and the coflow separationdevice, and the response time of the O3 analyzer. Evidently,the ozone depletion was decreasing with increasing amountsof lauric acid.
Uptake coefficients of ozone to deliquesced potassium io-dide coated by several fatty acids (C9, C12, C15, C18 and C20)were measured. Figure 5a shows the ratio (γcoated/γcoated) ofthe uptake coefficient to coated particles to that of neat del-
34
0.0 0.1 0.2 0.3 0.4 0.5 0.6 0.70.0
0.1
0.2
0.3
0.4
0.5
0.6
0.7
0.8
0.9
1.0
coat
ed/
unco
ated
mass ratio of surfactant
0 10 20 30 40 50 60 70 800.0
0.1
0.2
0.3
0.4
0.5
0.6
0.7
0.8
0.9
coat
ed/
unco
ate
d
Area per molecule (Å2)
Figure 5(a) and 5(b).Fig. 5. (a)Ratio of the uptake coefficient for coated particles to thatfor uncoated particles (γcoated/γuncoated) containing dry mass ra-tios of 0–70% of surfactant for different fatty acids (black crosses:C9, red circles: C12, green triangles: C15, blue squares: C18 andturquoise diamonds: C20). The lines are only guides to the eye.(b) Ratio γcoated/γuncoatedas a function of the area per moleculeof surfactant (black crosses: C9, red circles: C12, green triangles:C15, blue squares: C18 and turquoise diamonds: C20). The rect-angles represent the position of the equilibrium spreading pressureESP and the circles represent the phase transition film pressure Fj.For each fatty acid, the open symbols denote data points, where themonolayer has a density smaller than expected at ESP, while plainsymbols denote datapoints beyond the ESP, where the additionalfatty acid mass was remaining as a separate bulk phase.
iquesced KI particles, covering the range of mass ratios of0–70% of surfactants. For C9 and C12, the changes wererelatively weak, withγcoated/γcoateddropping to about 50%.For the C9 acid, which exhibits the highest water solubilityamong the fatty acids used in the present investigation, lessthan 1% of the number of molecules in a monolayer at ESPcould be dissolved in a pure aqueous particle of the size asused in our experiments. For C9, we may also suspect somelosses due to evaporation as already discussed by Stemmleret al. (2008). However, as presented in detail below, it is morelikely the monolayer properties that determine the higher per-meability of the C9 and C12 films. The saturated C15, C18 andC20 acids lead to a strong depletion of the reaction rate of O3with aqueous KI particles. Overall, it appears that there is atrend of increasing degree of reduction inγ with the lengthof the hydrocarbon chain, although there is an exception with
Atmos. Chem. Phys., 10, 11489–11500, 2010 www.atmos-chem-phys.net/10/11489/2010/
A. Rouviere and M. Ammann: Effect of fatty acids on O3 uptake 11495
the C15. Therefore, the first apparent conclusion is that alsofor O3 organic surfactant coatings can have significant effectson interfacial mass transfer, similar to other species, such asN2O5 or HNO3. Another way to interpret these results andto relate them to the monolayer properties is to plot the ratioγcoated/γcoatedas a function of the area per molecule of sur-factant as shown in Fig. 5b. On this scale, the low evaporatortemperatures that led to low surfactant mass ratios plot at thehigh area per molecule end, i.e., the area per molecule de-creases with increasing mass ratio for all fatty acids C9-C20.We reiterate the assessment of the monolayer properties asabove. Once the calculated area per molecule is lower thanthe position of the ESP in the phase diagram, i.e., at massratios high enough to leave an excess of bulk fatty acid, thecalculated areas per molecule do not make sense, but just re-sult from normalizing the number of fatty acid molecules bythe surface area. This is expressed in Fig. 5b by using plain,rather than open symbols for data points beyond the ESP. Be-yond the ESP, the area per molecule in the monolayer doesnot decrease further, since no external force is applied for fur-ther compression, as already indicated by the lines shown inFig. 3b. The excess surfactant molecules remain as a separatebulk phase as discussed above. ESP data were only availablefor C12 to C20. From that we can deduce a decrease of theuptake coefficient by 30% for C12, 85% for C15 and 50% forC18 in presence of a monolayer of a fatty acid at the ESP atthe air/water interface. We note that the further decrease ofγcoated/γcoatedwith increasing mass ratio is not due to furthercompression of the monolayer (since there is no driving forcefor that) but rather due to the extension of the separate fattyacid phase. At high mass ratios, the compound particle maybe dominated by the fatty acid phase in volume and surfacearea, and only the aqueous subphase with the monolayer atESP contributes to O3 uptake. If for the C18 fatty acid at 20%mass ratio we consider that the excess of fatty acid formed aseparate sphere, the total surface would be about a factor oftwo larger than that of the neat aqueous KI solution particle,which should lead to a maximum decrease of the uptake co-efficient by a factor of 2. The uptake coefficient at this massratio was even by more than a factor of two lower. This mayindicate that a significant part of the droplet surface area wasin contact with the excess solid phase and thus effectivelyreduced the surface area exposed to O3.
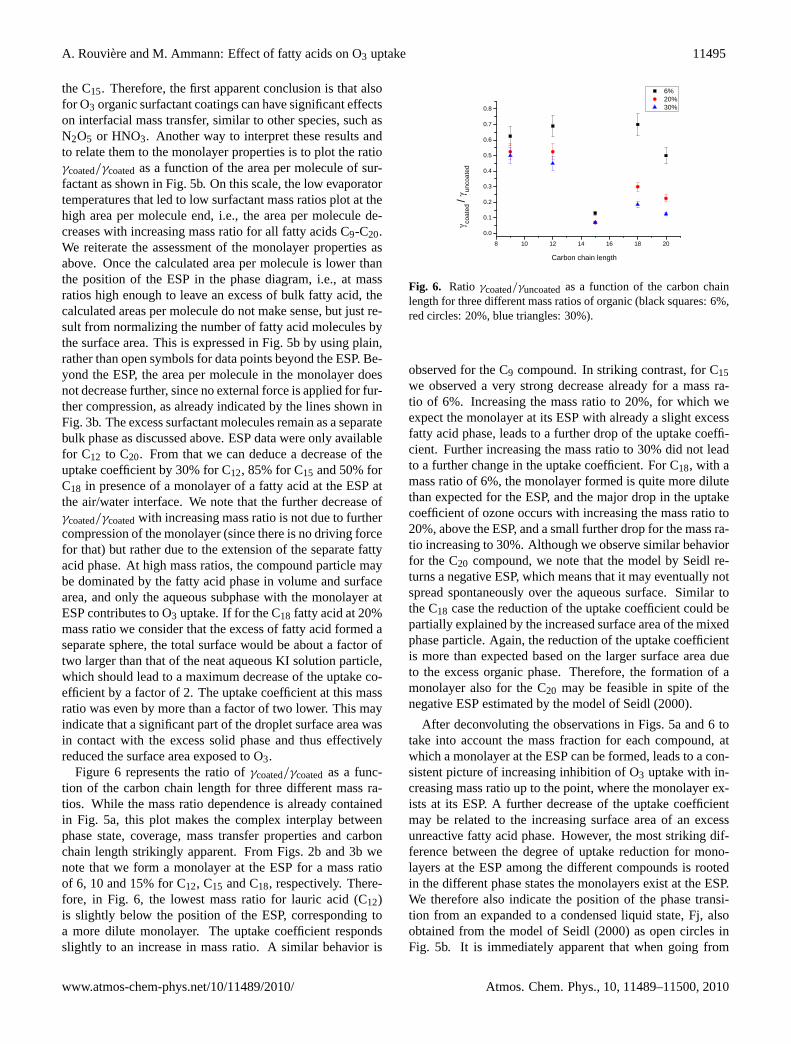
Figure 6 represents the ratio ofγcoated/γcoatedas a func-tion of the carbon chain length for three different mass ra-tios. While the mass ratio dependence is already containedin Fig. 5a, this plot makes the complex interplay betweenphase state, coverage, mass transfer properties and carbonchain length strikingly apparent. From Figs. 2b and 3b wenote that we form a monolayer at the ESP for a mass ratioof 6, 10 and 15% for C12, C15 and C18, respectively. There-fore, in Fig. 6, the lowest mass ratio for lauric acid (C12)is slightly below the position of the ESP, corresponding toa more dilute monolayer. The uptake coefficient respondsslightly to an increase in mass ratio. A similar behavior is
35
8 10 12 14 16 18 20
0.0
0.1
0.2
0.3
0.4
0.5
0.6
0.7
0.8
Carbon chain length
coa
ted
/ un
coat
ed
6% 20% 30%
Figure 6.
Fig. 6. Ratio γcoated/γuncoatedas a function of the carbon chainlength for three different mass ratios of organic (black squares: 6%,red circles: 20%, blue triangles: 30%).
observed for the C9 compound. In striking contrast, for C15we observed a very strong decrease already for a mass ra-tio of 6%. Increasing the mass ratio to 20%, for which weexpect the monolayer at its ESP with already a slight excessfatty acid phase, leads to a further drop of the uptake coeffi-cient. Further increasing the mass ratio to 30% did not leadto a further change in the uptake coefficient. For C18, with amass ratio of 6%, the monolayer formed is quite more dilutethan expected for the ESP, and the major drop in the uptakecoefficient of ozone occurs with increasing the mass ratio to20%, above the ESP, and a small further drop for the mass ra-tio increasing to 30%. Although we observe similar behaviorfor the C20 compound, we note that the model by Seidl re-turns a negative ESP, which means that it may eventually notspread spontaneously over the aqueous surface. Similar tothe C18 case the reduction of the uptake coefficient could bepartially explained by the increased surface area of the mixedphase particle. Again, the reduction of the uptake coefficientis more than expected based on the larger surface area dueto the excess organic phase. Therefore, the formation of amonolayer also for the C20 may be feasible in spite of thenegative ESP estimated by the model of Seidl (2000).
After deconvoluting the observations in Figs. 5a and 6 totake into account the mass fraction for each compound, atwhich a monolayer at the ESP can be formed, leads to a con-sistent picture of increasing inhibition of O3 uptake with in-creasing mass ratio up to the point, where the monolayer ex-ists at its ESP. A further decrease of the uptake coefficientmay be related to the increasing surface area of an excessunreactive fatty acid phase. However, the most striking dif-ference between the degree of uptake reduction for mono-layers at the ESP among the different compounds is rootedin the different phase states the monolayers exist at the ESP.We therefore also indicate the position of the phase transi-tion from an expanded to a condensed liquid state, Fj, alsoobtained from the model of Seidl (2000) as open circles inFig. 5b. It is immediately apparent that when going from
www.atmos-chem-phys.net/10/11489/2010/ Atmos. Chem. Phys., 10, 11489–11500, 2010
11496 A. Rouviere and M. Ammann: Effect of fatty acids on O3 uptake
36
0.5 1.0 1.5 2.0 2.5 3.00.0
2.0x10⁻³
4.0x10⁻³
6.0x10⁻³
8.0x10⁻³
1.0x10⁻²
[I-]1/2 M1/2
0.5 1.0 1.5 2.0 2.5 3.00.0
2.0x10⁻³
4.0x10⁻³
6.0x10⁻³
8.0x10⁻³
1.0x10⁻²
[I-]1/2 M1/2
Figure 7(a) and 7(b).
36
0.5 1.0 1.5 2.0 2.5 3.00.0
2.0x10⁻³
4.0x10⁻³
6.0x10⁻³
8.0x10⁻³
1.0x10⁻²
[I-]1/2 M1/2
0.5 1.0 1.5 2.0 2.5 3.00.0
2.0x10⁻³
4.0x10⁻³
6.0x10⁻³
8.0x10⁻³
1.0x10⁻²
[I-]1/2 M1/2
Figure 7(a) and 7(b).
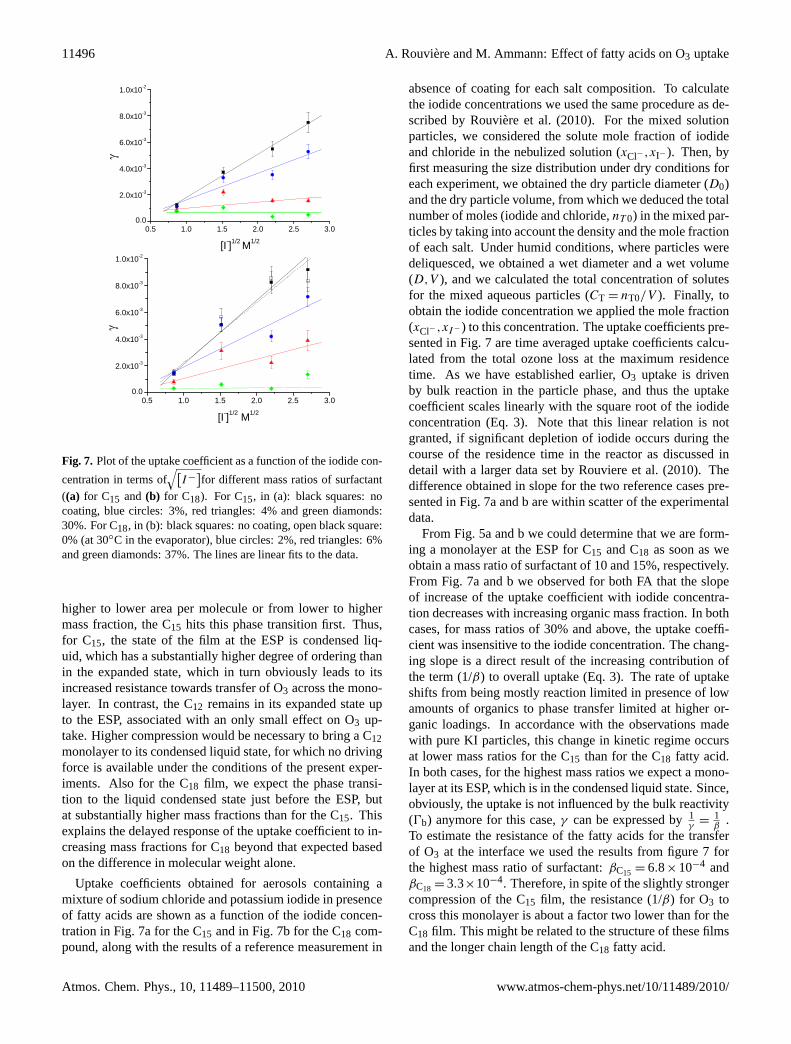
Fig. 7. Plot of the uptake coefficient as a function of the iodide con-
centration in terms of√[
I−]for different mass ratios of surfactant
((a) for C15 and (b) for C18). For C15, in (a): black squares: nocoating, blue circles: 3%, red triangles: 4% and green diamonds:30%. For C18, in (b): black squares: no coating, open black square:0% (at 30◦C in the evaporator), blue circles: 2%, red triangles: 6%and green diamonds: 37%. The lines are linear fits to the data.
higher to lower area per molecule or from lower to highermass fraction, the C15 hits this phase transition first. Thus,for C15, the state of the film at the ESP is condensed liq-uid, which has a substantially higher degree of ordering thanin the expanded state, which in turn obviously leads to itsincreased resistance towards transfer of O3 across the mono-layer. In contrast, the C12 remains in its expanded state upto the ESP, associated with an only small effect on O3 up-take. Higher compression would be necessary to bring a C12monolayer to its condensed liquid state, for which no drivingforce is available under the conditions of the present exper-iments. Also for the C18 film, we expect the phase transi-tion to the liquid condensed state just before the ESP, butat substantially higher mass fractions than for the C15. Thisexplains the delayed response of the uptake coefficient to in-creasing mass fractions for C18 beyond that expected basedon the difference in molecular weight alone.
Uptake coefficients obtained for aerosols containing amixture of sodium chloride and potassium iodide in presenceof fatty acids are shown as a function of the iodide concen-tration in Fig. 7a for the C15 and in Fig. 7b for the C18 com-pound, along with the results of a reference measurement in
absence of coating for each salt composition. To calculatethe iodide concentrations we used the same procedure as de-scribed by Rouviere et al. (2010). For the mixed solutionparticles, we considered the solute mole fraction of iodideand chloride in the nebulized solution (xCl− ,xI− ). Then, byfirst measuring the size distribution under dry conditions foreach experiment, we obtained the dry particle diameter (D0)and the dry particle volume, from which we deduced the totalnumber of moles (iodide and chloride,nT 0) in the mixed par-ticles by taking into account the density and the mole fractionof each salt. Under humid conditions, where particles weredeliquesced, we obtained a wet diameter and a wet volume(D,V ), and we calculated the total concentration of solutesfor the mixed aqueous particles (CT = nT0/V ). Finally, toobtain the iodide concentration we applied the mole fraction(xCl− ,xI−) to this concentration. The uptake coefficients pre-sented in Fig. 7 are time averaged uptake coefficients calcu-lated from the total ozone loss at the maximum residencetime. As we have established earlier, O3 uptake is drivenby bulk reaction in the particle phase, and thus the uptakecoefficient scales linearly with the square root of the iodideconcentration (Eq. 3). Note that this linear relation is notgranted, if significant depletion of iodide occurs during thecourse of the residence time in the reactor as discussed indetail with a larger data set by Rouviere et al. (2010). Thedifference obtained in slope for the two reference cases pre-sented in Fig. 7a and b are within scatter of the experimentaldata.
From Fig. 5a and b we could determine that we are form-ing a monolayer at the ESP for C15 and C18 as soon as weobtain a mass ratio of surfactant of 10 and 15%, respectively.From Fig. 7a and b we observed for both FA that the slopeof increase of the uptake coefficient with iodide concentra-tion decreases with increasing organic mass fraction. In bothcases, for mass ratios of 30% and above, the uptake coeffi-cient was insensitive to the iodide concentration. The chang-ing slope is a direct result of the increasing contribution ofthe term (1/β) to overall uptake (Eq. 3). The rate of uptakeshifts from being mostly reaction limited in presence of lowamounts of organics to phase transfer limited at higher or-ganic loadings. In accordance with the observations madewith pure KI particles, this change in kinetic regime occursat lower mass ratios for the C15 than for the C18 fatty acid.In both cases, for the highest mass ratios we expect a mono-layer at its ESP, which is in the condensed liquid state. Since,obviously, the uptake is not influenced by the bulk reactivity(0b) anymore for this case,γ can be expressed by1
γ=
1β
.To estimate the resistance of the fatty acids for the transferof O3 at the interface we used the results from figure 7 forthe highest mass ratio of surfactant:βC15 = 6.8×10⁻⁴ andβC18 = 3.3×10⁻⁴. Therefore, in spite of the slightly strongercompression of the C15 film, the resistance (1/β) for O3 tocross this monolayer is about a factor two lower than for theC18 film. This might be related to the structure of these filmsand the longer chain length of the C18 fatty acid.
Atmos. Chem. Phys., 10, 11489–11500, 2010 www.atmos-chem-phys.net/10/11489/2010/
A. Rouviere and M. Ammann: Effect of fatty acids on O3 uptake 11497
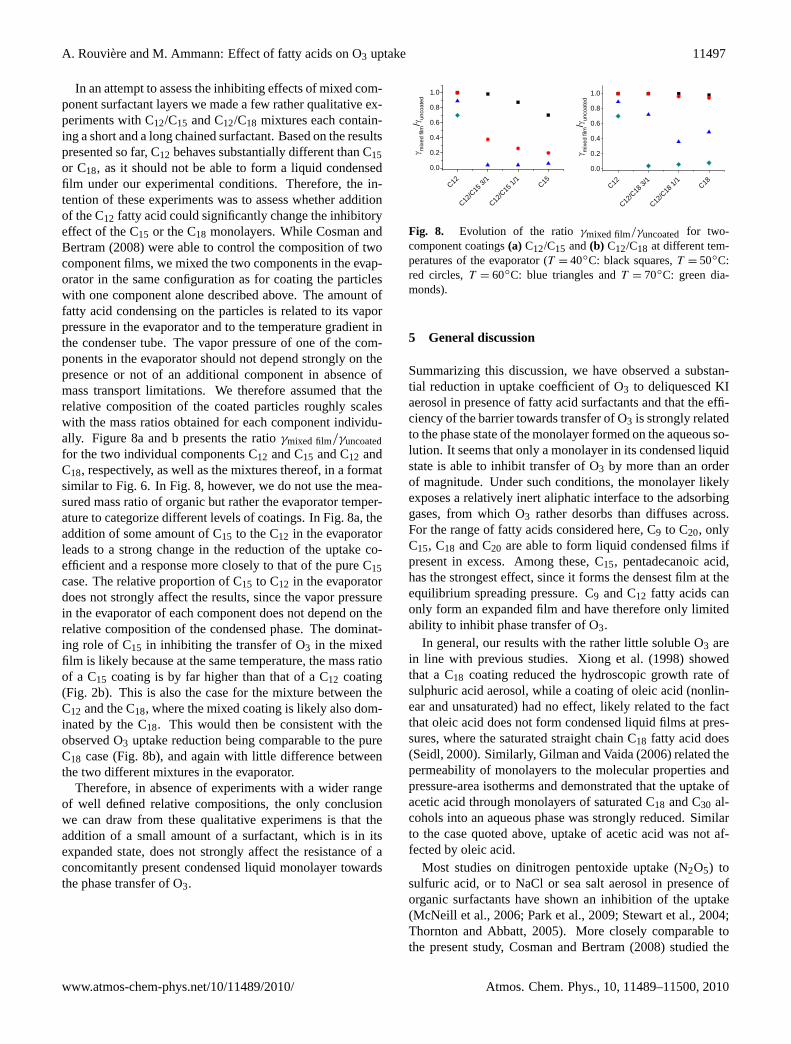
In an attempt to assess the inhibiting effects of mixed com-ponent surfactant layers we made a few rather qualitative ex-periments with C12/C15 and C12/C18 mixtures each contain-ing a short and a long chained surfactant. Based on the resultspresented so far, C12 behaves substantially different than C15or C18, as it should not be able to form a liquid condensedfilm under our experimental conditions. Therefore, the in-tention of these experiments was to assess whether additionof the C12 fatty acid could significantly change the inhibitoryeffect of the C15 or the C18 monolayers. While Cosman andBertram (2008) were able to control the composition of twocomponent films, we mixed the two components in the evap-orator in the same configuration as for coating the particleswith one component alone described above. The amount offatty acid condensing on the particles is related to its vaporpressure in the evaporator and to the temperature gradient inthe condenser tube. The vapor pressure of one of the com-ponents in the evaporator should not depend strongly on thepresence or not of an additional component in absence ofmass transport limitations. We therefore assumed that therelative composition of the coated particles roughly scaleswith the mass ratios obtained for each component individu-ally. Figure 8a and b presents the ratioγmixed film/γuncoatedfor the two individual components C12 and C15 and C12 andC18, respectively, as well as the mixtures thereof, in a formatsimilar to Fig. 6. In Fig. 8, however, we do not use the mea-sured mass ratio of organic but rather the evaporator temper-ature to categorize different levels of coatings. In Fig. 8a, theaddition of some amount of C15 to the C12 in the evaporatorleads to a strong change in the reduction of the uptake co-efficient and a response more closely to that of the pure C15case. The relative proportion of C15 to C12 in the evaporatordoes not strongly affect the results, since the vapor pressurein the evaporator of each component does not depend on therelative composition of the condensed phase. The dominat-ing role of C15 in inhibiting the transfer of O3 in the mixedfilm is likely because at the same temperature, the mass ratioof a C15 coating is by far higher than that of a C12 coating(Fig. 2b). This is also the case for the mixture between theC12 and the C18, where the mixed coating is likely also dom-inated by the C18. This would then be consistent with theobserved O3 uptake reduction being comparable to the pureC18 case (Fig. 8b), and again with little difference betweenthe two different mixtures in the evaporator.
Therefore, in absence of experiments with a wider rangeof well defined relative compositions, the only conclusionwe can draw from these qualitative experimens is that theaddition of a small amount of a surfactant, which is in itsexpanded state, does not strongly affect the resistance of aconcomitantly present condensed liquid monolayer towardsthe phase transfer of O3.
37
C12
C12/C
15 3
/1
C12/C
15 1
/1C15
0.0
0.2
0.4
0.6
0.8
1.0
C12
C12/C
18 3
/1
C12/C
18 1
/1C18
0.0
0.2
0.4
0.6
0.8
1.0
mix
ed fi
lm/
unco
ated
mix
ed
film
/un
coat
ed
Figure 8(a) and 8(b)
Fig. 8. Evolution of the ratioγmixed film/γuncoated for two-component coatings(a) C12/C15 and(b) C12/C18 at different tem-peratures of the evaporator (T = 40◦C: black squares,T = 50◦C:red circles,T = 60◦C: blue triangles andT = 70◦C: green dia-monds).
5 General discussion
Summarizing this discussion, we have observed a substan-tial reduction in uptake coefficient of O3 to deliquesced KIaerosol in presence of fatty acid surfactants and that the effi-ciency of the barrier towards transfer of O3 is strongly relatedto the phase state of the monolayer formed on the aqueous so-lution. It seems that only a monolayer in its condensed liquidstate is able to inhibit transfer of O3 by more than an orderof magnitude. Under such conditions, the monolayer likelyexposes a relatively inert aliphatic interface to the adsorbinggases, from which O3 rather desorbs than diffuses across.For the range of fatty acids considered here, C9 to C20, onlyC15, C18 and C20 are able to form liquid condensed films ifpresent in excess. Among these, C15, pentadecanoic acid,has the strongest effect, since it forms the densest film at theequilibrium spreading pressure. C9 and C12 fatty acids canonly form an expanded film and have therefore only limitedability to inhibit phase transfer of O3.
In general, our results with the rather little soluble O3 arein line with previous studies. Xiong et al. (1998) showedthat a C18 coating reduced the hydroscopic growth rate ofsulphuric acid aerosol, while a coating of oleic acid (nonlin-ear and unsaturated) had no effect, likely related to the factthat oleic acid does not form condensed liquid films at pres-sures, where the saturated straight chain C18 fatty acid does(Seidl, 2000). Similarly, Gilman and Vaida (2006) related thepermeability of monolayers to the molecular properties andpressure-area isotherms and demonstrated that the uptake ofacetic acid through monolayers of saturated C18 and C30 al-cohols into an aqueous phase was strongly reduced. Similarto the case quoted above, uptake of acetic acid was not af-fected by oleic acid.
Most studies on dinitrogen pentoxide uptake (N2O5) tosulfuric acid, or to NaCl or sea salt aerosol in presence oforganic surfactants have shown an inhibition of the uptake(McNeill et al., 2006; Park et al., 2009; Stewart et al., 2004;Thornton and Abbatt, 2005). More closely comparable tothe present study, Cosman and Bertram (2008) studied the
www.atmos-chem-phys.net/10/11489/2010/ Atmos. Chem. Phys., 10, 11489–11500, 2010
11498 A. Rouviere and M. Ammann: Effect of fatty acids on O3 uptake
uptake of N2O5 on aqueous H2SO4 solutions coated with 1or 2 component monolayers. They showed that the reactiveuptake coefficient depends on the molecular surface area ofthe surfactant. They also showed that a small amount of abranched surfactant could affect the overall resistance to thereactive uptake. Since these mixed component films werewell defined in composition, these results cannot be directlycompared to our qualitative results on mixed films. Someother studies have related the effectiveness of fatty acids toact as barriers for phase transfer to the nature of the headgroup (polarity), the pH and the temperature (Barnes, 1997;Johann and Vollhardt, 1999; Latif and Brimblecombe, 2004),parameters which have also a strong impact on the phasestate properties of the monolayers.
Concerning atmospheric implications we conclude that thepresence of fatty acids in aqueous aerosol particles may havethe potential to reduce the uptake of O3. However, it wouldrequire strong and persistent sink reactions in the aqueousphase resulting in uptake coefficients larger than 10−4 untilthe uptake of O3 would become limited by the permeabilityof a fatty acid monolayer, for which we determined a proba-bility for transfer and bulk accommodation in the lower 10−4
range. Smoydzin and von Glasow (2007) present the only de-tailed model study on the effect of surfactant coatings to thechemistry in the marine boundary layer. They note signifi-cant effects on the halogen budgets due to the effect of coat-ings to reduce phase transfer of the whole suite of O3, halo-gen and NOy species. Since they represented the coatings byoleic acid only, which has a double bond and is therefore re-active towards O3, their results probably overemphasise therole of coating oxidation by O3, since a major fraction offatty acids is certainly not reactive towards O3, implicatinglonger coating lifetimes. Nevertheless oxidation by OH re-mains an issue that leads to continuously changing composi-tion of potentially present organic coatings in the real marineboundary layer. Given the complexity of monolayer proper-ties already for the simple fatty acids discussed in this study,it is not yet possible to come up with a comprehensive pic-ture of how organic coatings affect atmospheric chemistry ingeneral. This is due to the very diverse range of compoundswith a wide range of ability to partition to the aqueous solu-tion – air interface and with a wide range of monolayer andpotentially also more complex layer structure properties.
6 Conclusions
The effects of amphiphilic fatty acids on the reaction ofozone with deliquesced potassium iodide aerosol particleswere investigated with an aerosol flow tube experiment. Thisis the first time that this system has been investigated underaerosol conditions. From the previous study in absence of or-ganic coating, we determined an initial uptake coefficient ofγ = (1.10±0.20)×10−2. The presence of a long chain surfac-tant coating adds a significant resistance to the transfer of O3
to deliquesced aerosol particles, similar to the case of morereactive trace gases. The results showed that, especially forthe C15-C20, amphiphilic surfactants may strongly limit themass transfer of ozone to the aqueous phase. Through vary-ing the iodide concentration in mixed chloride/iodide parti-cles we could directly determine the resistance exerted at theaqueous surface by two longer chained surfactants: pentade-canoic acid and stearic acid. The outstanding effectivenessof the C15 fatty acid to inhibit the ozone uptake from thegas phase could be explained by the monolayer properties ofthis fatty acid as compared to the others, specifically by thestate and the density of the monolayer formed at the equilib-rium spreading pressure. The short chained surfactants C9and C12 could only form monolayers in the liquid expandedstate, known to be not well ordered, and are only slightlyhindering ozone uptake. This study highlights the effective-ness of immiscible films of long-chain organics (C15-C20)to have an effect on the mass transport across the air-waterinterface by acting as a barrier for the transport of volatilespecies across the interface.
Acknowledgements.This work was supported by the SwissNational Science Foundation (grant no. 200020-109341). We aregrateful for the input of our colleague M. Birrer.
Edited by: V. Faye McNeill
References
Aller, J. Y., Kuznetsova, M. R., Jahns, C. J., and Kemp, P. F.: Thesea surface microlayer as a source of viral and bacterial enrich-ment in marine aerosols, J. Aerosol Sci., 36, 801–812, 2005.
Andrews, E. and Larson, S. M.: Effect of surfactant layers on thesize changes of aerosol particles as a function of relative humid-ity, Environ. Sci. Technol., 27, 857–865, 1993.
Aumann, E. and Tabazadeh, A.: Rate of organic film formationand oxidation on aqueous drops, J. Geophys. Res., 113, D23205.doi:10.1029/2007JD009738, 2008
Badger, C. L., Griffiths, P. T., George, I., Abbatt, J. P. D., and Cox,R. A.: Reactive Uptake of N2O5 by Aerosol Particles ContainingMixtures of Humic Acid and Ammonium Sulfate, J. Phys. Chem.A, 110, 6986–6994, 2006.
Barnes, G. T.: Permeation through monolayers, Collo. Surf. A, 126,149–158, 1997.
Bertram, T. H. and Thornton, J. A.: Toward a general parameteriza-tion of N2O5 reactivity on aqueous particles: the competing ef-fects of particle liquid water, nitrate and chloride, Atmos. Chem.Phys., 9, 8351–8363, doi:10.5194/acp-9-8351-2009, 2009.
Burden, D. K., Johnson, A. M., and Nathanson, G. M.: HCl Uptakethrough Films of Pentanoic Acid and Pentanoic Acid/HexanolMixtures at the Surface of Sulfuric Acid, J. Phys. Chem. A, 113,14131–14140, 2009.
Cavalli, F., Facchini, M. C., Decesari, S., Mircea, M., Emblico,L., Fuzzi, S., Ceburnis, D., Yoon, Y. J., O’Dowd, C. D.,Putaud, J. P., and Dell’Acqua, A.: Advances in characteri-zation of size-resolved organic matter in marine aerosol over
Atmos. Chem. Phys., 10, 11489–11500, 2010 www.atmos-chem-phys.net/10/11489/2010/
A. Rouviere and M. Ammann: Effect of fatty acids on O3 uptake 11499
the North Atlantic, J. Geophys. Res.-Atmos., 109, D24215,doi:10.1029/2004JD005137, 2004.
Chan, M. N. and Chan, C. K.: Mass transfer effects in hygro-scopic measurements of aerosol particles, Atmos. Chem. Phys.,5, 2703–2712, doi:10.5194/acp-5-2703-2005, 2005.
Cheng, Y., Li, S.-M., Leithead, A., Brickell, P. C., and Leaitch,W. R.: Characterizations of cis-pinonic acid and n-fatty acids onfine aerosols in the Lower Fraser Valley during Pacific 2001 AirQuality Study, Atmos. Environ., 38, 5789–5800, 2004.
Chuang, P. Y.: Measurement of the timescale of hygroscopicgrowth for atmospheric aerosols, J. Geophys. Res., 108, 4282,doi:10.1029/2002JD002757, 2003.
Cosman, L. M. and Bertram, A. K.: Reactive uptake of N2O5on aqueous H2SO4 solutions coated with 1-component and 2-component monolayers, J. Phys. Chem. A, 112, 4625–4635,2008.
Cosman, L. M., Knopf, D. A., and Bertram, A. K.: N2O5 Reac-tive Uptake on Aqueous Sulfuric Acid Solutions Coated withBranched and Straight-Chain Insoluble Organic Surfactants, J.Phys. Chem. A, 112, 2386–2396, 2008.
Day, D. A., Takahama, S., Gilardoni, S., and Russell, L. M.: Or-ganic composition of single and submicron particles in differ-ent regions of western North America and the eastern Pacificduring INTEX-B 2006, Atmos. Chem. Phys., 9, 5433–5446,doi:10.5194/acp-9-5433-2009, 2009.
Donaldson, D. J. and Vaida, V.: The Influence of Organic Filmsat the Air-Aqueous Boundary on Atmospheric Processes, Chem.Rev., 106, 1445–1461, 2006.
Ellison, G. B., Tuck, A. F., and Vaida, V.: Atmospheric processingof organic aerosols, J. Geophys. Res., 104, 11633–11641, 1999.
Enami, S., Vecitis, C. D., Cheng, J., Hoffmann, M. R., and Colussi,A. J.: Mass spectrometry of interfacial layers during fast aqueousaerosol/ozone gas reactions of atmospheric interest, Chem. Phys.Lett., 455, 316–320, 2008.
Facchini, M. C., Rinaldi, M., Decesari, S., Carbone, C., Finessi, E.,Mircea, M., Fuzzi, S., Ceburnis, D., Flanagan, R., Nilsson, E.D., de Leeuw, G., Martino, M., Woeltjen, J., and O’Dowd, C. D.:Primary submicron marine aerosol dominated by insoluble or-ganic colloids and aggregates, Geophys. Res. Lett., 35, L17814,doi:10.1029/2008GL034210, 2008.
Gabler, H. E. and Heumann, K. G.: Determination of ParticulateIodine in Aerosols from Different Regions by Size FractionatingImpactor Sampling and Idms, Int. J. Environ. Anal. Chem., 50,129–146, 1993.
Gill, P. S., Graedel, T. E., and Weschler, C. J.: Organic Films onAtmospheric Aerosol Particles, Fog Droplets, Cloud Droplets,Raindrops, and Snowflakes, Rev. Geophys., 21, 903–920, 1983.
Gilman, J. B., Tervahattu, H., and Vaida, V.: Interfacial propertiesof mixed films of long-chain organics at the air-water interface,Atmos. Environ., 40, 6606–6614, 2006.
Gilman, J. B. and Vaida, V.: Permeability of Acetic Acid throughOrganic Films at the Air-Aqueous Interface, J. Phys. Chem. A,110, 7581–7587, 2006.
Glass, S. V., Park, S.-C., and Nathanson, G. M.: Evaporation ofWater and Uptake of HCl and HBr through Hexanol Films at theSurface of Supercooled Sulfuric Acid, J. Phys. Chem. A, 110,7593–7601, 2006.
Hayase, S., Yabushita, A., Kawasaki, M., Enami, S., Hoffmann,M. R., and Colussi, A. J.: Heterogeneous Reaction of Gaseous
Ozone with Aqueous Iodide in the Presence of Aqueous OrganicSpecies, J. Phys. Chem. A, 114, 6016–6021, 2010.
Hou, X., Zhuang, G., Sun, Y., and An, Z.: Characteristics andsources of polycyclic aromatic hydrocarbons and fatty acids inPM2.5 aerosols in dust season in China, Atmos. Environ., 40,3251–3262, 2006.
Huang, X.-F., He, L.-Y., Hu, M., and Zhang, Y.-H.: Annual vari-ation of particulate organic compounds in PM2.5 in the urbanatmosphere of Beijing, Atmos. Environ., 40, 2449–2458, 2006.
Johann, R. and Vollhardt, D.: Texture features of long-chain fattyacid monolayers at high pH of the aqueous subphase, Mater. Sci.Eng. C-Biomimetic Supramol. Syst., 8–9, 35–42, 1999.
Kanakidou, M., Seinfeld, J. H., Pandis, S. N., Barnes, I., Dentener,F. J., Facchini, M. C., Van Dingenen, R., Ervens, B., Nenes, A.,Nielsen, C. J., Swietlicki, E., Putaud, J. P., Balkanski, Y., Fuzzi,S., Horth, J., Moortgat, G. K., Winterhalter, R., Myhre, C. E.L., Tsigaridis, K., Vignati, E., Stephanou, E. G., and Wilson,J.: Organic aerosol and global climate modelling: a review, At-mos. Chem. Phys., 5, 1053–1123, doi:10.5194/acp-5-1053-2005,2005.
Kanicky, J. R., Poniatowski, A. F., Mehta, N. R., and Shah, D.O.:Cooperativity among molecules at interfaces in relation tovarious technological processes: Effect of chain length on thepk(a)of fatty acid salt solutions, Langmuir, 16, 172–177, 2000.
Kanicky, J. R. and Shah, D. O.: Effect of degree, type, and positionof unsaturation on the pk(a) of long-chain fatty acids, J. ColloidInterf. Sci., 256, 201–207, 2002.
Knopf, D. A., Cosman, L. M., Mousavi, P., Mokamati, S., andBertram, A. K.: A Novel Flow Reactor for Studying Reactions onLiquid Surfaces Coated by Organic Monolayers: Methods, Vali-dation, and Initial Results, J. Phys. Chem. A, 111, 11021–11032,2007.
Krisch, M. J., D’Auria, R., Brown, M. A., Tobias, D. J., Hem-minger, C., Ammann, M., Starr, D. E., and Bluhm, H.: The Ef-fect of an Organic Surfactant on the Liquid-Vapor Interface ofan Electrolyte Solution, J. Phys. Chem. C, 111, 13497–13509,2007.
Kuznetsova, M., Lee, C., and Aller, J.: Characterization of the pro-teinaceous matter in marine aerosols, Marine Chem., 96, 359–377, 2005.
Latif, M. T. and Brimblecombe, P.: Surfactants in AtmosphericAerosols, Environ. Sci. Technol., 38, 6501–6506, 2004.
Leck, C. and Bigg, E. K.: Source and evolution of the marineaerosol – A new perspective, Geophys. Res. Lett., 32, L19803,doi:10.1029/2005GL023651, 2005.
Liu, Q., Schurter, L. M., Muller, C. E., Aloisio, S., Francisco, J.S., and Margerum, D. W.: Kinetics and Mechanisms of Aque-ous Ozone Reactions with Bromide, Sulfite, Hydrogen Sulfite,Iodide, and Nitrite Ions, Inorg. Chem., 40, 4436–4442, 2001.
McNeill, V. F., Patterson, J., Wolfe, G. M., and Thornton, J. A.:The effect of varying levels of surfactant on the reactive uptakeof N2O5 to aqueous aerosol, Atmos. Chem. Phys., 6, 1635–1644,doi:10.5194/acp-6-1635-2006, 2006.
McNeill, V. F., Wolfe, G. M., and Thornton, J. A.: The Oxidationof Oleate in Submicron Aqueous Salt Aerosols: Evidence of aSurface Process, J. Phys. Chem. A, 111, 1073–1083, 2007.
Mochida, M., Kitamori, Y., Kawamura, K., Nojiri, Y., andSuzuki, K.: Fatty acids in the marine atmosphere: Factorsgoverning their concentrations and evaluation of organic films
www.atmos-chem-phys.net/10/11489/2010/ Atmos. Chem. Phys., 10, 11489–11500, 2010
11500 A. Rouviere and M. Ammann: Effect of fatty acids on O3 uptake
on sea-salt particles, J. Geophys. Res.-Atmos., 107, 4325,doi:10.1029/2001JD001278, 2002.
Mochida, M., Umemoto, N., Kawamura, K., Lim, H.-J., and Turpin,B. J.: Bimodal size distributions of various organic acids andfatty acids in the marine atmosphere: Influence of anthropogenicaerosols, Asian dusts, and sea spray off the coast of East Asia, J.Geophys. Res., 112, D15209, doi:10.1029/2006JD007773, 2007.
O’Dowd, C. D., Facchini, M. C., Cavalli, F., Ceburnis, D., Mircea,M., Decesari, S., Fuzzi, S., Yoon, Y. J., and Putaud, J. P.: Bio-genically driven organic contribution to marine aerosol, Nature,431, 676–680, 2004.
Park, S. C., Burden, D. K., and Nathanson, G. M.: The Inhibition ofN2O5 Hydrolysis in Sulfuric Acid by 1-Butanol and 1-HexanolSurfactant Coatings, J. Phys. Chem. A, 111, 2921–2929, 2007.
Park, S. C., Burden, D. K., and Nathanson, G. M.: Surfactant Con-trol of Gas Transport and Reactions at the Surface of SulfuricAcid, Accounts Chem. Res., 42, 379–387, 2009.
Pio, C., Alves, C., and Duarte, A.: Organic components of aerosolsin a forested area of central Greece, Atmos. Environ., 35, 389–401, 2001.
Poschl, U., Rudich, Y., and Ammann, M.: Kinetic model frame-work for aerosol and cloud surface chemistry and gas-particleinteractions – Part 1: General equations, parameters, and termi-nology, Atmos. Chem. Phys., 7, 5989–6023, doi:10.5194/acp-7-5989-2007, 2007.
Putaud, J. P., Raes, F., Van Dingenen, R., Bruggemann, E., Fac-chini, M. C., Decesari, S., Fuzzi, S., Gehrig, R., Huglin, C.,Laj, P., Lorbeer, G., Maenhaut, W., Mihalopoulos, N., Mulller,K., Querol, X., Rodriguez, S., Schneider, J., Spindler, G., tenBrink, H., Torseth, K., and Wiedensohler, A.: European aerosolphenomenology-2: chemical characteristics of particulate matterat kerbside, urban, rural and background sites in Europe, Atmos.Environ., 38, 2579–2595, 2004.
Riemer, N., Vogel, H., Vogel, B., Anttila, T., Kiendler-Scharr, A.,and Mentel, T. F.: Relative importance of organic coatings forthe heterogeneous hydrolysis of N2O5 during summer in Europe,J. Geophys. Res., 114, D17307, doi:10.1029/2008JD011369, ,2009.
Robinson, A. L., Subramanian, R., Donahue, N. M., Bernardo-Bricker, A., and Rogge, W. F.: Source Apportionment of Molec-ular Markers and Organic Aerosol. 3. Food Cooking Emissions,Environ. Sci. Technol., 40, 7820–7827, 2006.
Rouviere, A., Sosedova, Y., and Ammann, M.: Uptake of ozoneto deliquesced KI and mixed KI/NaCl aerosol particles, J. Phys.Chem. A, 114(26), 7085–7093, doi:10.1021/jp103257d, 2010.
Rudich, Y.: Laboratory Perspectives on the Chemical Transforma-tions of Organic Matter in Atmospheric Particles, Chem. Rev.,103, 5097–5124, 2003.
Schauer, J. J., Kleeman, M. J., Cass, G. R., and Simoneit, B. R. T.:Measurement of Emissions from Air Pollution Sources. 4. C1-C27 Organic Compounds from Cooking with Seed Oils, Environ.Sci. Technol., 36, 567–575, 2001.
Seidl, W.: Model for a surface film of fatty acids on rain water andaerosol particles, Atmos. Environ., 34, 4917–4932, 2000.
Simoneit, B. R. T. and Mazurek, M. A.: Organic Matter of theTroposphere–II.: Natural Background of biogenic lipid matter inaerosols over the rural western United States, Atmos. Environ.,41, 4–24, 2007.
Smith, G. D., Woods, E., DeForest, C. L., Baer, T., and Miller, R. E.:
Reactive Uptake of Ozone by Oleic Acid Aerosol Particles: Ap-plication of Single-Particle Mass Spectrometry to HeterogeneousReaction Kinetics, J. Phys. Chem. A, 106, 8085-8095, 2002.
Smoydzin, L. and von Glasow, R.: Do organic surface films on seasalt aerosols influence atmospheric chemistry?- A model study,Atmos. Chem. Phys., 7, 5555–5567, doi:10.5194/acp-7-5555-2007, 2007.
Stemmler, K., Vlasenko, A., Guimbaud, C., and Ammann, M.: Theeffect of fatty acid surfactants on the uptake of nitric acid todeliquesced NaCl aerosol, Atmos. Chem. Phys., 8, 5127–5141,doi:10.5194/acp-8-5127-2008, 2008.
Stewart, D. J., Griffiths, P. T., and Cox, R. A.: Reactive uptakecoefficients for heterogeneous reaction of N2O5 with submicronaerosols of NaCl and natural sea salt, Atmos. Chem. Phys., 4,1381–1388, doi:10.5194/acp-4-1381-2004, 2004.
Tabazadeh, A.: Organic aggregate formation in aerosols and its im-pact on the physicochemical properties of atmospheric particles,Atmos. Environ., 39, 5472–5480, 2005.
Tervahattu, H., Hartonen, K., Kerminen, V. M., Kupiainen, K.,Aarnio, P., Koskentalo, T., Tuck, A. F., and Vaida, V.: New evi-dence of an organic layer on marine aerosols, J. Geophys. Res.-Atmos., 107, 4053, doi:10.1029/2000JD000282, 2002a.
Tervahattu, H., Juhanoja, J., and Kupiainen, K.: Identification ofan organic coating on marine aerosol particles by TOF-SIMS, J.Geophys. Res., 107, 4319, doi:10.1029/2001JD001403, 2002b.
Tervahattu, H., Juhanoja, J., Vaida, V., Tuck, A. F., Niemi, J. V.,Kupiainen, K., Kulmala, M., and Vehkamaki, H.: Fatty acidson continental sulfate aerosol particles, J. Geophys. Res., 110,D06207, doi:10.1029/2004JD005400, 2005.
Thornton, J. A., and Abbatt, J. P. D.: N2O5 Reaction on SubmicronSea Salt Aerosol: Kinetics, Products, and the Effect of SurfaceActive Organics, J. Phys. Chem. A, 109, 10004–10012, 2005.
Tobias, D. J. and Hemminger, J. C.: Chemistry – Getting specificabout specific ion effects, Science, 319, 1197–1198, 2008.
Woods, E. I., Kim, H. S., Wivagg, C. N., Dotson, S. J., Broekhuizen,K. E., and Frohardt, E. F.: Phase Transitions and Surface Mor-phology of Surfactant-Coated Aerosol Particles, J. Phys. Chem.A, 111, 11013–11020, 2007.
Xiong, J. Q., Zhong, M., Fang, C., Chen, L. C., and Lippmann, M.:Influence of Organic Films on the Hygroscopicity of UltrafineSulfuric Acid Aerosol, Environ. Sci. Technol., 32, 3536–3541,1998.
Zahardis, J. and Petrucci, G. A.: The oleic acid-ozone heteroge-neous reaction system: products, kinetics, secondary chemistry,and atmospheric implications of a model system – a review, At-mos. Chem. Phys., 7, 1237–1274, doi:10.5194/acp-7-1237-2007,2007.
Zhang, Q., Jimenez, J. L., Canagaratna, M. R., Allan, J. D., Coe,H., Ulbrich, I., Alfarra, M. R., Takami, A., Middlebrook, A.M., Sun, Y. L., Dzepina, K., Dunlea, E., Docherty, K., De-Carlo, P. F., Salcedo, D., Onasch, T., Jayne, J. T., Miyoshi,T., Shimono, A., Hatakeyama, S., Takegawa, N., Kondo, Y.,Schneider, J., Drewnick, F., Borrmann, S., Weimer, S., Demer-jian, K., Williams, P., Bower, K., Bahreini, R., Cottrell, L.,Griffin, R. J., Rautiainen, J., Sun, J. Y., Zhang, Y. M., andWorsnop, D. R.: Ubiquity and dominance of oxygenated speciesin organic aerosols in anthropogenically-influenced NorthernHemisphere midlatitudes, Geophys. Res. Lett., 34, L13801,doi:10.1029/2007GL029979, 2007.
Atmos. Chem. Phys., 10, 11489–11500, 2010 www.atmos-chem-phys.net/10/11489/2010/