plasma transport and mammary uptake of trans fatty acids in dairy...
TRANSCRIPT

Vargas Bello Pérez, Einar (2011) Plasma transport and mammary uptake of trans fatty acids in dairy cows. PhD thesis, University of Nottingham.
Access from the University of Nottingham repository: http://eprints.nottingham.ac.uk/12179/1/Thesis.pdf
Copyright and reuse:
The Nottingham ePrints service makes this work by researchers of the University of Nottingham available open access under the following conditions.
This article is made available under the University of Nottingham End User licence and may be reused according to the conditions of the licence. For more details see: http://eprints.nottingham.ac.uk/end_user_agreement.pdf
For more information, please contact [email protected]
Plasma transport and mammary uptake of trans fatty acids in dairy
cows
By
Einar Vargas Bello Pérez BSc (Hons) National Autonomous University of Mexico
MSc McGill University
Thesis submitted to the University of Nottingham
for the degree of Doctor of Philosophy
August 2011
School of Biosciences Sutton Bonington Campus
Loughborough Leicestershire
LE12 5RD
DECLARATION
I hereby declare that this thesis has been composed by myself, and has not been submitted
for any other degree at The University of Nottingham or elsewhere. The work presented
herein is my own, and all the work of other authors is duly acknowledged. I also
acknowledge all assistance given to me during the design and execution of the
experiments contained in this thesis and during its preparation.
Einar VARGAS BELLO PEREZ
i
LIST OF CONTENTS
List of contents……………………………………………………………………... i
Abstract…………………………………………………………………………….. viii
Publications and presentations…………………………………………………....... ix
Acknowledgments…………………………………………………………………. x
List of figures………………………………………………………………………. xi
List of tables………………………………………………………………………... xii
Abbreviations………………………………………………………………………. xv
Chapter 1
1. Literature review……………….………………................................................ 1
1.1Introduction……………………………………………………………... 2
1.2 Lipids…………………………………………………………………….4
1.2.1 Fatty acid nomenclature…………………………………….... 4
1.2.2 Essential fatty acids…………………………………………...5
1.2.3Conjugated linoleic acid (CLA)………………………………. 5
1.3 Milk fat composition…………………………………………………… 8
1.3.1 Factors affecting milk fat composition………………………. 9
1.4 Dietary fat in dairy cow diets…………………………………………... 10
1.4.1 Saturated fatty acids and oleic acid…………...………………12
1.4.2 Lipid metabolism in the rumen………………………………. 13
1.4.3 Lipolysis……………………………………………………… 14
1.4.4 Biohydrogenation…………………………………………….. 14
1.4.4.1 Biohydrogenation intermediates…………………… 15
1.4.5 Effects of dietary lipids on rumen fermentation……………... 16
1.5 Milk fat synthesis…………………………………………...…………..18
1.5.1 Milk fat depression (MFD)…………………………………... 19
1.6 Lipid transport......................................................................................... 20
1.6.1 Plasma lipoproteins.................................................................. 20
1.6.2 Lipoprotein structure................................................................ 20
ii
1.6.3 Chylomicrons………………………………………………… 21
1.6.4 Very low density lipoprotein………………………………… 21
1.6.5 Low density lipoprotein……………………………………… 21
1.6.6 High density lipoprotein……………………………………... 22
1.6.7 Lipoprotein isolation…………………………………………. 22
1.7 Fatty acids and human health effects…………………………………... 22
1.7.1 Saturated fatty acids (SFA) in human foodstuffs…………….. 22
1.7.2 Unsaturated fatty acids (UFA) in human foodstuffs…………. 23
1.7.3 Trans fatty acids in human foodstuffs……………………….. 24
1.7.4 Dietary fatty acids and blood lipoprotein and cholesterol levels……………………………………………………………….. 25
1.7.4.1 Effects of individual fatty acids on blood cholesterol level………………………………………………………… 26
1.7.5 Health effects related to milk trans fatty acids ……………… 26
1.7.6 Blood cholesterol level and atherosclerosis…………………...28
1.7.7 Blood cholesterol level and stroke development…………….. 29
1.7.8 Blood cholesterol level and coronary heart disease………….. 30
1.8 Using mammary gland cell lines to study fatty acid uptake…………… 31
1.8.1 Immortalized bovine mammary epithelial cell line: MAC-T... 31
1.8.2 Fatty acid transport proteins…………………………..……... 35
1.8.3 Fatty acid transport across cellular membranes……………… 36
1.8.4 Determinants of fatty acid transport…………………………. 36
1.9 Conclusions………………………………..…………………………… 37
1.10 General objectives…………………………………………….. ……... 37
CHAPTER 2
2. Ruminal pulses of fatty acids in dairy cows: 1. Soya oil and partially hydrogenated vegetable oil……………………………………….. ……………... 39
2.1 Introduction…………………………………………………………….. 39
2.2 Materials and methods…………………………………………………. 40
2.2.1 Animals and treatments…………………………………….....40
2.2.2 Sampling, measurements and analyses………………………. 41
iii
2.2.3 Statistical analysis …………………………………………… 45
2.3 Results………………………………………………………………….. 46
2.3.1 Composition of treatments………………………………….. 46
2.3.2 Ruminal fermentation parameters……………………………. 46
2.3.3 Plasma samples and treatment effects………………………... 46
2.3.4 Lipoprotein fractions and treatment effects………………….. 51
2.3.5 Total amount of trans fatty acids in lipoprotein fractions…… 54
2.3.6 Fatty acid composition of lipid subgroups within lipoproteins 55
2.3.7 Diurnal and daily variations in plasma and lipoprotein fractions on trans fatty acids…………………………………………………. 58
2.3.8 Diurnal and daily variations in ruminal fermentation parameters………………………………………………………….. 61
2.4 Discussion……………………………………………………………… 63
2.4.1 Fatty acid composition of plasma and lipoprotein fractions…. 66
2.4.2 Fatty acid composition of the lipoprotein lipid subgroups…... 68
2.4.3 Ruminal fermentation………………………………………... 70
2.5 Conclusion……………………………………………………………... 71
2.6 Implications……………………………………………………………..71
CHAPTER 3
3. Ruminal pulses of fatty acids in dairy cows: 2. Fish oil and partially hydrogenated vegetable oil……………………………………………………….. 74
3.1 Introduction…………………………………………………………….. 74
3.2 Materials and methods…………………………………………………. 75
3.2.1 Animals and treatments……………………………………….75
3.2.2 Sampling, measurements and analyses………………………. 76
3.2.3. Statistical analysis…………………………………………… 77
3.3 Results………………………………………………………………….. 77
3.3.1 Treatment composition………………………………………. 77
3.3.2 Ruminal fermentation parameters……………………………. 77
3.3.3 Plasma samples and treatment effect………………………… 77
iv
3.3.4 Lipoprotein fractions and treatments effects…………………. 83
3.3.5 Total amount of trans fatty acids in lipoprotein fractions…… 87
3.3.6 Fatty acid composition of lipid subgroups within lipoproteins 88
3.3.7 Diurnal and daily variations in plasma and lipoprotein fractions on trans fatty acids…………………………………………………. 91
3.3.8 Diurnal and daily variations in ruminal fermentation parameters………………………………………………………….. 93
3.4 Discussion……………………………………………………………… 95
3.4.1 Fatty acid profile of plasma and lipoprotein fractions……….. 98
3.4.2 Fatty acid composition in the lipoprotein lipid subgroups……100
3.4.3 Ruminal fermentation …………………………………...........102
3.5 Conclusion……………………………………………………………....104
3.6 Implications……………………………………………………………..104
CHAPTER 4
4. Using a bovine mammary epithelial cell line (MAC- T) to study fatty acid metabolism………………………………………………………………………… 107
4.1 Introduction…………………………………………………………….. 107
4.2 Material and methods…………………………………………………... 107
4.2.1 Cell culture…………………………………………………… 107
4.2.2 Basal medium…………………………………………………108
4.2.3 Lactogenic medium…………………………………………... 109
4.2.4 Preparation of LCFA solutions………………………………. 109
4.2.5 Treatment of MAC-T cell with exogenous fatty acids………. 109
4.2.6 Measurement of the TAG, DNA and protein content in cytosol…………………………………………………….…........... 110 4.2.7 Fatty acid analysis from cells and media…………………….. 111
4.3 Statistical analysis and design…………………………………………. 112
4.4 Results………………………………………………………………….. 113
4.4.1 Accumulation of cytosolic triacylglycerol…………………… 113
4.4.2 Cytosolic protein content…………………………………….. 115
v
4.4.3 Cytosolic DNA content………………………………………. 116
4.4.4 Accumulation of cytosolic triacylglycerol normalized for protein content……………………………………………………………… 117
4.4.5 Accumulation of cytosolic triacylglycerol normalized DNA content……………………………………………………………… 119
4.4.6 Cytosolic fatty acid profile……………………………………122
4.4.6.1 Saturated fatty acids………………………………... 122
4.4.6.2 Monounsaturated fatty acids and trans fatty acids… 122
4.4.6.3 Polyunsaturated fatty acids………………………… 122
4.4.6.4 Major fatty acid classes in cytosol………………… 122
4.4.7 Media fatty acid profile………………………………………. 123
4.4.7.1 Saturated fatty acids………………………………... 123
4.4.7.2 Monounsaturated fatty acids……………………….. 123
4.4.7.3 Polyunsaturated fatty acids………………………… 123
4.4.7.4 Major fatty acid classes in the media………………. 123
4.5 Discussion……………………………………………………………… 124
4.5.1 Cytosolic TAG accumulation (mmol/well)………………….. 125
4.5.2 Cytosolic TAG accumulation normalized for protein (µg / mg protein) and DNA (µg of TAG / µg of DNA) contents……………. 125
4.5.3 Cytosolic and media fatty acid profiles……………………… 127
4.5.4 Cytosolic versus media fatty acid profiles…………………… 128
4.5.5 Cytotoxicity (lipotoxicity)…………………………………… 129
4.5.6 Importance of FA groups on lipid metabolism………………. 129
4.5.7 Trans fatty acids in lipid metabolism…………………………130
4.6 Conclusions…………………………………………………………….. 131
4.7 Implications……………………………………………………………..131
CHAPTER 5
5. General discussion and conclusions………………………………………….. 134
5.1 General discussion…………………………………………………….. 134
5.2 Ruminal infusions of dietary oils……………………………………… 137

vi
5.3 Ruminal fermentation………………………………………….............. 138
5.4 Plasma fatty acid profile………………………………………………. 139
5.5 Lipoprotein fractions…………………………………………………… 141
5.6 Fatty acid composition of the lipoprotein lipids……………………….. 142
5.7 Cellular fatty acid metabolism…………………………………………. 143
5.8 Importance of the results shown in this thesis…………………………. 145
5.9 Limitations……………………………………………………………... 147
5.10 Implications……………………………………………………………149
5.11 Future work…………………………………………………………… 150
5.12 Conclusions………………………………………………………....... 151
Appendix 1 Methods associated with in vivo experiments
A.1.1 Fatty acid analysis of plasma and lipoprotein fractions……………. 153
A.1.2 Extraction of lipid from plasma and lipoprotein samples for thin layer
chromatography……………………………………………………………. 155
A.1.3 Volatile fatty acid analysis………………………………………….. 158
A.1.4 Separation of lipoproteins from bovine plasma by Preparative Sequential
Ultracentrifugation…………………………………………………………. 159
A.1.5 Salt solutions for ultracentrifugation of lipoproteins………………... 161
Appendix 2 Methods associated with cell cultures
A.2.1 MAC-T cell preparation for treatments……………………………... 163
A.2.2 Preparation of LCFA solutions for cell cultures……………………. 165
A.2.3 Fatty acid analysis of MAC-T cells…………………………………. 166
A.2.4 Protein assay by method of Lowry et al. (1951)……………………. 167
A.2.5 DNA quantification – Hoechst fluorimetric method………………… 168
A.2.6 Triacylglyceride (TAG) quantification……………………………… 169
A.2.7 Cryopreservation method for MAC-T cells…………………………. 173
Appendix 3 Cytosolic and media fatty acid profiles
A.3.1 Cytosolic fatty acid profile………………………………………… 173
vii
A.3.1.2 Saturated fatty acids……………………………………… 173
A.3.1.3 Monounsaturated fatty acids and trans fatty acids……….. 174
A.3.1.4 Polyunsaturated fatty acids………………………………... 175
A.3.1.5 Major fatty acid classes in cytosol………………………… 176
A.3.2 Media fatty acid profile……………………………………………… 178
A.3.2.1 Saturated fatty acids……………………………………….. 178
A.3.2.2 Monounsaturated fatty acids………………………………. 179
A.3.2.3 Polyunsaturated fatty acids………………………………... 179
A.3.2.4 Major fatty acid classes in the media……………………… 180
Bibliography………………………………………………………………………. 182
viii
ABSTRACT
In this thesis, aspects of metabolism of lipids in dairy cows were studied, particularly
18:1 trans fatty acid (tFA) concentrations in plasma and lipoprotein fractions, and
transportation of FA in epithelial mammary gland cell cultures.
Two in vivo studies were conducted to elucidate which lipoprotein fractions were
involved in bovine plasma transport of tFA by infusing oils that induced different
plasma tFA profiles. Fatty acid profiles of plasma and lipoprotein fractions [high
(HDL), low (LDL), and very low density (VLDL) lipoprotein fractions] were analysed.
Results showed that VLDL fraction was the main transport mechanism of tFA in
plasma and was more responsive to supply of tFA.
MAC-T cell cultures were used to study specific aspects of lipid uptake without
interference from the cow’s digestive system and general metabolism. Treatments
consisted of adding long-chain FA solutions to lactogenic medium at varying
concentrations. After incubation, cystosolic triacylglycerol (TAG), protein and DNA
contents were determined. Results demonstrated that cytosolic TAG accumulation is
stimulated by addition of long-chain FA, which affects FA profile of cytosolic free FA.
Overall, results from this thesis enhance knowledge on plasma transport and
mammary uptake of 18:1 tFA in dairy cows. The information strengthens
understanding of some aspects of milk fat synthesis and metabolism of FA in dairy
cows fed with different sources of tFA. Findings from this thesis are important
because saturated FA and tFA in milk fat have caused concern among human health
researchers and more recently milk fat has gained appreciation as a functional food
due to the health-promoting potential of some FA (vaccenic and conjugated linoleic
acids) found specifically in ruminant-derived products.
ix
PUBLICATIONS AND PRESENTATIONS
E. Vargas-Bello-Pérez and P.C. Garnsworthy (2008). Trans fatty acids in milk of dairy cows. Hungarian Veterinary Journal. Vol. 130. Supplement II. ISSN 0025-004X E. Vargas-Bello-Pérez and P.C. Garnsworthy (2009). 7th Euro Fed Lipid (European Federation for the Science and Technology of Lipids) Congress. Transport of trans fatty acids in dairy cows. Eur. J. Lipid Sci. Technol. Vol 111, p 57. doi: 10.1002/ejlt.200990021 E. Vargas-Bello-Pérez and P. C. Garnsworthy (2010). Differential transport of trans fatty acids by bovine plasma lipoprotein fractions: 1. Soya oil and partially hydrogenated vegetable oil. Advances in Animal Biosciences, 1, pp 21-21 doi: 10.1017/S2040470010001640 E. Vargas-Bello-Pérez and P. C. Garnsworthy (2010). Differential transport of trans fatty acids by bovine plasma lipoprotein fractions: 2. Fish oil and partially hydrogenated vegetable oil. Advances in Animal Biosciences, 1, pp 22-22 doi: 10.1017/S2040470010001652 E. Vargas-Bello-Pérez, A.M. Salter and P.C. Garnsworthy (2010). Ruminal infusions of soya and partially hydrogenated vegetable oils affect ruminal fermentation parameters and plasma fatty acid profile. European Federation of Animal Production. Book of abstracts Vol. 16, p 214 (2010) doi: 10.3920/978-90-8686-708-0 E. Vargas-Bello-Pérez, A. M .Salter, J. J. Loor, P. C. Garnsworthy (2011). Effect of exogenous long chain fatty acids on cytosolic triacylglycerol content of bovine mammary epithelial cells. Advances in Animal Biosciences, 2, pp 6-6 doi: 10.1017/S2040470011000045
x
ACKNOWLEDGEMENTS
I would like to express my sincere gratitude to my supervisors Prof. Phil Garnsworthy
and Prof. Andy Salter for their valuable advice, guidance, constructive criticism and
encouragement throughout this project.
I would like to thank Consejo Nacional de Ciencia y Tecnología (CONACYT –
México) for the invaluable studentship.
A large number of persons in the Division of Animal Sciences and Nutritional
Biochemistry gave me important input on my experiments and shared their experience
with me. Thanks to: Mrs. Linda Sheldrick, Dr. Dongfang Li, Mr. Neil Saunders, Mrs.
Morag Hunter, Mrs. Sheila Northover, Mrs. Monica Bagshaw, Dr. Zoë Daniel and Mr.
Jim Craigon.
Finally, I would like to express my heartfelt thanks to Gema. Thank you very much
for your love, support, reassurance, encouragement, for putting up with me through
the tough times and for always keeping me feet on the ground.
A mis padres y hermana,
Ab imo pectore
Gracias, por todo su amor y apoyo a lo largo de este proceso.
A bove maiori discit arare minor!
Gratias maximas tibi ago
xi
LIST OF FIGURES
Chapter 1
Figure 1.1 Cis and trans configurations of carbon double bonds in fatty acids………………………………………………………………………...5 Figure 1.2 General pathway for rumen biohydrogenation of PUFA 18-carbon FA…………………………………………………………………………. 8 Figure 1.3 A) The bMEC were treated with 400 μM palmitate, stearate, oleate, or linoleate for 24 h. B) The bMEC were treated with various concentrations of palmitate, stearate, oleate, or linoleate complex for 24 h………………….. 34 Figure 1.4 A) The bMEC were treated with DMEM containing 10% FCS plus 10 mM-acetate, butyrate, or octanoate for 1, 3, 5 or 7 d, respectively. B) bMEC were treated with various concentrations of octanoate for 7 d…………….. 35
Chapter 2
Figure 2.1: 3 x 3 Latin square design…………………..…………………. 40
Chapter 3
Figure 3.1: 2 x 3 Crossover design………………………………………... 75
Chapter 4
Figure 4.1 MAC-T cells at ~100% (“cobblestone” morphology; Huynh et al. 1991)……………………………………………………………………… 108 Figure 4.2 Cytosolic triacylglycerol content (mmol / well). Fatty acid and concentration effects………………………………………………………. 114 Figure 4.3 Accumulation of triacylglycerol contents (µg / mg protein). Fatty acids and concentration effects…………………………………………….. 119 Figure 4.4 Accumulation of triacylglycerol contents (µg of TAG / µg of DNA). Fatty acid and concentration effects……………………………….. 121
Chapter 5
Figure 5.1 Biochemical pathways for ruminal biohydrogenation and endogenous synthesis of FA in dairy cows…………………………….…... 135 Figure 5.2 The experiments in this thesis studied some of the changes that occur in dietary FA from mouth to mammary gland……………………… 136
xii
LIST OF TABLES
Chapter 1
Table 1.1 Lipids in milk…………………………………………………… 9
Table 1.2 Fat composition of milk in the United Kingdom and composition of the major fatty acids in milk fat…………………………………………… 9
Table 1.3 Composition of blood lipoproteins……………………………... 21
Table 1.4 Typical saturated fatty acids in foods……………………………23
Table 1.5 Unsaturated fatty acids in foods………………………………… 24
Table 1.6 Quantities of trans-18:1 in butter and milk fat samples determined by GLC with capillary columns and corrected by analyses with the argentation (Ag)-TLC/GLC method…………………………………………………… 28
Chapter 2
Table 2.1 Volatile fatty acid concentrations of standard used in GC analysis……………………………………………………………………. 41 Table 2.2 Fatty acid composition of oils and skimmed milk emulsions used for ruminal infusions…………………………………………………………. 47
Table 2.3 Effect of treatments on ruminal fermentation parameters…..…. 48
Table 2.4 Treatment effects on major fatty acid classes in plasma and lipoprotein fractions……………………………………………………….. 49 Table 2.5 Fatty acid distribution of plasma…………………………...…… 50
Table 2.6 Concentrations of HDL and LDL/VLDL fractions in plasma….. 51
Table 2.7 Fatty acid distribution of HDL fraction………………………… 52
Table 2.8 Fatty acid distribution of LDL/VLDL fraction…………………. 53
Table 2.9 Interactions between fractions and treatments for concentrations of 18:1 trans isomers………………………………………………………….. 54
Table 2.10 Treatment effects on trans fatty acids in lipoprotein fractions... 54 Table 2.11a Lipid concentration and fatty acid content (g / 100 g) in each lipid subgroup of lipoprotein fractions in plasma from cows subjected to ruminal pulses …………………………………………………………………......56 Table 2.11b Fatty acid content (g /100 g) in each lipid subgroup of lipoprotein fractions in plasma from cows subjected to ruminal pulses......57
xiii
Table 2.12 Day and sampling time (h) effects in plasma trans fatty acids.. 58 Table 2.13 Day and sampling time (h) effects in the HDL fraction trans fatty acids……………………………………………………………………….. 59 Table 2.14 Day and sampling time (h) effects in the LDL/VLDL fraction trans fatty acids………………………………………………………………….. 60 Table 2.15 Day and time (h) effects on ruminal fermentation parameters... 62
Chapter 3
Table 3.1 Fatty acid composition of oils and skimmed milk emulsions used for ruminal infusions………………………………………………………….. 79
Table 3.2 Effects of treatments on ruminal fermentation parameters……. 80
Table 3.3 Treatment effects on major fatty acid classes in plasma and lipoprotein fractions……………………………………………………….. 81 Table 3.4 Fatty acid distribution of plasma……………………………….. 82
Table 3.5 Concentrations of HDL and LDL/VLDL fractions in plasma…. 83
Table 3.6 Fatty acid distribution of HDL fraction………………………… 84
Table 3.7 Fatty acid distribution of LDL fraction…………………………. 85
Table 3.8 Fatty acid distribution of VLDL fraction………………………. 86
Table 3.9 Interactions between fractions and treatments for concentrations of 18:1 trans isomers…………………………………………………………. 87
Table 3.10 Treatment effects on trans fatty acids in lipoprotein fractions.. 87 Table 3.11a Lipid concentration and fatty acid content (g/100g) in lipid subgroups of each lipoprotein fraction of plasma from cows subjected to ruminal pulses ................................................................................................89 Table 3.11b Fatty acid content (g/100g) in lipid subgroups of each lipoprotein fraction of plasma from cows subjected to ruminal pulses.............................90
Table 3.12 Day and sampling time (h) effects in plasma trans fatty acids…..91 Table 3.13 Sampling time (h) effect in the HDL fraction trans fatty acids.....92 Table 3.14 Sampling time (h) effect in the LDL fraction trans fatty acids.....92
xiv
Table 3.15 Sampling time (h) effect in the VLDL fraction trans fatty acids. 93 Table 3.16 Day and time (h) effects on ruminal fermentation parameters…. 94
Chapter 4
Table 4.1 Preparation of stock LCFA……………………………………... 110
Table 4.2 Concentration of stock
Table 4.3 Cytosolic triacylglycerol content (mmol / well)……………….. 113
LCFA - 30 mM (30nmoles / µl)………. 110
Table 4.4 Cytosolic protein content (mg / ml).............................................. 115
Table 4.5 Cytosolic DNA content (µg / ml)................................................ 116
Table 4.6 Accumulation of triacylglycerol contents (µg / mg protein)…… 118
Table 4.7 Accumulation of triacylglycerol contents (µg of TAG / µg of DNA)………………………………………………….. 120
xv
ABBREVIATIONS
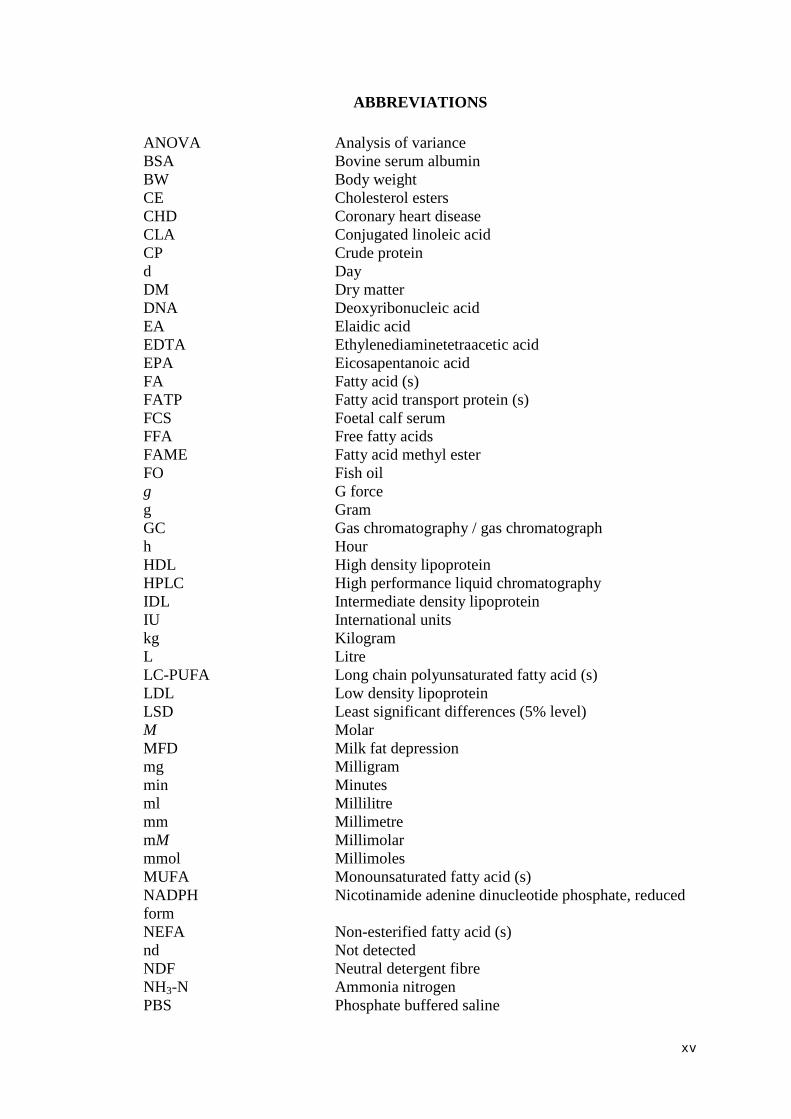
ANOVA Analysis of variance BSA Bovine serum albumin BW Body weight CE Cholesterol esters CHD Coronary heart disease CLA Conjugated linoleic acid CP Crude protein d Day DM Dry matter DNA Deoxyribonucleic acid EA Elaidic acid EDTA Ethylenediaminetetraacetic acid EPA Eicosapentanoic acid FA Fatty acid (s) FATP Fatty acid transport protein (s) FCS Foetal calf serum FFA Free fatty acids FAME Fatty acid methyl ester FO Fish oil g G force g Gram GC Gas chromatography / gas chromatograph h Hour HDL High density lipoprotein HPLC High performance liquid chromatography IDL Intermediate density lipoprotein IU International units kg Kilogram L Litre LC-PUFA Long chain polyunsaturated fatty acid (s) LDL Low density lipoprotein LSD Least significant differences (5% level) M Molar MFD Milk fat depression mg Milligram min Minutes ml Millilitre mm Millimetre mM Millimolar mmol Millimoles MUFA Monounsaturated fatty acid (s) NADPH Nicotinamide adenine dinucleotide phosphate, reduced form NEFA Non-esterified fatty acid (s) nd Not detected NDF Neutral detergent fibre NH3-N Ammonia nitrogen PBS Phosphate buffered saline

xvi
pH Log of reciprocal hydrogen ion concentration PHVO Partially hydrogenated vegetable oil PL Phospholipids PUFA Polyunsaturated fatty acid (s) rpm Revolutions per minute SCD Stearoyl CoA-desaturase SFA Saturated fatty acid (s) SED Standard error of difference SEM Standard error of the mean SM Skimmed milk SO Soya oil TAG Triacylglycerols TG Triglyceride TC Total cholesterol TLC Thin layer chromatography tFA Trans fatty acid (s) UFA Unsaturated fatty acid (s) uM Micromolar v/v Volume to volume VA Vaccenic acid VFA Volatile fatty acid (s) VLDL Very low density lipoprotein w/v Weight to volume WCOT Wall coated open tubular
xvii
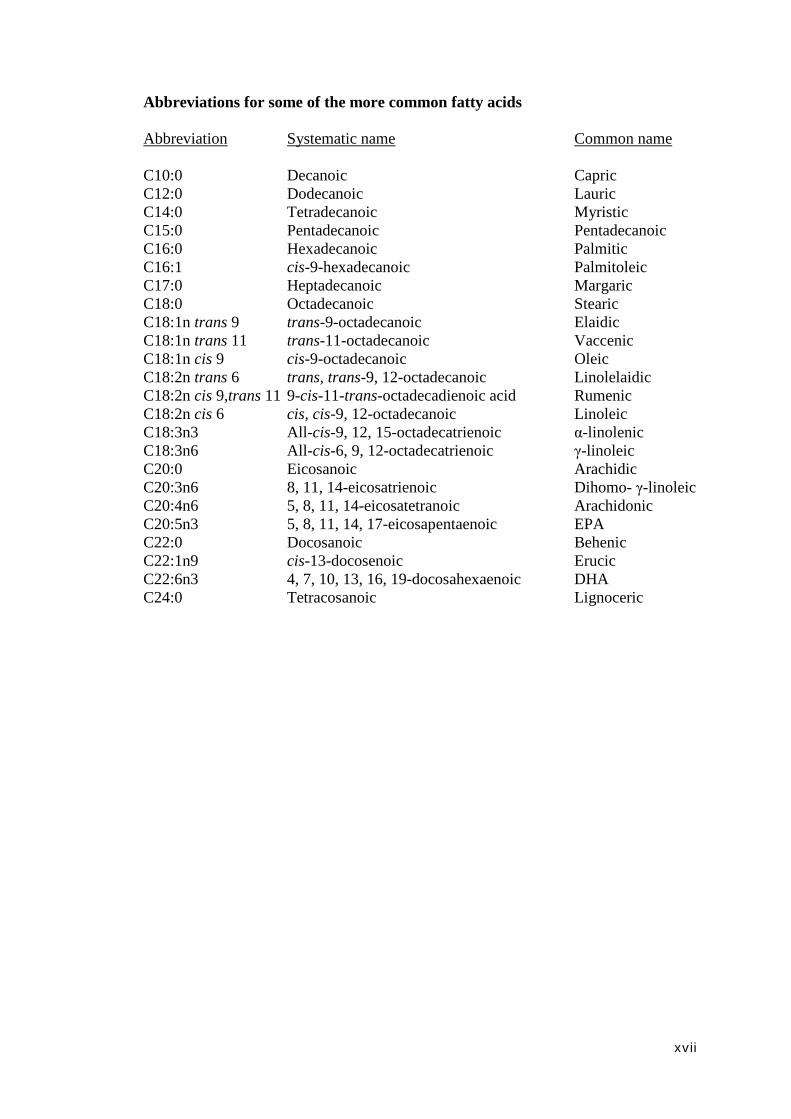
Abbreviations for some of the more common fatty acids Abbreviation Systematic name Common name C10:0 Decanoic Capric C12:0 Dodecanoic Lauric C14:0 Tetradecanoic Myristic C15:0 Pentadecanoic Pentadecanoic C16:0 Hexadecanoic Palmitic C16:1 cis-9-hexadecanoic Palmitoleic C17:0 Heptadecanoic Margaric C18:0 Octadecanoic Stearic C18:1n trans 9 trans-9-octadecanoic Elaidic C18:1n trans 11 trans-11-octadecanoic Vaccenic C18:1n cis 9 cis-9-octadecanoic Oleic C18:2n trans 6 trans, trans-9, 12-octadecanoic Linolelaidic C18:2n cis 9,trans 11 9-cis-11-trans-octadecadienoic acid Rumenic C18:2n cis 6 cis, cis-9, 12-octadecanoic Linoleic C18:3n3 All-cis-9, 12, 15-octadecatrienoic α-linolenic C18:3n6 All-cis-6, 9, 12-octadecatrienoic γ-linoleic C20:0 Eicosanoic Arachidic C20:3n6 8, 11, 14-eicosatrienoic Dihomo- γ-linoleic C20:4n6 5, 8, 11, 14-eicosatetranoic Arachidonic C20:5n3 5, 8, 11, 14, 17-eicosapentaenoic EPA C22:0 Docosanoic Behenic C22:1n9 cis-13-docosenoic Erucic C22:6n3 4, 7, 10, 13, 16, 19-docosahexaenoic DHA C24:0 Tetracosanoic Lignoceric

1
Chapter 1
Literature review
2
CHAPTER 1
1. Literature review
1.1 Introduction
Lipids obtained from dairy products are an important part of the human diet in many
countries; roughly 75% of the total consumption of fat from ruminant animals comes
from bovine milk fat (O’Donnell et al., 1993; Demeyer et al., 1999; Chilliard et al.,
2000). Milk fatty acid (FA) composition has numerous effects on milk quality,
including its physical properties (e.g. melting point and hardness of butter,
crystallization and fractionation of milk fat) and nutritional value (e.g. effects on
human health). Different FA (short- and medium-chain saturated, branched, mono-
and polyunsaturated, cis and trans, conjugated FA) present in ruminant milk fat are
potentially positive or negative factors for the health of consumers (Williams, 2000;
Jensen, 2002; Parodi, 2004; Chilliard et al., 2007). Dairy products provide 25–60% of
the overall saturated fat consumption in Europe, which, for decades has made them, a
target of concern due to the negative effects of excessive consumption of saturated FA
on human health (Givens and Shingfield, 2006; Chilliard et al., 2007). Recently
(Elwood et al., 2010) a review from different meta analyses showed that milk intake
reduces risk factors for ischemic heart disease, stroke and incident diabetes. However,
this does not necessarily apply to full fat dairy products such as butter and cream.
By altering the nutrition of the cow, farmers can markedly and rapidly modulate milk
FA composition. The largest changes can be obtained either by altering forages in
diets, particularly pasture, or by adding plant or marine lipid supplements to the diet
(Chilliard and Ferlay, 2004; Chilliard et al., 2001, 2003, 2007; Lock and Shingfield,
2004; Loor et al., 2005; Dewhurst et al., 2006). Modifying milk fat content by dietary
manipulation is not a recent concept (Palmquist and Beaulieu, 1993). In the early
1970s the concern for reducing saturated fat content in the human diet initiated an
intense research era (Grummer, 1991). In recent years the interest in reducing fat from
dairy products is mainly due to concern about the hypercholesteraemic effects of
medium-chain saturated FA (Dewhurst and Lee, 2004). Conversely, in recent decades
the dairy industry has increased the fat content of milk by making genetic
modifications, principally in the British Friesian breed, with the aim of improving
yields of cheese and butter, and milk fat as an energy source in the human diet
(Palmquist and Jenkins, 1980; Wu et al., 1991; Dewhurst and Lee, 2004). Given that

3
economic factors define the future profits for farmers, dietary manipulation of fat
content may be the most practical and appropriate approach to change milk FA
composition.
Lipids from ruminant milk have been estimated to contain over 400 different FA and
this number is mainly due to events that take place within the rumen (Jensen, 2002;
Bauman and Griinari, 2003). Diet has major effects on ruminal bacteria population
and processes within the rumen. For this reason, diet and nutrition have an important
role in determining the fat content and FA composition of milk (Bauman and Griinari,
2003).
Some FA, such as butyric acid, oleic acid, polyunsaturated FA (PUFA) and
conjugated linoleic acid (CLA) have potential anticarcinogenic and antiatherogenic
effects on human health. Other FA, such as some saturated (lauric, myristic and
palmitic acids) and some trans FA (tFA), have potential negative effects on human
health (Willet et al., 1993; Kinsella et al., 1990; Molkentin, 1999; Parodi, 1999;
Chilliard et al., 2000).
Trans fatty acids are produced during biohydrogenation of PUFA in the rumen. They
are mixtures of positional and geometric isomers (Griinari and Bauman, 1999;
Piperova et al., 2004), which are incorporated into milk fat (Parodi, 1977; Griinari and
Bauman, 1999; Loor and Herbein, 2001; Piperova et al., 2002, 2004; Precht et al.,
2002). There has been intensive research on tFA, mainly on the negative effect of
specific isomers of 18:1 trans that can be found in either dairy products or chemically
produced partially hydrogenated vegetable oils (PHVOs) (Willet et al., 1993; Wolff,
1995; Chilliard et al., 2000). There is also interest in the role of trans isomers of 18:1
mediating the milk fat depression associated with some specific dairy diets (Griinari et
al., 1998, 1999; Chilliard et al., 2000).
A number of researchers have highlighted the negative effect of tFA on milk fat
concentration. However, the exact mechanisms of this phenomenon remain unclear.
Milk fat depression has a great impact on economics, causing important losses to dairy
producers. Therefore, more research is needed to understand the exact mechanisms by
which tFA cause milk fat depression. Additionally, the influence of tFA on milk
4
composition is of interest due to their biological effects and potential role in human
diseases.
1.2 Lipids
Lipids are a group of heterogeneous chemically substances that are insoluble in water,
but soluble in non-polar solvents such as chloroform, hydrocarbons and alcohols
(Christie, 1981). Lipids include a wide range of compounds including neutral fats
(triacylglycerols), waxes, terpenes and more complex lipids such as glycolipids and
phospholipids. Lipids play important biological roles as structural cell membrane
components, storage forms of energy, metabolic fuels, emulsifying and insulating
agents, steroid hormones, vitamins, prostaglandins and roles in signal transduction
(Hajri and Abumrad, 2002; Doege and Stahl, 2006).
1.2.1 Fatty acid nomenclature
The number, geometry, and position of double bonds in FA affect their melting point.
Triglycerides high in long-chain saturated FA will easily conglomerate in a crystal
lattice and are therefore solid at room temperature (Katan and Zock, 1995). On the
other hand, cis unsaturated double bonds introduce bends in the molecule that hinders
crystal formation, which explains why oils are liquid. The spatial structure of tFA is in
between that of saturated FA and cis unsaturated FA. As a result, oleic acid melts at
13°C; its trans isomer elaidic acid (18:1 trans 9) melts at 44°C; and stearic acid
(18:0), which is straight and saturated, melts at 72°C (Katan and Zock, 1995).
Different conventions are used to name unsaturated FA according to the number of
carbons in the molecule, the position of the centres of unsaturation (double bonds) and
the geometrical configuration of the double bonds. The carbon atoms of an acid can be
numbered (or lettered) either from the carboxyl group (Δ numbering system) or from
the carbon atom furthest from the carboxyl group (n or ω numbering system) (Katan
and Zock, 1995). FA names are abbreviated in the Δ nomenclature by listing the
number of carbon atoms followed by the number of double bonds: i.e. 16:1 Δ9. The
number after Δ in this classification system is the position of the double bond relative
to carboxyl end. For example, in 16:1 Δ9, the single double bond is nine carbon atoms
away from the carboxyl group; meaning that it is between carbon atoms 9 and 10,
counting the carboxyl carbon atom as carbon atom number 1. In the ω numbering
system, palmitoleic would be referred as 16:1 (n-7). This indicates seven carbon atoms
5
away from the ω-carbon atom (Katan and Zock, 1995). This system is currently most
widely used. Most unsaturated FA are found in the cis configuration where the
hydrogen atoms are on the same side of the double carbon bond, whereas tFA have
hydrogen atoms on opposite sides of the double bond (Figure 1.1) (Food Safety,
Authority of Ireland, 2008).
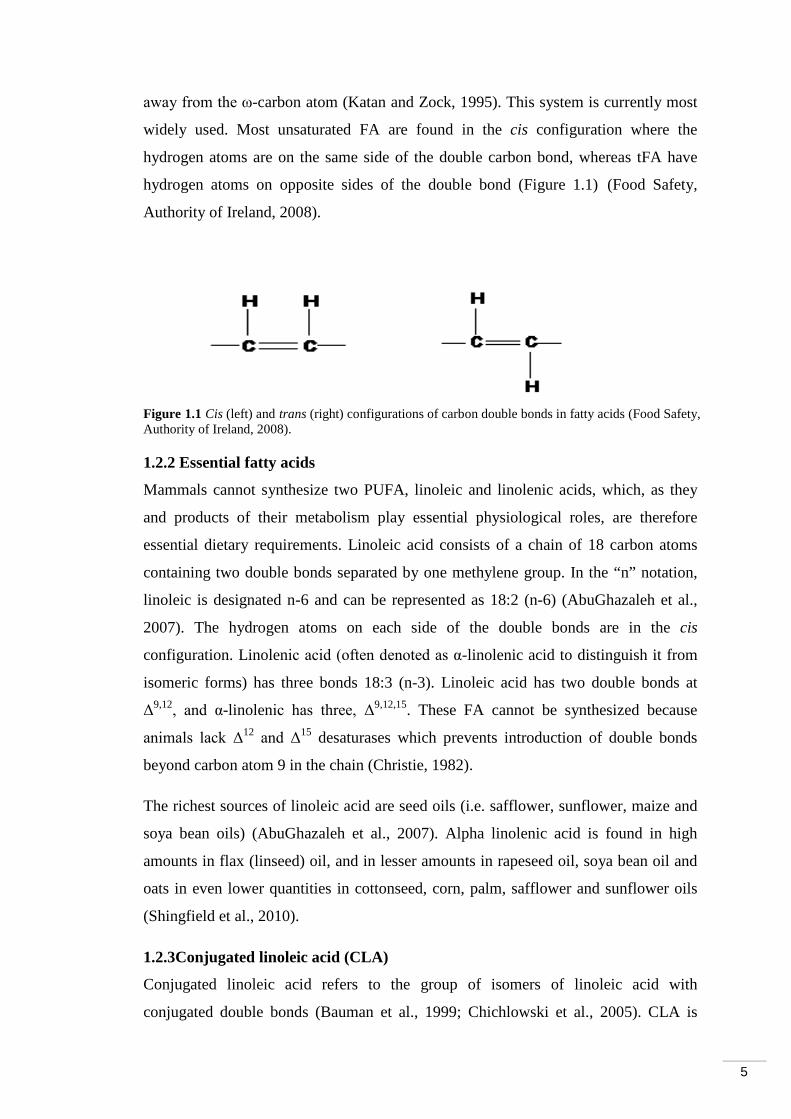
Figure 1.1 Cis (left) and trans (right) configurations of carbon double bonds in fatty acids (Food Safety, Authority of Ireland, 2008). 1.2.2 Essential fatty acids
Mammals cannot synthesize two PUFA, linoleic and linolenic acids, which, as they
and products of their metabolism play essential physiological roles, are therefore
essential dietary requirements. Linoleic acid consists of a chain of 18 carbon atoms
containing two double bonds separated by one methylene group. In the “n” notation,
linoleic is designated n-6 and can be represented as 18:2 (n-6) (AbuGhazaleh et al.,
2007). The hydrogen atoms on each side of the double bonds are in the cis
configuration. Linolenic acid (often denoted as α-linolenic acid to distinguish it from
isomeric forms) has three bonds 18:3 (n-3). Linoleic acid has two double bonds at
Δ9,12, and α-linolenic has three, Δ9,12,15. These FA cannot be synthesized because
animals lack Δ12 and Δ15 desaturases which prevents introduction of double bonds
beyond carbon atom 9 in the chain (Christie, 1982).
The richest sources of linoleic acid are seed oils (i.e. safflower, sunflower, maize and
soya bean oils) (AbuGhazaleh et al., 2007). Alpha linolenic acid is found in high
amounts in flax (linseed) oil, and in lesser amounts in rapeseed oil, soya bean oil and
oats in even lower quantities in cottonseed, corn, palm, safflower and sunflower oils
(Shingfield et al., 2010).
1.2.3Conjugated linoleic acid (CLA)
Conjugated linoleic acid refers to the group of isomers of linoleic acid with
conjugated double bonds (Bauman et al., 1999; Chichlowski et al., 2005). CLA is

6
produced during the biohydrogenation of PUFA in the rumen (Figure 1.2) (Griinari
and Bauman, 1999; Piperova et al., 2004). CLA is an intermediate in the rumen
hydrogenation of linoleic acid, whereas vaccenic acid (18:1 trans 11) is a common
intermediate in the biohydrogenation of linoleic and α- and γ-linoleic acids (Chilliard
et al., 2000). Griinari et al. (2000) demonstrated that endogenous synthesis of CLA cis
9, trans 11 from vaccenic acid represents the primary source of CLA in milk fat (Shen
et al., 2007).
Dairy products and meat from ruminants represent the only significant natural source
of CLA (Lawson et al., 2001; Burdge et al., 2005). CLA has been suggested to have
numerous beneficial physiological effects such as changes in body composition
(Gaullier et al., 2004; Chichlowski et al., 2005) and lower insulin resistance associated
with CHD (Aminot-Gilchrist and Anderson, 2004; Chichlowski et al., 2005). Other
health effects, such as anti-carcinogenic, anti-atherogenic, anti-obesity, anti-
diabetic and immune system enhancement, have been investigated in different animal
models, and to a lesser extent in humans (McGuire and McGuire, 2000;
Belury, 2002).
An increase in milk CLA, particularly rumenic acid content is associated with an
increase in other tFA, particularly 18:1 trans-11, which acts as a precursor of rumenic
acid via the enzymatic action of Δ9
-desaturase, and to a lesser extent 18:1 trans-10
(Williams, 2000; Lock and Garnsworthy, 2002; Lock et al., 2004; Hurtaud and
Peyraud, 2007). This was also reported by Chilliard et al. (2000), who found a linear
relationship between the content of CLA in milk and 18:1 trans. Similarly, Hurtaud
and Peyraud (2007) showed strong correlations between milk CLA and 18:1 trans.
Dietary starch and fibre levels affects biohydrogenation of FA by ruminal microflora
and hence, on the equilibrium of CLA isomers passing to the duodenum (Chilliard et
al., 2000; Offer et al., 2001). Supplementation of dairy cow diets with plant oils (soya
bean, sunflower, linseed, rapeseed and maize) results in significant increases in milk
fat CLA concentrations. Moreover, plant oils high in linoleic acid give the greatest
response in cattle. Feeding pasture to dairy cows has been also shown to increase milk
fat content of CLA (Stanton et al., 1997; Kelly et al., 1998; Lawless et al., 1998;
Chilliard et al., 2000; Boken et al., 2005; Hurtaud and Peyraud, 2007). However, other
studies have shown that milk CLA increases with diets low in 18:2, such as those
which include fish oil supplements; because of those observations it has been

7
suggested that CLA could be synthesized by tissues (i.e. adipose tissue) (Chilliard et
al., 2000).
Lock and Garnsworthy (2002) demonstrated that dietary lipid manipulation can alter
CLA cis-9, trans-11 content in milk fat when linoleic or linolenic acids are fed to
cows. They found similar increases in milk CLA cis-9, trans-11 content when either
dietary linoleic or linolenic acids were increased and higher concentrations were
observed when both oils were increased together. They also found that there was
considerably more CLA cis-9, trans-11 (approximately 80%) in milk than that
produced in the rumen in agreement with the concept of endogenous synthesis of CLA
cis-9, trans-11 in the mammary gland via the enzymatic action of Δ9-desaturase.
The concentration of CLA can be increased in pasture grazing cows when their feed is
supplemented with oils (Boken et al., 2005; AbuGhazaleh et al., 2007). Other studies
(Lawless et al., 1998) have concentrated on supplementation of grazing cows with
full-fat soyabeans or full-fat rapeseed to increase milk CLA concentration.
Alternatively, fish oil (FO) has been used as an effective means to increase
concentration of CLA in milk (AbuGhazaleh et al., 2007). However, there is low
efficiency of transfer of dietary (n-3) long-chain PUFA (LCPUFA) to milk (Offer et
al., 2001) mainly due to three factors occurring in the rumen:
1. Biohydrogention of these dietary lipids in the rumen (Figure 1.2)
2. Their selective incorporation into certain plasma lipoprotein fractions which
are ineffective in delivering FA into the mammary gland
3. A low specificity of the relevant enzymatic systems of the mammary gland for
these FA
8
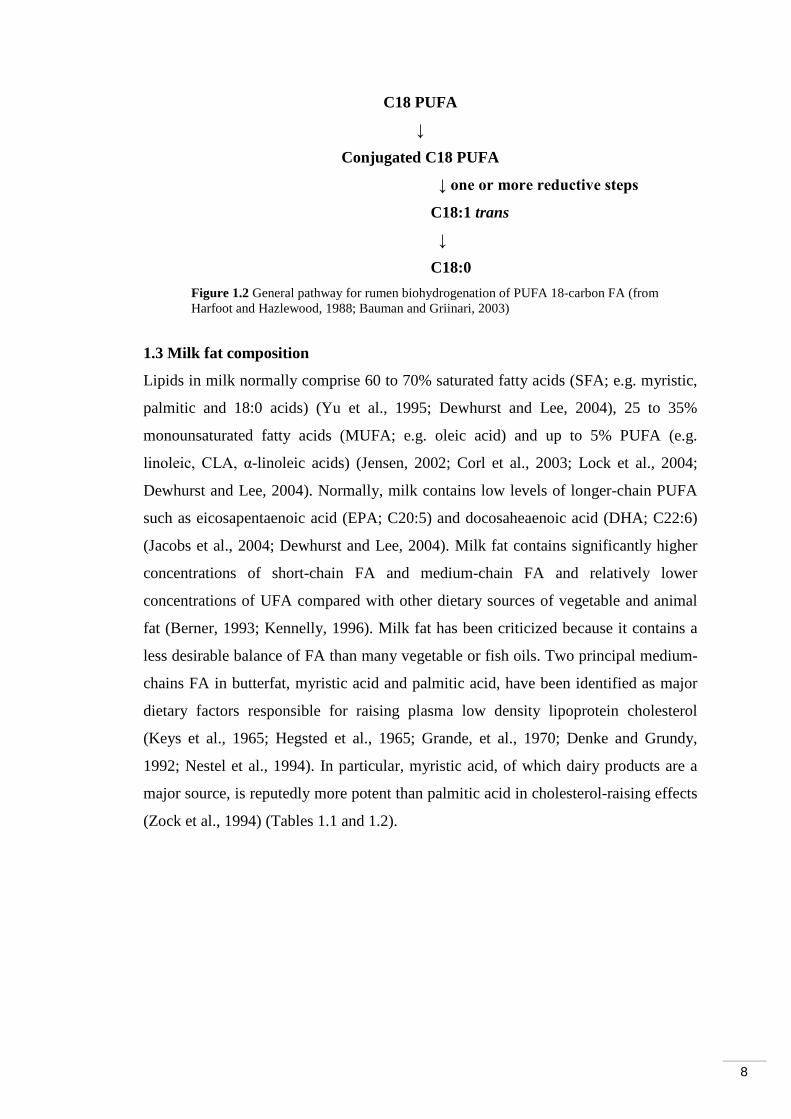
C18 PUFA
↓
Conjugated C18 PUFA
↓ one or more reductive steps
C18:1 trans
↓
C18:0 Figure 1.2 General pathway for rumen biohydrogenation of PUFA 18-carbon FA (from Harfoot and Hazlewood, 1988; Bauman and Griinari, 2003)
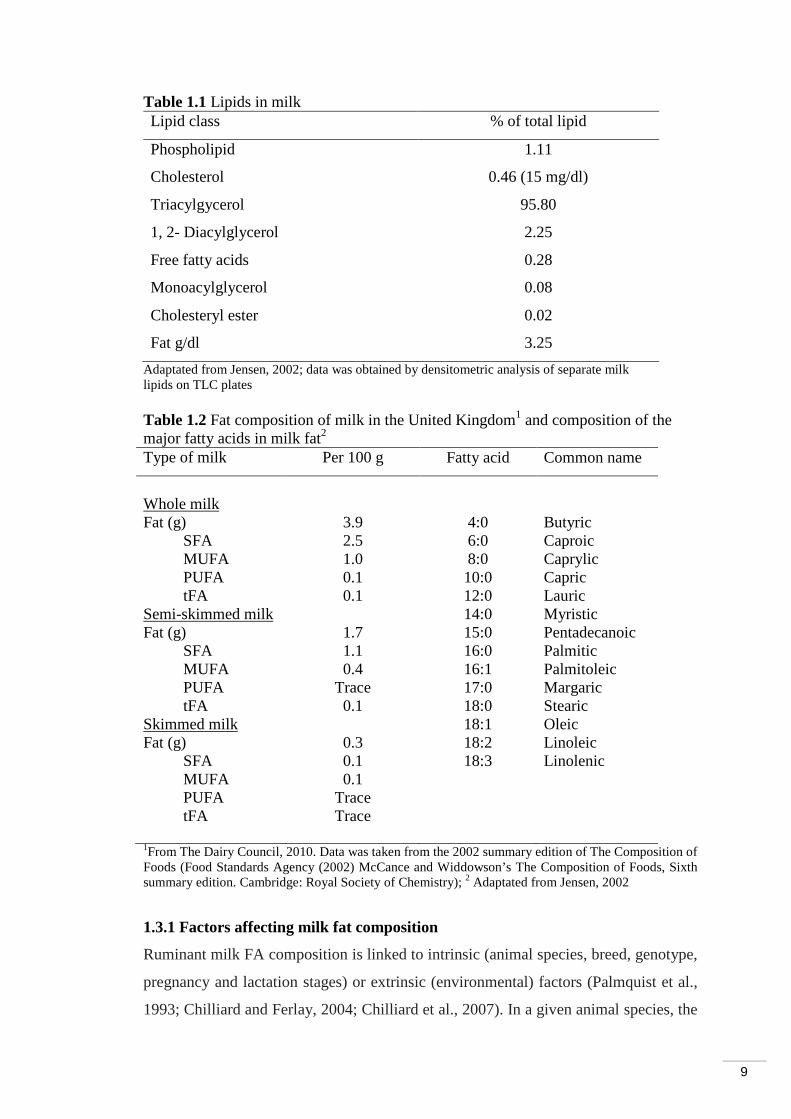
1.3 Milk fat composition
Lipids in milk normally comprise 60 to 70% saturated fatty acids (SFA; e.g. myristic,
palmitic and 18:0 acids) (Yu et al., 1995; Dewhurst and Lee, 2004), 25 to 35%
monounsaturated fatty acids (MUFA; e.g. oleic acid) and up to 5% PUFA (e.g.
linoleic, CLA, α-linoleic acids) (Jensen, 2002; Corl et al., 2003; Lock et al., 2004;
Dewhurst and Lee, 2004). Normally, milk contains low levels of longer-chain PUFA
such as eicosapentaenoic acid (EPA; C20:5) and docosaheaenoic acid (DHA; C22:6)
(Jacobs et al., 2004; Dewhurst and Lee, 2004). Milk fat contains significantly higher
concentrations of short-chain FA and medium-chain FA and relatively lower
concentrations of UFA compared with other dietary sources of vegetable and animal
fat (Berner, 1993; Kennelly, 1996). Milk fat has been criticized because it contains a
less desirable balance of FA than many vegetable or fish oils. Two principal medium-
chains FA in butterfat, myristic acid and palmitic acid, have been identified as major
dietary factors responsible for raising plasma low density lipoprotein cholesterol
(Keys et al., 1965; Hegsted et al., 1965; Grande, et al., 1970; Denke and Grundy,
1992; Nestel et al., 1994). In particular, myristic acid, of which dairy products are a
major source, is reputedly more potent than palmitic acid in cholesterol-raising effects
(Zock et al., 1994) (Tables 1.1 and 1.2).
9
Table 1.1 Lipids in milk Lipid class % of total lipid
Phospholipid 1.11
Cholesterol 0.46 (15 mg/dl)
Triacylgycerol 95.80
1, 2- Diacylglycerol 2.25
Free fatty acids 0.28
Monoacylglycerol 0.08
Cholesteryl ester 0.02
Fat g/dl 3.25
Adaptated from Jensen, 2002; data was obtained by densitometric analysis of separate milk lipids on TLC plates Table 1.2 Fat composition of milk in the United Kingdom1 and composition of the major fatty acids in milk fat2
Type of milk Per 100 g Fatty acid Common name
Whole milk
Fat (g) 3.9 4:0 Butyric SFA 2.5 6:0 Caproic MUFA 1.0 8:0 Caprylic PUFA 0.1 10:0 Capric tFA 0.1 12:0 Lauric
Semi-skimmed milk 14:0 Myristic Fat (g) 1.7 15:0 Pentadecanoic SFA 1.1 16:0 Palmitic MUFA 0.4 16:1 Palmitoleic PUFA Trace 17:0 Margaric tFA 0.1 18:0 Stearic
Skimmed milk 18:1 Oleic Fat (g) 0.3 18:2 Linoleic SFA 0.1 18:3 Linolenic MUFA 0.1 PUFA Trace tFA Trace 1From The Dairy Council, 2010. Data was taken from the 2002 summary edition of The Composition of Foods (Food Standards Agency (2002) McCance and Widdowson’s The Composition of Foods, Sixth summary edition. Cambridge: Royal Society of Chemistry); 2 Adaptated from Jensen, 2002
1.3.1 Factors affecting milk fat composition
Ruminant milk FA composition is linked to intrinsic (animal species, breed, genotype,
pregnancy and lactation stages) or extrinsic (environmental) factors (Palmquist et al.,
1993; Chilliard and Ferlay, 2004; Chilliard et al., 2007). In a given animal species, the
10
effects linked to breed or genotypes are significant but restricted and they can only be
altered over long terms. The effect of lactation stage on milk fat content and FA
composition is associated to body fat mobilization in early lactation (Chilliard et al.,
1991, 2007), but it only lasts a few weeks each year. Garnsworthy et al. (2006)
investigated the variation in citrate with stage of lactation and de novo FA synthesis,
without confounding dietary effects. They found that cows in late lactation produced
milk with a FA profile similar to that of cows in mid lactation. Differences between
mid and late lactation in yield of FA were due to differences in milk fat yield,
concluding that stage of lactation does not affect the relative incorporation of FA from
de novo synthesis vs. preformed sources when diet composition is constant.
1.4 Dietary fat in dairy cow diets
Supplementation with lipids has been used to increase the energy concentration of the
diet and to avoid negative associative effects on dry matter intake, digestibility, and
milk production and composition sometimes experienced with cereal grains (Coppock
and Wilks, 1991; Staples et al., 1998; Garnsworthy, 1997). Many sources of
supplemental fat have been fed to beef and dairy cattle under experimental conditions.
These include blends of animal and vegetable fat, tallow, yellow grease, fishmeal,
cottonseeds, soyabeans, rapeseeds, canola seeds, peanut hearts, safflower seeds,
sunflower seeds, flaked fat, prilled fat, hydrogenated fat, calcium soaps of fat,
medium-chain triglycerides, and free FA (Staples et al., 1998; Funston, 2004). The FA
profile of these fat sources varies widely. Coppock and Wilks (1991) reported the FA
profile of many of the commonly used fats. The major FA in most feed lipids is
linoleic acid whereas linolenic acid predominates in most forage lipids (Staples et al.,
1998). Tallow (40.9%) and yellow grease (46.8%) contain different contents of oleic
acid (Coppock and Wilks, 1991). Granular fats, such as calcium soaps of palm oil, and
prilled fats contain mainly saturated palmitic and stearic acids (Staples et al., 1998).
The fat content of ordinary diets for ruminants is less than 50 g/kg and digestive
problems can occur by increasing total fat content of the diet to more than 100 g/kg
(Garnsworthy, 1997). Rumen microorganisms cannot utilise large quantities of fat,
although limited quantities of FA can be incorporated into microorganisms during cell
synthesis. More important than the quantity of FA in the diet is their form, since long-
chain UFA have a detergent effect on bacterial cell walls. Under normal
circumstances, the ester linkages of tryglycerides are rapidly hydrolysed by bacterial

11
lipases in the rumen. Once released from the ester combination, unsaturated fatty acids
are subsequently hydrogenated to detoxify them (Garnsworthy, 1997). Fibre particles
in the rumen can be physically coated by fat and be inaccessible for microbial attack.
The magnitude of these effects depends on level, source and type of fat, dietary
carbohydrate source and feed intake. Similarly, another problem is that long-chain
free FA can form soaps with calcium and magnesium in the rumen. This will detoxify
FA, but it can also reduce the availability of minerals (Garnsworthy, 1997).
Theoretically, supplementation of fat could have some of the following advantages:
a. Increase the energy concentration of the diet because fat contains three times
more net energy for lactation than protein- and carbohydrate-rich feeds
(Palmquist, 1984)
b. Improve the energetic efficiency because reduced loss of energy as heat,
methane, and urine may be expected (Palmquist and Jenkins, 1980), and
because the dietary fatty FA are incorporated directly into milk fat by the
mammary gland (Wu and Huber, 1994; Garnsworthy, 1997)
c. Reduce the risk of rumen acidosis and a decrease in milk fat percent induced
by feeding high levels of cereal grains in the diet (Palmquist and Conrad,
1978; Palmquist, 1984)
Lipids can be manipulated by several means in order to avoid adverse effects in the
rumen and to retain availability in the small intestine (Palmquist, 1984). These
modified fat products are known as “by-pass fats” or “rumen inert fats”, and their
protection against rumen microbial action can be natural (i.e., encapsulation in
formaldehyde-treated casein or formation of calcium soaps) or physical (i.e., selection
of fatty acids with a high melting point and small particle size) (Garnsworthy, 1997).
Development of commercial products based on calcium soaps of long-chain fatty
acids offers dairy cattle producers a method of increasing energy concentration of
rations without disturbing rumen fermentation (Palmquist, 1984; Chalupa et al., 1986;
Espinoza et al., 1995).
Fat supplementation has been associated with positive and negative effects on
reproduction although (Grummer and Carroll, 1991; Fahey et al., 2002) the amount of
12
supplemental fat needed to elicit an effect on reproductive function is largely
unknown. Some studies indicate that the amount of added plant oil necessary to
maximize positive ovarian effects is not less than 4% (Stanko et al., 1997; Thomas,
Bao and Williams, 1997). Staples et al. (1998) found that 3% added dietary fat (DM
basis) has often positively influenced the reproductive status of the dairy cow. Lower
levels of added fat (2%) have also been shown to affect positively reproductive
performance (Bellows et al., 1978).
Lipids are rich sources of energy and have important roles in the structure and
function of different biological membranes (Cribier et al., 1993; Fouladi-Nashta et al.,
2007). Dietary FA are crucial in the reproductive performance of dairy cows due to
their influence on the energy balance and other reproductive processes that are not
related to energy (Thatcher et al., 2002; Fouladi-Nashta et al., 2007).
Feeding fat to cattle generally improved establishment and maintenance of pregnancy.
Potential improvements in fertility of cows caused by fat feeding have generally been
associated with enhanced follicle development postpartum, increased diameter of the
ovulatory follicle, increased progesterone (PG) concentrations during the luteal phase
of the cycle, altered uterine/embryo cross-talk by modulating PG synthesis, and
improved oocyte and embryo quality. Some of these effects have been more
influenced by the type of FA than by fat feeding per se. Differential responses in vivo
to FA feeding suggest that UFA of the n-6 and n-3 families were most beneficial
(Santos et al., 2008).
1.4.1 Saturated fatty acids and oleic acid
There is a huge potential to alter medium-chain SFA (10:0 to 16:0). For example, it
has been reported (Roy et al., 2006; Chilliard et al., 2007) that cows fed with hay-
based diets can increase these four FA to 56% of milk fat whereas supplementation
with linseed oil can decrease them to 29%. Lipid supplements rich in medium-chain
FA, can increase these FA; for example, calcium salts of palm oil increased palmitic
acid concentration (Chilliard et al., 2007).
On the other hand, it has been shown (Collomb et al., 2004; Loor et al., 2005;
Gonthier et al., 2005) that stearic acid in milk can be increased either by dietary 18:0
intake or by supplementation of 18-carbon unsaturated FA, because they are
hydrogenated to 18:0 in the rumen (Loor et al., 2004, 2005; Chilliard et al., 2007).
13
Similarly, secretion of oleic acid can be increased through its direct gut absorption and
mammary gland secretion or, perhaps more importantly, from its ruminal
biohydrogenation followed by mammary desaturation of 18:0. Also its concentration
can be increased by manipulating the distribution of oleamides (amides of oleic acid
that resists ruminal biohydrogenation and elevate milk oleic acid concentration when
fed to lactating cows) (Jenkins, 1998, 2006; Loor et al., 2002; Chilliard et al., 2007).
1.4.2 Lipid metabolism in the rumen
Unlike monogastrics, in which lipid digestion and absorption take place primarily in
the stomach and small intestine, in ruminants the rumen plays an important role.
Dietary lipids also affect ruminal fermentation, and ruminal fermentation in turn
affects the digestion and utilization of other nutrients. Hence, dietary lipids can have
profound effects on ruminant nutrition and animal performance. Grummer (1991) and
Mansbridge and Blake (1997) studied ruminal lipids metabolism focusing on
manipulation of physicochemical events in the rumen with two purposes:
1) To control the adverse effect of fatty acids on ruminal bacterial growth so
that supplementary lipids do not adversely affect ruminal fermentation and
nutrient digestion and
2) To regulate ruminal biohydrogenation to alter profiles of fatty acids
reaching the small intestine and those secreted in milk.
There are three major factors that influence the transfer of dietary fat to milk fat (Wu
et al., 1991; Palmquist et al., 1993):
1) Ruminal biohydrogenation
2) Absorption (digestibility)
3) Deposition in adipose tissue
For decades farmers have fed lipid supplements to modify and improve dairy
performance and energy metabolism (Chilliard et al., 1993; Lock and Shingfield, 2004;
Chilliard et al., 2007) and milk FA composition (Palmquist et al., 1993; Givens and
Shingfield, 2006; Chilliard et al., 2000, 2006, 2007). Both source and presentation
form of the lipids influence their effects. Changing the proportion of one category of
14
FA often has consequences for other FA. Thus, feeding a diet that increases PUFA
and/or CLA and decreases in milk SFA results in higher 18:1 trans concentration
(Lock et al., 2005; Roy et al., 2007; Bauchart et al., 2007; Chilliard et al., 2007).
Dietary lipids are mainly in the form of triacylglycerols, with small amounts in the
form of monoacylglycerols, free FA, galactolipids and phospholipids (Mansbridge and
Blake, 1997). Most common lipid supplements comprise predominantly of FA (90-
95%) with a chain length greater than 14 carbons and typically contain greater than
75% C18 FA. The degree of unsaturation varies considerably (Grummer, 1991).
Ingested lipids are subjected to two important microbial transformations in the rumen,
lipolysis and biohydrogenation.
1.4.3 Lipolysis
Dietary lipids, if not protected, are rapidly and almost completely hydrolyzed to
glycerol and free FA by lipases from different strains of bacteria. This process is
referred to as lipolysis. Protozoa are not involved to any great extent in hydrolysis,
except for that of phospholipids (Doreau and Ferlay, 1994). According to Bauchart et
al. (1990), the extent of ruminal hydrolysis of lipids is high for most unprotected lipids
(85-95%). Anaerovibrio lipolytica, which is best known for its lipase activity,
produces a cell-bound esterase and a lipase (Harfoot, 1978). These lipases hydrolyze
acylglycerols completely to free FA and glycerol with little accumulation of mono- or
diglycerides (Jenkins, 1993). Glycerol is fermented to volatile or short chain fatty
acids, mainly propionate and butyrate (Doreau and Ferlay, 1994), which are absorbed
through the ruminal wall, and may eventually be used as precursors for de novo
synthesis of short- and medium chain FA in the mammary gland (Mansbridge and
Blake, 1997). Released FA are subjected to subsequent biohydrogenation and /or used
for synthesis of microbial lipids. The dietary short-chain SFA released by microbial
lipolysis are also absorbed through the ruminal wall into the blood stream (Doreau and
Ferlay, 1994). Fatty acids also are released from plant galactolipids and phospholipids;
hydrolysis of those esterified lipids is attributed to a variety of galactosidases and
phospholipases produced by ruminal microbes (Jenkins, 1993).
1.4.4 Biohydrogenation
Released UFA are subjected to rapid and extensive biohydrogenation of double bonds
by ruminal microbes to saturated products. This process may have evolved to protect
microbes from toxic effects of UFA, because UFA are more toxic to ruminal microbes
15
than SFA (Palmquist and Jenkins, 1980). Biohydrogenation occurs only on free fatty
acids with a free carboxyl group adsorbed on feed particles or microbial cells
(Harfoot, 1978). The first step in biohydrogenation is an isomerization reaction that
converts the cis-12 double bond to a trans-11 isomer, catalyzed by isomerase. The
isomerase is not functional unless the FA has a free carboxyl group. This requirement
establishes lipolysis as a prerequisite for biohydrogenation (Kepler et al., 1970;
Jenkins, 1993). The extent to which UFA are biohydrogenated depends on several
factors, such as forage:concentrate ratio (Kucuk et al., 2001) and type of protective
treatment of the dietary fat (Tymchuk, 1998; Whitlock et al., 2002).
Lipolysis and biohydrogenation by rumen bacteria can be reduced by treating lipids
chemically (e.g. formaldehyde treatment or calcium salts) or physically (e.g. heat) to
resist microbial lipolysis and saturation in the rumen. Intact oilseeds also provide a
degree of protection from biohydrogenation by microbial enzymes (Kennelly, 1996;
Petit, 2001).
It has been reported (Doreau and Ferlay, 1994; Loor et al., 2005) that the process of
biohydrogenation of PUFA in the rumen can be reduced with high concentrate diets
causing low conversion of 18:1 trans isomers to 18:0. This phenomenon may be
provoked by shifts in bacterial populations (Loor et al., 2005) and decreases in pH
(Kalscheur et al., 1997; Loor et al., 2005). Loor et al. (2004, 2005) proposed other
factors (e.g. dietary starch amount and degradation rate, buffering capacity) that
contribute to accumulation of biohydrogenation intermediates in the rumen with high
concentrate diets. A shift in biohydrogenation pathways due to diet can have a huge
impact if the shift enhances ruminal production of 18:1 trans 10 and 18:2 trans 10, cis
12; which are associated with milk fat depression (Bauman and Griinari, 2003; Loor et
al., 2005).
1.4.4.1 Biohydrogenation intermediates
The major tFA intermediates produced from the ruminal metabolism of linoleic acid
are 18:1 trans 11 and cis 9, CLA trans 11. However, the dynamics of the ruminal
biohydrogenation pathways allow production of a wide range of positional and
geometrical FA isomers as well as modified FA such as hydroxyl and keto derivates
(Jenkins et al., 2008; Harvatine et al., 2008). These compounds are absorbed and
incorporated into milk fat at varying concentrations. However, production of high
16
concentrations of these FA can be induced only under experimental conditions
involving atypical diets (Lock and Bauman, 2004; Shingfield and Griinari, 2007;
Harvatine et al., 2008).
1.4.5 Effects of dietary lipids on rumen fermentation
Lipids added to ruminant diets can disrupt ruminal fermentation, causing reduced
digestibility of other nutrients, especially those of non-lipid energy sources. It has
been shown that ruminal digestion of structural carbohydrate can be reduced 50% or
more by less than 10% added fat (Knight et al., 1978). This is accompanied by the
reduced production of methane, hydrogen and volatile FA, which are the products of
ruminal fermentation. Moreover, decreased ratio of acetate to propionate was
observed (Ikwuegbu and Sutton, 1982). This negative effect of added fat on
fermentation of structural carbohydrate can be alleviated to some extent by hindgut
fermentation, but increased fibre excretion in faeces often still occurs (Palmquist and
Jenkins 1980). Several mechanisms have been proposed to explain how dietary lipids
interfere with ruminal fermentation. The generally accepted theories are:
• Close physical attachment of microbial matter to feed particles is necessary for
cellular digestion in rumen, and physical coating of the fibre with dietary fat
prevents microbial attack.
• Direct antimicrobial effects of lipids on certain microorganisms (Jenkins,
1993).
A depression in milk protein content is frequently observed with dietary lipid
supplementation (Doreau and Chilliard, 1997). Wu and Hubert (1994) showed that the
decrease of milk protein was attributed to a lack of increase in amino acids available
to the mammary gland for protein synthesis as milk yield increased during fat
supplementation. However, daily protein production may be unchanged as
supplemental fat has a positive effect on milk production (Kennelly, 1996). In some
cases, high dietary fat can cause decreases in both milk protein percentage and yield.
This is possible because dietary fat adversely affects microbial fermentation and
microbial protein yield, thereby decreasing the supply of amino acids available for
absorption by the animal (Palmquist and Jenkins, 1980). However, previously Wu and

17
Hubert (1994) proposed four possible mechanisms to explain how dietary fat reduces
milk protein concentration:
1. Glucose deficiency
2. Insulin resistance
3. Increased energetic efficiency of milk production
4. Somatothrophin deficiency
Glucose deficiency appears to be the explanation for milk protein depression observed
with dietary fat supplementation. In order to maintain adequate protein supplies when
fats are included in a diet, dietary protein content should be increased and
consideration given to increasing the supply of fermentable carbohydrates. Even
where protein supply is sufficient, glucose status may be marginal with high fat diets,
due to insulin resistance and absorption requirements (Garnsworthy, 1997).
Compared with fibre and protein, ruminal digestibility of non-structure carbohydrate
is less affected by dietary fat. Several studies showed normal starch digestion in the
rumen of cattle that were fed additional fat even though dry matter or fibre
digestibility was depressed (Jenkins, 1993). Similarly, feeding high fat diets often
depresses feed and energy intakes. When cows are fed large amounts of fats which
cannot be metabolized, feedback satiety signals may be generated to prevent further
intake of food (Choi and Palmquist, 1996).
Detrimental effects of supplemental lipids on ruminal fermentation are affected by
several factors, including the degree of unsaturation, amount and type of fat fed.
Studies have demonstrated that UFA inhibit fermentation more than SFA (Jenkins,
1993; Doreau and Chilliard, 1997). The mechanism behind this phenomenon is not
clear. Unsaturated free fatty acids (FFA) concentration in the rumen is affected by the
amount and type of lipid fed and also by the rates of lipolysis, biohydrogenation, and
formation of carboxylate salts. A free carboxyl group seems important for inhibition
of ruminal fermentation. This is because FA derivatives, such as Ca salts of LCFA
(Enjalbert, 1994), fatty alcohols, fatty acyl amides and triglycerides inhibit
fermentation less than do FFA. Relevant knowledge has been used to produce ruminal
inert FA products for energy supply without adversely affecting ruminal fermentation
and nutrients utilization.

18
Compared with single fat sources, blended fat sources may have less or even no
adverse effects on ruminal fermentation and utilization of nutrients. Commercial
blends of animal fat and vegetable oil sometimes have little effect on fermentation,
and more resemble ruminally inert fats, despite their relatively high degree of
unsaturation (Jenkins, 1993).
Inclusion of FO, in the diet of ruminants, enhances the concentrations of 20:5n-3 and
22:6n-3 in milk (Offer et al., 1999; Shingfield et al., 2003; Loor et al., 2005a) and
muscle (Scollan et al., 2001; Kook et al., 2002). FO is also known to inhibit the
complete biohydrogenation of C18 PUFA to C18:0 resulting in an accumulation of
18:1 trans 11 (Shingfield et al., 2003, Lee et al., 2005, Loor et al., 2005b). This
particular FA is consequently available for endogenous conversion to CLA cis 9, trans
11 via the action of stearoyl-CoA desaturase in the mammary gland (Griinari et al.,
2000; Palmquist et al., 2005) and explains FO’s effect in enhancing CLA cis-9, trans-
11 concentration in milk (Offer et al., 1999; Chilliard et al., 2000; Shingfield et al.,
2003). Enhancement of CLA in ruminant products (meat and dairy) through dietary
manipulation is an important contributor towards the recommended CLA intake of
0.31 g/100 FA (Roche et al., 2001) as part of a complete diet approach (Lee et al.,
2008).
1.5 Milk fat synthesis
Fatty acids incorporated into milk triglycerides are derived from two sources, uptake
of preformed FA from peripheral circulation and FA synthesis in mammary secretory
cells. Depending on breed, stage of lactation and diet, FA synthesis de novo in the
bovine contributes to proportionately 0.60 on a molar basis or 0.40 by weight to total
FA secretion in milk (Shingfield et al., 2010).
Mammary epithelial cells synthesize short- and medium chain FA using acetate and 3-
hydroxy-butyrate as substrates. Fatty acid synthesis de novo accounts for all 4:0 to
12:0, most of the 14:0 (ca. 95%) and about 50% of 16:0 secreted in milk, whereas all
18 carbon and longer chain FA are thought to be derived from circulating plasma
lipids (Chilliard et al., 2000). De novo FA synthesis has an absolute requirement for
acetyl-CoA, the presence of two key enzymes, acetyl-CoA carboxylase and FA
synthase and a supply of NADPH reducing equivalents (Barber et al., 1997). Both 3-
hydroxy-butyrate and acetate contribute equally to the initial four carbon unit. Acetate
19
is converted to acetyl CoA in the cytosol and used to extend the chain length of
synthesized FA via the malonyl-CoA pathway, whereas 3-hydroxy-butyrate is
incorporated directly following activation to butyryl CoA. Conversion of acetate to
malonyl-CoA, catalyzed by ACC, is considered to be the rate limiting step (Bauman
and Davis, 1974).
1.5.1 Milk fat depression (MFD)
Decreases in milk fat synthesis are common in cows fed diets containing: high
proportions of concentrates, FO and marine algal lipids or ionophores (Bauman and
Griinari, 2001 and 2003). Even though certain attributes of a diet are important in the
establishment of MFD, there is considerable interaction between the composition of
the basal diet, amount and source of dietary lipid supplement and feeding frequency
(Chilliard et al., 2007; Shingfield and Griinari, 2007).
A number of theories have been proposed to explain diet induced MFD. The major
theories have attributed the decreases in milk fat synthesis during diet-induced MFD
to:
1. Reductions in the supply of acetate and 3-hydroxy-butyrate for de novo FA
synthesis in the mammary gland
2. Elevated insulin secretion stimulating the preferential partitioning of FA
towards adipose tissue at the expense of the mammary gland
3. Direct inhibition of mammary lipogenesis by tFA formed during the
biohydrogenation of dietary UFA in the rumen (Shingfield et al., 2010).
Of all the hypotheses developed to explain diet-induced MFD, the biohydrogenation
theory appears to be the most robust and offers a more convincing explanation for
MFD over a wider range of diets (Shingfield et al., 2010). However, increases in
ruminal outflow of CLA trans-10, cis-12, do not explain the decreases in milk fat
synthesis in all cases of diet-induced MFD, with the implication that additional
biohydrogenation intermediates and/or mechanisms must be involved (Shingfield and
Griinari, 2007). Milk fat depressing diets (high concentrate, high starch, PUFA, and
pasture sometimes) also alter ruminal environment (decrease in pH with high
concentrate) and fermentation products (increased propionate production). MFD diets,

20
thus, lead to a simultaneous increase of numerous FA isomers and other energetic
nutrients, complicating the elucidation of related mechanisms (Glasser et al., 2010).
1.6 Lipid transport
1.6.1 Plasma lipoproteins
The plasma lipoproteins are soluble complexes of lipids (triacylglycerols-TAG,
phospholipids, cholesterol esters and cholesterol) with specialized proteins
(apolipoproteins) (Vance and Vance, 1991). The main function of these lipoproteins is
to transport water insoluble lipids throughout the body. Lipoproteins deliver lipid to
cells efficiently. This efficiency is due to the fact that dispersion of lipid by exchange
or diffusion is very low. The delivery of lipid by lipoproteins is also very specific
when required (Vance and Vance, 1991). The main fluid space through which the
lipoproteins circulate is the blood plasma, but many lipoproteins can filter through the
vascular wall to interact with parenchymal cells. Liver and intestine are the major sites
of lipoprotein synthesis and the major flow of lipids is from tissues capable of lipid
synthesis to tissues which make little of their own lipid. There are also important
reverse transport systems in which lipid from peripheral tissues is returned to the liver
for catabolism and recirculation.
1.6.2 Lipoprotein structure
The major lipoprotein particles are (Small and Shipley, 1974). The composition of
these lipoprotein types are summarized in Table 1.3:
• Chylomicrons
• Very low density lipoprotein (VLDL)
• Intermediate density lipoprotein (IDL)
• Low density lipoprotein (LDL)
• High density lipoprotein (HDL)
21
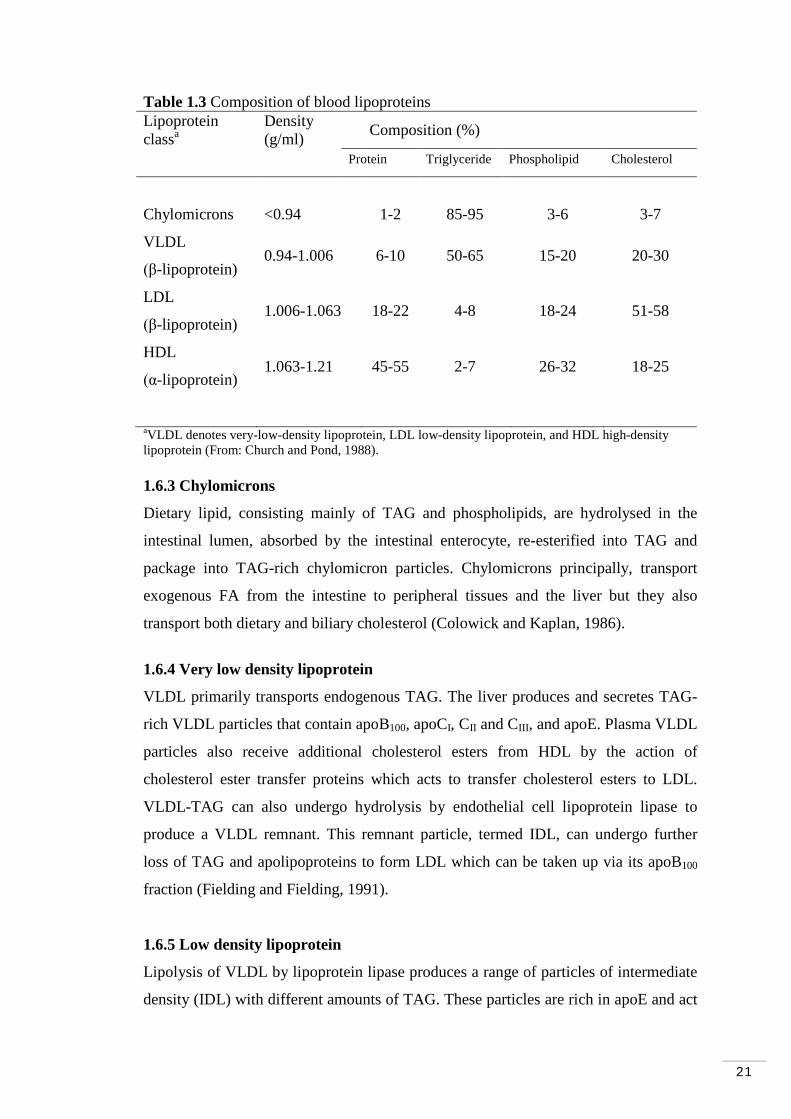
Table 1.3 Composition of blood lipoproteins Lipoprotein class
Density (g/ml) a Composition (%)
Protein Triglyceride Phospholipid Cholesterol
Chylomicrons <0.94 1-2 85-95 3-6 3-7
VLDL
(β-lipoprotein) 0.94-1.006 6-10 50-65 15-20 20-30
LDL
(β-lipoprotein) 1.006-1.063 18-22 4-8 18-24 51-58
HDL
(α-lipoprotein) 1.063-1.21 45-55 2-7 26-32 18-25
aVLDL denotes very-low-density lipoprotein, LDL low-density lipoprotein, and HDL high-density lipoprotein (From: Church and Pond, 1988). 1.6.3 Chylomicrons
Dietary lipid, consisting mainly of TAG and phospholipids, are hydrolysed in the
intestinal lumen, absorbed by the intestinal enterocyte, re-esterified into TAG and
package into TAG-rich chylomicron particles. Chylomicrons principally, transport
exogenous FA from the intestine to peripheral tissues and the liver but they also
transport both dietary and biliary cholesterol (Colowick and Kaplan, 1986).
1.6.4 Very low density lipoprotein
VLDL primarily transports endogenous TAG. The liver produces and secretes TAG-
rich VLDL particles that contain apoB100, apoCI, CII and CIII, and apoE. Plasma VLDL
particles also receive additional cholesterol esters from HDL by the action of
cholesterol ester transfer proteins which acts to transfer cholesterol esters to LDL.
VLDL-TAG can also undergo hydrolysis by endothelial cell lipoprotein lipase to
produce a VLDL remnant. This remnant particle, termed IDL, can undergo further
loss of TAG and apolipoproteins to form LDL which can be taken up via its apoB100
fraction (Fielding and Fielding, 1991).
1.6.5 Low density lipoprotein
Lipolysis of VLDL by lipoprotein lipase produces a range of particles of intermediate
density (IDL) with different amounts of TAG. These particles are rich in apoE and act
22
at an important point in lipoprotein metabolism because they may be cleared from the
circulation by the liver or they may be further processed to become LDL (Jackson et
al., 1976).
1.6.6 High density lipoprotein
HDL is formed in the circulation from apolipoproteins produced by the liver and
intestine. apoAI combines with unesterified cholesterol and phospholipid to form disk
shaped particles before undergoing modification to become HDL3 and the HDL2 as
they acquire cholesterol ester and other apolipoproteins including apoAII, apoE and
apoCs (Tall, 1990). The hydrolysis of chylomicrons and VLDL by lipoprotein lipases
results in a further net transfer of phospholipids and unesterified cholesterol to HDL
(Tall, 1990).
1.6.7 Lipoprotein isolation
Different methods can be used for lipoprotein isolation including; gel filtration,
precipitation or antibody affinity columns. The most frequent technique used is the
sequential flotation ultracentrifugation because plasma lipoproteins have lower
hydrated densities relative to the other plasma proteins (Ray et al., 1954). Sequential
centrifugation permits the process of large volumes or many small samples. However,
during lipoprotein separation by this method, centrifugation times are often 18 h and
greater, and consequently exchanges or transfers including losses of apolipoproteins
from the lipoprotein surface may occur (Ray et al., 1954).
1.7 Fatty acids and human health effects 1.7.1 Saturated fatty acids (SFA) in human foodstuffs
A SFA is an aliphatic carboxylic acid with no double bonds between any of its carbon
atoms. Table 1.4, provides systemic names, shorthand notations, trivial names and
dietary sources of most common and nutritionally important SFA. According to the
Food Standards Agency (FSA, 2010) SFA can be found in dairy products, meat,
pastries, coconut and palm oils and most British people consume 20% more than the
recommended maximum amount (20-30 g/d) of SFA.

23
Table 1.4 Typical saturated fatty acids in foods
Systemic name Shorthand notation
Trivial name Major sources
Tetranoic 4:0 Butyric Butter Hexanoic 6:0 Caproic Butter Octanoic 8:0 Caprylic Coconut Decanoic 10:0 Capric Most milk fats Dodecanoic 12:0 Lauric Palm kernel, coconut Tetradecanoic 14:0 Myristic Palm kernel, coconut Hexadecanoic 16:0 Palmitic Palm Octadecanoic 18:0 Stearic Most animal fats, cocoa Eicosanoic 20:0 Arachidic Peanut Docosanoic 22:0 Behenic Seeds Tetracosanoic 24:0 Lignoceric Peanut From: Perkins, 1991; Food and Drug Administration, US, 2009; Food Standards Agency, UK, 2010.
1.7.2 Unsaturated fatty acids (UFA) in human foodstuffs
Naturally occurring UFA are mostly in the cis configuration. Table 1.5, provides
information for common UFA available in food sources. According to the FSA (2010)
foods rich in UFA include fish oil (e.g., from mackerel, salmon and trout), sardines,
avocados, nuts and seeds, and sunflower, rapeseed, and olive oils.

24
Table 1.5 Unsaturated fatty acids in foods Systemic name Shorthand
notation Trivial name Major sources
Monounsaturated
Cis 9-Tetradecanoic 14:1n5 Myristoleic Butter 9-Hexadecanoic 16:1n7 Palmitoleic Seafood, beef 9-Octadecanoic 18:1n9 Oleic Olive, Canola 11-Octadecanoic 18:1n7 Cis-Vaccenic Seafood 13-Docosenoic 22:1n9 Eruic Rapeseed Trans 9-Octadecanoic Trans-
18:1n9 Elaidic Hydrogenated
fats 11-Octadecanoic Trans-
18:1n7 Vaccenic Hydrogenated
fats, Butter
Polyunsaturated All Cis 9,12-Octadienoic 18:2n6 Linoleic Sunflower,
safflower 6,9,12-Octadecatrienoic 18:3n6 γ-Linolenic Primrose 8,11,14-Eicosatrienoic 20:3n6 dihomo-γ-
linoleic Shark liver
5,8,11,14-Eicosatetraenoic 20:4n6 Arachidonic Eggs, most animal fats
9,12,15-Octatrienoic 18:3n3 Linolenic Soybean, canola 5,8,11,14,17-Eicosapentaenoic
20:5n3 Timnodonic Seafood
7,10,13,16,19-Docosapentaenoic
22:5n3 Clupadonic Seafood
4,7,10,13,16,19-Docosahexaenoic
22:6n3 Cervonic Seafood
From: Perkins, 1991; Food and Drug Administration, US, 2009; Food Standards Agency, UK, 2010.
1.7.3 Trans fatty acids in human foodstuffs
The most important sources of tFA in the human diet are PHVO, and ruminant milk
and meat products (Salter et al., 2006). Trans fats can be found in many of the same
foods as saturated fat, such as vegetable shortenings, some margarines, crackers,
candies, cookies, snack foods, fried foods, baked goods, and other processed foods
made with partially hydrogenated vegetable oils (FDA, 2006). According to Hulshof
et al., 1999, in many European countries about 50% of tFA come from dairy fat.
Ruminant derived lipids often contain 1 to 8% of total FA as tFA (Craig-Schmidt
25
1998; Salter et al., 2006), and those are predominantly 18:1 trans (Emken, 1995;
Salter et al., 2006). The most common 18:1 trans in ruminant fat is vaccenic acid,
accounting for 60% to 80% of total tFA (Emken, 1995; Craig-Schmidt 1998; Salter et
al., 2006). tFA from ruminant tFA (vaccenic acid) can be converted to CLA cis 9,
trans 11 (rumenic acid; RA), through the action of stearoyl coenzymeA desaturase. In
European countries such as Denmark and Switzerland, legislation limited the use of
industrially-produced oils to no more than 2% of fat in human food products (Salter et
al., 2006). In 2007, the Food Standards Agency (2010), along with the Scientific
Advisory Committee on Nutrition (SACN) recommended that average tFA intake
should not exceed 2% of food energy. However, average intakes of tFA in the UK are
half the recommended maximum of 2 of total food energy and therefore are not a
cause for concern (FSA, 2010).
1.7.4 Dietary fatty acids and blood lipoprotein and cholesterol levels
Absorption of fat after a meal is associated with a large increase in lipid concentration
of the blood, referred to as lipidaemia (Helfant and Banka, 1978). Blood lipids consist
of dietary lipids absorbed from the intestine, as well as lipids mobilized from depot
stores and from synthesis in body tissues, especially the liver and adipose tissues. Diet
is the primary source of cholesterol to the body. Cholesterol is also synthesized in
many tissues of the body including the liver (Helfant and Banka, 1978). According to
the National Health Service (NHS) in England, two out of three adults have a total
cholesterol level of 5mmol/l or above. On average, men have a cholesterol level of 5.5
mmol/l and women have a level of 5.6 mmol/l. The UK Government recommends that
cholesterol levels should not exceed 5 mmol/l (NHS, 2009).
Diets rich in SFA are believed to increase plasma cholesterol levels (Spady et al.,
1993) by increasing blood concentration of LDL which contains about 51 to 58%
cholesterol (Church and Pond, 1988). This condition is known as
hypercholesterolemia. For example, a meta-analysis of human dietary studies
(Mensink et al., 2003) suggested that lauric (12:0), myristic (14:0) and palmitic (16:0)
acids each increased HDL fraction more than UFA did but the effect on the LDL
fraction was greater. Numerous controlled feeding studies of the effects of different
dietary FA on serum cholesterol levels have been summarized in meta-analyses from
which predictive equations have been developed (Keys et al., 1966; Yu et al., 1995).
26
Those studies confirmed that SFA increase and PUFA decrease in the LDL fraction.
All three classes of FA (SFA, MUFA and PUFA) elevate HDL fraction when they
replace carbohydrates in the diet, and this effect is slightly greater with SFA (Hu and
Willet, 2002). Also, TAG levels increase when dietary FA are replaced by
carbohydrates. Replacement of saturated fat with carbohydrates proportionally
reduces both LDL and HDL fractions; this change in diet would be expected to have
minimal benefit on coronary heart disease risk. When MUFA or PUFA replace
saturated fat, LDL fraction decreases and HDL fraction changes only slightly (Hu and
Willet, 2002).
1.7.4.1 Effects of individual fatty acids on blood cholesterol level
There is agreement that certain, but not all, SFA raise plasma levels of LDL-
cholesterol. Short chain fatty acids (butyric acid, caproic acid, caprylic acid, and
capric acid), present in a small number of food sources, do not appear to raise LDL-
cholesterol levels (Berner, 1993). Medium-chain SFA, (lauric acid, myristic acid, and
palmitic acid) are generally considered to raise serum total and LDL-cholesterol (Keys
et al., 1965; Hegsted et al., 1965). These three FA account for approximately 41% of
milk fat (Berner, 1993). It has been suggested that 14:0 is more hypercholesterolemic
than 16:0 (Zock et. al., 1994). The other 59% of milk FA are not hypercholesterolemic
compared with medium-chain FA. These FA are short-chain FA, stearic acid (18:0),
MUFA, PUFA, and traces of others (Berner, 1993).
1.7.5 Health effects related to milk trans fatty acids
Although different studies have reported negative effects of tFA on human health, it is
important to take into account that the main sources (PHVOs and milk/meat products
from ruminant animals) of dietary tFA differ substantially in the isomer distribution of
18:1 trans. Also, there is reasonable evidence that tFA associated with PHVO increase
LDL-cholesterol, possibly decrease HDL-cholesterol and increase risk of
cardiovascular disease (Salter et al., 2006). The impact of ruminant tFA is much less
certain and it may actually be beneficial as it is mainly vaccenic acid (18:1 trans-11)
that can be converted to CLA (Salter et al., 2006).
In the early 1990s the adverse effects of consuming tFA on blood lipid levels
(Mensink and Katan, 1990; Ascherio et al., 1999) and coronary heart disease (Willet
and Ascherio, 1994; Ascherio et al., 1999) were identified. There is also evidence that
27
tFA are also implicated in increasing risk of cardiovascular disease to an extent equal
to or greater than the hypercholesterolemic saturated FA (Judd et al., 2002; Baer et al.,
2004). In 1994, the UK Department of Health recommended to reduce total fat
consumption to 30% of total energy intake, with 10% of energy intake coming from
saturated FA (Wood et al., 2003). At the same time it was also advised to increase the
intake of PUFA. Besides the health benefits from PUFA for human health, CLA
isomers have received much attention due to their health promoting effects (Jahreis et
al., 2000; Connor, 2000; Pariza et al., 2000, 2001; Roche et al., 2001; Williams, 2000;
Raes et al., 2004).
Despite the fact that tFA have been regarded and implicated as a causal factor of heart
diseases, Ackman (2000) questioned this theory and explained that humans have
consumed tFA in milk fat throughout history since ruminants were domesticated and
their products consumed, and hence human metabolism may have adapted positively
to their presence (Ackman, 2000; Jensen, 2002). Nevertheless, potential negative
effects on animal health have been observed (Teter et al., 1990; Jensen, 2002).
Consumption of tFA by humans (Table 1.6) was estimated by Craig-Schmidt (1998)
and Allison et al. (1999); however, Jensen (2002) observed that in both investigations
consumption was underestimated when based on data obtained only with capillary
GLC columns. Additionally, Jensen (2002) criticized the research conducted by Katan
(2000) in which tFA were implicated as a cause of cardiovascular disease; Jensen
(2002) mentioned that milk fat is a minor source of tFA and hence it should not be
excluded from human diets for this reason.
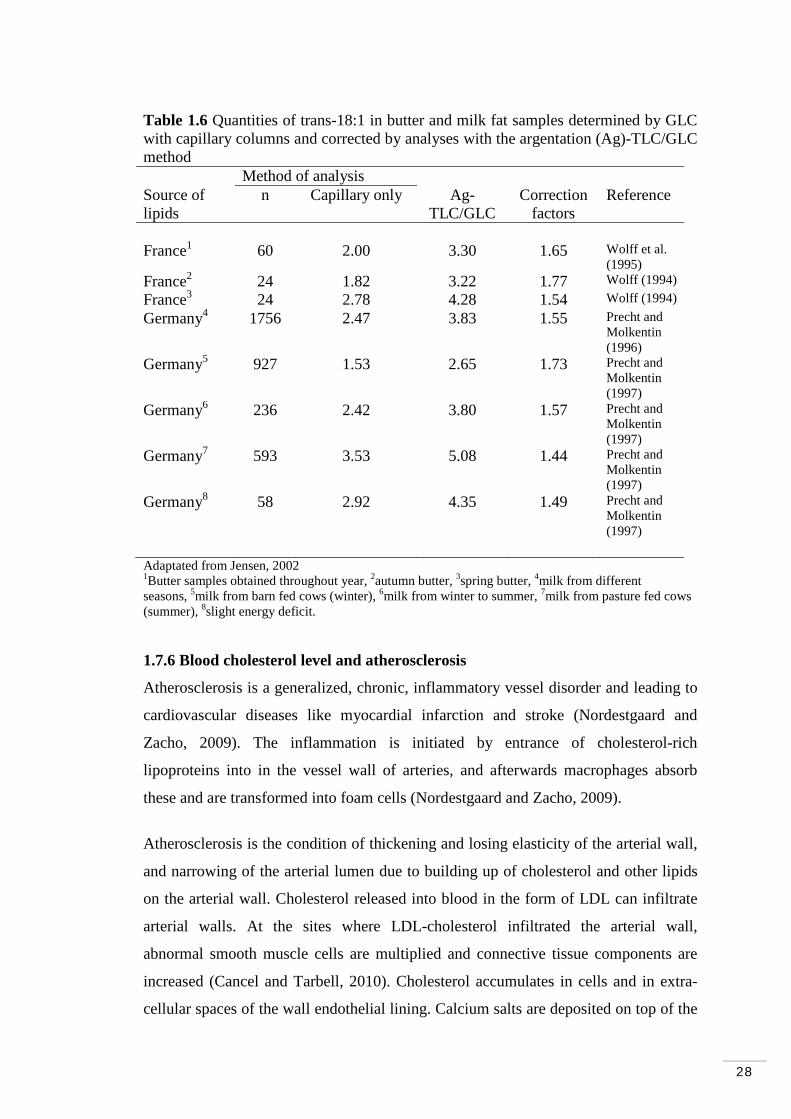
28
Table 1.6 Quantities of trans-18:1 in butter and milk fat samples determined by GLC with capillary columns and corrected by analyses with the argentation (Ag)-TLC/GLC method Method of analysis Source of lipids
n Capillary only Ag- TLC/GLC
Correction factors
Reference
France 60 1 2.00 3.30 1.65 Wolff et al.
(1995) France 24 2 1.82 3.22 1.77 Wolff (1994) France 24 3 2.78 4.28 1.54 Wolff (1994) Germany 1756 4 2.47 3.83 1.55 Precht and
Molkentin (1996)
Germany 927 5 1.53 2.65 1.73 Precht and Molkentin (1997)
Germany 236 6 2.42 3.80 1.57 Precht and Molkentin (1997)
Germany 593 7 3.53 5.08 1.44 Precht and Molkentin (1997)
Germany 58 8 2.92 4.35 1.49 Precht and Molkentin (1997)
Adaptated from Jensen, 2002 1Butter samples obtained throughout year, 2autumn butter, 3spring butter, 4milk from different seasons, 5milk from barn fed cows (winter), 6milk from winter to summer, 7milk from pasture fed cows (summer), 8
slight energy deficit.
1.7.6 Blood cholesterol level and atherosclerosis
Atherosclerosis is a generalized, chronic, inflammatory vessel disorder and leading to
cardiovascular diseases like myocardial infarction and stroke (Nordestgaard and
Zacho, 2009). The inflammation is initiated by entrance of cholesterol-rich
lipoproteins into in the vessel wall of arteries, and afterwards macrophages absorb
these and are transformed into foam cells (Nordestgaard and Zacho, 2009).
Atherosclerosis is the condition of thickening and losing elasticity of the arterial wall,
and narrowing of the arterial lumen due to building up of cholesterol and other lipids
on the arterial wall. Cholesterol released into blood in the form of LDL can infiltrate
arterial walls. At the sites where LDL-cholesterol infiltrated the arterial wall,
abnormal smooth muscle cells are multiplied and connective tissue components are
increased (Cancel and Tarbell, 2010). Cholesterol accumulates in cells and in extra-
cellular spaces of the wall endothelial lining. Calcium salts are deposited on top of the
29
lipids, and a fibrous net is formed over the mass. This atherosclerotic plaque projects
into the arterial lumen (Cancel and Tarbell, 2010).
Dietary tFA have been linked to atherosclerosis but the mechanisms by which they
cause the disease remains unclear. Chen et al. (2010) found that dietary tFA cause
atherosclerosis by the increase deposition of cholesterol into cellular plasma
membranes in vascular tissue as in hypercholesterolemia. This is in agreement with
previous research (Lichtenstein et al., 2003; Vega-López et al., 2009) in which the
major risk factor of cardiovascular disease caused by dietary tFA is LDL cholesterol
levels and total cholesterol/HDL ratios in plasma.
1.7.7 Blood cholesterol level and stroke development
Increased blood cholesterol levels are related to an increased risk of coronary heart
disease (CHD) (Imamura et al., 2009). In contrast, the relation between total
cholesterol levels and the risk of stroke remains unclear because of conflicting results
reported in the literature. The inconsistent results may be due to several reasons. First,
because stroke is a heterogeneous syndrome of different etiologic origins, lipid levels
may be important for some subtypes of stroke but not for others. An inverse
association has been observed between total cholesterol and haemorrhagic stroke, and
there is a positive association between total cholesterol and ischemic stroke (Imamura
et al., 2009). Furthermore, the association may be different for ischemic stroke
subtypes. Second, lipoprotein subfractions are considered to exert varying influence
on stroke risk. It is possible that the protective effect of HDL cholesterol against
stroke weakens the positive association between total cholesterol and stroke in
instances where lipoprotein sub fractions are counted together (Imamura et al., 2009).
The stroke-cholesterol relation is complex and contains several paradoxes. Whereas
total cholesterol is a well-documented risk factor for CHD, evidence of a relation
between cholesterol and risk of stroke is inconsistent (Olsen et al., 2007). In search of
an explanation for this paradox, it has been noted that most large-scale studies on
cholesterol and stroke risk have not differentiated between ischemic and hemorrhagic
stroke, nor did they differentiate among various subtypes of ischemic stroke. It has
been suggested that cholesterol may increase the risk of only certain types of infarcts
and that LDL predisposes to hemorrhagic stroke, thus attenuating an association
between cholesterol and all stroke (Olsen et al., 2007).

30
1.7.8 Blood cholesterol level and coronary heart disease
Over the past decades, numerous population-based and intervention studies have
identified LDL cholesterol as a key risk factor for CHD. However, although many
trials have documented the benefits of lowering plasma LDL levels for primary and
secondary prevention of CHD, studies have shown that individuals reaching their LDL
target may still be at increased CHD risk if they have detrimental levels of other
parameters of the lipoprotein-lipid profile. In this regard, it has been proposed
(Kastelein et al., 2008) that other lipid parameters such as cholesterol levels in
lipoproteins other than HDL (i.e., non–HDL cholesterol levels), TAG levels, or the
total cholesterol (TC) to HDL- cholesterol ratio could better predict cardiovascular
outcomes in patients on LDL- cholesterol lowering therapy. However, there is a lack
of epidemiological data to suggest that the aforementioned parameters of the
lipoprotein-lipid profile could better predict CHD risk than LDL- cholesterol in
asymptomatic individuals (Arsenault et al., 2010). Death rates of CHD in both the
United Kingdom and the Unites States have declined over the last 40 years,
particularly in men. The reasons for these rates are not fully understood. However,
they appear to be a consequence of a combination of improved treatment of
individuals and changes in risk factor within the whole population. In England and
Wales, it has been estimated that 42% of the decrease seen between 1981 and 2000
was due to improved treatment whereas the 58% remaining was due to risk factor
conditions within the population (Unal et al., 2004; Salter et al., 2007). Of the risk
factors, by far the biggest impact (48% of overall deaths) was from reduction in
smoking, with lesser effects of reduced blood pressure (9.5%) and reduced cholesterol
(9.6%) (Salter et al., 2007).
For prevention and treatment of CHD, vigorous dietary intervention is needed to
lower serum cholesterol level by at least 6% (Temple, 1996). For this purpose, the
foods of animal origin should be eaten sparingly, and more prominence should be
given to the foods rich in carbohydrate and fibre, especially fruit and vegetables. If
acceptability of the diet becomes a problem and people desire more fat in their diet,
then the UFA rich oils such as olive or canola could be incorporated in the diet
(Temple, 1996). Similarly, Connor and Connor (1997) suggested a prominent
therapeutic role for FO in prevention and treatment of coronary artery disease. The n-3
FA of fish and FO have great potential for prevention and treatment of patients with
31
coronary artery disease. That is because n-3 FA promote synthesis of beneficial nitric
oxide in the endothelium (Connor and Connor, 1997). FO has a profound
hypolipidemic effect in humans, especially lowering of plasma triacylglycerol. Both
very-low-density lipoprotein production and apolipoprotein B synthesis are inhibited
by FO. Finally, FO has a mild blood pressure-lowering effect in both normal and
mildly hypertensive individuals.
On the other hand, Hu and Willet (2002), reported that there is substantial evidence
indicating that diets using non hydrogenated UFA as the predominant form of dietary
fat, whole grains as the main form of carbohydrates, an abundance of fruits and
vegetables, and adequate omega-3 fatty acids can offer significant protection against
CHD.
1.8 Using mammary gland cell lines to study fatty acid uptake
Lipids in milk are present in fat globules; they are formed mainly by triacygycerols
and are enclosed within a membrane derived from the secretory epithelial mammary
cell (Jensen, 2002; Heid and Keenan, 2005). Although the general principles of lipid
droplet formation, growth, movement, and secretion are known, practically few
studies have been performed on lipid absorption and secretion by mammary gland
cells (Ernens et al., 2007).
Milk fat, normally produced, is assembled in the mammary alveolar cells from FA
derived partly by de novo synthesis from acetate within these specialized cells, and
partly by absorption from the blood. Fatty acids synthesised within alveolar cells are
mostly saturated and contain from four to sixteen carbon atoms per molecule (Kinsella
et al., 1968). Lipids produced by the lactating bovine mammary cell are distinctive,
which facilitates the assessment of the biochemical fidelity of these cells when used in
vitro (Kinsella et al., 1968).
1.8.1 Immortalized bovine mammary epithelial cell line: MAC-T
Mac-T cells are an established cloned cell line produced from primary bovine
epithelial cells by transfection with SV-40 large-T-antigen designated (MAC-T).
Differentiation was induced (Turner et al., 1993) by increasing cell to cell interactions
on a floating extra cellular matrix in the presence of prolactin. MAC-T cells have
normal physiological responses in that it produces milk constituents which comprises
32
α- and β- casein and lactose. These cells provide a method of studying in vitro
lactation due to their normal physiological responses. They also provide a method of
in vitro screening for gene expression in transgenic cows prior to gene transfer when
the mammary gland is the target organ of expression and hence reduce the cost of
genetic engineering (Zavizion et al., 1995). This cell line has been deposited at the
American Type Culture Collection (ATTC) under the accession number CRL 10274.
The MAC-T cells were reported to have >150 passages without senescence or
replication problems (Turner et al., 1993), which represents continuous culture for
more than one year. These cells have a “cobblestone” morphological characteristic
when they reach 90-100% confluence. They are also heterogeneous in morphology,
growth, and cytogenetic characteristics (Zavizion et al., 1995).
MAC-T cells have been used for gene expression studies (Keating et al., 2008;
Kadegowda et al., 2009; Thering et al., 2009) that evaluated in vitro effects of certain
FA on mammary epithelial cell growth, morphological changes and apoptosis, as well
as effects of hormones (insulin and prolactin) on metabolic regulation of TAG
biosynthesis (Morand et al., 1998). Johnson et al., (2010) reported changes in TAG,
cholesterol and phospholipids distribution in MAC-T cells stimulated with 10 ng / ml
of growth hormone. These cells have also been studied for their response to bacterial
virulent factors produced by mastitis pathogens. Matthews et al. (1994) reported that
MAC-T cells proliferation was inhibited by different concentrations of Escherichia
coli endotoxin.
Peterson et al. (2004) used this cell line to study the effects of CLA trans 10, cis 12 on
milk fat depression and abundance of mRNA for lipogenic enzymes. The study
reported that lipogenesis was inhibited by 56% when cells were incubated with 75
μmol / l of CLA trans 10, cis 12. Keating et al. (2008) reported that increasing
concentrations of CLA isomers trans 10, cis 12 and cis 9, trans 11 have negative
impacts on cell growth inducing apoptosis of the mammary cells. They observed that
at higher doses of CLA (35 μM and above) cell growth was inhibited or in some cases
cells were no longer available. Those findings are in agreement with the negative
effects seen on milk yield and composition when cows are abomasally infused with
high doses of CLA (Bell and Kennelly, 2003). Sorensen et al., (2008) treated MAC-T
cells with CLA and other C18-UFA to study effects on lipogenic enzymes. They
33
concluded that MFD caused by CLA trans 10, cis 12 could affect a number of
lipogenic enzymes including diacylglycerol acyltransferase. Jayan and Herbein (2000)
studied the effects of oleic and vaccenic acids on the activity of acetyl-CoA
carboxylase-ACC, fatty acid synthetase –FAS and stearoyl-CoA desaturase- SCD.
Their data suggested that vaccenic acid inhibited activity of ACC and FAS, which are
responsible for synthesis of SFA secreted into milk, and simultaneously enhanced
SCD activity.
Other studies used (Yonezawa et al., 2004a, 2004b 2009) cloned mammary gland
epithelial cells (bMEC) and worked on the effects of FA on the expression of certain
enzymes involved in lipid synthesis. Yonezawa et al., (2004a) measured the effect of
LCFA on TAG accumulation on bMEC cells treated with 400 μM palmitate, stearate,
oleate and linolate for 24 h and TAG accumulation on bMEC cells treated with the
same FA at different concentrations. Their results suggested that exogenous LCFA
could enhance accumulation of cytosolic TAG and expression of CD 36 (a FA
traslocase) which plays an important role in FA translocation in various cells and
plays a positive role in uptake of LCFA in bMEC (Figure 1.3). Yonezawa et al.
(2004b) evaluated the effect of 10 mM of acetate, butyrate and octanoate on bMEC
for 1, 3, 5 and 7 d and various concentrations of octanoate for 7 d. Octanoate induced
the accumulation of cytosolic TAG and formation of lipid droplets in bMEC (Figure
1.4).
Most of the studies using Mac-T cells focus on gene expression and enzymatic
responses; hence few data are available on FA uptake and secretion.
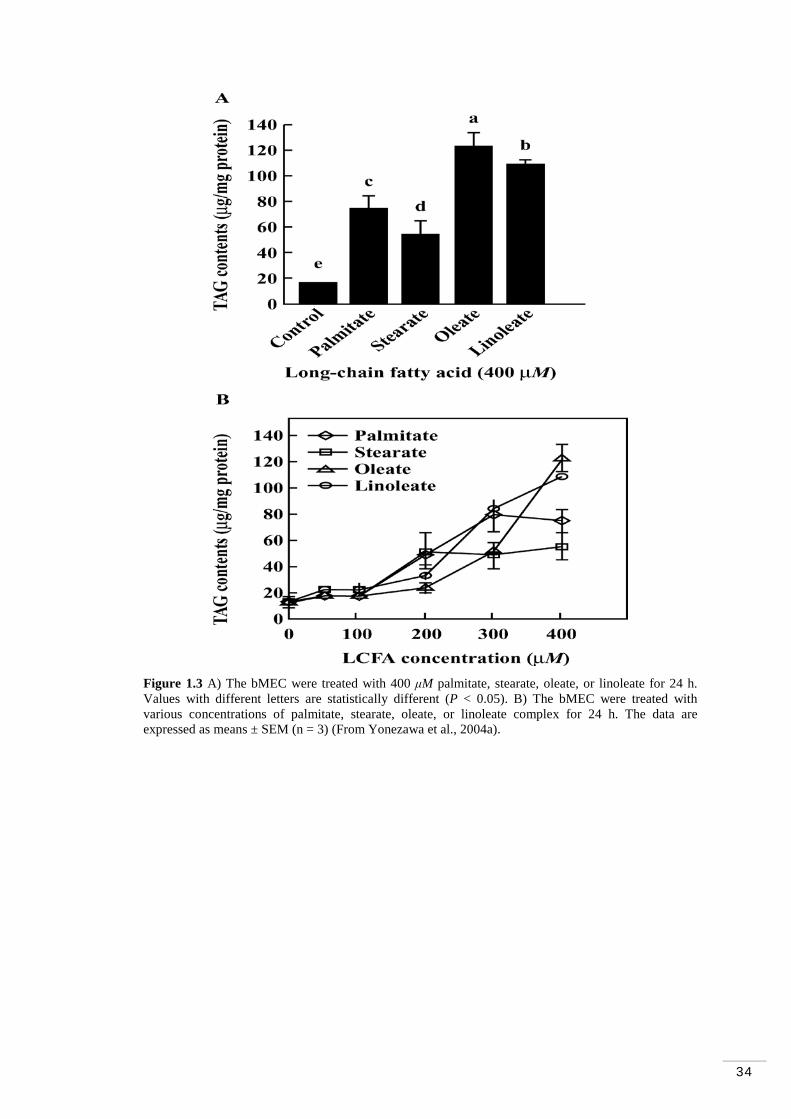
34
Figure 1.3 A) The bMEC were treated with 400 μM palmitate, stearate, oleate, or linoleate for 24 h. Values with different letters are statistically different (P < 0.05). B) The bMEC were treated with various concentrations of palmitate, stearate, oleate, or linoleate complex for 24 h. The data are expressed as means ± SEM (n = 3) (From Yonezawa et al., 2004a).
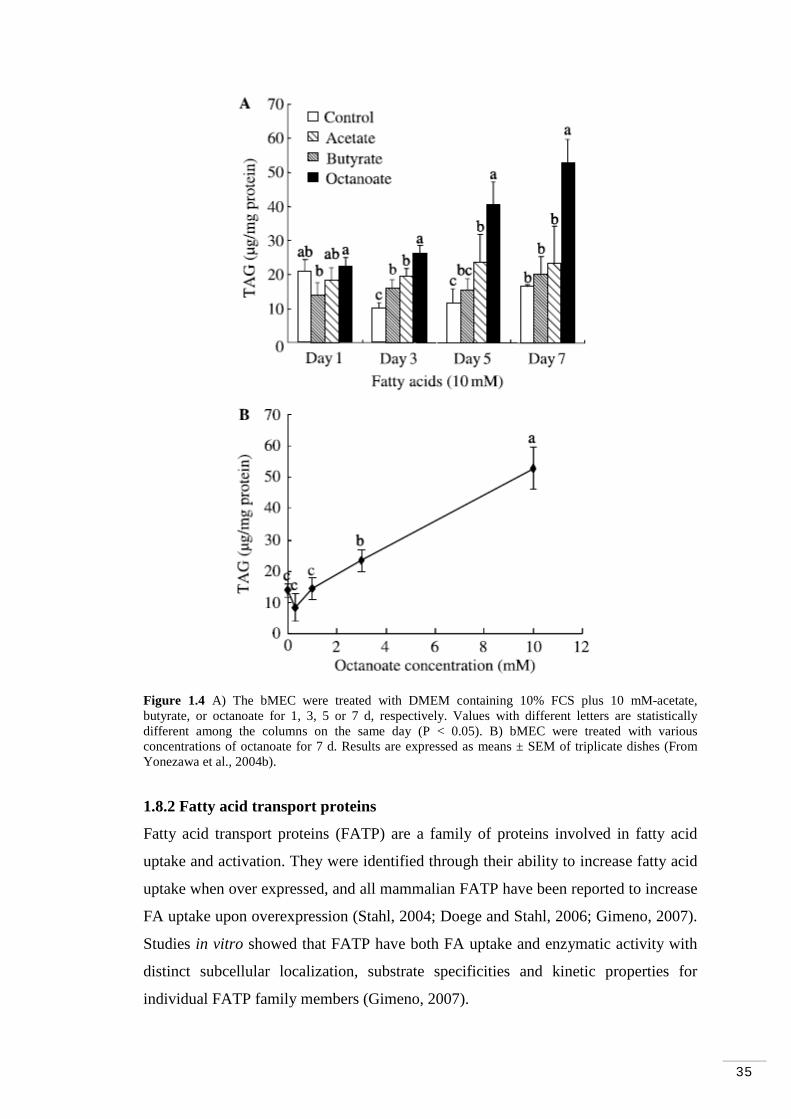
35
Figure 1.4 A) The bMEC were treated with DMEM containing 10% FCS plus 10 mM-acetate, butyrate, or octanoate for 1, 3, 5 or 7 d, respectively. Values with different letters are statistically different among the columns on the same day (P < 0.05). B) bMEC were treated with various concentrations of octanoate for 7 d. Results are expressed as means ± SEM of triplicate dishes (From Yonezawa et al., 2004b).
1.8.2 Fatty acid transport proteins
Fatty acid transport proteins (FATP) are a family of proteins involved in fatty acid
uptake and activation. They were identified through their ability to increase fatty acid
uptake when over expressed, and all mammalian FATP have been reported to increase
FA uptake upon overexpression (Stahl, 2004; Doege and Stahl, 2006; Gimeno, 2007).
Studies in vitro showed that FATP have both FA uptake and enzymatic activity with
distinct subcellular localization, substrate specificities and kinetic properties for
individual FATP family members (Gimeno, 2007).
36
1.8.3 Fatty acid transport across cellular membranes
The mechanism by which FA enter cells has been a matter of debate. Fatty acid must
be extracted from the internal face of the plasma membrane and move into the interior
of the cell; without extraction, FA would remain available in the membrane to move
back to the outer face of the plasma membrane and be recaptured by albumin present
in the interstitial fluid (Mashek and Coleman et al., 2006). There are different
approaches (Abumrad et al., 1998; Kleinfeld, 2000) that provide evidence that there
are two processes involved in LCFA uptake:
1. Passive diffusion through the lipid bilayer
2. Protein facilitated transport
The relative contribution of each component depends on concentrations and molar
ratios of FA and albumin in the circulation (Hajri and Abumrad, 2002).
1.8.4 Determinants of fatty acid transport
In the extracellular medium and in the circulation, FA are carried bound to albumin. In
the absence of albumin or other FA binding protein (FABP), the concentration of
LCFA that can be used is very low and is depleted by cells automatically, meaning the
linear portion of the uptake time course would be too short to measure (Hajri and
Abumrad, 2002). When mixtures of FA and albumin are used, uptake follows the
unbound FA, which is determined by the molar ratio of FA to albumin. Within the cell,
one or more types of abundant cytosolic FABP buffer intracellular FA. There is an
important role for cytosolic FABP in shuttling FA between plasma membrane and
intracellular membranes or metabolic compartments (Hajri and Abumrad, 2002).
37
1.9 Conclusions
This review has summarised the background of some aspects of lipid structure, milk
fat composition and FA metabolism in dairy cows. The review has also studied the
role of dietary FA on human health.
However, we do not know how tFA are transported in the blood and partitioned into
lipoprotein fractions of dairy cows. Moreover, we do not know how dietary lipids
affect lipoprotein fractions in dairy cows and whether those fractions lead to
differences in tFA concentrations. We also do not know how certain FA
concentrations perform within the bovine mammary gland cells.
All of these questions will help us to understand the regulation of milk fat synthesis
that is central to the development of nutritional strategies to enhance the nutritional
value of milk in ruminants.
1.10 General objectives
In summary, this thesis aims to:
• Compare plasma cholesterol fractions and FA profiles from cows subjected to different treatments
• Examine the effects of dietary lipids on the transportation of tFA among the plasma cholesterol fractions
• Study LCFA uptake in epithelial mammary gland cell cultures on MAC-T cells line
• Evaluate the effects of lipids on the transportation of FA in epithelial mammary gland cell cultures (MAC-T cells)
38
C h a p t e r 2
Ruminal pulses of fatty acids in dairy cows: 1. Soya oil and partially hydrogenated vegetable oil

39
CHAPTER 2
2. Ruminal pulses of fatty acids in dairy cows: 1. Soya oil and partially hydrogenated vegetable oil
2.1 Introduction
In ruminants, tFA are produced naturally during biohydrogenation of PUFA in the
rumen and are incorporated into carcass fat or milk fat (Katz and Keeney, 1966;
Griinari and Bauman, 1999; Piperova et al., 2004). The predominant tFA in ruminant
fat is vaccenic acid (VA; C18:1 trans-11), accounting for 60% to 80% of total tFA,
although other tFA (e.g. C18:1 trans-10) occur when high-fat or high-concentrate
diets are fed to ruminants. PHVO contains a mixture of C18:1 trans isomers, the most
predominant being elaidic acid (EA; C18:1 trans-9) (Meijer et al., 2001). Vaccenic
acid may not have the same deleterious health effects in humans as tFA from PHVO
(Salter et al., 2006).
Cholesterol is important for the transport and clearance of fatty acids in all mammals,
and also plays vital roles in cell membrane structure and steroid hormone synthesis.
Although proportions of low- and high- density lipoproteins (LDL and HDL) have
been studied extensively in humans, they have received little attention in ruminants.
The mammary gland appears to have differential uptake of lipids from lipoprotein
fractions and affect the efficiency of transfer LCFA from diet to milk (Offer et al.,
2001). No in vivo study has been published in which effects of different tFA on
lipoprotein fractions or their FA profile have been compared in ruminants. We were
particularly interested to see if there are different effects of VA (naturally produced in
the rumen) and EA (from PHVO).
The main hypothesis being tested in this experiment was that FA profiles of plasma
and lipoprotein fractions would be different depending on source of the dietary lipids,
which would lead to differences in tFA concentrations. The objective of the present
study was to elucidate which lipoprotein fractions are involved in tFA transport and
whether there is a difference between 18:1 tFA isomers. This objective was achieved
by comparing plasma lipoprotein fractions in cows subjected to ruminal pulses of soya
oil (SO; to induce high VA production and absorption) or PHVO with high
concentrations of a range of 18:1 tFA isomers.

40
2.2 Materials and methods
2.2.1 Animals and treatments
Three non-lactating Holstein nuliparous cows [BW 773 ± 63 kg (average ± SD)], each
with a rumen cannula were utilized in a 3 x 3 Latin square design with 3 d treatment
periods (adapted and modified from Kadegowda et al., 2008 and Castaneda-Gutierrez
et al., 2007) followed by 4 d washout interval between treatments to minimize
carryover effects (Loor et al., 2005) (Figure 2.1). Cows were treated with ruminal
pulses of: 1) skim milk (SM; 500 ml/d) as control; 2) SO (250 g/d in 500 ml/d of SM)
and 3) PHVO (250 g/d in 500 ml/d of SM). PHVO was supplied by the manufacturers
(Aarhus Karlshamn, Ltd., Hull, UK) and was based on hydrogenated rapeseed oil.
Quantities of fat and SM in ruminal pulses were calculated according to previous
studies (Ferlay and Doreau, 1992).
Figure 2.1: The experiment had three treatment periods, each followed by a 4-d washout interval. Cows were given each treatment in a 3 x 3 Latin square design.
Emulsions were prepared the day before each pulse. To provide a homogenised
release of pulses, skim milk was used (Loor and Herbein, 2003) (500 ml/d) to
emulsify the oils (SO and PHVO) using a laboratory mixer emulsifier (L2R Silverson,
Machines Ltd., Waterside, Chesham, Bucks). Before each pulse, emulsions were
heated for 30 min at 60 ºC in water bath (Grant Y28, Cambridge Ltd., England) to
provide easier diffusion of PHVO. During pulses and sampling periods, cows were
housed in tie stalls and had free access to water. Cows were fed a maintenance diet
which comprised meadow hay (ad libitum) and a concentrate based on barley (25-40
g/kg), sugar beet pulp (8 g/kg) and wheat (8 g/kg) and cane molasses (<5 g/kg),
Washout l
Washout l
Treatment and sampling Treatment and sampling
Treatment and sampling
Cow 1
SM
Cow 2
SO
Cow 3
PHVO
Cow 1
PHVO
Cow 2
SM
Cow 3
SO
Cow 1
SO
Cow 2
PHVO
Cow 3
SM
3 DAYS 3 DAYS 3 DAYS
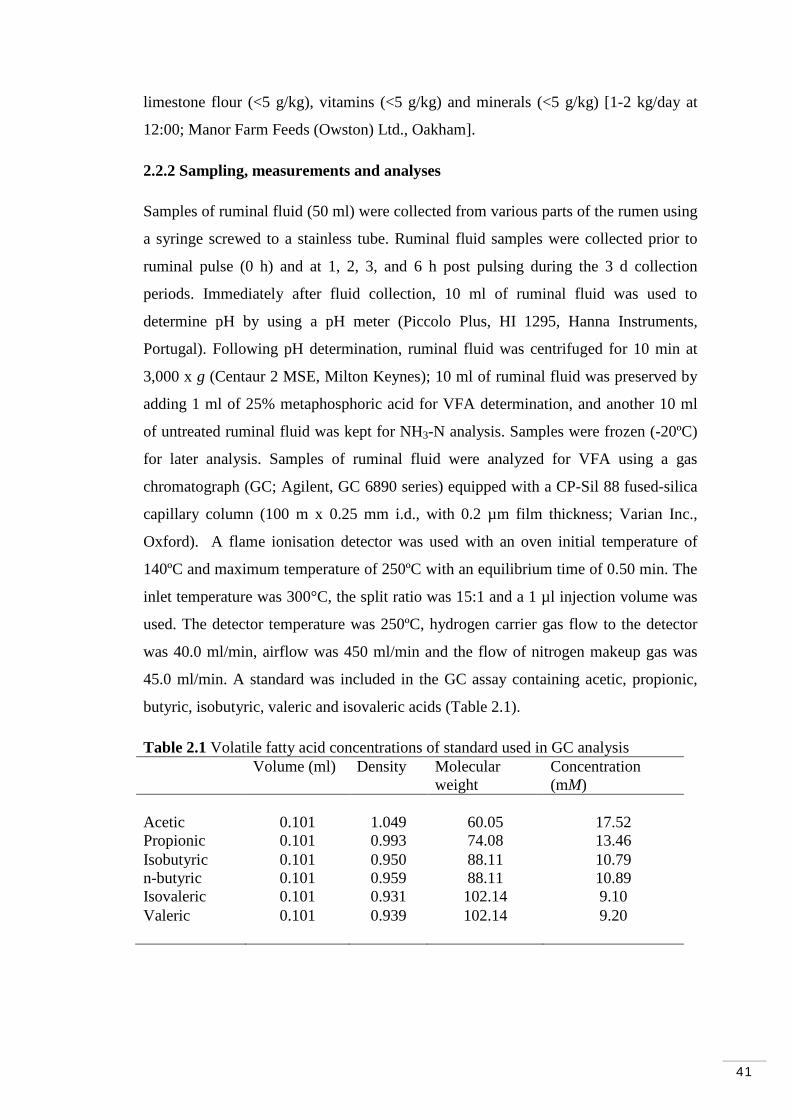
41
limestone flour (<5 g/kg), vitamins (<5 g/kg) and minerals (<5 g/kg) [1-2 kg/day at
12:00; Manor Farm Feeds (Owston) Ltd., Oakham].
2.2.2 Sampling, measurements and analyses
Samples of ruminal fluid (50 ml) were collected from various parts of the rumen using
a syringe screwed to a stainless tube. Ruminal fluid samples were collected prior to
ruminal pulse (0 h) and at 1, 2, 3, and 6 h post pulsing during the 3 d collection
periods. Immediately after fluid collection, 10 ml of ruminal fluid was used to
determine pH by using a pH meter (Piccolo Plus, HI 1295, Hanna Instruments,
Portugal). Following pH determination, ruminal fluid was centrifuged for 10 min at
3,000 x g (Centaur 2 MSE, Milton Keynes); 10 ml of ruminal fluid was preserved by
adding 1 ml of 25% metaphosphoric acid for VFA determination, and another 10 ml
of untreated ruminal fluid was kept for NH3-N analysis. Samples were frozen (-20ºC)
for later analysis. Samples of ruminal fluid were analyzed for VFA using a gas
chromatograph (GC; Agilent, GC 6890 series) equipped with a CP-Sil 88 fused-silica
capillary column (100 m x 0.25 mm i.d., with 0.2 µm film thickness; Varian Inc.,
Oxford). A flame ionisation detector was used with an oven initial temperature of
140ºC and maximum temperature of 250ºC with an equilibrium time of 0.50 min. The
inlet temperature was 300°C, the split ratio was 15:1 and a 1 µl injection volume was
used. The detector temperature was 250ºC, hydrogen carrier gas flow to the detector
was 40.0 ml/min, airflow was 450 ml/min and the flow of nitrogen makeup gas was
45.0 ml/min. A standard was included in the GC assay containing acetic, propionic,
butyric, isobutyric, valeric and isovaleric acids (Table 2.1).
Table 2.1 Volatile fatty acid concentrations of standard used in GC analysis Volume (ml) Density Molecular
weight Concentration (mM)
Acetic 0.101 1.049 60.05 17.52 Propionic 0.101 0.993 74.08 13.46 Isobutyric 0.101 0.950 88.11 10.79 n-butyric 0.101 0.959 88.11 10.89 Isovaleric 0.101 0.931 102.14 9.10 Valeric 0.101 0.939 102.14 9.20
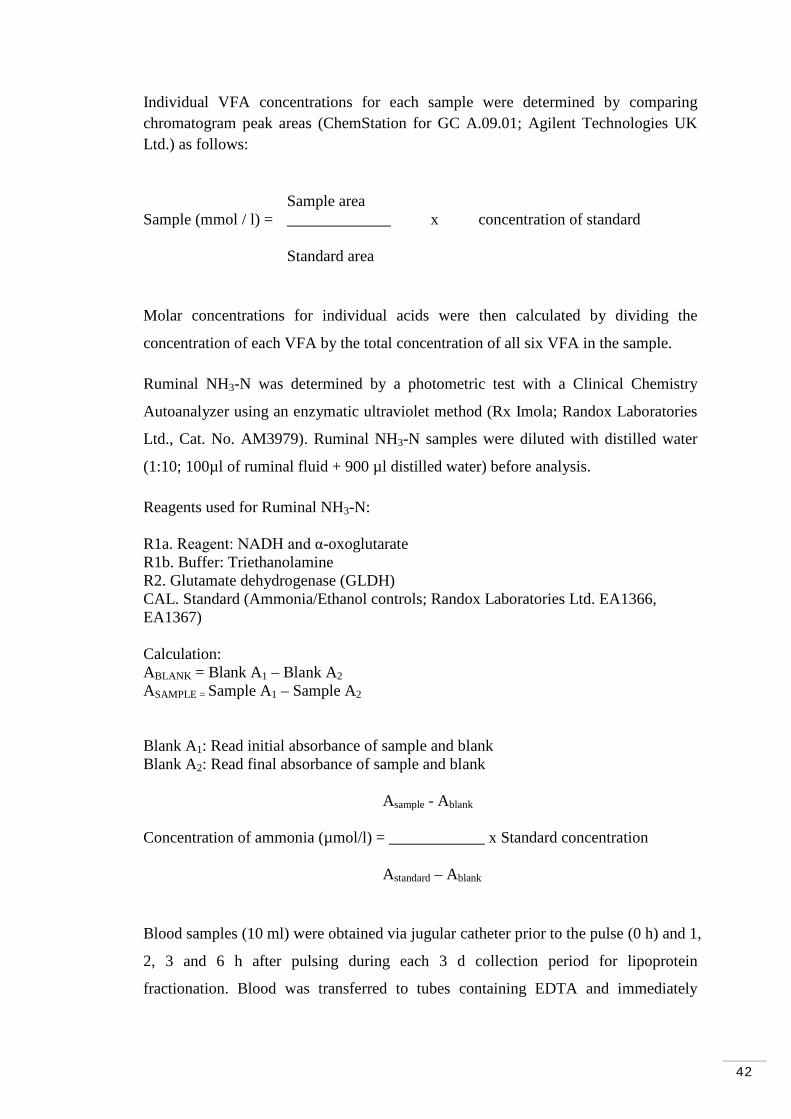
42
Individual VFA concentrations for each sample were determined by comparing chromatogram peak areas (ChemStation for GC A.09.01; Agilent Technologies UK Ltd.) as follows:
Sample area Sample (mmol / l) = _____________ x concentration of standard Standard area
Molar concentrations for individual acids were then calculated by dividing the
concentration of each VFA by the total concentration of all six VFA in the sample.
Ruminal NH3-N was determined by a photometric test with a Clinical Chemistry
Autoanalyzer using an enzymatic ultraviolet method (Rx Imola; Randox Laboratories
Ltd., Cat. No. AM3979). Ruminal NH3-N samples were diluted with distilled water
(1:10; 100µl of ruminal fluid + 900 µl distilled water) before analysis.
Reagents used for Ruminal NH3-N: R1a. Reagent: NADH and α-oxoglutarate R1b. Buffer: Triethanolamine R2. Glutamate dehydrogenase (GLDH) CAL. Standard (Ammonia/Ethanol controls; Randox Laboratories Ltd. EA1366, EA1367) Calculation: ABLANK = Blank A1 – Blank A2 ASAMPLE = Sample A1 – Sample A2 Blank A1: Read initial absorbance of sample and blank Blank A2: Read final absorbance of sample and blank
Asample - Ablank Concentration of ammonia (µmol/l) = ____________ x Standard concentration
Astandard – Ablank
Blood samples (10 ml) were obtained via jugular catheter prior to the pulse (0 h) and 1,
2, 3 and 6 h after pulsing during each 3 d collection period for lipoprotein
fractionation. Blood was transferred to tubes containing EDTA and immediately

43
centrifuged for 10 min at 3,000 x g (Centaur 2 MSE, Milton Keynes) for harvesting
plasma.
Based on their density, lipoprotein fractions were separated sequentially by
preparative ultracentrifugation in a Beckman XL-70 Preparative centrifuge (Beckman
Coulter UK Ltd., Buckinghamshire, UK). Potassium bromide (KBr) was added to the
plasma to obtain the required density calculated by use of the Radding-Steinberg
(1960) formula:
[(V (df – di)]
X= __________________
[1 – (0.312 x df)]
X= grams of KBr di= initial density df= final density V= volume of serum (ml) 0.312= partial specific volume of KBr
The density ranges selected for isolation of the major lipoprotein fractions of the
bovine were those normally adopted for human lipoprotein separation, i.e., LDL, d<
1.063 g/ml (this fraction also contains chylomicrons/VLDL fractions) and HDL, d>
1.063 g/ml (Chapman, 1980). The chylomicrons/VLDL fraction was not isolated due
to its low concentration. KBr was added to the plasma and mixed until the salt was
dissolved. Density was adjusted in order to obtain the LDL fraction. The plasma and
salt solution were added to Beckman Quick-Seal tubes. Plasma was then separated
into lipoprotein fractions (LDL and HDL fractions) by ultracentrifugation at 39,000 x
g for 20 h at 12ºC. Tubes were carefully removed after ultracentrifugation and each
tube was cut using a Kontron bench tube slicer to retrieve the top layer which was
predominantly LDL fraction. Density of lipoprotein and KBr solution was re-adjusted
to obtain the HDL fraction and tubes were ultracentrifuged at 39,000 x g for 40 h at
12ºC. Tubes were carefully removed from the centrifuge and cut as previously.
Another 10 ml blood sample was collected at each sampling time and stored at -20ºC
for analysis of FA profile and quantification of lipoprotein fractions. Lipids from
plasma, HDL and LDL fractions were extracted by adaptation of the method by Bligh
44
and Dyer (1959) and methylated according to the method of Christie (1982) with
modifications by Chouinard et al. (1999). All chemicals and solvents used for this
method were of analytical grade. For analysis of FA in plasma and lipoprotein
fractions, a GC system (Agilent, GC 6890 series) equipped with a CP-Sil 88 fused-
silica capillary column (100 m x 0.25 mm i.d., with 0.2 µm film thickness; Varian Inc.,
Oxford) was used. The GC conditions were as follows: the oven temperature was
initially set at 110°C for 4 min after injection, and then increased to 240°C with
equilibration time of 2 min. The inlet and flame-ionization detector temperatures were
260°C, the split ratio was 15:1 and a 2 µl injection volume was used. The hydrogen
carrier gas flow to the detector was 25 ml/min, airflow was 400 ml/min, and the flow
of nitrogen makeup gas was 40 ml/min. Fatty acid peaks were identified by using a
fatty acid methyl ester standard (FAME; Supelco 37 Component FAME mix,
Bellefonte, PA) and a tFA reference standard (trans 11- C18:1, methyl ester, Supelco,
Bellefonte, PA).
Concentrations of lipoprotein fractions in plasma (LDL and HDL fractions) were
determined using a Clinical Chemistry Autoanalyzer (Rx Imola; Randox Laboratories,
Ltd.).
HDL/LDL Calibrator - Cat. No. CH2673
Performance data for HDL cholesterol (Cat. No. CH3811):
Range: 0.04 - 3.73 mmol (1.43 - 144 mg/dl) Sample type: EDTA plasma Intra-assay precision: 1.20% at 0.96 mmol/l (37.07 mg/dl)
1.53% at 1.5 mmol/l (57.93 mg/dl) Inter-assay precision: 0.93% at 0.97 mmol/l (37.7 mg/dl)
0.88% at 1.5 mmol/l (58.1 mg/dl)
Performance data for LDL cholesterol (Cat. No. CH3841):
Range 0.19 - 22.2 mmol (7.35 - 860 mg/dl) Sample type EDTA plasma Intra-assay precision 0.58% at 2.0 mmol/l (77.5 mg/dl)
0.50% at 4.95 mmol/l (191.4 mg/dl) Inter-assay precision 1.61% at 1.27 mmol/l (49.0 mg/dl)
1.78% at 2.78 mmol/l (107.5 mg/dl)
Cholesteryl esters, triglycerides, and phospholipids were separated by thin layer
chromatography using the solvent system light petroleum ether (b.p. 40-60):diethyl
45
ether:acetic acid in ratios of 90:30:1ratio (by volume) (Brown et al., 1980). Lipid
subgroup standards were included on each TLC plate to identify the position of the
lipids of interest. The bands were then visualized with iodine vapour and scraped to
re-extract the lipids (Hara and Radin, 1978; Brow et al., 1980). FA in each band were
determined by capillary column GC described for plasma and lipoprotein fractions.
The concentration of each FA (g/100g) was calculated for 16:0 to 22:6n3 FA with
concentrations higher than 0.3 g/100g.
2.2.3 Statistical analysis
Data were analysed using the GenStat 12th statistical package (VSN International Ltd.,
Oxford) as a Latin square 3 x 3 design with fixed effects of treatments, periods and
sampling times; cow was included as a random effect to account for repeated
measures. Fatty acid composition of lipid subgroups within lipoproteins was analysed
using a Factorial design based on treatments (3), fractions (2) and lipids (3). Diurnal
variations were analysed as POLYANOVA based on days (3) and sampling times (5)
factorial. Data are reported as least square means ± SED across all sampling times.

46
2.3 Results
2.3.1 Composition of treatments
PHVO+SM contained higher concentrations of saturated (18 g/100g),
monounsaturated (57 g/100g) and trans (51 g/100g) fatty acids and lower
concentrations of unsaturated (59 g/100gr) and polyunsaturated (2 g/100g) fatty acids
than SO+SM. VA (8 g/100g) and EA (8 g/100g) concentrations were higher in the
PHVO+SM mix (Table 2.2).
2.3.2 Ruminal fermentation parameters
Ruminal pH was not affected by treatment. Compared with control, SO and PHVO
resulted in lower (P < 0.05) concentrations of ruminal NH3-N and total VFA
concentrations. Individual molar concentrations of VFA were not affected by
treatment (Table 2.3).
2.3.3 Plasma samples and treatment effects
There was no difference between treatments in concentrations of SFA and PUFA in
plasma or lipoprotein fractions (Table 2.4). Compared with control, SO and PHVO
resulted in higher (P < 0.05) concentrations of MUFA in plasma and the LDL+VLDL
fraction, higher (P < 0.05) concentrations of trans fatty acids in plasma and both
lipoprotein fractions, and higher (P < 0.05) concentrations of UFA (MUFA+PUFA)
and LCFA in the LDL+VLDL fraction (Table 2.4).
Treatments influenced individual FA concentrations of some 18:1 trans isomers in
plasma samples. SO resulted in higher concentrations of 18:1 trans 10, trans 11, and
20:1, and lower concentrations of 12:0, 15:0, 18:1 trans 5, 20:3n6 and 23:0 compared
with control and PHVO (Table 2.5).

47
Table 2.2 Fatty acid composition of oils and skimmed milk emulsions used for ruminal pulses Control Oils Treatments4
Fatty acid, g/100 g SM1 SO2 PHVO3 SO+SM PHVO+SM
10:0 2.51 - - - - 12:0 2.14 - 0.23 - 0.24 14:0 7.89 0.07 0.18 0.08 0.30 14:1 0.50 - - - - 15:0 0.98 - - - - 16:0 27.02 10.74 7.82 10.84 7.80 16:1 1.54 - - - 0.13 17:0 0.63 - - 0.08 0.07 18:0 11.69 4.28 8.35 4.30 8.15 18:1 trans-4 - - 0.59 - 0.48 18:1 trans-5 - - 1.48 - 1.38 18:1 trans-6-8 - - 17.60 - 16.67 18:1 trans-9 - - 8.39 - 8.33 18:1 trans-10 - - 9.28 - 8.96 18:1 trans-11 1.70 - 7.67 - 7.54 18:1 trans-12 - - 7.35 - 6.97 18:1 cis-9 21.08 22.42 6.06 22.33 6.27 18:2 n-trans 6 - - 1.13 - 0.84 18:2 n-cis 6 3.39 53.03 0.42 52.90 0.46 20:0 - 0.34 0.76 0.34 0.73 18:3 n-6 - - 0.42 - 0.58 20:1 - 0.20 - 0.18 0.15 18:3 n-3 0.61 6.78 0.06 6.75 0.14 18:2 cis-9, trans-11 1.03 - - - - 20:2 - 0.05 0.05 - - 22:0 - 0.38 0.44 0.37 0.42 24:0 - 0.15 0.15 0.14 0.18 Saturated 53.89 15.96 19.93 16.15 17.89 Monounsaturated 24.82 22.62 58.42 22.51 56.88 Polyunsaturated 4 59.86 2.08 59.65 2.02 Unsaturated (Mono+PUFA) 28.82 82.48 60.50 82.16 58.90 Trans 1.7 - 53.49 - 51.17 Unidentified5 17.29 1.56 21.57 1.69 23.21 1SM = Skim milk; 2SO = Soya oil; 3PHVO = Partially hydrogenated vegetable oil; 4Single administration per day, 5Fatty acids < 0.03 g / 100g.
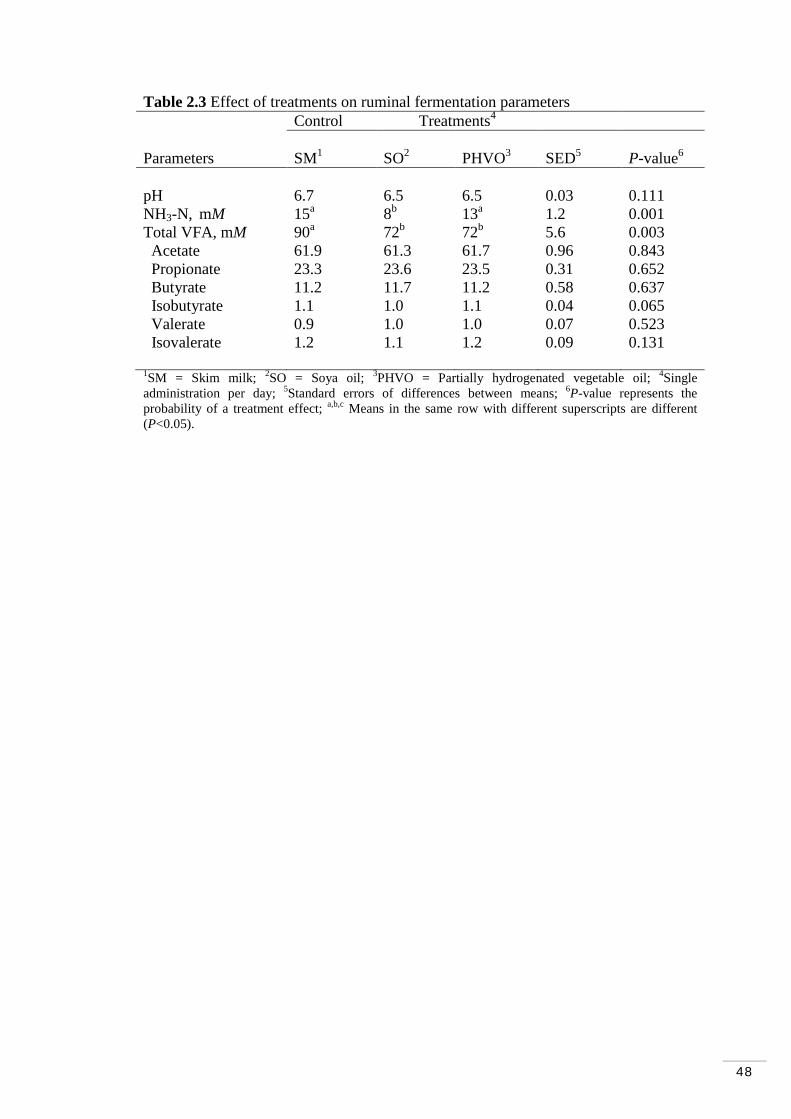
48
Table 2.3 Effect of treatments on ruminal fermentation parameters Control Treatments4 Parameters SM1 SO2 PHVO3 SED5 P-value6
pH 6.7 6.5 6.5 0.03 0.111 NH3-N, mM 15a 8b 13a 1.2 0.001 Total VFA, mM 90a 72b 72b 5.6 0.003 Acetate 61.9 61.3 61.7 0.96 0.843 Propionate 23.3 23.6 23.5 0.31 0.652 Butyrate 11.2 11.7 11.2 0.58 0.637 Isobutyrate 1.1 1.0 1.1 0.04 0.065 Valerate 0.9 1.0 1.0 0.07 0.523 Isovalerate 1.2 1.1 1.2 0.09 0.131 1SM = Skim milk; 2SO = Soya oil; 3PHVO = Partially hydrogenated vegetable oil; 4Single administration per day; 5Standard errors of differences between means; 6P-value represents the probability of a treatment effect; a,b,c Means in the same row with different superscripts are different (P<0.05).
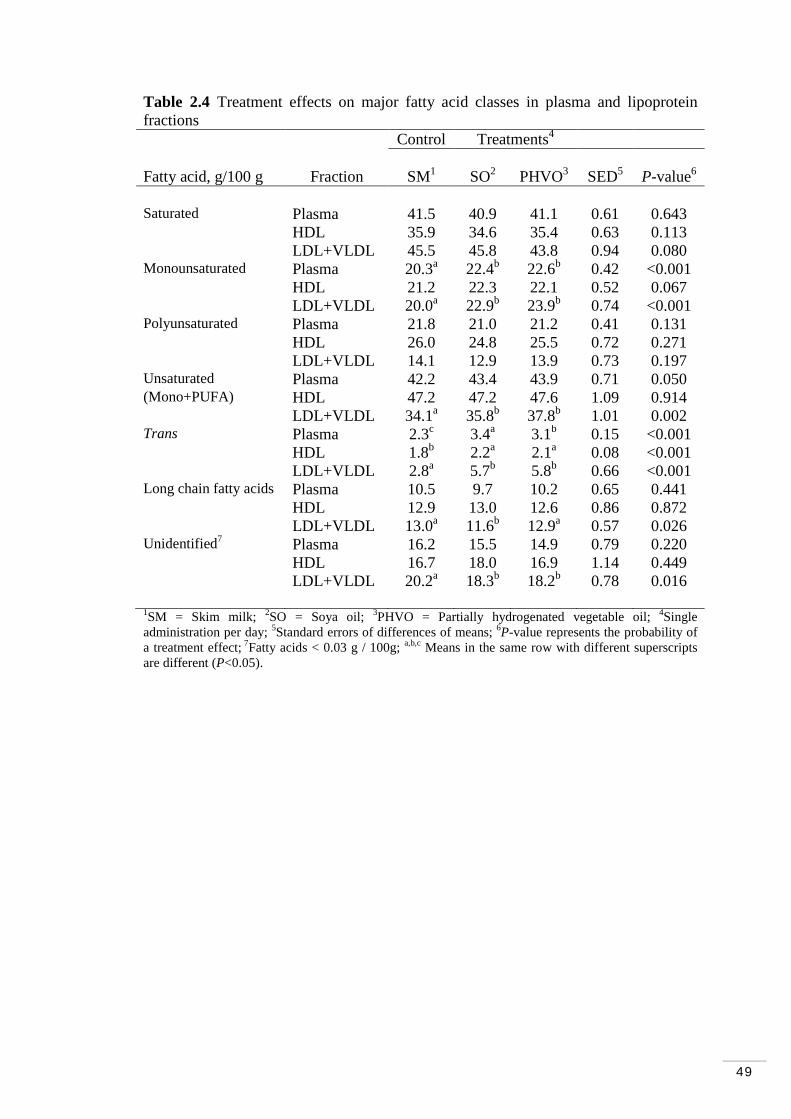
49
Table 2.4 Treatment effects on major fatty acid classes in plasma and lipoprotein fractions Control Treatments4 Fatty acid, g/100 g Fraction SM1 SO2 PHVO3 SED5 P-value6
Saturated Plasma 41.5 40.9 41.1 0.61 0.643 HDL 35.9 34.6 35.4 0.63 0.113 LDL+VLDL 45.5 45.8 43.8 0.94 0.080 Monounsaturated Plasma 20.3a 22.4b 22.6b 0.42 <0.001 HDL 21.2 22.3 22.1 0.52 0.067 LDL+VLDL 20.0a 22.9b 23.9b 0.74 <0.001 Polyunsaturated Plasma 21.8 21.0 21.2 0.41 0.131 HDL 26.0 24.8 25.5 0.72 0.271 LDL+VLDL 14.1 12.9 13.9 0.73 0.197 Unsaturated Plasma 42.2 43.4 43.9 0.71 0.050 (Mono+PUFA) HDL 47.2 47.2 47.6 1.09 0.914 LDL+VLDL 34.1a 35.8b 37.8b 1.01 0.002 Trans Plasma 2.3c 3.4a 3.1b 0.15 <0.001 HDL 1.8b 2.2a 2.1a 0.08 <0.001 LDL+VLDL 2.8a 5.7b 5.8b 0.66 <0.001 Long chain fatty acids Plasma 10.5 9.7 10.2 0.65 0.441 HDL 12.9 13.0 12.6 0.86 0.872 LDL+VLDL 13.0a 11.6b 12.9a 0.57 0.026 Unidentified7 Plasma 16.2 15.5 14.9 0.79 0.220 HDL 16.7 18.0 16.9 1.14 0.449 LDL+VLDL 20.2a 18.3b 18.2b 0.78 0.016 1SM = Skim milk; 2SO = Soya oil; 3PHVO = Partially hydrogenated vegetable oil; 4Single administration per day; 5Standard errors of differences of means; 6P-value represents the probability of a treatment effect; 7Fatty acids < 0.03 g / 100g; a,b,c Means in the same row with different superscripts are different (P<0.05).
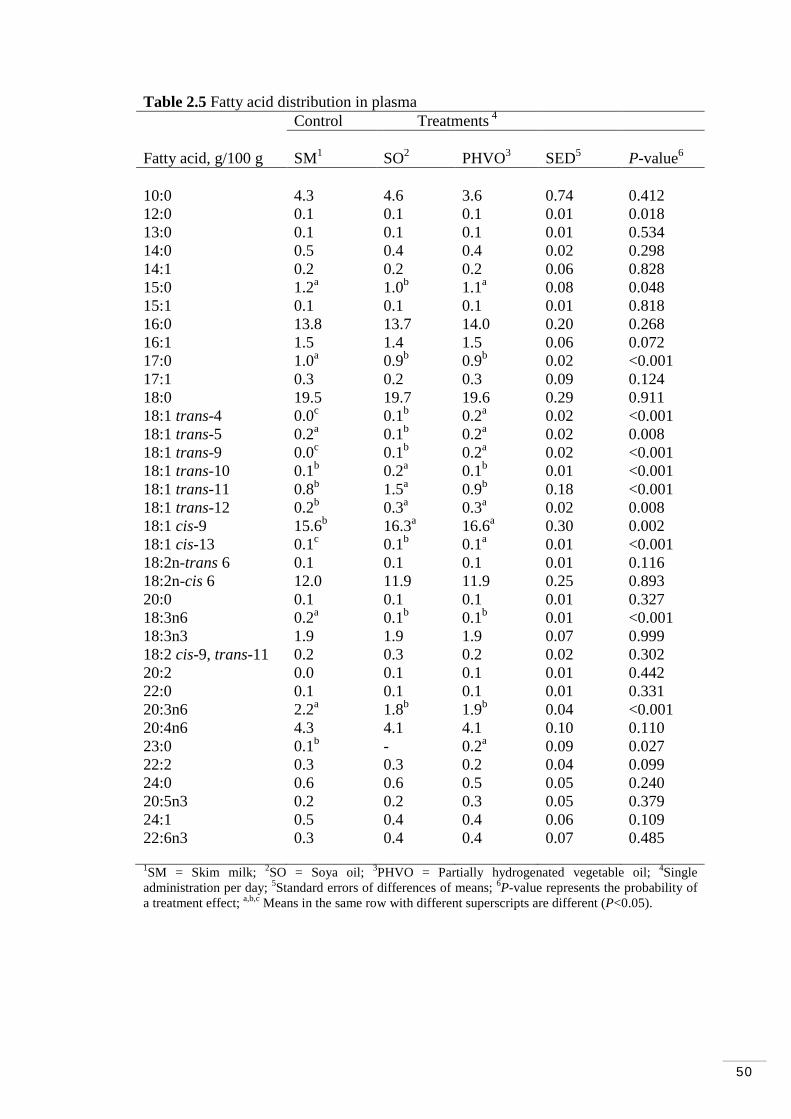
50
Table 2.5 Fatty acid distribution in plasma Control Treatments 4 Fatty acid, g/100 g SM1 SO2 PHVO3 SED5 P-value6
10:0 4.3 4.6 3.6 0.74 0.412 12:0 0.1 0.1 0.1 0.01 0.018 13:0 0.1 0.1 0.1 0.01 0.534 14:0 0.5 0.4 0.4 0.02 0.298 14:1 0.2 0.2 0.2 0.06 0.828 15:0 1.2a 1.0b 1.1a 0.08 0.048 15:1 0.1 0.1 0.1 0.01 0.818 16:0 13.8 13.7 14.0 0.20 0.268 16:1 1.5 1.4 1.5 0.06 0.072 17:0 1.0a 0.9b 0.9b 0.02 <0.001 17:1 0.3 0.2 0.3 0.09 0.124 18:0 19.5 19.7 19.6 0.29 0.911 18:1 trans-4 0.0c 0.1b 0.2a 0.02 <0.001 18:1 trans-5 0.2a 0.1b 0.2a 0.02 0.008 18:1 trans-9 0.0c 0.1b 0.2a 0.02 <0.001 18:1 trans-10 0.1b 0.2a 0.1b 0.01 <0.001 18:1 trans-11 0.8b 1.5a 0.9b 0.18 <0.001 18:1 trans-12 0.2b 0.3a 0.3a 0.02 0.008 18:1 cis-9 15.6b 16.3a 16.6a 0.30 0.002 18:1 cis-13 0.1c 0.1b 0.1a 0.01 <0.001 18:2n-trans 6 0.1 0.1 0.1 0.01 0.116 18:2n-cis 6 12.0 11.9 11.9 0.25 0.893 20:0 0.1 0.1 0.1 0.01 0.327 18:3n6 0.2a 0.1b 0.1b 0.01 <0.001 18:3n3 1.9 1.9 1.9 0.07 0.999 18:2 cis-9, trans-11 0.2 0.3 0.2 0.02 0.302 20:2 0.0 0.1 0.1 0.01 0.442 22:0 0.1 0.1 0.1 0.01 0.331 20:3n6 2.2a 1.8b 1.9b 0.04 <0.001 20:4n6 4.3 4.1 4.1 0.10 0.110 23:0 0.1b - 0.2a 0.09 0.027 22:2 0.3 0.3 0.2 0.04 0.099 24:0 0.6 0.6 0.5 0.05 0.240 20:5n3 0.2 0.2 0.3 0.05 0.379 24:1 0.5 0.4 0.4 0.06 0.109 22:6n3 0.3 0.4 0.4 0.07 0.485 1SM = Skim milk; 2SO = Soya oil; 3PHVO = Partially hydrogenated vegetable oil; 4Single administration per day; 5Standard errors of differences of means; 6P-value represents the probability of a treatment effect; a,b,c Means in the same row with different superscripts are different (P<0.05).

51
2.3.4 Lipoprotein fractions and treatment effects
There was no difference between treatments in plasma concentration of lipoprotein
cholesterol fractions (Table 2.6). Compared with control and SO, PHVO resulted in
higher concentrations of EA, but lower concentrations of 18:1 trans 10 in the HDL
fraction (Table 2.7). Compared with control and SO, PHVO, resulted in higher
concentrations of 18:1 trans 5, trans 6-8, and EA, and trans 10 in the LDL+VLDL
fraction (Table 2.8). Compared with control and PHVO, SO resulted in higher
concentrations of VA in both lipoprotein fractions.
Significant interactions (P < 0.05) between lipoprotein fractions and treatments were
observed. Compared with control and SO, PHVO resulted in higher concentration of
18:1 trans 5, trans 9 and 18:2n-trans 6 in the HDL fraction. On the other hand,
compared with control and SO, PHVO resulted in higher concentrations of 18:1 trans
5, trans 9, trans 10 and trans 12 in the LDL+VLDL fraction (Table 2.9).
Table 2.6 Concentrations of HDL and LDL+VLDL fractions in plasma Control Treatments4 Parameters (mg/l) SM1 SO2 PHVO3 SED5 P-value6
HDL 0.4 0.5 0.4 0.05 0.261 LDL+VLDL 0.1 0.1 0.1 0.02 0.519 1SM = Skim milk; 2SO = Soya oil; 3PHVO = Partially hydrogenated vegetable oil; 4Single administration per day; 5Standard errors of differences of means; 6P-value represents the probability of a treatment effect.
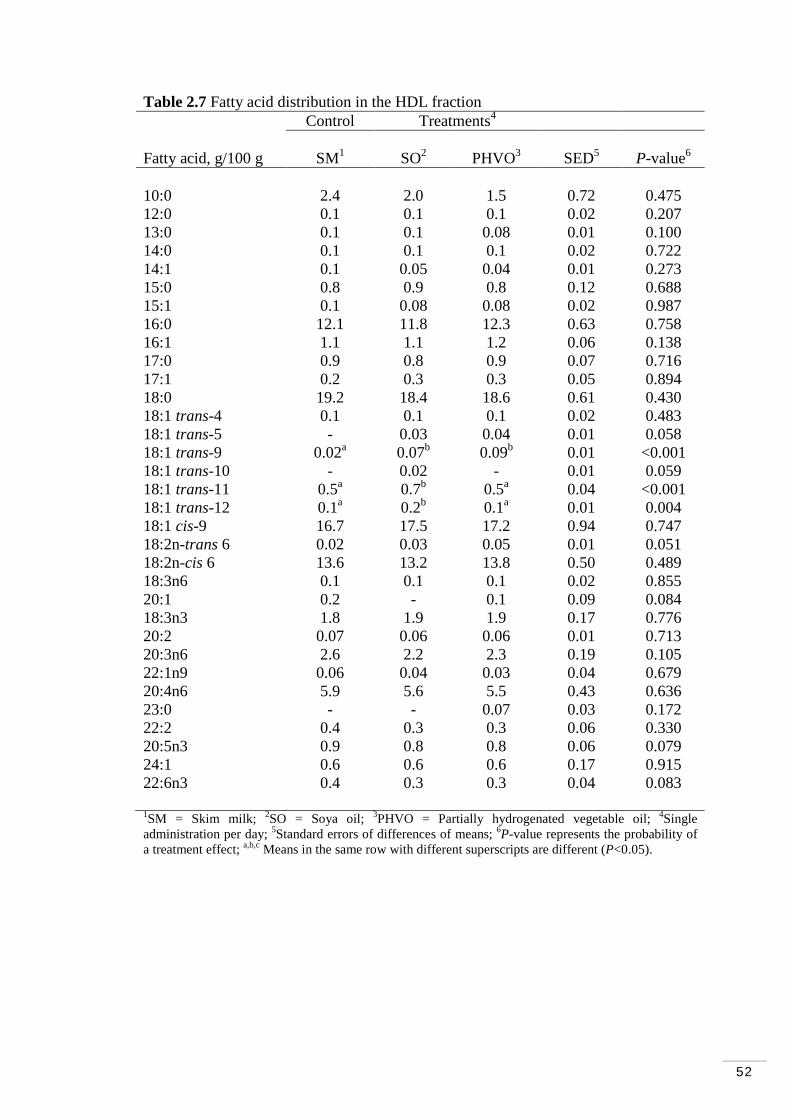
52
Table 2.7 Fatty acid distribution in the HDL fraction Control Treatments4 Fatty acid, g/100 g SM1 SO2 PHVO3 SED5 P-value6
10:0 2.4 2.0 1.5 0.72 0.475 12:0 0.1 0.1 0.1 0.02 0.207 13:0 0.1 0.1 0.08 0.01 0.100 14:0 0.1 0.1 0.1 0.02 0.722 14:1 0.1 0.05 0.04 0.01 0.273 15:0 0.8 0.9 0.8 0.12 0.688 15:1 0.1 0.08 0.08 0.02 0.987 16:0 12.1 11.8 12.3 0.63 0.758 16:1 1.1 1.1 1.2 0.06 0.138 17:0 0.9 0.8 0.9 0.07 0.716 17:1 0.2 0.3 0.3 0.05 0.894 18:0 19.2 18.4 18.6 0.61 0.430 18:1 trans-4 0.1 0.1 0.1 0.02 0.483 18:1 trans-5 - 0.03 0.04 0.01 0.058 18:1 trans-9 0.02a 0.07b 0.09b 0.01 <0.001 18:1 trans-10 - 0.02 - 0.01 0.059 18:1 trans-11 0.5a 0.7b 0.5a 0.04 <0.001 18:1 trans-12 0.1a 0.2b 0.1a 0.01 0.004 18:1 cis-9 16.7 17.5 17.2 0.94 0.747 18:2n-trans 6 0.02 0.03 0.05 0.01 0.051 18:2n-cis 6 13.6 13.2 13.8 0.50 0.489 18:3n6 0.1 0.1 0.1 0.02 0.855 20:1 0.2 - 0.1 0.09 0.084 18:3n3 1.8 1.9 1.9 0.17 0.776 20:2 0.07 0.06 0.06 0.01 0.713 20:3n6 2.6 2.2 2.3 0.19 0.105 22:1n9 0.06 0.04 0.03 0.04 0.679 20:4n6 5.9 5.6 5.5 0.43 0.636 23:0 - - 0.07 0.03 0.172 22:2 0.4 0.3 0.3 0.06 0.330 20:5n3 0.9 0.8 0.8 0.06 0.079 24:1 0.6 0.6 0.6 0.17 0.915 22:6n3 0.4 0.3 0.3 0.04 0.083 1SM = Skim milk; 2SO = Soya oil; 3PHVO = Partially hydrogenated vegetable oil; 4Single administration per day; 5Standard errors of differences of means; 6P-value represents the probability of a treatment effect; a,b,c Means in the same row with different superscripts are different (P<0.05).
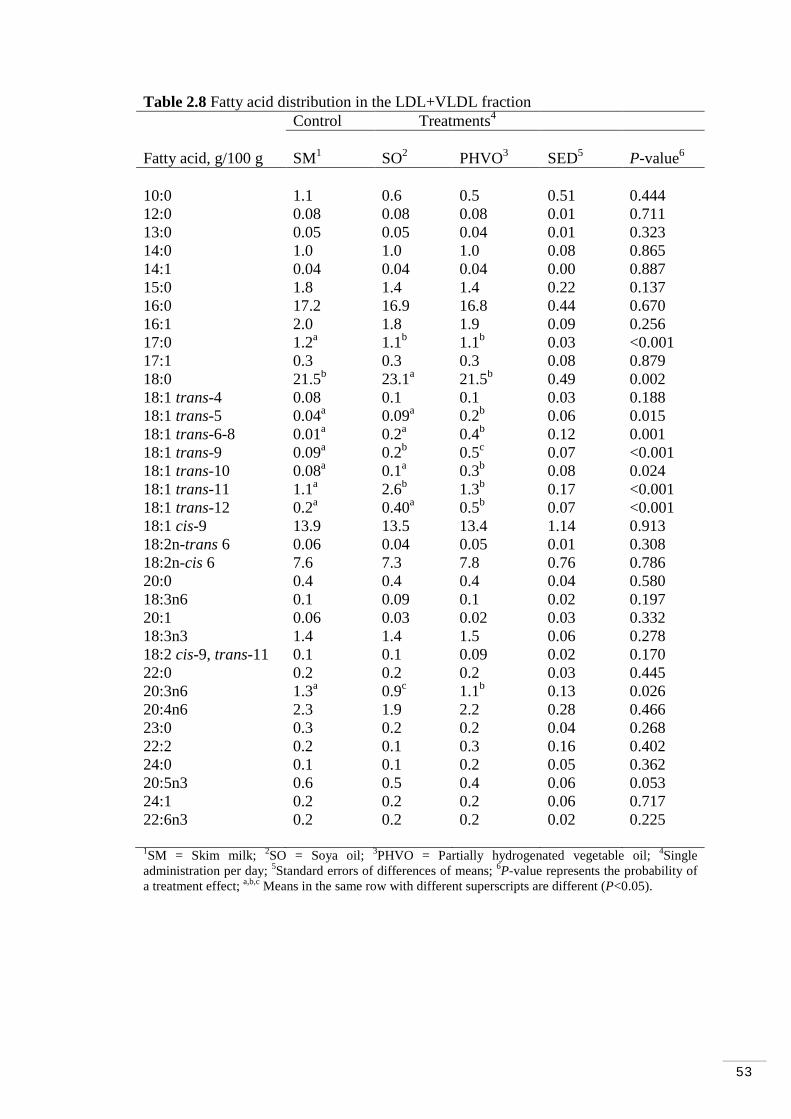
53
Table 2.8 Fatty acid distribution in the LDL+VLDL fraction Control Treatments4 Fatty acid, g/100 g SM1 SO2 PHVO3 SED5 P-value6
10:0 1.1 0.6 0.5 0.51 0.444 12:0 0.08 0.08 0.08 0.01 0.711 13:0 0.05 0.05 0.04 0.01 0.323 14:0 1.0 1.0 1.0 0.08 0.865 14:1 0.04 0.04 0.04 0.00 0.887 15:0 1.8 1.4 1.4 0.22 0.137 16:0 17.2 16.9 16.8 0.44 0.670 16:1 2.0 1.8 1.9 0.09 0.256 17:0 1.2a 1.1b 1.1b 0.03 <0.001 17:1 0.3 0.3 0.3 0.08 0.879 18:0 21.5b 23.1a 21.5b 0.49 0.002 18:1 trans-4 0.08 0.1 0.1 0.03 0.188 18:1 trans-5 0.04a 0.09a 0.2b 0.06 0.015 18:1 trans-6-8 0.01a 0.2a 0.4b 0.12 0.001 18:1 trans-9 0.09a 0.2b 0.5c 0.07 <0.001 18:1 trans-10 0.08a 0.1a 0.3b 0.08 0.024 18:1 trans-11 1.1a 2.6b 1.3b 0.17 <0.001 18:1 trans-12 0.2a 0.40a 0.5b 0.07 <0.001 18:1 cis-9 13.9 13.5 13.4 1.14 0.913 18:2n-trans 6 0.06 0.04 0.05 0.01 0.308 18:2n-cis 6 7.6 7.3 7.8 0.76 0.786 20:0 0.4 0.4 0.4 0.04 0.580 18:3n6 0.1 0.09 0.1 0.02 0.197 20:1 0.06 0.03 0.02 0.03 0.332 18:3n3 1.4 1.4 1.5 0.06 0.278 18:2 cis-9, trans-11 0.1 0.1 0.09 0.02 0.170 22:0 0.2 0.2 0.2 0.03 0.445 20:3n6 1.3a 0.9c 1.1b 0.13 0.026 20:4n6 2.3 1.9 2.2 0.28 0.466 23:0 0.3 0.2 0.2 0.04 0.268 22:2 0.2 0.1 0.3 0.16 0.402 24:0 0.1 0.1 0.2 0.05 0.362 20:5n3 0.6 0.5 0.4 0.06 0.053 24:1 0.2 0.2 0.2 0.06 0.717 22:6n3 0.2 0.2 0.2 0.02 0.225 1SM = Skim milk; 2SO = Soya oil; 3PHVO = Partially hydrogenated vegetable oil; 4Single administration per day; 5Standard errors of differences of means; 6P-value represents the probability of a treatment effect; a,b,c Means in the same row with different superscripts are different (P<0.05).
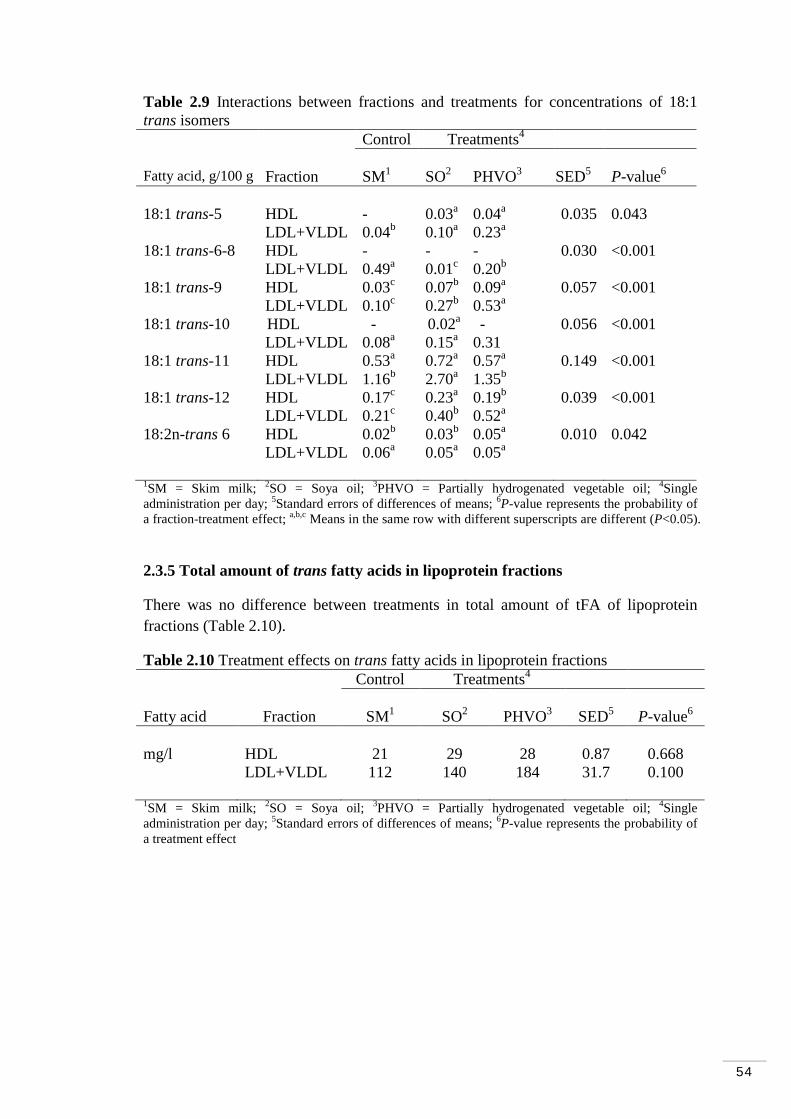
54
Table 2.9 Interactions between fractions and treatments for concentrations of 18:1 trans isomers Control Treatments4 Fatty acid, g/100 g Fraction SM1 SO2 PHVO3 SED5 P-value6
18:1 trans-5 HDL - 0.03a 0.04a 0.035 0.043 LDL+VLDL 0.04b 0.10a 0.23a 18:1 trans-6-8 HDL - - - 0.030 <0.001 LDL+VLDL 0.49a 0.01c 0.20b 18:1 trans-9 HDL 0.03c 0.07b 0.09a 0.057 <0.001 LDL+VLDL 0.10c 0.27b 0.53a 18:1 trans-10 HDL - 0.02a - 0.056 <0.001 LDL+VLDL 0.08a 0.15a 0.31 18:1 trans-11 HDL 0.53a 0.72a 0.57a 0.149 <0.001 LDL+VLDL 1.16b 2.70a 1.35b 18:1 trans-12 HDL 0.17c 0.23a 0.19b 0.039 <0.001 LDL+VLDL 0.21c 0.40b 0.52a 18:2n-trans 6 HDL 0.02b 0.03b 0.05a 0.010 0.042 LDL+VLDL 0.06a 0.05a 0.05a 1SM = Skim milk; 2SO = Soya oil; 3PHVO = Partially hydrogenated vegetable oil; 4Single administration per day; 5Standard errors of differences of means; 6P-value represents the probability of a fraction-treatment effect; a,b,c Means in the same row with different superscripts are different (P<0.05).
2.3.5 Total amount of trans fatty acids in lipoprotein fractions
There was no difference between treatments in total amount of tFA of lipoprotein fractions (Table 2.10).
Table 2.10 Treatment effects on trans fatty acids in lipoprotein fractions Control Treatments4 Fatty acid Fraction SM1 SO2 PHVO3 SED5 P-value6
mg/l HDL 21 29 28 0.87 0.668 LDL+VLDL 112 140 184 31.7 0.100 1SM = Skim milk; 2SO = Soya oil; 3PHVO = Partially hydrogenated vegetable oil; 4Single administration per day; 5Standard errors of differences of means; 6P-value represents the probability of a treatment effect
55
2.3.6 Fatty acid composition of lipid subgroups within lipoproteins
Total lipid concentration (mg/l) was not affected by treatments. Total lipid
concentration was increased in LDL+VLDL-TG. 16:0 and 18:0 were not affected by
treatments but were increased in LDL+VLDL-TG. Compared with control, SO and
PHVO increased EA. EA was increased in LDL+VLDL-CE. Compared with control
and SO, PHVO increased VA. VA was higher in CE and TG compared with PL
subgroup. 18:1 cis 9 was not affected by treatments but was higher in LDL+VLDL-PL
(Table 2.11a).
18:2 trans 6 was not affected by treatments but was increased in HDL-TG. 18:2 cis 6
was not affected by treatments but was higher in CE than PL and TG subgroups.
18:3n6 was not affected by treatments but higher in HDL-TG. 18:3n3 was not affected
by treatments but was higher in CE than TG and PL subgroups. 20:3n6 was not
affected by treatments but was was higher in HDL-PL. Compared with SO, PHVO
and control increased 20:5n3. 22:6n3 was not affected by treatments but was higher in
TG than CE and PL subgroups (Table 2.11b).
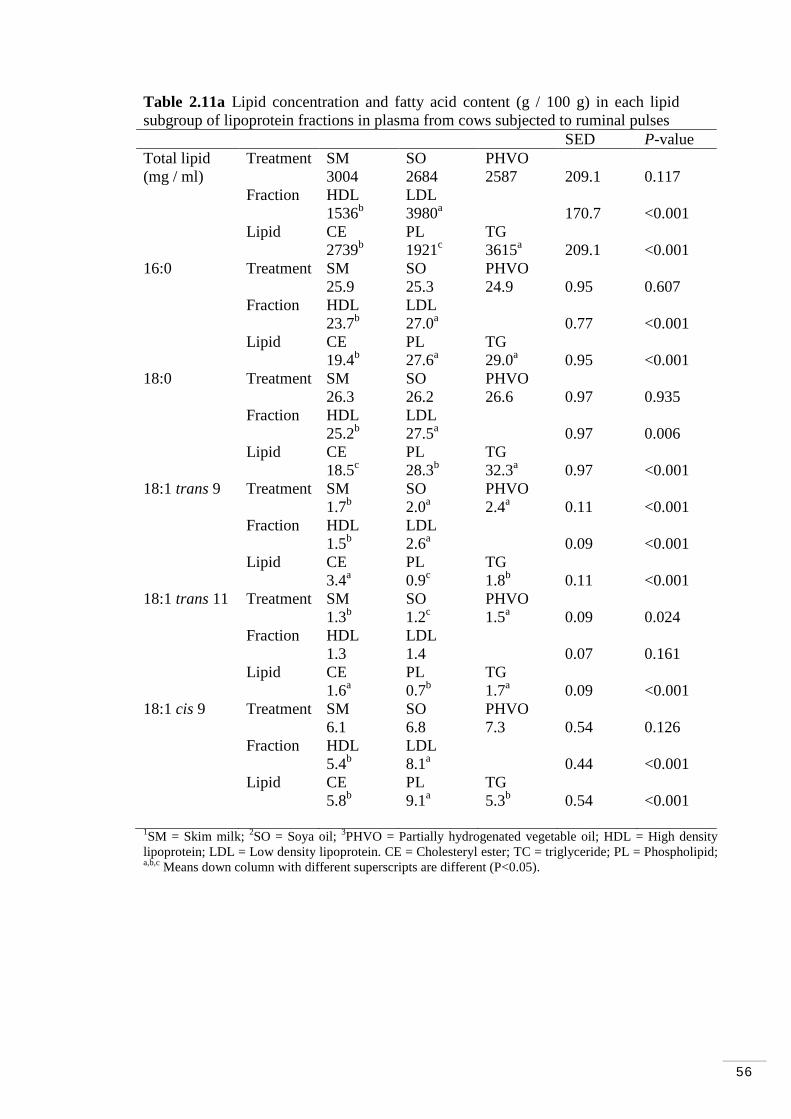
56
Table 2.11a Lipid concentration and fatty acid content (g / 100 g) in each lipid subgroup of lipoprotein fractions in plasma from cows subjected to ruminal pulses SED P-value Total lipid Treatment SM SO PHVO (mg / ml) 3004 2684 2587 209.1 0.117 Fraction HDL LDL 1536b 3980a 170.7 <0.001 Lipid CE PL TG 2739b 1921c 3615a 209.1 <0.001 16:0 Treatment SM SO PHVO 25.9 25.3 24.9 0.95 0.607 Fraction HDL LDL 23.7b 27.0a 0.77 <0.001 Lipid CE PL TG 19.4b 27.6a 29.0a 0.95 <0.001 18:0 Treatment SM SO PHVO 26.3 26.2 26.6 0.97 0.935 Fraction HDL LDL 25.2b 27.5a 0.97 0.006 Lipid CE PL TG 18.5c 28.3b 32.3a 0.97 <0.001 18:1 trans 9 Treatment SM SO PHVO 1.7b 2.0a 2.4a 0.11 <0.001 Fraction HDL LDL 1.5b 2.6a 0.09 <0.001 Lipid CE PL TG 3.4a 0.9c 1.8b 0.11 <0.001 18:1 trans 11 Treatment SM SO PHVO 1.3b 1.2c 1.5a 0.09 0.024 Fraction HDL LDL 1.3 1.4 0.07 0.161 Lipid CE PL TG 1.6a 0.7b 1.7a 0.09 <0.001 18:1 cis 9 Treatment SM SO PHVO 6.1 6.8 7.3 0.54 0.126 Fraction HDL LDL 5.4b 8.1a 0.44 <0.001 Lipid CE PL TG 5.8b 9.1a 5.3b 0.54 <0.001 1SM = Skim milk; 2SO = Soya oil; 3PHVO = Partially hydrogenated vegetable oil; HDL = High density lipoprotein; LDL = Low density lipoprotein. CE = Cholesteryl ester; TC = triglyceride; PL = Phospholipid; a,b,c Means down column with different superscripts are different (P<0.05).

57
Table 2.11b Fatty acid content (g /100 g) in each lipid subgroup of lipoprotein fractions in plasma from cows subjected to ruminal pulses SED P-value 18:2 trans 6 Treatment SM SO PHVO 1.6 1.5 1.4 0.14 0.470 Fraction HDL LDL 1.9a 1.1b 0.12 <0.001 Lipid CE PL TG 1.6b 0.9c 2.0a 0.14 <0.001 18:2 cis 6 Treatment SM SO PHVO 9.0 8.9 8.9 1.09 0.993 Fraction HDL LDL 9.1 8.8 0.89 0.679 Lipid CE PL TG 18.7a 5.7b 2.5c 1.09 <0.001 18:3n6 Treatment SM SO PHVO 1.5 1.3 1.5 0.09 0.081 Fraction HDL LDL 1.9a 1.1b 0.08 <0.001 Lipid CE PL TG 1.9a 0.9b 1.7a 0.09 <0.001 18:3n3 Treatment SM SO PHVO 2.1 2.3 2.3 0.23 0.785 Fraction HDL LDL 2.4 2.0 0.19 0.051 Lipid CE PL TG 4.8a 0.7c 1.2b 0.23 <0.001 20:3n6 Treatment SM SO PHVO 1.0 1.1 1.0 0.09 0.730 Fraction HDL LDL 1.3a 0.8b 0.07 <0.001 Lipid CE PL TG 0.7c 1.3a 1.1b 0.09 <0.001 20:5n3 Treatment SM SO PHVO 0.7a 0.5b 0.7a 0.01 <0.001 Fraction HDL LDL 0.6 0.6 0.01 0.993 Lipid CE PL TG 0.6 0.6 0.6 0.01 0.619 22:6n3 Treatment SM SO PHVO 6.6 6.6 6.9 0.40 0.662 Fraction HDL LDL 6.6 6.8 0.33 0.450 Lipid CE PL TG 6.8b 3.3c 10.0a 0.40 <0.001 1SM = Skim milk; 2SO = Soya oil; 3PHVO = Partially hydrogenated vegetable oil; HDL = High density lipoprotein; LDL = Low density lipoprotein. CE = Cholesteryl ester; TC = triglyceride; PL = Phospholipid; a,b,c Means down column with different superscripts are different (P<0.05).
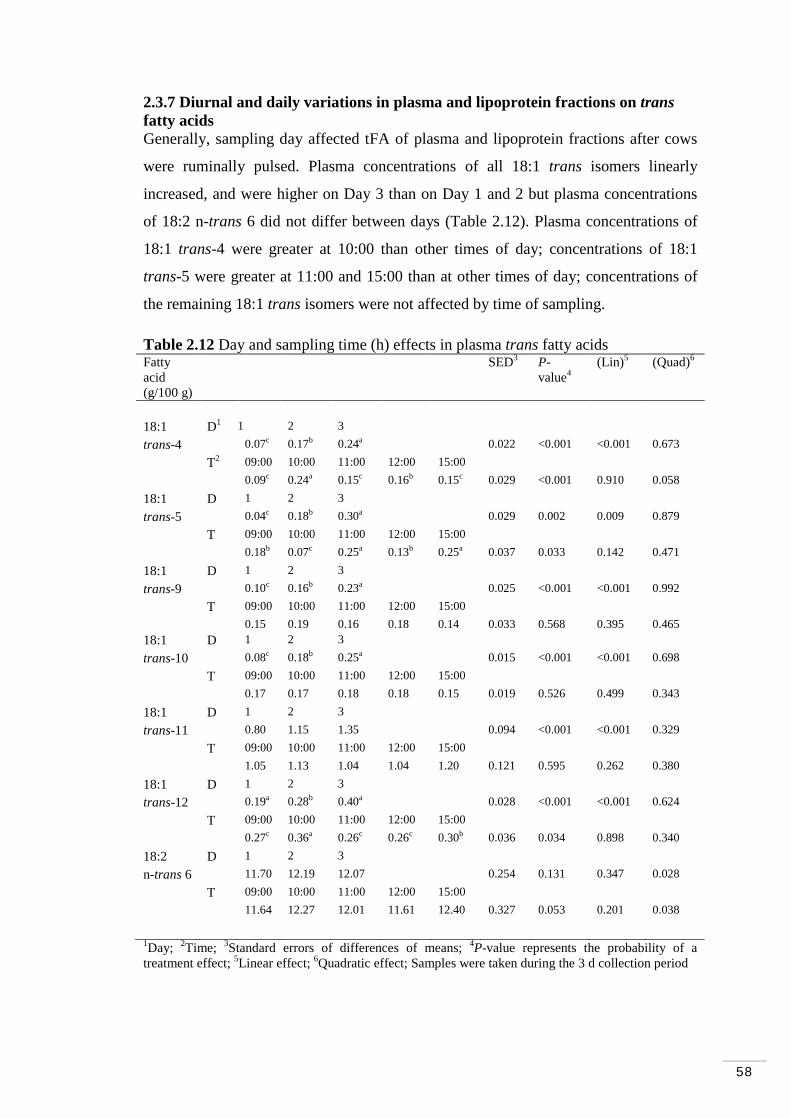
58
2.3.7 Diurnal and daily variations in plasma and lipoprotein fractions on trans fatty acids Generally, sampling day affected tFA of plasma and lipoprotein fractions after cows
were ruminally pulsed. Plasma concentrations of all 18:1 trans isomers linearly
increased, and were higher on Day 3 than on Day 1 and 2 but plasma concentrations
of 18:2 n-trans 6 did not differ between days (Table 2.12). Plasma concentrations of
18:1 trans-4 were greater at 10:00 than other times of day; concentrations of 18:1
trans-5 were greater at 11:00 and 15:00 than at other times of day; concentrations of
the remaining 18:1 trans isomers were not affected by time of sampling.
Table 2.12 Day and sampling time (h) effects in plasma trans fatty acids Fatty acid (g/100 g)
SED3 P-value4
(Lin)5 (Quad)6
18:1 D1 1 2 3 trans-4 0.07c 0.17b 0.24a 0.022 <0.001 <0.001 0.673 T2 09:00 10:00 11:00 12:00 15:00 0.09c 0.24a 0.15c 0.16b 0.15c 0.029 <0.001 0.910 0.058 18:1 D 1 2 3 trans-5 0.04c 0.18b 0.30a 0.029 0.002 0.009 0.879 T 09:00 10:00 11:00 12:00 15:00 0.18b 0.07c 0.25a 0.13b 0.25a 0.037 0.033 0.142 0.471 18:1 D 1 2 3 trans-9 0.10c 0.16b 0.23a 0.025 <0.001 <0.001 0.992 T 09:00 10:00 11:00 12:00 15:00 0.15 0.19 0.16 0.18 0.14 0.033 0.568 0.395 0.465 18:1 D 1 2 3 trans-10 0.08c 0.18b 0.25a 0.015 <0.001 <0.001 0.698 T 09:00 10:00 11:00 12:00 15:00 0.17 0.17 0.18 0.18 0.15 0.019 0.526 0.499 0.343 18:1 D 1 2 3 trans-11 0.80 1.15 1.35 0.094 <0.001 <0.001 0.329 T 09:00 10:00 11:00 12:00 15:00 1.05 1.13 1.04 1.04 1.20 0.121 0.595 0.262 0.380 18:1 D 1 2 3 trans-12 0.19a 0.28b 0.40a 0.028 <0.001 <0.001 0.624 T 09:00 10:00 11:00 12:00 15:00 0.27c 0.36a 0.26c 0.26c 0.30b 0.036 0.034 0.898 0.340 18:2 D 1 2 3 n-trans 6 11.70 12.19 12.07 0.254 0.131 0.347 0.028
T 09:00 10:00 11:00 12:00 15:00
11.64 12.27 12.01 11.61 12.40 0.327 0.053 0.201 0.038
1Day; 2Time; 3Standard errors of differences of means; 4P-value represents the probability of a treatment effect; 5Linear effect; 6Quadratic effect; Samples were taken during the 3 d collection period
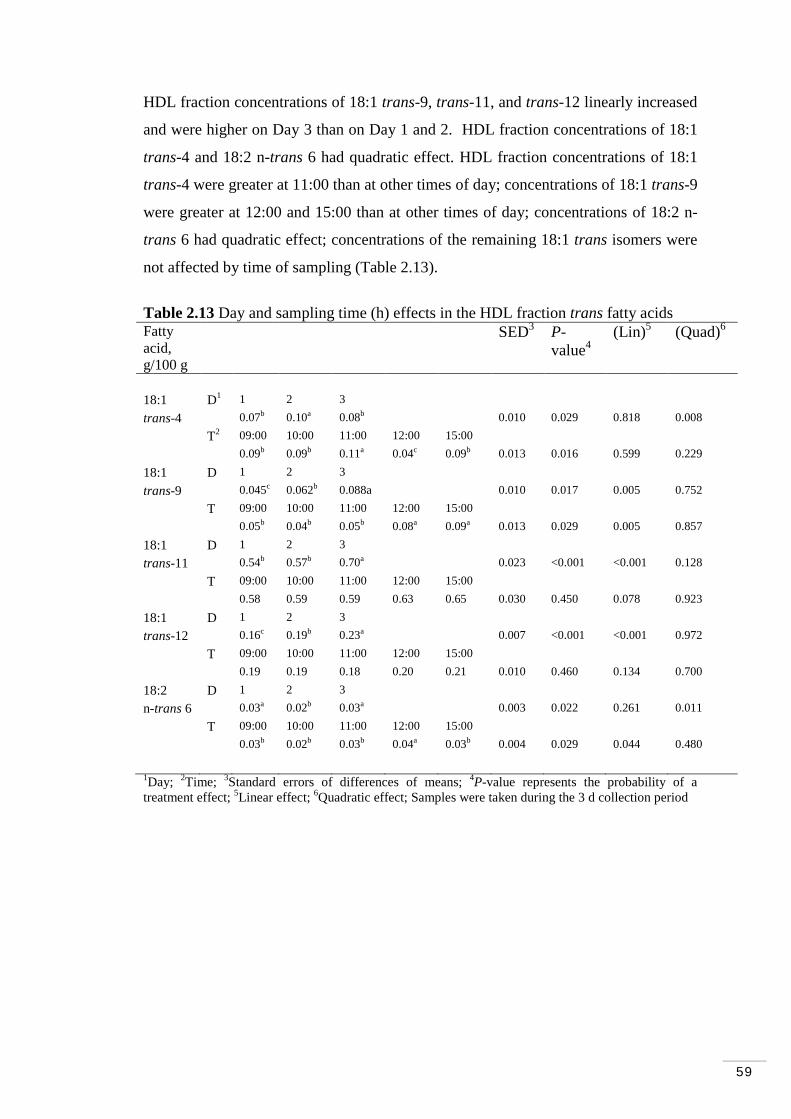
59
HDL fraction concentrations of 18:1 trans-9, trans-11, and trans-12 linearly increased
and were higher on Day 3 than on Day 1 and 2. HDL fraction concentrations of 18:1
trans-4 and 18:2 n-trans 6 had quadratic effect. HDL fraction concentrations of 18:1
trans-4 were greater at 11:00 than at other times of day; concentrations of 18:1 trans-9
were greater at 12:00 and 15:00 than at other times of day; concentrations of 18:2 n-
trans 6 had quadratic effect; concentrations of the remaining 18:1 trans isomers were
not affected by time of sampling (Table 2.13).
Table 2.13 Day and sampling time (h) effects in the HDL fraction trans fatty acids Fatty acid, g/100 g
SED3 P-value4
(Lin)5 (Quad)6
18:1 D1 1 2 3 trans-4 0.07b 0.10a 0.08b 0.010 0.029 0.818 0.008 T2 09:00 10:00 11:00 12:00 15:00 0.09b 0.09b 0.11a 0.04c 0.09b 0.013 0.016 0.599 0.229 18:1 D 1 2 3 trans-9 0.045c 0.062b 0.088a 0.010 0.017 0.005 0.752 T 09:00 10:00 11:00 12:00 15:00 0.05b 0.04b 0.05b 0.08a 0.09a 0.013 0.029 0.005 0.857 18:1 D 1 2 3 trans-11 0.54b 0.57b 0.70a 0.023 <0.001 <0.001 0.128 T 09:00 10:00 11:00 12:00 15:00 0.58 0.59 0.59 0.63 0.65 0.030 0.450 0.078 0.923 18:1 D 1 2 3 trans-12 0.16c 0.19b 0.23a 0.007 <0.001 <0.001 0.972 T 09:00 10:00 11:00 12:00 15:00 0.19 0.19 0.18 0.20 0.21 0.010 0.460 0.134 0.700 18:2 D 1 2 3 n-trans 6 0.03a 0.02b 0.03a 0.003 0.022 0.261 0.011 T 09:00 10:00 11:00 12:00 15:00 0.03b 0.02b 0.03b 0.04a 0.03b 0.004 0.029 0.044 0.480
1Day; 2Time; 3Standard errors of differences of means; 4P-value represents the probability of a treatment effect; 5Linear effect; 6Quadratic effect; Samples were taken during the 3 d collection period
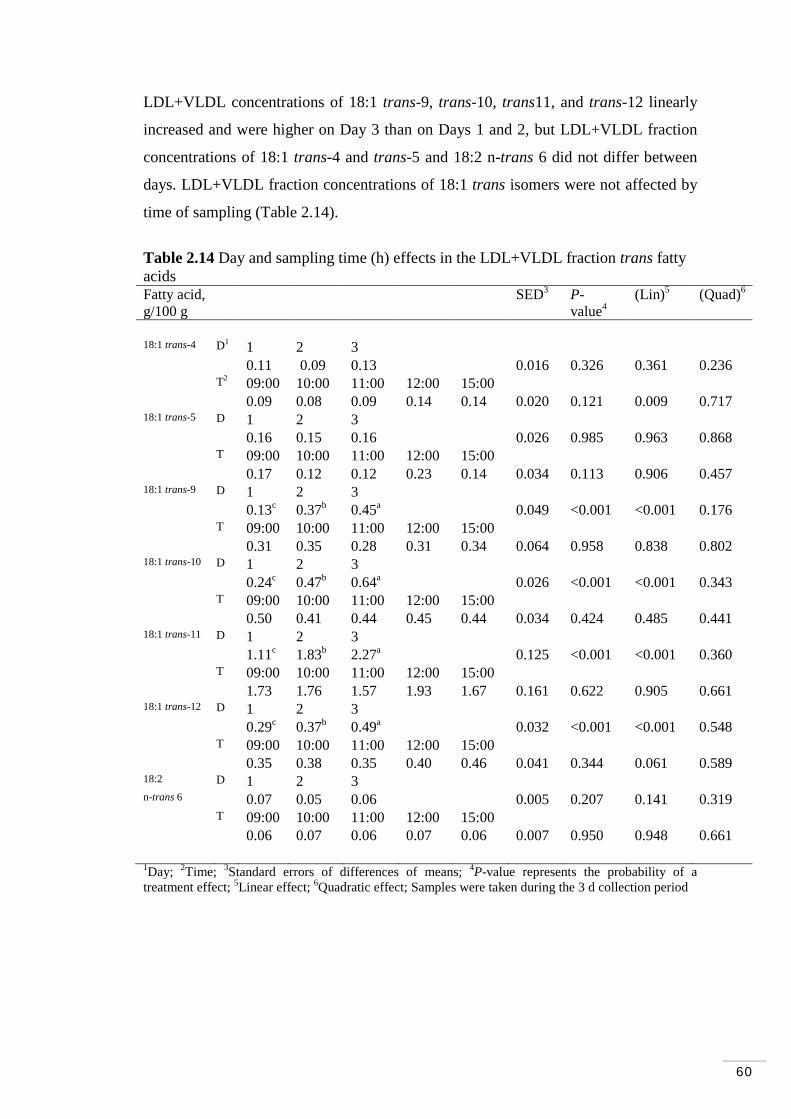
60
LDL+VLDL concentrations of 18:1 trans-9, trans-10, trans11, and trans-12 linearly
increased and were higher on Day 3 than on Days 1 and 2, but LDL+VLDL fraction
concentrations of 18:1 trans-4 and trans-5 and 18:2 n-trans 6 did not differ between
days. LDL+VLDL fraction concentrations of 18:1 trans isomers were not affected by
time of sampling (Table 2.14).
Table 2.14 Day and sampling time (h) effects in the LDL+VLDL fraction trans fatty acids Fatty acid, g/100 g
SED3 P-value4
(Lin)5 (Quad)6
18:1 trans-4 D1 1 2 3 0.11 0.09 0.13 0.016 0.326 0.361 0.236 T2 09:00 10:00 11:00 12:00 15:00 0.09 0.08 0.09 0.14 0.14 0.020 0.121 0.009 0.717 18:1 trans-5 D 1 2 3 0.16 0.15 0.16 0.026 0.985 0.963 0.868 T 09:00 10:00 11:00 12:00 15:00 0.17 0.12 0.12 0.23 0.14 0.034 0.113 0.906 0.457 18:1 trans-9 D 1 2 3 0.13c 0.37b 0.45a 0.049 <0.001 <0.001 0.176 T 09:00 10:00 11:00 12:00 15:00 0.31 0.35 0.28 0.31 0.34 0.064 0.958 0.838 0.802 18:1 trans-10 D 1 2 3 0.24c 0.47b 0.64a 0.026 <0.001 <0.001 0.343 T 09:00 10:00 11:00 12:00 15:00 0.50 0.41 0.44 0.45 0.44 0.034 0.424 0.485 0.441 18:1 trans-11 D 1 2 3 1.11c 1.83b 2.27a 0.125 <0.001 <0.001 0.360 T 09:00 10:00 11:00 12:00 15:00 1.73 1.76 1.57 1.93 1.67 0.161 0.622 0.905 0.661 18:1 trans-12 D 1 2 3 0.29c 0.37b 0.49a 0.032 <0.001 <0.001 0.548 T 09:00 10:00 11:00 12:00 15:00 0.35 0.38 0.35 0.40 0.46 0.041 0.344 0.061 0.589 18:2 D 1 2 3 n-trans 6 0.07 0.05 0.06 0.005 0.207 0.141 0.319 T 09:00 10:00 11:00 12:00 15:00 0.06 0.07 0.06 0.07 0.06 0.007 0.950 0.948 0.661 1Day; 2Time; 3Standard errors of differences of means; 4P-value represents the probability of a treatment effect; 5Linear effect; 6Quadratic effect; Samples were taken during the 3 d collection period

61
2.3.8 Diurnal and daily variations in ruminal fermentation parameters
Ruminal pH and NH3-N did not differ by between days. Ruminal pH linearly
decreased and was lower at 15:00 than at other times of day. Ruminal NH3-N had
quadratic effect and was greater at 12:00 than at other times of day. Total volatile FA
were not affected by day and time of sampling. Concentrations of acetate, propionate,
butyrate, valerate and isovalerate did not differ between days. Concentration of acetate
linearly decreased and was lower at 12:00 than at other times of day; molar
concentration of propionate linearly increased and was greater at 12:00 than at other
times of day; molar concentrations of butyrate and isovalerate had quadratic effect and
were greater at 10:00 than at other times of day, but molar concentration of valerate
was not affected by time of sampling (Table 2.15).
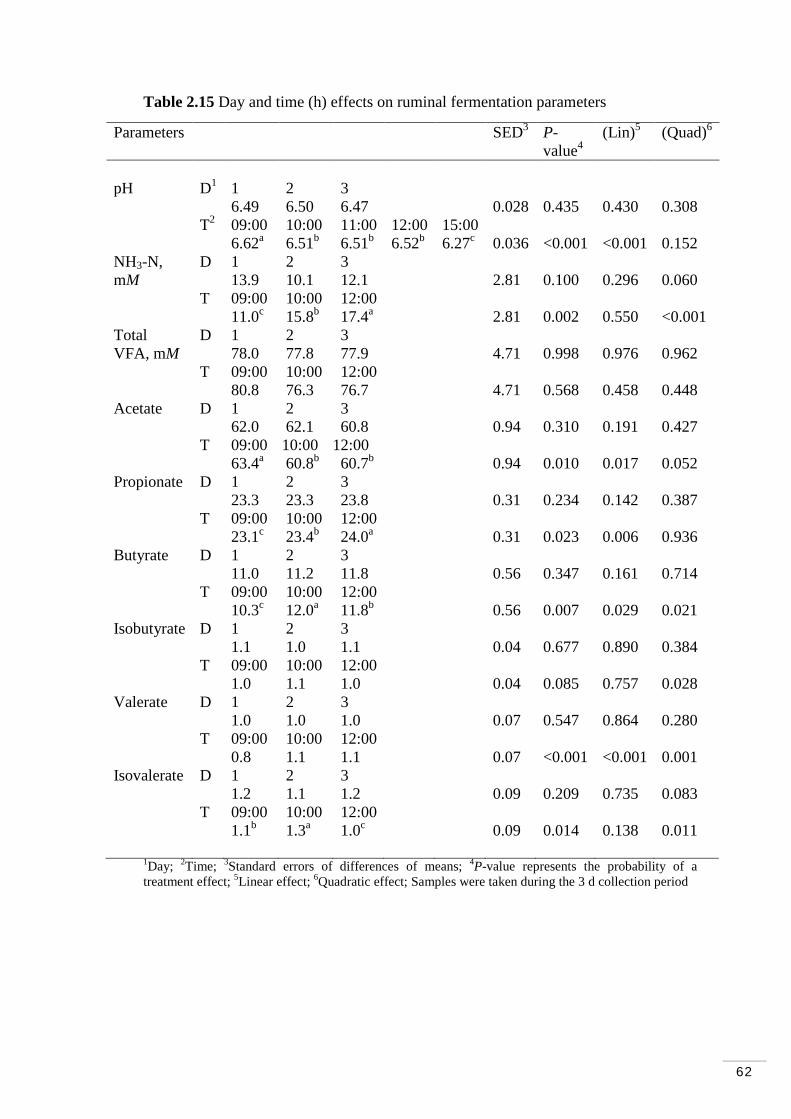
62
Table 2.15 Day and time (h) effects on ruminal fermentation parameters
1Day; 2Time; 3Standard errors of differences of means; 4P-value represents the probability of a treatment effect; 5Linear effect; 6Quadratic effect; Samples were taken during the 3 d collection period
Parameters SED3 P-value4
(Lin)5 (Quad)6
pH D1 1 2 3 6.49 6.50 6.47 0.028 0.435 0.430 0.308 T2 09:00 10:00 11:00 12:00 15:00 6.62a 6.51b 6.51b 6.52b 6.27c 0.036 <0.001 <0.001 0.152 NH3-N, D 1 2 3 mM 13.9 10.1 12.1 2.81 0.100 0.296 0.060 T 09:00 10:00 12:00 11.0c 15.8b 17.4a 2.81 0.002 0.550 <0.001 Total D 1 2 3 VFA, mM 78.0 77.8 77.9 4.71 0.998 0.976 0.962 T 09:00 10:00 12:00 80.8 76.3 76.7 4.71 0.568 0.458 0.448 Acetate D 1 2 3 62.0 62.1 60.8 0.94 0.310 0.191 0.427 T 09:00 10:00 12:00 63.4a 60.8b 60.7b 0.94 0.010 0.017 0.052 Propionate D 1 2 3 23.3 23.3 23.8 0.31 0.234 0.142 0.387 T 09:00 10:00 12:00 23.1c 23.4b 24.0a 0.31 0.023 0.006 0.936 Butyrate D 1 2 3 11.0 11.2 11.8 0.56 0.347 0.161 0.714 T 09:00 10:00 12:00 10.3c 12.0a 11.8b 0.56 0.007 0.029 0.021 Isobutyrate D 1 2 3 1.1 1.0 1.1 0.04 0.677 0.890 0.384 T 09:00 10:00 12:00 1.0 1.1 1.0 0.04 0.085 0.757 0.028 Valerate D 1 2 3 1.0 1.0 1.0 0.07 0.547 0.864 0.280 T 09:00 10:00 12:00 0.8 1.1 1.1 0.07 <0.001 <0.001 0.001 Isovalerate D 1 2 3 1.2 1.1 1.2 0.09 0.209 0.735 0.083 T 09:00 10:00 12:00 1.1b 1.3a 1.0c 0.09 0.014 0.138 0.011
63
2.4 Discussion
Overall, the results demonstrated that FA profile of plasma and lipoprotein fractions
reflected the dietary FA source; ruminal parameters were affected by oil pulses and
concentrations of tFA were different in plasma and both lipoprotein fractions.
LDL+VLDL fraction was the main fraction involved in transport of tFA.
The design of the experiment enabled examination of effects of different dietary lipids
on FA profiles of plasma and lipoprotein fractions. In the current experiment, 250 g/d
of SO or PHVO was ruminally pulsed accompanied by skimmed milk as a vehicle
(Loor and Herbein, 2001). The aim was to increase tFA supply to the duodenum either
as products of ruminal biohydrogenation (SO) or as preformed tFA (PHVO). The
ruminal pulse amounts were of a magnitude similar to those used in other studies
(Rogers et al., 1979; Ferlay and Doureau, 1992). Ferlay and Doreau (1992) compared
two treatments, one in which rapeseed oil was continuously infused into the rumen at
1000 g/d and another with a single administration of 250 g of rapeseed oil. However,
they did not use any emulsifier to permit a homogenised release of the oil. They
reported that the effects of lipid supplementation on ruminal digestion are less strong
with a continuous supply than with a single administration.
This experiment is the first to investigate concentrations of individual 18:1 tFA
isomers in lipoprotein fractions of bovine plasma. The current experiment differs from
previous research (Baumgard et al., 2002; Mosley et al., 2006; Tyburczy et al., 2008;
Lock et al., 2008) mainly in the use of oils rather than using individual FA (i.e. CLA
trans-10, cis-12; oleic acid, VA and EA), enriched oils (i.e. fish oil high in oleic acid;
Amorocho et al., 2009) and combination of oils (i.e. fish oil+sunflower oil; Cruz-
Hernandez et al., 2007; Belenguer et al., 2010) that might be absorbed and transported
differently to the mammary gland. Also, in this experiment, ruminal pulses were used,
whereas, previous studies (Loor and Herbein, 2001; Baumgard et al., 2002; Mosley et
al., 2006; Tyburczy et al., 2008) used abomasal infusion to study effects of dietary
lipids on plasma and lipoprotein fractions mainly because the authors aimed to avoid
ruminal biohydrogenation. Thus, differences in FA output in milk between abomasal
infusion and oral treatments can be attributed to ruminal metabolism and intestinal
bioavailability, or both (Castaneda-Gutierrez et al., 2007). The present experiment
also differs from studies (Chilliard et al., 1991, DePeters et al., 2001) that used
64
duodenal infusions to investigate effects of dietary oils on milk fatty acid profile. The
profile of FA absorbed in the duodenum can alter the FA profile of dairy and other
animal products, especially modifying FA saturation and CLA concentration
(Grummer, 1991; Mansbridge and Blake, 1997; Harvatine and Allen, 2006).
The use of PHVO as ruminal pulse is another difference between other studies
(Mosley et al., 2006; Tyburczy et al., 2008). Abomasal infusion of PHVO to dairy
cows’ results in milk fat depression and this has been attributed to the high levels of
18:1 trans isomers (Selner and Schultz, 1980; Gaynor et al., 1994; Romo et al., 1996).
PHVO also contains a Gaussian distribution of 18:1 trans isomers (approximately 40
to 60% of total FA), that undergo the hydrogenation process resulting in the formation
of several conjugated and other unique FA isomers that are present in PHVO, and
some of these could regulate milk fat synthesis (Lock et al., 2007; Bauman and
Griinari, 2003; Shingfield and Griinari, 2007; Tyburczy et al., 2008). The concentration of EA in PHVO was higher than that in SO because EA is the
major trans isomer found in PHVO (Meijer et al., 2001). On the other hand, while VA
was not detectable in SO, after biohydrogenation high concentrations of VA were
found in plasma and lipoprotein fractions following SO treatment. This is consistent
with observations that inclusion of vegetable oils high in PUFA into concentrate diets
raises VA and 18:2 cis-9, trans-11 content in milk fat (Bauman et al., 2000; Shingfield
et al., 2006). Other studies have shown that diets with a higher forage-to-concentrate
ratio of 60:40 (Bell et al., 2006) or 73:27 (Roy et al., 2006) and containing safflower
oil (6%) or linseed oil (5%), respectively, also increased high levels of VA in milk.
AbuGhazaleh et al. (2002) examined the effect of feeding fish oil, extruded soya
beans, or their blend on the milk fat concentration of CLA cis-9, trans-11 and found
that the concentration of VA in milk fat was increased 129% by the fish oil diet
compared with the control diet, despite the fact that fish oil had low concentration (<
3%) of both linoleic and linolenic acids, the precursors of VA produced by ruminal
biohydrogenation. Milk VA concentration was also increased by 136% when extruded
soya beans were fed, compared with the control diet. In the current experiment,
linoleic acid and oleic acid were higher in the SO treatment; however, linoleic acid
has been shown to be more effective than oleic acid in promoting high VA
65
concentrations in the milk (AbuGhazaleh et al., 2003) and in the rumen (AbuGhazaleh
et al., 2003, 2005, 2007).
CLA 18:2 cis-9, trans-11 was detected in skimmed milk (control) but not in SO nor
PHVO. It is known that food products from ruminants, particularly dairy products, are
the major dietary source of CLA for humans. Griinari et al., (1998) demonstrated that
cows can synthesize CLA from VA. The major CLA isomer in food products from
ruminants is 18:2 cis-9, trans-11, although other CLA isomers are present and these
may vary under different rumen conditions (Griinari et al. 1997). CLA levels in food
products derived from ruminants can be altered by affecting ruminal production of
CLA or VA, or by dietary supplement with these fatty acids (Chouinard et al., 1999).
Usually, supplementing cows with hydrogenated vegetable oils can decrease milk fat
content due to their high content of 18:1 trans isomers and could raise the
concentration of blood cholesterol. Selner and Schultz (1980) found that dairy cows
supplemented with hydrogenated vegetable oil containing 13% tFA at 454 g per cow
per day decreased slightly milk fat concentration and elevated plasma cholesterol from
190 to 245 mg/100 ml and 18:1 tFA in milk fat from 4.2 to 6.2 g/100g. Hydrogenated
vegetable oil containing 49% 18:1 tFA fed at 454 g/d decreased milk fat concentration
from 3.9 to 3.1%. Short chain FA in milk fat triglycerides decreased and there were
increases in 18:1 trans isomers (from 2.6 to 11.2 g/100g), 18:1 cis (from 22.9 to 29.0
g/100g), and 18:2 trans (from 0.2 to 1.8 g/100g). In milk phospholipids 18:1 trans
isomers increased from 0.3 to 3.1 g/100g in and 18:1 cis isomers increased from 20.5
to 31.4 g/100g. Blood cholesterol esters were increased from 152 to 195 mg/100 ml.
In the current experiment, SO contained high concentrations of UFA and PUFA. If
dairy cows were fed with this oil, it could reduce milk fat yield and inhibit de novo FA
synthesis and FA desaturation, although, in some experiments, oil supplementation
has the potential to overcome reductions in de novo synthesis caused by PUFA found
in vegetable oils (Loor et al., 2002). The origin of short-chain (4:0 to 8:0) and
medium-chain FA (10:0 to 14:0) in ruminant milk fat is from de novo synthesis, while
long-chain FA (> C:18) are derived from precursors in the blood (Bauman and
Griinari, 2003). Storry (1972) proposed that long-chain FA taken up by the mammary
gland inhibit de novo synthesis of short- and medium-chain FA, which was supported
66
by work with rats and humans (Barber et al., 1997). Neville and Picciano (1997)
discussed and summarized studies to support the concept that FA play an integral role
in regulating de novo FA synthesis in the lactating mammary gland, probably via
actions on acetyl-CoA carboxylase (Carroll et al., 2006).
Likewise, Hervas et al. (2008) reported that dietary supplementation with sunflower
oil led to an increase in 18:0 and 18:1 isomers in milk of dairy ewes. That response
had been reported previously (Chilliard and Ferlay, 2004) in milk from cows and
goats and has been also observed in milk fat from ewes supplemented with SO (Mele
et al., 2006; Gomez-Cortes et al., 2008). In the current experiment, the increased of
18:1 trans isomers found in plasma and lipoprotein fractions following SO pulse can
be attributed to a shift in the biohydrogenation pathways, due to alterations in the
rumen environmental conditions as a results of the ruminal pulsing.
Kadegowda et al. (2008) found that dry matter intake was affected by abomasal
infusion of highly UFA and to a less extend saturated LCFA. Their infusion mixtures
contained both SFA and UFA and the maximum amount of FA infused was limited to
400 g/d to avoid possible adverse effects on dry matter intake.
2.4.1 Fatty acid composition of plasma and lipoprotein fractions
The main hypothesis of this experiment was that concentrations of 18:1 tFA in plasma
and lipoprotein fractions would be influenced by type of lipid pulsed. This hypothesis
was supported by the differences in concentrations of 18:1 tFA in plasma and
lipoprotein fractions observed between SO and PHVO.
With a single administration, concentrations of treatments are higher during the first
few hours after pulse and lower in subsequent hours. Generally, sampling day had
linear effect on 18:1 trans isomers in plasma, HDL and LDL+VLDL. Normally,
dietary lipids cause a decreased in ruminal degradation (Ferlay and Doreau, 1992). In
this study, effects of treatments on tFA profile of plasma and lipoprotein fractions
were observed within the first three hours post pulse. Sampling day affected tFA of
plasma and lipoprotein fractions. The diurnal variation of tFA in the plasma and
cholesterol fractions found in this study may indicate that fluctuations vary according
to metabolic status (preprandial and postprandial status) (Diven et al., 1958). The

67
amounts and composition of lipids circulating in the blood of dairy cattle are
dependent upon a number of physiological variables. The nature of the diet, time since
feeding, age, breed, pregnancy, and stage of lactation may all affect lipid content and
composition (Christie, 1981). In this study, diurnal variations of plasma, lipoprotein
fractions and ruminal fermentation parameters and showed that there may be an
adaptation of ruminal microflora to the treatments and also reflected a cycle control
mechanism balancing rate of lipid entry and rate of removal in the circulatory system.
This is possibly related to regulation of lipid supply (diet, production, synthesis) and
utilization by peripheral tissues (Bitman et al., 1990).
Differences in tFA concentrations due to type of oil infused led to major changes in
the profiles of most 18:1 trans isomers in plasma and lipoprotein fractions, in
agreement with observations in plasma by Loor and Herbein (2001) in which ruminal
infusions of CLA mixtures were used. In the current experiment, SO treatment was
higher in 18:1 cis-9 and 18:2 n-cis 6. Previous in vivo and in vitro observations
indicated that ruminal biohydrogenation of 18:1 cis-9 and 18:2 n-6 give rise to
geometrical isomers of 18:1 with double bonds at positions 6 to 16 of the carbon chain
(Bickerstaffe et al., 1972; Kemp et al., 1975; Loor et al., 2002). Ruminal isomerisation
of oleic acid is also associated with production of several 18:1 trans isomers but
primarily 18:1 trans-6, 7, 8, 18:1 trans-9, and 18:1 trans-10 (Loor et al., 2002; Mosley
et al., 2002). Under normal conditions, however, VA is by far the predominant 18:1
trans isomer, resulting from hydrogenation of 18:2n-6 in the rumen (Loor et al., 2002).
In the current experiment, SO treatment was higher in 18:0 which availability for
endogenous 18:1 cis-9 production is crucial for milk fat synthesis (Donovan et al.,
2000; Chilliard et al., 2003; Loor et al., 2005).
There are several possible processes for production of 18:1 trans isomers from 18:1
cis-9. One could be that the rumen bacteria possess a multitude of cis / trans
isomerases. It is accepted that there is an isomerase that converts the cis- 12 bond of
linoleic and linolenic acids to a trans-11 bond. Another possibility could be that the
18:1 trans isomers are formed as a result of simple chemical double bond migration
(Griinari and Bauman, 1999). Ward et al. (1964) suggested that the accumulation of
trans monoenes from biohydrogenation of 14C-labeled linoleic acid was due to double
bond migration. This conclusion was based on the observation that the chemical
hydrogenation of linoleic acid with a metal catalyst resulted in migration of the double
68
bond and formation of tFA. However, enzymatic and metal catalyzed hydrogenations
are not parallel processes (Mosley et al., 2002).
Compared with HDL fraction, concentrations of tFA were increased almost 3-fold in
LDL+VLDL fraction. These results may indicate which lipoprotein fraction is
involved in the transportation of tFA. The increase in trans isomers across plasma and
lipoprotein fractions with SO and PHVO reflects modification of rumen microbial
population and pathways of biohydrogenation usually caused by supplementation with
dietary PUFA. Those changes promote formation and accumulation of
biohydrogenation intermediates, some of which are potent inhibitors of milk fat
synthesis (Bauman and Griinari, 2003).
VA was significantly higher following ruminal pulse of SO compared with control
and PHVO in plasma and lipoprotein fractions. EA was significantly higher following
ruminal pulse of PHVO compared with control and SO treatments in plasma and
lipoprotein fractions. This result is in agreement with observations in lipoprotein
fractions by Meijer et al. (2001) in which EA and VA were supplemented in the diet
of hamsters. In the current experiment, concentrations of tFA in plasma and
lipoprotein fractions were significantly higher following ruminal pulse of SO
compared with control and PHVO. This effect may be explained by the composition
of the oils where SO had lower concentrations of VA and EA and the interaction
effects of ruminal biohydrogenation.
In the current experiment CLA 18:2 cis-9, trans-11 was too low to be detected in the
HDL fraction, however, 18:2 cis-9, trans-11 was identified in plasma and
LDL+VLDL but no difference was observed between control and treatments. The
most predominant CLA isomer found in foods of ruminant origin is 18:2 cis-9, trans-
11. This CLA isomer is an intermediate in ruminal biohydrogenation of linoleic acid
(Corl et al., 2002).
2.4.2 Fatty acid composition of the lipoprotein lipids
Ruminant plasma lipoprotein fractions are characterized by low concentrations of
chylomicrons, VLDL and total TG, whereas more than 90% of plasma lipids are
carried by HDL, mainly in the CE and PL lipid sub groups (Offer et al., 2001). In the
current experiment concentrations of LDL+VLDL-TG appeared to be the major lipid
69
subgroups carrying plasma lipids. Because the LDL fraction contains
chylomicrons/VLDL fractions, it is possible that TG found in the LDL fraction are
associated with chylomicrons which contain dietary TG.
In the current experiment, palmitic acid was increased in LDL+VLDL-TG compared
with HDL. Palmitic acid is an important FA for the synthesis of triacylglycerol in the
mammary gland (Hansen and Knudsen, 1987). Initiation of acylation of the sn-1
position is a prerequisite for triacylglycerols synthesis, and palmitic acid is the most
preferred substrate for the initial acylation of L-α glycerolphosphate by
acyltransferase to form sn-1-lysophosphatidic acid (Kinsella and Gross, 1973). It has
been shown (Kinsella and Gross, 1973) that myristyl, stearyl, and oleyl coenzyme-A
were rapidly acylated when sn-1-lysophosphatidic acid was used as a substrate, but
were poorly acylated without the latter indicating that these FA are taken up mostly in
the second step of triacylglycerol synthesis (Kadegowda et al., 2008).
To study the transport of FA in bovine plasma, Offer et al. (2001) fed cows with
dietary fish oil finding progressive milk depression from those cows supplemented
with fish oil. They separated HDL, LDL and VLDL fractions and found that total
lipids in the VLDL fraction were increased, although this did not reach statistical
significance. The current experiment is different from Offer et al. (2001) because they
used lactating cows, stage of lactation has an important effect on FA utilization
needed to satisfy specific energy requirements and this may be reflected in the FA
profile of lipoprotein lipid subgroups found in our experiment (non-lactating cows).
Also, the current experiment involved release of treatments as ruminal pulses rather
than supplementing oils in the diet. Despite the fact that the results are different from
those of Offer et al. (2001), in the current experiment TG had the larger content of FA
than CE and PL. That has implications for the theory that the ruminant mammary
gland obtains FA required for assembly of milk lipids by the action of mammary
lipoprotein lipase on the TG fraction of chylomicrons and VLDL.
The difference between abomasal and ruminal pulses is probably another factor that
may explain the variation in the concentrations of certain FA within each lipid sub
group (Ashes et al., 2000; Offer et al., 2001). For example, DePeters et al. (2001)
attributed changes in carbon number for TG structure to high concentrations of LCFA
70
and medium chain FA associated with canola oil infused either in the rumen or
abomasum.
In this experiment, PHVO pulse tended to increased VA in LDL+VLDL-TG, however,
it did not reach significance. Because the mammary gland extracts FA primarily from
TG fractions of plasma, FA in these LDL+VLDL lipid subgroups may possibly be
available for milk synthesis in cows supplemented with PHVO. Increased in VA in
LDL+VLDL-TG by PHVO might also be explained by the fact that concentrations of
dietary or ruminally derived fatty acids in the major plasma lipid fractions are directly
proportional to the amounts of fatty acids absorbed from the small intestine (Loor et
al., 2002).
2.4.3 Ruminal fermentation
Sampling time had linear effect and decreased ruminal pH and acetate and linearly
increased propionate. On the other hand, sampling time had quadratic effect on NH3-N,
butyrate, isobutyrate, valerate and isovalerate. Those changes may indicate that
dietary lipids had an impact on ruminal microflora affecting fermentation parameters.
Dietary oil supplementation has been shown to affect ruminal fermentation in
ruminants (Harfoot & Hazelwood, 1997). Yang et al. (2009) found that
supplementation of soybean and linseed oils reduced the concentration of total VFA
and increased ruminal NH3-N. Relatively few data exist relating to the effects of
PHVO or SO on ruminal fermentation. In the current experiment, ruminal pulses of
both SO and PHVO had quadratic effect on ruminal NH3-N and total VFA
concentrations, which suggests that dietary lipids inhibited microbial activity. Cieslak
et al. (2009); supplemented linoleic acid on two rumen ciliate cultures (Entodinium
caudatum and Diploplastron affine) and reported a decreased in the concentration of
ruminal NH3-N and no effects on total VFA concentration, methane production or
concentration of acetate and butyrate in the Diploplastron affine culture. On the other
hand, NH3-N was reduced in the Entodinium caudatum culture. Likewise, Hervas et al.
(2008) found no difference in VFA and NH3-N in an in vitro study in which sunflower
oil was incubated with ruminal fluid from dairy ewes.
In agreement with the current experiment, Ivan et al. (2001) reported that NH3-N and
total VFA concentrations were reduced in ruminal fluid of sheep supplemented with
dietary sunflower seed oil compared with an unsupplemented diet. In the current

71
experiment, ruminal pulses of PHVO and SO affected VFA concentrations. It has
been shown that dietary oils rich in saturated and unsaturated FA may reduce the
number of ruminal protozoa both in vivo and in vitro, moreover, unsaturated C18 FA
exert toxic effects on protozoan populations.
Defaunation is known to decrease ruminal NH3-N which is related to decreased N
recycling between bacteria, protozoa and ammonia pools resulting from engulfment
and digestion of bacteria by protozoa. Another reason for the reduction of ruminal
NH3-N is that there is an increase in demand for ammonia by ruminal bacteria that use
it as substrate for cell synthesis (Dayani et al., 2007).
Possibly a ruminal ecology (i.e., ruminal bacteria, fungi and protozoa) study would be
a promising approach to truly understand how 18:1 trans isomers affect ruminal
fermentation and bacterial populations.
2.5 Conclusion
The results of this experiment demonstrated that 18:1 tFA concentrations of plasma
and lipoprotein fractions can be changed by altering dietary lipids. LDL+VLDL
appears to be the main lipoprotein fraction involved in transportation of 18:1 trans
isomers in bovine plasma. Overall, the current experiment demonstrates that dietary
lipids rich in either PUFA or tFA can alter the rumen environment, and that both types
of FA result in increased plasma and lipoprotein-fraction concentrations of tFA. The
results therefore show how plasma FA profiles change when supplementary oils do
not bypass the rumen and hence the lipids had extensive effects on rumen
microorganisms, as indicated by concentrations of total VFA and ruminal NH3-N, and
on the biohydrogenation process, as indicated by plasma and lipoprotein 18:1 trans
isomers. Treatment effects are, therefore, in agreement with expectations from dietary
supplementation of oils, but are independent of any effects of oil on palatability and
feed intake data.
2.6 Implications
Although the results from this experiment suggests that the LDL+VLDL fraction is
more responsive to supply of tFA and responsible for the transport of CLA isomers,
further fractionation is required to distinguish between true LDL-fraction,
chylomicrons and VLDL that are also present in this fraction.

72
In the current experiment concentrations of tFA were increased in both LDL+VLDL
and HDL fractions suggesting that feeding cows with oils rich in UFA and tFA might
produce milk with high concentrations of FA undesirable for human consumption and
reduce intake of digestible energy (Harvatine and Allen, 2006), milk fat content and
yield compared with typical diets (Griinari et al., 1998; Piperova et al., 2000; Peterson
et al., 2003; Loor et al., 2005). On the other hand, recently, Brouwer et al. (2010)
reported that all FA with a double bond in the trans configuration raise the ratio of
plasma LDL to HDL regardless of FA origin (tFA industrially produced or from
biohydrogenation in the rumen). However, findings from this experiment, shows that
altering the supply of tFA from the rumen modifies the tFA content of LDL+VLDL
fraction much more than HDL fraction. Thus if it were to alter tFA delivery to the
mammary gland it is likely that it is through this fraction.
Results from tFA content in plasma and lipoprotein fractions demonstrated that there
are clear differences in their plasma transport that may exert an effect on mammary
uptake and utilization of 18-carbon FA, and these results might be related to the
location, orientation, and number of double bonds (Tyburczy et al., 2008).

73
C h a p t e r 3
Ruminal pulses of fatty acids in dairy cows: 2. Fish oil and partially hydrogenated vegetable oil
74
CHAPTER 3
3. Ruminal pulses of fatty acids in dairy cows: 2. Fish oil and partially hydrogenated vegetable oil 3.1 Introduction
Recently, nutritional recommendations for humans have emphasized the need to
decrease intake of SFA and increase intakes of beneficial PUFA, in particular α-
linolenic acid (18:3 n-3) and the LC-PUFA (20:5 n-3 and 22:6 n-3), in the diet (Lee et
al., 2008). Ruminant products make an important contribution to the human diet but
have caused concern due to their high SFA content. This is largely due to microbial
biohydrogenation of dietary unsaturated fatty acids in the rumen, although some
intermediates of biohydrogenation such as conjugated linolenic acid (CLA cis-9,
trans-11) and 18:1 trans-11 (VA) could be important in human health (Lock and
Bauman, 2004).
It has been shown that fish oil (FO) either alone or in combination with vegetable oils
results in increased concentrations of trans fatty acids (tFA) and CLA in duodenal
fluid and milk fat tFA and CLA are intermediates in the rumen hydrogenation of
PUFA (Lock and Bauman, 2004; Kim et al., 2008). Moreover, inclusion of fish oil in
lactating cow diets has been shown to increase CLA, VA and omega-3 fatty acids in
milk fat (Abu-Ghazaleh et al., 2002). Fish oil has also been shown to interrupt the
complete biohydrogenation of C18 PUFA, resulting in increased production of VA,
the precursor for CLA (cis-9, trans-11) in the mammary gland (Piperova et al., 2002).
The experiment reported in Chapter 2 demonstrated that pulses of partially
hydrogenated vegetable oils (PHVO) or soya oil increased the tFA content of both
HDL and LDL lipoprotein fractions, but responses varied according to fatty acid
source. Because FO contains higher concentrations of long chain PUFA, compared
with vegetable oils (Duckett and Gillis, 2010), it is hypothesized that differences in
FA concentrations would be observed, particularly in C18:1 trans isomers and 18:2
cis-9, trans-11, which would lead to differences in tFA concentrations of plasma and
lipoprotein fractions.
The objective of this experiment was to determine the effects of pulsing FO either
alone or in combination with PHVO on plasma FA composition and to determine
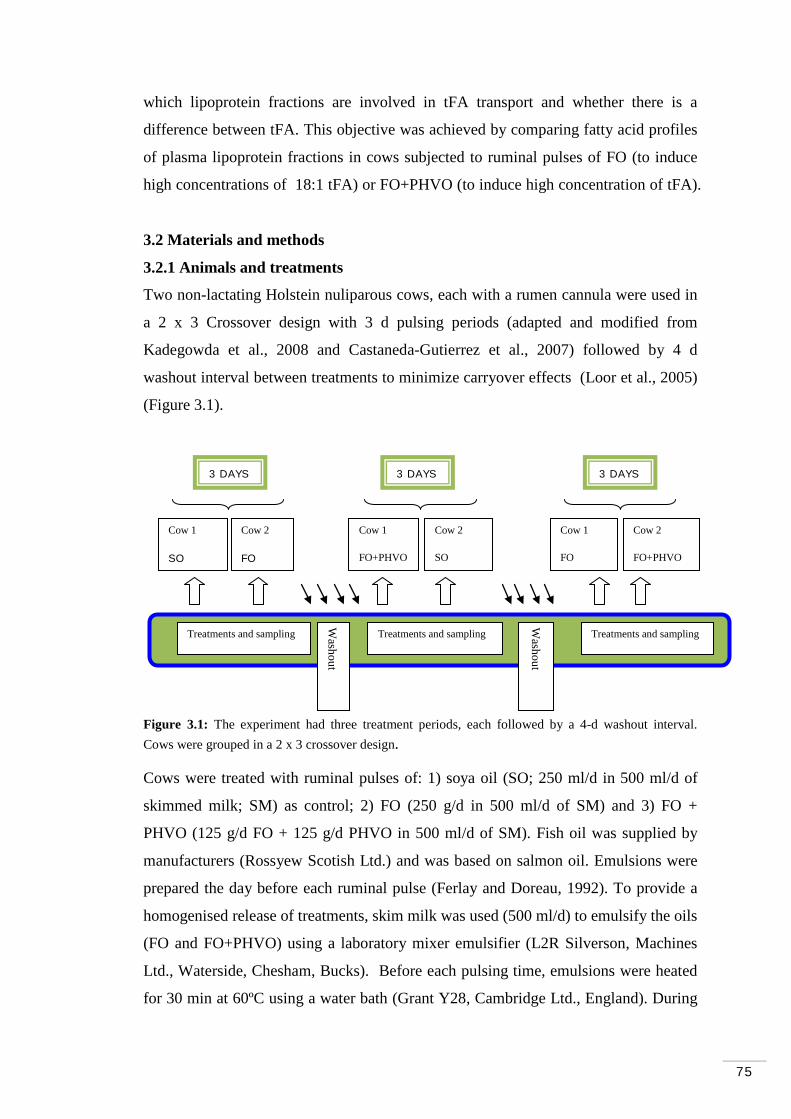
75
which lipoprotein fractions are involved in tFA transport and whether there is a
difference between tFA. This objective was achieved by comparing fatty acid profiles
of plasma lipoprotein fractions in cows subjected to ruminal pulses of FO (to induce
high concentrations of 18:1 tFA) or FO+PHVO (to induce high concentration of tFA).
3.2 Materials and methods
3.2.1 Animals and treatments
Two non-lactating Holstein nuliparous cows, each with a rumen cannula were used in
a 2 x 3 Crossover design with 3 d pulsing periods (adapted and modified from
Kadegowda et al., 2008 and Castaneda-Gutierrez et al., 2007) followed by 4 d
washout interval between treatments to minimize carryover effects (Loor et al., 2005)
(Figure 3.1).
Figure 3.1: The experiment had three treatment periods, each followed by a 4-d washout interval. Cows were grouped in a 2 x 3 crossover design.
Cows were treated with ruminal pulses of: 1) soya oil (SO; 250 ml/d in 500 ml/d of
skimmed milk; SM) as control; 2) FO (250 g/d in 500 ml/d of SM) and 3) FO +
PHVO (125 g/d FO + 125 g/d PHVO in 500 ml/d of SM). Fish oil was supplied by
manufacturers (Rossyew Scotish Ltd.) and was based on salmon oil. Emulsions were
prepared the day before each ruminal pulse (Ferlay and Doreau, 1992). To provide a
homogenised release of treatments, skim milk was used (500 ml/d) to emulsify the oils
(FO and FO+PHVO) using a laboratory mixer emulsifier (L2R Silverson, Machines
Ltd., Waterside, Chesham, Bucks). Before each pulsing time, emulsions were heated
for 30 min at 60ºC using a water bath (Grant Y28, Cambridge Ltd., England). During
Washout
Washout
Treatments and sampling Treatments and sampling
Treatments and sampling
Cow 1
SO
Cow 2
FO
Cow 1
FO+PHVO
Cow 2
SO
Cow 1
FO
Cow 2
FO+PHVO
3 DAYS 3 DAYS 3 DAYS
76
pulsing and sampling periods, cows were housed in tie stalls and had free access to
water. Cows were fed a maintenance diet which comprised meadow hay (ad libitum)
and a concentrate based on barley (25-40 g/kg), sugar beet pulp (8 g/kg) and wheat (8
g/kg) and cane molasses (<5 g/kg), limestone flour (<5 g/kg), vitamins (<5 g/kg) and
minerals (<5 g/kg) [1-2 kg/day at 12:00; Manor Farm Feeds (Owston) Ltd., Oakham].
3.2.2 Sampling, measurements and analyses
Samples of ruminal fluid (50 ml) were collected from various parts of the rumen using
a syringe screwed to a stainless tube. Ruminal fluid samples were collected prior to
pulses (0 h) and at 1, and 3 h post pulsing during the 3 d collection periods.
Immediately after fluid collection, 10 ml of ruminal fluid were used to determine pH
by using a pH meter (Piccolo Plus, HI 1295, Hanna Instruments, Portugal). Samples
were frozen (-20ºC) for later analysis. See Chapter 2 for ruminal VFA and NH3-N
sample preparation and calculations.
Blood samples (20 ml) were obtained via jugular catheter prior to the pulse (0 h), 1,
and 3 h after pulse during the last day of each collection period for lipoprotein
fractionation. Blood was transferred to tubes containing EDTA and immediately
centrifuged for 10 min at 3,000 x g (Centaur 2 MSE, Milton Keynes, England) for
harvesting plasma. Plasma samples for lipoprotein fractionation were obtained during
the last day of each collection period. Plasma was ultracentrifuged at 39,000 x g for
16h at a density of 1.006 g/ml (to remove VLDL fraction) and 20 h at a density of
1.063 g/ml (to separate LDL and HDL fractions) at 12ºC using a Beckman XL-70
ultracentrifuge. Another 20 ml plasma sample were collected and stored at -20ºC for
analysis of FA profile. See Chapter 2 for more details on the sequential separation of
lipoprotein fractions. Concentrations of lipoprotein fractions in plasma (LDL and
HDL fractions) were determined using a Clinical Chemistry Autoanalyzer (Rx Imola;
Randox Laboratories, Ltd.).
Lipids from plasma, HDL, LDL, and VLDL fractions were extracted by adaptation of
the method by Bligh and Dyer (1959) and methylated according to the method of
Christie (1982) with modifications by Chouinard et al. (1999). For more details see
Chapter 2. The lipid classes (triacylglycerol, phospholipid, and cholesteryl ester) of
the lipoprotein fractions were isolated by thin layer chromatography, and their
77
constituent FA were analysed by capillary column GC as described previously for
plasma and lipoprotein fractions. See Chapter 2 for methodology of TLC.
3.2.3. Statistical analysis
Using the GenStat 12th statistical package (VSN International Ltd., Oxford), data were
analyzed as a 2 x 3 crossover design with fixed effects of treatments, periods and
sampling times; cow was included as a random effect to allow for repeated measures.
Fatty acid composition of lipid subgroups within lipoproteins was analysed using a
Factorial design based on treatments (3), fractions (3) and lipids (3). Diurnal
variations were analysed as Factorial design using POLYANOVA based on days (3)
and sampling times (3). Data are reported as least square mean ± SED.
3.3 Results
3.3.1 Treatment composition
The FO/PHVO+SM blend contained higher concentrations of saturated (19 g/100g),
MUFA (43 g/100g), UFA (MUFA+PUFA) (48 g/100g) and trans (19 g/100g) fatty
acids and lower concentrations of polyunsaturated (5 g/100g) and long chain (8
g/100g) fatty acids than FO+SM. Concentrations of VA (3 g/100g) and EA (9 g/100g)
were higher in FO/PHVO+SM compared with FO+SM (Table 3.1).
3.3.2 Ruminal fermentation parameters
There was no difference between treatments in ruminal NH3-N and total VFA
concentrations. Compared with control, FO and FO+PHVO resulted in higher
concentrations of propionate (Table 3.2).
3.3.3 Plasma samples and treatment effect
Compared with control, all treatments resulted in lower concentration of SFA in
plasma. Compared with control and FO, FO+PHVO resulted in higher concentrations
of SFA in VLDL fraction; higher concentrations of MUFA in plasma and lipoprotein
fractions; higher concentrations of UFA in plasma, LDL and VLDL fractions; and
higher concentrations of tFA in plasma and VLDL fraction. Compared with control
and FO+PHVO, FO resulted in higher concentrations of PUFA in plasma and higher
concentrations of LCFA in plasma, HDL and VLDL fractions (Table 3.3).

78
Treatment significantly affected concentrations of some 18:1 trans isomers in plasma.
Compared with control and FO, FO+PHVO resulted in higher concentrations of 18:1
trans 5, trans 6-8, trans 9, trans 10, trans 11, trans 12, cis 9, trans 15 and 18:2n trans
6 (Table 3.4).
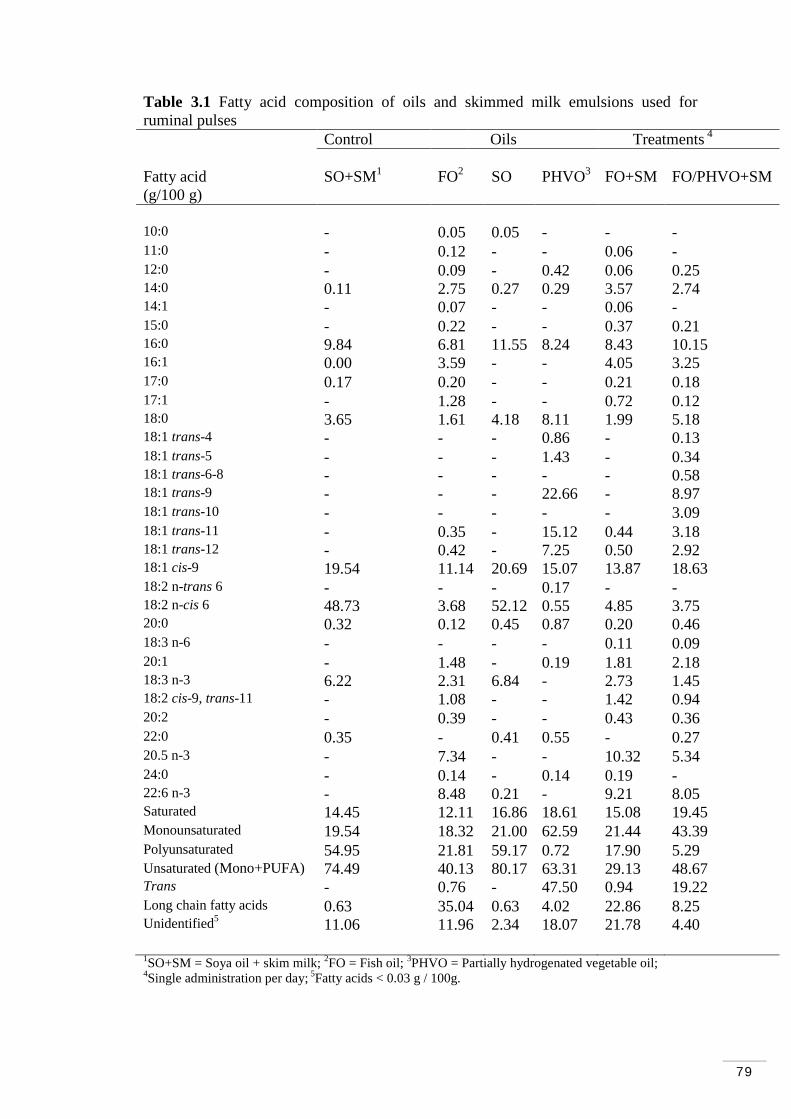
79
Table 3.1 Fatty acid composition of oils and skimmed milk emulsions used for ruminal pulses Control Oils Treatments 4
Fatty acid (g/100 g)
SO+SM1 FO2 SO PHVO3 FO+SM FO/PHVO+SM
10:0 - 0.05 0.05 - - - 11:0 - 0.12 - - 0.06 - 12:0 - 0.09 - 0.42 0.06 0.25 14:0 0.11 2.75 0.27 0.29 3.57 2.74 14:1 - 0.07 - - 0.06 - 15:0 - 0.22 - - 0.37 0.21 16:0 9.84 6.81 11.55 8.24 8.43 10.15 16:1 0.00 3.59 - - 4.05 3.25 17:0 0.17 0.20 - - 0.21 0.18 17:1 - 1.28 - - 0.72 0.12 18:0 3.65 1.61 4.18 8.11 1.99 5.18 18:1 trans-4 - - - 0.86 - 0.13 18:1 trans-5 - - - 1.43 - 0.34 18:1 trans-6-8 - - - - - 0.58 18:1 trans-9 - - - 22.66 - 8.97 18:1 trans-10 - - - - - 3.09 18:1 trans-11 - 0.35 - 15.12 0.44 3.18 18:1 trans-12 - 0.42 - 7.25 0.50 2.92 18:1 cis-9 19.54 11.14 20.69 15.07 13.87 18.63 18:2 n-trans 6 - - - 0.17 - - 18:2 n-cis 6 48.73 3.68 52.12 0.55 4.85 3.75 20:0 0.32 0.12 0.45 0.87 0.20 0.46 18:3 n-6 - - - - 0.11 0.09 20:1 - 1.48 - 0.19 1.81 2.18 18:3 n-3 6.22 2.31 6.84 - 2.73 1.45 18:2 cis-9, trans-11 - 1.08 - - 1.42 0.94 20:2 - 0.39 - - 0.43 0.36 22:0 0.35 - 0.41 0.55 - 0.27 20.5 n-3 - 7.34 - - 10.32 5.34 24:0 - 0.14 - 0.14 0.19 - 22:6 n-3 - 8.48 0.21 - 9.21 8.05 Saturated 14.45 12.11 16.86 18.61 15.08 19.45 Monounsaturated 19.54 18.32 21.00 62.59 21.44 43.39 Polyunsaturated 54.95 21.81 59.17 0.72 17.90 5.29 Unsaturated (Mono+PUFA) 74.49 40.13 80.17 63.31 29.13 48.67 Trans - 0.76 - 47.50 0.94 19.22 Long chain fatty acids 0.63 35.04 0.63 4.02 22.86 8.25 Unidentified5 11.06 11.96 2.34 18.07 21.78 4.40 1SO+SM = Soya oil + skim milk; 2FO = Fish oil; 3PHVO = Partially hydrogenated vegetable oil; 4Single administration per day; 5Fatty acids < 0.03 g / 100g.

80
Table 3.2 Effects of treatments on ruminal fermentation parameters Control Treatments6 Parameters SO1 FO2 FO/PHVO3 SED4 P-value5
pH 6.3b 6.5a 6.3b 0.05 0.002 NH3-N, mM 19 12 14 2.8 0.074 VFA, mM 84 81 73 9.4 0.508 Acetate 66 65 65 1.0 0.250 Propionate 29.3b 30.8a 31.6a 0.54 <0.001 Butyrate 16.3 17.3 16.3 0.56 0.117 Isobutyrate 1.7 1.8 1.8 0.08 0.545 Valerate 1.6 1.7 1.5 0.14 0.507 Isovalerate 2.3 2.5 2.2 0.17 0.173 1SO = Soya oil; 2FO = Fish oil; 3PHVO = Partially hydrogenated vegetable oil; 4Standard errors of differences of means; 5P-value represents the probability of a treatment effect; 6Single administration per day; a,b,c Means in the same row with different superscripts are different (P<0.05).

81
Table 3.3 Treatment effects on major fatty acid classes in plasma and lipoprotein fractions Control Treatments6 Fatty acid, g/100 g Fraction SO1 FO2 FO/PHVO3 SED4 P-value5
Saturated Plasma 40.6a 37.6b 38.2b 0.61 <0.001 HDL 38.5 36.7 37. 3.10 0.839 LDL 46.6 35.9 37.3 6.82 0.287 VLDL 44.4a 40.0b 44.6a 1.41 0.020 Monounsaturated Plasma 20.8a 19.4b 24.7a 0.83 <0.001 HDL 23.8b 20.7c 26.5a 0.75 <0.001 LDL 16.2b 8.2c 21.1a 2.04 <0.001 VLDL 17.4c 22.4b 26.8a 1.24 <0.001 Polyunsaturated Plasma 24.2b 27.2a 23.9b 0.74 <0.001 HDL 24.5 26.7 24.0 1.56 0.247 LDL 14.4 10.2 12.4 2.96 0.416 VLDL 11.5 14.5 11.5 1.50 0.141 Unsaturated Plasma 45.1b 46.6b 48.6a 0.77 <0.001 (Mono+PUFA) HDL 48.3 47.4 50.5 1.16 0.067 LDL 30.7a 18.5b 33.5a 3.58 0.007 VLDL 29.0b 36.9a 38.4a 2.32 0.008 Trans Plasma 3.5b 3.8b 4.9a 0.57 0.046 HDL 4.4 5.3 5.7 1.02 0.489 LDL 3.7 2.0 6.0 1.68 0.114 VLDL 4.8b 9.2a 10.4a 0.85 <0.001 Long chain fatty acids Plasma 0.8b 1.1a 0.8b 0.08 <0.001 HDL 0.7b 1.4a 0.9b 0.22 0.045 LDL 2.5 3.8 1.1 1.93 0.431 VLDL 1.3a 1.6a 0.9b 0.21 0.029 Unidentified Plasma 12.3 12.6 12.0 0.59 0.349 HDL 13.1 15.8 12.1 4.23 0.674 LDL 7.0 7.6 13.6 8.54 0.277 VLDL 26.4a 22.5a 16.6b 2.77 0.022 1SO = Soya oil; 2FO = Fish oil; 3PHVO = Partially hydrogenated vegetable oil; 4Standard errors of differences of means; 5P-value represents the probability of a treatment effect; 6Single administration per day; a,b,c Means in the same row with different superscripts are different (P<0.05).

82
Table 3.4 Fatty acid distribution in plasma Control Treatments6 Fatty acid, g/100 g SO1 FO2 FO/PHVO3 SED4 P-value5
10:0 2.3a 0.8b 0.1b 0.54 <0.001 12:0 0.2 0.3 0.08 0.21 0.450 13:0 0.2 0.2 0.08 0.08 0.096 14:0 0.4 0.4 0.3 0.08 0.328 14:1 0.3a 0.2b 0.3a 0.06 0.041 15:0 0.7b 0.7b 0.8a 0.04 0.014 15:1 0.1b 0.1a 0.09b 0.02 0.014 16:0 14.4a 13.1b 13.9a 0.36 0.002 16:1 1.1b 1.1b 1.3a 0.07 <0.001 17:0 1.0b 1.2a 1.2a 0.05 0.004 17:1 0.4a 0.3b 0.5a 0.04 0.023 18:0 20.1 19.9 20.7 0.61 0.410 18:1 trans-5 0.1 0.1 0.1 0.04 0.669 18:1 trans-6-8 0.1b 0.1b 0.2a 0.01 <0.001 18:1 trans-9 0.3b 0.1b 0.5a 0.09 <0.001 18:1 trans-10 0.2b 0.2b 0.4a 0.05 <0.001 18:1 trans-11 1.7 1.5 1.9 0.26 0.412 18:1 trans-12 0.3c 0.4b 0.6a 0.09 0.007 18:1 cis-9 13.8b 12.4c 15.8a 0.41 <0.001 18:1 trans-15 1.1b 1.1b 1.2a 0.05 0.027 18:1 cis-11 0.3b 0.2b 0.4a 0.05 0.003 18:1 cis-12 0.1 0.1 0.2 0.03 0.871 18:1 cis-13 0.1 0.1 0.1 0.02 0.589 18:1 cis-14+ trans-15 0.2b 0.3a 0.2b 0.03 0.006 18:2n-trans 6 0.1b 0.1a 0.1a 0.02 0.013 18:2n-cis 6 11.0 11.5 10.8 0.53 0.455 20:0 0.1 0.09 0.1 0.03 0.043 18:3n6 0.07 0.1 0.1 0.01 0.004 20:1 0.05b 0.1a 0.1a 0.02 <0.001 18:3n3 1.7 1.7 1.7 0.07 0.595 18:2 cis-9, trans-11 0.3a 0.2c 0.3b 0.01 <0.001 20:2 0.1 0.2 0.2 0.04 0.421 22:0 0.1 0.1 0.1 0.02 0.094 20:3n6 2.4a 2.7a 2.1b 0.15 <0.001 22:1n9 0.08b 0.09b 0.1a 0.02 0.011 20:3n3 0.00 0.02 0.04 0.01 0.175 20:4n6 6.0b 6.6a 5.9b 0.18 0.001 23:0 0.2 0.1 0.2 0.07 0.807 22:2 0.2 0.2 0.1 0.09 0.302 24:0 0.00b 0.06a 0.05a 0.01 0.008 20:5n3 1.5b 2.6a 1.6b 0.18 <0.001 24:1 0.4 0.4 0.3 0.05 0.168 22:6n3 0.8b 1.1a 0.8b 0.08 <0.001 1SO = Soya oil; 2FO = Fish oil; 3PHVO = Partially hydrogenated vegetable oil; 4Standard errors of differences of means; 5P-value represents the probability of a treatment effect; 6Single administration per day; a,b,c Means in the same row with different superscripts are different (P<0.05).
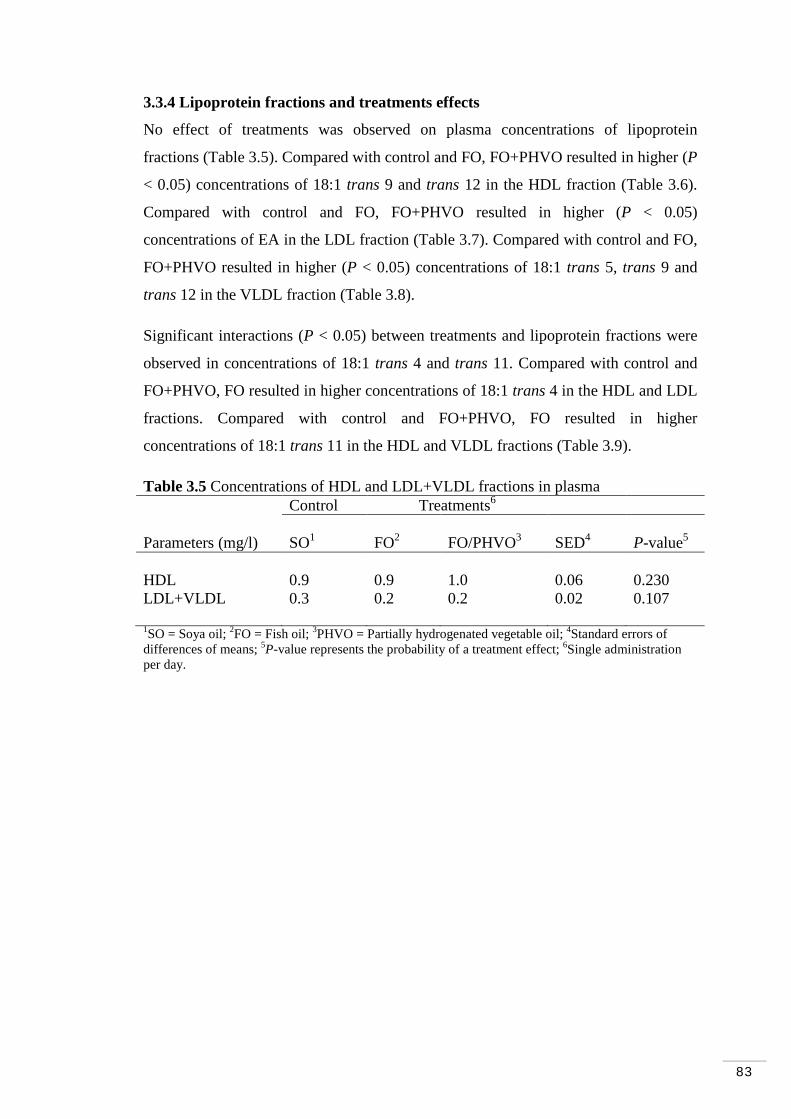
83
3.3.4 Lipoprotein fractions and treatments effects
No effect of treatments was observed on plasma concentrations of lipoprotein
fractions (Table 3.5). Compared with control and FO, FO+PHVO resulted in higher (P
< 0.05) concentrations of 18:1 trans 9 and trans 12 in the HDL fraction (Table 3.6).
Compared with control and FO, FO+PHVO resulted in higher (P < 0.05)
concentrations of EA in the LDL fraction (Table 3.7). Compared with control and FO,
FO+PHVO resulted in higher (P < 0.05) concentrations of 18:1 trans 5, trans 9 and
trans 12 in the VLDL fraction (Table 3.8).
Significant interactions (P < 0.05) between treatments and lipoprotein fractions were
observed in concentrations of 18:1 trans 4 and trans 11. Compared with control and
FO+PHVO, FO resulted in higher concentrations of 18:1 trans 4 in the HDL and LDL
fractions. Compared with control and FO+PHVO, FO resulted in higher
concentrations of 18:1 trans 11 in the HDL and VLDL fractions (Table 3.9).
Table 3.5 Concentrations of HDL and LDL+VLDL fractions in plasma Control Treatments6 Parameters (mg/l) SO1 FO2 FO/PHVO3 SED4 P-value5
HDL 0.9 0.9 1.0 0.06 0.230 LDL+VLDL 0.3 0.2 0.2 0.02 0.107 1SO = Soya oil; 2FO = Fish oil; 3PHVO = Partially hydrogenated vegetable oil; 4Standard errors of differences of means; 5P-value represents the probability of a treatment effect; 6Single administration per day.
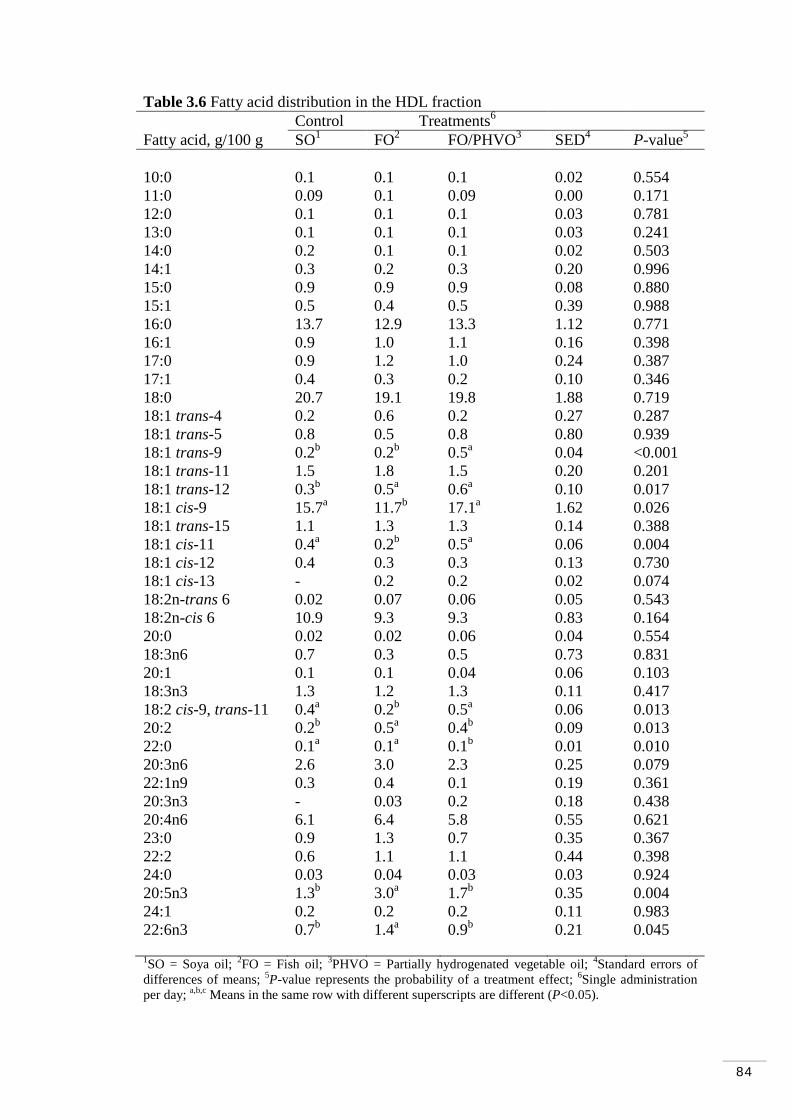
84
Table 3.6 Fatty acid distribution in the HDL fraction Control Treatments6 Fatty acid, g/100 g SO1 FO2 FO/PHVO3 SED4 P-value5
10:0 0.1 0.1 0.1 0.02 0.554 11:0 0.09 0.1 0.09 0.00 0.171 12:0 0.1 0.1 0.1 0.03 0.781 13:0 0.1 0.1 0.1 0.03 0.241 14:0 0.2 0.1 0.1 0.02 0.503 14:1 0.3 0.2 0.3 0.20 0.996 15:0 0.9 0.9 0.9 0.08 0.880 15:1 0.5 0.4 0.5 0.39 0.988 16:0 13.7 12.9 13.3 1.12 0.771 16:1 0.9 1.0 1.1 0.16 0.398 17:0 0.9 1.2 1.0 0.24 0.387 17:1 0.4 0.3 0.2 0.10 0.346 18:0 20.7 19.1 19.8 1.88 0.719 18:1 trans-4 0.2 0.6 0.2 0.27 0.287 18:1 trans-5 0.8 0.5 0.8 0.80 0.939 18:1 trans-9 0.2b 0.2b 0.5a 0.04 <0.001 18:1 trans-11 1.5 1.8 1.5 0.20 0.201 18:1 trans-12 0.3b 0.5a 0.6a 0.10 0.017 18:1 cis-9 15.7a 11.7b 17.1a 1.62 0.026 18:1 trans-15 1.1 1.3 1.3 0.14 0.388 18:1 cis-11 0.4a 0.2b 0.5a 0.06 0.004 18:1 cis-12 0.4 0.3 0.3 0.13 0.730 18:1 cis-13 - 0.2 0.2 0.02 0.074 18:2n-trans 6 0.02 0.07 0.06 0.05 0.543 18:2n-cis 6 10.9 9.3 9.3 0.83 0.164 20:0 0.02 0.02 0.06 0.04 0.554 18:3n6 0.7 0.3 0.5 0.73 0.831 20:1 0.1 0.1 0.04 0.06 0.103 18:3n3 1.3 1.2 1.3 0.11 0.417 18:2 cis-9, trans-11 0.4a 0.2b 0.5a 0.06 0.013 20:2 0.2b 0.5a 0.4b 0.09 0.013 22:0 0.1a 0.1a 0.1b 0.01 0.010 20:3n6 2.6 3.0 2.3 0.25 0.079 22:1n9 0.3 0.4 0.1 0.19 0.361 20:3n3 - 0.03 0.2 0.18 0.438 20:4n6 6.1 6.4 5.8 0.55 0.621 23:0 0.9 1.3 0.7 0.35 0.367 22:2 0.6 1.1 1.1 0.44 0.398 24:0 0.03 0.04 0.03 0.03 0.924 20:5n3 1.3b 3.0a 1.7b 0.35 0.004 24:1 0.2 0.2 0.2 0.11 0.983 22:6n3 0.7b 1.4a 0.9b 0.21 0.045 1SO = Soya oil; 2FO = Fish oil; 3PHVO = Partially hydrogenated vegetable oil; 4Standard errors of differences of means; 5P-value represents the probability of a treatment effect; 6Single administration per day; a,b,c Means in the same row with different superscripts are different (P<0.05).
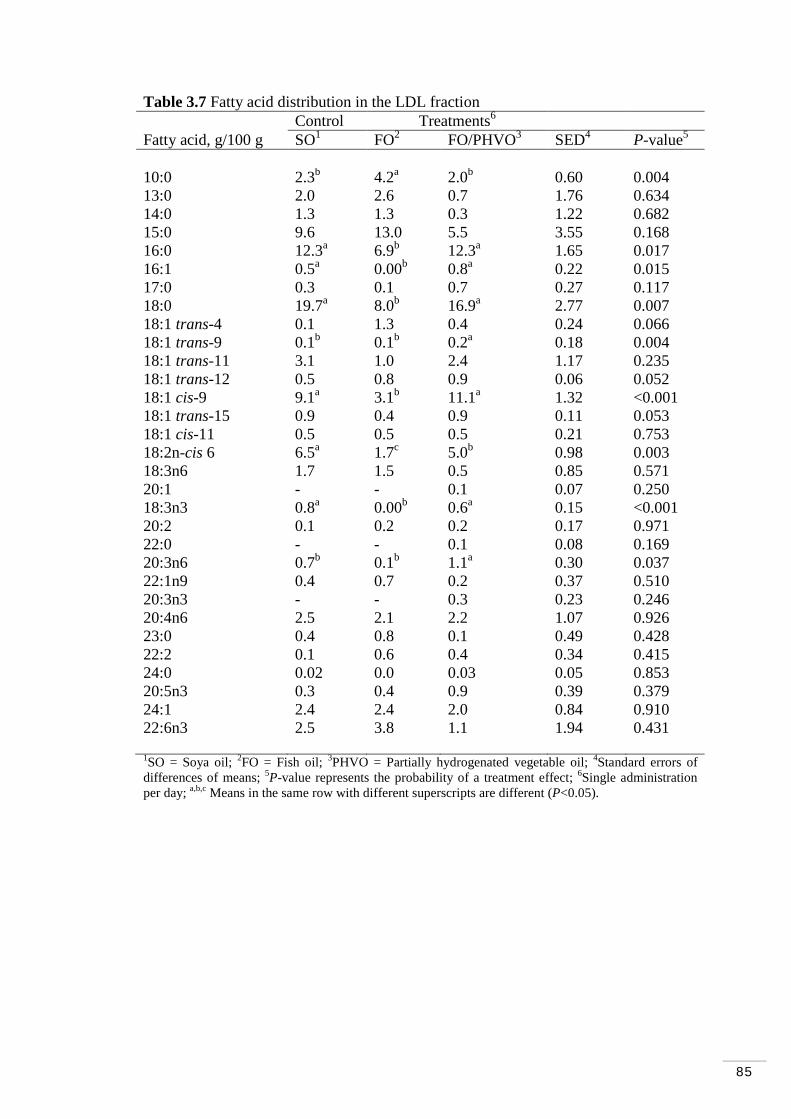
85
Table 3.7 Fatty acid distribution in the LDL fraction Control Treatments6 Fatty acid, g/100 g SO1 FO2 FO/PHVO3 SED4 P-value5
10:0 2.3b 4.2a 2.0b 0.60 0.004 13:0 2.0 2.6 0.7 1.76 0.634 14:0 1.3 1.3 0.3 1.22 0.682 15:0 9.6 13.0 5.5 3.55 0.168 16:0 12.3a 6.9b 12.3a 1.65 0.017 16:1 0.5a 0.00b 0.8a 0.22 0.015 17:0 0.3 0.1 0.7 0.27 0.117 18:0 19.7a 8.0b 16.9a 2.77 0.007 18:1 trans-4 0.1 1.3 0.4 0.24 0.066 18:1 trans-9 0.1b 0.1b 0.2a 0.18 0.004 18:1 trans-11 3.1 1.0 2.4 1.17 0.235 18:1 trans-12 0.5 0.8 0.9 0.06 0.052 18:1 cis-9 9.1a 3.1b 11.1a 1.32 <0.001 18:1 trans-15 0.9 0.4 0.9 0.11 0.053 18:1 cis-11 0.5 0.5 0.5 0.21 0.753 18:2n-cis 6 6.5a 1.7c 5.0b 0.98 0.003 18:3n6 1.7 1.5 0.5 0.85 0.571 20:1 - - 0.1 0.07 0.250 18:3n3 0.8a 0.00b 0.6a 0.15 <0.001 20:2 0.1 0.2 0.2 0.17 0.971 22:0 - - 0.1 0.08 0.169 20:3n6 0.7b 0.1b 1.1a 0.30 0.037 22:1n9 0.4 0.7 0.2 0.37 0.510 20:3n3 - - 0.3 0.23 0.246 20:4n6 2.5 2.1 2.2 1.07 0.926 23:0 0.4 0.8 0.1 0.49 0.428 22:2 0.1 0.6 0.4 0.34 0.415 24:0 0.02 0.0 0.03 0.05 0.853 20:5n3 0.3 0.4 0.9 0.39 0.379 24:1 2.4 2.4 2.0 0.84 0.910 22:6n3 2.5 3.8 1.1 1.94 0.431 1SO = Soya oil; 2FO = Fish oil; 3PHVO = Partially hydrogenated vegetable oil; 4Standard errors of differences of means; 5P-value represents the probability of a treatment effect; 6Single administration per day; a,b,c Means in the same row with different superscripts are different (P<0.05).

86
Table 3.8 Fatty acid distribution in the VLDL fraction Control Treatments6 Fatty acid, g/100 g SO1 FO2 FO/PHVO3 SED4 P-value5
10:0 0.7 0.5 0.3 0.16 0.116 11:0 0.7 0.3 0.4 0.13 0.077 12:0 1.2a 0.6b 0.6b 0.20 0.018 13:0 0.6a 0.2b 0.3b 0.11 0.037 14:0 1.5 1.4 1.4 0.19 0.965 15:0 6.0a 3.4b 3.6b 0.81 0.022 15:1 0.5 0.5 0.7 0.15 0.600 16:0 14.0 15.3 16.7 0.80 0.032 16:1 1.6 1.6 1.7 0.22 0.870 17:0 0.3b 1.0a 0.9a 0.22 0.038 17:1 0.07 0.1 0.2 0.11 0.241 18:0 16.2 14.5 17.1 1.44 0.254 18:1 trans-4 1.8a 0.9b 0.9b 0.31 0.030 18:1 trans-5 0.3b 0.3b 1.4a 0.15 0.027 18:1 trans-9 0.1b 0.7b 1.3a 0.33 0.028 18:1 trans-11 2.7b 4.6a 3.9a 0.55 0.020 18:1 trans-12 0.7c 1.1b 1.4a 0.10 0.002 18:1 cis-9 7.7b 8.5b 11.9a 0.91 0.004 18:1 trans-15 1.5 1.4 1.4 0.04 0.055 18:1 cis-11 0.3 0.3 0.4 0.07 0.488 18:1 cis-12 0.1 0.3 0.4 0.03 0.129 18:2n-cis 6 4.3 4.6 4.2 0.63 0.838 20:0 0.7 0.6 1.1 0.62 0.670 18:3n6 1.7a 0.7b 0.8b 0.32 0.035 20:1 0.01c 0.7a 0.3b 0.12 0.001 18:3n3 0.5b 1.2a 1.0a 0.19 0.018 20:2 0.2 0.3 0.08 0.13 0.224 22:0 0.06 0.2 0.3 0.09 0.081 20:3n6 1.0 1.0 0.7 0.53 0.752 22:1n9 1.5a 0.7b 0.4b 0.30 0.014 20:3n3 0.1b 0.4a 0.5a 0.13 0.031 20:4n6 1.9 2.3 1.9 0.40 0.535 23:0 0.8 0.7 0.9 0.48 0.883 22:2 0.1 0.5 0.2 0.15 0.106 24:0 - 1.0 0.02 0.03 0.059 20:5n3 0.3b 2.0a 1.1b 0.37 0.005 24:1 1.2a 0.6b 0.4b 0.25 0.027 22:6n3 1.3a 1.6a 0.9b 0.21 0.029 1SO = Soya oil; 2FO = Fish oil; 3PHVO = Partially hydrogenated vegetable oil; 4Standard errors of differences of means; 5P-value represents the probability of a treatment effect; 6Single administration per day; a,b,c Means in the same row with different superscripts are different (P<0.05).
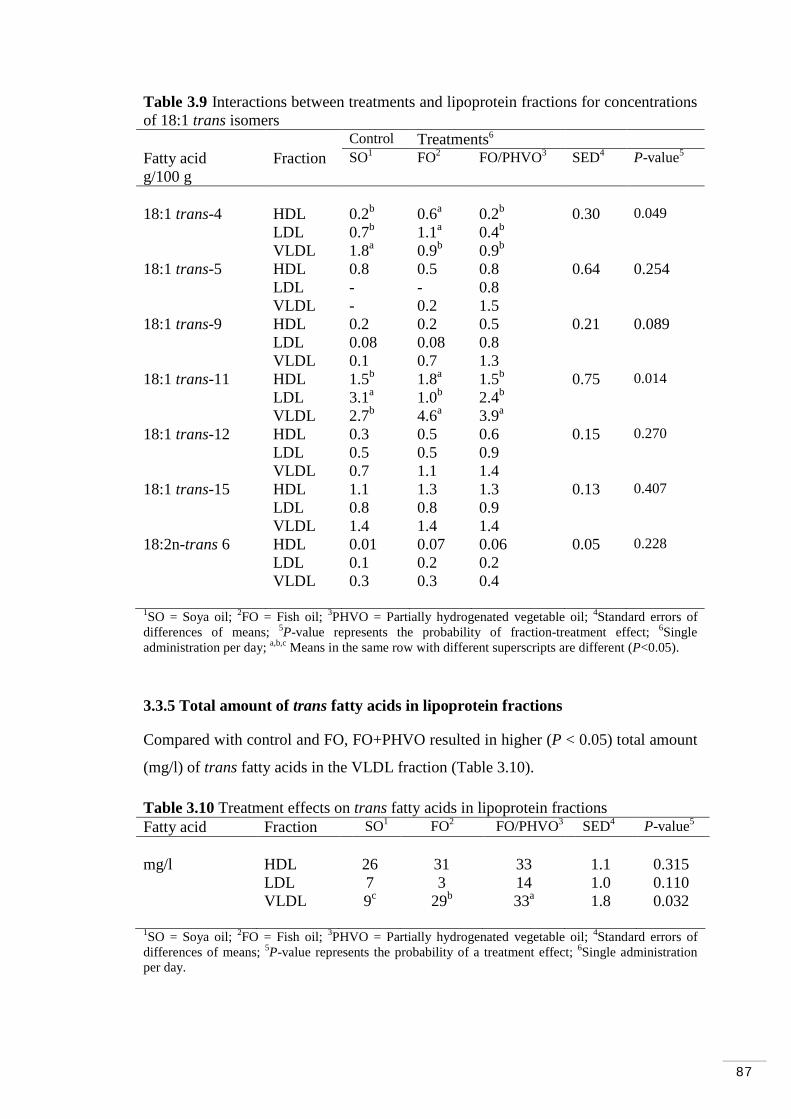
87
Table 3.9 Interactions between treatments and lipoprotein fractions for concentrations of 18:1 trans isomers Control Treatments6 Fatty acid g/100 g
Fraction SO1 FO2 FO/PHVO3 SED4 P-value5
18:1 trans-4 HDL 0.2b 0.6a 0.2b 0.30 0.049 LDL 0.7b 1.1a 0.4b VLDL 1.8a 0.9b 0.9b 18:1 trans-5 HDL 0.8 0.5 0.8 0.64 0.254 LDL - - 0.8 VLDL - 0.2 1.5 18:1 trans-9 HDL 0.2 0.2 0.5 0.21 0.089 LDL 0.08 0.08 0.8 VLDL 0.1 0.7 1.3 18:1 trans-11 HDL 1.5b 1.8a 1.5b 0.75 0.014 LDL 3.1a 1.0b 2.4b VLDL 2.7b 4.6a 3.9a 18:1 trans-12 HDL 0.3 0.5 0.6 0.15 0.270 LDL 0.5 0.5 0.9 VLDL 0.7 1.1 1.4 18:1 trans-15 HDL 1.1 1.3 1.3 0.13 0.407 LDL 0.8 0.8 0.9 VLDL 1.4 1.4 1.4 18:2n-trans 6 HDL 0.01 0.07 0.06 0.05 0.228 LDL 0.1 0.2 0.2 VLDL 0.3 0.3 0.4 1SO = Soya oil; 2FO = Fish oil; 3PHVO = Partially hydrogenated vegetable oil; 4Standard errors of differences of means; 5P-value represents the probability of fraction-treatment effect; 6Single administration per day; a,b,c Means in the same row with different superscripts are different (P<0.05).
3.3.5 Total amount of trans fatty acids in lipoprotein fractions
Compared with control and FO, FO+PHVO resulted in higher (P < 0.05) total amount
(mg/l) of trans fatty acids in the VLDL fraction (Table 3.10).
Table 3.10 Treatment effects on trans fatty acids in lipoprotein fractions Fatty acid Fraction SO1 FO2 FO/PHVO3 SED4 P-value5
mg/l HDL 26 31 33 1.1 0.315 LDL 7 3 14 1.0 0.110 VLDL 9c 29b 33a 1.8 0.032 1SO = Soya oil; 2FO = Fish oil; 3PHVO = Partially hydrogenated vegetable oil; 4Standard errors of differences of means; 5P-value represents the probability of a treatment effect; 6Single administration per day.
88
3.3.6 Fatty acid composition of lipid subgroups within lipoproteins
Concentrations (mg/l) of total lipid were not affected by treatment but were higher in
HDL-TG. 16:0 was not affected by treatments but higher in VLDL-CE. 18:0 was
higher in LDL than HDL and VLDL fractions. 18:1 trans-9 was not affected by
treatments but higher in LDL-CE. 18:1 trans-11 was not affected by treatments but
higher in TG than CE and PL subgroups. Compared with control and FO, FO+PHVO
increased the concentration of oleic acid in HDL-PL (Table 3.11a).
18:2 trans-6 was not affected by treatments but higher in CE than TG and PL
subgroups. 18:2 cis-6 was not affected by treatments but higher in HDL-TG. 18:3n6
was not affected by treatments but higher in CE than in TG and PL subgroups. 18:3n3
was not affected by treatments but higher in HDL-TG.Compared with control and
FO+PHVO, FO increased 20:3n6 in LDL-CE and increased 20:5n3 in LDL-TG.
Compared with FO and FO+PHVO, SO increased 22:6n3 in VLDL-CE (Table 3.11b).
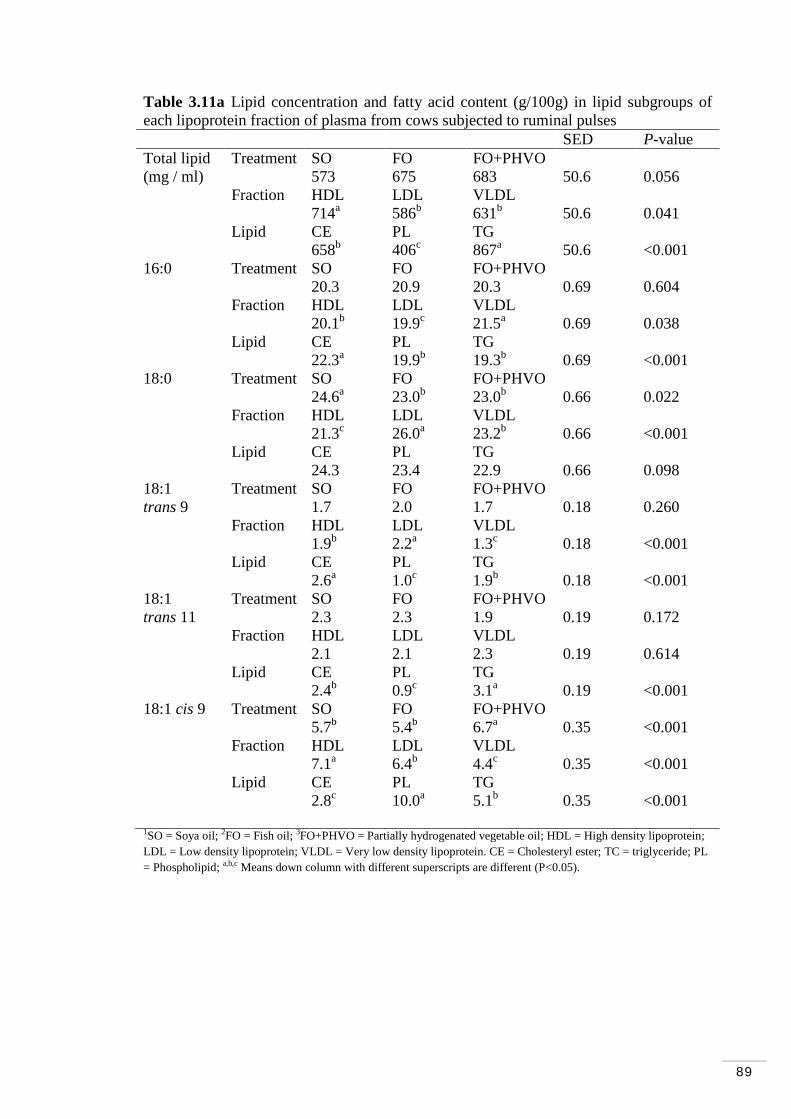
89
Table 3.11a Lipid concentration and fatty acid content (g/100g) in lipid subgroups of each lipoprotein fraction of plasma from cows subjected to ruminal pulses SED P-value Total lipid Treatment SO FO FO+PHVO (mg / ml) 573 675 683 50.6 0.056 Fraction HDL LDL VLDL 714a 586b 631b 50.6 0.041 Lipid CE PL TG 658b 406c 867a 50.6 <0.001 16:0 Treatment SO FO FO+PHVO 20.3 20.9 20.3 0.69 0.604 Fraction HDL LDL VLDL 20.1b 19.9c 21.5a 0.69 0.038 Lipid CE PL TG 22.3a 19.9b 19.3b 0.69 <0.001 18:0 Treatment SO FO FO+PHVO 24.6a 23.0b 23.0b 0.66 0.022 Fraction HDL LDL VLDL 21.3c 26.0a 23.2b 0.66 <0.001 Lipid CE PL TG 24.3 23.4 22.9 0.66 0.098 18:1 Treatment SO FO FO+PHVO trans 9 1.7 2.0 1.7 0.18 0.260 Fraction HDL LDL VLDL 1.9b 2.2a 1.3c 0.18 <0.001 Lipid CE PL TG 2.6a 1.0c 1.9b 0.18 <0.001 18:1 Treatment SO FO FO+PHVO trans 11 2.3 2.3 1.9 0.19 0.172 Fraction HDL LDL VLDL 2.1 2.1 2.3 0.19 0.614 Lipid CE PL TG 2.4b 0.9c 3.1a 0.19 <0.001 18:1 cis 9 Treatment SO FO FO+PHVO 5.7b 5.4b 6.7a 0.35 <0.001 Fraction HDL LDL VLDL 7.1a 6.4b 4.4c 0.35 <0.001 Lipid CE PL TG 2.8c 10.0a 5.1b 0.35 <0.001 1SO = Soya oil; 2FO = Fish oil; 3FO+PHVO = Partially hydrogenated vegetable oil; HDL = High density lipoprotein; LDL = Low density lipoprotein; VLDL = Very low density lipoprotein. CE = Cholesteryl ester; TC = triglyceride; PL = Phospholipid; a,b,c Means down column with different superscripts are different (P<0.05).
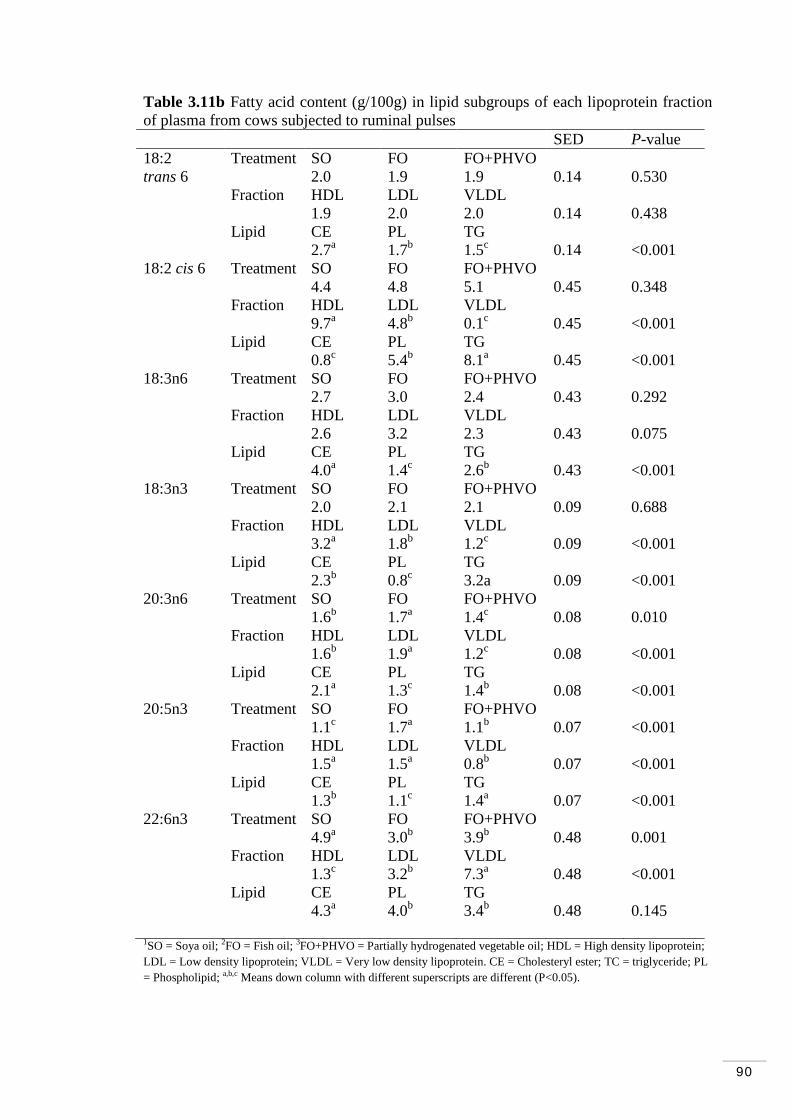
90
Table 3.11b Fatty acid content (g/100g) in lipid subgroups of each lipoprotein fraction of plasma from cows subjected to ruminal pulses SED P-value 18:2 Treatment SO FO FO+PHVO trans 6 2.0 1.9 1.9 0.14 0.530 Fraction HDL LDL VLDL 1.9 2.0 2.0 0.14 0.438 Lipid CE PL TG 2.7a 1.7b 1.5c 0.14 <0.001 18:2 cis 6 Treatment SO FO FO+PHVO 4.4 4.8 5.1 0.45 0.348 Fraction HDL LDL VLDL 9.7a 4.8b 0.1c 0.45 <0.001 Lipid CE PL TG 0.8c 5.4b 8.1a 0.45 <0.001 18:3n6 Treatment SO FO FO+PHVO 2.7 3.0 2.4 0.43 0.292 Fraction HDL LDL VLDL 2.6 3.2 2.3 0.43 0.075 Lipid CE PL TG 4.0a 1.4c 2.6b 0.43 <0.001 18:3n3 Treatment SO FO FO+PHVO 2.0 2.1 2.1 0.09 0.688 Fraction HDL LDL VLDL 3.2a 1.8b 1.2c 0.09 <0.001 Lipid CE PL TG 2.3b 0.8c 3.2a 0.09 <0.001 20:3n6 Treatment SO FO FO+PHVO 1.6b 1.7a 1.4c 0.08 0.010 Fraction HDL LDL VLDL 1.6b 1.9a 1.2c 0.08 <0.001 Lipid CE PL TG 2.1a 1.3c 1.4b 0.08 <0.001 20:5n3 Treatment SO FO FO+PHVO 1.1c 1.7a 1.1b 0.07 <0.001 Fraction HDL LDL VLDL 1.5a 1.5a 0.8b 0.07 <0.001 Lipid CE PL TG 1.3b 1.1c 1.4a 0.07 <0.001 22:6n3 Treatment SO FO FO+PHVO 4.9a 3.0b 3.9b 0.48 0.001 Fraction HDL LDL VLDL 1.3c 3.2b 7.3a 0.48 <0.001 Lipid CE PL TG 4.3a 4.0b 3.4b 0.48 0.145 1SO = Soya oil; 2FO = Fish oil; 3FO+PHVO = Partially hydrogenated vegetable oil; HDL = High density lipoprotein; LDL = Low density lipoprotein; VLDL = Very low density lipoprotein. CE = Cholesteryl ester; TC = triglyceride; PL = Phospholipid; a,b,c Means down column with different superscripts are different (P<0.05).
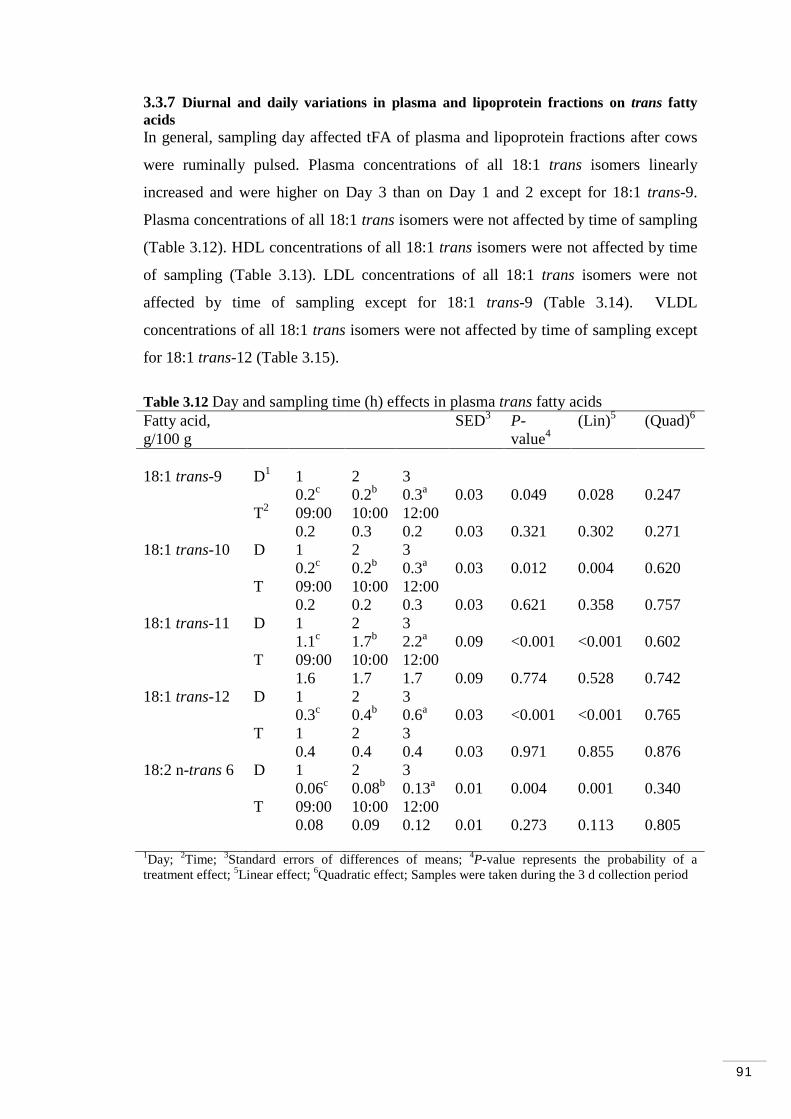
91
3.3.7 Diurnal and daily variations in plasma and lipoprotein fractions on trans fatty acids In general, sampling day affected tFA of plasma and lipoprotein fractions after cows
were ruminally pulsed. Plasma concentrations of all 18:1 trans isomers linearly
increased and were higher on Day 3 than on Day 1 and 2 except for 18:1 trans-9.
Plasma concentrations of all 18:1 trans isomers were not affected by time of sampling
(Table 3.12). HDL concentrations of all 18:1 trans isomers were not affected by time
of sampling (Table 3.13). LDL concentrations of all 18:1 trans isomers were not
affected by time of sampling except for 18:1 trans-9 (Table 3.14). VLDL
concentrations of all 18:1 trans isomers were not affected by time of sampling except
for 18:1 trans-12 (Table 3.15).
Table 3.12 Day and sampling time (h) effects in plasma trans fatty acids Fatty acid, g/100 g
SED3 P-value4
(Lin)5 (Quad)6
18:1 trans-9 D1 1 2 3 0.2c 0.2b 0.3a 0.03 0.049 0.028 0.247 T2 09:00 10:00 12:00 0.2 0.3 0.2 0.03 0.321 0.302 0.271 18:1 trans-10 D 1 2 3 0.2c 0.2b 0.3a 0.03 0.012 0.004 0.620 T 09:00 10:00 12:00 0.2 0.2 0.3 0.03 0.621 0.358 0.757 18:1 trans-11 D 1 2 3 1.1c 1.7b 2.2a 0.09 <0.001 <0.001 0.602 T 09:00 10:00 12:00 1.6 1.7 1.7 0.09 0.774 0.528 0.742 18:1 trans-12 D 1 2 3 0.3c 0.4b 0.6a 0.03 <0.001 <0.001 0.765 T 1 2 3 0.4 0.4 0.4 0.03 0.971 0.855 0.876 18:2 n-trans 6 D 1 2 3 0.06c 0.08b 0.13a 0.01 0.004 0.001 0.340 T 09:00 10:00 12:00 0.08 0.09 0.12 0.01 0.273 0.113 0.805 1Day; 2Time; 3Standard errors of differences of means; 4P-value represents the probability of a treatment effect; 5Linear effect; 6Quadratic effect; Samples were taken during the 3 d collection period
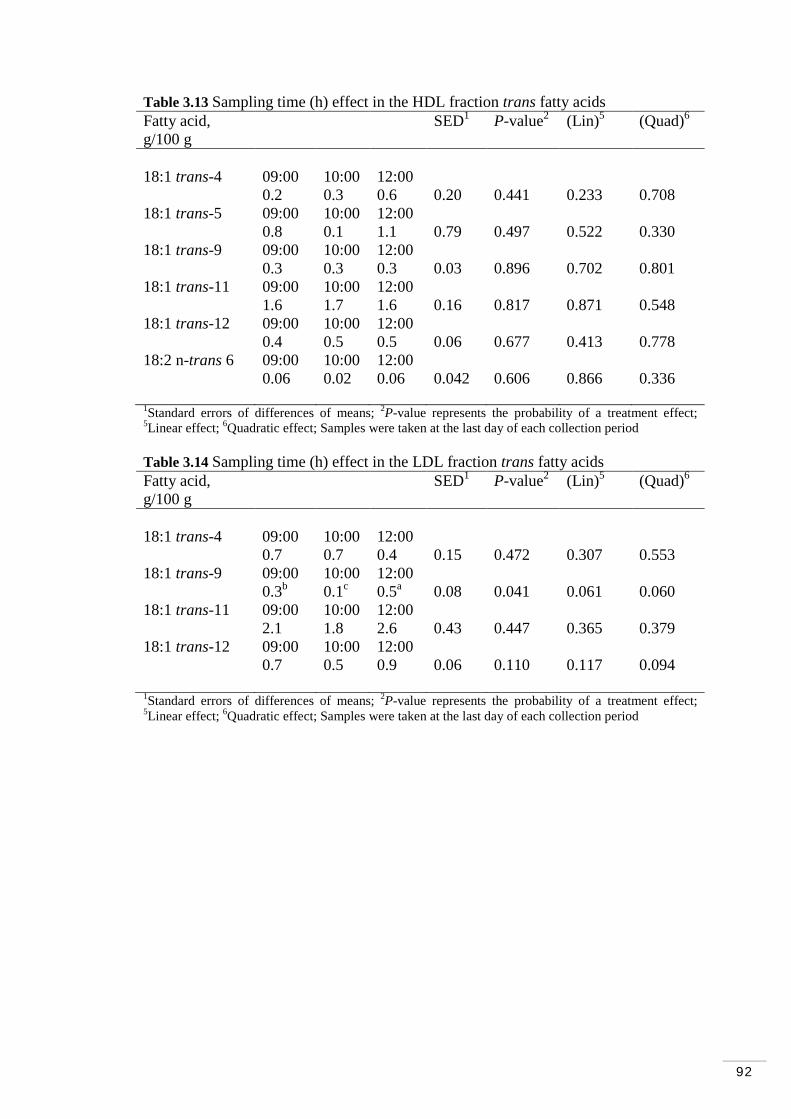
92
Table 3.13 Sampling time (h) effect in the HDL fraction trans fatty acids Fatty acid, g/100 g
SED1 P-value2 (Lin)5 (Quad)6
18:1 trans-4 09:00 10:00 12:00 0.2 0.3 0.6 0.20 0.441 0.233 0.708 18:1 trans-5 09:00 10:00 12:00 0.8 0.1 1.1 0.79 0.497 0.522 0.330 18:1 trans-9 09:00 10:00 12:00 0.3 0.3 0.3 0.03 0.896 0.702 0.801 18:1 trans-11 09:00 10:00 12:00 1.6 1.7 1.6 0.16 0.817 0.871 0.548 18:1 trans-12 09:00 10:00 12:00 0.4 0.5 0.5 0.06 0.677 0.413 0.778 18:2 n-trans 6 09:00 10:00 12:00 0.06 0.02 0.06 0.042 0.606 0.866 0.336 1Standard errors of differences of means; 2P-value represents the probability of a treatment effect; 5Linear effect; 6Quadratic effect; Samples were taken at the last day of each collection period Table 3.14 Sampling time (h) effect in the LDL fraction trans fatty acids Fatty acid, g/100 g
SED1 P-value2 (Lin)5 (Quad)6
18:1 trans-4 09:00 10:00 12:00 0.7 0.7 0.4 0.15 0.472 0.307 0.553 18:1 trans-9 09:00 10:00 12:00 0.3b 0.1c 0.5a 0.08 0.041 0.061 0.060 18:1 trans-11 09:00 10:00 12:00 2.1 1.8 2.6 0.43 0.447 0.365 0.379 18:1 trans-12 09:00 10:00 12:00 0.7 0.5 0.9 0.06 0.110 0.117 0.094 1Standard errors of differences of means; 2P-value represents the probability of a treatment effect; 5Linear effect; 6Quadratic effect; Samples were taken at the last day of each collection period
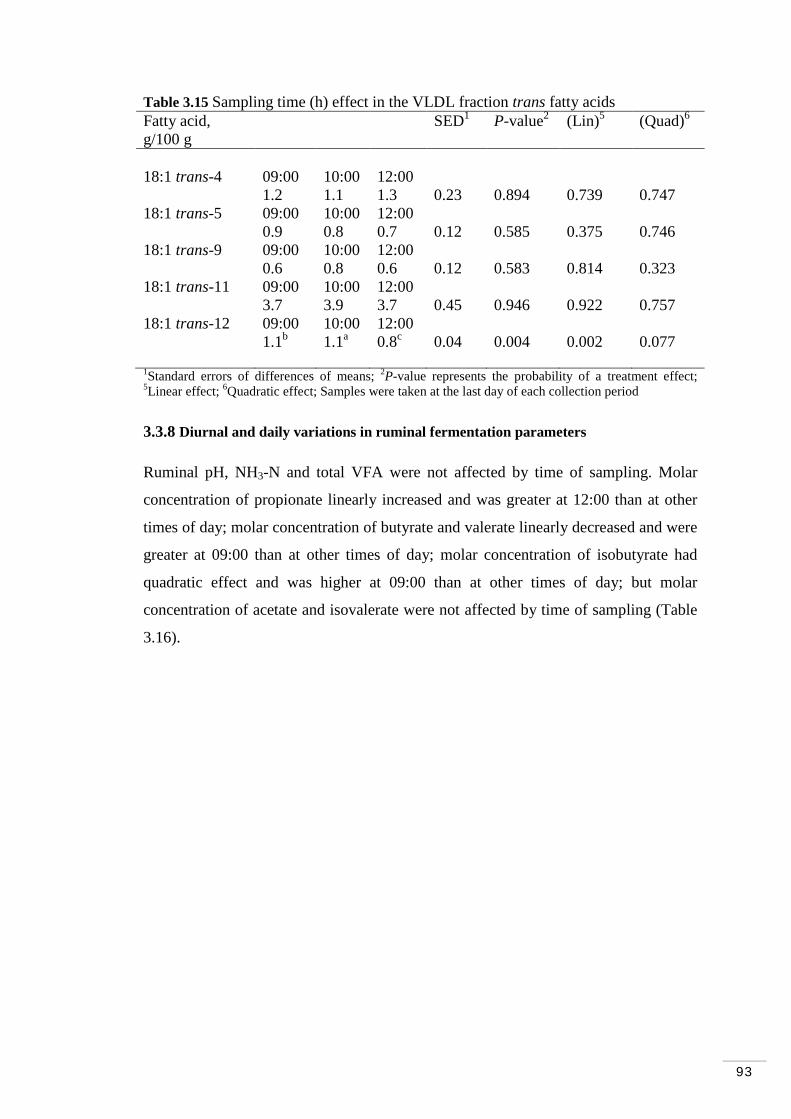
93
Table 3.15 Sampling time (h) effect in the VLDL fraction trans fatty acids Fatty acid, g/100 g
SED1 P-value2 (Lin)5 (Quad)6
18:1 trans-4 09:00 10:00 12:00 1.2 1.1 1.3 0.23 0.894 0.739 0.747 18:1 trans-5 09:00 10:00 12:00 0.9 0.8 0.7 0.12 0.585 0.375 0.746 18:1 trans-9 09:00 10:00 12:00 0.6 0.8 0.6 0.12 0.583 0.814 0.323 18:1 trans-11 09:00 10:00 12:00 3.7 3.9 3.7 0.45 0.946 0.922 0.757 18:1 trans-12 09:00 10:00 12:00 1.1b 1.1a 0.8c 0.04 0.004 0.002 0.077 1Standard errors of differences of means; 2P-value represents the probability of a treatment effect; 5Linear effect; 6Quadratic effect; Samples were taken at the last day of each collection period
3.3.8 Diurnal and daily variations in ruminal fermentation parameters
Ruminal pH, NH3-N and total VFA were not affected by time of sampling. Molar
concentration of propionate linearly increased and was greater at 12:00 than at other
times of day; molar concentration of butyrate and valerate linearly decreased and were
greater at 09:00 than at other times of day; molar concentration of isobutyrate had
quadratic effect and was higher at 09:00 than at other times of day; but molar
concentration of acetate and isovalerate were not affected by time of sampling (Table
3.16).
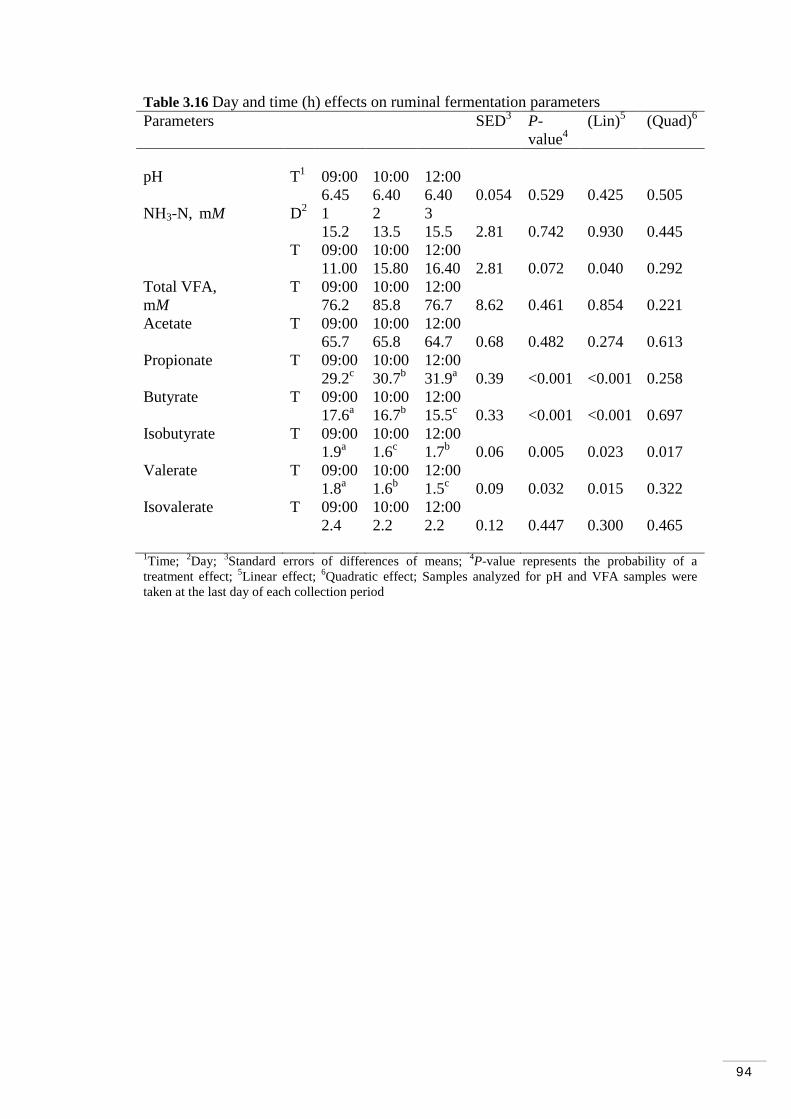
94
Table 3.16 Day and time (h) effects on ruminal fermentation parameters Parameters SED3 P-
value4 (Lin)5 (Quad)6
pH T1 09:00 10:00 12:00 6.45 6.40 6.40 0.054 0.529 0.425 0.505 NH3-N, mM D2 1 2 3 15.2 13.5 15.5 2.81 0.742 0.930 0.445 T 09:00 10:00 12:00 11.00 15.80 16.40 2.81 0.072 0.040 0.292 Total VFA, T 09:00 10:00 12:00 mM 76.2 85.8 76.7 8.62 0.461 0.854 0.221 Acetate T 09:00 10:00 12:00 65.7 65.8 64.7 0.68 0.482 0.274 0.613 Propionate T 09:00 10:00 12:00 29.2c 30.7b 31.9a 0.39 <0.001 <0.001 0.258 Butyrate T 09:00 10:00 12:00 17.6a 16.7b 15.5c 0.33 <0.001 <0.001 0.697 Isobutyrate T 09:00 10:00 12:00 1.9a 1.6c 1.7b 0.06 0.005 0.023 0.017 Valerate T 09:00 10:00 12:00 1.8a 1.6b 1.5c 0.09 0.032 0.015 0.322 Isovalerate T 09:00 10:00 12:00 2.4 2.2 2.2 0.12 0.447 0.300 0.465 1Time; 2Day; 3Standard errors of differences of means; 4P-value represents the probability of a treatment effect; 5Linear effect; 6Quadratic effect; Samples analyzed for pH and VFA samples were taken at the last day of each collection period
95
3.4 Discussion
The current experiment focused on the transport of tFA by bovine plasma VLDL
fraction (that also contained chylomicrons - lipoprotein derived from the intestine)
because the previous experiment demonstrated that pulses of PHVO and SO increased
tFA content in both HDL and LDL fractions. Further fractionation was required to
distinguish between true LDL and VLDL fractions that are present in the LDL
fraction. The approach was similar to the previous experiment; hence ruminal pulses
were used to study effects of dietary lipids on plasma and lipoprotein fractions. As in
Chapter 2, the results may differ from other studies because the treatments did not
bypass the rumen and hence the biohydrogenation process had an extensive effect on
concentrations of FA observed in plasma and lipoprotein fractions. The main
hypothesis was that differences in FA concentrations would be observed, particularly
in 18:1 trans isomers and 18:2 cis-9, trans-11. This hypothesis was supported by the
differences in concentrations 18:1 tFA isomers and 18:2 cis-9, trans-11 in plasma and
lipoprotein fractions, particularly in the VLDL fraction.
This experiment was the first to compare the response to ruminal pulses of PHVO, FO
and their blend on concentrations of individual tFA isomers in lipoprotein fractions of
bovine plasma. The use of PHVO was discussed in Chapter 2; however, FO was used
in this experiment to increase the formation of 18:1 trans isomers in the rumen. FO is
also interesting because it is often included in ruminant diets to increase the content of
long chain n-3 PUFA (22:6n-3 and 20:5n-3; DHA and EPA) for human health reasons
(vascular and heart diseases, immune and inflammatory responses and in early
development) (Offer et al, 2001; Loor et al., 2005).
In the current experiment, differences in 18:1 trans isomers in plasma and lipoprotein
fractions are in agreement with the previous experiment and with observations by
Loor and Herbein (2001) in which a mixture of CLA (41% 18:2 cis-9, trans-11 and
44% 18:2 trans-10,cis-12) was ruminally infused causing alterations in plasma and
milk fatty acid profiles. Concentrations of CLA are higher in milk fat from cows
offered fresh compared with conserved forages, and can also be increased using whole
oilseeds (e.g. SO) or oil supplements (e.g. FO and PHVO) (Griinari and Bauman,
1999), but larger responses have been obtained using FO (Offer et al., 1999). The
response mechanism remains unclear, but FO has been shown to increase 18:1 trans
96
isomers in milk fat and the flow of 18:1 tFA entering the duodenum (Wonsil et al.,
1994), suggesting that FO modifies biohydrogenation of dietary PUFA in the rumen
(Shingfield et al., 2003).
In the current experiment, compared with PHVO, FO increased VA in plasma and
lipoprotein fractions. That response is in agreement with AbuGhazaleh et al. (2007)
who compared the effect of FO and sunflower oil supplementation on milk CLA cis-9,
trans-11 when dairy cows were managed on pasture or in confinement. They found
that FO and sunflower oil supplementation resulted in higher milk concentrations and
yields of VA, CLA cis-9, trans-11 and lower 18:1 trans-10 in pasture-fed cows
compared with confinement-fed cows. Likewise, Cruz-Hernandez et al. (2007)
evaluated different levels of inclusion of sunflower oil (15, 30 and 45 g/kg of DM)
and a constant level of FO (5 g/kg of DM) to increase VA and RA in milk and
examine the content and composition of CLA and 18:1 trans isomers. They found
that supplementation with sunflower oil and FO reduced milk fat but milk protein and
lactose levels were not affected. There was a linear decrease in all short- and medium-
chain SFA in milk fat after 10 d and a corresponding linear increase in total 18:1 trans
isomers and total CLA.
In this experiment, 18:2 cis-9, trans-11 was detected in FO and FO+PHVO, earlier
studies revealed that CLA content in milk fat is highest when diets are supplemented
with a blend of FO and linoleic acid-rich oils. Cows on pasture diets have been shown
to have higher concentrations of CLA (Kelly et al., 1998; Lawless et al., 1998; White
et al., 2001; Boken et al., 2005) in their milk than those consuming conserved forages.
It has also been shown that milk CLA concentration can be enhanced in pasture
grazing cows when their feed is supplemented with oils (Lawless et al., 1998; Boken
et al., 2005; AbuGhazaleh and Holmes, 2007). Inclusion of FO in total mix ratios is an
effective means of increasing milk CLA cis-9, trans-11 content (Donovan et al., 2000;
Whitlock et al., 2002). This appears to occur because of the inhibitory effect of
docosahexaenoic acid (DHA) in FO on VA reduction to 18:0 (AbuGhazaleh and
Jenkins, 2004). Milk CLA cis-9, trans-11 response to FO is further enhanced when
given in combination with linoleic or linolenic acid-rich oil sources (AbuGhazaleh et
al., 2002, 2003). AbuGhazaleh et al. (2003) concluded that supplementing dairy cow
97
diets with a combination of FO and linoleic acid-rich oils is the most effective dietary
regime to increase milk CLA cis- 9, trans-11 content.
Castaneda-Gutierrez et al. (2005) demonstrated that when Ca salts of FO are fed
through a rumen fistula, the negative effects of FO on DM intake and lactation
performance were decreased compared to feeding the free oil. In that study, infusion
of FO into the rumen clearly suppressed DM intake and milk fat yield compared with
abomasal infusion of FO or feeding of Ca salts of FO. Their data indicated that Ca
salts of FO minimized the negative effects of FO on rumen fermentation. When FO
was supplemented unprotected, at 145 g/day (Castaneda-Gutierrez et al., 2005), 206
g/day (Petit et al., 2002) or 290 to 612 g/day (Donovan et al., 2000), milk fat content
and yield were depressed. Donovan et al. (2000) demonstrated a linear negative effect
of FO (added at 0, 10, 20 and 30 g/kg of diet DM) on milk fat content and yield. FO
supplementation greater than 10 g/kg of DM (290 g/day) decreased DM intake and
milk production, although cows fed 10 g/kg FO produced more milk than cows not
supplemented with FO. Moreover, Juchem et al., (2008) reported that negative effects
of FO on DM intake and yields of milk and milk fat can be modulated by two factors.
Firstly, when FO is protected; this is likely to minimize its effects on the rumen
microflora (Castaneda-Gutierrez et al., 2005). Secondly, the amount of FO
supplementation; in their experiments, cows were fed FO at approximately 80 g/day
(3.2 g/kg diet DM), so the amount of FO consumed by cows was significantly less
than that demonstrated to affect performance (Donovan et al., 2000). It has been also
reported that along with CLA cis-9, trans-11 the concentration of VA, a substrate for
endogenous synthesis of CLA cis-9, trans-11 in human tissues (Pariza et al., 2001),
also increased in milk fat in response to dietary FO (Chilliard et al., 2001; Loor et al.,
2005).
Studies have identified that availability of 18:0 for endogenous 18:1 cis-9 production
seems to be crucial for milk fat synthesis (Donovan et al., 2000; Chilliard et al., 2003;
Loor et al., 2005). Furthermore, the reduction in 18:0 availability seems to be the
strongest association among all previous studies dealing with milk fat depression
induced by FO supplementation (Chilliard et al., 2001; Donovan et al., 2000;
Shingfield et al., 2003; Loor et al., 2005; Gama et al., 2008). Inhibition of the
reduction of 18:1 trans isomers to 18:0 by FO could be related to greater ruminal
98
protozoa numbers or toxic effects of DHA and eicosapentaenoic acid (EPA), which
can in turn lower concentrations of ruminal bacteria associated not only with the final
reduction step but also with the overall process of biohydrogenation (Loor et al.,
2005). Moreover, at a given dose of incorporation, marine oils or algae rather than
unsaturated vegetable oils in dairy diets seem to be more effective for increasing milk
CLA cis-9, trans-11 concentration (Chilliard et al., 2000).
3.4.1 Fatty acid profile of plasma and lipoprotein fractions
As discussed in Chapter 2, sampling day and time affected 18:1 tFA of plasma.
Generally, sampling day had linear effect on 18:1 trans isomers on plasma. On the
other hand, only 18:1 trans-12 from VLDL fraction had linear effect on sampling time.
With a single administration, concentrations of treatments are higher during the first
few hours after pulse and lower in subsequent hours (Ferlay and Doreau, 1992). In
this study, effects of treatments on tFA profile of plasma and lipoprotein fractions
were observed within the first three hours post pulse. The diurnal variation of tFA in
the plasma and cholesterol fractions found in this study may indicate that fluctuations
vary according to metabolic status (preprandial and postprandial status) (Diven et al.,
1958). The amounts and composition of lipids circulating in the blood of dairy cattle
are dependent upon a number of physiological variables. The nature of the diet, time
since feeding, age, breed, pregnancy, and stage of lactation may all affect lipid content
and composition (Christie, 1981). In this study, diurnal variations of plasma,
lipoprotein fractions and ruminal fermentation parameters and showed that there may
be an adaptation of ruminal microflora to the treatments and also reflected a cycle
control mechanism balancing rate of lipid entry and rate of removal in the circulatory
system. This is possibly related to regulation of lipid supply (diet, production,
synthesis) and utilization by peripheral tissues (Bitman et al., 1990).
Concentrations (g/100g) of tFA were almost 2 times greater in VLDL than HDL and
LDL fractions. These results may support the suggestion from the previous
experiment that further fractionation was necessary to distinguish true LDL fraction
from chylomicrons and VLDL that are also present in this fraction. However, such
comparisons in bovine lipoprotein fractions have not been evaluated in previous
studies (Loor and Herbein, 2001; Mosley et al., 2006; Tyburczy et al., 2008). In this
99
experiment, compared with control, FO and FO/PHVO increased 18:1 trans isomers
in plasma and VLDL fraction, that may be attributed to an inhibition of the
biohydrogentation reduction steps of 18:1 trans isomers to 18:0 by LC-PUFA present
in FO (Shingfield et al., 2003; AbuGhazaleh and Jenkins, 2004; Lee et al., 2005; Loor
et al., 2005; Or-Rashid et al., 2008).
In the current experiment, 18:2 cis-9, trans-11 was increased by SO and FO+PHVO in
plasma and HDL fraction but was not detected in LDL and VLDL fractions.
Vegetable or marine oils elevate the concentration and yield of CLA and tFA isomers
in milk fat (Chilliard et al., 2000). In this experiment, SO and FO+PHVO increased
18:2 cis-9, trans-11 in plasma and HDL fraction probably because its concentration of
18:2 n-cis 6 was enough to inhibit hydrogenation of 18:1 isomers to 18:0 (Loor and
Herbein, 2001).
In the current experiment, the presence of plasma CLA 18:2 cis-9, trans-11 in HDL
probably reflects the predominance of HDL fraction lipid in cattle plasma. Normally,
70-90% of bovine plasma lipids are in the HDL fraction; thus it is expected that the
preponderance of 18:2 cis-9, trans-11 would also be in this fraction (Herdt et al.,
1995).
Capper et al. (2007) evaluated the effects of supplementing pregnant and lactating
ewes with FO and vitamin E upon the performance of lactating ewes and sucking
lambs. They found that the total FA concentration in sucking lamb plasma was
reduced by FO supplementation of the ewe. Maternal FO supplementation reduced
plasma concentrations of 16:0, 18:0, 18:1 cis-9, 18:2n-6 and 20:4n-6 in sucking lambs.
By contrast, increases in 18:1 trans isomers; CLA cis-9, trans-11, 18:3n-3, EPA and
DHA were obtained by supplementing ewes with FO.
Addition of FO to the ruminant diet has been shown to increase plasma concentrations
of both 18:1 trans isomers and CLA produced by incomplete ruminal
biohydrogenation of PUFA (Baumgard et al., 2000; Wachira et al., 2000; Chikunya et
al., 2004), results that agree with the increase in 18:1 tFA conferred by FO and
FO/PHVO treatments within the current experiment. Increases in n-3 PUFA conferred
by FO supplementation are often accompanied by a corresponding increase in plasma

100
20:4n-6 concentration resulting from increased dietary supply (Kitessa et al., 2001). In
the current experiment, increased 20:4n-6, EPA and DHA are in agreement with data
presented by Capper et al. (2007). They found that significant increase in plasma EPA
and DHA in ewes offered diets containing FO were a direct result of increased dietary
supply of preformed long-chain PUFA. However, Wachira et al. (2002) and Chikunya
et al. (2004) reported the presence of EPA and DHA within muscle and plasma FA of
sheep fed diets in which these FA were not detected.
Alternatively, proliferation of bacteria capable of conversion of 18:3 and 18:2 through
to 18:0 might be inhibited by the LCPUFA in FO, resulting in increased VA. A study
by Wasowska et al. (2006) showed that addition of EPA or DHA (50 mg/l) to pure
cultures inhibited growth and isomerase activity of B. fibrisolvens, whereas FO, in
which the FA were present in triacylglycerols, had no effect. Other reports (Kim et al.,
2008) suggested that accumulation of 18:2n-6 in the rumen (by feeding more 18:2n-6
to the ruminant) causes incomplete biohydrogenation.
3.4.2 Fatty acid composition in the lipoprotein lipids
In the current experiment, HDL-CE had higher concentrations (g/100g) of VA, EA
and 18:2 trans6 in bovine plasma. This high concentration of plasma tFA in HDL-CE
probably reflects the predominance of HDL fraction lipid in cattle plasma. Normally,
70-90% of bovine plasma lipids are in the HDL fraction; thus it is expected that the
preponderance of tFA would also be in this fraction (Herdt et al., 1995). However, it
also depends on whether tFA are coming directly from the intestine (in which case
tFA will be present in the VLDL fraction) or whether tFA get incorporated into tissues
and then released again (in which case tFA can be found in LDL and/or HDL
fractions).
Ruminant plasma lipoprotein profile is characterized by low concentrations of
chylomicrons, VLDL and total TG, whereas approximately 90% of plasma lipid is
carried by HDL, mainly in the form of CE and PL (Offer et al., 2001). Offer et al.
(2001) studied the selective incorporation of dietary FA into plasma lipoprotein
classes in cows supplemented with FO (300 g/d). They found that VLDL-TG was not
altered by FO supplementation. In the current experiment concentration of VLDL-TG
101
appeared to be the major lipid sub group carrying plasma FA. These results are
different from previous studies (Ashes et al., 2000; Offer et al., 2001) probably due to
the fact that FA treatments were given as single ruminal pulses and were exposed to
direct ruminal biohydrogenation rather than being supplemented in the diet. Also,
because non-lactating cows were used, FA profiles reported may be different from
lactating cows because milk fat composition is affected by stage of lactation. More
importantly, FA metabolism is affected by lactation, which greatly increases
metabolic demand for FA and precursors (Belyea et al., 1990; Palmquist et al., 1993).
The effect of FO and FO/PHVO as ruminal pulses is another factor that may explain
variation in concentrations of certain FA within each lipid sub group. For example,
DePeters et al. (2001) attributed changes in carbon number for TG structure to high
proportions of LCFA and medium chain FA associated with canola oil infused either
into the rumen or abomasum. Also in the current experiment non-lactating cows were
used, whereas Offer et al. (2001) used mid-lactation cows and hence that may have an
effect on FA utilization to satisfy different energy requirements.
There is evidence (Palmquist, 1976; Moore and Christie, 1979; Christie et al., 1986;
Scow and Chernick, 1987; Barber et al., 1997) that the ruminant mammary gland
obtains FA required for assembly of milk lipids by the action of mammary lipoprotein
lipase on the TG fraction of chylomicrons and VLDL. Studies on lactating cows and
goats, utilizing arterio-venous difference measurements, mammary gland perfusions
and infusions of radioactively labelled lipids, all indicated that the TG component of
chylomicrons and VLDL is the main source of milk lipid. Although much larger
amounts of CE and PL are present, mainly in HDL, these are poor substrates for
lipoprotein lipase and thus make only modest contributions to the formation of milk
fat (Offer et al., 2001). The dynamics of lipid transport cannot be inferred simply from
the analysis of plasma lipoprotein concentrations. The high fractionation removal rate
(~ 0.5 per min) of VLDL from lactating cow plasma (Palmquist and Mattos, 1978)
and the large increase in plasma VLDL concentration which takes place at the end of
lactation (Palmquist, 1976), supports the high state of flux of this lipoprotein, with
influx being balanced by mammary uptake. The efficient delivery of any dietary FA
from the small intestine to the mammary gland depends on partitioning of FA into the
TG fraction during assembly of chylomicrons / VLDL in the intestinal epithelium. If
102
FA are instead incorporated only into the PL and CE fractions of lipoproteins, then
they will be unavailable to the mammary lipoprotein lipase system (Offer et al., 2001).
Another consideration is that high-oil feed ingredients increase availability of UFA
and rumen-derived 18:1 trans isomers in blood for uptake and incorporation into milk
fat. VA and 18:2 cis-9, trans-11 are the major intermediates of dietary 18:2n-6
hydrogenation. In contrast, 18:1 trans-6/7/8 and trans-9 are the major intermediates
produced during isomerization of 18:1 cis-9. This is in agreement with the decreased
of EA in LDL-PL and VLDL-FFA caused by FO in the current experiment. Despite
its ruminal origin, the majority of 18:2 cis-9, trans-11 in milk fat is synthesized within
the mammary gland from VA via Δ9 desaturase. Transfer of dietary 18:2 trans-10, cis-
12 into milk fat may be low due to its preferential incorporation into plasma
phospholipids (Loor et al., 2003).
3.4.3 Ruminal fermentation
Ruminal NH3-N and propionate linearly increased and butyrate and valerate linearly
decreased across sampling times. Conversely, Shingfield et al. (2010) studied the
effects of incremental amounts (0, 8, 16 and 24 g/kg of DM) of FO as a source of EPA
and DHA on ruminal lipid metabolism and the flow of FA at the duodenum in steers
fed maize silage-based diets, and reported that the inclusion of FO in the diet had no
effect on rumen pH and NH3-N concentrations. They also observed that
supplementing FO increased linearly molar concentration of propionate and reduced
linearly butyrate, with a trend towards a linear decrease in molar proportions of
acetate in rumen VFA. Likewise, Toral et al. (2009), supplemented ewes with a diet
that included sunflower oil (20 g/kg of DM) and FO (10 g/kg of DM) to investigate
the impact of the addition of oils on ruminal fermentation parameters; they found no
effect on ruminal pH, NH3-N, lactate and VFA concentrations and concluded that its
use to improve the nutritional value of ruminant sub products cannot be precluded.
The effect of FO on ruminal fermentation parameters may be due to the level of
inclusion in diets, for example, Lee et al. (2008), examined the effects of incremental
amounts (0, 10, 20 and 30 g/kg DM) of FO on biohydrogenation in steers fed sole
forage diets based on ensiled grass or red clover. They found that FO in the diets had
no effect on rumen pH but decreased rumen NH3-N concentrations when added at 30

103
g/kg diet DM. Regardless of the forage fed, FO supplements had no effect on total
VFA concentrations or VFA molar proportions.
Amorocho et al. (2009) evaluated catfish oil as a dietary ingredient for dairy cows at
different levels (0, 15 and 30 g/kg); they found that total VFA concentrations in
ruminal fluid were similar across levels of inclusion; molar proportion of acetate
decreased with increasing concentrations of catfish oil, whereas propionate
concentration increased by adding catfish oil in the diet. Doreau and Chilliard (1997)
also reported a decrease in molar proportion of acetate and an increase in propionate
in ruminal fluid of cows fed diets supplemented with 370 g/d of menhaden fish oil.
Onetti et al. (2001) and Lewis et al. (1999) reported similar results when tallow was
the source of fat. A possible explanation for such effects is that UFA can alter the
ruminal ecosystem by suppression of methanogenic (and to a lesser extent cellulolytic)
bacteria and protozoa (Van Soest, 1994). A decrease in methane production alters
rumen fermentation, leading to an increase in propionate production to maintain the
ruminal fermentation balance (Amorocho et al., 2009).
As described before, the effect of lipid supplementation on ruminal fermentation relies
mainly on three factors: first, the type of oil (Wachira et al., 2000), second, the level
of oil inclusion in the diet (Shingfield et al., 2008) and third, the dietary
forage:concentrate ratio, since animals fed a concentrate-rich diet might be more
likely to be adversely affected by oil supplementation (Ueda et al., 2003). In lactating
cows, a high-forage diet supplemented with a combination of sunflower and FO only
induced a transient reduction in total VFA concentration at 2 h post feeding, but no
effect was observed at 6 h (Palmquist and Griinari, 2006).
It would be interesting to study further the effect of FO and its blend with PHVO to
understand alterations to ruminal ecosystem. As previously reported (AbuGhazaleh
and Jenkins, 2004; Boeckaert et al., 2007, 2008; Scollan et al., 2001) marine products,
such as FO and algae, proved highly effective at inhibiting rumen biohydrogenation of
UFA because LC-PUFA (EPA and/or DHA) are active compounds in this process.
Supplementation with LC-PUFA can reduce 18:0 production, resulting in
accumulation of various hydrogenation intermediates, predominantly VA and 18:1
trans-10 (Boeckaert et al., 2008).
104
3.5 Conclusion
Differences in FA concentrations between plasma and lipoprotein fractions were
observed, particularly in 18:1 trans isomers. This experiment reinforces findings
reported in Chapter 2 and helps to understand which lipoprotein is involved in the
transport of tFA. In this experiment, VLDL appeared to be the main transport
mechanism of 18:1 trans isomers in bovine plasma. Overall, results from Chapters 2
and 3 demonstrates that dietary lipids rich in PUFA can alter the rumen environment
and result in increased plasma and lipoprotein-fraction concentrations of tFA. The
results therefore show how plasma FA profiles change when supplementary oils do
not bypass the rumen and hence the lipids had extensive effects on the
biohydrogenation process, as indicated by plasma and lipoprotein 18:1 trans isomers.
3.6 Implications
In this experiment, VLDL fraction appeared to be the major fraction involved in the
transportation of tFA. However, further research is needed to understand the
metabolism of FA at the cellular level within the mammary gland.
The phenomenon of milk fat depression induced by PUFA supplementation in
lactating ruminants has been reviewed in detail (Peterson et al., 2003; Bauman et al.,
2006) and it is clear that specific FA produced as intermediates during ruminal
biohydrogenation of 18:2n-6 play a significant role in reducing milk fat synthesis
through inhibitory effects on mammary gene expression (Peterson et al., 2003). This
mechanism would explain the decrease in milk fat concentration conferred by FO
supplementation, in combination with effects of diet upon milk yield and milk fat
yield (Capper et al., 2008). Hence, use of dietary FO in the dairy diet has to be
carefully balanced to avoid milk fat depression and increase the nutritional value of
milk fat.
It is becoming clear that the VA and rumenic acid contents in milk fat depend not only
on dietary forage-to-concentrate ratio and carbohydrate sources, but also on amounts
and types of supplementary oils, with FO being most effective in small quantities.
Efforts should be made to reduce the level of other 18:1 trans and CLA isomers
because no beneficial effect has so far been attributed to these isomers (Cruz-
Hernandez et al., 2007).

105
This experiment helps to understand the basis of the beneficial effect of adding oils to
the ruminant diet on FA composition plasma and lipoprotein fractions. However, a
better understanding of how ruminal biohydrogenation is modified via differential
toxicity to ruminal bacteria of different PUFA including the FO fatty acids is needed.
If we can understand how selective FA toxicity, or indeed other factors, affects the
physiology of biohydrogenating bacteria in the rumen, we may be able to suggest new,
rational dietary modifications that will eventually lead to ruminant products that are
healthier for human consumption (Maia et al., 2010).
106
C h a p t e r 4
Using a bovine mammary epithelial
cell line (MAC- T) to study fatty acid
metabolism

107
CHAPTER 4
4. Using a bovine mammary epithelial cell line (MAC- T) to study fatty acid
metabolism
4.1 Introduction
Lipids in milk are present in fat globules formed chiefly of triacylglycerols enclosed
within a membrane derived from the secretory epithelial mammary cell (Jensen, 2002;
Heid and Keenan, 2005). Although the general outlines of lipid droplet formation,
growth, movement, and secretion are known, few studies have been performed on
lipid absorption and secretion in mammary gland cells (Ernens et al., 2007).
Selective uptake of lipoprotein fractions or specific FA could affect milk fat
composition by determining the substrates available for TAG synthesis (Offer et al.,
2001). The use of cell cultures allows studying specific aspects of lipid uptake without
the interference from the cow’s digestive system and general metabolism. The main
hypothesis being tested in this experiment was that LCFA and tFA might influence
TAG accumulation and FA profile in cytosol of mammary epithelial cells. The
objective was to elucidate how cytosolic TAG are accumulated and whether this is
influenced by tFA, SFA and UFA. This objective was achieved by adding different
FA to a FA-free medium used to culture MAC-T cells.
4.2 Material and methods
4.2.1 Cell culture
Bovine mammary epithelial cells (MAC-T; provided by Juan J. Loor, University of
Illinois, USA) were grown in HyQ RPMI-1640 media (Hyclone) supplemented with
foetal bovine serum (10%, F7524, Sigma) and ABAM (Antibiotic-antimycotic
solution; 10,000 units penicillin, 10 mg streptomycin and 25 μg amphotericin B per
ml; A5955, Sigma) in sterile 75 cm2 flasks coated with Poly-D-Lysine or Collagen I
(to ensure cell attachment and facilitate growth) (156472-Nunclon, Fisher Scientific).
Cultures were maintained in a water-jacket incubator at 37°C in the presence of 5%
CO2. Culture medium was changed every 48 h and cells were sub-cultured to 70 to
80% confluence (Figure 4.1) by rinsing once with 3 ml of 0.25% trypsin, and
incubated at 37°C until there was evidence of cell detachment. Trypsin activity was
inhibited by addition of 25 ml of fresh culture media at 37°C (Kadegowda et al. 2009).
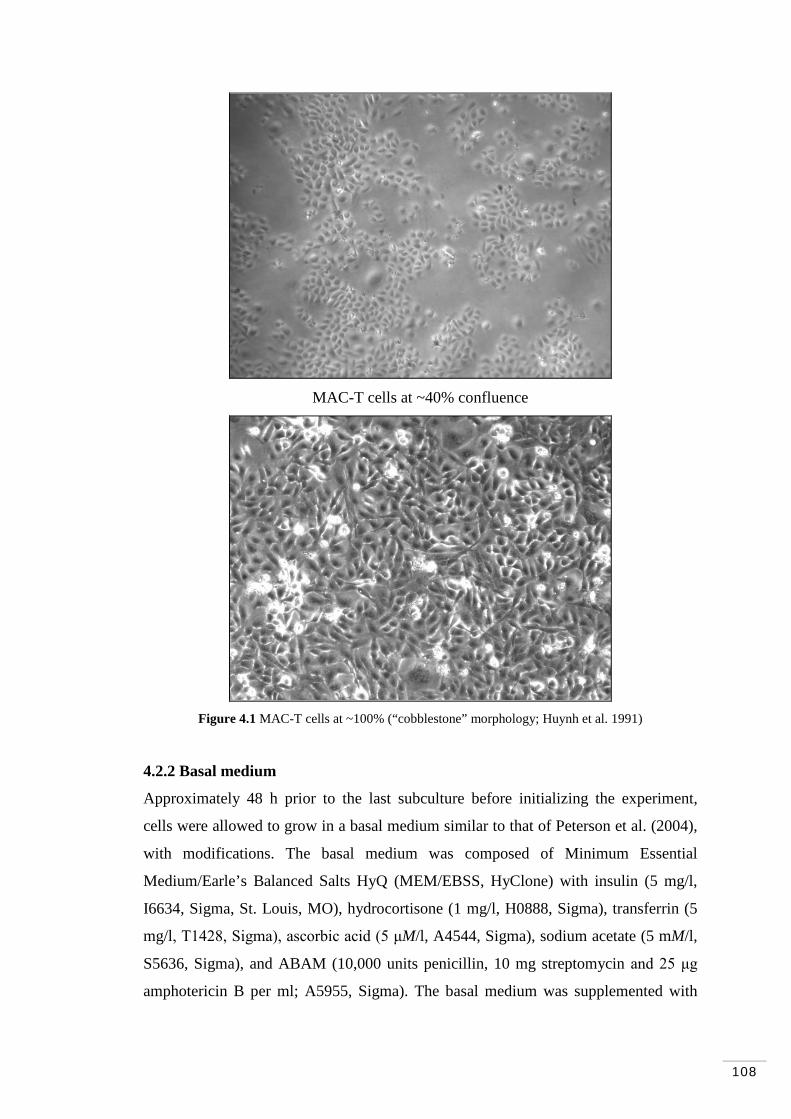
108
MAC-T cells at ~40% confluence
Figure 4.1 MAC-T cells at ~100% (“cobblestone” morphology; Huynh et al. 1991)
4.2.2 Basal medium
Approximately 48 h prior to the last subculture before initializing the experiment,
cells were allowed to grow in a basal medium similar to that of Peterson et al. (2004),
with modifications. The basal medium was composed of Minimum Essential
Medium/Earle’s Balanced Salts HyQ (MEM/EBSS, HyClone) with insulin (5 mg/l,
I6634, Sigma, St. Louis, MO), hydrocortisone (1 mg/l, H0888, Sigma), transferrin (5
mg/l, T1428, Sigma), ascorbic acid (5 μM/l, A4544, Sigma), sodium acetate (5 mM/l,
S5636, Sigma), and ABAM (10,000 units penicillin, 10 mg streptomycin and 25 μg
amphotericin B per ml; A5955, Sigma). The basal medium was supplemented with
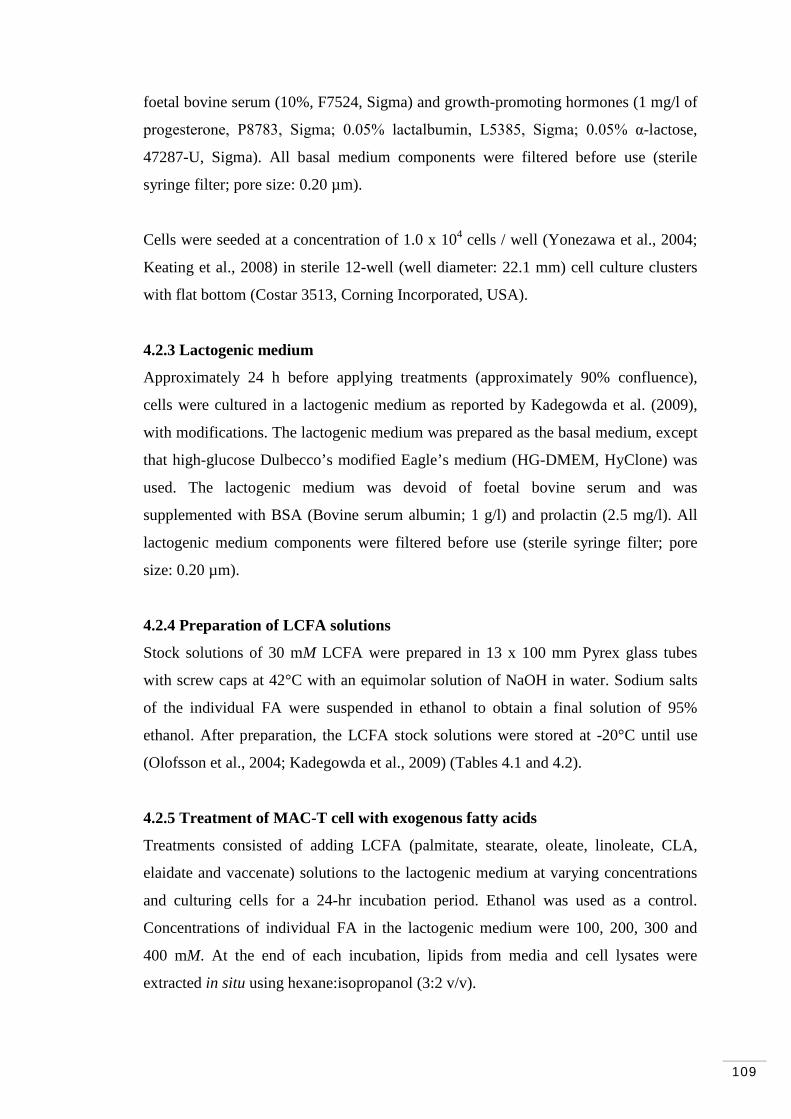
109
foetal bovine serum (10%, F7524, Sigma) and growth-promoting hormones (1 mg/l of
progesterone, P8783, Sigma; 0.05% lactalbumin, L5385, Sigma; 0.05% α-lactose,
47287-U, Sigma). All basal medium components were filtered before use (sterile
syringe filter; pore size: 0.20 µm).
Cells were seeded at a concentration of 1.0 x 10⁴ cells / well (Yonezawa et al., 2004;
Keating et al., 2008) in sterile 12-well (well diameter: 22.1 mm) cell culture clusters
with flat bottom (Costar 3513, Corning Incorporated, USA).
4.2.3 Lactogenic medium
Approximately 24 h before applying treatments (approximately 90% confluence),
cells were cultured in a lactogenic medium as reported by Kadegowda et al. (2009),
with modifications. The lactogenic medium was prepared as the basal medium, except
that high-glucose Dulbecco’s modified Eagle’s medium (HG-DMEM, HyClone) was
used. The lactogenic medium was devoid of foetal bovine serum and was
supplemented with BSA (Bovine serum albumin; 1 g/l) and prolactin (2.5 mg/l). All
lactogenic medium components were filtered before use (sterile syringe filter; pore
size: 0.20 µm).
4.2.4 Preparation of LCFA solutions
Stock solutions of 30 mM LCFA were prepared in 13 x 100 mm Pyrex glass tubes
with screw caps at 42°C with an equimolar solution of NaOH in water. Sodium salts
of the individual FA were suspended in ethanol to obtain a final solution of 95%
ethanol. After preparation, the LCFA stock solutions were stored at -20°C until use
(Olofsson et al., 2004; Kadegowda et al., 2009) (Tables 4.1 and 4.2).
4.2.5 Treatment of MAC-T cell with exogenous fatty acids
Treatments consisted of adding LCFA (palmitate, stearate, oleate, linoleate, CLA,
elaidate and vaccenate) solutions to the lactogenic medium at varying concentrations
and culturing cells for a 24-hr incubation period. Ethanol was used as a control.
Concentrations of individual FA in the lactogenic medium were 100, 200, 300 and
400 mM. At the end of each incubation, lipids from media and cell lysates were
extracted in situ using hexane:isopropanol (3:2 v/v).
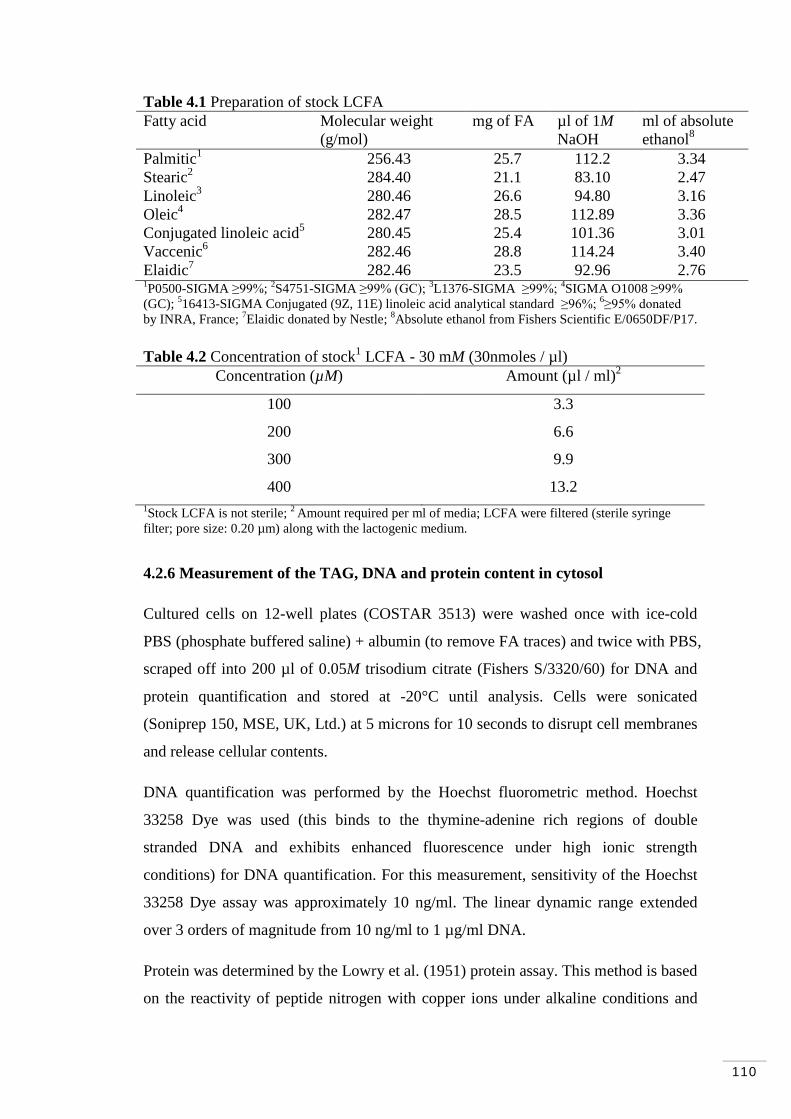
110
Table 4.1 Preparation of stock LCFA Fatty acid Molecular weight
(g/mol) mg of FA µl of 1M
NaOH ml of absolute ethanol8
Palmitic1 256.43 25.7 112.2 3.34 Stearic2 284.40 21.1 83.10 2.47 Linoleic3 280.46 26.6 94.80 3.16 Oleic4 282.47 28.5 112.89 3.36 Conjugated linoleic acid5 280.45 25.4 101.36 3.01 Vaccenic6 282.46 28.8 114.24 3.40 Elaidic7 282.46 23.5 92.96 2.76 1P0500-SIGMA ≥99%; 2S4751-SIGMA ≥99% (GC); 3L1376-SIGMA ≥99%; 4SIGMA O1008 ≥99% (GC); 516413-SIGMA Conjugated (9Z, 11E) linoleic acid analytical standard ≥96%; 6≥95% donated by INRA, France; 7Elaidic donated by Nestle; 8Absolute ethanol from Fishers Scientific E/0650DF/P17.
Table 4.2 Concentration of stock1
Concentration (µM) LCFA - 30 mM (30nmoles / µl)
Amount (µl / ml)2
100 3.3
200 6.6
300 9.9
400 13.2 1Stock LCFA is not sterile; 2 Amount required per ml of media; LCFA were filtered (sterile syringe filter; pore size: 0.20 µm) along with the lactogenic medium.
4.2.6 Measurement of the TAG, DNA and protein content in cytosol
Cultured cells on 12-well plates (COSTAR 3513) were washed once with ice-cold
PBS (phosphate buffered saline) + albumin (to remove FA traces) and twice with PBS,
scraped off into 200 µl of 0.05M trisodium citrate (Fishers S/3320/60) for DNA and
protein quantification and stored at -20°C until analysis. Cells were sonicated
(Soniprep 150, MSE, UK, Ltd.) at 5 microns for 10 seconds to disrupt cell membranes
and release cellular contents.
DNA quantification was performed by the Hoechst fluorometric method. Hoechst
33258 Dye was used (this binds to the thymine-adenine rich regions of double
stranded DNA and exhibits enhanced fluorescence under high ionic strength
conditions) for DNA quantification. For this measurement, sensitivity of the Hoechst
33258 Dye assay was approximately 10 ng/ml. The linear dynamic range extended
over 3 orders of magnitude from 10 ng/ml to 1 µg/ml DNA.
Protein was determined by the Lowry et al. (1951) protein assay. This method is based
on the reactivity of peptide nitrogen with copper ions under alkaline conditions and

111
the subsequent reduction of the Folin-Ciocalteay phosphotungstic acid to
heteropolymolybdenum blue by the copper-catalyzed oxidation of aromatic acids.
Concentration of the reduced Folin reagent was measured by absorbance at 655 nm.
Optical density was read using a microplate reader (Microplate Manager Bio-Rad
Laboratories, Inc.).
TAG in the cell lysates was extracted using hexane:isopropanol (3:2 v/v) and
quantified using a Triglyceride reagent (Infinity Triglyceride, Thermo Scientific,
TR22421). The linear range was 0 to 10 mmol/l (885 mg/dl). Optical density was read
using a microplate reader (Microplate Manager Bio-Rad Laboratories, Inc.). The
measurement wavelength was 550 nm and 655 nm for reference wavelength. Each
assay was performed in triplicate and repeated at least 3 times.
4.2.7 Fatty acid analysis from cells and media
Lipids from cells and media were extracted using an adaptation of the method of Bligh
and Dyer (1959) and methylated according to the method of Christie (1982) with
modifications by Chouinard et al. (1999). All chemicals and solvents used for these
methods were of analytical grade. For analysis of FA in cells and media, a GC system
(Agilent, GC 6890 series) equipped with a CP-Sil 88 fused-silica capillary column
(100 m x 0.25 mm i.d., with 0.2 µm film thickness; Varian Inc., Oxford) was used.
The GC conditions were as follows: the oven temperature was initially set at 110°C
for 4 min after injection, and then increased to 240°C with equilibration time of 2 min.
The inlet and flame-ionization detector temperatures were 260°C, the split ratio was
15:1 and a 2 µl injection volume was used. The hydrogen carrier gas flow to the
detector was 25 ml/min, airflow was 400 ml/min, and the flow of nitrogen makeup gas
was 40 ml/min. Fatty acid peaks were identified by using a fatty acid methyl ester
standard (FAME; Supelco 37 Component FAME mix, Bellefonte, PA) and a tFA
reference standard (trans 11- C18:1, methyl ester, Supelco, Bellefonte, PA). The
concentration of each FA (g/100g) was calculated for 16:0 to 22:6n3 FA with
concentrations higher than 0.3 g/100g.
112
4.3 Statistical analysis and design
Using the GenStat 12th statistical package (VSN International Ltd., Oxford); cytosolic
TAG, protein and DNA data was analyzed as Linear Mixed Models with fixed effects
of LCFA and concentration; the random effects were run, plate, strips and wells. In
the current experiment different runs (of which there were 8) were carried out to
obtain replication for each of the measurements. To avoid biased results, treatments
were added randomly to different wells (of which there were 408), strips (of which
there were 3 in each 12-well plate) and plates (of which there were 35) for each run.
Cytosolic fatty acid profile from cell and media data was analyzed as a Linear Mixed
Models with fixed effects of LCFA and concentration; the random effect was plate.
Data are reported as least square means ± SED across different concentrations (100,
200, 300 and 400 µM).

113
4.4 Results
4.4.1 Accumulation of cytosolic triacylglycerol
Addition of stearate, oleate, elaidate, vaccenate, linolate and CLA increased cytosolic
TAG (from 100 to 400 µM). Compared with control, cytosolic TAG was increased by
palmitate and elaidate. Compared with 100 µM (initial concentration), cytosolic TAG
content was increased by 300 and 400 µM. Concentration effect linearly increased and
had quadratic effect (Table 4.3 and Figure 4.2).
Table 4.3 Cytosolic triacylglycerol content (mmol / well) Concentration (µM) Fatty acid 100 200 300 400 SED2 P-value Control 0.39 0.35 0.37 0.44 0.062 <0.0013 Palmitate 0.46 0.43 0.43 0.57 Stearate 0.25 0.26 0.27 0.36
Oleate 0.38 0.45 0.64 0.71
Elaidate 0.35 0.35 0.50 0.66 Vaccenate 0.38 0.41 0.57 0.70 Linoleate 0.47 0.50 0.66 0.84 CLA1 0.28 0.52 0.68 0.97 Fatty acid effect Control 0.39 0.036 <0.0014 Palmitate 0.47 Stearate 0.28 Oleate 0.54 Elaidate 0.47 Vaccenate 0.51 Linoleate 0.61 CLA 0.61 Concentration effect (Lin)6 (Quad)7
Concentration 100 0.37 0.020 <0.0015 <0.001 <0.001 (µM) 200 0.41 300 0.51 400 0.65 1Conjugated linoleic acid; 2Standard errors of differences between means (calculated on variance scale); 3P-value represents the probability of a treatment-concentration interaction; 4P-value represents the probability of a treatment effect; 5P-value represents the probability of a concentration effect; 6Linear effect; 7Quadratic effect.
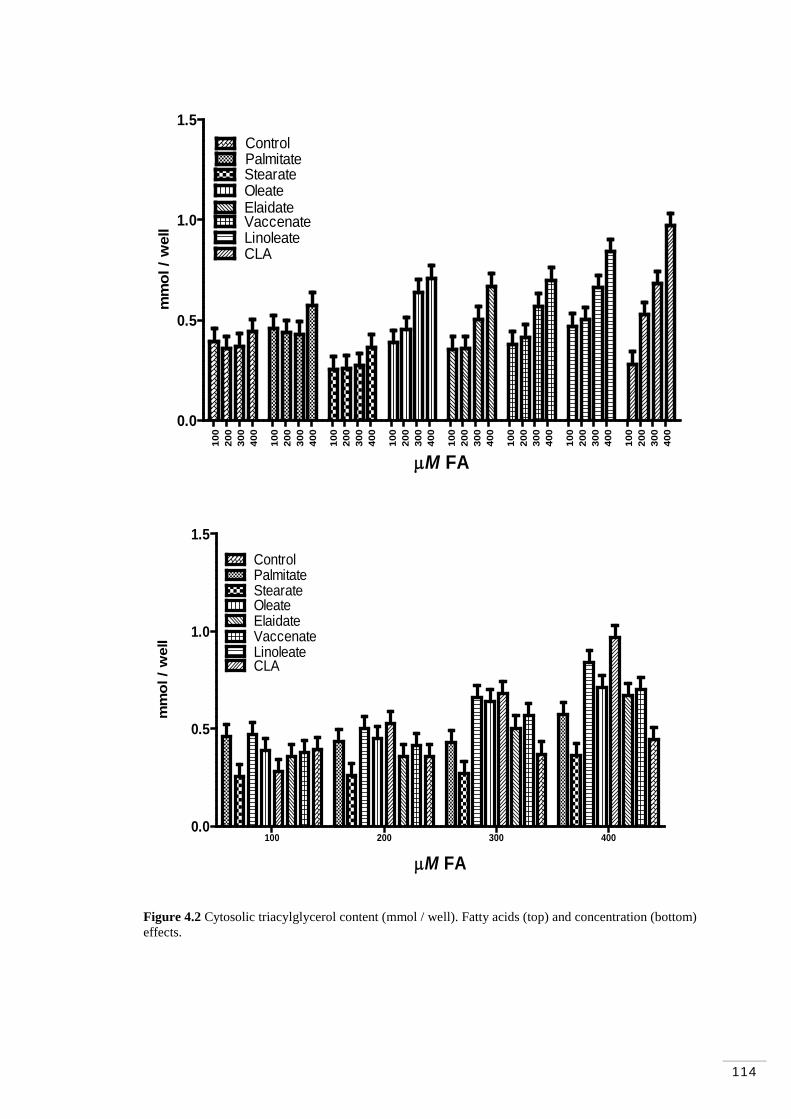
114
100
200
300
400
100
200
300
400
100
200
300
400
100
200
300
400
100
200
300
400
100
200
300
400
100
200
300
400
100
200
300
400
0.0
0.5
1.0
1.5
PalmitateStearate
Linoleate
Oleate
CLA
ElaidateVaccenate
Control
µM FA
mm
ol /
wel
l
100 200 300 4000.0
0.5
1.0
1.5
PalmitateStearate
Linoleate
Oleate
CLA
ElaidateVaccenate
Control
µM FA
mm
ol /
wel
l
Figure 4.2 Cytosolic triacylglycerol content (mmol / well). Fatty acids (top) and concentration (bottom) effects.

115
4.4.2 Cytosolic protein content
Compared with control, cytosolic protein content was increased by oleate, vaccenate
and linoleate. Cytosolic protein content was not affected by concentration or
treatment-concentration interaction (Table 4.4).
Table 4.4 Cytosolic protein content (mg / ml) Concentration (µM) Fatty acid 100 200 300 400 SED2 P-value Control 1.42 1.48 1.47 1.32 0.311 0.9473 Palmitate 1.84 1.63 1.40 1.25
Stearate 1.12 1.31 1.31 1.25
Oleate 2.33 2.47 2.53 2.55 Elaidate 1.57 1.57 1.64 1.56 Vaccenate 2.03 2.02 2.11 2.00 Linoleate 2.72 2.80 2.46 2.21 CLA1 1.36 1.29 1.48 1.35 Fatty acid effect Control 1.42 0.176 <0.0014 Palmitate 1.53 Stearate 1.25 Oleate 2.47 Elaidate 1.59 Vaccenate 2.04 Linoleate 2.55 CLA 1.37 Concentration effect (Lin)6 (Quad)7
Concentration 100 1.80 0.105 0.2985 0.045 0.398 (µM) 200 1.82 300 1.80 400 1.69 1Conjugated linoleic acid; 2Standard errors of differences between means (calculated on variance scale); 3P-value represents the probability of a treatment-concentration interaction; 4P-value represents the probability of a treatment effect; 5P-value represents the probability of a concentration effect; 6Linear effect; 7Quadratic effect.

116
4.4.3 Cytosolic DNA content
Compared with control, cytosolic DNA content was increased by vaccenate and
decreased by palmitate. Cytosolic DNA content was not affected by concentration and
there was no treatment-concentration interaction (Table 4.5).
Table 4.5 Cytosolic DNA content (µg / ml) Concentration (µM) Fatty acid 100 200 300 400 SED2 P-value Control 3.36 3.38 2.73 2.65 0.403 0.5423 Palmitate 2.87 2.37 2.32 1.86
Stearate 2.63 2.79 2.95 2.95
Oleate 3.08 2.77 3.26 2.83 Elaidate 2.80 2.89 2.92 2.94 Vaccenate 3.52 3.84 3.75 3.70 Linoleate 2.92 3.38 2.65 2.59 CLA1 2.70 2.82 2.80 2.78 Fatty acid effect Control 3.03 0.219 <0.0014 Palmitate 2.36 Stearate 2.83 Oleate 2.98 Elaidate 2.88 Vaccenate 3.70 Linoleate 2.89 CLA 2.78 Concentration effect (Lin)6 (Quad)7
Concentration 100 2.99 0.138 0.1875 0.044 0.303 (µM) 200 3.03 300 2.92 400 2.79 1Conjugated linoleic acid; 2Standard errors of differences between means (calculated on variance scale); 3P-value represents the probability of a treatment-concentration interaction; 4P-value represents the probability of a treatment effect; 5P-value represents the probability of a concentration effect; 6Linear effect; 7Quadratic effect.
117
4.4.4 Accumulation of cytosolic triacylglycerol normalized for protein content
Addition of palmitate, elaidate, vaccenate and linolate increased (from 100 to 400 µM)
cytosolic TAG content corrected for protein (µg of TAG / mg protein). Compared
with control, cytosolic TAG was increased by palmitate, vaccenate, linoleate and CLA.
Concentration effect linearly increased and had quadratic effect. Compared with 100
µM (initial concentration), cytosolic TAG content was increased by 300 and 400 µM
(Table 4.6 and Figure 4.3).
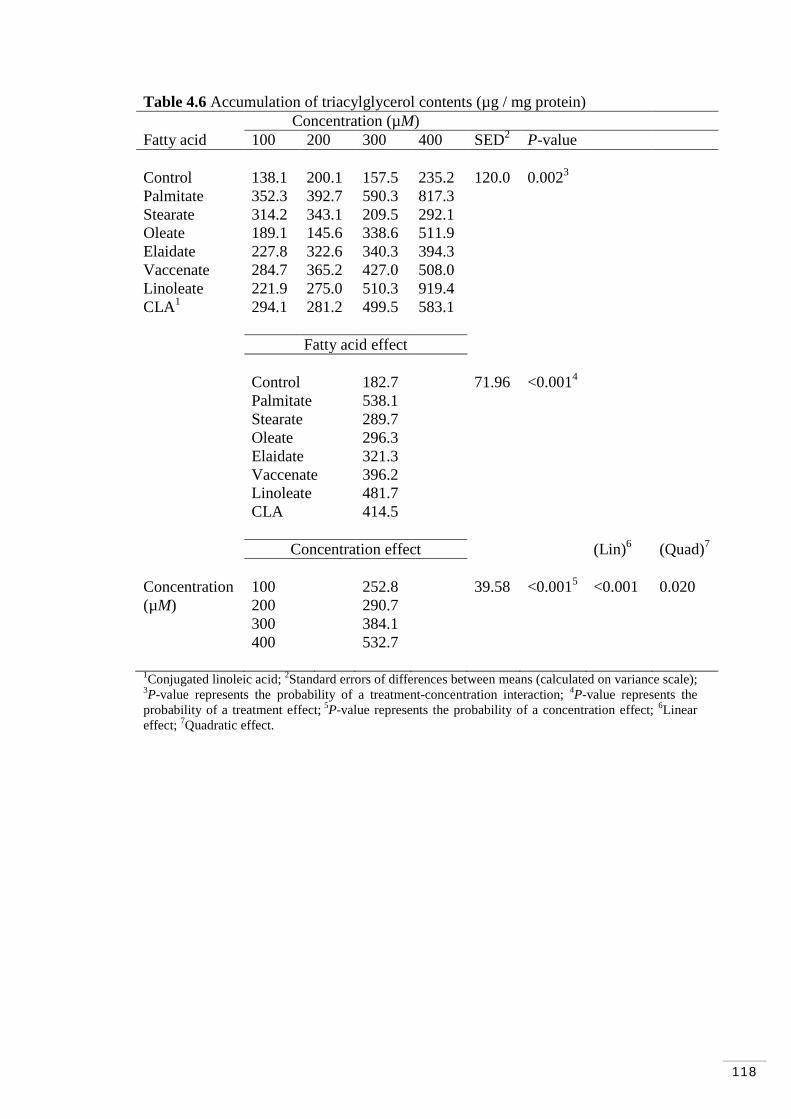
118
Table 4.6 Accumulation of triacylglycerol contents (µg / mg protein) Concentration (µM) Fatty acid 100 200 300 400 SED2 P-value Control 138.1 200.1 157.5 235.2 120.0 0.0023 Palmitate 352.3 392.7 590.3 817.3
Stearate 314.2 343.1 209.5 292.1
Oleate 189.1 145.6 338.6 511.9 Elaidate 227.8 322.6 340.3 394.3 Vaccenate 284.7 365.2 427.0 508.0 Linoleate 221.9 275.0 510.3 919.4 CLA1 294.1 281.2 499.5 583.1 Fatty acid effect Control 182.7 71.96 <0.0014 Palmitate 538.1 Stearate 289.7 Oleate 296.3 Elaidate 321.3 Vaccenate 396.2 Linoleate 481.7 CLA 414.5 Concentration effect (Lin)6 (Quad)7
Concentration 100 252.8 39.58 <0.0015 <0.001 0.020 (µM) 200 290.7 300 384.1 400 532.7 1Conjugated linoleic acid; 2Standard errors of differences between means (calculated on variance scale); 3P-value represents the probability of a treatment-concentration interaction; 4P-value represents the probability of a treatment effect; 5P-value represents the probability of a concentration effect; 6Linear effect; 7Quadratic effect.
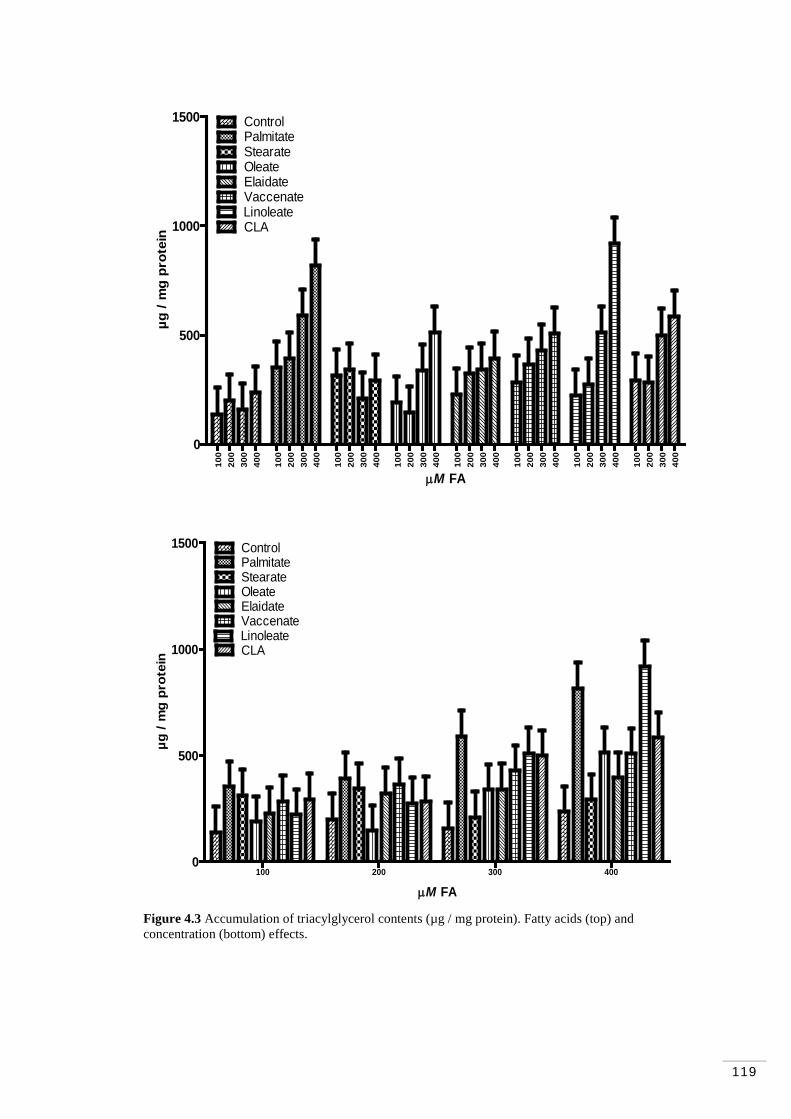
119
100
200
300
400
100
200
300
400
100
200
300
400
100
200
300
400
100
200
300
400
100
200
300
400
100
200
300
400
100
200
300
400
0
500
1000
1500PalmitateStearate
Linoleate
Oleate
CLA
ElaidateVaccenate
Control
µM FA
µg /
mg
prot
ein
100 200 300 4000
500
1000
1500PalmitateStearate
Linoleate
Oleate
CLA
ElaidateVaccenate
Control
µM FA
µg /
mg
prot
ein
Figure 4.3 Accumulation of triacylglycerol contents (µg / mg protein). Fatty acids (top) and concentration (bottom) effects.

120
4.4.5 Accumulation of cytosolic triacylglycerol normalized DNA content
Addition of palmitate, oleate, vaccenate and CLA increased (from 100 to 400 µM)
cytosolic TAG content (µg of TAG / µg of DNA). Compared with control, cytosolic
TAG content was increased by palmitate and CLA. Concentration effect linearly
increased and had quadratic effect. Compared with 100 µM (initial concentration),
cytosolic TAG content was increased by 300 and 400 µM (Table 4.7 and Figure 4.4).
Table 4.7 Accumulation of triacylglycerol contents (µg of TAG / µg of DNA) Concentration (µM) Fatty acid 100 200 300 400 SED2 P-value Control 137.8 126.2 139.9 183.8 28.59 0.0263 Palmitate 145.9 158.0 167.4 284.0
Stearate 126.6 115.5 115.0 140.1
Oleate 112.5 112.7 148.5 164.9 Elaidate 131.9 128.6 162.8 225.7 Vaccenate 105.7 109.8 129.9 165.2 Linoleate 126.9 114.8 175.1 235.8 CLA1 122.3 189.7 223.0 298.5 Fatty acid effect Control 146.9 15.60 <0.0014 Palmitate 188.8 Stearate 124.3 Oleate 134.7 Elaidate 162.3 Vaccenate 127.6 Linoleate 163.2 CLA 208.4 Concentration effect (Lin)6 (Quad)7
Concentration 100 126.2 9.81 <0.0015 <0.001 <0.001 (µM) 200 131.9 300 157.7 400 212.3 1Conjugated linoleic acid; 2Standard errors of differences between means (calculated on variance scale); 3P-value represents the probability of a treatment-concentration interaction; 4P-value represents the probability of a treatment effect; 5P-value represents the probability of a concentration effect; 6Linear effect; 7Quadratic effect.

121
100
200
300
400
100
200
300
400
100
200
300
400
100
200
300
400
100
200
300
400
100
200
300
400
100
200
300
400
100
200
300
400
0
100
200
300
400PalmitateStearate
Linoleate
Oleate
CLA
ElaidateVaccenate
Control
µM FA
µg o
f TA
G /
µg o
f DN
A
100 200 300 4000
100
200
300
400PalmitateStearate
Linoleate
Oleate
CLA
ElaidateVaccenate
Control
µM FA
µg o
f TAG
/ µg
of D
NA
Figure 4.4 Accumulation of triacylglycerol contents (µg of TAG / µg of DNA). Fatty acids (top) and concentration (bottom) effects.

122
4.4.6 Cytosolic fatty acid profile
4.4.6.1 Saturated fatty acids
• Cytosolic 16:0 concentration was decreased by linoleate (from 100 to 400 µM)
and CLA (from 100 to 400 µM).
• Cytosolic 18:0 concentration was decreased by CLA (from 100 to 400 µM).
• Cytosolic 20:0 concentration was increased by linoleate (from 100 to 400 µM),
but for other fatty acid treatments 20:0 remained below 1.5 g / 100g (from 100
to 400 µM) of fatty acid (See appendix 3).
4.4.6.2 Monounsaturated fatty acids and trans fatty acids
• Cytosolic 16:1 concentration was decreased by CLA (from 100 to 400 µM).
• Cytosolic 18:1 trans-9 concentration was increased by elaidate (from 200 to
400 µM); for other fatty acid treatments 18:1 trans-9 remained around 10 g /
100g from 100 to 400 µM of fatty acid or not detectable.
• Cytosolic 18:1 cis-9 concentration was increased by oleate (from 100 to 300
µM).
• Cytosolic 24:1 concentration was increased by palmitate (from 100 to 400 µM);
for all other fatty acid treatments 24:1remained below 2.5 g / 100g from 100 to
400 µM of fatty acid (See appendix 3).
4.4.6.3 Polyunsaturated fatty acids
• Cytosolic 18:2n-cis 6 concentration was increased by linoleate (from 100 to
400 µM) and decreased by palmitate (from 100 to 400 µM); for the other fatty
acid treatments 18:2n-cis 6 remained below 3.5 g / 100g from 100 to 400 µM
of fatty acid.
• Cytosolic CLA concentration was increased by CLA (from 100 to 400 µM);
for all other fatty acid treatments CLA remained below 5g / 100g from 100 to
400 µM of fatty acid or not detectable.
• Cytosolic 20:4n6 concentration was decreased by oleate, vaccenate, and
linoleate (from 100 to 400 µM); for all other fatty acid treatments 20:4n6
remained below 1.7g / 100g from 100 to 400 µM of fatty acid or not detectable
(See appendix 3).
123
4.4.6.4 Major fatty acid classes in cytosol
• MUFA concentration was increased by oleate (from 100 to 300 µM) and
elaidate (from 200 to 400 µM).
• PUFA concentration was increased by CLA (from 100 to 400 µM).
• SFA concentration was increased by linoleate (from 100 to 400 µM) and
decreased by CLA (from 100 to 400 µM).
• Trans fatty acid concentration was increased by vaccenate (from 100 to 300
µM) and elaidate (from 200 to 400 µM).
• UFA concentration was decreased by palmitate (from 100 to 300 µM), and
increased by oleate and CLA (from 100 to 400 µM) (See appendix 3).
4.4.7 Media fatty acid profile
4.4.7.1 Saturated fatty acids
• Media 18:0 concentration was decreased by palmitate (from 100 to 400 µM),
vaccenate (from 200 to 400 µM) and CLA (from 200 to 400 µM) and increased
by stearate (from 100 to 300 µM).
• Media 21:0 concentration was increased by stearate (from 100 to 300 µM)
(See appendix 3).
4.4.7.2 Monounsaturated fatty acids
• Media 18:1 cis-9 concentration was increased by oleate (from 200 to 400 µM)
and palmitate (from 100 to 300 µM) (See appendix 3).
4.4.7.3 Polyunsaturated fatty acids
• Media 18:2n-cis 6 concentration was increased by linoleate (from 100 to 400
µM); for the other fatty acid treatments 18:2n-cis 6 remained below 2.5 g /
100g from 100 to 400 µM of fatty acid.
• Media CLA concentration was increased by CLA (from 100 to 400 µM); for
all other fatty acid treatments CLA was not detectable (See appendix 3).
4.4.7.4 Major fatty acid classes in the media
• Media trans fatty acids concentrations were increased by elaidate and
vaccenate (from 100 to 400 µM) (See appendix 3).
124
4.5 Discussion
This experiment is the first to study effects of FA (SFA, UFA, PUFA and tFA) at
increasing concentrations on cytosolic TAG, protein and DNA contents, and FA
profiles in mammary gland epithelial cells. The design of the experiment allowed
analysis of cytosolic and media FA profiles whereas previous studies (Jayan and
Herbein, 2000; Peterson et al., 2004; Yonezawa et al., 2004; Keating et al., 2008;
Sorensen et al., 2008; Kadegowda et al., 2009; Thering et al., 2009; Kadegowda et al.,
2009) focussed on different aspects of mammalian physiology (i.e., enzymatic activity
and gene expression). This experiment contributes to knowledge on lipid metabolism
in bovine mammary gland cells and its biological significance in milk production
because it allowed the study of lipid uptake without the interference from the cow’s
digestive system and general metabolism.
Milk fat is assembled in the mammary alveolar cells from FA derived partly by de
novo synthesis from acetate within these specialized cells, and partly by absorption
from the blood. Lipids produced by lactating bovine mammary cells are distinctive,
which facilitates assessment of the biochemical fidelity of these cells when used in
vitro (Kinsella et al., 1968). MAC-T cells have normal physiological responses to
prolactin in that they produce milk constituents including α- and β- casein and lactose.
These cells thus provide a method of studying aspects of milk production in vitro
(Turner et al., 1993).
The design of the current experiment enabled examination of effects of different
LCFA including tFA on cytosolic TAG accumulation and protein and DNA
concentration. In the current experiment, control was used to show if there was any
effect of increasing amounts of ethanol. Concentrations of the individual FA were 100,
200, 300 and 400 µM. These concentrations were different from Jayan and Herbein
(2000; 25, 50 and 100 µM of FA) and Keating et al. (2008; 15, 20, 30, 35, 37.5 and
150 µM of FA) but similar to those used by Yonezawa et al. (2004, 2008; 50, 100, 200,
300 and 400 µM of FA). In the current study, lower concentrations (< 100 µM of FA)
were tested in a pilot experiment; however, cytosolic TAG accumulation was not
enough to be measured. In experiments of Keating et al. (2008) and Yonezawa et al.
(2004, 2008), FA were bound to bovine serum albumin. Albumin is the most abundant
125
serum protein and one of its main physiological functions is to bind and transport
LCFA (Spector, 1986). Based on previous studies (Olofsson et al., 2004; Kadegowda
et al., 2009; Thering et al., 2009), in the current experiment, ethanol was used to
dissolve sodium salts of FA to avoid additional limitations on LCFA uptake by
mammary epithelial cells (FA albumin binding process is selective due to varying
degrees of configurational adaptability to its binding sites as FA increase in length;
Ashbrook et al., 1975; Spector, 1975).
4.5.1 Cytosolic TAG accumulation (mmol / well)
Mammary epithelial cells accumulate TAG in their cytosol; in these cells, esterified
FA such as TAG are derived either from plasma lipids or by de novo synthesis from
acetate and butyrate (Clegg et al., 2001; Heid and Keenan, 2005). After lipoprotein
lipase hydrolysis all FA are absorbed as free FA. The main hypothesis of the current
experiment was that cytosolic TAG accumulation (mmol / well) may be stimulated by
addition of LCFA at different concentrations and that LCFA may affect the FA profile
of cytosolic FFA. In the current experiment palmitate and elaidate increased
accumulation of cytosolic TAG content. UFA treatments induced greater cytosolic
TAG accumulation than SFA treatments suggesting that SFA are subjected to another
metabolic pathway (or not absorbed by cells), and not either TAG synthesis or lipid
droplet formation (Yonezawa et al., 2004). In this experiment, treatment
concentrations linearly increased cytosolic TAG accumulation and had quadratic
effect; this agrees in part with the increase in a concentration dependent manner in
cytosolic TAG accumulation observed in primary cultured bMEC cells by Yonezawa
et al., (2004).
4.5.2 Cytosolic TAG accumulation normalized for protein (µg / mg protein) and
DNA (µg of TAG / µg of DNA) contents
In the current experiment, cytosolic TAG accumulation was normalized for protein
(µg / mg protein) and DNA contents (µg of TAG / µg of DNA). Usually in cell
cultures, protein content is used as cell proliferation indicator to eliminate variances
from cell cultures and allow data comparisons with greater confidence. Normalization
is a process by which data are corrected to remove sample-to-sample variability
caused by factors other than those being tested in the experiment. These factors
included variabilities in cell plating and pipetting inconsistencies (Schagat et al.,

126
2007). Because MAC-T cells synthesise protein for inclusion in milk, cytosolic TAG
accumulation normalized for protein may not be appropriate for this experiment.
However, each cell has a fixed amount of DNA, so DNA content per well reflects the
number of cells per well. Hence, when cytosolic TAG is corrected for DNA a measure
of TAG per cell can be obtained and this is why it is more accurate than normalising
for protein content.
In the current experiment, when cytosolic TAG was normalized for protein content
(µg / mg protein), palmitate, vaccenate, linoleate and CLA increased cytosolic TAG
content. This is in agreement with Yonezawa et al. (2004), who reported that palmitate,
and linoleate increased cytosolic TAG (µg / mg protein) in primary culture bovine
mammary epithelial cells isolated from the mammary gland of a 102-d-pregnant
Holstein heifer. However, in this experiment, cytosolic TAG accumulation (from
221.9 to 919.4 µg / mg protein) achieved by MAC-T cells was greater than Yonezawa
et al. (2004; from 54.8 to 122.6 µg / mg protein). In this experiment, treatment
concentrations linearly increased cytosolic TAG (µg / mg protein) accumulation and
had quadratic effect; this agrees in part with the increase in a concentration dependent
manner in cytosolic TAG accumulation observed in primary cultured bMEC cells by
Yonezawa et al., (2004).
On the other hand, in the current experiment, palmitate and CLA increased cytosolic
TAG adjusted for DNA content (µg of TAG / µg of DNA) and treatment
concentrations linearly increased cytosolic TAG and had quadratic effect. Previous
studies (Jayan and Herbein, 2000; Yonezawa et al., 2004, 2008) did not quantify
cytosolic DNA contents.
As Yonezawa et al. (2004, 2008), in this experiment, MAC-T cells were left for a 24 h
incubation period. In the current experiment, sodium salts of LCFA were prepared
using ≥99% (GC) purity, and suspended in absolute ethanol whereas Yonezawa et al.
(2004, 2008) prepared their treatments (palmitate, stearate, oleate and linoleate)
coupled with 0.5% FA free bovine serum albumin. In the study of Jayan and Herbein
(2000), FA (stearic, oleic and vaccenic acids) were bound to bovine serum albumin,
all media contained a basal concentration of 100 µM stearic acid and the cells were

127
left for a 3-d incubation period. In those studies, the chemical nature of the FA was
not described.
4.5.3 Cytosolic and media fatty acid profiles
Results from cytosolic FA profiles were consistent with most of the FA treatments
added to MAC-T cells. Oleate increased oleic acid (from 100 to 300 µM of FA),
elaidate increased EA (from 200 to 400 µM of FA), linoleate increased linoleic acid
(from 100 to 400 µM of FA), and CLA increased CLA (from 100 to 400 µM of FA).
In the current experiment, effects on cytosolic FA concentrations were not consistent
within FA classes (tFA, SFA and UFA):
• SFA treatments: palmitate decreased UFA
• Trans FA treatments: elaidate increased cytosolic MUFA and tFA
• UFA treatments: oleate increased MUFA and UFA; linolate increased SFA;
CLA increased PUFA and UFA and decreased SFA
In the current experiment, stearate increased stearic acid (from 100 to 300 µM of FA),
oleate increased oleic acid (from 200 to 400 µM of FA), linoleate increased linoleic
acid (from 100 to 400 µM of FA) and CLA increased α-linoleic acid (from 100 to 400
µM of FA), in media samples. Only tFA class was affected by treatments. Media tFA
concentrations were increased by elaidate and vaccenate (from 100 to 400 µM of FA).
Those results may be explained due to the media enrichment of each individual FA
added and perhaps the FA extraction method (Bligh and Dyer, 1959) included some of
the FFA added as well as TAG.
Perhaps the different effects of individual FA found in the current experiment may be
due to specific activity that each FA has on enzymes (acetyl-CoA carboxylase; ACC
and FA synthetase; FAS) involved in the biosynthesis of SFA and SCD responsible
for catalyzing biosynthesis of UFA from SFA precursors in MAC-T cells (Jayan and
Herbein, 2000). The ability for PUFA to down regulate the expression of genes for
enzymes involved in FA synthesis, including ACC, FAS and SCD, has been
recognised on membrane lipid composition (Salter and Tarling, 2007).
128
4.5.4 Cytosolic versus media fatty acid profiles Cytosolic stearate ranged from 34 to 46 g/100g whereas media ranged from 24 to 30
g/100g at 100 to 400 µM of FA. Cytosolic oleate ranged from 18 to 37 g/100g
whereas media ranged from 5 to 14 g/100g at 100 to 400 µM of FA. Cytosolic
linoleate ranged from 14 to 34 g/100g whereas media ranged from 2 to 11 g/100g at
100 to 400 µM of FA. Cytosolic CLA ranged from 6 to 38 g/100g whereas media
ranged from 2 to 12 g/100g at 100 to 400 µM of FA. The tFA concentrations were
decreased (from 0.1 to 13 g/100g) in media compared with cytosolic FA profiles
(from 2 to 50 g/100g).
Results from media FA profiles showed disappearance of some FA and that may
indicate which FA were not incorporated and absorbed into cytosol of MAC-T cells.
Only media FA profiles of stearate, oleate, linoleate and CLA were detected. Results
found in the currents experiment may be attributed to different roles of LCFA in
cellular metabolism. LCFA are taken up by cells and used for a large number of
biological functions such as energy generation and storage, LCFA also contribute to
phospholipid synthesis which are necessary for the structure, integrity and function of
plasma membranes. FA modulate the function of enzymes and regulate the expression
of multiple genes involved in FA metabolism (Hajri and Abumrad, 2002).
The cellular uptake of LCFA may be due to passive diffusion through the lipid bilayer
and protein-facilitated transport. The relative contribution of each component depends
on the concentrations and molar ratios of FA and albumin in the circulation (Hajri and
Abumrad, 2002). In the circulation and extracellular medium, FA are carried
quantitatively bound to albumin. Complexes of FA and albumin are used in uptake
assays in vitro because FA adsorption to assay tubes and pipette walls and FA
aggregation may have complications. In the absence of albumin or other FA binding
protein, the concentration of LCFA that can be used is very low and is depleted by
cells instantaneously; meaning that linear portion of the uptake time course would be
too short to measure (Hajri and Abumrad, 2002). In the current experiment, ethanol
used to dissolve sodium salts of FA probably affected FA uptake of LCFA (palmitic,
stearic, oleic, linoleic and conjugated linoleic acids) and tFA (elaidic and vaccenic
acids).
129
4.5.5 Cytotoxicity (lipotoxicity)
In the current experiment, LCFA did not decrease cytosolic protein (mg / ml) or DNA
(µg / ml) contents. However, it is well documented that accumulation of excess lipids
in tissues leads to cell dysfunction or cell death (Shaffer, 2003). When cells
accumulate more FFA than are required for anabolic or catabolic processes, excess
lipid is esterified and stored as TAG in lipid droplets. Although TAG accumulation is
essentially a condition of lipid overload, cellular TAG accumulation may initially
serve a protective role. Accumulation of excess FFA in TAG pools diverts these
molecules from pathways that lead to cytotoxicity and may thus serve as a buffer
against lipotoxicity (Shaffer, 2003).
4.5.6 Importance of FA groups on lipid metabolism
LCFA have numerous roles in biological functions of cells, not only as an energy
substrate but also as substrates for cell membrane synthesis and as precursors for
intracellular signalling molecules (McArthur et al., 1999). Excess LCFA are stored as
TAG in lipogenic tissues such as the adipose, liver, testis, ovary and the mammary
gland. In the lead up to-, and during lactation, energy metabolism of cells is
dramatically modified in order to enable synthesis of milk components (Barber et al.,
1997). Animals accordingly diminish the storage of nutrients, particularly of TAG, in
adipose tissue. The lactating mammary gland thus uses LCFA which are derived from
dietary fats and TAG released from the adipose tissue. Lactating mammary epithelial
cells are highly active in synthesis of FA de novo (Clegg et al., 2001). Bovine
mammary epithelial cells have the ability to produce a remarkable amount of lipid;
hence, this lipogenic capacity probably affected results from the current experiment
and influenced the transfer of some FA from cytosol to media by decreasing TAG
accumulation in cytosol.
In the current experiment, MAC-T cells incubated with SFA (palmitic and stearic
acids), UFA (oleic acid), PUFA (linoleic and conjugated linoleic acids), tFA (elaidic
and vaccenic acids), increased cytosolic TAG content; however, when TAG content
was normalised for cytosolic DNA content SFA (palmitic acid) and PUFA (CLA)
noticeably increased the amount of cytosolic TAG content. Hence, these findings may
indicate that mammary epithelial cells accumulate lipids depending on chain length of
the FA, degree of unsaturation and configuration.
130
Although activity of lipogenetic enzymes in mammary gland cells was not evaluated,
the findings (cytosolic and media FA profiles) from the present study may
complement previous studies. For example, Jayan and Herbein (2000) studied
exogenous factors that were related to the synthesis of SFA and UFA in MAC-T cells.
They analyzed effects of oleic and vaccenic acids on activities of ACC, FAS and SCD.
ACC and FAS are major enzymes involved in biosynthesis of SFA in eukaryotic cells
and SCD is responsible for biosynthesis of UFA from their saturated precursors. Jayan
and Herbein (2000) reported that VA depressed activity of ACC and FAS, along with
simultaneous enhancement of mammary desaturase activity and explained that the
effects of exogenous FA on ACC and FAS in MAC-T cells were related to the
biological function of FA in cells and tissues. For example, FA are components of cell
membranes, and FA provided in the media of cultured mammary epithelial cells are
primarily incorporated into cell membrane PL. Inhibition of lipogenesis in various
tissues by LC-UFA has been reported; in rats, oleic acid and VA inhibited hepatic
FAS activity and inhibited the conversion of glucose to lipids (Clarke et al., 1990).
Fatty acids are components of cell membranes, and FA provided in the media of
cultured mammary epithelial cells are primarily incorporated into cell membrane
phospholipids (Baughman, 1995). The relative amounts of SFA and UFA, as well as
the chain length of FA that constitute membranes, are important factors that determine
membrane fluidity. In general, fluidity has an inverse relationship to chain length and
a direct relationship to degree of unsaturation of FA. Jayan and Herbein (2000) noted
that excess incorporation of unsaturated oleic acid and VA into cell membranes,
especially at the expense of the corresponding saturated isomer, would increase
membrane fluidity above normal limits. SC-SFA have the same effect on membrane
fluidity as LC-UFA, meaning that both these groups enhance membrane fluidity when
compared with LC-SFA. Therefore inhibition of ACC and FAS activities by the
monounsaturated isomers could be a cellular response to reduce synthesis of SC-SFA.
4.5.7 Trans fatty acids in lipid metabolism
In the present study, at concentrations of 100, 200, 300 and 400 µM, EA and VA
increased cytosolic TAG content (mmol / well). Jayan and Herbein (2000) found a
concentration-dependent uptake of VA complexed to FA-free bovine serum albumin
131
at concentrations of 25, 50 and 100 µM; however, this is the first experiment using EA
on MAC-T cells.
Jayan and Herbein (2000) found that the position and geometry of the double bond is
a factor deciding the influence of UFA on lipogenic enzyme activity. When compared
with cis double bonds, trans double bonds have a more rigid structure and are less
fluid in nature. It is possible that VA may compete with oleic acid for incorporation
into cell membranes (oleic acid will be produced in bovine mammary epithelial cells
by desaturation of stearic acid). Excess incorporation of VA at the expense of oleic
acid would reduce fluidity of cell membranes and therefore enhanced synthesis of cis-
UFA from available substrates or precursors is prefered.
4.6 Conclusions
Overall, the results of this experiment demonstrate that cytosolic TAG accumulation is
stimulated by addition of palmitate and EA at different concentrations, which affects
FA profile of cytosolic FFA. Effects on cytosolic TAG accumulation are not
consistent within FA classes (tFA, SFA and UFA) but depend on individual FA
structure (chain length of the FA, degree of saturation and configuration, and number
and orientation of FA double bonds). At concentrations of 100, 200, 300 and 400 µM,
LCFA (palmitic, stearic, oleic, linoleic, elaidic, vaccenic and conjugated linoleic acids)
did not have detrimental effects on MAC-T cells as determined by cytosolic protein
and DNA content, presumably reflecting their role in lipid accumulation and secretion.
4.7 Implications
In this experiment, EA resulted to stimulate cytosolic TAG accumulation and based
on protein and DNA content it did not have deleterious effect on mammary gland cells.
This finding is important to dairy industry because it is known that MFD is caused by
direct inhibition of mammary lipogenesis by tFA formed during the biohydrogenation
of dietary UFA in the rumen.
Data reported in the current experiment enhances knowledge on the regulation of milk
fat synthesis which is vital to the development of nutritional strategies to improve the
nutritional value of milk, decrease milk energy secretion and improve the energy
balance of lactating ruminants. FA treatments used in the current experiment included
132
different lipid classes because in normal conditions dairy cow diets are supplied with
lipids containing different FA classes, however, TAG accumulation and uptake into
the mammary gland cell will depend on their individual structure.
Understanding the regulation of milk fat synthesis is vital to the development of
nutritional strategies to enhance the nutritional value of milk, decrease milk energy
secretion and improve the energy balance of lactating ruminants. The current
experiment did not assess enzymatic activity; however, it may be necessary to
evaluate activity of lipogenic enzymes in mammary gland cells due to its importance
on ruminal lipid metabolism and mammary specific regulation of cellular processes
(Shingfield et al., 2010).

133
C h a p t e r 5
General discussion and conclusions
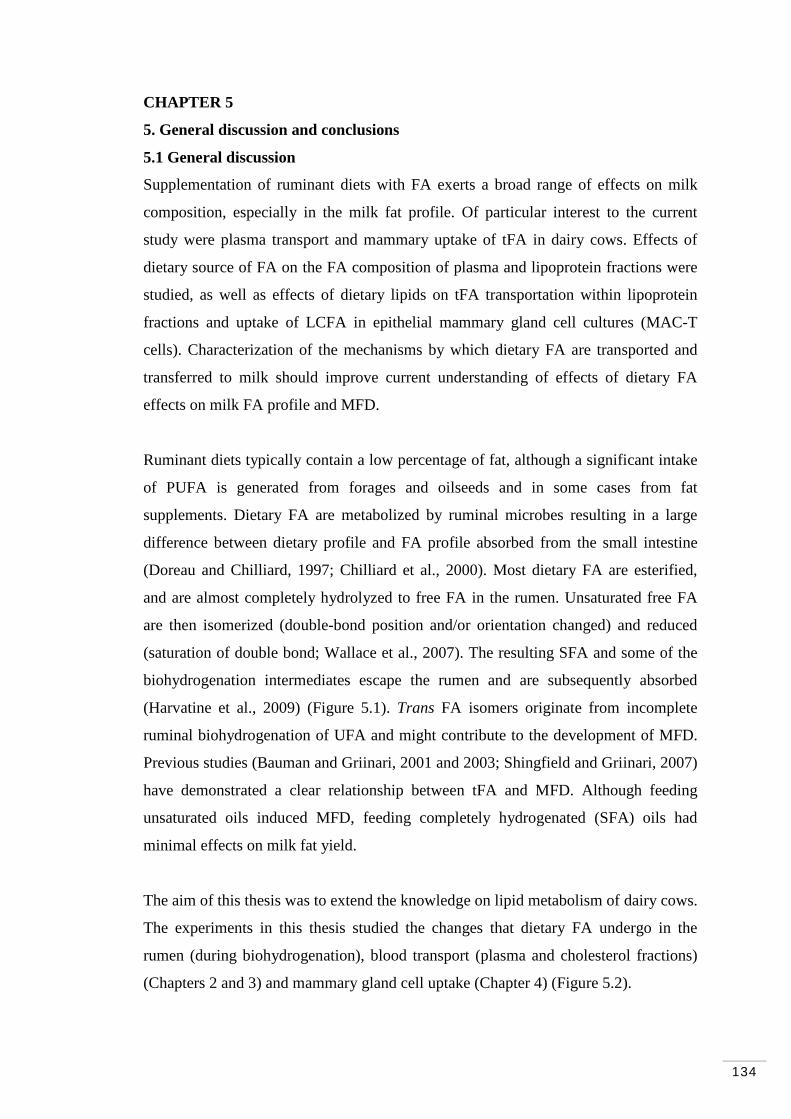
134
CHAPTER 5
5. General discussion and conclusions
5.1 General discussion
Supplementation of ruminant diets with FA exerts a broad range of effects on milk
composition, especially in the milk fat profile. Of particular interest to the current
study were plasma transport and mammary uptake of tFA in dairy cows. Effects of
dietary source of FA on the FA composition of plasma and lipoprotein fractions were
studied, as well as effects of dietary lipids on tFA transportation within lipoprotein
fractions and uptake of LCFA in epithelial mammary gland cell cultures (MAC-T
cells). Characterization of the mechanisms by which dietary FA are transported and
transferred to milk should improve current understanding of effects of dietary FA
effects on milk FA profile and MFD.
Ruminant diets typically contain a low percentage of fat, although a significant intake
of PUFA is generated from forages and oilseeds and in some cases from fat
supplements. Dietary FA are metabolized by ruminal microbes resulting in a large
difference between dietary profile and FA profile absorbed from the small intestine
(Doreau and Chilliard, 1997; Chilliard et al., 2000). Most dietary FA are esterified,
and are almost completely hydrolyzed to free FA in the rumen. Unsaturated free FA
are then isomerized (double-bond position and/or orientation changed) and reduced
(saturation of double bond; Wallace et al., 2007). The resulting SFA and some of the
biohydrogenation intermediates escape the rumen and are subsequently absorbed
(Harvatine et al., 2009) (Figure 5.1). Trans FA isomers originate from incomplete
ruminal biohydrogenation of UFA and might contribute to the development of MFD.
Previous studies (Bauman and Griinari, 2001 and 2003; Shingfield and Griinari, 2007)
have demonstrated a clear relationship between tFA and MFD. Although feeding
unsaturated oils induced MFD, feeding completely hydrogenated (SFA) oils had
minimal effects on milk fat yield.
The aim of this thesis was to extend the knowledge on lipid metabolism of dairy cows.
The experiments in this thesis studied the changes that dietary FA undergo in the
rumen (during biohydrogenation), blood transport (plasma and cholesterol fractions)
(Chapters 2 and 3) and mammary gland cell uptake (Chapter 4) (Figure 5.2).
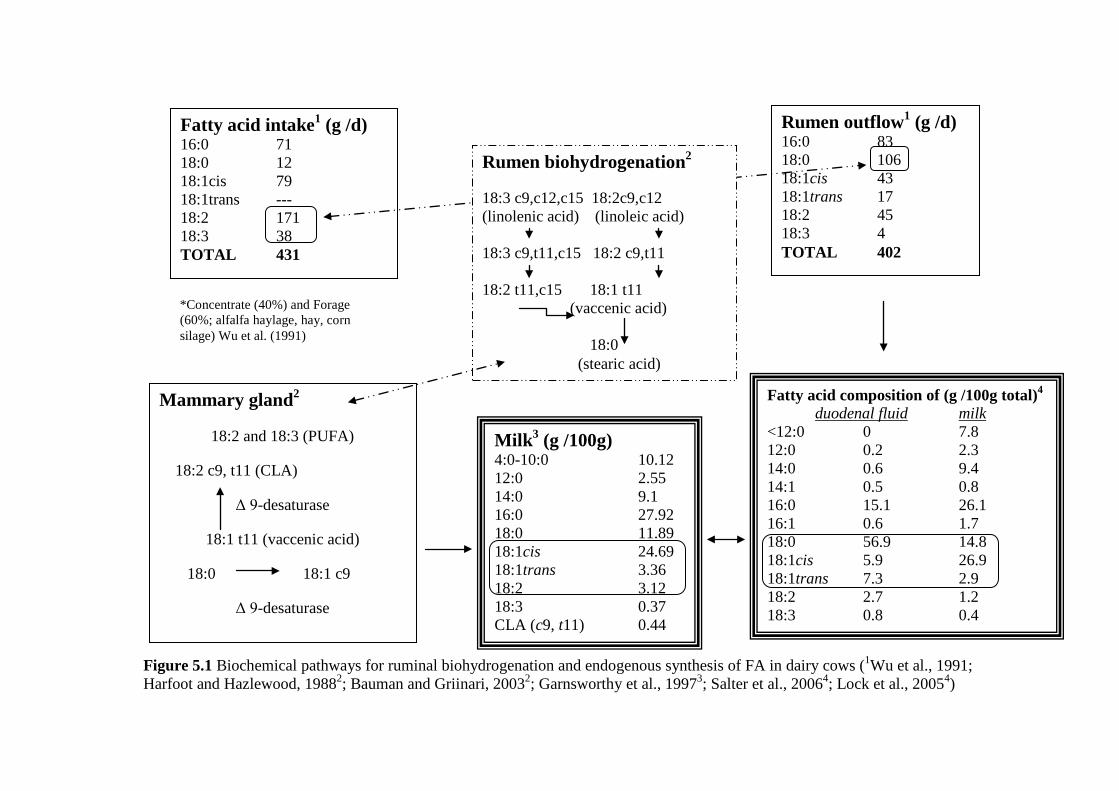
Figure 5.1 Biochemical pathways for ruminal biohydrogenation and endogenous synthesis of FA in dairy cows (1Wu et al., 1991; Harfoot and Hazlewood, 19882; Bauman and Griinari, 20032; Garnsworthy et al., 19973; Salter et al., 20064; Lock et al., 20054)
Rumen outflow1 (g /d) 16:0 83 18:0 106 18:1cis 43 18:1trans 17 18:2 45 18:3 4 TOTAL 402
*Concentrate (40%) and Forage (60%; alfalfa haylage, hay, corn silage) Wu et al. (1991)
Rumen biohydrogenation2
18:3 c9,c12,c15 18:2c9,c12 (linolenic acid) (linoleic acid) 18:3 c9,t11,c15 18:2 c9,t11 18:2 t11,c15 18:1 t11 (vaccenic acid) 18:0 (stearic acid)
Fatty acid intake1 (g /d) 16:0 71 18:0 12 18:1cis 79 18:1trans --- 18:2 171 18:3 38 TOTAL 431
Fatty acid composition of (g /100g total)4
duodenal fluid milk <12:0 0 7.8 12:0 0.2 2.3 14:0 0.6 9.4 14:1 0.5 0.8 16:0 15.1 26.1 16:1 0.6 1.7 18:0 56.9 14.8 18:1cis 5.9 26.9 18:1trans 7.3 2.9 18:2 2.7 1.2 18:3 0.8 0.4
Milk3 (g /100g)
4:0-10:0 10.12 12:0 2.55 14:0 9.1 16:0 27.92 18:0 11.89 18:1cis 24.69 18:1trans 3.36 18:2 3.12 18:3 0.37 CLA (c9, t11) 0.44
Mammary gland2
18:2 and 18:3 (PUFA)
18:2 c9, t11 (CLA)
Δ 9-desaturase
18:1 t11 (vaccenic acid)
18:0 18:1 c9
Δ 9-desaturase

Figure 5.2 The experiments in this thesis studied some of the changes that occur in dietary FA from mouth to mammary gland
Biohydrogenation Ruminal fluid:
• VFA • NH3 • pH
Mammary gland
Milk - LCFA
Small intestine
Ruminal wall
Liver
Dietary fatty acids Portal blood Jugular vein Plasma lipoproteins:
• HDL • LDL • VLDL
Blo
od c
apill
ary
Milk fat globule formed by TAG
Chy
lom
icro
n or
VLD
L
LCFA uptake in epithelial mammary gland cells (MAC-T)
• Cytosolic TAG • Cytosolic DNA and protein
Ruminal pulses Effects of dietary lipids on the transport of tFA among plasma and lipoprotein fractions
137
5.2 Ruminal pulses of dietary oils
Ruminal pulses were used in the experiments described in Chapters 2 and 3 in order to
include the impact of the biohydrogenation process on different 18:1 trans isomers.
Previous studies used abomasal (Loor and Herbein, 2001; Mosley et al., 2006;
Tyburczy et al., 2008) and duodenal (Chilliard et al., 1991, DePeters et al., 2001)
infusions to specifically avoid biohydrogenation effects on dietary treatments.
Supplementary oils did not bypass the rumen in these experiments and hence lipids
had extensive effects on rumen microorganisms, as indicated reflected by changes in
fermentation parameters, and on the biohydrogenation process, as indicated by plasma
and lipoprotein FA profiles.
Addition of lipids to the diet generally induces a decrease in ruminal degradation,
especially of fibre. There are several factors responsible for variations in ruminal
digestion (Doreau and Ferlay, 1992):
1) Nature of FA supplied in the diet
2) Percentage of lipids added to the diet, type of fat and any protection process
3) Nature of the basal diet (ruminal digestive disturbances are greater with
corn silage-based diets than with hay-based diets)
Numerous experiments with oil supplements have been carried out in recent years;
however, the effects of lipids are not completely explained by the factors just
mentioned. Therefore, ruminal pulses were chosen to test if FA profiles (particularly
tFA concentrations) of plasma and lipoprotein fractions are different depending on
source of the dietary lipids.
Fatty acids obtained after ruminal pulses resulted from extensive biohydrogenation of
unsaturated FA (Doreau and Ferlay, 1994; Glasser et al., 2008). Rumen pulses do not
bypass biohydrogenation hence FA supply to the duodenum will be more similar to
when oilseeds or oils are included in the diet. Therefore rumen pulses are more
representative of FA normally available to the animal. Post-ruminal infusions can be
used to test hypotheses about intestinal uptake, but they only mimic rumen protected
138
lipids (Glasser et al., 2008). In real production conditions, there is a loss of FA from
the rumen either by absorption across the ruminal epithelium or by catabolism to VFA
or C02. In addition, microbes synthesize FA de novo from carbohydrate precursors.
Therefore, lipids reaching the duodenum consist of FA from both dietary and
microbial origins (Jenkins, 1993).
The relative short treatment (single administration per day), sampling (3 d) and
washout periods (4 d) in Chapters 2 and 3 were selected to include the extensive
biohydrogenation effects on oil pulses that are often observed during the first few
hours after administration (Doreau et al., 1989). Oil administration method can affect
how long the oil remains in the rumen. With continuous infusion, oil concentration in
the rumen varied slightly throughout the day and night. With single administration, oil
concentration is higher during the first few hours after administration and lower
during the subsequent hours (Ferlay and Doreau, 1992). Because cows were ruminally
pulsed with less than 300 g/d of oil, a 3 d sampling period was chosen (adapted and
modified from Loor and Herbein, 2001; Kadegowda et al., 2008 and Castaneda-
Gutierrez et al., 2007) with a 4 d whashout period.
5.3 Ruminal fermentation
Dietary lipids rich in either PUFA or tFA alter the rumen environment. The data in
Chapters 2 and 3 indicated that dietary oil supplementation affects ruminal
fermentation in ruminants. In the first experiment, ruminal pulses of both SO (high in
PUFA) and PHVO (high in preformed tFA) reduced ruminal NH3-N and total VFA
concentrations, which suggests that dietary lipids inhibited microbial activity. On the
other hand in Chapter 3, FO (used to induce high concentrations of tFA, CLA and LC-
PUFA) resulted in higher concentrations of propionate than FO/PHVO (used to induce
high concentration of tFA) and there was no differential effect between them on
ruminal NH3-N and total VFA concentrations. The lack of FA treatment effects on
ruminal NH3-N and total VFA concentrations is in agreement with the findings of
Shingfield et al. (2010) who studied the effects of incremental amounts (0, 8, 16 and
24 g/kg of DM) of FO as a source of EPA and DHA on ruminal lipid metabolism and
duodenal flow of FA in steers fed maize silage-based diets. They reported that
inclusion of FO in the diet had no effect on rumen pH and NH3-N concentrations but
as in these experiments, tended to decreased total rumen VFA concentrations. The
139
effect of lipid supplementation on ruminal fermentation relies mainly on three factors:
firstly, the type of oil (Wachira et al., 2000), secondly, the level of oil inclusion in the
diet (Shingfield et al., 2008) and thirdly, the dietary forage:concentrate ratio, since
animals fed a concentrate-rich diet might be more likely to be adversely affected by
oil supplementation (Ueda et al., 2003). Dietary factors that affect ruminal
fermentation (e.g. high carbohydrate fermentability, high oil) modify ruminal FA
metabolism through complex associative effects that result in altered ruminal
microbial populations, altered pathways of PUFA biohydrogenation and ruminal
outflow of a wide range of biohydrogenation intermediates and this is reflected in the
milk FA composition. The predominant metabolic pathways and the microbial
capacity for isomerization and biohydrogenation depend on the microbial population
and the ruminal environment (Allen, 2000; Palmquist et al., 2005; Jenkins et al.,
2008). 18:1 trans isomers from ruminal biohydrogenation serve as precursors for the
synthesis of SFA in the rumen and of CLA within the tissues of the animal. For
example, VA is reduced in the rumen to form 18:0 or is desaturated by Δ9-desaturase
in the mammary tissue, producing 18:2 cis-9, trans-11, the most abundant CLA
isomer in milk (Griinari and Bauman, 1999). This isomer has been shown to have
antioxidant and anticarcinogenic properties (McDonald, 2000). Another CLA isomer,
18:2 trans-10, cis-12, which can be produced in the rumen, has been linked to
decreased body fat deposition in animals and humans (Blankson et al., 2000; Gavino
et al., 2000). This isomer has also been shown to be responsible for decreased milk fat
synthesis (Baumgard et al., 2000). Furthermore, the concentration of 18:1 trans-10 in
milk fat is directly correlated with milk fat depression (Griinari et al., 1998).
5.4 Plasma fatty acid profile
The biohydrogenation process had an extensive effect on concentrations of FA
observed in plasma and lipoprotein fractions. The main hypothesis being tested in
those experiments was that FA profiles of plasma and lipoprotein fractions would be
different depending on source of the dietary lipids (SO, PHVO and FO), which would
lead to differences in 18:1 trans isomers (Chapter 2 and 3). This hypothesis was
supported by the differences in the tFA isomers concentrations of plasma and
lipoprotein fractions, particularly in the LDL+VLDL (Chapter 2) and VLDL (Chapter
3) fractions.

140
Results from the in vivo experiments confirmed that treatments had the desired effect
on tFA concentrations of plasma and lipoproteins, for example, in Chapter 2
concentration of EA in PHVO was higher than SO because EA is the major trans
isomer found in PHVO (Meijer et al., 2001). On the other hand, undetectable VA
concentrations were observed in SO, but biohydrogenation resulted in high
concentrations of VA in plasma and lipoprotein fractions. Inclusion of vegetable oils
high in PUFA into concentrate diets raises VA and 18:2 cis-9, trans-11 content in
milk fat (Bauman et al., 2000; Shingfield et al., 2006). Compared with HDL fraction,
concentrations of tFA were increased almost 3-fold in LDL fraction. These results
indicate which lipoprotein fraction is involved in transportation of tFA. SO and PHVO
increased plasma concentrations of tFA. The increase in trans isomers across plasma
and lipoprotein fractions with SO and PHVO reflects modification of rumen microbial
population and pathways of biohydrogenation usually caused by supplementation with
dietary PUFA. Those changes promote formation and accumulation of
biohydrogenation intermediates, some of which are potent inhibitors of milk fat
synthesis (Bauman and Griinari, 2003).
In Chapter 3, compared with PHVO, FO increased VA in plasma and lipoprotein
fractions which is in agreement with AbuGhazaleh et al. (2007) who compared the
effect of FO and sunflower oil supplementation on milk CLA cis-9, trans-11 when
dairy cows were managed on pasture or in confinement. They found that FO and
sunflower oil supplementation resulted in higher milk VA, CLA cis-9, trans-11 and
lower 18:1 trans-10 concentrations and yields in pasture-fed cows compared with
confinement-fed cows. Likewise, Cruz-Hernandez et al. (2007) evaluated different
levels of inclusion of sunflower oil (1.5, 3 and 4.5 % of DM) and a constant level of
FO (0.5 % of DM) to increase VA and RA in milk and examine the content and
composition of CLA and 18:1 trans isomers, and found that supplementation of
sunflower oil and FO reduced milk fat but milk protein and lactose levels were not
affected.
Changes found in tFA isomers of plasma and lipoprotein fractions are a result of
biohydrogenation effects and type of oil pulsed. Trans FA and CLA isomers are the
predominant intermediates produced from ruminal metabolism of linoleic acid
(Harfoot and Hazelwood, 1988); however, ruminal biohydrogenation pathways are
141
dynamic, allowing the production of a wide range of positional and geometric isomers
as well as modified FA such as hydroxy and keto derivatives (Palmquist et al., 2005;
Jenkins et al., 2008). These isomers are absorbed and incorporated into milk fat,
thereby allowing the milk FA profile to be used as a proxy for changes occurring in
the rumen. Although linoleic acid give raise to different FA intermediates in the
biohydrogenation process, other PUFA including the long-chain n-3 FA are also
biohydrogenated and likely produce unique FA intermediates (Harvatine et al., 2009).
Milk fat depression induced by PUFA supplementation in lactating ruminants
(Peterson et al., 2003; Bauman et al., 2006) is caused by 18:1 trans isomers produced
as intermediates during ruminal biohydrogenation of 18:2n-6 which affect milk yield
and milk fat yield (Capper et al., 2008). Hence, supplementing oils in dairy cow diets
has to be carefully balanced to avoid milk fat depression and increase the nutritional
value of milk fat for human consumption.
5.5 Lipoprotein fractions
In Chapters 2 and 3, differences in tFA concentrations due to type of oil pulsed led to
major changes in most 18:1 trans isomers in plasma and lipoprotein fractions, this is
in agreement with observations in plasma by Loor and Herbein (2001) in which
ruminal infusions of CLA mixtures were used.
In Chapter 2, SO and PHVO increased 18:1 trans isomers in HDL and LDL+VLDL
fractions whereas FO and FO/PHVO increased 18:1 trans isomers in the VLDL
fraction in Chapter 3, that may be attributed to an inhibition of the biohydrogentation
reduction steps of 18:1 trans isomers to 18:0 by LC-PUFA present in SO, FO and
PHVO (Shingfield et al., 2003; AbuGhazaleh and Jenkins, 2004; Lee et al., 2005;
Loor et al., 2005; Or-Rashid et al., 2008).
In Chapter 2, concentrations of tFA were 2 times greater in LDL+VLDL than HDL
fraction; however, concentrations of tFA were 2 times greater in VLDL than HDL and
LDL fractions in Chapter 3. These results supported findings from Chapter 2 in which
further fractionation was suggested to distinguish between true LDL fraction and
chylomicrons, and VLDL that are also present in this fraction.
Overall, results from Chapters 2 and 3 showed that VLDL fraction is the main tFA
transport mechanism. Most of the FA is associated with TG (and perhaps
142
phospholipids). Normally, 70-90% of bovine plasma cholesterol is in the HDL
fraction; thus it is expected that the preponderance of tFA would also be in this
fraction (Herdt et al., 1995). However, if tFA are coming directly from the intestine,
they will be present in the chylomicron/VLDL fraction, but if they are incorporated
into tissues and then released again, they will be found in LDL (which is formed from
VLDL) and/or HDL fractions.
5.6 Fatty acid composition of the lipoprotein lipids
Results from Chapter 2 and 3 differ from those reported by Offer et al. (2001) because
treatments were administrated as ruminal pulses and were exposed to a direct ruminal
biohydrogenation rather than being supplemented in the diet. The differences between
FA profile of oils supplied as ruminal pulses is another factor that may explain the
variation in concentrations of certain FA within each lipid sub group (Ashes et al.,
2000; Offer et al., 2001). For example, DePeters et al. (2001) attributed changes in
carbon number for TG structure to high proportions of LCFA and medium chain FA
associated with canola oil infused either in the rumen or abomasum. Also, stage of
lactation has an important effect on FA utilization needed to satisfy specific energy
requirements and this may be reflected in the FA profile of lipoprotein lipid subgroups
found in our in vivo experiments (non-lactating cows) compared with those reported
by Offer et al. (2001) (mid-lactational cows). The results presented make an important
contribution to our understanding of the transfer mechanisms of long-chain PUFA
from diet to milk due to selective incorporation of FA into certain plasma lipoprotein
classes (i.e., cholesteryl esters, triglycerides, and phospholipids) which may be
ineffective in delivering FA to the mammary gland.
In Chapter 2, concentrations of LDL+VLDL-TG appeared to be the major lipid
subgroups carrying plasma lipids and tFA, however after further lipoprotein
separation (Chapter 3), concentrations of HDL-TG appeared to be the major lipid
subgroups carrying plasma lipids and LDL-CE the main lipid sub group involved in
the transportation of some 18:1 trans isomers (VA, EA and 18:2 trans6) in bovine
plasma. Approximately, more than 90% of plasma FA are carried by HDL fraction,
mainly in the CE and PL lipid subgroups (Offer et al., 2001), conversely, the
mammary gland appears to take up TAG from chylomicrons, VLDL and LDL
143
fractions, but not from HDL fraction, and it does not use esterified FA from LDL or
HDL fraction (Christie, 1981).
5.7 Cellular fatty acid metabolism
Findings from Chapter 4 enhance knowledge of lipid metabolism in bovine mammary
gland cells and its biological significance in milk production because they allowed the
study of lipid uptake without interference from the cow’s digestive system and general
metabolism. Chapter 4 reported effects of different FA groups (SFA, UFA, PUFA and
tFA) on concentrations on cytosolic TAG, protein and DNA contents to explore
whether there was any significant discrimination on absorption of exogenous FA by
mammary gland epithelial cells. The design of the experiment allowed analysis of
cytosolic and media FA profiles whereas previous studies (Jayan and Herbein, 2000;
Peterson et al., 2004; Yonezawa et al., 2004; Keating et al., 2008; Sorensen et al.,
2008; Kadegowda et al., 2009; Thering et al., 2009; Kadegowda et al., 2009) focused
on enzymatic activity and gene expression.
Although albumin complexes carry FA derived from stored TAG in adipose tissue
(Spector, 1986), based on previous studies (Olofsson et al., 2004; Kadegowda et al.,
2009; Thering et al., 2009), ethanol was used to dissolve sodium salts of FA to avoid
additional limitations (The FA-albumin binding process is selective due to varying
degrees of configurational adaptability to albumin binding sites as FA increases in
length; Ashbrook et al., 1975; Spector, 1975) for LCFA uptake by epithelial
mammary cells.
Information is also provided on LCFA metabolism from bovine mammary gland cells.
LCFA have many roles in the biological function of cells, not only as energy
substrates but also as substrates for cell membrane synthesis and as precursors for
intracellular signalling molecules. Excess LCFA are stored as TAG in lipogenic
tissues such as adipose, liver, testis, ovary or mammary gland. During the
periparturient period, the energy metabolism of cells is dramatically modified in order
to enable synthesis of milk components. Animals accordingly diminish storage of
nutrients, particularly TAG, in adipose tissue. The lactating mammary gland thus
utilizes LCFA which are derived from dietary fats and TAG released from adipose
tissue. Lactating mammary epithelial cells are also highly active in de novo FA

144
synthesis. Each gram of mammary gland tissue is known to produce 1 to 2 ml of milk
per day, and 2 to 600 g fat/l milk depending on the animal species. Thus, mammary
epithelial cells have the ability to produce a remarkable amount of lipid (Yonezawa et
al., 2008). When cells accumulate FFA for anabolic or catabolic processes, lipids are
esterified and stored as TAG in lipid droplets (Schaffer, 2003). Although it is known
that accumulation of excess lipids in many tissues leads to cell dysfunction or cell
death, LCFA and tFA treatments did not appear to have detrimental effects on MAC-T
cells as determined by cytosolic protein (mg / ml) and DNA (µg / ml) content,
presumably reflecting their role in lipid accumulation and secretion.
Palmitate and elaidate increased accumulation of cytosolic TAG (mmol/well) content.
However, Yonezawa et al. (2004) reported that palmitate, stearate, oleate and linoleate
increased cytosolic TAG (µg / mg protein) in primary culture bovine mammary
epithelial cells. UFA treatments induced greater cytosolic TAG accumulation than
SFA treatments suggesting that SFA are subjected to another metabolic pathway (or
not absorbed by cells), and not either TAG synthesis or lipid droplet formation
(Yonezawa et al., 2004).
Palmitate and CLA increased cytosolic TAG adjusted for DNA content (µg of TAG /
µg of DNA). However, previous studies (Jayan and Herbein, 2000; Yonezawa et al.,
2004, 2008) did not quantify cytosolic DNA content. Cytosolic TAG accumulation
was normalized for protein (µg / mg protein) and DNA content (µg of TAG / µg of
DNA). However, as each cell has a fixed amount of DNA, changes in DNA content
reflects the number of cells present. Hence, when cytosolic TAG is corrected for DNA
a measure of TAG per cell can be obtained and this is why it is probably more
accurate than normalising for protein content. Moreover, because MAC-T cells
synthesise protein for inclusion in milk, cytosolic TAG accumulation normalization
for protein may not be appropriate for this experiment.
When cytosolic and media FA profiles were compared, it was found that tFA
concentrations were decreased (from 0.1 to 13 g/100g) in media compared with
cytosolic FA profiles (from 2 to 50 g/100g). Compared with cytosolic FA profiles,
only stearate, oleate, linoleate and CLA were detected in media. These results are
attributed to different roles of LCFA in cellular metabolism. LCFA are taken up by

145
cells and used for a large number of biological functions such as energy generation
and storage, LCFA also contribute to phospholipid synthesis which is necessary for
the structure, integrity and function of plasma membranes. FA modulate the function
of enzymes and regulate the expression of multiple genes involved in FA metabolism
(Hajri and Abumrad, 2002).
The design of the current experiment was different to previous studies (Jayan and
Herbein, 2000; Yonezawa et al., 2004, 2008) in the following ways:
• Use of MAC-T cells
• Use of ethanol to couple FA treatments
• Individual FA concentrations
• Quantification of DNA (to normalise cytosolic TAG content)
The effects of FA treatments on cytosolic TAG accumulation and FA profiles found in
cytosol and media may be due to:
• Specific activity that each FA has on enzymes involved in FA
biosynthesis
• Competition between different FA for uptake
• Chain length of the FA, degree of saturation and configuration
• Number and orientation of FA double bond
• FA extraction might include some of the FFA added as well as TAG
5.8 Importance of the results shown in this thesis
Overall, results reported in this thesis are important in that they extend our knowledge
of lipid metabolism of dairy cows. In this thesis, the design of the experiments aided
understanding of how FA (especially tFA isomers) are transported in blood. On the
other hand, accumulation of TAG was studied in mammary epithelial cells to
comprehend how FA are metabolised and absorbed in mammary epithelial cells,
therefore findings from this thesis cover some aspects that help to understand
synthesis of milk FA. This is important because milk fat plays a central role in dairy
products and farm efficiency, fat is a major contributor to the energy concentration of
whole milk and is essential to many of the physical properties, manufacturing qualities
and organoleptic characteristics of dairy products.
146
From the producers’ perspective, milk fat represents a major component of the value
of milk, but it is also a significant portion of the energy cost of lactation. Fat is the
most variable component of milk and is affected by many factors including genetics,
physiological state and environment. However, milk fat is especially responsive to
nutrition, providing a practical tool to alter its yield and composition. Diet induced
MFD, or low-fat milk syndrome, is characterized by a decrease in milk fat yield of up
to 50%, with no change in milk yield or in the yield of other milk components
(Bauman and Griinari, 2001). MFD is classically observed in ruminants fed highly
fermentable diets or in diets that contain plant or FO supplements. MFD is also a
useful variable for evaluating herd management; in many cases onset of diet induced
MFD is an indication of modified ruminal fermentation and in more pronounced cases
this can be associated with ruminal acidosis and reduced ruminal efficiency (Bauman
and Griinari, 2001). Trans 18:1 isomers have received much less attention due to the
technical challenges of making purified preparations, however, in this thesis, oils high
in EA and VA were fed in vivo whereas purified EA and VA were used in cultured
mammary cell experiments.
In this thesis, VLDL fraction was found to be the lipoprotein responsible for the
transport of the majority of tFA. Traditionally, trans and saturated FA in milk fat have
caused concern among human health experts, although more recently milk fat has
garnered appreciation as a functional food due to the health-promoting potential of
some FA found specifically in ruminant-derived products (Bauman et al., 2006).
During recent decades, increasing emphasis has been placed on the contribution of
ruminant derived foods on the development or prevention of chronic human diseases
including cancer, cardiovascular disease and insulin resistance. Milk and dairy
products are the main source of 12:0 and 14:0 in the human diet and also provide a
major contribution to total 16:0 and tFA consumption in industrialized countries
(Givens and Shingfield, 2006). Production of ruminant milk with a FA profile more in
line with public health recommendations has the potential to improve long-term
human health without requiring substantial changes in consumer eating habits
(Shingfield et al., 2010). Findings reported in this thesis showed how tFA are
transported and accumulated into mammary gland epithelial cells hence these data can
be used to predict the amount of FA secreted in milk with positive human health
effects such as VA and CLA when cows are supplied with SO and FO.
147
Understanding the role of diet on milk fat synthesis and the underlying mechanisms
regulating mammary lipogenesis in ruminants is central to the formulation of diets
and/or supplements for strategic changes in milk fat content and composition.
Numerous reviews have considered the effect of nutrition on milk fat synthesis in
ruminants (Bauman and Griinari, 2003; Chilliard et al., 2007; Shingfield and Griinari,
2007), whereas several appraisals have considered possible molecular mechanisms
underlying diet-induced changes in mammary lipogenesis and fat secretion (Bauman
et al., 2008; Bernard et al., 2008; Harvatine et al., 2009). Recent evidence on factors
regulating mammary lipogenic enzyme activity and gene expression in ruminants is
also considered within the context of highlighting areas for further investigation and
providing an insight into the possible causes for variable milk fat secretion responses
to changes in diet composition between ruminant species (Shingfield et al., 2010).
5.9 Limitations
There are several factors affecting milk fat composition that were not studied in the
experiments described. Ruminant milk FA composition is linked to intrinsic (animal
species, breed, genotype, pregnancy and lactation stages) or extrinsic (environmental)
factors (Palmquist et al., 1993; Chilliard and Ferlay, 2004; Chilliard et al., 2007). In a
given animal species, the effects linked to breed or genotypes are significant but
restricted and they can only be achieved over long terms. For example, the effect of
lactation stage on milk fat content and FA composition is perceptible and mainly
associated to body fat mobilization in early lactation (Chilliard et al., 1991, 2007), but
it only lasts a few weeks each year.
Because non-lactating cows were used in Chapters 2 and 3; caution is needed when
data are extrapolated to real dairy production conditions. FA profiles reported in those
chapters may be different from lactating cows because milk fat composition is
affected by stage of lactation. More importantly, FA metabolism is affected by
lactation, which greatly increases metabolic demand for FA and precursors. At
initiation of lactation, cows are in negative energy balance, causing mobilization of
adipose FA and incorporation of these LCFA into milk fat. However, high uptake of
LCFA inhibits de novo synthesis of short chain FA by mammary tissue (Belyea et al.,
1990; Palmquist et al., 1993). For example, Auldist et al. (1998) found that milk from
148
early lactation (30 d) contained less short chain FA (4:0 to 12:0) than milk from
middle (120 d), and late (210 d) lactation periods in New Zealand cows. Such effects
were attributed to the physiological inability of dairy cows in early lactation to
consume enough dry matter to meet their energy requirements. Synthesis of 4:0 to
12:0 in the mammary gland increased during early lactation then decreased whereas
mobilization of FA from adipose tissue was increased (Palmquist et al., 1993; Jensen,
2002). Garnsworthy et al. (2006) reported variations in the concentration of milk
citrate (constituent of milk that affects milk processing characteristics) with regard to
stage of lactation. This fluctuation was associated to de novo synthesis of FA and
independent to diet and milk yield.
For any dietary strategy to be useful, it must not compromise rumen fermentation and,
concomitantly, dry matter intake and animal production and/or performance
(Lourenço et al., 2010). As in the present experiments, others have often report the
effect of different nutritional strategies on lipid metabolism, but no further information
is given on the impact of a particular strategy on the whole ruminal function and
adaptation processes. It may be possible that the 3-day pulsing periods used in
Chapters 2 and 3 were not enough to evaluate the extensive effects of oils (SO, FO
and PHVO) on ruminal microbiota given that in real production conditions the
ruminal microbial ecosystems can adapt to different diets and hence FA profiles
reported for plasma and lipoproteins may be underestimated (Fernando et al., 2010).
Moreover, extended pulsing periods could reflect time-dependent ruminal adaptations
to supplied lipids, which would lead to alterations in the formation of specific
biohydrogenation intermediates (tFA and CLA isomers) (Shingfield et al., 2006) and
might also affect the animal’s general metabolism and feed intake.
Despite the fact that ruminal pulses were used to study the effect of SO, FO and
PHVO on the biohydrogenation process, results may be more useful for dairy
production systems if cows were fed a total mix ration including those oils. Practically,
supplying dairy cow diets with supplements that increase VA production in the rumen
can improve the ratio of unsaturated to saturated FA in milk fat (Jayan and Herbein,
2000). In Chapter 4, EA and VA were used along with other purified FA treatments,
however in real dairy production conditions; supplementing cows with specific FA is
149
not possible because it would be too expensive. In dairy farms, feeding grass and
linseed is commonly used to increase VA production in the rumen.
Because in Chapter 4 ethanol was used to dissolve sodium salts of FA allowing FA
uptake into the cytosol of epithelial cells, cytosolic TAG, DNA and protein contents
may be different if FA treatments were bound to albumin.
5.10 Implications
Data reported in Chapters 2 and 3, showed that different sources of tFA (SO, FO and
PHVO) augmented tFA contents in HDL, LDL and VLDL fractions. Such findings
suggest that feeding cows with oils rich in UFA and tFA might produce milk with
high concentrations of FA undesirable for human consumption and reduce intake of
digestible energy (Harvatine and Allen, 2006), milk fat content and yield compared
with typical diets (Griinari et al., 1998; Piperova et al., 2000; Peterson et al., 2003;
Loor et al., 2005).
Milk fat depression induced by PUFA supplementation in lactating ruminants has
been reviewed in detail (Peterson et al., 2003; Bauman et al., 2006) and it is clear that
specific FA produced as intermediates during ruminal biohydrogenation of 18:2n-6
play a significant role in reducing milk fat synthesis (Peterson et al., 2003). This
mechanism would explain the decrease in milk fat concentration conferred by FO
supplementation, in combination with effects of diet upon milk yield and milk fat
yield (Capper et al., 2008). Hence, use of dietary SO and PHVO (Chapter 2) or FO
(Chapter 3) in the dairy diet has to be carefully balanced to avoid milk fat depression
and increase the nutritional value of milk fat.
Data reported in Chapter 4 enhances knowledge on the regulation of milk fat synthesis
which is vital to the development of nutritional strategies to improve the nutritional
value of milk, decrease milk energy secretion and improve the energy balance of
lactating ruminants. FA treatments used in Chapter 4 included different lipid classes
because in normal conditions dairy cow diets are supplied with lipids containing
different FA classes. Results from Chapter 4 showed that FA uptake of mammary
gland cells depends on FA individual chemical structures (chain length of the FA,
degree of saturation and configuration, and number and orientation of FA double
bonds). Likewise, results from tFA content in plasma and lipoprotein fractions in
150
Chapter 2 and 3 demonstrated that there are clear differences in their plasma transport
that may exert an effect on mammary uptake and utilization of 18-carbon FA, and
these results might be related to the location, orientation, and number of double bonds
(Tyburczy et al., 2008).
5.11 Future work
Overall, data presented in this thesis are helpful in understanding transport and
mammary uptake of tFA. However, further studies are needed to see if the same
responses are found in lactating cows and with different sources of FA.
Further studies are required to explore mechanisms by which PUFA exert their toxic
effects. If we can understand how selective FA toxicity, or indeed other factors,
affects the physiology of biohydrogenating bacteria in the rumen, we may be able to
suggest new, rational dietary modifications that will eventually lead to ruminant
products that are healthier for human consumption (Maia et al., 2010).
There is a growing concern about environmental impact of animal production systems,
for that reason, more research would be desirable to understand how dietary tFA
interact with methanogenic Archae. Manipulating metabolism of lipids in dairy cows
may be helpful to reduce environmental impact of dairy production systems. Plant oils
and oilseeds in ruminant diets decrease methanogenesis in ruminants (Machmüller et
al., 2003; Martin et al., 2008; Beauchemin et al., 2009). Due to the interrelationship
between diet composition, rumen metabolism and mammary lipogenesis, on-farm
feeding regimens for decreasing greenhouse gas emissions or altering milk FA
composition can also be expected to influence milk fat content (Chilliard et al., 2009)
depending on diet composition and ruminant species.
Understanding the regulation of milk fat synthesis is vital to the development of
nutritional strategies to enhance the nutritional value of milk, decrease milk energy
secretion and improve the energy balance of lactating ruminants. Molecular based
techniques have provided an insight into the molecular mechanisms underlying the
nutritional regulation of mammary lipogenesis in ruminants. Future experiments
examining changes in the mammary transcriptome should provide a more
comprehensive insight into the role of specific metabolites on milk fat synthesis in
ruminant species.
151
5.12 Conclusions
This thesis has studied some aspects of metabolism of FA in dairy cows, particularly
tFA concentrations in plasma and lipoprotein fractions. Comparison of plasma
lipoprotein fractions and FA profiles from cows subjected to ruminally pulsed
treatments was assessed to understand the effects of dietary lipids on transportation of
tFA among the plasma cholesterol fractions. LCFA uptake in epithelial mammary
gland cell cultures on MAC-T cells line was carried out to evaluate the effects of
lipids on the transportation of FA in epithelial mammary gland cell cultures.
The current study demonstrates that:
I. The LDL fraction is the main transport mechanism of tFA and is more
responsive to supply of tFA and PUFA and hence, tFA concentrations of
plasma and lipoprotein fractions can be changed by dietary lipids.
II. Dietary lipids rich in either PUFA or tFA can alter ruminal VFA and NH3-N.
III. SO (induced high VA production in plasma lipoproteins), PHVO (induced
high concentrations of tFA in plasma lipoprotein fractions) and FO
(interrupted biohydrogenation of C18 PUFA, resulting in increased production
of VA) can increase plasma and lipoprotein-fraction concentrations of tFA.
IV. Cytosolic TAG accumulation is stimulated by the addition of palmitate and
elaidate at different concentrations affecting FA profile of cytosolic FFA.
Cytosolic TAG accumulation depends on individual chemistry of FA (chain
length of the FA, degree of saturation and configuration, and number and
orientation of FA double bonds).
Overall, the information from this thesis, strengths understanding of some aspects of
milk fat synthesis (Chapter 4) and metabolism of FA in dairy cows and also, data from
this thesis can be used to predict milk FA profiles from cows fed with different
sources of tFA (SO and FO). Findings from this thesis are important because tFA in
milk fat have caused concern among human health researchers and more recently milk
fat has gained appreciation as a functional food due to the health-promoting potential
of some FA (VA and CLA) found specifically in ruminant-derived products
152
A p p e n d i x 1
Methods associated with in vivo experiments
• Plasma and lipoprotein fatty acid
analysis
• Plasma lipoprotein fractions
• Dialysis of lipoproteins
153
A.1.1 Fatty acid analysis of plasma and lipoprotein fractions
Preparation:
Make reagents up just before experiment is carried out and keep cool.
1. Rinse clean tubes with hexane and leave to dry.
2. Adequately label tubes.
Extraction:
3. Pipette 1ml of plasma directly into a labelled tube with screw cap.
4. Add known amount of pentadecanoic acid to tube (200µl).
5. Add 3.75ml of cold, freshly made chloroform: methanol (1:2) mix and vortex
for 1 min, 18ml chroloform + 36ml methanol (for 12 samples).
6. Add 1.25ml cold chloroform.
7. Add 1.25ml of HPLC water and mix (giving final extraction ratio of
chloroform: methanol: water as 10:9:9 v/v. Vortex for 1 min.
8. Centrifuge at 3400rpm at 15ºC for 15min.
9. Aspirate water above protein layer in test tube.
10. Collect lower organic chloroform phase, containing lipids into labelled tube
using a long form Pasteur pipette.
11. Dry down under a steady stream of nitrogen gas at 40ºC.
12. *Rinse walls of test tube with 1ml chloroform (extracted lipids at this time can
be stored in -20ºC).
Methylation:
13. Take tubes out of -20ºC and bring to room temperature, evaporate chloroform
to dryness.
14. Heat oxalic acid at 95ºC (in dessicator) for 30mins in oven.
15. Weigh out 0.2g of oxalic acid and add 6ml diethyl ether, this is the termination
reagent.
16. To make up 5ml methylation reagent: Use 900μl 30%NaOMe and 4.1ml
HPLC methanol. 450µl of NaOMe + 2.05ml Methanol (for 12 samples)
17. Add 2ml hexane to dried sample.
18. Add 40μl methyl acetate to each tube.

154
19. Add 40μl methylation reagent to each tube.
20. Close tube and vortex for 1min, let stand and leave to react for 10mins.
21. Add 60μl termination reagent.
22. Add ~200mg Calcium Chloride and vortex for 1 min, let stand for 1 h.
23. Centrifuge samples at 3400rpm (2400 x g) for 5mins at 15ºC.
24. Transfer top layer to GC vial and store at -20ºC (if injecting within 24hrs) or -
80ºC (longer-term storage) for injection into GC or analyse immediately.

155
A.1.2 Extraction of lipid from plasma and lipoprotein samples for thin layer
chromatography
1. Prepare 15ml Falcon tubes containing 5.4ml of hexane:isopronaponol (3:2, v/v)
and 3.6 of sodium sulphate (1g/15ml water).
2. Add 1ml of sample to appropriate labelled 15ml falcon tube.
3. Vortex for 30 sec to 1 min.
4. Centrifuge at 2000 rpm for 5 min at room temperature.
5. Transfer the top layer into a solvent-resistant LP tube.
6. Dry under nitrogen on a heating block until all the solvent has evaporated.
7. Pipette 1ml of hexane around the sides of the tube to wash them and then store
at -20°C until needed.
Thin layer chromatography (TLC)
1. Prepare TLC plate by lightly drawing a line across the plate, 2cm up from the
bottom. On this line, also mark 2cm in from each side of the plate. The
samples should not be loaded in these parts as the samples can run off the sides
if the plate does not run straight. Divide the line up into as many sections as
you need, leaving at least 1cm between each sample.
2. Prepare TLC tank by adding a solvent mix consisting of petroleum ether bp40-
60:diethyl ether:acetic acid (90:30:1) to a TLC tank and place lid on with a
weight on top. Let the solvent mix to react for 30 min before placing TLC
plates.
3. Load 50 µl of standard along a sample section using a positive displacement
pipette. Let sample dry between applications.
4. Load 50 µl to 100 µl of sample (depending on the amount of lipid in the
sample) onto the TLC plate and put into tank to run.
5. When the solvent had run to within 2cm of the top of the plate, remove and
allow drying before placing in a tank, containing iodine vapour, for staining.
The iodine vapour reacts with the unsaturated bonds in the fatty acids staining
them brown. Once stained, the bands have to be marked in the plate and left to
distain until all colours had disappeared. Only stain the standard and some of
the samples to localize the needed bands. For bovine plasma and lipoprotein
156
fractions iodine vapour has a negative effect and fatty acids are lost in the
staining process.
Extraction of lipids from TLC plates
Types of lipid and solvents to use;
Cholesterol ester: 2ml hexane:isopropanol (3:2, v/v) twice
Triacylglycerol: 2ml chloroform:methanol (2:1, v/v) twice
Phospholipid: 2ml chloroform:methanol (1:2, v/v) and,
then 2ml chloroform:methanol (1:5, v/v)
1. Scrape TLC plates into labelled vials fro extraction
2. Add required solvent mix and leave for 30 min agitating frequently but gently
3. Remove solvent to a labelled solvent resistant LP4 tube
4. Add another 2ml of solvent mix and leave for another 30 min as before
5. Remove solvent to tube containing previous solvent
6. Cap tube and centrifuge at 2000 rpm for 10 min at 4°C
7. Carefully remove solvent to another labelled methylation tube without
disturbing the silica in the bottom of the tube
8. Dry under nitrogen on a heating block until all the solvent has evaporated
Combine base-acid methylation of bovine plasma and lipoprotein fractions
1. Add 1ml toluene to dissolve lipid, and then add 2ml 0.5 M sodium
methoxide/methanol.
Place a Teflon-screw cap on the tube and thoroughly mix
0.5M = 2.7g sodium methoxide in 100ml methanol
2. Incubate at 60°C for 20 min with gentle shaking.
3. After 10 min, add 2ml 14% boron-tri-fluoride (BF3) in methanol and
recommence incubation for a further 20 min with gentle shaking.
157
4. After 10 min, allow samples to cool to room temperature before adding 5ml
distilled water.
5. Mix the samples well and add 2ml hexane. Leave samples until two well-
defined phases are seen (to aid separation centrifuge at 2000 rpm for 5 min at
room temperature).
6. Transfer the top fatty acid methyl ester (FAME) containing hexane layer into a
second methylation tube using a Pasteur pipette.
7. Dry combined hexane samples under nitrogen and re-dissolve in an
appropriate volume of hexane. Pipette into a gas chromatography vial and
store at -20°C until analysis.
158
A.1.3 Volatile fatty acid analysis
Preparation of metaphosphoric acid 25%:
• Mix 100ml Distilled water with 54.3g metaphosphoric acid.
Preparation of ruminal fluid for GC analysis:
• Centrifuge 10ml of ruminal fluid in15ml conical tubes @ 4000 rpm for 15mins.
• Mix 1ml of supernatant with 200µl 25% Metaphosphoric acid in an epindorf
tube (5:1 ratio).
• Incubate at room temperature for 30 minutes.
• Centrifuge epindorfs @ 12000 rpm for 10 minutes.
• Add to tightly capped GC vials for analysis (1µl).
• GC should have an oven temp of 200 ºC and a detector temperature of 250ºC.
159
A.1.4 Separation of lipoproteins from bovine plasma by Preparative Sequential
Ultracentrifugation
1- Invert each tube of bovine plasma samples to maximise homogeneity
2- Work out how much KBr needs to be added to serum sample to obtain
required density:
Volume of sample x (required density – initial density) ______________________________________________________
1 – (0.312 x required density)
50mls (volume of serum that we had) x (1.06 – 1.006) = _________________________________________________
1 – (0.312 x 1.06)
2.7 2.7 = _______________ = _______________ = 4.03g KBr
1-0.3307 0.6993
Calculations are based on the Radding-Steinberg Formula (1960)
3- Add KBr to plasma and gently mix (prevent bubbles where possible) to
dissolve salt.
4- Add solution to Beckman Quick-Seal® Tubes up to neck of tube:
5- Seal with the bench top tube sealer (ensure that you put metal caps on top of
tubes first)
6- Spin the tubes at 39000 rpm for 20 h (or 45000 rpm for 15 h but it will take
longer to slow down) under vacuum, at 12ºC using 70.1 Ti Rotor (Beckman
Optima Ultracentrifuge XL-70 – No brake).
7- After ultracentrifugation, carefully remove from centrifuge and carry upstairs.
8- Using the Kontron bench top tube slicer carefully cut each tube. Top layer is
mostly the LDL, VLDL and CM layer. Place tube into slicer with indentation
pointing towards the blade (make sure that the blade is fully back). Ensure the
tube is just sticking up a little and place your left thumb lightly over the top.
With your right hand turn the handle towards you and the blade will move
towards the tube. Once you have started cutting the tube, continue until you
have cut the tube completely.
160
9- Using forceps and the side of the tube holder lever the lid off. The fraction of
interest will be trapped in the chamber above the blade. Add contents of
chamber to collection tube. Rinse the top of the tube and the surface of the
tube slicer blade with a small amount of KBr solution (1.063g/ ml) and re-
pipette into collection tube, labelled LDL #.
10- Dry the blade with clean tissue paper and draw it back to expose the bottom
section of the tube. Using a different plastic Pasteur pipette, pipette some of
the lower tube into other collection tube. Very gently tease tube out of holder
and agitate serum proteins etc. *Very sticky so be careful not to block end of
pipette*. Rinse tube with KBr solution. Once all tubes are done, make
solution up to 40 ml with 1.24g/ ml KBr solution.
Adjust the density to 1.24 using calculation below:
40 x (1.21 – 1.06) 40 x 0.15 6
_______________ = _________ = _____ = 9.6g
1 – (0.312 x 1.21) 1 – (0.377) 0.623
11- Add salt to tubes and gently mix to minimise bubbles but making sure that
KBr dissolves.
12- Syringe each sample into labelled (HDL#) Beckman Quick-Seal®
ultracentrifuge tubes (polyallomer), using 5ml syringe and 19G x 1½”. Use
one syringe for each group. Top the tubes up with 1.24 KBr and heat seal as
before.
13- Spin the tubes in ultracentrifuge as before (39000rpm) but for double time (40
h or 45000rpm for 30 h). Ultracentrifuge takes about 4 hours to stop spinning
as no brake is used because it will disturb fractions.
14- Carefully cut the tubes as in stage 8.
15- Using a plastic Pasteur pipette (one for each group), pipette the top HDL
fraction into a labelled tube; rinse the top of the tube and the surface of the
tube slicer with a small amount of 1.24 KBr solution and re-pipette into
collection tube.
16- Dry the blade with clean tissue paper and draw it back to expose the bottom
section of the tube. Pipette some of the contents into another labelled
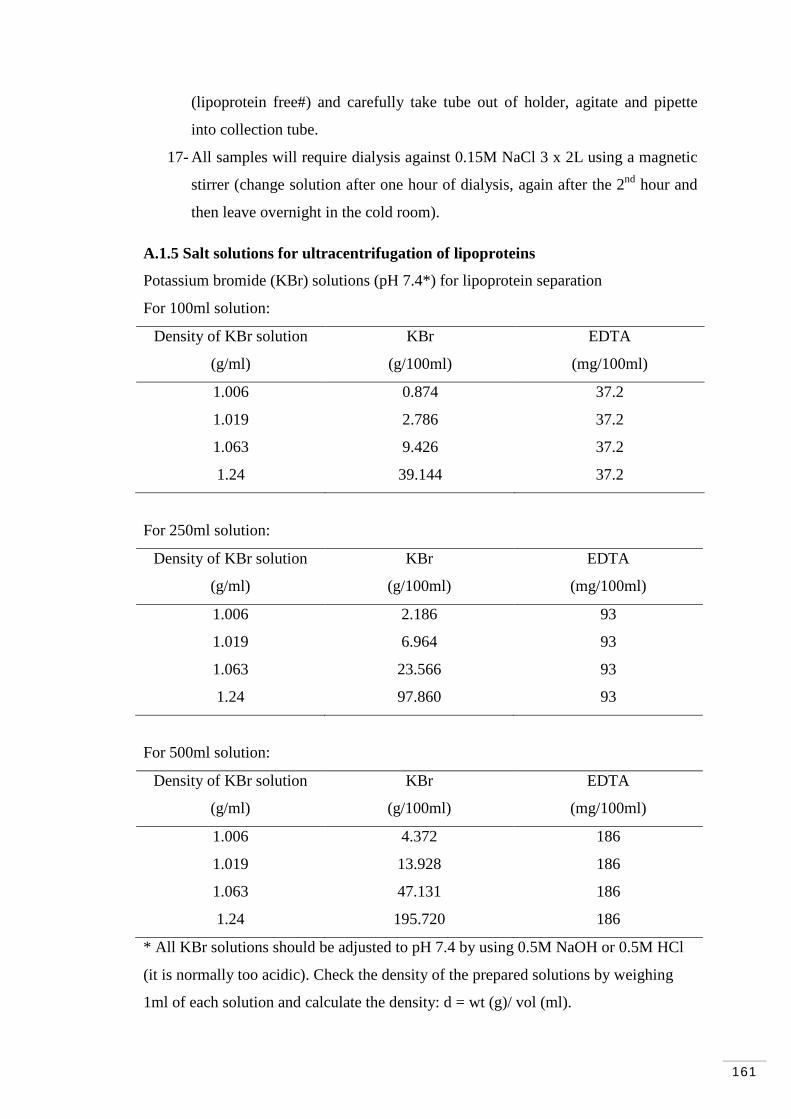
161
(lipoprotein free#) and carefully take tube out of holder, agitate and pipette
into collection tube.
17- All samples will require dialysis against 0.15M NaCl 3 x 2L using a magnetic
stirrer (change solution after one hour of dialysis, again after the 2nd hour and
then leave overnight in the cold room).
A.1.5 Salt solutions for ultracentrifugation of lipoproteins
Potassium bromide (KBr) solutions (pH 7.4*) for lipoprotein separation
For 100ml solution:
Density of KBr solution
(g/ml)
KBr
(g/100ml)
EDTA
(mg/100ml)
1.006 0.874 37.2
1.019 2.786 37.2
1.063 9.426 37.2
1.24 39.144 37.2
For 250ml solution:
Density of KBr solution
(g/ml)
KBr
(g/100ml)
EDTA
(mg/100ml)
1.006 2.186 93
1.019 6.964 93
1.063 23.566 93
1.24 97.860 93
For 500ml solution:
Density of KBr solution
(g/ml)
KBr
(g/100ml)
EDTA
(mg/100ml)
1.006 4.372 186
1.019 13.928 186
1.063 47.131 186
1.24 195.720 186
* All KBr solutions should be adjusted to pH 7.4 by using 0.5M NaOH or 0.5M HCl
(it is normally too acidic). Check the density of the prepared solutions by weighing
1ml of each solution and calculate the density: d = wt (g)/ vol (ml).
162
A p p e n d i x 2 Methods associated with cell
cultures
• In vitro treatments preparation
• Cytosolic fatty acid analysis
• Cytosolic protein, DNA and TAG quantification
163
A.2.1 MAC-T cell preparation for treatments
Growth medium
It is the media used for growth and maintenance of MAC-T cells
To prepare approximately 100 ml:
• 90 ml RPMI 1640 (comprised of amino acids and vitamins; medium was
developed by Moore et al., at Roswell Park Memorial Institute; RPMI)
(GIBCO/invitrogen 61870-044)
• 10 ml Foetal bovine serum (FBS)
• 1 ml ABAM (antibiotic-antimycotic solution; 10,000 units of penicillin, 10
mg streptomycin and 25 µg amphotericin B per ml)
Basal medium
Prepared approximately 48 h prior to the last subculture before initializing the experiment
To prepare approximately 25 ml:
22.5 ml Minimum essential medium (MEM) (HYCLONE)
62.5 µl Insulin (Sigma I6634-100 mg)
2.5 µl Hydrocortisone (Sigma H0888-1 g)
25 µl Transferrin (Sigma T1428-50 mg)
25 µl Ascorbic acid (Sigma A4544-25 g)
25 µl Sodium acetate (Sigma S5636-500 mg)
250 µl ABAM (Sigma A5955)
2.5 ml FBS (Sigma F7524)
2.5 µl Progesterone (Sigma P8783-1g)
12.5 mg Lactoalbumin (Sigma L5385-25 mg)
12.5 mg α-lactose (Sigma 47287-U)
164
Lactogenic medium
Prepared at approximately 24 h before applying cell treatments (approximately 90% confluence)
To prepare approximately 100 ml:
100 ml Dulbecco’s modified Eagle’s medium (DMEM) (Sigma D6429-500 ml)
250 µl Insulin
10 µl Hydrocortisone
100 µl Transferrin
100 µl Ascorbic acid
100 µl Sodium acetate
1 ml ABAM
100 mg Bovine serum albumin (BSA) (Sigma A4919-5 g)
10 µl Progesterone
50 mg Lactoalbumin
50 mg α-lactose
250 µl Prolactin (Sigma L6520-250 IU)
165
A.2.2 Preparation of LCFA solutions for cell cultures (example)
1. Prepare a 1 M solution of NaOH (e.g., 4 g in 100 mL PBS or water since
NaOH MW is 40)
2. Weigh an amount of 16:0 between 20 and 30 mg in a glass tube. Record
precisely the amount of the FA (eg., 26.1 mg, which divided by the MW
(256.42) = 101.8 μMoles)
3. Add to the glass tube a 112% μMoles of NaOH 1 M solution (e.g., 101.8
μMoles * 1.12 = 114 μMoles of NaOH = 114 μL of 1M NaOH solution) and
mix by swirling in a water bath at 42°C
4. Then add an amount of absolute ethanol to obtain a final solution of 30 mM
of 16:0 stock solution (e.g., the 101.8 μMoles in 1 L = 101.8 μM, in 1 mL =
101.8 mM, since 30 mM is needed, then 101.8/30 = 3.39 mL – 0.114 mL
(the NaOH solution) = 3.28 mL) has to be added. Mix well in the 42°C bath
until all the palmitate is dissolved before storing the stock at -20°C.
166
A.2.3 Fatty acid analysis of MAC-T cells
Extraction of lipid
1) From Media
• Collect media (1ml )
• In a solvent resistant tube add 0.8ml of media to 5.4ml of freshly prepared
hexane isopropanol (3:2 v/v) –mix well
• Add 3.6ml of 6.6% anhydrous sodium sulphate (w/v in water) – mix well
• Centrifuge briefly at room temperature to separate phases
• Collect top phase and dry down
• Take up in 1000µl of hexane and carry on with the procedure and preparation
of samples for GC analysis
2) From Cells
• After removing media wash cells with 3 x 1ml phosphate buffered saline (or
something similar)
• Add 1ml of freshly prepared hexane: isopropanol to each well and leave at
room temperature for 30 minutes
• Collect hexane: isopropanol into a solvent resistant tube
• Add a further 1ml of hexane:isopropanol to each well –mix and combine with
original 1ml
• Dry down and take up in 1000µl of hexane and carry on with the procedure
and preparation GC analysis
• Washed once with ice-cold PBS+albumin (to remove FA traces) and twice
with PBS
• Scrapped off into 200 µl of 0.05M trisodium citrate for DNA and protein
quantification and stored at -20°C until analysis After 10 min scrape the plate
with to dissolve remaining cell debris in the NaoH

167
A.2.4 Protein assay by method of Lowry et al. (1951)
BSA standards
Make BSA stock at 5 mg/ml
Protein (µg per 50 µl in well)
Concentration for standard (mg/ml)
Volume BSA (5mg/ml)
Volume H2O
10 0.2 0.2 4.8
20 0.4 0.4 4.6
30 0.6 0.6 4.4
40 0.8 0.8 4.2
50 1.0 1.0 4.0
60 1.2 1.2 3.8
Reagents (make up fresh using stocks)
1. Prepare reagent 1 using:
a. 5.0 ml 2% Na2CO3 in 0.1 M NaOH
b. 0.5 ml 1% CuSO4
c. 0.5 ml 2% KNa tartrate
2. Prepare reagent 2 using:
a. 0.5 ml Folins Ciocaltuae’s phenol reagent
b. 5.0 ml 0.1M NaOH
3. Prepare BSA standards into plate (0-50 µg in 50 µl)
4. Pipette approximate volume of sample (10-50 µl) per well (make up to 50 µl by addition of 40 µl distilled H2O
5. Add 150 µl 0.1M NaOH to all wells to make total volume of 200 µl per well
6. Add 50 µl of reagent 1 to all wells and pipette up and won to mix. Leave at room temperature for 5 min
7. Add 50 µl of reagent 2 and leave to stand for 20 min at room temperature
8. Read absorbance at 655 nm
168
A.2.5 DNA quantification – Hoechst fluorimetric method
Stock solutions
• 10x TNE buffer stock solution
12.11 g Tris base [Tris (hydroxymethyl) aminomethane], MW = 121.14 3.72 g EDTA, disodium salt, dihydrate, MW = 372.20
116.89 g NaCl, MW = 58.44
• 1mg/ml Hoechst dye solution (bisBenzimide H33258; SIGMA B2883-25 mg)
• 20 µg/ml calf thymus DNA (SIGMA D4522 1mg) in distilled water
Sample preparation
1. Scrapped off into 200 µl of 0.05M trisodium citrate (Fishers S/3320/60)
2. Centrifuge 2500 rpm at 4°C form 10 min
3. Store at -80°C for later analysis
Working solutions
• 2x TNE
• 2 µg/ml dye in 2x TNE
Add 30 µl of 1 mg/ml stock dye solution to 15 ml of 2x TNE and cover with foil to protect from light
Protocol
1. Prepare serial dilutions of stock standard to range from 20 to 0.0312 µg/ml
2. Add 100 µl of distilled water (blank), standard, or sample (10 µl sample diluted to 100 µl in distilled water) to each well
3. Add 100 µl dye solution to each well
4. Scan on fluorescent plate reader to assay amount of DNA
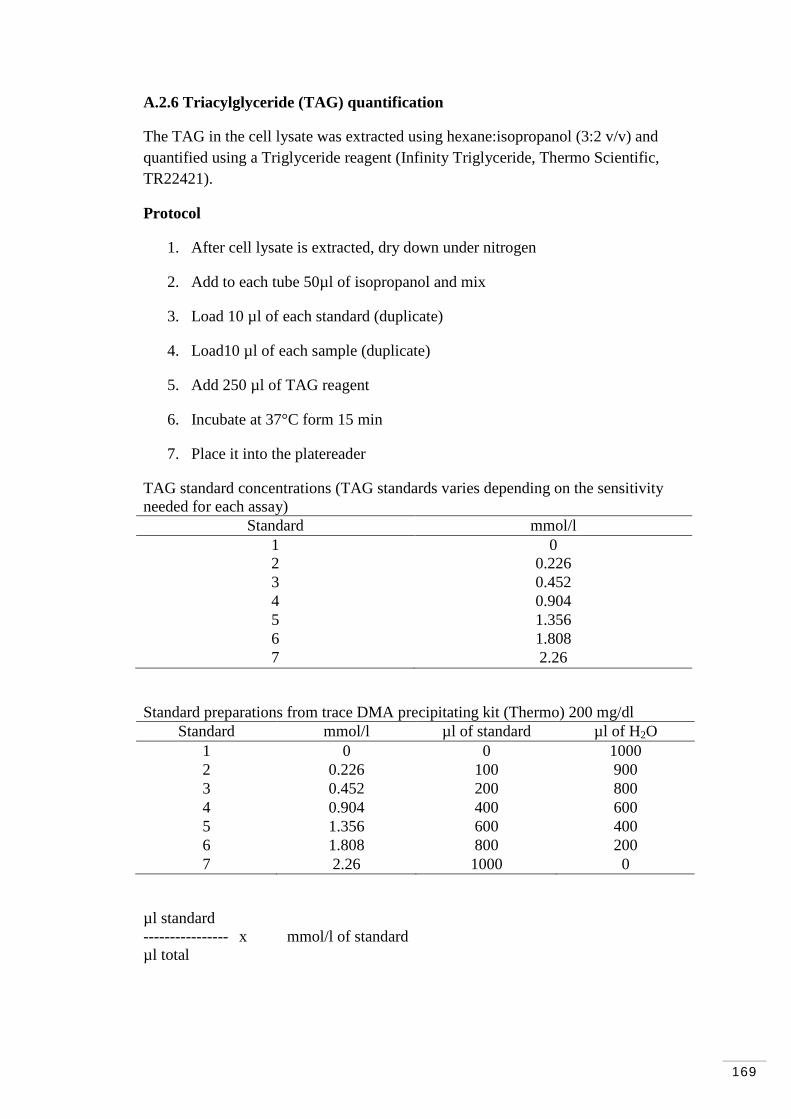
169
A.2.6 Triacylglyceride (TAG) quantification
The TAG in the cell lysate was extracted using hexane:isopropanol (3:2 v/v) and quantified using a Triglyceride reagent (Infinity Triglyceride, Thermo Scientific, TR22421).
Protocol
1. After cell lysate is extracted, dry down under nitrogen
2. Add to each tube 50µl of isopropanol and mix
3. Load 10 µl of each standard (duplicate)
4. Load10 µl of each sample (duplicate)
5. Add 250 µl of TAG reagent
6. Incubate at 37°C form 15 min
7. Place it into the platereader
TAG standard concentrations (TAG standards varies depending on the sensitivity needed for each assay)
Standard mmol/l 1 0 2 0.226 3 0.452 4 0.904 5 1.356 6 1.808 7 2.26
Standard preparations from trace DMA precipitating kit (Thermo) 200 mg/dl Standard mmol/l µl of standard µl of H2O
1 0 0 1000 2 0.226 100 900 3 0.452 200 800 4 0.904 400 600 5 1.356 600 400 6 1.808 800 200 7 2.26 1000 0
µl standard ---------------- x mmol/l of standard µl total
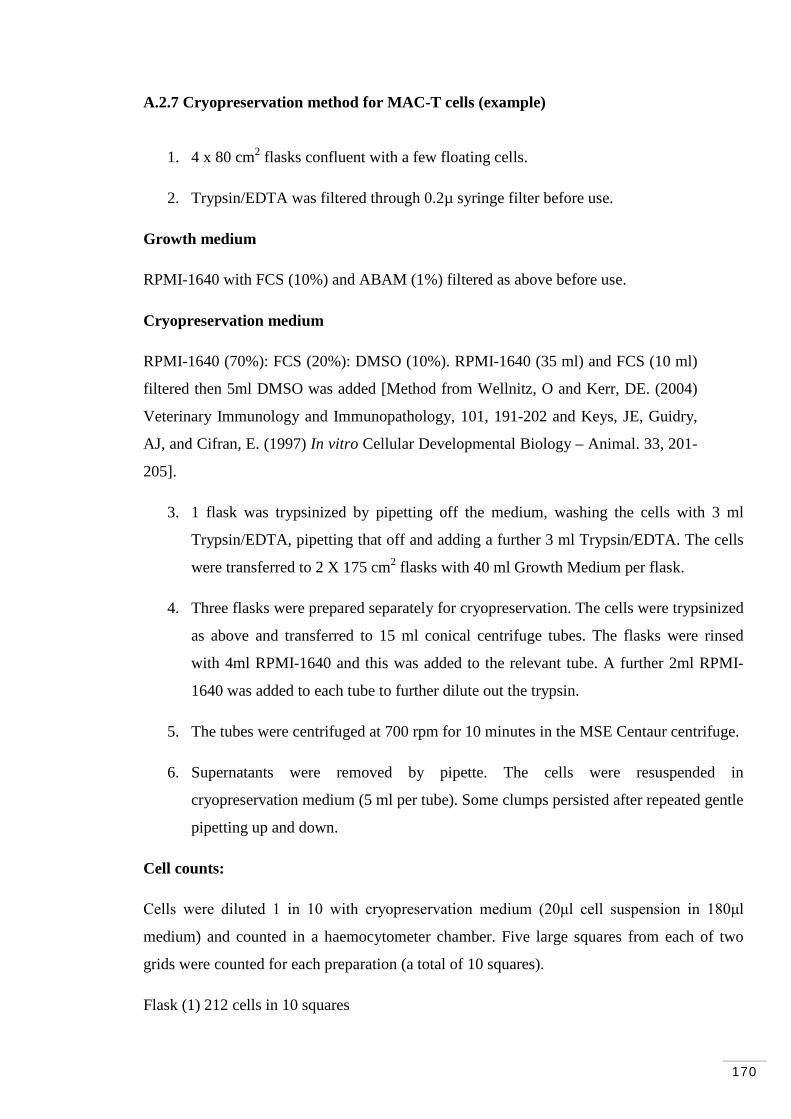
170
A.2.7 Cryopreservation method for MAC-T cells (example)
1. 4 x 80 cm2 flasks confluent with a few floating cells.
2. Trypsin/EDTA was filtered through 0.2µ syringe filter before use.
Growth medium
RPMI-1640 with FCS (10%) and ABAM (1%) filtered as above before use.
Cryopreservation medium
RPMI-1640 (70%): FCS (20%): DMSO (10%). RPMI-1640 (35 ml) and FCS (10 ml)
filtered then 5ml DMSO was added [Method from Wellnitz, O and Kerr, DE. (2004)
Veterinary Immunology and Immunopathology, 101, 191-202 and Keys, JE, Guidry,
AJ, and Cifran, E. (1997) In vitro Cellular Developmental Biology – Animal. 33, 201-
205].
3. 1 flask was trypsinized by pipetting off the medium, washing the cells with 3 ml
Trypsin/EDTA, pipetting that off and adding a further 3 ml Trypsin/EDTA. The cells
were transferred to 2 X 175 cm2 flasks with 40 ml Growth Medium per flask.
4. Three flasks were prepared separately for cryopreservation. The cells were trypsinized
as above and transferred to 15 ml conical centrifuge tubes. The flasks were rinsed
with 4ml RPMI-1640 and this was added to the relevant tube. A further 2ml RPMI-
1640 was added to each tube to further dilute out the trypsin.
5. The tubes were centrifuged at 700 rpm for 10 minutes in the MSE Centaur centrifuge.
6. Supernatants were removed by pipette. The cells were resuspended in
cryopreservation medium (5 ml per tube). Some clumps persisted after repeated gentle
pipetting up and down.
Cell counts:
Cells were diluted 1 in 10 with cryopreservation medium (20μl cell suspension in 180μl
medium) and counted in a haemocytometer chamber. Five large squares from each of two
grids were counted for each preparation (a total of 10 squares).
Flask (1) 212 cells in 10 squares
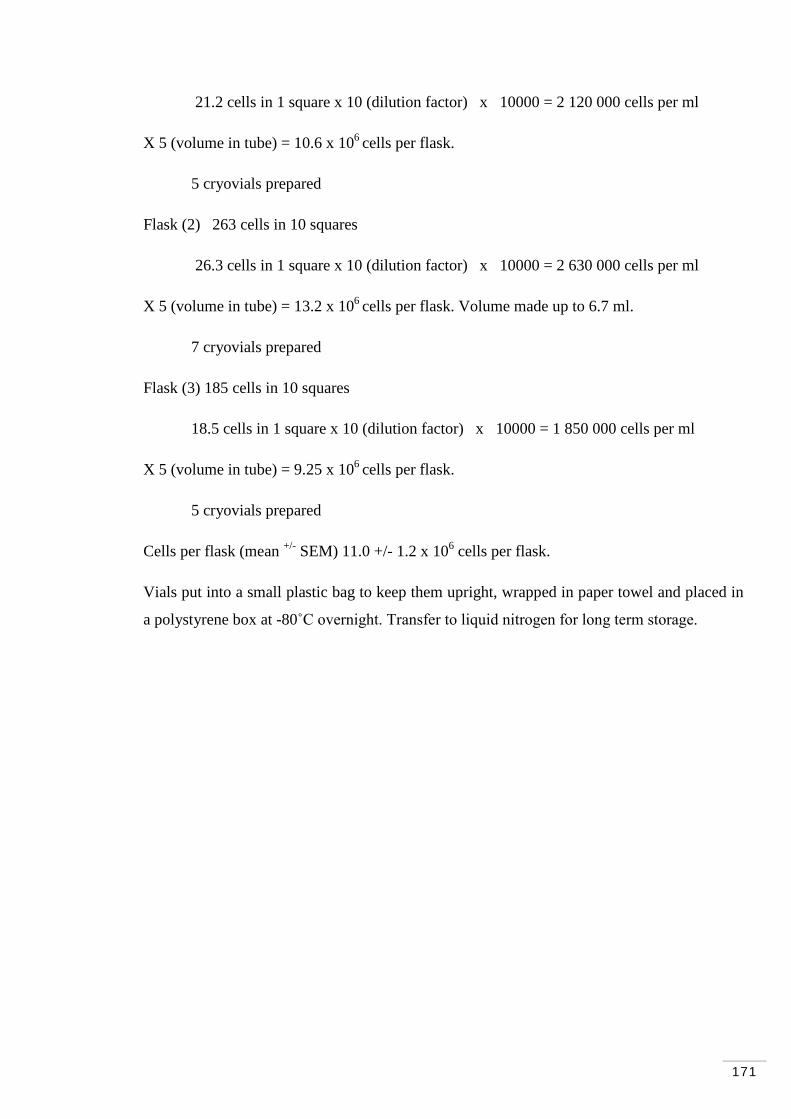
171
21.2 cells in 1 square x 10 (dilution factor) x 10000 = 2 120 000 cells per ml
X 5 (volume in tube) = 10.6 x 10⁶ cells per flask.
5 cryovials prepared
Flask (2) 263 cells in 10 squares
26.3 cells in 1 square x 10 (dilution factor) x 10000 = 2 630 000 cells per ml
X 5 (volume in tube) = 13.2 x 10⁶ cells per flask. Volume made up to 6.7 ml.
7 cryovials prepared
Flask (3) 185 cells in 10 squares
18.5 cells in 1 square x 10 (dilution factor) x 10000 = 1 850 000 cells per ml
X 5 (volume in tube) = 9.25 x 10⁶ cells per flask.
5 cryovials prepared
Cells per flask (mean +/- SEM) 11.0 +/- 1.2 x 10⁶ cells per flask.
Vials put into a small plastic bag to keep them upright, wrapped in paper towel and placed in
a polystyrene box at -80˚C overnight. Transfer to liquid nitrogen for long term storage.

172
Appendix 3
Cytosolic and media fatty acid profiles
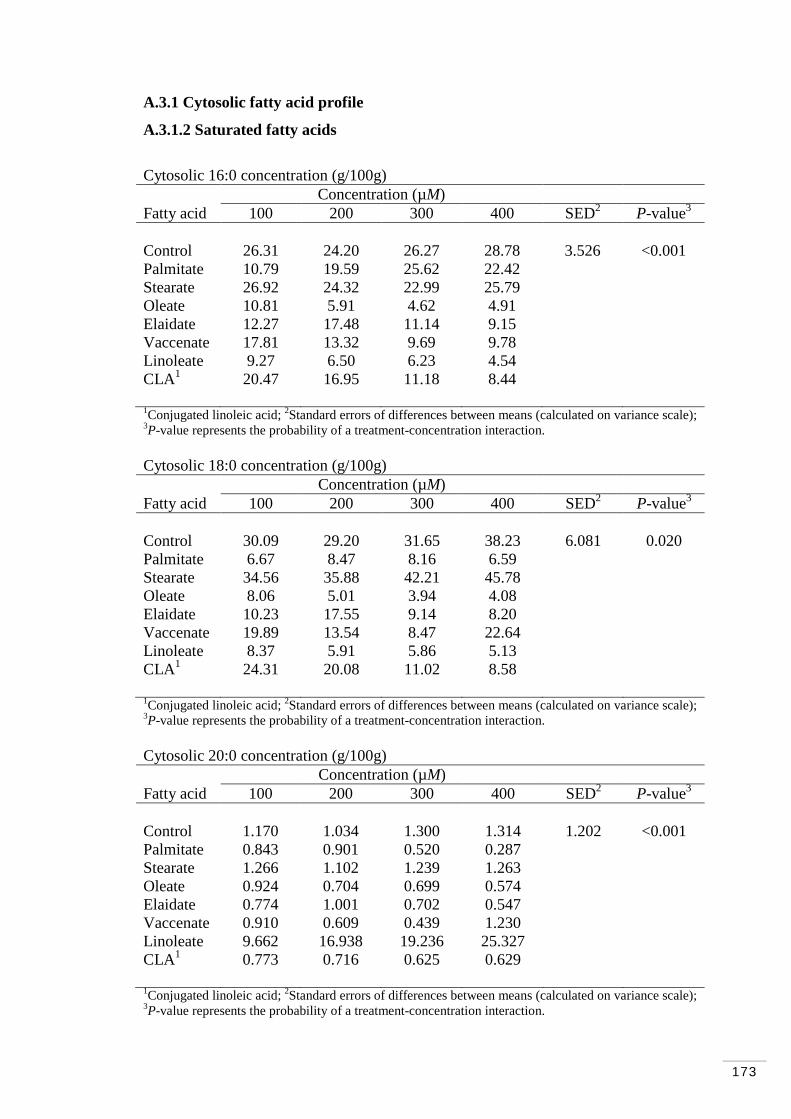
173
A.3.1 Cytosolic fatty acid profile
A.3.1.2 Saturated fatty acids
Cytosolic 16:0 concentration (g/100g) Concentration (µM) Fatty acid 100 200 300 400 SED2 P-value3
Control 26.31 24.20 26.27 28.78 3.526 <0.001 Palmitate 10.79 19.59 25.62 22.42 Stearate 26.92 24.32 22.99 25.79 Oleate 10.81 5.91 4.62 4.91 Elaidate 12.27 17.48 11.14 9.15 Vaccenate 17.81 13.32 9.69 9.78 Linoleate 9.27 6.50 6.23 4.54 CLA1 20.47 16.95 11.18 8.44 1Conjugated linoleic acid; 2Standard errors of differences between means (calculated on variance scale); 3P-value represents the probability of a treatment-concentration interaction. Cytosolic 18:0 concentration (g/100g) Concentration (µM) Fatty acid 100 200 300 400 SED2 P-value3
Control 30.09 29.20 31.65 38.23 6.081 0.020 Palmitate 6.67 8.47 8.16 6.59 Stearate 34.56 35.88 42.21 45.78 Oleate 8.06 5.01 3.94 4.08 Elaidate 10.23 17.55 9.14 8.20 Vaccenate 19.89 13.54 8.47 22.64 Linoleate 8.37 5.91 5.86 5.13 CLA1 24.31 20.08 11.02 8.58 1Conjugated linoleic acid; 2Standard errors of differences between means (calculated on variance scale); 3P-value represents the probability of a treatment-concentration interaction. Cytosolic 20:0 concentration (g/100g) Concentration (µM) Fatty acid 100 200 300 400 SED2 P-value3
Control 1.170 1.034 1.300 1.314 1.202 <0.001 Palmitate 0.843 0.901 0.520 0.287 Stearate 1.266 1.102 1.239 1.263 Oleate 0.924 0.704 0.699 0.574 Elaidate 0.774 1.001 0.702 0.547 Vaccenate 0.910 0.609 0.439 1.230 Linoleate 9.662 16.938 19.236 25.327 CLA1 0.773 0.716 0.625 0.629 1Conjugated linoleic acid; 2Standard errors of differences between means (calculated on variance scale); 3P-value represents the probability of a treatment-concentration interaction.

174
A.3.1.3 Monounsaturated fatty acids and trans fatty acids
Cytosolic 16:1 concentration (g/100g) Concentration (µM) Fatty acid 100 200 300 400 SED2 P-value3
Control 1.514 0.862 1.472 * 0.3383 0.008 Palmitate 2.339 3.300 2.545 1.675 Stearate 1.098 * 0.778 * Oleate 0.841 0.601 0.539 1.203 Elaidate 1.306 1.104 1.176 0.888 Vaccenate 1.103 0.782 0.856 0.627 Linoleate 0.778 0.582 0.484 * CLA1 1.193 0.981 0.879 0.772 1Conjugated linoleic acid; 2Standard errors of differences between means (calculated on variance scale); 3P-value represents the probability of a treatment-concentration interaction; *not detectable. Cytosolic 18:1 trans-9 concentration (g/100g) Concentration (µM) Fatty acid 100 200 300 400 SED2 P-value3
Control 3.685 2.205 0.988 1.052 5.694 <0.001 Palmitate 3.308 4.174 2.645 3.213 Stearate * 1.944 0.496 1.707 Oleate 3.805 2.329 2.209 1.975 Elaidate 15.495 12.867 32.519 39.963 Vaccenate * * 6.801 * Linoleate 3.385 2.733 1.889 1.923 CLA1 1.850 * * * 1Conjugated linoleic acid; 2Standard errors of differences between means (calculated on variance scale); 3P-value represents the probability of a treatment-concentration interaction; *not detectable. Cytosolic 18:1 cis-9 concentration (g/100g) Concentration (µM) Fatty acid 100 200 300 400 SED2 P-value3
Control 7.19 5.16 5.78 2.96 3.544 0.002 Palmitate 11.73 9.95 7.98 5.30 Stearate 14.66 3.09 8.07 5.13 Oleate 18.63 28.96 37.45 37.09 Elaidate 11.34 9.95 15.12 11.62 Vaccenate 7.37 6.98 7.79 5.19 Linoleate 7.12 5.26 4.22 3.28 CLA1 7.63 6.35 6.99 6.23 1Conjugated linoleic acid; 2Standard errors of differences between means (calculated on variance scale); 3P-value represents the probability of a treatment-concentration interaction.
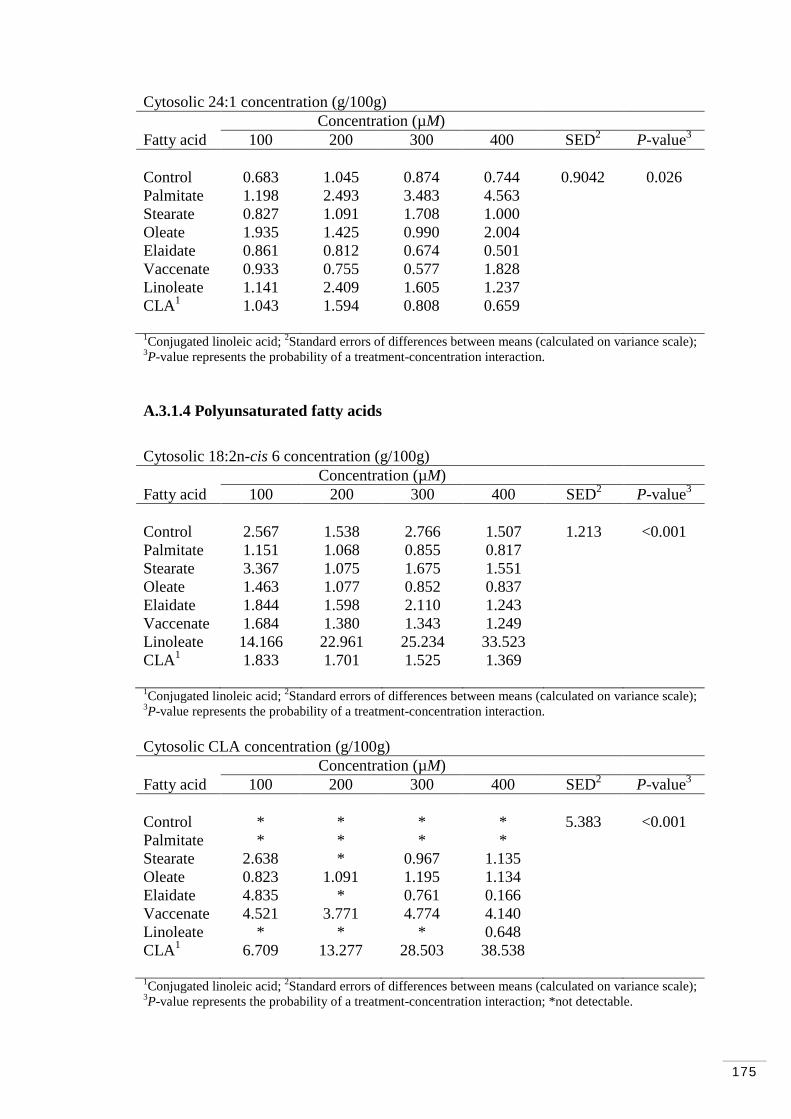
175
Cytosolic 24:1 concentration (g/100g) Concentration (µM) Fatty acid 100 200 300 400 SED2 P-value3
Control 0.683 1.045 0.874 0.744 0.9042 0.026 Palmitate 1.198 2.493 3.483 4.563 Stearate 0.827 1.091 1.708 1.000 Oleate 1.935 1.425 0.990 2.004 Elaidate 0.861 0.812 0.674 0.501 Vaccenate 0.933 0.755 0.577 1.828 Linoleate 1.141 2.409 1.605 1.237 CLA1 1.043 1.594 0.808 0.659 1Conjugated linoleic acid; 2Standard errors of differences between means (calculated on variance scale); 3P-value represents the probability of a treatment-concentration interaction. A.3.1.4 Polyunsaturated fatty acids
Cytosolic 18:2n-cis 6 concentration (g/100g) Concentration (µM) Fatty acid 100 200 300 400 SED2 P-value3
Control 2.567 1.538 2.766 1.507 1.213 <0.001 Palmitate 1.151 1.068 0.855 0.817 Stearate 3.367 1.075 1.675 1.551 Oleate 1.463 1.077 0.852 0.837 Elaidate 1.844 1.598 2.110 1.243 Vaccenate 1.684 1.380 1.343 1.249 Linoleate 14.166 22.961 25.234 33.523 CLA1 1.833 1.701 1.525 1.369 1Conjugated linoleic acid; 2Standard errors of differences between means (calculated on variance scale); 3P-value represents the probability of a treatment-concentration interaction. Cytosolic CLA concentration (g/100g) Concentration (µM) Fatty acid 100 200 300 400 SED2 P-value3
Control * * * * 5.383 <0.001 Palmitate * * * * Stearate 2.638 * 0.967 1.135 Oleate 0.823 1.091 1.195 1.134 Elaidate 4.835 * 0.761 0.166 Vaccenate 4.521 3.771 4.774 4.140 Linoleate * * * 0.648 CLA1 6.709 13.277 28.503 38.538 1Conjugated linoleic acid; 2Standard errors of differences between means (calculated on variance scale); 3P-value represents the probability of a treatment-concentration interaction; *not detectable.
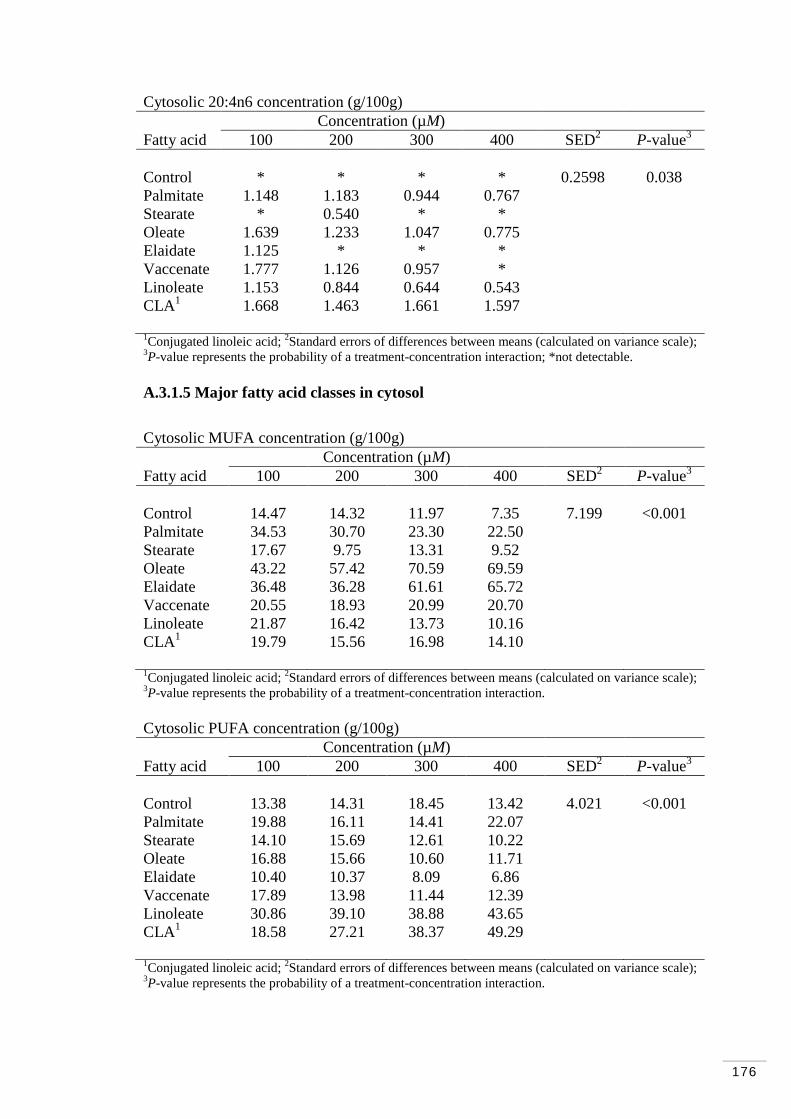
176
Cytosolic 20:4n6 concentration (g/100g) Concentration (µM) Fatty acid 100 200 300 400 SED2 P-value3
Control * * * * 0.2598 0.038 Palmitate 1.148 1.183 0.944 0.767 Stearate * 0.540 * * Oleate 1.639 1.233 1.047 0.775 Elaidate 1.125 * * * Vaccenate 1.777 1.126 0.957 * Linoleate 1.153 0.844 0.644 0.543 CLA1 1.668 1.463 1.661 1.597 1Conjugated linoleic acid; 2Standard errors of differences between means (calculated on variance scale); 3P-value represents the probability of a treatment-concentration interaction; *not detectable. A.3.1.5 Major fatty acid classes in cytosol
Cytosolic MUFA concentration (g/100g) Concentration (µM) Fatty acid 100 200 300 400 SED2 P-value3
Control 14.47 14.32 11.97 7.35 7.199 <0.001 Palmitate 34.53 30.70 23.30 22.50 Stearate 17.67 9.75 13.31 9.52 Oleate 43.22 57.42 70.59 69.59 Elaidate 36.48 36.28 61.61 65.72 Vaccenate 20.55 18.93 20.99 20.70 Linoleate 21.87 16.42 13.73 10.16 CLA1 19.79 15.56 16.98 14.10 1Conjugated linoleic acid; 2Standard errors of differences between means (calculated on variance scale); 3P-value represents the probability of a treatment-concentration interaction. Cytosolic PUFA concentration (g/100g) Concentration (µM) Fatty acid 100 200 300 400 SED2 P-value3
Control 13.38 14.31 18.45 13.42 4.021 <0.001 Palmitate 19.88 16.11 14.41 22.07 Stearate 14.10 15.69 12.61 10.22 Oleate 16.88 15.66 10.60 11.71 Elaidate 10.40 10.37 8.09 6.86 Vaccenate 17.89 13.98 11.44 12.39 Linoleate 30.86 39.10 38.88 43.65 CLA1 18.58 27.21 38.37 49.29 1Conjugated linoleic acid; 2Standard errors of differences between means (calculated on variance scale); 3P-value represents the probability of a treatment-concentration interaction.
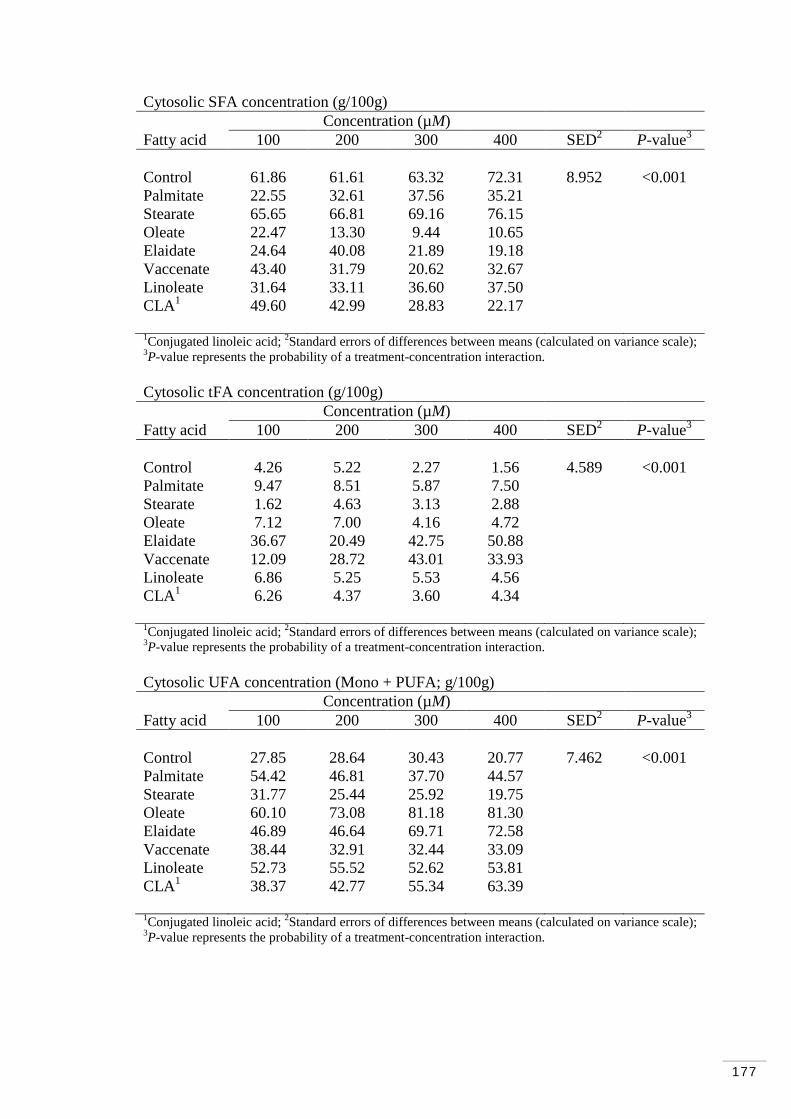
177
Cytosolic SFA concentration (g/100g) Concentration (µM) Fatty acid 100 200 300 400 SED2 P-value3
Control 61.86 61.61 63.32 72.31 8.952 <0.001 Palmitate 22.55 32.61 37.56 35.21 Stearate 65.65 66.81 69.16 76.15 Oleate 22.47 13.30 9.44 10.65 Elaidate 24.64 40.08 21.89 19.18 Vaccenate 43.40 31.79 20.62 32.67 Linoleate 31.64 33.11 36.60 37.50 CLA1 49.60 42.99 28.83 22.17 1Conjugated linoleic acid; 2Standard errors of differences between means (calculated on variance scale); 3P-value represents the probability of a treatment-concentration interaction. Cytosolic tFA concentration (g/100g) Concentration (µM) Fatty acid 100 200 300 400 SED2 P-value3
Control 4.26 5.22 2.27 1.56 4.589 <0.001 Palmitate 9.47 8.51 5.87 7.50 Stearate 1.62 4.63 3.13 2.88 Oleate 7.12 7.00 4.16 4.72 Elaidate 36.67 20.49 42.75 50.88 Vaccenate 12.09 28.72 43.01 33.93 Linoleate 6.86 5.25 5.53 4.56 CLA1 6.26 4.37 3.60 4.34 1Conjugated linoleic acid; 2Standard errors of differences between means (calculated on variance scale); 3P-value represents the probability of a treatment-concentration interaction. Cytosolic UFA concentration (Mono + PUFA; g/100g) Concentration (µM) Fatty acid 100 200 300 400 SED2 P-value3
Control 27.85 28.64 30.43 20.77 7.462 <0.001 Palmitate 54.42 46.81 37.70 44.57 Stearate 31.77 25.44 25.92 19.75 Oleate 60.10 73.08 81.18 81.30 Elaidate 46.89 46.64 69.71 72.58 Vaccenate 38.44 32.91 32.44 33.09 Linoleate 52.73 55.52 52.62 53.81 CLA1 38.37 42.77 55.34 63.39 1Conjugated linoleic acid; 2Standard errors of differences between means (calculated on variance scale); 3P-value represents the probability of a treatment-concentration interaction.

178
A.3.2 Media fatty acid profile
A.3.2.1 Saturated fatty acids
Media 18:0 concentration (g/100g) Concentration (µM)
Fatty acid 100 200 300 400 SED2 P-value3
Control 26.17 23.14 23.69 23.26 3.075 0.014 Palmitate 37.57 33.28 28.84 28.78 Stearate 24.13 31.51 32.98 30.61 Oleate 34.66 33.50 34.73 27.76 Elaidate 35.99 30.52 32.97 28.90 Vaccenate 33.32 33.39 32.10 29.40 Linoleate 35.26 35.56 32.77 33.10 CLA1 37.74 39.93 30.29 29.98 1Conjugated linoleic acid; 2Standard errors of differences between means (calculated on variance scale); 3P-value represents the probability of a treatment-concentration interaction. Media 21:0 concentration (g/100g) Concentration (µM)
Fatty acid 100 200 300 400 SED2 P-value3
Control 0.668 1.148 1.402 1.448 0.5798 0.012 Palmitate 0.939 0.742 * 1.511 Stearate 0.777 1.572 3.409 1.586 Oleate 1.243 1.583 0.827 1.175 Elaidate 0.785 1.251 0.843 1.196 Vaccenate 1.523 1.541 0.534 1.175 Linoleate 0.987 1.147 0.880 0.956 CLA1 1.231 1.132 0.906 3.116 1Conjugated linoleic acid; 2Standard errors of differences between means (calculated on variance scale); 3P-value represents the probability of a treatment-concentration interaction; *not detectable.

179
A.3.2.2 Monounsaturated fatty acids
Media 18:1 cis-9 concentration (g/100g) Concentration (µM)
Fatty acid 100 200 300 400 SED2 P-value3
Control 1.010 0.966 0.857 1.055 1.448 0.004 Palmitate 2.715 3.014 3.737 3.559 Stearate 0.919 1.159 1.447 1.126 Oleate 5.732 5.291 9.062 14.852 Elaidate 2.101 2.572 2.886 3.127 Vaccenate 1.807 2.002 2.152 1.910 Linoleate 2.719 2.390 2.897 2.450 CLA1 1.896 1.903 1.812 2.632 1Conjugated linoleic acid; 2Standard errors of differences between means (calculated on variance scale); 3P-value represents the probability of a treatment-concentration interaction. A.3.2.3 Polyunsaturated fatty acids
Media 18:2n-cis 6 concentration (g/100g) Concentration (µM)
Fatty acid 100 200 300 400 SED2 P-value3
Control 0.515 0.502 0.473 0.474 0.3145 <0.001 Palmitate 0.852 0.815 1.061 0.926 Stearate 0.447 0.497 0.475 0.428 Oleate 2.060 0.667 0.856 0.914 Elaidate 0.912 0.934 0.752 0.780 Vaccenate 0.685 0.883 0.742 0.764 Linoleate 1.697 4.705 8.092 11.476 CLA1 0.807 0.739 0.760 0.849 1Conjugated linoleic acid; 2Standard errors of differences between means (calculated on variance scale); 3P-value represents the probability of a treatment-concentration interaction.
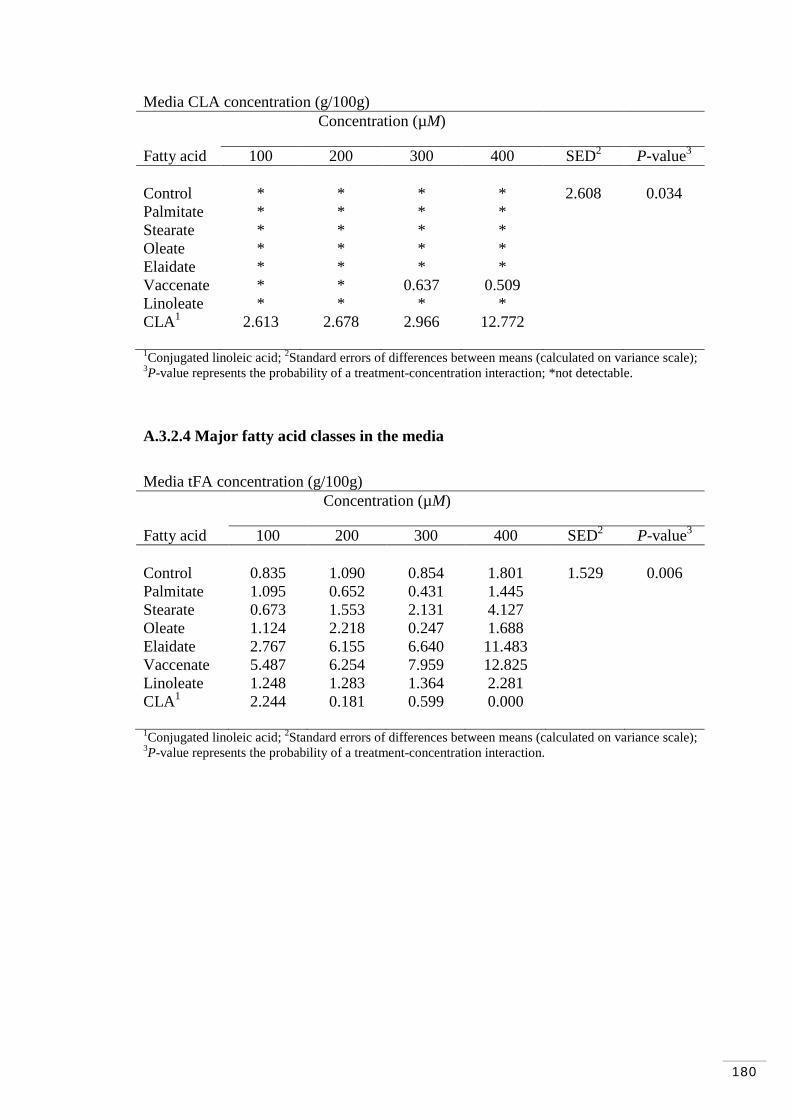
180
Media CLA concentration (g/100g) Concentration (µM)
Fatty acid 100 200 300 400 SED2 P-value3
Control * * * * 2.608 0.034 Palmitate * * * * Stearate * * * * Oleate * * * * Elaidate * * * * Vaccenate * * 0.637 0.509 Linoleate * * * * CLA1 2.613 2.678 2.966 12.772 1Conjugated linoleic acid; 2Standard errors of differences between means (calculated on variance scale); 3P-value represents the probability of a treatment-concentration interaction; *not detectable.
A.3.2.4 Major fatty acid classes in the media
Media tFA concentration (g/100g) Concentration (µM)
Fatty acid 100 200 300 400 SED2 P-value3
Control 0.835 1.090 0.854 1.801 1.529 0.006 Palmitate 1.095 0.652 0.431 1.445 Stearate 0.673 1.553 2.131 4.127 Oleate 1.124 2.218 0.247 1.688 Elaidate 2.767 6.155 6.640 11.483 Vaccenate 5.487 6.254 7.959 12.825 Linoleate 1.248 1.283 1.364 2.281 CLA1 2.244 0.181 0.599 0.000 1Conjugated linoleic acid; 2Standard errors of differences between means (calculated on variance scale); 3P-value represents the probability of a treatment-concentration interaction.

181
Bibliography
182
AbuGhazaleh, A. A. and T. C. Jenkins (2004). "Short communication: Docosahexaenoic acid promotes vaccenic acid accumulation in mixed ruminal cultures when incubated with linoleic acid." Journal of Dairy Science 87(4): 1047-1050.
AbuGhazaleh, A. A., D. J. Schingoethe, et al. (2002). "Fatty acid profiles of milk and
rumen digesta from cows fed fish oil, extruded soybeans or their blend." Journal of Dairy Science 85(9): 2266-2276.
AbuGhazaleh, A. A., D. J. Schingoethe, et al. (2003). "Conjugated linoleic acid and
vaccenic acid in rumen, plasma, and milk of cows fed fish oil and fats differing in saturation of 18 carbon fatty acids." Journal of Dairy Science 86(11): 3648-3660.
AbuGhazaleh, A. A. and L. D. Holmes (2007). "Diet supplementation with fish oil
and sunflower oil to increase conjugated linoleic acid levels in milk fat of partially grazing dairy cows." Journal of Dairy Science 90(6): 2897-2904.
AbuGhazaleh, A. A., D. O. Felton, et al. (2007). "Milk conjugated linoleic acid
response to fish oil and sunflower oil supplementation to dairy cows managed under two feeding systems." Journal of Dairy Science 90(10): 4763-4769.
Abumrad, N., C. Harmon, et al. (1998). "Membrane transport of long-chain fatty acids: evidence for a facilitated process." Journal of Lipid Research 39(12): 2309-2318.
Ackman, R. G. (2000). "The dichotomy of the trans ethylenic bond in our foods."
European Journal of Lipid Science and Technology 102(10): 630-632.
Allison, D. B., S. K. Egan, et al. (1999). "Estimated intakes of trans fatty and other fatty acids in the US population." Journal of the American Dietetic Association 99(2): 166-174.
American Heart Association., N. H. L. a. B. I. (1990). "The Cholesterol facts. A summary of the evidence relating dietary fats, serum cholesterol and coronary heart disease." Circulation 81: 1721.
American-Heart-Association. (2007). "Know your fats." Retrieved 25th, January, 2008, from http://www.americanheart.org/presenter.jhtml?identifier=532.
Aminot-Gilchrist, D. V. and H. D. I. Anderson (2004). "Insulin resistance-associated cardiovascular disease: potential benefits of conjugated linoleic acid." American Journal of Clinical Nutrition 79(6): 1159s-1163s.
Amorocho, A. K., T. C. Jenkins, et al. (2009). "Evaluation of catfish oil as a feedstuff for lactating Holstein cows." Journal of Dairy Science 92(10): 5178-5188.
Annison, E. F. and W. L. Bryden (1998). "Perspectives on ruminant nutrition and
metabolism I. Metabolism in the rumen." Nutrition Research Reviews 11(2): 173-198.
183
Annison, E. F. and W. L. Bryden (1999). "Perspectives on ruminant nutrition and metabolism. II. Metabolism in ruminant tissues." Nutrition Research Reviews 12(1): 147-177.
Arsenault, B. J., J. S. Rana, et al. (2009). "Beyond Low-Density Lipoprotein
Cholesterol." Journal of the American College of Cardiology 55(1): 35-41. Ashbrook, J. D., A. A. Spector, et al. (1975). "Long-Chain Fatty-Acid Binding to
Human Plasma Albumin." Journal of Biological Chemistry 250(6): 2333-2338. Ascherio, A., M. B. Katan, et al. (1999). "Trans fatty acids and coronary heart
disease." New England Journal of Medicine 340(25): 1994-1998.
Ashes, J. R., S. K. Gulati, et al. (1997). "Potential to alter the content and composition of milk fat through nutrition." Journal of Dairy Science 80(9): 2204-2212.
Astrup, H. N., L. Vikmo, et al. (1976). "Feeding Protected and Unprotected Oils to
Dairy-Cows." Journal of Dairy Science 59(3): 426-430. Atwal, A. S., M. Hidiroglou, et al. (1990). "Effects of Feeding Alpha-Tocopherol and
Calcium Salts of Fatty-Acids on Vitamin-E and Fatty-Acid Composition of Cows Milk." Journal of Dairy Science 73(10): 2832-2841.
Baer, D. J., J. T. Judd, et al. (2004). "Dietary fatty acids affect plasma markers of inflammation in healthy men fed controlled diets: a randomized crossover study." American Journal of Clinical Nutrition 79(6): 969-973.
Baggio, G., A. Pagnan, et al. (1988). "Olive-Oil Enriched Diet - Effect on Serum Lipoprotein Levels and Biliary Cholesterol Saturation." American Journal of Clinical Nutrition 47(6): 960-964.
Baggio, G., O. Decandia, et al. (1994). "Efficacy and Safety of Fluvastatin, a New
Hmg Coa Reductase Inhibitor, in Elderly Hypercholesterolemic Women." Drugs 47: 59-63.
Barbano, D. M. 1990. Seasonal and regional variation in milk composition in the U. S.
Proc. Cornell Nutr. Conf. Feed Manuf., Cornell Univ., Ithaca, NY. Banks, W., J. L. Clapperton, et al. (1984). "Effect of Inclusion of Different Forms of
Dietary Fatty-Acid on the Yield and Composition of Cows Milk." Journal of Dairy Research 51(3): 387-395.
Barber, M. C., R. A. Clegg, et al. (1997). "Lipid metabolism in the lactating mammary
gland." Biochimica Et Biophysica Acta-Lipids and Lipid Metabolism 1347(2-3): 101-126.
Bas, P., V. Berthelot, et al. (2007). "Effect of level of linseed on fatty acid
composition of muscles and adipose tissues of lambs with emphasis on trans fatty acids." Meat Science 77(4): 678-688.
Bauchart, D. (1993). "Lipid Absorption and Transport in Ruminants." Journal of Dairy Science 76(12): 3864-3881.

184
Bauchart, D., Legay-Carmier, et al. (1990). "Ruminal hydrolysis of dietary
triglycerids in dairy cows fed lipid-supplemented diets." Reprod. Nutr. Dev 30 (Suppl. 2): 187.
Bauchart, D., F. Legaycarmier, et al. (1990). "Lipid-Metabolism of Liquid-Associated and Solid-Adherent Bacteria in Rumen Contents of Dairy-Cows Offered Lipid-Supplemented Diets." British Journal of Nutrition 63(3): 563-&.
Bauman DE and Davis CL 1974. Biosynthesis of milk fat. In Lactation: a comprehensive treatise (ed. BL Larson and VR Smith), vol. 2, pp. 31–75. Academic Press, London, UK.
Bauman, D. E., I. H. Mather, et al. (2006). "Major advances associated with the
biosynthesis of milk." Journal of Dairy Science 89(4): 1235-1243. Bauman, D. E., L. H. Baumgard, et al. (1999). Biosynthesis of conjugated linoleic
acid in ruminants. Proc. Am. Soc. Anim. Sci.
Bauman, D. E. and J. M. Griinari (2003). "Nutritional regulation of milk fat synthesis." Annual Review of Nutrition 23: 203-227.
Bauman, D. E., J. W. Perfield, et al. (2008). "Regulation of fat synthesis by conjugated linoleic acid: Lactation and the ruminant model." Journal of Nutrition 138(2): 403-409.
Baumgard, L. H., B. A. Corl, et al. (2000). "Identification of the conjugated linoleic
acid isomer that inhibits milk fat synthesis." American Journal of Physiology-Regulatory Integrative and Comparative Physiology 278(1): R179-R184.
Baumgard, L. H., E. Matitashvili, et al. (2002). "trans-10, cis-12 conjugated linoleic
acid decreases lipogenic rates and expression of genes involved in milk lipid synthesis in dairy cows." Journal of Dairy Science 85(9): 2155-2163.
Beauchemin, K. A., S. M. McGinn, et al. (2009). "Crushed sunflower, flax, or canola
seeds in lactating dairy cow diets: Effects on methane production, rumen fermentation, and milk production." Journal of Dairy Science 92(5): 2118-2127.
Belenguer, A., P. G. Toral, et al. (2010). "Changes in the rumen bacterial community
in response to sunflower oil and fish oil supplements in the diet of dairy sheep." Journal of Dairy Science 93(7): 3275-3286.
Belury, M. A. (2002). "Dietary conjugated linoleic acid in health: Physiological
effects and mechanisms of action." Annual Review of Nutrition 22: 505-531.
Bell, J. A., J. M. Griinari, et al. (2006). "Effect of safflower oil, flaxseed oil, monensin, and vitamin E on concentration of conjugated linoleic acid in bovine milk fat." Journal of Dairy Science 89(2): 733-748.
185
Bell, J. A. and J. J. Kennelly (2003). "Short communication: Postruminal infusion of conjugated linoleic acids negatively impacts milk synthesis in Holstein cows." Journal of Dairy Science 86(4): 1321-1324.
Bellows, R. A., and Short, R.E. (1978). "Effects of precalving feed level on birth
weight, calving difficulty and subsequent fertility." Journal of Animal Science 46: 1522-1528.
Belyea, R. L. and M. W. Adams (1990). "Energy and Nitrogen-Utilization of High Versus Low Producing Dairy-Cows." Journal of Dairy Science 73(4): 1023-1030.
Berk, P. D., S. L. Zhou, et al. (1997). "Uptake of long chain free fatty acids is selectively up-regulated in adipocytes of Zucker rats with genetic obesity and non-insulin-dependent diabetes mellitus." Journal of Biological Chemistry 272(13): 8830-8835.
Bernard, L., C. Leroux, et al. (2008). "Expression and nutritional regulation of
lipogenic genes in the ruminant lactating mammary gland." Bioactive Components of Milk 606: 67-108.
Berner, L. A. (1993). "Round table discussion on milk fat, dairy foods and coronary
heart disease risk." Journal of Nutrition 123: 1175.
Bickerst.R, E. F. Annison, et al. (1972). "Quantitative Aspects of Fatty-Acid Biohydrogenation, Absorption and Transfer into Milk-Fat in Lactating Goat, with Special Reference to Cis-Isomers and Trans-Isomers of Octadecenoate and Linoleate." Biochemical Journal 130(2): 607-&.
Bitman, J., D. L. Wood, et al. (1990). "Rhythms in Cholesterol, Cholesteryl Esters,
Free Fatty-Acids, and Triglycerides in Blood of Lactating Dairy-Cows." Journal of Dairy Science 73(4): 948-955.
Blankson, H., J. A. Stakkestad, et al. (2000). "Conjugated linoleic acid reduces body
fat mass in overweight and obese humans." Journal of Nutrition 130(12): 2943-2948.
Bligh, E. G. and W. J. Dyer (1959). "A Rapid Method of Total Lipid Extraction and
Purification." Canadian Journal of Biochemistry and Physiology 37(8): 911-917.
Boeckaert, C., B. Vlaeminck, et al. (2008). "Accumulation of trans C-18:1 Fatty Acids
in the Rumen after Dietary Algal Supplementation Is Associated with Changes in the Butyrivibrio Community." Applied and Environmental Microbiology 74(22): 6923-6930.
Boeckaert, C., K. Ardvisson, et al. (2007). "Effect of vitamin E or vitamin C on in
vitro biohydrogenation of linolenic and linoleic acid in the presence of unesterified DHA." Journal of Dairy Science 90: 119-119.
186
Boken, S. L., C. R. Staples, et al. (2005). "Effect of grazing and fat supplementation on production and reproduction of Holstein cows." Journal of Dairy Science 88(12): 4258-4272.
Bottger, J. D., B. W. Hess, et al. (2002). "Effects of supplementation with high linoleic or oleic cracked safflower seeds on postpartum reproduction and calf performance of primiparous beef heifers." Journal of Animal Science 80(8): 2023-2030.
Brouwer, I. A., A. J. Wanders, et al. (2010). "Effect of Animal and Industrial Trans Fatty Acids on HDL and LDL Cholesterol Levels in Humans - A Quantitative Review." Plos One 5(3): -.
Brown, M. S., Y. K. Ho, et al. (1980). "The Cholesteryl Ester Cycle in Macrophage
Foam Cells - Continual Hydrolysis and Re-Esterification of Cytoplasmic Cholesteryl Esters." Journal of Biological Chemistry 255(19): 9344-9352.
Burdge, G. C., S. Tricon, et al. (2005). "Incorporation of cis-9, trans-11 conjugated
linoleic acid and vaccenic acid (trans-11 18 : 1) into plasma and leucocyte lipids in healthy men consuming dairy products naturally enriched in these fatty acids." British Journal of Nutrition 94(2): 237-243.
Capper, J. L., R. G. Wilkinson, et al. (2007). "The effect of fish oil supplementation of pregnant and lactating ewes on milk production and lamb performance." Animal 1(6): 889-898.
Castaneda-Gutierrez, E., M. J. de Veth, et al. (2007). "Effect of supplementation with
calcium salts of fish oil on n-3 fatty acids in milk fat." Journal of Dairy Science 90(9): 4149-4156.
Cancel, L. M. and J. M. Tarbell (2010). "The role of apoptosis in LDL transport through cultured endothelial cell monolayers." Atherosclerosis 208(2): 335-341.
Carroll, S. M., E. J. DePeters, et al. (2006). "Milk composition of Holstein, Jersey, and
Brown Swiss cows in response to increasing levels of dietary fat." Animal Feed Science and Technology 131(3-4): 451-473.
Chen, C.L., L. H. Tetri, et al., (2010). “A mechanism by which dietary trans fats cause
atherosclerosis”. J Nutr Biochem doi:10.1016/j.jnutbio.2010.05.004
Cieslak, A., Z. Varadyova, et al. (2009). "The Effects of Linoleic Acid on the Fermentation Parameters, Population Density, and Fatty-acid Profile of Two Rumen Ciliate Cultures, Entodinium caudatum and Diploplastron affine." Acta Protozoologica 48(1): 51-61.
Cnop, M., J. C. Hannaert, et al. (2001). "Inverse relationship between cytotoxicity of
free fatty acids in pancreatic islet cells and cellular triglyceride accumulation." Diabetes 50(8): 1771-1777.
187
Chalupa, W., B. Vecchiarelli, et al. (1996). "Responses of dairy cows supplemented with somatotropin during weeks 5 through 43 of lactation." Journal of Dairy Science 79(5): 800-812.
Chalupa, W., B. Vecchiarelli, et al. (1986). "Ruminal Fermentation Invivo as
Influenced by Long-Chain Fatty-Acids." Journal of Dairy Science 69(5): 1293-1301.
Chapman, M. J. (1980). "Animal Lipoproteins - Chemistry, Structure, and Comparative Aspects." Journal of Lipid Research 21(7): 789-853.
Chen, Z. J., T. H. Herdt, et al. (1995). "Reduction of Bovine Plasma-Cholesterol
Concentration by Partial Interruption of Enterohepatic Circulation of Bile-Salts - a Novel Hypocholesterolemic Model." Journal of Lipid Research 36(7): 1544-1556.
Chichlowski, M. W., J. W. Schroeder, et al. (2005). "Altering the fatty acids in milk
fat by including canola seed in dairy cattle diets." Journal of Dairy Science 88(9): 3084-3094.
Chilliard, Y., D. Bauchart, et al. (1991). "Duodenal Rapeseed Oil Infusion in Early and Midlactation Cows .1. Intestinal Apparent Digestibility of Fatty-Acids and Lipids." Journal of Dairy Science 74(2): 490-498.
Chilliard, Y., M. Doreau, et al (1993) “Protected (encapsulated or calcium soaps)
lipids in dairy cow diets. Effects on production and milk composition”. Prod Anim., 6, 139–150.
Chilliard, Y., A. Ferlay, et al. (2000). "Ruminant milk fat plasticity: nutritional control
of saturated, polyunsaturated, trans and conjugated fatty acids." Annales De Zootechnie 49(3): 181-205.
Chilliard, Y. and A. Ferlay (2004). "Dietary lipids and forages interactions on cow and goat milk fatty acid composition and sensory properties." Reproduction Nutrition Development 44(5): 467-492.
Chilliard, Y., A. Ferlay, et al. (2001). "Effect of different types of forages, animal fat or marine oils in cow's diet on milk fat secretion and composition, especially conjugated linoleic acid (CLA) and polyunsaturated fatty acids." Livestock Production Science 70(1-2): 31-48.
Chilliard, Y., A. Ferlay, et al. (2003). "A review of nutritional and physiological factors affecting goat milk lipid synthesis and lipolysis." Journal of Dairy Science 86(5): 1751-1770.
Chilliard, Y., F. Glasser, et al. (2007). "Diet, rumen biohydrogenation and nutritional quality of cow and goat milk fat." European Journal of Lipid Science and Technology 109(8): 828-855.
Chilliard, Y., C. Martin, et al. (2009). "Milk fatty acids in dairy cows fed whole crude linseed, extruded linseed, or linseed oil, and their relationship with methane output." Journal of Dairy Science 92(10): 5199-5211.
188
Chikunya, S., G. Demirel, et al. (2004). "Biohydrogenation of dietary n-3 PUFA and
stability of ingested vitamin E in the rumen, and their effects on microbial activity in sheep." British Journal of Nutrition 91(4): 539-550.
Choi, B. R. and D. L. Palmquist (1996). "High fat diets increase plasma
cholecystokinin and pancreatic polypeptide, and decrease plasma insulin and feed intake in lactating cows." Journal of Nutrition 126(11): 2913-2919.
Chouinard, P. Y., L. Corneau, et al. (1999). "Milk yield and composition during abomasal infusion of conjugated linoleic acids in dairy cows." Journal of Dairy Science 82(12): 2737-2745.
Chouinard, P. Y., L. Corneau, et al. (1999). "Conjugated linoleic acids alter milk fatty
acid composition and inhibit milk fat secretion in dairy cows." Journal of Nutrition 129(8): 1579-1584.
Church, D. C., and Pond, W. G . (1988). Basic animal nutrition and feeding, 3rd ed
John Wiley and Sons. New York, Chichester, Brisbane, Toronto, Singapore.
Christie, W. W. (1981). The composition, structure and function of lipids in the tissues of ruminant animals. Page 95 in Lipid metabolism in ruminant animals. W. W. Christie, ed. Pergamon Press. New York. NY.
Christie, W. W. (1982). "A Simple Procedure for Rapid Transmethylation of
Glycerolipids and Cholesteryl Esters." Journal of Lipid Research 23(7): 1072-1075.
Christie, W. W., R. C. Noble, et al. (1986). “The hydrolysis of very low density
lipoproteins and chylomicrons of intestinal origin by lipoprotein lipase in ruminants”. Lipids 21: 252-253.
Civelek, V. N., J. A. Hamilton, et al. (1996). "Intracellular pH in adipocytes: Effects
of free fatty acid diffusion across the plasma membrane, lipolytic agonists, and insulin." Proceedings of the National Academy of Sciences of the United States of America 93(19): 10139-10144.
Clegg, R. A., M. C. Barber, et al. (2001). "Milk fat synthesis and secretion: molecular
and cellular aspects." Livestock Production Science 70(1-2): 3-14. Clarke, S. D., M. K. Armstrong, et al. (1990). "Dietary Polyunsaturated Fats Uniquely
Suppress Rat-Liver Fatty-Acid Synthase and S14 Messenger-Rna Content." Journal of Nutrition 120(2): 225-231.
Collomb, M., R. Sieber, et al. (2004). "CLA isomers in milk fat from cows fed diets with high levels of unsaturated fatty acids." Lipids 39(4): 355-364.
Colowick, S. P. and Kaplan, N. O., Plasma Lipoproteins. Segrest, J. P., Albers, J. J.,
Eds, Meth. in Enzymol. (Academic Press Inc, London 1986), vol. 129.
189
Connor, W. E. (2000). "Importance of n-3 fatty acids in health and disease." American Journal of Clinical Nutrition 71(1): 171s-175s.
Connor, S. L. and W. E. Connor (1997). "Are fish oils beneficial in the prevention and treatment of coronary artery disease?" American Journal of Clinical Nutrition 66: S1020-S1031.
Corl, B. A., D. M. Barbano, et al. (2003). "cis-9, trans-11 CLA derived endogenously
from trans-11 18 : 1 reduces cancer risk in rats." Journal of Nutrition 133(9): 2893-2900.
Corl, B. A., L. H. Baumgard, et al. (2002). "Trans-7,cis-9 CLA is synthesized endogenously by triangle(9)-desaturase in dairy cows." Lipids 37(7): 681-688.
Coppock, C. E. and D. L. Wilks (1991). "Supplemental Fat in High-Energy Rations
for Lactating Cows - Effects on Intake, Digestion, Milk-Yield, and Composition." Journal of Animal Science 69(9): 3826-3837.
Craig-Schmidt, M. C. (1998). Worldwide consumption of trans fatty acids. . Trans Fatty Acids in Human Nutrition. J. L. Sebedio, and Christie, W.W., The Oily Press, Dundee, Scotland: 59-114.
Cruz-Hernandez, C., J. K. G. Kramer, et al. (2007). "Evaluating the conjugated linoleic acid and trans 18 : 1 isomers in milk fat of dairy cows fed increasing amounts of sunflower oil and a constant level of fish oil." Journal of Dairy Science 90(8): 3786-3801.
Davis, R. A., J. R. Boogaerts, et al. (1985). "Intrahepatic Assembly of Very Low-
Density Lipoproteins - Varied Synthetic Response of Individual Apolipoproteins to Fasting." Journal of Biological Chemistry 260(26): 4137-4144.
Davis, C.L. and Brown R.E. (1970). Low-fat milk syndrome. In Physiology of
Digestion and Metabolism in the Ruminant, ed. AT Phillipson, pp. 545–65. Newcastle upon Tyne, UK: Oriel
Dayani, O., G. R. Ghorbani, et al. (2007). "Effects of dietary whole cottonseed and
crude protein level on rumen protozoal population and fermentation parameters." Small Ruminant Research 69(1-3): 36-45.
Demeyer, D. and M. Doreau (1999). "Targets and procedures for altering ruminant
meat and milk lipids." Proceedings of the Nutrition Society 58(3): 593-607.
Denke, M. A. and S. M. Grundy (1992). "Comparison of Effects of Lauric Acid and Palmitic Acid on Plasma-Lipids and Lipoproteins." American Journal of Clinical Nutrition 56(5): 895-898.
DePeters, E. J., J. B. German, et al. (2001). "Fatty acid and triglyceride composition of milk fat from lactating Holstein cows in response to supplemental canola oil." Journal of Dairy Science 84(4): 929-936.
190
DeSilva, U., S. C. Fernando, et al. (2010). "Rumen Microbial Population Dynamics during Adaptation to a High-Grain Diet." Applied and Environmental Microbiology 76(22): 7482-7490.
deVries, J. E., M. M. Vork, et al. (1997). "Saturated but not mono-unsaturated fatty
acids induce apoptotic cell death in neonatal rat ventricular myocytes." Journal of Lipid Research 38(7): 1384-1394.
Dewhurst, R. J., and Lee, M.R.F. (2004). Alternative strategies for manipulating milk
fat in dairy cows. Recent Advances in Animal Nutrition 2004, Nottingham University Press, UK: 255-275.
Dewhurst, R. J., K. J. Shingfield, et al. (2006). "Increasing the concentrations of beneficial polyunsaturated fatty acids in milk produced by dairy cows in high-forage systems." Animal Feed Science and Technology 131(3-4): 168-206.
Dhayal, S., H. J. Welters, et al. (2008). "Structural requirements for the cytoprotective actions of mono-unsaturated fatty acids in the pancreatic beta-cell line, BRIN-BD11." British Journal of Pharmacology 153(8): 1718-1727.
Dhiman, T. R., E. D. Helmink, et al. (1999). "Conjugated linoleic acid content of milk
and cheese from cows fed extruded oilseeds." Journal of Dairy Science 82(2): 412-419.
Diven, R. H., H. M. Page, et al. (1958). "Effect of Environmental Temperature on Diurnal Variation of Blood Coonstituents in the Bovine." American Journal of Physiology 195(1): 88-90.
Doege, H. and A. Stahl (2006). "Protein-mediated fatty acid uptake: Novel insights
from in vivo models." Physiology 21: 259-268. Doi, Y., T. Ninomiya, et al. (2010). "Impact of Glucose Tolerance Status on
Development of Ischemic Stroke and Coronary Heart Disease in a General Japanese Population The Hisayama Study." Stroke 41(2): 203-209.
Donovan, D. C., D. J. Schingoethe, et al. (2000). "Influence of dietary fish oil on
conjugated linoleic acid and other fatty acids in milk fat from lactating dairy cows." Journal of Dairy Science 83(11): 2620-2628.
Doreau, M., Demeyer, D. T., et al. (1997). “Transformation and effects of unsaturated fatty acids in the rumen”. Consequences on milkfat secretion. Milk Composition, Production and Technology, R. A. S. Welch, D. J. W. Burns, S. R. Davis A. I. Popay, and C. G. Prosser, eds. CAB International, New York: 73-92.
Doreau, M., Chilliard, Y., et al. (1999). Manipulation of milk fat in dairy cows. Recent Advances in Animal Nutrition. P. C. Garnsworthy, and Wiseman, J., Nottingham Press, Nottingham, UK: 81-109
191
Doreau, M. and Y. Chilliard (1997). "Effects of ruminal or postruminal fish oil supplementation on intake and digestion in dairy cows." Reproduction Nutrition Development 37(1): 113-124.
Doreau, M. (1992). "Effects of Supplementation with Hydrogenated Fish Fat on Digestion in Dairy-Cows." Annales De Zootechnie 41(2): 137-143.
Doreau, M. and A. Ferlay (1994). "Digestion and Utilization of Fatty-Acids by
Ruminants." Animal Feed Science and Technology 45(3-4): 379-396.
Duckett, S. K. and M. H. Gillis (2010). "Effects of oil source and fish oil addition on ruminal biohydrogenation of fatty acids and conjugated linoleic acid formation in beef steers fed finishing diets." Journal of Animal Science 88(8): 2684-2691.
Duffield, T. F. and R. N. Bagg (2000). "Use of ionophores in lactating dairy cattle: A
review." Canadian Veterinary Journal-Revue Veterinaire Canadienne 41(5): 388-394.
Emken, E. A. (1995). "Trans fatty acids and coronary heart disease risk,
physicochemical properties, intake, and metabolism." American Journal of Clinical Nutrition 62: 659S-669S.
Enig, M. G., Atal, S., et al. (1990). "Isomeric trans fatty acids in the US diet." J. Am. Coll. Nutr 9: 471-486.
Enjalbert, F., M. C. Nicot, et al. (1994). "Effect of Different Forms of Polyunsaturated Fatty-Acids on Duodenal and Serum Fatty-Acid Profiles in Sheep." Canadian Journal of Animal Science 74(4): 595-600
Erdman, R. A. and B. B. Teter, (1995). “The role of trans fatty acids in diet induced milk fat depression in dairy cows”. Journal of Dairy Science 78 Suppl. 1 p. 229.
Ernens, I., R. Clegg, et al. (2007). "Short communication: Ability of cultured
mammary epithelial cells in a bicameral system to secrete milk fat." Journal of Dairy Science 90(2): 677-681.
Espinoza, J. L., J. A. Ramirezgodinez, et al. (1995). "Effects of Calcium Soaps of
Fatty-Acids on Postpartum Reproductive Activity in Beef-Cows and Growth of Calves." Journal of Animal Science 73(10): 2888-2892.
Ferlay, A. and M. Doreau (1992). "Influence of Method of Administration of Rapeseed Oil in Dairy-Cows .1. Digestion of Nonlipid Components." Journal of Dairy Science 75(11): 3020-3027.
Fielding, P. E. and Fielding, C. J. Biochemistry of Lipids, Lipoproteins and
Membranes. Vance, D. E., Vance, J. E., Eds (Elsevier, Amsterdam, 1991) vol 20 , pp. 427-459.
Food and Drug Administration, US. http://www.fda.gov/default.htm
Food Safety, Authority of Ireland. http://www.fsai.ie/
Food Standards Agency, UK. http://www.food.gov.uk/
192
Funston, R. N. (2004). "Fat supplementation and reproduction in beef females." Journal of Animal Science 82 (E.Suppl.): E154-E161.
Gama, M. A. S., P. C. Garnsworthy, et al. (2008). "Diet-induced milk fat depression: Association with changes in milk fatty acid composition and fluidity of milk fat." Livestock Science 115(2-3): 319-331.
Garnsworthy, P. C. (1997). Fats in dairy cow diets. Recent Developments in Ruminant
Nutrition, Edited by Garnsworthy, P.C and Wiseman, J. Nottingham University Press: 399-415.
Garnsworthy, P. C., L. L. Masson, et al. (2006). "Variation of milk citrate with stage of lactation and de novo fatty acid synthesis in dairy cows." Journal of Dairy Science 89(5): 1604-1612.
Gaullier, J. M., J. Halse, et al. (2004). "Conjugated linoleic acid supplementation for 1
y reduces body fat mass in healthy overweight humans." American Journal of Clinical Nutrition 79(6): 1118-1125.
Gavino, V. C., G. Gavino, et al. (2000). "An isomeric mixture of conjugated linoleic acids but not pure cis-9,trans-11-octadecadienoic acid affects body weight gain and plasma lipids in hamsters." Journal of Nutrition 130(1): 27-29.
Gaynor, P. J., R. A. Erdman, et al. (1994). "Milk-Fat Yield and Composition during
Abomasal Infusion of Cis or Trans Octadecenoates in Holstein Cows." Journal of Dairy Science 77(1): 157-165.
German, J. B., L. Morand, C. J. et al. (1997). Milk fat composition: Targets for alteration of function and nutrition. Pages 39–72 in Milk Composition, Production and Biotechnology. R. A. S. Welch, D. J. W. Burns, S. R. Davis, A. I. Popay, and C.G. Prosser, eds. CAB International, New York, NY.
Gimeno, R. E. (2007). "Fatty acid transport proteins." Current Opinion in Lipidology
18(3): 271-276. Givens, D. I., and Shingfield, K. J. (2006). Optimizing dairy milk fatty acid
composition. Improving the Fat Content of Foods, Eds. C. Williams, J. Buttriss, Woodhead Publishing Limited. Cambridge, UK: 252-280.
Gibbons, G. F. (1990). "Assembly and Secretion of Hepatic Very-Low-Density Lipoprotein." Biochemical Journal 268(1): 1-13.
Glasser, F., A. Ferlay, et al. (2010). "t10,c12-18:2-Induced Milk Fat Depression is
Less Pronounced in Cows Fed High-Concentrate Diets." Lipids 45(9): 877-887. Gomez-Cortes, P., P. Frutos, et al. (2008). "Milk production, conjugated linoleic acid
content, and in vitro ruminal fermentation in response to high levels of soybean oil in dairy ewe diet." Journal of Dairy Science 91(4): 1560-1569.
Gonthier, C., A. F. Mustafa, et al. (2005). "Feeding micronized and extruded flaxseed
to dairy cows: Effects on blood parameters and milk fatty acid composition." Journal of Dairy Science 88(2): 748-756.
193
Grande, F., Anderson, J. T., et al. (1970). "Comparison of effects of palmitic and stearic acids in the diet on serum cholesterol in man." American Journal of Clinical Nutrition 23: 1184.
Griinari, J. M., and Bauman, D.E. (1999). Biosynthesis of conjugated linoleic acid and its incorporation into meat and milk in ruminants. Advances in Conjugated Linoleic Acid Research. M. P. Yurawecz, Mossoba, M.M., Kramer, J.K.G., Pariza, M.W., Nelson, G.J. (Eds.). Champaign, Illinois, AOCS Press. 1: 180-200.
Griinari, J. M., and Bauman, D. E. (2006). Milk fat depression: Concepts, mechanisms and management applications. Ruminant Physiology: Digestion, Metabolism and Impact of Nutrition on Gene Expression, Immunology and Stress. T. H. K. Sejrsen, M. O. Nielsen, Wageningen Academic Publishers. Wageningen (The Netherlands): 389-417.
Griinari, J. M., D. A. Dwyer, et al. (1998). "Trans-octadecenoic acids and milk fat depression in lactating dairy cows." Journal of Dairy Science 81(5): 1251-1261.
Griinari, J. M., B. A. Corl, et al. (2000). "Conjugated linoleic acid is synthesized endogenously in lactating dairy cows by Delta(9)-desaturase." Journal of Nutrition 130(9): 2285-2291.
Grummer, R. R. (1991). "Effect of Feed on the Composition of Milk-Fat." Journal of Dairy Science 74(9): 3244-3257.
Grummer, R. R. and D. J. Carroll (1991). "Effects of Dietary-Fat on Metabolic Disorders and Reproductive-Performance of Dairy-Cattle." Journal of Animal Science 69(9): 3838-3852.
Gurr, M. (1991) “The Butter Council, Polyunsaturates; their role in health and nutrition”.
Gurr, M.I., and Harwood, J.L., Lipid biochemistry (Chapman and Hall, Bury St Edmons, 1991).
Hajri, T. and N. A. Abumrad (2002). "Fatty acid transport across membranes: Relevance to nutrition and metabolic pathology." Annual Review of Nutrition 22: 383-415.
Hansen, H. O. and J. Knudsen (1987). "Effect of Exogenous Long-Chain Fatty-Acids
on Lipid Biosynthesis in Dispersed Ruminant Mammary-Gland Epithelial-Cells - Esterification of Long-Chain Exogenous Fatty-Acids." Journal of Dairy Science 70(7): 1344-1349.
Hara, A. and N. S. Radin (1978). "Lipid Extraction of Tissues with a Low-Toxicity
Solvent." Analytical Biochemistry 90(1): 420-426. Harfoot, C. G. (1978). "Lipid metabolism in the rumen." Progress in Lipid Research
17: 51-54.
194
Harfoot, C. G., and Hazlewood, G.P. (1988). Lipid metabolism in the rumen. The Rumen Microbial Ecosystem. N. Y. Elsevier Appl. Sci., ed PN Hobson: 285-322.
Harfoot, C. G., and Hazlewood, G. P. (1997). Lipid metabolism in the rumen. The Rumen Microbial Ecosystem. P. N. Hobson, and Stewart, C. S. Blackie Academic & Professional. London (UK) 382-426.
Harvatine, K. J. and M. S. Allen (2006). "Fat supplements affect fractional rates of ruminal fatty acid biohydrogenation and passage in dairy cows." Journal of Nutrition 136(3): 677-685.
Harvatine, K. J., Y. R. Boisclair, et al. (2009). "Recent advances in the regulation of
milk fat synthesis." Animal 3(1): 40-54. Harvatine, K. J., D. A. Dwyer, et al. (2007). "Expression of lipogenic genes in adipose
tissue increases during milk fat depression induced by treatment with trans-10, cis-12 conjugated linoleic acid (CLA)." Journal of Dairy Science 90: 206-206.
Hay, J. D. and W. R. Morrison (1970). "Isomeric Monoenoic Fatty Acids in Bovine
Milk Fat." Biochimica Et Biophysica Acta 202(2): 237-&. Hayakawa, K., Y. Y. Linko, et al. (2000). "The role of trans fatty acids in human
nutrition." European Journal of Lipid Science and Technology 102(6): 419-425.
Hegsted, D. M., R. B. McGandy, et al. (1965). "Quantitative effects of dietary fat on serum cholesterol in man." American Journal of Clinical Nutrition 17: 281.
Helfant, R. H., and Banka, V. S. (1978). A clinical and angiographic approach to coronary heart disease, F. A. Davis Co., Philadelphia, PA.
Heid, H. W. and T. W. Keenan (2005). "Intracellular origin and secretion of milk fat globules." European Journal of Cell Biology 84(2-3): 245-258.
Herdt, T. H. and J. C. Smith (1996). "Blood-lipid and lactation-stage factors affecting
serum vitamin E concentrations and vitamin E cholesterol ratios in dairy cattle." Journal of Veterinary Diagnostic Investigation 8(2): 228-232.
Hervas, G., P. Luna, et al. (2008). "Effect of diet supplementation with sunflower oil
on milk production, fatty acid profile and ruminal fermentation in lactating dairy ewes." Journal of Dairy Research 75(4): 399-405.
Hickson-Bick, D. L. M., L. M. Buja, et al. (2000). "Palmitate-mediated alterations in the fatty acid metabolism of rat neonatal cardiac myocytes." Journal of Molecular and Cellular Cardiology 32(3): 511-519.
Hulshof, K. F. A. M., M. A. van Erp-Baart, et al. (1999). "Intake of fatty acids in
western Europe with emphasis on trans fatty acids: The TRANSFAIR study." European Journal of Clinical Nutrition 53(2): 143-157.

195
Hurtaud, C. and J. L. Peyraud (2007). "Effects of feeding camelina (seeds or meal) on milk fatty acid composition and butter spreadability." Journal of Dairy Science 90(11): 5134-5145.
Hu, F. B. and W. C. Willett (2002). "Optimal diets for prevention of coronary heart disease." Jama-Journal of the American Medical Association 288(20): 2569-2578.
Huang, H., O. Starodub, et al. (2002). "Liver fatty acid-binding protein targets fatty acids to the nucleus - Real time confocal and multiphoton fluorescence imaging in living cells." Journal of Biological Chemistry 277(32): 29139-29151.
Huynh, H. T., G. Robitaille, et al. (1991). "Establishment of Bovine Mammary
Epithelial-Cells (Mac-T) - an Invitro Model for Bovine Lactation." Experimental Cell Research 197(2): 191-199.
Ikwuegbu, O. A. and J. D. Sutton (1982). "The Effect of Varying the Amount of
Linseed Oil Supplementation on Rumen Metabolism in Sheep." British Journal of Nutrition 48(2): 365-375.
Imamura, T., Y. Doi, et al. (2009). "LDL Cholesterol and the Development of Stroke Subtypes and Coronary Heart Disease in a General Japanese Population: The Hisayama Study." Stroke 40(2): 382-388.
Ivan, M., P. S. Mir, et al. (2001). "Effects of dietary sunflower seed oil on rumen
protozoa population and tissue concentration of conjugated linoleic acid in sheep." Small Ruminant Research 41(3): 215-227.
Jackson, R. L., Morrisett, J. D. et al. (1976). “Lipoprotein and structure metabolism”
Physiological Review. 56, 256-316.
Jacobs, M. N., A. Covaci, et al. (2004). "Time trend investigation of PCBs, PBDEs, and organochlorine pesticides in selected n-3 polyunsaturated fatty acid rich dietary fish oil and vegetable oil supplements; Nutritional relevance for human essential n-3 fatty acid requirements." Journal of Agricultural and Food Chemistry 52(6): 1780-1788.
Jahreis, G., J. Kraft, et al. (2000). "Conjugated linoleic acids: Physiological effects in animal and man with special regard to body composition." European Journal of Lipid Science and Technology 102(11): 695-703.
Jahreis, G., J. Fritsche, et al. (1996). “Monthly variations of milk composition with special regard to fatty acids depending on season and farm management systems-Conventional versus ecological”. Fett/Lipid 98:356–369.
Jayan, G.C, and Herbein, J. H. (2000). Healthier dairy fat using trans-vaccenic acid.
Nutr Food Sci. 2000; 30:304–9.
Jenkins, T. C. (1987). " Effect of fats and fatty acid combinations on ruminal fermentation in semicontinuous in vitro cultures." Journal of Animal Science 64: 1526.
196
Jenkins, T. C. (1993). "Lipid-Metabolism in the Rumen." Journal of Dairy Science 76(12): 3851-3863
Jenkins, T. C., R. J. Wallace, et al. (2008). "BOARD-INVITED REVIEW: Recent advances in biohydrogenation of unsaturated fatty acids within the rumen microbial ecosystem." Journal of Animal Science 86(2): 397-412.
Jensen, R. G. (2000). “Fatty acids in milk and dairy products. Pages 109–123 in Fatty
Acids in Foods and their Health Implications”. 2nd ed. C. K. Chow, ed. Marcel Dekker, Inc., New York, NY.
Jensen, R. G. (2002). "The composition of bovine milk lipids: January 1995 to
December 2000." Journal of Dairy Science 85(2): 295-350.
Johnson, T. L., B. A. S. Fujimoto, et al. (2010). "Growth hormone alters lipid composition and increases the abundance of casein and lactalbumin mRNA in the MAC-T cell line." Journal of Dairy Research 77(2): 199-204.
Juchem, S. O., J. E. P. Santos, et al. (2008). "Effect of calcium salts of fish and palm
oils on lactational performance of Holstein cows." Animal Feed Science and Technology 140(1-2): 18-38.
Judd, J. T., D. J. Baer, et al. (2002). "Dietary cis and trans monounsaturated and
saturated FA and plasma lipids and lipoproteins in men." Lipids 37(2): 123-131.
Judd, J. T., B. A. Clevidence, et al. (1994). "Dietary Trans-Fatty-Acids - Effects on Plasma-Lipids and Lipoproteins of Healthy-Men and Women." American Journal of Clinical Nutrition 59(4): 861-868.
Kadegowda, A. K. G., L. S. Piperova, et al. (2008). "Abomasal infusion of butterfat increases milk fat in lactating dairy cows." Journal of Dairy Science 91(6): 2370-2379.
Kadegowda, A. K. G., M. Bionaz, et al. (2009). "Peroxisome proliferator-activated
receptor-gamma activation and long-chain fatty acids alter lipogenic gene networks in bovine mammary epithelial cells to various extents." Journal of Dairy Science 92(9): 4276-4289.
Kalscheur, K. F., Teter, et al. (1997). "Effect of fat source on duodenal flow of trans-C18.1 fatty acids and milk fat production in dairy cows." Journal of Dairy Science 80: 2115-2126.
Kampf, J. P. and A. M. Kleinfeld (2004). "Fatty acid transport in adipocytes monitored by imaging intracellular free fatty acid levels." Journal of Biological Chemistry 279(34): 35775-35780.
Kastelein, J. J. P., W. A. van der Steeg, et al. (2008). "Lipids, apolipoproteins, and
their ratios in relation to cardiovascular events with statin treatment." Circulation 117(23): 3002-3009.

197
Katan, M. B. (2000). "Trans fatty acids and plasma lipoproteins." Nutrition Reviews 58(6): 188-191.
Katan, M. B., P. L. Zock, et al. (1995). "Trans-Fatty-Acids and Their Effects on Lipoproteins in Humans." Annual Review of Nutrition 15: 473-493.
Katz, I., and Keeney, M. (1966). "Characterization of the octadecenoic acids in rumen digesta and rumen bacteria." Journal of Dairy Science 49: 962-966.
Keating, A. F., F. Q. Zhao, et al. (2008). "Effect of conjugated linoleic acid on bovine mammary cell growth, apoptosis and stearoyl Co-A desaturase gene expression." Domestic Animal Endocrinology 34(3): 284-292.
Kelly, M. L., E. S. Kolver, et al. (1998). "Effect of intake of pasture on concentrations
of conjugated linoleic acid in milk of lactating cows." Journal of Dairy Science 81(6): 1630-1636.
Kennelly, J. J. (1996). "The fatty acid composition of milk fat as influenced by feeding oilseeds." Animal Feed Science and Technology 60(3-4): 137-152.
Keys, J. E., A. V. Capuco, et al. (1991). "Lipid-Synthesis by Cocultures of Mammary, Liver, and Adipose-Tissue Explants from Sometribove (Recombinant Methionyl Bovine Somatotropin)-Treated Dairy-Cows." In Vitro Cellular & Developmental Biology 27(3): 249-252.
Knight, R., J. D. Sutton, et al. (1978). "Effect of Dietary Lipid Supplementation on
Digestion and Synthesis in Stomach of Sheep." Proceedings of the Nutrition Society 37(1): A14-A14.
Kemp, P., R. W. White, et al. (1975). "Hydrogenation of Unsaturated Fatty-Acids by 5
Bacterial Isolates from Sheep Rumen, Including a New Species." Journal of General Microbiology 90(Sep): 100-114.
Kepler, C. R., Tucker, et al. (1970). "Biohydrogenation of unsaturated fatty acids. IV.
Substrate specificity and inhibition of linoleate Alz-cis, All-trm isomerase from Butyrivibrio fibrisolvens." Biol. Chem 245: 3612.
Keys, A., Anderson, et al. (1965). "Serum cholesterol response to changes in the diet. IV. Particular saturated fatty acids in the diet." Metabolism 14: 776.
Keys, A., Menotti, et al. (1986). "The diet and 15-year death rate in the seven countries study." American Journal of Epidemiology 124: 903.
Kleinfeld, A. M. (2000). "Lipid phase fatty acid flip-flop, is it fast enough for cellular transport?" Journal of Membrane Biology 175(2): 79-86.
Kim, E. J., S. A. Huws, et al. (2008). "Fish oil increases the duodenal flow of long
chain polyunsaturated fatty acids and trans-11 18 : 1 and decreases 18 : 0 in steers via changes in the rumen bacterial community." Journal of Nutrition 138(5): 889-896.
198
Kinsella, J. E. (1968). "Lipid Biosynthesis by Bovine Mammary Cells in Vitro." Journal of Dairy Science 51(12): 1968-&.
Kinsella, J. E. and M. Gross (1973). "Palmitic Acid and Initiation of Mammary
Glyceride Synthesis Via Phosphatidic Acid." Biochimica Et Biophysica Acta 316(1): 109-113.
Kinsella, J. E., B. Lokesh, et al. (1990). "Dietary N-3 Polyunsaturated Fatty-Acids and
Amelioration of Cardiovascular-Disease - Possible Mechanisms." American Journal of Clinical Nutrition 52(1): 1-28.
Kitessa, S. M., S. K. Gulati, et al. (2001). "Utilisation of fish oil in ruminants - I. Fish oil metabolism in sheep." Animal Feed Science and Technology 89(3-4): 189-199.
Knight, R., J. , D. Sutton, et al. (1978). “Rumen microbial synthesis of longchain fatty
acids.” Proc. Nutr. SOC. 37:4A.(Abstr.) Kraft, J., Collomb, et al. (2003). "Differences in CLA isomer distribution of cow’s
milk lipids." Lipids 38: 657-664
Kook K, Choi BH, Sun SS, Garcia F and Myung KH 2002. Effect of fish oil supplementation on growth performance, ruminal metabolism and fatty acid composition of longissimus muscle in Korean cattle. Asian-Australasian Journalof Animal Science 15, 66–71.
Kucuk, O., Hess, et al. (2001). "Effect of forage: concentrate ration on ruminal
digestion and duodenal flow of fatty acids in ewes." Journal of Animal Science 79: 2233-2240.
Lawless, F., Murphy, et al. (1998). "Elevation of conjugated cis-9, trans-11-octadecadienoic acid in bovine milk because of dietary suppplementation." Journal of Dairy Science 81: 3259-3267.
Lawson, R. E., Moss, et al. (2001). "The role of dairy products in supplying conjugated linoleic acid to man’s diet: a review." Nutr Res 14: 153-172.
Lee, M. R. F., J. K. S. Tweed, et al. (2005). "The effects of fish oil supplementation on rumen metabolism and the biohydrogenation of unsaturated fatty acids in beef steers given diets containing sunflower oil." Animal Science 80: 361-367.
Lee, M. R. F., K. J. Shingfield, et al. (2008). "Effect of fish oil on ruminal
biohydrogenation of C18 unsaturated fatty acids in steers fed grass or red clover silages." Animal 2(12): 1859-1869.
Lewis, W. D., J. A. Bertrand, et al. (1999). "Interaction of tallow and hay particle size
on ruminal parameters." Journal of Dairy Science 82(7): 1532-1537. Liao, J. F., R. Sportsman, et al. (2005). "Real-time quantification of fatty acid uptake
using a novel fluorescence assay." Journal of Lipid Research 46(3): 597-602.
199
Lichtenstein, A. H., A. T. Erkkila, et al. (2003). "Influence of hydrogenated fat and butter on CVD risk factors: remnant-like particles, glucose and insulin, blood pressure and C-reactive protein." Atherosclerosis 171(1): 97-107.
Listenberger, L. L., X. L. Han, et al. (2003). "Triglyceride accumulation protects
against fatty acid-induced lipotoxicity." Proceedings of the National Academy of Sciences of the United States of America 100(6): 3077-3082.
Listenberger, L. L., D. S. Ory, et al. (2001). "Palmitate-induced apoptosis can occur
through a ceramide-independent pathway." Journal of Biological Chemistry 276(18): 14890-14895.
Lock, A. L. and D. E. Bauman (2004). "Modifying milk fat composition of dairy cows
to enhance fatty acids beneficial to human health." Lipids 39(12): 1197-1206. Lock, A. L., C. A. M. Horne, et al. (2005). "Butter naturally enriched in conjugated
linoleic acid and vaccenic acid alters tissue fatty acids and improves the plasma lipoprotein profile in cholesterol-fed hamsters." Journal of Nutrition 135(8): 1934-1939.
Lock, A. L., M. Rovai, et al. (2008). "A conjugated linoleic acid supplement
containing trans-10, cis-12 conjugated linoleic acid reduces milk fat synthesis in lactating goats." Journal of Dairy Science 91(9): 3291-3299.
Lock, A. L. and P. C. Garnsworthy (2002). "Independent effects of dietary linoleic
and linolenic fatty acids on the conjugated linoleic acid content of cows' milk." Animal Science 74: 163-176.
Lock, A. L., Corl, B.A., et al. (2004). "The anticancer effects of vaccenic acid in milk
fat are due to its conversion to conjugated linoleic acid via delta-9 desaturase." Journal of Dairy Science 87 (Suppl. 1): 425 (abstract).
Lock, A. L., Shingfield, K. J. (2004). Optimising milk composition. In: Dairying – Using Science to Meet Consumers’s Needs. Occasional Publication No 29 of the British Society of Animal Science Nottingham University Press, Lougborough. (UK) 2004, pp. 107–108.
Lock, A. L., C. Tyburczy, et al. (2007). "Trans-10 octadecenoic acid does not reduce milk fat synthesis in dairy cows." Journal of Nutrition 137(1): 71-76.
Loor, J. J., J. H. Herbein, et al. (2002). "Nutrient digestion, biohydrogenation, and fatty acid profiles in blood plasma and milk fat from lactating Holstein cows fed canola oil or canolamide." Animal Feed Science and Technology 97(1-2): 65-82.
Loor, J. J., J. H. Herbein, et al. (2002). "Trans18 : 1 and 18 : 2 isomers in blood
plasma and milk fat of grazing cows fed a grain supplement containing solvent-extracted or mechanically extracted soybean meal." Journal of Dairy Science 85(5): 1197-1207.
200
Loor, J. J., Ueda, K., et al. (2004). "Biohydrogenation, duodenal flows, and intestinal digestion of trans fatty acids and conjugated linoleic acids in response to dietary forage:concentrate ratio and linseed oil in dairy cows." Journal of Dairy Science 87: 2472-2485.
Loor, J. J., A. Ferlay, et al. (2005). "Relationship among trans and conjugated fatty acids and bovine milk fat yield due to dietary concentrate and linseed oil." Journal of Dairy Science 88(2): 726-740.
Loor, J. J., K. Ueda, et al. (2005). "Intestinal flow and digestibility of trans fatty acids and conjugated linoleic acids (CLA) in dairy cows fed a high-concentrate diet supplemented with fish oil, linseed oil, or sunflower oil." Animal Feed Science and Technology 119(3-4): 203-225.
Loor, J. J., K. Ueda, et al. (2004). "Short communication: Diurnal profiles of
conjugated linoleic acids and trans fatty acids in ruminal fluid from cows fed a high concentrate diet supplemented with fish oil, linseed oil, or sunflower oil." Journal of Dairy Science 87(8): 2468-2471.
Loor, J. J., M. Doreau, et al. (2005). "Effects of ruminal or duodenal supply of fish oil
on milk fat secretion and profiles of trans-fatty acids and conjugated linoleic acid isomers in dairy cows fed maize silage." Animal Feed Science and Technology 119(3-4): 227-246.
Loor, J. J., A. Ferlay, et al. (2005). "High-concentrate diets and polyunsaturated oils
alter trans and conjugated isomers in bovine rumen, blood, and milk." Journal of Dairy Science 88(11): 3986-3999.
Loor, J. J. and J. H. Herbein (2003). "Reduced fatty acid synthesis and desaturation
due to exogenous trans10, cis12-CLA in cows fed oleic or linoleic oil." Journal of Dairy Science 86(4): 1354-1369.
Loor, J. J. and J. H. Herbein (2001). "Alterations in blood plasma and milk fatty acid
profiles of lactating Holstein cows in response to ruminal infusion of a conjugated linoleic acid mixture." Animal Research 50(6): 463-476.
Lowry, O. H., N. J. Rosebrough, et al. (1951). "Protein Measurement with the Folin Phenol Reagent." Journal of Biological Chemistry 193(1): 265-275.
Luna, P., A. Bach, et al. (2008). "Influence of diets rich in flax seed and sunflower oil
on the fatty acid composition of ewes' milk fat especially on the level of conjugated linoleic acid, n-3 and n-6 fatty acids." International Dairy Journal 18(1): 99-107.
MacDonald, H. B. (2000). "Conjugated linoleic acid and disease prevention: A review of current knowledge." Journal of the American College of Nutrition 19(2): 111s-118s.
Machmuller, A., C. R. Soliva, et al. (2003). "Methane-suppressing effect of myristic
acid in sheep as affected by dietary calcium and forage proportion." British Journal of Nutrition 90(3): 529-540.
201
Maedler, K., G. A. Spinas, et al. (2001). "Distinct effects of saturated and
monounsaturated fatty acids on beta-cell turnover and function." Diabetes 50(1): 69-76.
Maia, M. R. G., L. C. Chaudhary, et al. (2010). "Toxicity of unsaturated fatty acids to
the biohydrogenating ruminal bacterium, Butyrivibrio fibrisolvens." Bmc Microbiology 10: -.
Mansbridge, R. J. and J. S. Blake (1997). "Nutritional factors affecting the fatty acid
composition of bovine milk." British Journal of Nutrition 78(1): S37-S47.
Martin, C., J. Rouel, et al. (2008). "Methane output and diet digestibility in response to feeding dairy cows crude linseed, extruded linseed, or linseed oil." Journal of Animal Science 86(10): 2642-2650.
Mashek, D. G. and R. A. Coleman (2006). "Cellular fatty acid uptake: the contribution
of metabolism." Current Opinion in Lipidology 17(3): 274-278. Matitashvili, E. and D. E. Bauman (2001). "Synthesis of extracellular matrix proteins
in bovine mammary epithelial cells." In Vitro Cellular & Developmental Biology-Animal 37(10): 629-632.
Matitashvili, E., A. J. Bramley, et al. (1997). "An in vitro approach to ruminant
mammary gland biology." Biotechnology Advances 15(1): 17-41. Matthews, K. R., J. J. Rejman, et al. (1994). "Proliferation of a Bovine Mammary
Epithelial-Cell Line in the Presence of Bacterial Virulence Factors." Journal of Dairy Science 77(10): 2959-2964.
Mattson, F. H., and Grundy, S. M. (1985). "Comparison of effects of dietary saturated,
monounsaturated, and polyunsaturated fatty acids and lipoproteins in man." Jounal of Lipid Research 26: 194.
McArthur, M. J., B. P. Atshaves, et al. (1999). "Cellular uptake and intracellular trafficking of long chain fatty acids." Journal of Lipid Research 40(8): 1371-1383.
McGuire, M. A., and M. K. McGuire (2000). Conjugated linoleic acid (CLA): A
ruminant fatty acid with beneficial effects on human health. Proc. Am. Soc. Anim. Sci. 1999.
Meijer, G. W., A. van Tol, et al. (2001). "Effect of dietary elaidic versus vaccenic acid on blood and liver lipids in the hamster." Atherosclerosis 157(1): 31-40.
Mele, M., A. Buccioni, et al. (2006). "Effect of forage/concentrate ratio and soybean
oil supplementation on milk yield, and composition from Sarda ewes." Animal Research 55(4): 273-285.
202
Mensink, R. P. and M. B. Katan (1990). "Effect of Dietary Trans-Fatty-Acids on High-Density and Low-Density-Lipoprotein Cholesterol Levels in Healthy-Subjects." New England Journal of Medicine 323(7): 439-445.
Mensink, R. P., P. L. Zock, et al. (2003). "Effects of dietary fatty acids and carbohydrates on the ratio of serum total to HDL cholesterol and on serum lipids and apolipoproteins: a meta-analysis of 60 controlled trials." American Journal of Clinical Nutrition 77(5): 1146-1155.
Mertens, D. R. (1997). "Creating a system for meeting the fiber requirements of dairy
cows." Journal of Dairy Science 80(7): 1463-1481. Molkentin, J. (1999). "Bioactive lipids naturally occurring in bovine milk." Nahrung-
Food 43(3): 185-189.
Moore, J. H. and Christie, W. W. (1979). “Lipid metabolism in the mammary gland of ruminant animals”. Progress in Lipid Research 17: 347-395.
Morales, M. S., D. L. Palmquist, et al. (2000). "Effects of fat source and copper on
unsaturation of blood and milk triacylglycerol fatty acids in Holstein and Jersey cows." Journal of Dairy Science 83(9): 2105-2111.
Morand, L. Z., J. N. Morand, et al. (1998). "Effect of insulin and prolactin on
acyltransferase activities in MAC-T bovine mammary cells." Journal of Dairy Science 81(1): 100-106.
Morgan, N. G., S. Dhayal, et al. (2008). "The cytoprotective actions of long-chain
mono-unsaturated fatty acids in pancreatic beta-cells." Biochemical Society Transactions 36: 905-908.
Mosley, E. E., G. L. Powell, et al. (2002). "Microbial biohydrogenation of oleic acid
to trans isomers in vitro." Journal of Lipid Research 43(2): 290-296. Mosley, E. E., B. Shafii, et al. (2006). "cis-9, trans-11 conjugated linoleic acid is
synthesized directly from vaccenic acid in lactating dairy cattle." Journal of Nutrition 136(3): 570-575.
Mu, Y. M., T. Yanase, et al. (2001). "Saturated FFAs, palmitic acid and stearic acid,
induce apoptosis in human granulosa cells." Endocrinology 142(8): 3590-3597. National Health Service, UK. http://www.nhs.uk/Pages/HomePage.aspx Nambi, V., R. C. Hoogeveen, et al. (2009). "Lipoprotein-Associated Phospholipase
A(2) and High-Sensitivity C-Reactive Protein Improve the Stratification of Ischemic Stroke Risk in the Atherosclerosis Risk in Communities (ARIC) Study." Stroke 40(2): 376-381.
Nestel, P., P. Clifton, et al. (1994). "Effects of Increasing Dietary Palmitoleic Acid
Compared with Palmitic and Oleic Acids on Plasma-Lipids of Hypercholesterolemic Men." Journal of Lipid Research 35(4): 656-662.
203
Neville, M. C. and M. F. Picciano (1997). "Regulation of milk lipid secretion and composition." Annual Review of Nutrition 17: 159-183.
Noakes, M., P. J. Nestel, et al. (1996). "Modifying the fatty acid profile of dairy
products through feedlot technology lowers plasma cholesterol of humans consuming the products." American Journal of Clinical Nutrition 63(1): 42-46.
Nordestgaard, B. G. and J. Zacho (2009). "Lipids, atherosclerosis and CVD risk: Is
CRP an innocent bystander?" Nutrition Metabolism and Cardiovascular Diseases 19(8): 521-524.
O’Donnell, J. A. (1993). "Future of milk fat modification by production or processing: integration of nutrition, food science, and animal science." Journal of Dairy Science 76: 1797-1801.
Offer, N. W., M. Marsden, et al. (1999). "Effect of dietary fat supplements on levels of n-3 poly-unsaturated fatty acids, trans acids and conjugated linoleic acid in bovine milk." Animal Science 69: 613-625.
Offer, N. W., B. K. Speake, et al. (2001). "Effect of fish-oil supplementation on levels
of (n-3) poly-unsaturated fatty acids in the lipoprotein fractions of bovine plasma." Animal Science 73: 523-531.
Olsen, T. S., R. H. B. Christensen, et al. (2007). "Higher total serum cholesterol levels
are associated with less severe strokes and lower all-cause mortality - Ten-year follow-up of ischemic strokes in the Copenhagen Stroke Study." Stroke 38(10): 2646-2651.
Olofsson, C. S., A. Salehi, et al. (2004). "Palmitate increases L-type Ca2+ currents
and the size of the readily releasable granule pool in mouse pancreatic beta-cells." Journal of Physiology-London 557(3): 935-948.
Onetti, S. G., R. D. Shaver, et al. (2001). "Effect of type and level of dietary fat on
rumen fermentation and performance of dairy cows fed corn silage-based diets." Journal of Dairy Science 84(12): 2751-2759.
Or-Rashid, M. M., J. K. G. Kramer, et al. (2008). "Supplemental algal meal alters the
ruminal trans-18 : 1 fatty acid and conjugated linoleic acid composition in cattle." Journal of Animal Science 86(1): 187-196.
Palmquist, D. L. (1976). "Kinetic Concept of Lipid Transport in Ruminants -
Review." Journal of Dairy Science 59(3): 355-363. Palmquist, D. L. (1984). Use of fats in diets for lactating dairy cow. Fats in animal
nutrition, Butterworths, London: 357-381.
Palmquist, D. L. and H. R. Conrad (1978). "High Fat Rations for Dairy-Cows - Effects on Feed-Intake, Milk and Fat Production, and Plasma Metabolites." Journal of Dairy Science 61(7): 890-901.

204
Palmquist, D. L. and J. M. Griinari (2006). "Milk fatty acid composition in response to reciprocal combinations of sunflower and fish oils in the diet." Animal Feed Science and Technology 131(3-4): 358-369.
Palmquist, D. L. and W. Mattos (1978). "Turnover of Lipoproteins and Transfer to
Milk-Fat of Dietary (1-Carbon-14) Linoleic-Acid in Lactating Cows." Journal of Dairy Science 61(5): 561-565.
Palmquist, D. L., A. D. Beaulieu, et al. (1993). "Feed and Animal Factors Influencing
Milk-Fat Composition." Journal of Dairy Science 76(6): 1753-1771.
Palmquist, D. L., Lock, A. L., et al. (2005). "Biosynthesis of conjugated linoleic acid in ruminants and humans." Adv Food Nutr Res 50: 179-217.
Palmquist, D. L. and T. C. Jenkins (1980). "Fat in Lactation Rations - Review." Journal of Dairy Science 63(1): 1-14.
Pariza, M. W., Y. Park, et al. (2000). "Mechanisms of action of conjugated linoleic acid: Evidence and speculation." Proceedings of the Society for Experimental Biology and Medicine 223(1): 8-13.
Pariza, M. W., Y. Park, et al. (2001). "The biologically active isomers of conjugated linoleic acid." Progress in Lipid Research 40(4): 283-298.
Park, P. W. and R. E. Goins (1994). "In-Situ Preparation of Fatty-Acid Methyl-Esters for Analysis of Fatty-Acid Composition in Foods." Journal of Food Science 59(6): 1262-1266.
Parodi, P. W. (1977). "Conjugated Octadecadienoic Acids of Milk-Fat." Journal of
Dairy Science 60(10): 1550-1553.
Parodi, P. W. (1999). "Conjugated linoleic acid and other anticarcinogenic agents of bovine milk fat." Journal of Dairy Science 82(6): 1339-1349.
Parodi, P. W. (2004). "Milk fat in human nutrition." Australian Journal of Dairy Technology 59(1): 3-59.
Pennington, J. A. and C. L. Davis (1975). "Effects of Intraruminal and Intra-Abomasal Additions of Cod-Liver Oil on Milk-Fat Production in Cow." Journal of Dairy Science 58(1): 49-55.
Petit, H. V., R. J. Dewhurst, et al. (2001). "Milk production, milk composition, and
reproductive function of dairy cows fed different fats." Canadian Journal of Animal Science 81(2): 263-271.
Petit, H. V., R. J. Dewhurst, et al. (2002). "Milk production and composition, ovarian function, and prostaglandin secretion of dairy cows fed omega-3 fats." Journal of Dairy Science 85(4): 889-899.
Perkins, E. G. (1991). "Analysis of Fats, Oils and Lipoproteins." Journal of the
American Oil Chemists Society(Champaign, IL).
205
Peterson, D. G., E. A. Matitashvili, et al. (2003). "Diet-induced milk fat depression in dairy cows results in increased trans-10, cis-12 CLA in milk fat and coordinate suppression of mRNA abundance for mammary enzymes involved in milk fat synthesis." Journal of Nutrition 133(10): 3098-3102.
Peterson, D. G., E. A. Matitashvili, et al. (2004). "The inhibitory effect of trans-10,
cis-12 CLA on lipid synthesis in bovine mammary epithelial cells involves reduced proteolytic activation of the transcription factor SREBP-1." Journal of Nutrition 134(10): 2523-2527.
Piperova, L. S., J. Sampugna, et al. (2002). "Duodenal and milk trans octadecenoic
acid and conjugated linoleic acid (CLA) isomers indicate that postabsorptive synthesis is the predominant source of cis-9-containing CLA in lactating dairy cows." Journal of Nutrition 132(6): 1235-1241.
Piperova, L. S., U. Moallem, et al. (2004). "Changes in milk fat in response to dietary supplementation with calcium salts of trans-18 : 1 or conjugated linoleic fatty acids in lactating dairy cows (vol 87, pg 3836, 2004)." Journal of Dairy Science 87(12): 4342-4342.
Piperova, L. S., B. B. Teter, et al. (2000). "Mammary lipogenic enzyme activity, trans fatty acids and conjugated linoleic acids are altered in lactating dairy cows fed a milk fat-depressing diet." Journal of Nutrition 130(10): 2568-2574.
Precht, D., H. Hagemeister, et al. (2002). "Trans fatty acids and conjugated linoleic
acids in milk fat from dairy cows fed a rumen-protected linoleic acid rich diet." Kieler Milchwirtschaftliche Forschungsberichte 54(3): 225-242.
Precht, D. and J. Molkentin (1996). "Rapid analysis of the isomers of trans-octadecenoic acid in milk fat." International Dairy Journal 6(8-9): 791-809.
Precht, D. and J. Molkentin (1997). "Effect of feeding on conjugated cis Delta 9, trans Delta 11-octadecadienoic acid and other isomers of linoleic acid in bovine milk fats." Nahrung-Food 41(6): 330-335.
Radding, C. M., and D. Steinberg (1960). Studies on the synthesis and secretion of
serum lipoproteins by rat liver slices. J. Clin. Invest. 39 1560-1569.
Raes, K., S. De Smet, et al. (2004). "Effect of dietary fatty acids on incorporation of long chain polyunsaturated fatty acids and conjugated linoleic acid in lamb, beef and pork meat: a review." Animal Feed Science and Technology 113(1-4): 199-221.
Ray, B. R., E. O. Davisson, et al. (1954). "Experiments on the Degradation of Lipoproteins from Serum." Journal of Physical Chemistry 58(10): 841-846.
Roche, H. M., Noone, E., et al. (2001). "Conjugated linoleic acid: a novel therapeutic
nutrient?" Nutr. Res. Rev 14: 173-187.
Rogers, G. L., C. Grainger, et al. (1979). "Effect of Nutrition of Dairy-Cows in Late Pregnancy on Milk-Production." Australian Journal of Experimental Agriculture 19(96): 7-12.

206
Romo, G. A., R. A. Erdman, et al. (2000). "Milk composition and apparent digestibilities of dietary fatty acids in lactating dairy cows abomasally infused with cis or trans fatty acids." Journal of Dairy Science 83(11): 2609-2619.
Romo, G. A., D. P. Casper, et al. (1996). "Abomasal infusion of cis or trans fatty acid
isomers and energy metabolism of lactating dairy cows." Journal of Dairy Science 79(11): 2005-2015.
Rose, M. T. and McConochie, H. (2006) “The Long Road to a representative in vitro
model of bovine lactation”. Journal of Integrated Field Science 3:67-72.
Roy, A., Ferlay, A., et al. (2006). "Examination of the persistency of milk fatty acid composition responses to plant oils in cows given different basal diets, with particular emphasis on trans-C18:1 fatty acids and isomers of conjugated linoleic acid." Journal of Animal Science 82: 479-492.
Roy, A., J. M. Chardigny, et al. (2007). "Butters rich either in trans-10-C18 : 1 or in trans-11-C18 : 1 plus cis-9, trans-11 CLA differentially affect plasma lipids and aortic fatty streak in experimental atherosclerosis in rabbits." Animal 1(3): 467-476.
Salter, A. M., Lock, A.L., et al. (2006). Milk fatty acids: Implications for human
health. Recent Advances in Animal Nutrition. P. C. Garnsworthy, and Wiseman, J., Nottingham University Press, UK: 1-18.
Salter, A. M. and E. J. Tarling (2007). "Regulation of gene transcription by fatty acids." Animal 1(9): 1314-1320.
Santos, J. E. P., T. R. Bilby, et al. (2008). "Long chain fatty acids of diet as factors influencing reproduction in cattle." Reproduction in Domestic Animals 43: 23-30.
Schneider, P., D. Sklan, et al. (1988). "Feeding Calcium Salts of Fatty-Acids to
Lactating Cows." Journal of Dairy Science 71(8): 2143-2150.
Scollan, N. D., N. J. Choi, et al. (2001). "Manipulating the fatty acid composition of muscle and adipose tissue in beef cattle." British Journal of Nutrition 85(1): 115-124.
Scow, R. O. and Chernick, S. S. (1987). “Lipoprotein lipase during lactation. In Lipoprotein lipase” (ed. J. Borensztajn), pp. 149-185. Evener, Chicago.
Selner, D. R. and L. H. Schultz (1980). "Effects of Feeding Oleic-Acid or
Hydrogenated Vegetable-Oils to Lactating Cows." Journal of Dairy Science 63(8): 1235-1241.
Schaffer, J. E. (2002). "Fatty acid transport: the roads taken." American Journal of Physiology-Endocrinology and Metabolism 282(2): E239-E246.
Schaffer, J. E. (2003). "Lipotoxicity: when tissues overeat." Current Opinion in
Lipidology 14(3): 281-287.
207
Schagat, T., A. Paguio, et al. (2007). “Normalizing Genetic Reporter Assays: Approaches and Considerations for Increasing Consistency and Statistical Significance”. PROMEGA CORPORATION (Cell Notes, Issue 17, 2007, www.promega.com)
Shen, X. Z., K. Nuernberg, et al. (2007). "Vaccenic acid and cis-9,trans-11 CLA in the rumen and different tissues of pasture- and concentrate-fed beef cattle." Lipids 42(12): 1093-1103.
Shillingford, J. P. (1981). Coronary heart diseases. The facts, Oxford University Press. Oxford, New York, Toronto.
Shingfield, K. J., S. Ahvenjarvi, et al. (2003). "Effect of dietary fish oil on biohydrogenation of fatty acids and milk fatty acid content in cows." Animal Science 77: 165-179.
Shingfield, K. J. and J. M. Griinari (2007). "Role of biohydrogenation intermediates in
milk fat depression." European Journal of Lipid Science and Technology 109(8): 799-816.
Shingfield, K. J., C. K. Reynolds, et al. (2006). "Examination of the persistency of
milk fatty acid composition responses to fish oil and sunflower oil in the diet of dairy cows." Journal of Dairy Science 89(2): 714-732.
Shingfield, K. J., L. Bernard, et al. (2010). "Role of trans fatty acids in the nutritional regulation of mammary lipogenesis in ruminants." Animal 4(7): 1140-1166.
Shingfield, K. J., M. R. F. Lee, et al. (2010). "Effect of incremental amounts of fish oil
in the diet on ruminal lipid metabolism in growing steers." British Journal of Nutrition 104(1): 56-66.
Small, D. M. and G. G. Shipley (1974). "Physical-Chemical Basis of Lipid Deposition
in Atherosclerosis." Science 185(4147): 222-229. Sommerfeld, M. (1983). "Trans Unsaturated Fatty-Acids in Natural-Products and
Processed Foods." Progress in Lipid Research 22(3): 221-233.
Sorensen, B. M., E. C. Kazala, et al. (2008). "Effect of CLA and other C18 unsaturated fatty acids on DGAT in bovine milk fat biosynthetic systems." Lipids 43(10): 903-912.
Spady, D. K., Wollett, L. A., et al. (1993). "Regulation of plasma LDL-cholesterol
level by dietary cholesterol and fatty acids." Annual Reviews of Nutrition 13: 355.
Sparagna, G. C., D. L. Hickson-Bick, et al. (2000). "A metabolic role for mitochondria in palmitate-induced cardiac myocyte apoptosis." American Journal of Physiology-Heart and Circulatory Physiology 279(5): H2124-H2132.
Spector, A. A. (1975). "Fatty-Acid Binding to Plasma Albumin." Journal of Lipid
Research 16(3): 165-179.
208
Spector, A. A. (1986). "Structure and Lipid-Binding Properties of Serum-Albumin."
Methods in Enzymology 128: 320-339. Stahl, A. (2004). "A current review of fatty acid transport proteins (SLC27)." Pflugers
Archiv-European Journal of Physiology 447(5): 722-727. Stanton, C., F. Lawless, et al. (1997). "Dietary influences on bovine milk cis-9,trans-
11-conjugated linoleic acid content." Journal of Food Science 62(5): 1083-1086.
Stanko, R. L., Fajersson, P., et al. (1997). "Follicular growth and metabolic changes in beef heifers fed incremental amounts of polyunsaturated fat." Journal of Animal Science 75 (Supplement 1): 223 (Abstract).
Staples, C. R., J. M. Burke, et al. (1998). "Influence of supplemental fats on reproductive tissues and performance of lactating cows." Journal of Dairy Science 81(3): 856-871.
Starr, C. (1994). Biology. Concepts and Applications, Wadsworth Publishing Company. Belmont, CA.
Storry, J.E., (1972). “Milk fat: its synthesis and composition in relation to the nutrition of the dairy cow”. J. Soc. Dairy Technol. 25, 40–46.
Tall, A. R. (1990). "Plasma High-Density Lipoproteins - Metabolism and Relationship
to Atherogenesis." Journal of Clinical Investigation 86(2): 379-384. Temple, N. J. (1996). "Dietary fats and coronary heart disesase." Biomed and
Pharmacother. Elsevier, Paris 50: 261.
Teter, B. B., J. Sampugna, et al. (1990). "Milk-Fat Depression in C57b1/6j Mice Consuming Partially Hydrogenated Fat." Journal of Nutrition 120(8): 818-824.
Thering, B. J., M. Bionaz, et al. (2009). "Long-chain fatty acid effects on peroxisome proliferator-activated receptor-alpha-regulated genes in Madin-Darby bovine kidney cells: Optimization of culture conditions using palmitate." Journal of Dairy Science 92(5): 2027-2037.
Thomas, M. G., B. Bao, et al. (1997). "Dietary fats varying in their fatty acid
composition differentially influence follicular growth in cows fed isoenergetic diets." Journal of Animal Science 75(9): 2512-2519.
Toral, P. G., A. Belenguer, et al. (2009). "Effect of the supplementation of a high-concentrate diet with sunflower and fish oils on ruminal fermentation in sheep." Small Ruminant Research 81(2-3): 119-125.
Tyburczy, C., A. L. Lock, et al. (2008). "Uptake and utilization of trans octadecenoic
acids in lactating dairy cows." Journal of Dairy Science 91(10): 3850-3861.
209
Tymchuk, S. M., G. R. Khorasani, et al. (1998). "Effect of feeding formaldehyde- and heat-treated oil seed on milk yield and milk composition." Canadian Journal of Animal Science 78(4): 693-700.
Tzonou, A., Kalandidi, A., et al. (1993). "Diet and coronary heart disease: A case control study in Athens, Greece." Epidemiology 4: 511.
Ueda, K., A. Ferlay, et al. (2003). "Effect of linseed oil supplementation on ruminal digestion in dairy cows fed diets with different forage: Concentrate ratios." Journal of Dairy Science 86(12): 3999-4007.
Unal, B., J. A. Critchley, et al. (2004). "Explaining the decline in coronary heart
disease mortality in England and Wales between 1981 and 2000." Circulation 109(9): 1101-1107.
Van Soest, P. J. (1994). Pages 260–261, 328–329 in Nutritional Ecology of the
Ruminant. 2nd ed. Cornell Univ. Press, Ithaca, NY.
Vance, D.E. and Vance, J., Biochemistry of Lipids, Lipoproteins and Membranes. Neurerber, A., van Deenen, L. L. M ., Eds., New Comprehensive Biochemistry (Elsevier, New York, 1991), vol. 20.
Vargas-Bello-Perez, E., A. F. Mustafa, et al. (2008). "Effects of feeding forage soybean silage on milk production, nutrient digestion, and ruminal fermentation of lactating dairy cows." Journal of Dairy Science 91(1): 229-235.
Vega-Lopez, S., N. R. Matthan, et al. (2009). "Substitution of vegetable oil for a
partially-hydrogenated fat favorably alters cardiovascular disease risk factors in moderately hypercholesterolemic postmenopausal women." Atherosclerosis 207(1): 208-212.
Wachira, A. M., L. A. Sinclair, et al. (2000). "Rumen biohydrogenation of n-3
polyunsaturated fatty acids and their effects on microbial efficiency and nutrient digestibility in sheep." Journal of Agricultural Science 135: 419-428.
Wachira A.M., L.A Sinclair., et al. (2002). “Effects of dietary fat source and breed on
the carcass composition n-3 polyunsaturated fatty acid and conjugated linoleic acid content of sheep meat and adipose tissue”. The British Journal of Nutrition 88, 1–14.
Ward, P. F. V., T. W. Scott, et al. (1964). "Hydrogenation of Unsaturated Fatty Acids
in Ovine Digestive Tract." Biochemical Journal 92(1): 60-&. Wasowska, I., M. R. G. Maia, et al. (2006). "Influence of fish oil on ruminal
biohydrogenation of C18 unsaturated fatty acids." British Journal of Nutrition 95(6): 1199-1211.
White, S. L., J. A. Bertrand, et al. (2001). "Comparison of fatty acid content of milk
from jersey and Holstein cows consuming pasture or a total mixed ration." Journal of Dairy Science 84(10): 2295-2301.
210
Whitlock, L. A., Schingoethe, D.J., et al. (2002). "Fish oil and extruded soybeans fed
in combination increase conjugated linoleic acid in milk of dairy cows more than when fed separately." Journal of Dairy Science 85: 234-243.
Willett, W. C., and Ascherio, A. (1994). "Trans fatty acids: are the effects only marginal? ." American Journal of Public Health 84: 722-724.
Willett, W. C., M. J. Stampfer, et al. (1993). "Intake of Trans-Fatty-Acids and Risk of Coronary Heart-Disease among Women." Lancet 341(8845): 581-585.
Williams, C. M. (2000). "Dietary fatty acids and human health." Annales De Zootechnie 49(3): 165-180.
Wellnitz, O. and D. E. Kerr (2004). "Cryopreserved bovine mammary cells to model epithelial response to infection." Veterinary Immunology and Immunopathology 101(3-4): 191-202.
Wood, L. G., D. A. Fitzgerald, et al. (2003). "Hypothesis: Vitamin E complements
polyunsaturated fatty acids in essential fatty acid deficiency in cystic fibrosis." Journal of the American College of Nutrition 22(4): 253-257.
Wood, J. D., R. I. Richardson, et al. (2004). "Effects of fatty acids on meat quality: a
review." Meat Science 66(1): 21-32.
Wolff, R. L. (1994). "Contribution of Trans-18/1 Acids from Dairy Fat to European Diets." Journal of the American Oil Chemists Society 71(3): 277-283.
Wolff, R. L. (1995). "Content and Distribution of Trans-18/1 Acids in Ruminant Milk and Meat Fats - Their Importance in European Diets and Their Effect on Human-Milk." Journal of the American Oil Chemists Society 72(3): 259-272.
Wolff, R. L., C. C. Bayard, et al. (1995). "Evaluation of sequential methods for the determination of butterfat fatty acid composition with emphasis on trans-18:1 acids. Application to the study of seasonal variations in French butters." Journal of the American Oil Chemists Society 72(12): 1471-1483.
Wonsil, B. J., J. H. Herbein, et al. (1994). "Dietary and Ruminally Derived Trans-18/1 Fatty-Acids Alter Bovine-Milk Lipids." Journal of Nutrition 124(4): 556-565.
Wu, Z. and J. T. Huber (1994). "Relationship between Dietary-Fat Supplementation and Milk Protein-Concentration in Lactating Cows - a Review." Livestock Production Science 39(2): 141-155.
Wu, Z., O. A. Ohajuruka, et al. (1991). "Ruminal Synthesis, Biohydrogenation, and Digestibility of Fatty-Acids by Dairy-Cows." Journal of Dairy Science 74(9): 3025-3034.
Yang, S. L., D. P. Bu, et al. (2009). "Soybean oil and linseed oil supplementation affect profiles of ruminal microorganisms in dairy cows." Animal 3(11): 1562-1569.

211
Yonezawa, T., S. Haga, et al. (2009). "Saturated fatty acids stimulate and insulin suppresses CIDE-A expression in bovine mammary epithelial cells." Biochemical and Biophysical Research Communications 384(4): 535-539.
Yonezawa, T., K. Katoh, et al. (2004b). "Effects of fatty acids on cytosolic TAG
accumulation in primary cultured bovine mammary epithelial cells." Journal of Animal and Feed Sciences 13: 583-586.
Yonezawa, T., M. Sanosaka, et al. (2008). "Regulation of uncoupling protein 2
expression by long-chain fatty acids and hormones in bovine mammary epithelial cells." Biochemical and Biophysical Research Communications 375(2): 280-285.
Yonezawa, T., S. Yonekura, et al. (2004a). "Effects of long-chain fatty acids on
cytosolic triacylglycerol accumulation and lipid droplet formation in primary cultured bovine mammary epithelial cells." Journal of Dairy Science 87(8): 2527-2534.
Yu, S. M., J. Derr, et al. (1995). "Plasma Cholesterol-Predictive Equations
Demonstrate That Stearic-Acid Is Neutral and Monounsaturated Fatty-Acids Are Hypocholesterolemic." American Journal of Clinical Nutrition 61(5): 1129-1139.
Zavizion, B., J. H. White, et al. (1997). "Staphylococcus aureus stimulates urokinase-type plasminogen activator expression by bovine mammary cells." Journal of Infectious Diseases 176(6): 1637-1640.
Zavizion, B., M. vanDuffelen, et al. (1996). "Establishment and characterization of a
bovine mammary epithelial cell line with unique properties." In Vitro Cellular & Developmental Biology-Animal 32(3): 138-148.
Zock, P. L., J. H. M. Devries, et al. (1994). "Impact of Myristic Acid Versus Palmitic
Acid on Serum-Lipid and Lipoprotein Levels in Healthy Women and Men." Arteriosclerosis and Thrombosis 14(4): 567-575.