the effect of dopants on tio 2 solar cell efficiency mini project presentation fs09 e. buitrago...
TRANSCRIPT

1
The Effect of Dopants on TiO2 Solar Cell Efficiency
Mini Project Presentation FS09
E. Buitrago Advisors: Dr. A. Teleki and A. Tricoli
Particle Technology Laboratory
Swiss Federal Institute of Technology (ETHZ)

2
Overview• Introduction
– Global energy problem– Solar Cell possibilities– Dye Sensitized Solar Cells– Narrowing the TiO2 bandgap: doping
• Experimental– FSP particle synthesis– Photocatalytic Experiments– Bandgap Calculations
• Results– Fe– Nb– Ru
• Conclusion• Outlook• Future Work

3
World Energy Use
http://www.flickr.com/photos/33264427@N06/3166865015/
, US, 2006
4
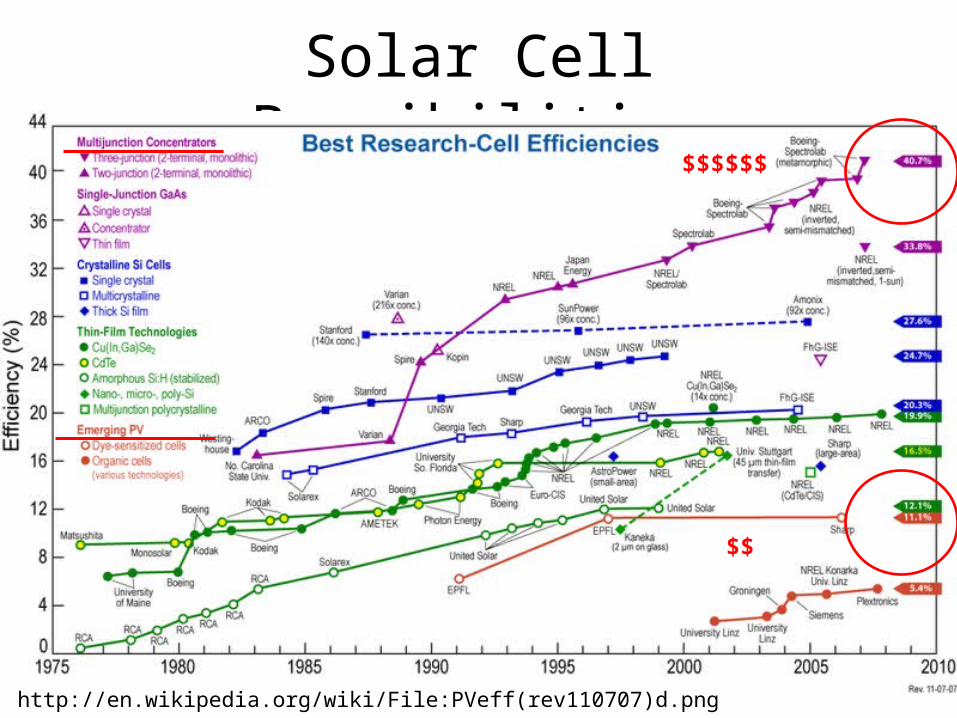
Solar Cell Possibilities
http://en.wikipedia.org/wiki/File:PVeff(rev110707)d.png
$$$$$$
$$

5
Dye Sensitized Solar Cell (DSSC) Schematic
I- / I-
3
Ru2+ → Ru3+ + e−
Anode (oxi): 3I−→I−3 +2e−
Cathode (red): I−3 +2e−→3I−
5
1. O’Regan et al. Nature . 1991.2. Nazeeruddin et al. J.Am.Chem.Soc. 2001.3. http://bouman.chem.georgetown.edu/S02/lect23/Solar_Spectrum.png\4. Grätzel et al. MRS Bulletin. 2005.
Cathode (+)Anode (-)
A.R.
U. A
bsor
banc
e1
2
3
Wide bandgap semiconductorEg = 3.2 eV ~ 385 nm (4)Visible light: 400-700 nm
1.8- 3.1 eV

6
Maximizing Visible Light Absorption: Dopants
Bandgap Method Concentration
1. TiO2 3.2 eV (anatase)
2. Fe-TiO2 2.2 eV FSP 30 mol%Solubility limit 5 mol%
3. Ru-TiO2 2.56 eV Ion exchange
0.018 mol%
4. Nb-TiO2 2.9 eV Sol gel 0.0017 mol%
1. Grätzel et al. MRS Bulletin. 2005.2.Teoh et al. Catalysis Today. 20073. Khan et al. Appl. Surf. Sci. 20094. Salvador et al. Solar Energy Materials. 1980 0.03, 0.3, 1 mol% dopant

7
FSP Particle Synthesis
• TiO2:• 0.5 M TTIP in
Xylene/Acetronile(3:1)• Dopant Precursors :
– Fe: Iron Acetylacetonate– Nb: Niobium 2-
Ethylhexaonate– Ru: Ruthenium (III)
Acetylacetonate• 5/5 Flame
Mädler et al. J. Aerosol Sci. 2002
d

8
200 300 400 500 6000.0
0.5
1.0
1.5
2.0
2.5
Abs
orba
nce
Wavelength (nm)
TiO2
Bandgap Calculations
2.0 2.2 2.4 2.6 2.8 3.0 3.2 3.4 3.6 3.8 4.0 4.2 4.4 4.6 4.8 5.0 5.2 5.40
1
2
3
4
(hv
)(1/2
)
Eg =hv [eV]
TiO2
Indirect Semiconductorhvα = const (hv-Eg)2
hv = energy of incident photon [eV]
α = absorption coefficient [cm-1]
α = A/lA = Absorbance
(measured with UV-vis)l = cuvette length
UV-vis Spectrometry
Singh et al. International Journal of Hydrogen Energy. 2008.
9TiO2 0.03 mol% Fe 0.3 mol% Fe 1 mol% Fe
2.90
2.95
3.00
3.05
3.10
3.15
3.20
Eg
(
Eg
12
14
16
18
20
22
24
Rut
ile w
t%
Rutile wt%
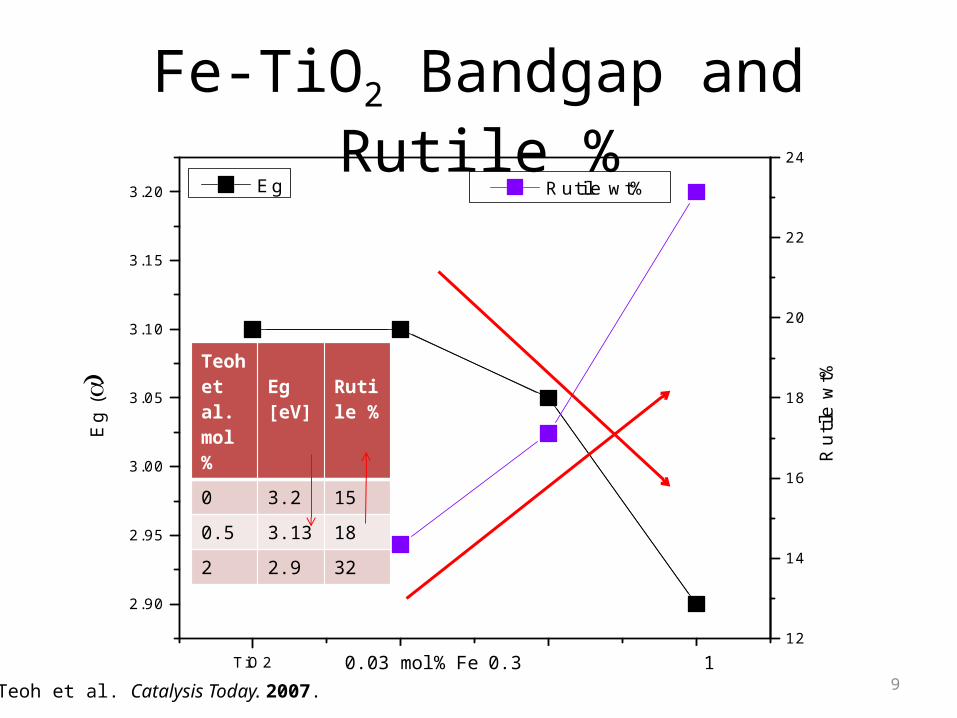
Fe-TiO2 Bandgap and Rutile %
Teoh et al.mol %
Eg [eV]
Rutile %
0 3.2 15
0.5 3.13 18
2 2.9 32
Teoh et al. Catalysis Today. 2007.0.03 mol% Fe 0.3 1
10
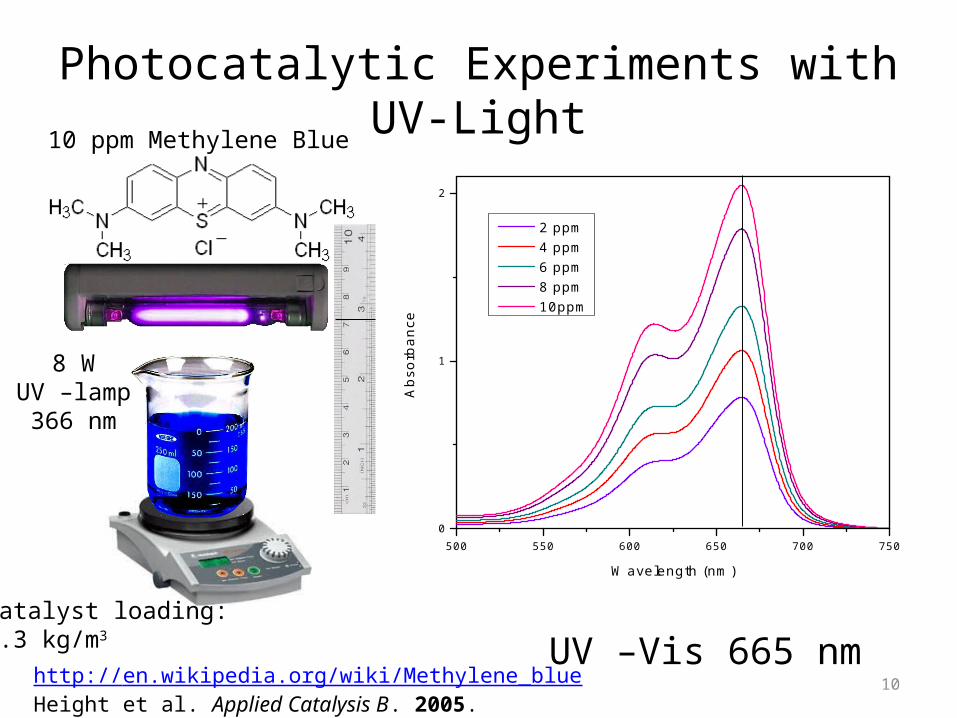
Photocatalytic Experiments with UV-Light
http://en.wikipedia.org/wiki/Methylene_blueHeight et al. Applied Catalysis B. 2005.
10 ppm Methylene Blue
Catalyst loading:0.3 kg/m3
8 WUV –lamp366 nm
500 550 600 650 700 7500
1
2
Abs
orban
ce
Wavelength (nm)
2 ppm 4 ppm 6 ppm 8 ppm 10ppm
UV –Vis 665 nm

11
UV-Photocatalytic Testing Fe-TiO2
0 10 20 30 40 50 60
0.4
0.5
0.6
0.7
0.8
0.9
1.0C
/C0
Time (min)
Control TiO
2
Fe 0.03 mol% Fe 0.3 mol% Fe 1 mol%
-0.5 kg(catalyst)/m3
-Hydrothermal doping-366 nm-100 ppm MB

12
TiO2 0.03 mol% Nb 0.3 mol% Nb 1 mol% Nb
2.90
2.95
3.00
3.05
3.10
3.15
3.20
Eg(
Eg
12
14
16
18
20
22
24
Rut
ile w
t%
Rutile wt%
Nb-TiO2 Bandgap and Rutile %
Nb2O5 Eg = 3.4 eV
Salvador et al. Solar Energy Materials. 1980.Teleki et al. Sensor. Actuator. B. 20070.03 mol% Nb 0.3 1
13
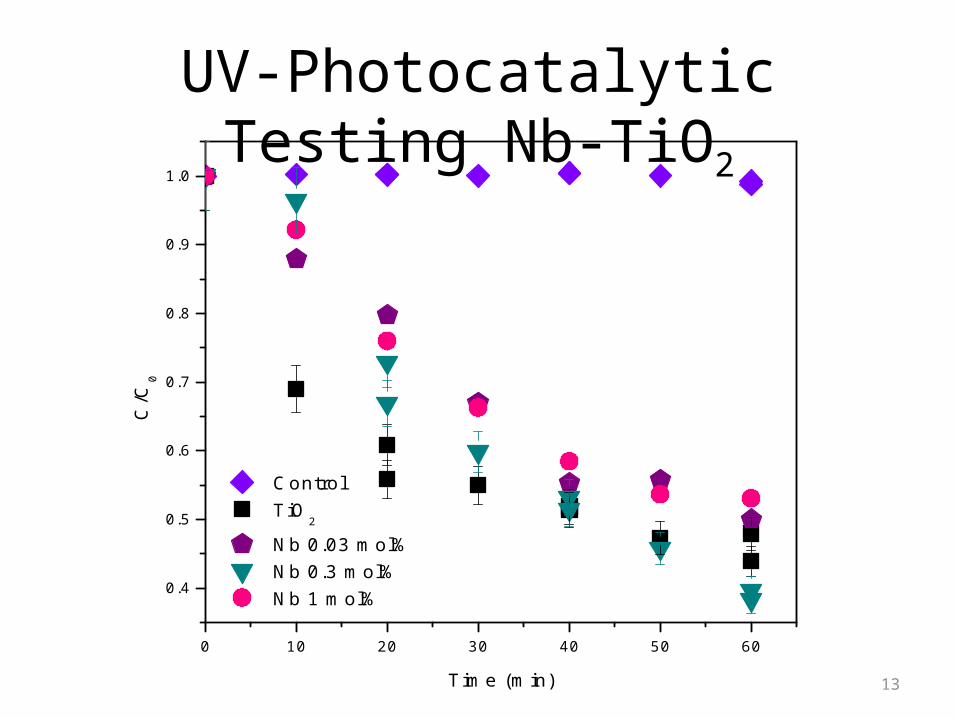
UV-Photocatalytic Testing Nb-TiO2
0 10 20 30 40 50 60
0.4
0.5
0.6
0.7
0.8
0.9
1.0
C/C
0
Time (min)
Control TiO
2
Nb 0.03 mol% Nb 0.3 mol% Nb 1 mol%

14
Nb-TiO2 Outperforms TiO2
0 10 20 30 40 50 60 70 80 90 100 110 1200.0
0.1
0.2
0.3
0.4
0.5
0.6
0.7
0.8
0.9
1.0
Control TiO
2
Nb 0.3 mol%
C/C
0
Time (min)

15TiO2 0.03 mol% Ru 0.3 mol% Ru 1 mol% Ru
2.90
2.95
3.00
3.05
3.10
3.15
3.20
E(
Eg
12
14
16
18
20
22
24
Rut
ile w
t%
Rutile wt%
Ru-TiO2 Bandgap and Rutile %
Ru02 Eg = 2.4 eV
Gujar et al. Electrochemistry Communications. 2007.0.03 mol% Ru 0.3 1

16
UV-Photocatalytic Testing Ru-TiO2
0 10 20 30 40 50 60
0.4
0.5
0.6
0.7
0.8
0.9
1.0
C/C
0
Time (min)
Control TiO
2
Ru 0.03 mol% Ru 0.3 mol% Ru 1 mol%

17
Conclusion
• TiO2 Bandgap reduced by FSP with Nb and Fe.• Highest bandgap reduction Fe- 1 mol%.• Highest photocatalytic activity under UV light
for Nb-TiO2 at 0.3 mol% by (2.95 eV).

18
Outlook
• Investigation of photocatalytic activity under visible light for Fe.
-1 kg(catalyst)/m3
-FSP-λ > 400 nm-10 oxalic acid
= 5 mol%
Teoh et al. Catalysis Today. 2007.

19
Future Work
• Synthesis of DSSC with best catalyst.

20
Appendix
• Bandgap Calculations• Photocatalytic Process

21
Photocatalytic Process
• Photo-generation of electron/hole pair
• Formation of radicals (Ox)
• Radical oxidation of organic compound
TiO2 hv
e- + h+
h+ + H2O OH + H+
e- + O2 O2-
O2- + H+ HO2
TOC + Ox TOC (partially oxidized species) +
CO2 + H2O
Kim et al. Catalysis Letters. 2007

22
TiO2 0.03 mol% Fe 0.3 mol% Fe 1 mol% Fe3
4
5
6
7
8
9
10
11
12
13
14
15
16
17
18
19
20
Ave
rage
Partic
le D
iam
eter (n
m)
dBET
dXRD, A
dXRD, R
0.03 mol% Fe 0.3 1
Anatase
Rutile
20 30 40 50 60
1 mol% Fe
Inte
nsity
(a.u
.)
2
TiO2
0.03 mol% Fe
0.3 mol% Fe
14.3 wt%
14.3 wt%
17.1 wt%
Rutile = 23.1 wt%
Fe-TiO2
Fe3+ ionic radius: 0.55 Å Ti4+ ionic radius is: 0.67 Å Wikipedia

23
TiO2 0.03 mol% Nb 0.3 mol% Nb 1 mol% Nb3
4
5
6
7
8
9
10
11
12
13
14
15
16
17
18
19
20 d
BET
dXRD, A
dXRD, R
Ave
rage
Partic
le D
iam
eter (n
m)
0.03 mol% Nb 0.3 1
Anatase
Rutile
20 30 40 50 60
Inte
nsity
(a.u
.)
2
1 mol% Nb
TiO2
0.03 mol% Nb
0.3 mol% Nb
14.3 wt%
18.0 wt%
17.1 wt%
Rutile = 13.71 wt%
Nb-TiO2
Nb5+ ionic radius: 0.64 Å Ti4+ ionic radius is: 0.68 Å Wikipedia

24
TiO2 0.03 mol% Ru 0.3 mol% Ru 1 mol% Ru3
4
5
6
7
8
9
10
11
12
13
14
15
16
17
18
19
20 d
BET
dXRD, A
dXRD, R
Ave
rage
Partic
le D
iam
eter (n
m)
0.03 mol% Ru 0.3 1
Anatase
Rutile
20 30 40 50 60
14.3 wt%
13.2 wt%
14.3 wt%
Rutile = 13.0 wt%
Inte
nsity
(a.
u.)
2
1 mol% Ru
TiO2
0.03 mol% Ru
0.3 mol% Ru
Ru-TiO2
Fe3+ ionic radius: 0.57.5 Å Ti4+ ionic radius is: 0.67 Å Wikipedia

250 10 20 30 40 50 60
0.4
0.5
0.6
0.7
0.8
0.9
1.0
C/C
0
Time (min)
Control TiO
2
Fe 0.03 mol% Fe 0.3 mol% Fe 1 mol%
Photocatalytic Testing with MB
Li et al. J. Hazardous Materias. 2008
-0.5 kg(catalyst)/m3
-Hydrothermal doping-366 nm-100 ppm MB
-1 kg(catalyst)/m3
-FSP-λ > 400 nm-10 oxalic acid
= 5 mol%
Teoh et al. Catalysis Today. 2007.
-0.5 kg(catalyst)/m3
-Impregnation methodn: Fe(NO3)3•9H2Oa: Iron acetylacetonate complex-300-400 nm-5 ppm oxalic acid
Navío et al. Journal of Molecular Catalysis A. 1996.
-1 kg(catalyst)/m3
-Impregnation methodn: Fe(NO3)3•9H2Oa: Iron acetylacetonate complex-λ > 400 nm-5 ppm oxalic acid
0.004 mol%
0.04 mol%

26

27
2.0 2.2 2.4 2.6 2.8 3.0 3.2 3.4 3.6 3.8 4.0 4.2 4.4 4.6 4.8 5.0 5.2 5.40
1
2
3
4
(hv
)(1/2
)
Eg =hv [eV]
TiO2
Bandgap Calculations
Indirect Semiconductorhvα = const (hv-Eg)2
hv = energy of incident photon [eV]
α = absorption coefficient [cm-1]
α = A/lA = Absorbance
(measured with UV-vis)l = cuvette length

28
2.0 2.2 2.4 2.6 2.8 3.0 3.2 3.4 3.6 3.8 4.0 4.2 4.4 4.6 4.8 5.0 5.2 5.40.0
0.5
1.0
1.5
2.0
2.5
3.0
(
hv)(1
/2)
Eg =hv [eV]
TiO2
1 mol% Fe 0.3 mol% Fe 0.03 mol% Fe
Bandgap Calculations Fe

29
Bandgap Calculations Nb
2.0 2.2 2.4 2.6 2.8 3.0 3.2 3.4 3.6 3.8 4.0 4.2 4.4 4.6 4.8 5.0 5.2 5.40.0
0.5
1.0
1.5
2.0
2.5
3.0 TiO
2
1 mol% Nb 0.3 mol% Nb 0.03 mol% Nb
(
hv)(1
/2)
Eg =hv [eV]

30
Bandgap Calculations Ru
2.0 2.2 2.4 2.6 2.8 3.0 3.2 3.4 3.6 3.8 4.0 4.2 4.4 4.6 4.8 5.0 5.2 5.40.0
0.5
1.0
1.5
2.0
2.5
3.0
(hv
)(1/2
)
Eg =hv [eV]
TiO2
0.03 mol% Ru 0.3 mol% Ru 1 mol% Ru

31
TiO2 BondOrbitals
Ti d + (O2p)
O2P + ( Ti d)
Ti d Eg = 3.2 eV
O2p
Energy
Conduction Band
Valence Band