sno 2 with ag nanoelectrodes for sensing ultra low acetone concentrations final presentation...
TRANSCRIPT

SnO2 with Ag Nanoelectrodes for Sensing Ultra Low Acetone Concentrations
Final PresentationSemester Project FS09
E. Buitrago Advisors: Dr. H. Keskinen and A. Tricoli
Particle Technology Laboratory
Swiss Federal Institute of Technology (ETHZ)
1

Outline
• Motivation• Tin Oxide• Silver• Experimental• Results• Conclusion• Outlook• Questions?
2

Motivation: Gas sensors for VOCs
• Certain VOCs in human breath = disease biomarkers:
Examples for disease markers in human breath:1
VOCs Disease
Ethane and pentane Oxidative stress
Methylated hydrocarbons Lung or breast cancer
Hydrocarbons (especially ethane and pentane) Oxidative stress
Isoprene Cholesterol metabolism
Acetone Diabetes mellitus, ketonemia
3
–Acetone2
–diabetic patients: 1.8 ppm– healthy individuals: 0.8 ppm.
1.Boguslaw et al., Biomed. Chromatogr., 21, 2007, 544.2. Wang et al., Chem. Mater.,20, 2008, 4894.

4Eranna et al., Crit. Rev. Solid State Mater. Sci., 29, 2004, 171.
Tin Oxides (35%)

5
Sensing of different metal oxides to various gaseous species.
Eranna et al., Crit. Rev. Solid State Mater. Sci., 29, 2004, 171.

6Zhao et al., Sens. Actuators, B., 115, 2006, 460.
SnO2 Dip coating 21 °CDry Air dXRD = 5 nm
Acetone(ppm)
Sens
itivi
ty
SnO2 Sensitivity to Low Concentrations of Acetone

Acetone in Breath Detection Challenges
• > 200 VOCs in human breath. 1
• VOCs present at trace levels:– i.e. ammonia: 0.8 ppm ,
ethanol: 0.1 ppm.2
• Breath saturated in H2O,
– H2O decreases SnO2
resistivity.3 7
1. Dang et al., J. Chromatogr., B810, 2004, 274.2. Boguslaw et al., Biomed. Chromatogr., 21, 2007, 554.3. Gaman et al., Russian Physics Journal, 51, 2008, 833.
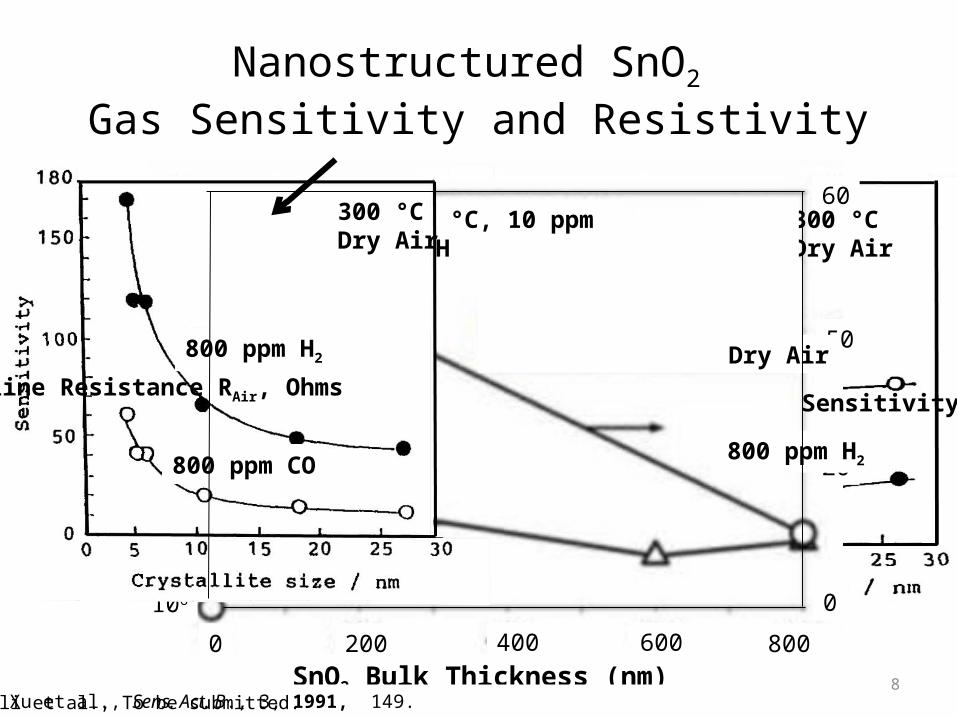
Nanostructured SnO2 Gas Sensitivity and Resistivity
SnO2 Bulk Thickness (nm)
1011
1010
109
108
107
106
0 200 400 600 800
50
60
20
0
320 °C, 10 ppm EtOHFSP
8Xu et al., Sens. Act. B., 3, 1991, 149.
300 °CDry Air
Dry Air
800 ppm H2
300 °CDry Air
Tricoli et al., To be submitted.
800 ppm H2
800 ppm CO
Base
line
Resi
stan
ce R
Air,
Ohm
s
Sens
itivi
ty

Film Resistance and Sensitivity
• Electrode geometry and minimal distance.1
• Film characteristics (porosity, thickness, material, etc.).
• Divide Sensitive and Conductive Functions!2
9
Interdigitated Electrodes
1. Shukla et al., International Journal of Hydrogen Energy. 33, 2008, 470.2. Tricoli et al., To be submitted.
SnO2/CuO Multi - Layer
Au Electrode40 mm

• Advantages–Ag lowest resistivity of all metals Ag: 15.87 nΩ·m,1 CuO: 0.1 Ω·m2 (20°C).–Can produce metallic Ag by flames.3
–Relatively cheap.4
–Ag can enhance sensitivity.4
10
Ag Nanoparticles as Nanoelectrodes
1.http://en.wikipedia.org/wiki/Resistivity2.Tsai et al., Acta Materialia, 57, 2008, 1570.3.Keskinen et al., Journal of Nanoparticle Research. 9, 2007, 569.4.http://www.kitco.com/market/us_charts.html5.Kim et al., Thin Solid Films. 516, 2008,198.

FSP Direct Deposition and In-situ Flame Annealing
• SnO2:– 0.5M Tin (II) ethylhexanoate in
Xylene• Ag:
– 0.01 M AgNO3 in ethanol, ethylhexanoate acid (1:1 ratio)
5/5 FlameDep time: 15 s
• Anneal:– Xylene– 12/5 Flame– Anneal time: 25 s
Mädler et al. Sens. Actuators, B. 2006.11
Tricoli et al. Adv. Mater., 20, 2006, 3005.

Ag Nanoelectrodes-Anneal
12
Before in-situ anneal15 s
After in-situ anneal

Deposition Time
13
15 seconds 60 seconds
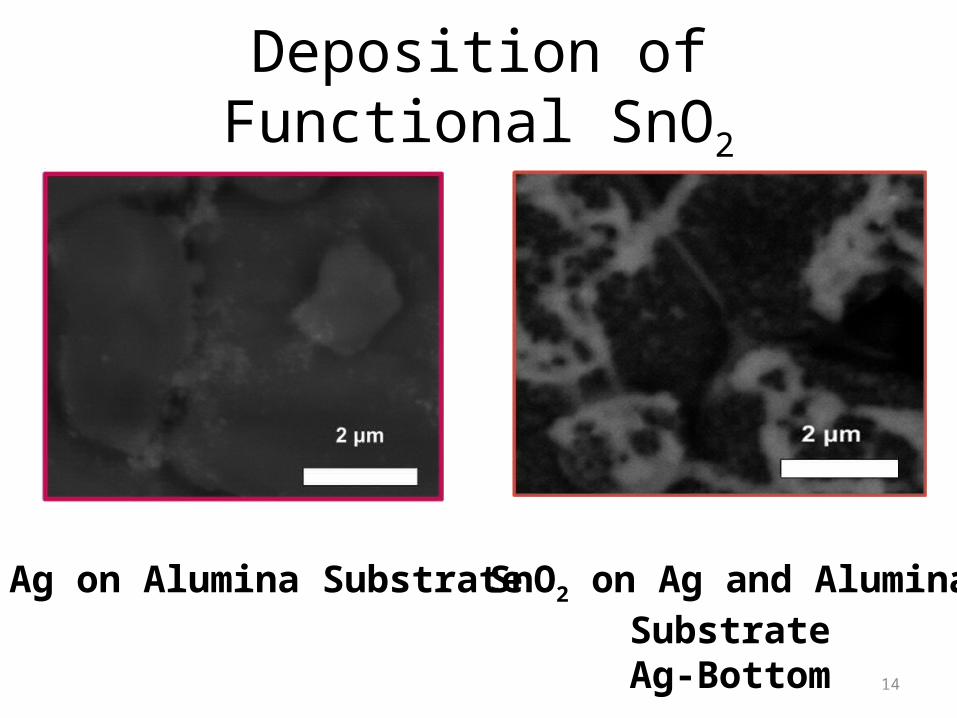
Deposition of Functional SnO2
14
Ag on Alumina Substrate SnO2 on Ag and AluminaSubstrate
Ag-Bottom

Qualitative Effect of Anneal on Glass Substrate
15
Ag-Bottom- No AnnealGlass Substrate
Ag-Bottom- Annealed
~3.3 μm~0.4 μm

Sensor Testing
Teleki et al., Sens. Actuators, B.,119, 2006, 684.16
Synthetic dry air
Acetone
T = 320 °C
Water Vapor
(1) Tubular furnace, (2) Quartz tube(3) Sensor, (4) Gold wiring
S = Rair/Ranalyte

Characterization of Ag Nanoelectrodes
17
320 °C Dry Air
Substrate
0 15 30 45 60101
102
103
104
105
106
B
asel
ine
Res
ista
nce
RA
ir [M
]
Deposition Time (seconds)
Ag-Not Annealed
0 15 30 45 60101
102
103
104
105
106
B
asel
ine
Res
ista
nce
RA
ir [M
]
Deposition Time (seconds)
Ag-Not Annealed Ag-Annealed
0 15 30 45 60101
102
103
104
105
106
B
asel
ine
Res
ista
nce
RA
ir [M
]
Deposition Time (seconds)
Ag-Not Annealed Ag-Annealed SnO
2
SnO2
0 15 30 45 60101
102
103
104
105
106
B
asel
ine
Res
ista
nce
RA
ir [M
]
Deposition Time (seconds)
Ag-Not Annealed Ag-Annealed SnO
2
Ag-Bottom
Ag-Bottom

18
Substrate
+ -
e- e- e-
O -
O -
O -
O - O
- O -
CH3COCH3 CO2, H2O
R SnO2
R Ag
1/R =1/RAg +1/RSnO2
RSnO2
CH3COCH3 (gas) + 8O- (adsorbed) 3CO2 (gas) +3H2O (gas) +8e- (conduction band)
Qin et al., Nanotechnology. 19, 2008, 7.
R Response
S = RDry Air/RAcetone

Reproducibility
190.0 0.2 0.4 0.6
1.0
1.2
1.4
1.6
1.8
2.0
2.2
SnO2-1
Sen
sor R
espo
nse
S =
RA
ir /R
Ace
tone
Acetone (ppm)
0.0 0.2 0.4 0.6
1.0
1.2
1.4
1.6
1.8
2.0
2.2
SnO2-1
SnO2-2
Sen
sor R
espo
nse
S =
RA
ir /R
Ace
tone
Acetone (ppm)
0.0 0.2 0.4 0.6
1.0
1.2
1.4
1.6
1.8
2.0
2.2
SnO2-1
SnO2-2
SnO2-Average
Sen
sor R
espo
nse
S =
RA
ir /R
Ace
tone
Acetone (ppm)
320 °C0% RH

-0.1 0.0 0.1 0.2 0.3 0.4 0.5 0.6 0.7
1
2
3
4
SnO2
Sen
sor R
espo
nse
S =
RA
ir /R
Ace
tone
Acetone (ppm)
Ag-Bottom vs. SnO2 under Dry Conditions
20
320 °CDry Air
Wang et al., Chem. Mater.,20, 2008, 4894.
350 °C10% Cr doped WO3
-0.1 0.0 0.1 0.2 0.3 0.4 0.5 0.6 0.7
1
2
3
4
Ag-Bottom SnO
2
Sen
sor R
espo
nse
S =
RA
ir /R
Ace
tone
Acetone (ppm)
~40%
-0.1 0.0 0.1 0.2 0.3 0.4 0.5 0.6 0.7
1
2
3
4
Ag-Bottom SnO
2
Wang et al. 2008
Sen
sor R
espo
nse
S =
RA
ir /R
Ace
tone
Acetone (ppm)

0.0 0.2 0.4 0.6
1.00
1.05
1.10
1.15 SnO2
Sen
sor R
espo
nse
S =
RR
H=80%
/RA
ceto
ne R
H=80%
Acetone (ppm)
0.0 0.2 0.4 0.6
1.00
1.05
1.10
1.15 Ag-BottomSnO
2
Sen
sor R
espo
nse
S =
RR
H=80%
/RA
ceto
ne R
H=80%
Acetone (ppm)
Effect of RH, Closer to Real Conditions
21
320 °C80% RH
S =RRH=80%/RAcetone RH=80%
~9%

Ag-Bottom Selectivity under Dry Conditions
22
320 °CDry Air
~40%
0.0 0.2 0.4 0.6
2
4
Ethanol
Sen
sor R
espo
nse
S =
RA
ir /R
Analy
te
Analyte(ppm)
0.0 0.2 0.4 0.6
2
4
Acetone Ethanol
Sen
sor R
espo
nse
S =
RA
ir /R
Analy
te
Analyte(ppm)

0.0 0.2 0.4 0.6
1.0
1.1
1.2
Acetone Ethanol
Sen
sor R
espo
nse
S =
RR
H=80%
/RA
naly
te R
H=80%
Analyte(ppm)
Ag-Bottom Acetone Selectivity 80% RH
23
320 °C80% RH

Conclusions
• Conductive path already with Ag 15 s, annealed.• Detection of < 0.6 ppm acetone possible with
ultra thin SnO2 and nanostructured Ag/SnO2.
• Ag-Bottom 40% more sensitive than SnO2 0% RH, 9% in 80% RH, acetone.
• Ag-Bottom selective to acetone 0% RH.• Acetone and ethanol sensitivity comparable 80%
RH.
24

Outlook
• TiO2 doped Ag-Bottom sensor testing- decrease cross sensitivity to humidity.
• Repetition ethanol humidity Testing.• “Home-made” FSP-made sensor testing and
characterization.
25
Acknowledgments
• Dr. Helmi Keskinen• Antonio Tricoli• PTL Lab
26

Thank you for your attention,
Questions?27

Appendix
• XRD• Thermal Stability Ag• Effect Ag addition, Resistance• Dry and Humid Air Trace• Portable Gas sensors• High Concentration mini-p results
28

20 25 30 35 40 45 50
2degree20 25 30 35 40 45 50
2degree20 25 30 35 40 45 50
2degree
XRD Results
29
: SnO2
: Ag: Al2O3
: Au
Au + Al2O3 Substrate
SnO2 FilterdXRD = 12 nm
Ag-Bottom
Ag 8 mindXRD = 20 nm
SnO2-Only
15 s. Depositiontime
Ag Nanoparticles as Nanoelectrodes
• Disadvantages– Low thermal stability in air, < 500°C.
30Akhavan et al. Applied Surface Science., 2007, 254, 548.

Low Thermal Stability High Resistances
31
Sheet resistance variation with Ag Thickness, different temperatures. SEM. Akhavan et al. Applied Surface Science., 254, 2007, 548.
a) As deposited Agb) 500 °Cc) 700 °C1 hour anneal in dry air

Ag Nanoparticles as Nanoelectrodes
• Disadvantages– Low thermal stability at low temperatures in
air, < 500°C.1
– Melting point depression for decreasing grain sizes. 10 nm < 760 K, bulk: 1233 K.
32Shyjumon et al. The Eur. Phys. J. D., 37, 2006, 309.
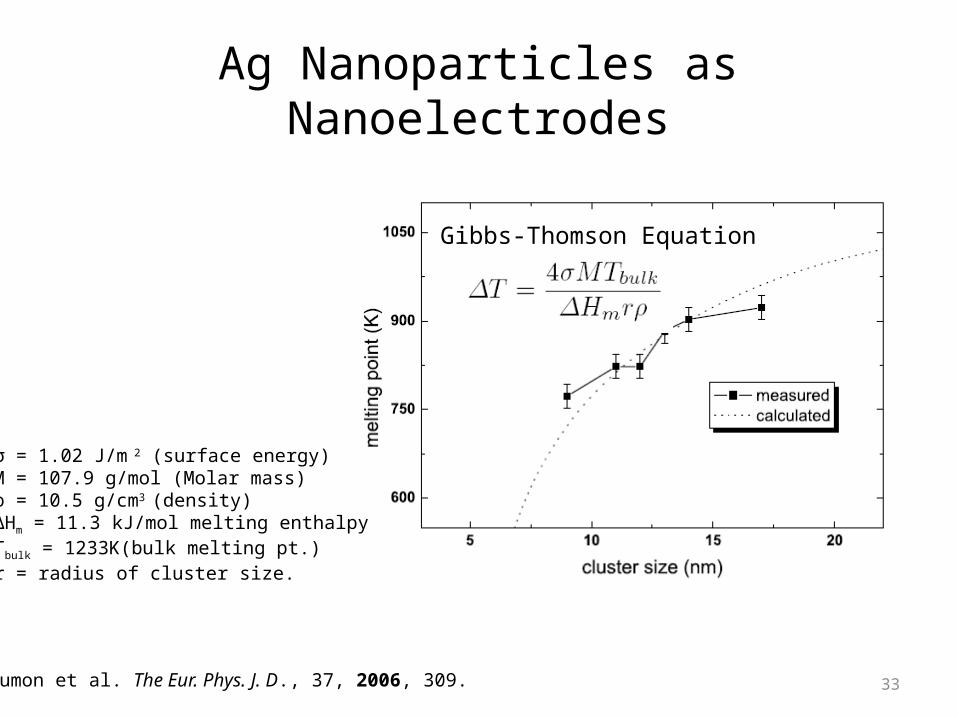
Ag Nanoparticles as Nanoelectrodes
33
Gibbs-Thomson Equation
Shyjumon et al. The Eur. Phys. J. D., 37, 2006, 309.
σ = 1.02 J/m 2 (surface energy)M = 107.9 g/mol (Molar mass)ρ = 10.5 g/cm3 (density) ∆Hm = 11.3 kJ/mol melting enthalpyTbulk = 1233K(bulk melting pt.) r = radius of cluster size.

Ag Nanoelectrodes
34
1 hour, O2 Atmosphere
Kim et al., Thin Solid Films. 2008, 516, 198

Sensitive to Ultra Low Concentrations of Acetone
353500 4000 4500 5000 5500 6000
4.0x10⁸
8.0x10⁸
1.2x10⁹
1.6x10⁹
Ohm
s
time (secs)
RH=0, 0 ppm
0.1 ppm
0.2
0.5
0.6
Ag-Bottom320 °C0% RH
S= RDryAir/RAnalyte

Ag-Anneal 80%, Acetone Response
36
80% RH, 0 ppm Acetone
0.1 ppm
0.2 ppm
0.5 ppm
0.6 ppm
23000 23500 24000 24500 25000 255001.5x106
2.0x10⁶
2.5x10⁶
3.0x10⁶
3.5x10⁶
Ohm
s
Time (secs)
Ag-Bottom
S= RRH=80%/RRH=80%, Analyte

Portable Micro Gas Sensors
37Kühne et al., J. Micromech. Microeng., 18, 2008, 035040 Tricoli et al., Adv. Mater., 20, 2008, 3005
Baseline 109 ohm, Optimal Baseline 107 ohm
Microhotplate back-heating
SnO2
300 mm

0 5 10 15 20 25 30 35 40 45 50 55
1
10
100
Acetone Ag-Bottom Acetone Ag-Top Acetone SnO
2-Only
Sensor
Response, S
Acetone Concentration, ppm
Acetone Sensor Response, Low Concentrations
38
T = 320 °CSynthetic dry air
S = Rair/Ranalyte
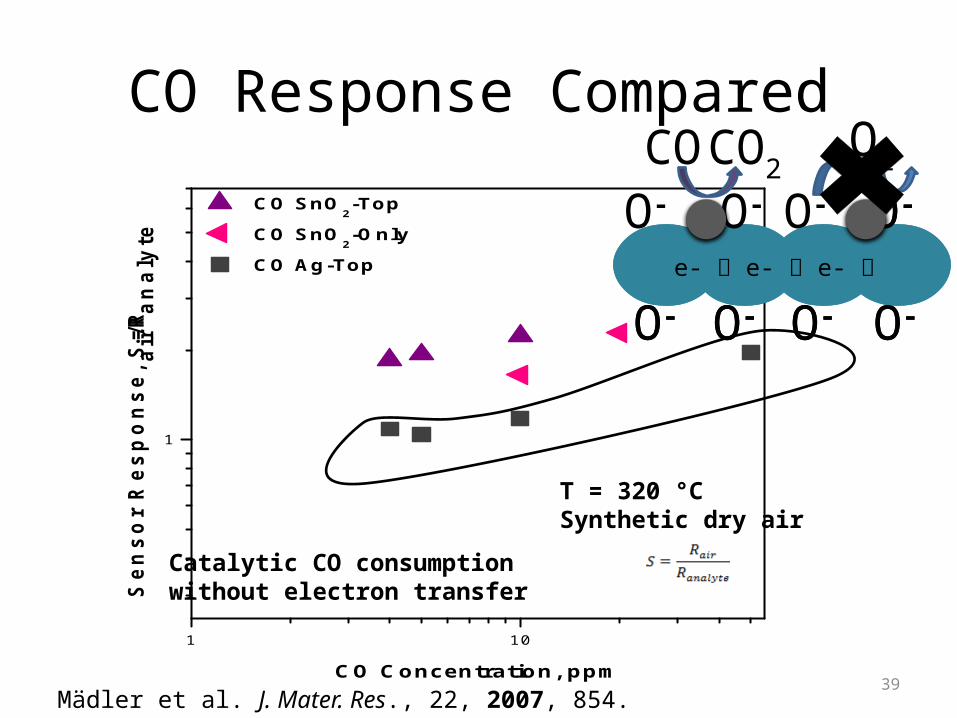
1 10
1
CO SnO2-Top
CO SnO2-Only
CO Ag-Top
Sensor
Response, S
=R
air/
Ranaly
te
CO Concentration, ppm
CO Response Compared
39
T = 320 °CSynthetic dry air
O- O- O-
O-O-O- O-e- e- e-
O- O-
O-O-O- O-
e- e- e-
O2
Mädler et al. J. Mater. Res., 22, 2007, 854.
CO CO2
Catalytic CO consumptionwithout electron transfer