the effect of all-trans retinoic acid and fatty …
TRANSCRIPT

THE EFFECT OF ALL-TRANS RETINOIC ACID AND FATTY ACIDS ON
MCF-7 BREAST CANCER CELL PROGRESSION
A Thesis
presented to
the Faculty of California Polytechnic State University,
San Luis Obispo
In Partial Fulfillment
of the Requirements for the Degree
Master of Science in Agriculture, with Specialization in Food Science and Nutrition
By
David Adam Brown
October, 2009

ii
© 2009 David Adam Brown
ALL RIGHTS RESERVED
COMMITTEE MEMBERSHIP
iii
TITLE: The Affect of All-trans Retinoic Acid and Fatty
Acids on MCF-7 Breast Cancer Cell Progression
AUTHOR: David Adam Brown
DATE SUBMITTED: October, 2009
COMMITTEE CHAIR: Susan Hawk COMMITTEE MEMBER: Scott Reaves COMMITTEE MEMBER: Lisa Nicholson
ABSTRACT
The Affect of All-trans Retinoic Acid and Fatty Acids on MCF-7 Breast Cancer Cell
Progression

iv
By
David Adam Brown
Vitamin A metabolites and retinoids may slow the progression of breast cancer
and elicit anti-neoplastic properties similar to those of omega-3 fatty acids. Studies using
animal models show a decrease in the incidence, growth and metastisis of mammary
tumors in the presence of specific fatty acids. This effect is also seen with use of
retinoids, specifically all-trans retinoic acid (AtRA). Thus, fatty acids may also alter
retinoid homeostasis in mammary carcinoma cells (MCF-7s). The potential for inter/co
dependency among fatty acids and retinoids is considerable, and here it has been
hypothesized that a decrease in cancer progression will occur in the presence of both
compounds. MCF-7’s were seeded in a 48 well plate at 5,000 cells per well. After 24 hr,
cells were treated with either 1 µM AtRA alone, fatty acids alone, or AtRA + fatty acids.
Fatty acid treatments (Linoleic, and Linolenic) were administered at 2.5 uM
concentrations. Each fatty acid treatment was also combined with 1 µM AtRA to
determine if there is a synergistic effect on slowing cell growth. Both culture media and
treatments were changed at 24 hour intervals over a 3 day trial. When compared to the
controls, cells treated with 1 µM AtRA or 2.5 µM Linolenic acid both inhibited cell
growth. Interestingly, when combined with Linolenic acid, AtRA treatment resulted in a
significant (nearly 50%) additional growth inhibition when compared to treatment with
AtRA alone. Our results suggest that AtRA and Linolenic acid have a inter/co
dependency that significantly inhibits breast cancer cell growth in vitro by 73.4 %
compared to control, and 49.7% compared to AtRA alone over 72 hours. We conclude

v
that AtRA and linolenic acid have a combined effect in breast cancer cell proliferation in-
vitro and their role in dietary prevention warrants further investigation.
ACKNOWLEDGEMENTS While there were many people involved in the completion of this thesis, I will simply name a few. Lisa Nicholson, Scott Reeves, and Susan Hawk-Woody were incredibly gracious with their time and effort in helping me succeed. Thank you for every moment you provided me over the last couple years. I would like to extend my sincere gratitude to Jessica Yee and Diana Rios for being incredible lab partners, and always helping me succeed. Dan Peterson was my greatest inspiration as a professor, and taught

vi
me the meaning of responsibility. My wife Michelle was unwavering, even in the tough moments. Finally, I would like to dedicate the completion of this thesis to my late father. Thank you Dad.
TABLE OF CONTENTS
Page LIST OF FIGURES…………………………………………………………………..…. ix
CHAPTER
I. INTRODUCTION...................................................………………........................1
II. LITERATURE REVIEW.........................................……………….......................4
vii
2.1: Breast Cancer…………………………………………………………………4
2.2: Retinoic Acid and Breast Cancer………………………………………..……9
2.3: Fatty Acids and Breast Cancer………………………………………………12
2.4: Fatty Acids…………………………………………………………………..15
2.4.1: Omega 3 Fatty Acids……………………………………...………16
2.4.2: Omega 6 Fatty Acids………………………………………...……17
2.4.3: Monounsaturated Fatty Acids……………………………………..18
2.4.4: Conjugated Linoleic Acid………………………………………....19
2.4.5: Trans Fatty Acids………………………………………………….19
2.5: Vitamin A…………………………………………………………………...20
2.6: Nuclear Hormone Receptors….…………………………………………….25
2.7: Nutrient Delivery System……………………………………………...……27
III. MATERIALS AND METHODS………………………………………….……29
3.1: Experimental Design/Purpose……………………………………………....29
3.2: Materials…………………...………………...……………………………...29
3.3: Cell Experiments…………………………………………………………....29
3.4: Cell Treatments……………………………………………………………..30
3.5: Cell Proliferation Assay…………………………….………………….……31
3.6: Cell Proliferation Quantification……………………………………...…….31
IV. RESULTS………………………………………..………………………..…….32
4.1: AtRA and Linolenic Acid Combined Treatment Results…………...………35
4.2: Statistical Analysis…………………………………………………………..35
V. DISCUSSION...………………..………………………………………………...37
BIBLIOGRAPHY…………………………………….……………………………….…40
viii
APPENDICES…………………………………………………………………………...45
Appendix A: Cyquant Cell Proliferation Protocol ………………………………………45
Appendix B: Hemacytometer Protocol ………………………………………………….47
Appendix C: Complete Expanded Results ……………………………………………....48 Appendix D: Liposome Delivery System Results…………………………………….…51
Appendix E: Minitab Output……………………………………………………….……53
LIST OF FIGURES
Page
2.1.1 Image of Chromosome 17, and Chromosome 13, with location of BRCA1 and
BRCA2 respectively…………………………………………….…………….……..……7
2.2.1 RXR partner binding sites…………………………………………………………12
2.5.1 Retinol conversions (a) and binding sites (b) intracellularly………………………22
2.6.1: PPAR alpha and gamma pathways………………………………………………..26
3.1: View of hemacytometer grid (10x) and cells. Cells are counted in the squares and determine the amount of cells in solution following calculation……………………...…30 4.1: Molecular Probes Cyquant Kit: AtRA………..………..……………………………32
ix
4.2: Cell Proliferation Assay. Standard curve for cell growth under varying amounts of
AtRA delivered in vitro……………………………………………………….………....33
4.3: Cell Proliferation Assay: Data presented as percent of control…………………..…34
4.4: Molecular Probes Cyquant Kit: 72 hours, AtRA and Fatty Acids…………………..34
4.5: AtRA refeeding is significantly more effective at decreasing MCF-7 cell growth over
72 hours compared to a single treatment……………...………………………………....35

1
Chapter 1
INTRODUCTION
All-trans retinoic acid (AtRA), the intracellular derivative of vitamin A, has been
shown to slow the progression of human mammary carcinoma cells (MCF-7) in vitro
(Danforth 2004, Cho et al. 2007). Of perhaps equal importance is the role by which fatty
acids contribute to tumor growth and stability. With both AtRA and intracellular fatty
acid involvement with the nuclear hormone family of receptors, the possibility of
synergism is substantial. Interestingly, altered nuclear receptor activity is known to
increase carcinogenesis (Chamras et al. 2002). In either situation, both retinoids and fatty
acids are directly involved with the cells ability to undergo apoptosis (Okamoto et al.
2000)
AtRA is responsible for cell growth, differentiation, and apoptosis (Liu et al.
1996). This control is mediated via hormone receptors in the nucleus. MCF-7 cells have
shown diminished hormone receptor efficiency which results in a decreased availability
of AtRA. The result is a reduced amount of a ligand which promotes apoptosis via
genetic transcription (Budhu 2002). The steroid-thyroid receptor super-family includes
the retinoic acid receptor (RAR and RXR), which also includes receptors for estrogen and
vitamin D (Tighe 2004). Recently, it has been shown that many carcinogenic cell types
are missing retinoic acid receptors. Because retinoic acid seems to induce apoptosis, an
accumulation of receptor deficient cells could be unresponsive to normal retinoic acid
levels and therefore not undergo normal cellular death required for optimal health of the
organism (Merino 2003). There are many pathways involved in this process and include
those involving fatty acids.

2
Fatty acids have been under extreme scrutiny for their involvement in breast
cancer incidence and progression. Both the protective effects of omega-3 fatty acids
(linolenic), and the enhancing effects of omega-6 fatty acids (linoleic) have been
demonstrated in the literature (Cohen et al. 1986, Chajès et al. 1995). While there is yet to
be substantial evidence to directly link linoleic acid to breast cancer in vivo, animal
studies, which have shown diminished breast cancer progression as a consequence of
linolenic acid treatment (Reyes et al. 2004). Epidemiological studies also link fish oil, a
classic source of omega-3, intake with lower breast cancer incidence (Rose 1999).
Peroxisome proliferator-activated receptors (PpAR), members of the nuclear hormone
signaling family are directly involved with breast cancer tumorogenesis (Thoennes et al.
2000). Interestingly, Linolenic acid acts as an agonist to this receptor and therefore has
yielded increased apoptosis in MCF-7 cells (Menendez et al. 2001). Using this acid
presents a viable option to creating new and effective cancer treatments and establishing
preventative lifestyle behavior choices.
Separate investigations have confirmed the use of both AtRA and Linolenic acid
to slow breast cancer proliferation in vitro by establishing a higher rate of apoptosis (Liu
et al. 1996, Budhu 1996). Here, we combine the two treatments to investigate the
synergism. We show that physiological treatments of both AtRA and linolenic acid
further increase apoptosis when compared to each treatment alone. We believe the
explanation is found on the surface of the nucleus where nuclear transporters are changed
dramatically in a carcinogenic cell. The PpARy receptor and RXR receptor act together
as a dimer and have a unique response element (PpARE) (Kim 2003). Up-regulation of
this genetic activity seems to slow cancer proliferation, and is a viable explanation for our

3
observation of AtRA and linolenic acid as cancer treatments in vitro. Clearly, the
functional significance of these findings will require further investigation.
Chapter 2

4
LITERATURE REVIEW
2.1 Breast Cancer
Breast cancer is the second leading cause of death from cancer among American
women (Reyes et al. 2004). It is estimated that 217,440 new cases of this cancer was
diagnosed, and over 40,000 deaths occured in 2005 alone (Reyes et al. 2004). Age is one
of the strongest risk factors in breast cancer. In women under the age of 30, breast cancer
is very uncommon. The incidence rate begins to increase between ages 35 and 39 years
and does not plateau until age 80 (Reyes et al. 2004). Breast cancer incidence is also
influenced by race. In the United States, breast cancer risk is slightly higher in whites
than in African Americans, although the incidence of early-onset cancers is higher in
African Americans (Kuhajda 2000). Incidence rates are markedly lower in other racial
and ethnic groups (Korde et al. 2004). The most common types of breast cancer occur in
the lining of the ducts or in the lobules of the breast. Atypical ductal hyperplasia results
in an overactive growth of cells lining the breast ducts, while lobular carcinoma results in
uncontrolled growth of lobular cells.
On average, women have a 10% to 14% chance of having breast cancer by the time
they reach 90 years of age (Reyes et al. 2004). Women at increased risk may have a
strong family history of breast cancer, a known or suspected genetic predisposition for
the disease, a history of radiation therapy, a previous problem of the breast, and a 5-year
Gail model risk of 1.67% or greater (Murff et al. 2004).
There are two types of models used in breast cancer risk assessment--those that
estimate the risk of breast cancer over time and those that estimate the risk of a mutation
in one of the BRCA genes. These models are the Gail and Claus models, respectively. The

5
current version of the Gail model estimates the 5-year and lifetime risks of breast cancer
by incorporating risk factors such as age, age of menarche, and age of 1st pregnancy. A 5-
year risk of 1.67% is considered elevated risk (Korde et al. 2004). The Gail model has
proven to be very limited as it fails to incorporate paternal family history and ovarian
cancer family history (Murff et al. 2004). In contrast, the Claus model is useful because it
bases risk on family history of breast and ovarian cancers on both the maternal and
paternal lineage. These two models compliment each other well, and together help
women to define their risk of developing breast cancer. Defining risk can also prepare
both physicians and patients for effective treatment. The only true shortcoming of these
models is the continuing evidence that breast cancer is simply a mutation on the genome.
Breast cancer treatments vary depending on the advancement of the cancer, and the
patient’s response to each treatment. The best opportunity to reduce mortality is through
early detection (Maggiora et al. 2004). Generally, the location and size of the tumor in the
breast and the extent of the disease in the armpit and the rest of the body will determine
treatment options. Breast cancer progresses in stages. Stages 0-II are termed early stages,
where the severity is a small tumor 1-2 inches in diameter with little or no lymph node
invasion. Stage III is a progression towards the complete metastatic invasion known as
type IV. The final stage is the most severe and advanced because of the extensive tissue
invasion and malignancy (Maggiora et al. 2004). To develop a treatment plan to fit each
patient's needs, the doctor also considers the woman's age and general health, as well as
her feelings about the treatment options. The primary method of treatment is surgery.
Few patients elect to bypass this option, as it is considered necessary to stop the cancer
progression. The lumpectomy procedure removes a tumor from the breast, while a

6
mastectomy removes a portion of, or the entire breast. The need of the mastectomy is
based on the progression of the cancer, and the literal “spread” of the cancer. This
depends on the number of tumors in the area, as well as the condition of the local
lymphnodes (Wiseman 2004).
The second step in treating cancer is radiation therapy, which uses x-rays and other
radioactive materials to kill cancer cells. The radiation disrupts cell growth by destroying
DNA and cell membranes (Serrano et al. 2004). This can be performed externally or
internally depending on the growth of the cancer, and is effective when the cancer can be
targeted in a specific area of the body.
The third step is chemotherapy, which is the use of chemical agents to either
destroy dividing cells or stop their division. Chemotherapy can be localized, but in
general is a systemic treatment. Gleevec, a pharmaceutical agent, inhibits cancer cell
growth by inducing apoptosis. It binds to abnormal proteins in cancer cells, blocking
uncontrolled cell growth. Because it binds only to these abnormal proteins, Gleevec does
not show the high levels of toxicity exhibited by other chemotherapy drugs (Abou-Jawde
et al. 2003).
The fourth and final treatment step is the use of hormone therapy. Hormone therapy
can be used throughout the entire treatment process; however it is only applicable for
certain types of breast cancer. In 1998, the Food and Drug Administration approved
Nolvadex (tamoxifen citrate), which interferes with the activity of estrogen to reduce the
incidence of breast cancer in women at high risk for developing the disease (Merino et al.
2003). It is used as an additional type of therapy in conjunction with other steps in
fighting the cancer (Abou-Jawde et al. 2003). The anti-proliferative effects of Tamoxifen
7
have been attributed to the inhibition of protein kinase C and its calmodulin binding
(Abou-Jawde et al. 2003). The activity of these proteins is directly connected to the
known breast cancer susceptibility genes.
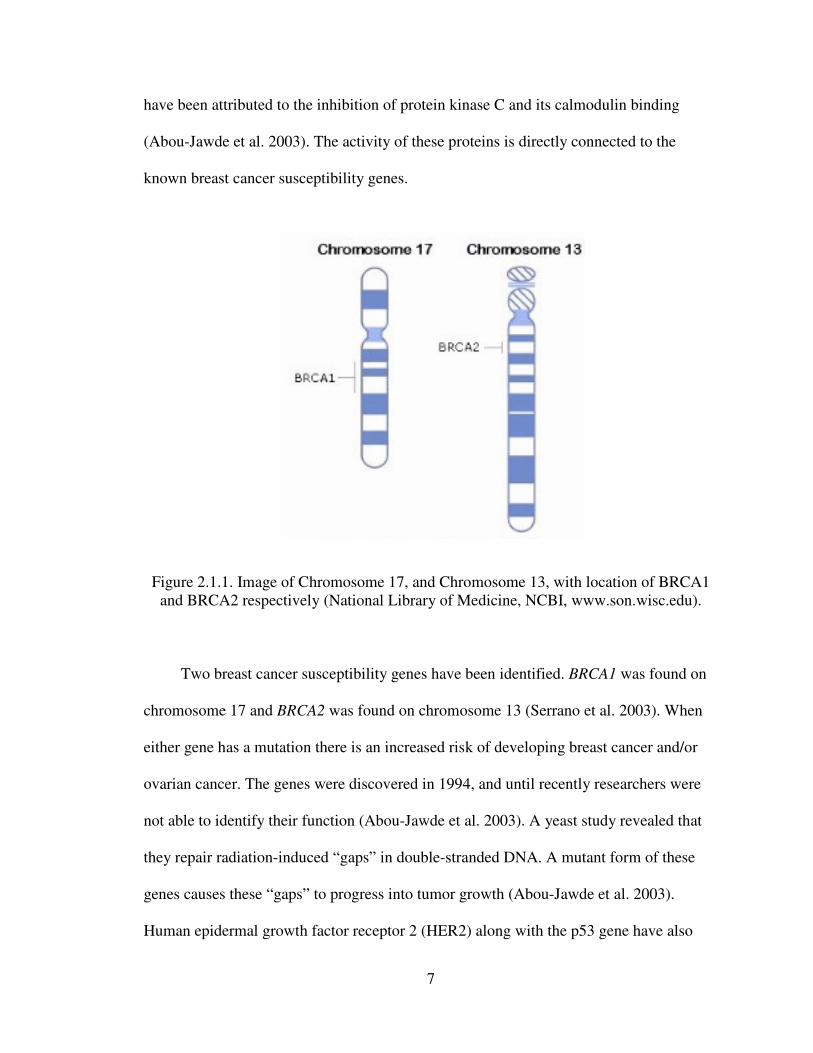
Figure 2.1.1. Image of Chromosome 17, and Chromosome 13, with location of BRCA1
and BRCA2 respectively (National Library of Medicine, NCBI, www.son.wisc.edu).
Two breast cancer susceptibility genes have been identified. BRCA1 was found on
chromosome 17 and BRCA2 was found on chromosome 13 (Serrano et al. 2003). When
either gene has a mutation there is an increased risk of developing breast cancer and/or
ovarian cancer. The genes were discovered in 1994, and until recently researchers were
not able to identify their function (Abou-Jawde et al. 2003). A yeast study revealed that
they repair radiation-induced “gaps” in double-stranded DNA. A mutant form of these
genes causes these “gaps” to progress into tumor growth (Abou-Jawde et al. 2003).
Human epidermal growth factor receptor 2 (HER2) along with the p53 gene have also

8
been shown to be causative factors when their mutations lead to breast cancer (Abou-
Jawde et al. 2003).
Lifestyle choices are a very important area of interest when determining possible
sources of cancer development. Dietary influences have been heavily explored as of late,
and have produced many promising links between diet and cancer. Vitamin A (retinoids)
has been shown to play a major role in the progression of breast cancer cells in vitro
(Merino et al. 2003). This important vitamin can change its role on the molecular level
when not readily converted to its active form (retinoic acid) and leads to unnatural control
over the human genome yielding cancerous growth. Scientists currently believe that the
link between fatty acids and breast cancer is also substantial. Saturated fatty acids have
been termed carcinogenic for some time, and omega 6 fatty acids seem to be following
that trend and have been linked to breast cancer incidence (Thoennes et al. 1999).
On the contrary, antioxidant-rich foods protect normal cellular growth processes.
Polyphenols, vitamin C, and Vitamin E have been toted as the great cancer preventors.
While studies show these factors to be greatly protective against oxidative and free
radical damage, there is little evidence to support these facts on the molecular and
genomic level for breast cancer (Mezzetti 2001). While scientists may not argue against
having a vegetable rich diet to help prevent cancer, the conclusive evidence for such has
yet to be uncovered.
Diet is not the only lifestyle choice influencing cancer risk. Epidemiologic data
regarding physical activity suggest a 20% to 30% reduction in the risk of breast cancer in
women who are physically active compared with those who are inactive (Wiseman
2004). In addition, moderate to heavy alcohol intake (more than 45 g of alcohol, or three

9
drinks, per day) has been shown to increase the risk of cancer, in a dose-response
relationship (Wiseman 2004). High alcohol consumption causes the liver to be less
effective at controlling estrogen levels in the body. This results in increased estrogen
exposure to cells, and an increase in the chance of cancerous cell growth.
High levels of hormones, particularly estrogens, have been shown to be associated
with increased breast cancer occurrences (McClelland 2004). Another theory claims that
breast cancer progresses over time, and only becomes a clinical disease later in life
(Wiseman 2004). The decisions women make regarding different hormone therapies
influence breast cancer risk. These decisions include the use of oral contraceptives,
excessive exercise, and hormone replacement therapy. The increased exposure of breast
tissue to estrogen during these treatments has a direct link as a risk factor. The use of
hormone replacement therapy for the difficulties of menopause has also been shown to
increase cancer susceptibility from 5-40% (Wiseman 2004). Oral contraceptive use has
been controversial about its potential increase in breast cancer risk. However, the most
recent data suggests that oral contraceptive use is not associated with increased risk of
breast cancer (Korde 2004).
2.2 Retinoic Acid and Breast Cancer
The vitamin A metabolite retinoic acid (RA) and its derivatives are effective
chemotherapeutic agents in the treatment of a number of types of cancer, including
tumors of lung, breast, head and neck, and blood (Sun et al 1997). The historical and
most significant finding to date has been the use of retinoids to treat acute promyelocytic
leukemia (APL) (Jimenez-Lara et al. 2004). Along with chemotherapy, the prognosis for

10
the disease has improved rapidly. In animal models, retinoids have antitumor activity in
cancer xenografts and induced regression of mammary carcinoma (Lehmann et al. 1991).
In vitro, RA and its derivatives inhibit proliferation of a variety of tumor types including
lung, breast, leukemia, and rhabdomyosarcoma (Lehmann et al. 1991). Retinoids exert
their function on tumor growth in three ways: increased cellular differentiation, decreased
cell proliferation, and induction of apoptosis (Merino et al. 2004). Retinoids are known to
inhibit hormone dependent, but not hormone independent mammary carcinoma cells (Liu
et al. 1996). Thus, retinoids are currently being used as a treatment for many epithelial
cancers (Liu et al. 1996).
Retinoic acid receptors (RAR) and RA in cancer therapy was initiated in the
1970’s when RA treatment was shown to disrupt anchorage-dependent growth in a few
different cell lines (Lehmann et al. 1991). Recently, it has been shown that many
carcinogenic cell types are missing retinoic acid receptors. Because retinoic acid seems to
induce apoptosis, an accumulation of receptor deficient cells could be unresponsive to
normal retinoic acid levels and therefore not undergo normal cellular death required for
optimal health of the organism (Liu et al. 1996). In the nucleus, the RARs mediate the
effects of RA on gene expression. The RARs are members of a large family of ligand-
dependent transcription factors that include steroid, thyroid hormone, and vitamin D
receptors (Bischoff et al. 1998). Numerous synthetic retinoids with receptor selective
activities have been characterized. RARs have functional domains for RA and DNA
binding, dimerization with other factors, and transcriptional activation. The DNA binding
domain contains two zinc finger motifs. RARs interact with cognate response elements in
the promoters of many genes. RARs bind DNA as heterodimers with retinoid X receptors
11
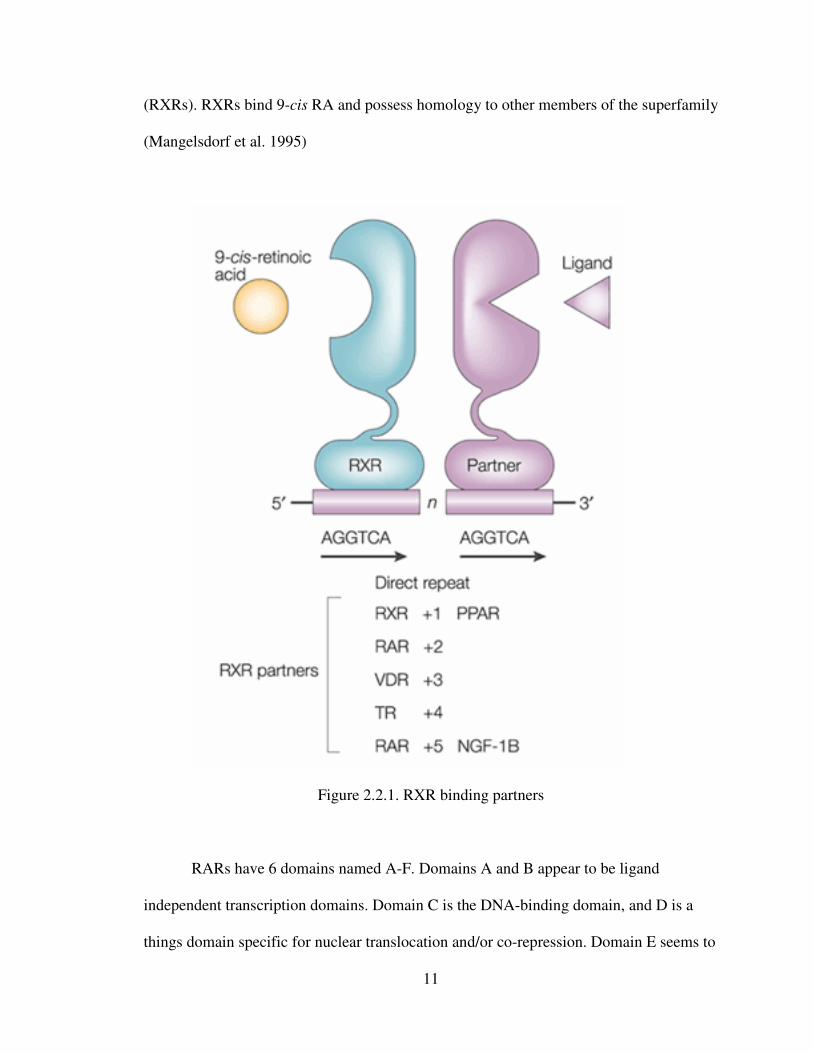
(RXRs). RXRs bind 9-cis RA and possess homology to other members of the superfamily
(Mangelsdorf et al. 1995)
Figure 2.2.1. RXR binding partners
RARs have 6 domains named A-F. Domains A and B appear to be ligand
independent transcription domains. Domain C is the DNA-binding domain, and D is a
things domain specific for nuclear translocation and/or co-repression. Domain E seems to
12
be for both dimerization and ligand binding. The F region is unknown to date (Sommer et
al. 2002). When examining the role of RAR and its own genetic transcription, there
appears to be a promoter problem in tumoregenic cells (Sun et al. 1997). There are three
genes coding for RAR, but the problematic gene is RAR-beta. The gene has two
promoters, one of which (P2) is highly down regulated. The transcription of this gene is
controlled by a RARE, and thus RAR. It is a unique feedback mechanism which becomes
disrupted in mammary carcinoma cells (Sommer et al. 2002).
Acyclo-retinoic acid was investigated for its possible role in activating the retinoic
acid response element and slowing proliferation of immortal human mammary carcinoma
cells (MCF-7) cells in culture. This retinoid is structurally and functionally similar to
Lycopene (Leblanc et al. 1995). The result of the study showed a 100-fold decrease in
RARE activity when compared to retinoic acid alone. Lycopene apparently does not
show a direct affect on MCF-7 breast cancer cells, and does not act in place of retinoic
acid (Ben-dor et al. 2002). MCF-7 cells treated with lycopene did not undergo apoptosis;
however, they did show reduced activation of AP-1 transcription factor, IGF-1 receptor
signaling, and cell cycle progression. These results indicate an inteference in cell cycle
pathways by lycopene, which could be the reason for it’s prescribed affect of reducing
cancer risk (Ben-dor et al. 2002).
2.3 Fatty Acids and Breast Cancer
In 1982 the National Academy of Sciences suggested that breast cancer was
related to consumption of a high fat diet (Kushi et al. 2002). Studies now show that it is
also the type of fat consumed, not just the amount of fat contributing to the rise in breast

13
cancer incidence. For example, Indian women have a high incidence of breast cancer in
spite of a diet rich with fruits and vegetables (Kushi et al. 2002). In India, most foods are
prepared with n-6 polyunsaturated rich vegetable oils (Kachhap et al. 1999). Case-control
studies in Greece, Spain, and Italy have shown that consumption of olive oils
(monounsaturated fat) reduce the incidence of breast cancer (Kushi et al. 2002). This
protective effect may be due in part to its phenolic compounds that offer protection of
lipids from oxidation (Gerber 1997). Another example of a specific fatty acid is
Conjugated linoleic acid (CLA). This fatty acid is found in meat and dairy products. It
can inhibit carcinogenic rat mammary tumor formation (Durgam 1997). The final lipid of
interest is the omega-3 fatty acid. This fatty acid is considered anti-inflammatory, and has
protective properties against breast cancer (Chajès et al. 1995).
Although not all experts agree, women who consume foods rich in omega-3 fatty
acids routinely and over long periods of time are less likely to develop breast cancer then
those that consume them sparsely (Wayne et al. 2004). Breast cancer mortality also
seems significantly less for those who consume large quantities of omega-3 fatty acids.
This is particularly true among women who substitute fish for meat in their diet. The
balance between omega-3 and omega-6 fatty acids suggests an important role in the
development and growth of breast cancer (Simopoulos 2002). Further research is still
needed to understand the affect that omega-3 fatty acids may have on the prevention or
treatment of breast cancer. Researchers speculate that omega-3 fatty acids may be more
effective in combination with other nutrients (vitamin E, vitamin C, beta-carotene) in the
treatment and/or prevention of breast cancer (Rose et al. 1999).
Studies on the effects of dietary fat on breast cancer have been carried out using
several rodent experimental models. They consistently show that mice and rats are less
14
likely to develop mammary tumors when they are fed low-fat as compared to high-fat
diets (Cohen et al. 1986). Experimental evidence shows that dietary fat exerts its effect
most commonly during the promotion phase of developing mammary tumors. However,
the type of fatty acid is paramount in relation to breast cancer. For example, a diet
providing a high proportion of n-6 polyunsaturated fatty acids (PUFA) greatly enhances
tumor promotion (Simopoulos 2002). In contrast, diets high in linolenic acid found in fish
oil inhibited the progression of mammary carcinogenesis (Rose et al. 1999). Studies on
the influence of diets rich in monosaturated fatty acids such as olive oil, are inconclusive
but at this time there are several results which give them a protective antitumor effect.
More recently, it has been described that conjugated linoleic acid has also inhibitory
effects on breast cancer (Durgam 1997).
The precise molecular mechanisms by which dietary fat might influence cancer
development are potentially numerous as dietary fatty acids can modulate gene
expression resulting in changes in metabolism, cell differentiation, and proliferation.
Further, the cellular response to fat depends on the type of fatty acids, cell-specific
metabolism and cell-specific transcription factors and nuclear receptors. The effects of
dietary fat on tumor development may be indirect as a modulation of hormonal or growth
factor mediated pathways. In addition, the oxidative stress due to generation of reactive
oxygen species from fatty acids may contribute to the promotional effect of dietary fat by
lipid peroxidation and damage of DNA and protein. Further, the metabolism of dietary
fatty acids via the cyclooxygenase or lipoxygenase pathways may alter gene expression
through the regulation of G proteins involved in signal transduction cascades that target
the nuclear receptors.
2.4 Fatty Acids

15
Dietary fats, more specifically, fatty acids have become increasingly scrutinized
over the last few decades. At the center of this scrutiny are the omega 3 and omega 6
fatty acids, with saturated and trans fatty acids following close behind. Omega 3 (GLA,
DHA) fatty acids possess anti-inflammatory, antiarrhythmic, and antithrombotic
properties. Omega 6 fatty acids (Linoleic) are proinflammatory and prothrombotic
(Thoennes et al. 1999). Saturated fats and trans fats have been shown to increase LDLs,
and subsequently have lead to an American population plagued by high cholesterol and
heart disease (Kushi et al. 2002). Some scientists would argue that people simply eat a
poor ratio of these different fats. Americans have a high ratio of omega-6 fatty acids to
omega-3 fatty acids in their diets. Simopoulos suggests that humans evolved with a ratio
close to one, and the distance from that ratio of the western diet is a link to increased
levels of mortality and morbidity (2002). The deviation from the evolutionary ratio seems
to be a historical indicator for fatalities resulting from cardiovascular disease and cancer
(Simopoulos 2002).
Fatty acids are an integral part of every physiological system in the human body.
They are responsible for absorption of many essential nutrients such as vitamins A, D,
and K. When examining fatty acids it is important to differentiate between dietary fatty
acids and fatty acids actively involved in metabolic processes. Dietary fatty acids are
typically defined by the food one eats. For example, mono-unsaturated fats originate from
olives, saturated fats originate from animals, omega-3 fats originate from fish, and of
course trans fats are a product of partial hydrogenation. Fats are commonly defined
metabolically. For example, the omega-3 fatty acid alpha linolenic acid (ALA) is a
precursor to eicosopentaenoic acid (EPA), which in turn is a precursor for

16
docosahexaenoic acid (DHA). Linoleic acid (LA), an omega-6 fatty acid, is the
metabolic precursor to arachidonic acid (AA) (Rose et al. 1999). These fats are known as
essential fatty acids (EFA), as the body does not synthesize them. Essential fatty acids
belong to the class of fatty acids called polyunsaturated fatty acids (PUFAs). They have
many functions among which are, stimulate hair and skin growth, maintain bone health,
regulate metabolism, and maintain the capability to reproduce (Kachhap et al. 2000).
They serve in forming body structures, maintaining immune system function, protecting
vision, creating cell membranes, and producing eicosanoids (Thoennes et al. 1999).
Eicosanoids, which include prostaglandins, are regulators of temperature, immune
response, blood clotting, blood pressure, and inflammatory response.
2.4.1 Omega 3 Fatty Acids
Omega 3 fatty acids have been directly linked to the health of a human being. The
omega-3 fatty acids are effective in the treatment of cardiovascular disease, arthritic
disorders, and diabetes mellitus (Rose et al. 1999). The dietary omega-3 fatty acids that
may impact cancer include eicosapentaenoic acid (EPA) and docosahexanoic acid
(DHA). These fats are found primarily in fatty fish such as salmon and tuna (Rose et al.
1999).). Another rich source of omega-3 fatty acids is seaweed, and is the only true plant
source of EPA and DHA. The other omega-3 fatty acid is ALA and is readily found in
flaxseed and dark leafy green vegetables. The body can enzymatically convert ALA to
EPA. All three fatty acids are paramount to human health (Simopoulos 2002).
Approximately 1 g of EPA acid DHA consumed per day orally is recommended
for cardio protection. Higher dosages of omega-3 fatty acids are required to reduce
17
elevated triglyceride levels (2 to 4 g per day) and to reduce the stiffness in the number of
joints in patients with rheumatoid arthritis (at least 3 g per day)( Rose et al. 1999).).
Small decreases in blood pressure can occur with higher dosages of omega 3 fatty acids
(Rose et al. 1999).).
2.4.2 Omega 6 Fatty Acids
Omega 6 fatty acids are derived from a variety of sources. Most omega 6 fatty
acids are consumed in the human diet, and are found in vegetable oils as linoleic acid.
Linoleic acid is converted to gamma-linolenic acid (GLA), and then further broken down
to arachidonic acid (AA). Arachidonic acid can also be consumed directly from meat.
Gamma-linolenic acid can be part of a diet containing specific plant oils including:
evening primrose oil (EPO), borage oil, and black currant seed oil (Kachhap et al. 2000).
Excess amounts of LA and AA are unhealthy because they can promote
inflammation, which can potentially lead to heart disease and cancer (Reyes et al. 2004).
In contrast, GLA seems to reduce inflammation (Cohen et al. 1986). When GLA is taken
as a supplement, it is not converted to AA. Rather, it is converted to dihomogamma-
linolenic acid (DGLA). Dihomogamma-linolenic acid competes with AA and prevents
the normal inflammatory effects that AA would have caused the body. Dihomogamma-
linolenic acid also becomes involved with prostaglandins, which reduce inflammation.
Important dietary concerns are considered for this process to take place. Adequate
amounts of magnesium, zinc, and vitamins B3, B6, and C help to promote the conversion
of GLA to DGLA (Reyes et al. 2004).
18
2.4.3 Monounsaturated Fatty Acids
Monounsaturated fatty acids have functionally specific roles in the human body.
These fatty acids are an important source of energy for the body, and are also important
constituents of cell membranes. Monounsaturated fatty acids regulate hormone response,
nutrient uptake, and waste removal. They are also very important as oils of the skin
(Gerber 1997).
Monounsaturated fatty acids (MUFAs) have a single double carbon bond found
with a cis configuration. These fatty acids cannot closely associate with neighboring fatty
acids due to this double bond and consequently act as a liquid oil at room temperature.
Monounsaturated fatty acids can be synthesized in the body, and are normally completed
by a double bond insertion between the ninth and tenth carbons of a saturated fatty acid.
This reaction creates either oleic acid or palmitoleic acid, depending on the original
saturated fat. The common fat, oleic acid, is created using stearic acid. Palmitoleic acid is
created from a palmitic acid chain. Together, these two fatty acids can be found in a
variety of foods. Oleic acid is present in almost all animal fats and vegetable oils. It is the
most common fatty acid in olive oil, canola oil, and sunflower oil. Palmitoleic acid is
found in coconut and palm oils (Gerber 1997).
2.4.4 Conjugated Linoleic Acid
Conjugated Linoleic Acid (CLA) has been shown to be a very effective treatment
in preventing the proliferation of breast cancer cells in vitro (Maggiora et al. 2004).

19
Conjugated Linoleic Acid is a mixture of positional and geometric isomers of linoleic
acid. It is found in ruminant foods such as meat and dairy products (0.6 – 5.6 mg CLA/g
fat), and has proven to be an effective inhibitor of carcinogenic rat mammary tumors
(Durgam 1999). It is unique due to its presence in animal food sources, and its anticancer
efficacy is expressed at concentrations close to human consumption levels.
CLA has been shown to increase metabolic rate, decrease body fat, increase lean
muscle, lowers cholesterol and reduces insulin resistance. CLA is a slightly altered form
of LA, an omega-6 fatty acid important to human health. Recently, it has been widely
produced as a supplement which claims cancer prevention. It remains to be extensively
tested and/or completely understood (Chujo et al. 2003).
2.4.5 Trans Fatty Acids
On November 12, 1999, the Food and Drug Administration announced that it
would include the trans fatty acid content of foods on standard food labels. Metabolic
studies reveal that trans fats have adverse effects on blood lipid levels increasing LDL
cholesterol while decreasing HDL cholesterol. This combined effect on the ratio of LDL
to HDL cholesterol is double that of saturated fatty acids (Mensink 2008). Trans fats
have also been associated with an increased risk of coronary heart disease in
epidemiologic studies (Willett 2007).
Unsaturated fatty acids are naturally found in a cis configuration. Trans fatty acids
have the hydrogen atoms on opposite sides. These trans double bonds can occur naturally
in ruminants, and will show low levels in many meat and dairy products. Trans
unsaturated fatty acids are produced artificially by introducing heat to liquid vegetable

20
oils in the presence of metal catalysts and hydrogen (Katan 2009).
2.5 Vitamin A
Vitamin A is a generic term for a large number of related compounds. The alcohol
form is named retinol, while the aldehyde is termed retinal. These are commonly referred
to as pre-formed vitamin A. Retinoic acid is formed in the body from retinal and is
actively involved in molecular processes. These three compounds as well as others
similar in form and function are collectively known as retinoids. Another group of
compounds known as carotenoids have been termed provitamin A. Beta-carotene is found
in this category, and is found in a variety of sources in the environment (Prakash et al.
2000).
Vitamin A is found naturally and occurs in many forms from a variety of both
plant and animal sources. Retinol, the free form, is not found in foods. Carotenoids are
found specifically in plants. Leafy green, and brightly colored are the most significant
sources of carotenoids (Prakash et al. 2000). Retinyl palmitate is the major source of
retinol found in animals. It is a storage form which acts as a precursor for retinol. In those
foods where retinol activity comes mainly from provitamin A carotenoids, the carotenoid
content and the retinol activity equivalents are presented (Thurnham et al. 2003). The
USDA food composition database provides the content of several different carotenoids,
including lycopene, lutein and zeaxanthin.
Vitamin A exists as provitamin B carotene found in foods such as milk, eggs, and
many fruits and vegetables. It is absorbed in the intestine and travels to the liver as a
retinyl ester. It is stored in the liver, or its ester is cleaved and it travels through the body

21
bound to retinol binding protein (RBP). Retinoic acid is transported bound to albumin.
Once retinol enters the cell it binds to cellular retinol binding protein (CRBP) and from
there can be oxidized into retinal and retinoic acid by retinaldehyde dehydrogenase (Lei
2003). It has been shown that genes induced by retinoic acid transcription factors control
most of the targets involved in the metabolic activities of retinoids. It is a unique
feedback system, which shows the dependency of the organism on these processes (Lei
2003).
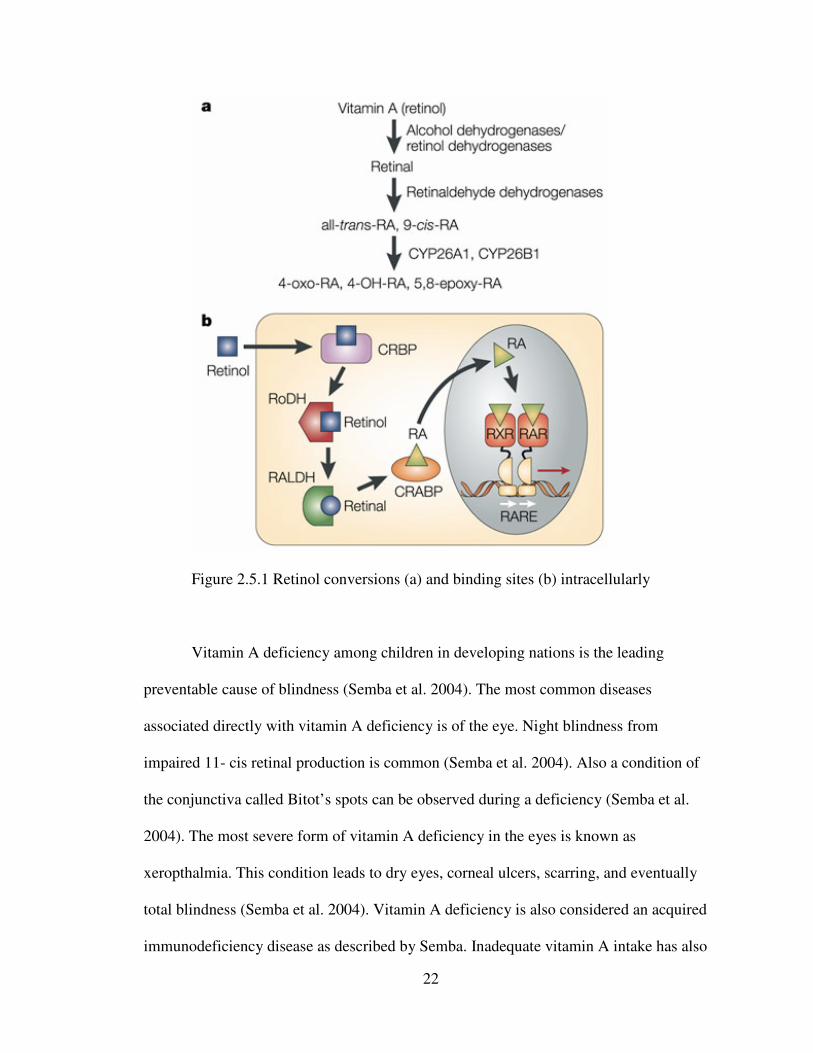
Retinol from dietary sources (vitamin A) is metabolized intracellularly and results
in its active versions: all-trans retinoic acid (tRA) and 9-cis retinoic acid (9-cis RA).
Retinoid functions are exerted through their binding with their receptors. The receptors
are termed retinoic acid receptors (RAR) and retinoic x receptors (RXR) (Ben-dor et al.
2002). The difference between the two is RARs have a high affinity for all-trans-retinoic
acid, while the RXRs tend to bind with cis forms of retinoic acid. The receptors act as a
dimer, and then (bound to their ligand) are imported into the nucleus as transcription
factors where they bind to the retinoic acid responsive element (RARE) (Ben-dor et al.
2002). While RAR bound to trans-RA seems to have an antiproliferative effect on MCF-7
cells in culture, RXR does not show any effect on cell growth. Cis-RA and RXR have not
been shown to result in the same level of cancer suppression as RAR and trans-RA (Liu
et al. 1996).
22
Figure 2.5.1 Retinol conversions (a) and binding sites (b) intracellularly
Vitamin A deficiency among children in developing nations is the leading
preventable cause of blindness (Semba et al. 2004). The most common diseases
associated directly with vitamin A deficiency is of the eye. Night blindness from
impaired 11- cis retinal production is common (Semba et al. 2004). Also a condition of
the conjunctiva called Bitot’s spots can be observed during a deficiency (Semba et al.
2004). The most severe form of vitamin A deficiency in the eyes is known as
xeropthalmia. This condition leads to dry eyes, corneal ulcers, scarring, and eventually
total blindness (Semba et al. 2004). Vitamin A deficiency is also considered an acquired
immunodeficiency disease as described by Semba. Inadequate vitamin A intake has also

23
been shown to lead to increased incidence of infectious disease. Interestingly, vitamin A
supplementation in developing countries decreases deaths in children from diarrhea and
measles (Thurnham et al. 2003).
The RDA for vitamin A was revised by the Food and Nutrition Board (FNB) of
the Institute of Medicine in 2001. Vitamin A has an RDA of 900mcg/day for men and
700mcg/day for women. The latest RDA is based on the amount needed to ensure an
adequate store of vitamin A in the body. This store is a sufficient amount to support
normal vision, immune function, maturation, growth, and gene expression (Semba et al.
2004).
Vitamin A is an integral part of the signal transduction required for vision. As light
passes through the lens of the eye, it is received by the retina located at the rear of the
eye. The light is then converted to a signal, which the brain translates into vision. At the
epithelial surface of the retina, retinol is esterified to form a retinyl ester. These esters are
then isomerized following hydrolysis and become 11-cis retinol. Following oxidation this
compound becomes11-cis retinal. The importance of 11-cis retinal is its ability to bind to
opsin and form rhodopsin. Rhodopsin is found on rod cells of the eye, which are
important in night vision. 11-cis retinal isomerizes to all-trans retinal, which results in the
signal cascade responsible for vision.
Vitamin A is necessary for the normal and healthy activities of the human immune
system. Better known as retinol, vitamin A and its metabolites are required to maintain
the correct function of the mucosal cells (epithelial cells) found in the urinary, digestive,
and reproductive tracts. Retinol and retinoic acid (RA) have an integral role in the
development and differentiation of lymphocytes, and AtRA is required by T-lymphocytes

24
for proper regulation of the immune system.
Both vitamin A excess and deficiency are known to cause birth defects. Retinol
and retinoic acid (RA) are essential for embryonic development (Christian 2003). During
fetal development, RA functions in limb development and formation of the heart, eyes,
and ears (Pavia 1999). Additionally, RA has been found to regulate expression of the
gene for growth hormone (Christian 2003)
Red blood cells, like all blood cells, are derived from precursor cells called stem
cells. These stem cells are dependent on retinoids for normal differentiation into red
blood cells. Additionally, vitamin A appears to facilitate the mobilization of iron from
storage sites to the developing red blood cell for incorporation into hemoglobin, the
oxygen carrier in red blood cells (Christian 2003).
Delivery of RA to its receptor within the cell has been a topic of interest recently,
and it has yet to be fully understood. The current theory on RA delivery is a combination
of passive diffusion and the action of a carrier protein. Cellular retinoic acid binding
protein II (CRABPII) has been uncovered as that carrier protein. Upon binding to its
ligand (RA) it undergoes a massive conformational change in the cytosol near the
nucleus. The change causes a rapid recruitment into the nucleus where RA is delivered to
its receptor RAR or RXR. The collision-mediated process leaves the binding protein
empty and is then immediately exported from the nucleus back to the cytosol where it
awaits another ligand. Recent research has concluded that the CRABPII is a necessary
and exciting pathway by which retinoic acid induces growth arrest in mammary
carcinoma cells (Budhu et al. 2002). Over expression of CRABPII in MCF-7 cells
showed a significant decrease in cell proliferation, while silencing the protein allowed the
25
cells to proliferate as if there was no RA in the treatment.
2.6 Nuclear Hormone Receptors
Nuclear hormone receptors may be responsible for the combines effect of Vitamin
A and Fatty Acid on carcinogenesis. More specifically, the peroxisome proliferator-
activated receptors (PPARs) are the hypothesized to play a role in the decreased cell
proliferation. (Moller et al. 2003). The PPARs are ligand-activated transcription factors
of the nuclear hormone receptor superfamily. They share a high degree of structural
homology with all members of the superfamily, particularly in the DNA-binding domain
and ligand- and cofactor-binding domain. Many cellular and systemic roles have been
attributed to these receptors, reaching far beyond the stimulation of peroxisome
proliferation in rodents after which they were initially named. Peroxisome proliferator-
activated receptors exhibit broad, isotype-specific tissue expression patterns. PPAR is
expressed at high levels in organs with significant catabolism of fatty acids. PPAR / has
the broadest expression pattern, and the levels of expression in certain tissues depend
on
the extent of cell proliferation and differentiation. PPAR is expressed as two isoforms,
of which PPAR 2 is found at high levels in the adipose tissues, whereas PPAR 1 has a
broader expression pattern.
26
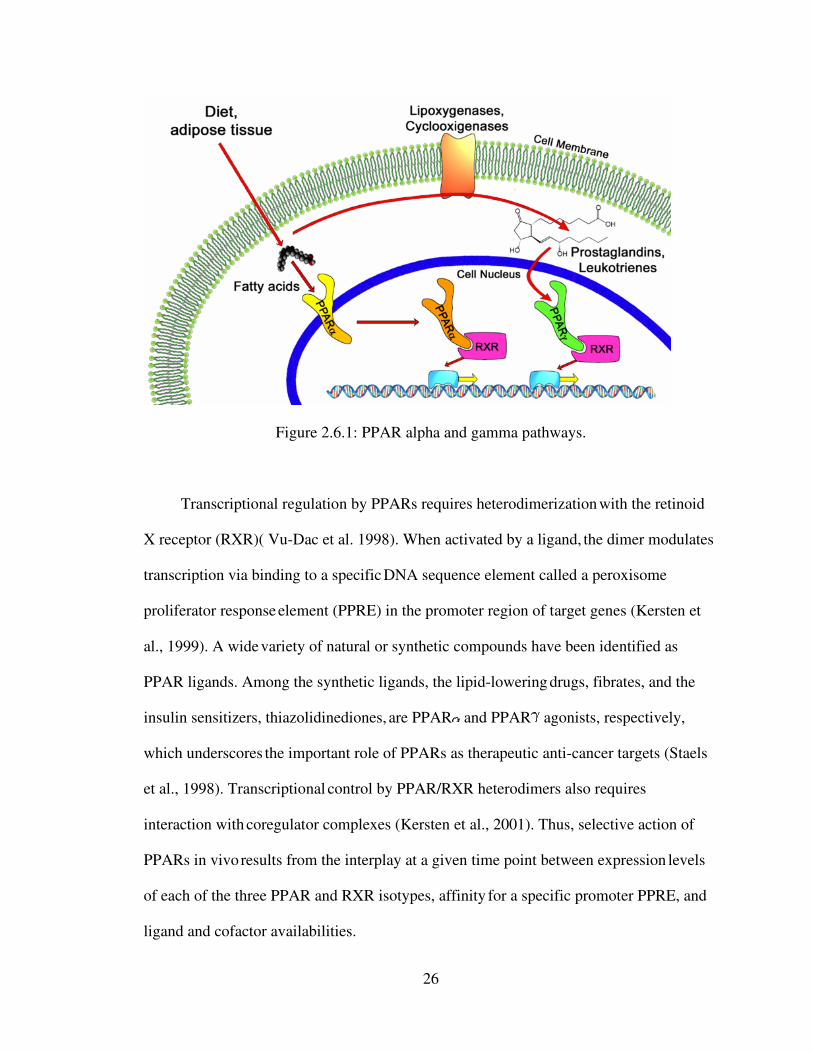
Figure 2.6.1: PPAR alpha and gamma pathways.
Transcriptional regulation by PPARs requires heterodimerization with the retinoid
X receptor (RXR)( Vu-Dac et al. 1998). When activated by a ligand, the dimer modulates
transcription via binding to a specific DNA sequence element called a peroxisome
proliferator response element (PPRE) in the promoter region of target genes (Kersten et
al., 1999). A wide variety of natural or synthetic compounds have been identified as
PPAR ligands. Among the synthetic ligands, the lipid-lowering drugs, fibrates, and the
insulin sensitizers, thiazolidinediones, are PPAR and PPAR agonists, respectively,
which underscores the important role of PPARs as therapeutic anti-cancer targets (Staels
et al., 1998). Transcriptional control by PPAR/RXR heterodimers also requires
interaction with coregulator complexes (Kersten et al., 2001). Thus, selective action of
PPARs in vivo results from the interplay at a given time point between expression
levels
of each of the three PPAR and RXR isotypes, affinity for a specific promoter PPRE, and
ligand and cofactor availabilities.
27
Consistent with its distribution in tissues with high catabolic rates of fatty acids and
high peroxisomal activity, the major role of PPAR is the regulation of energy
homeostasis (Lefebvre et al. 2006). In the liver especially, PPAR activates fatty
acid
catabolism, stimulates gluconeogenesis and ketone body synthesis, and is involved in the
control of lipoprotein assembly (Staels et al. 1995). PPAR also stimulates heme
synthesis and cholesterol catabolism (Staels et al. 1995). Furthermore, it attenuates
inflammatory responses and participates in the control of amino acid metabolism
and urea
synthesis (Devchand et al. 1999). Increased fatty acid oxidation by activated PPAR
lowers circulating triglyceride levels, liver and muscle steatosis, and reduces adiposity,
which improves insulin sensitivity (Guerre-Millo et al. 2000; Chou et al. 2002).
Not
surprisingly, fibrate drugs such as gemfibrozil, clofibrate, and fenofibrate that are widely
used to treat hypertriglyceridemia are activators of PPAR . In addition, PPAR agonists
have demonstrated significant anti-inflammatory activities that seem to play a
role in their
protective actions within the cardiovascular system (Berger et al. 2005).
2.7 Nutrient Delivery Systems
The delivery of AtRA has not been easily performed to date. The goal of
establishing therapeutic levels of AtRA in tissue has also met some barriers. These
barriers include issues of compound stability, and also tissue safety.
While beneficial as an anti-cancer agent, the use of AtRA is not without
complications. AtRA is a water insoluble, toxic agent with limited bioavailability
(Freemantle et al. 2003). Pharmacological levels can cause retinoic acid syndrome and
neurotoxicity, particularly in children (Takitani et al. 2006). In addition, drug resistance
has been reported in cases of sustained ATRA treatment requiring the use of additional

28
cytotoxic chemotherapy (Freemantle et al. 2003). Although liposomal formulations were
developed a number of years ago in an effort to address these issues, they have not
progressed past the clinical trial stage (Freemantle et al. 2003). Despite this, the potential
benefits of associating ATRA with a lipid-based carrier are many. Not only do lipid-drug
formulations address solubility issues, they also decrease toxicity and potentially avoid
triggering ATRA resistance, thereby minimizing the need for additional chemotherapy
(Freemantle et al. 2003).
In conjunction with this study, our research team was involved in exploring
possible applications of the above named Liposomes. Liposomal delivery offers many
specific stability advantages of AtRA, and we were able to produce results in vitro
supporting the possibility of further usage. The application model stemmed from using
dairy based fatty acids to produce liposomes that delivered AtRA. Appendix D has the
full results. Liposome use is a viable option for future delivery of AtRA and could be
engineered with specific fatty acids as well. The search for a viable delivery option from
liposomes is currently underway, and should yield realistic applications in the future to
treat carcinomas.
Chapter 3.0
29
MATERIALS AND METHODS
3.1 Materials
MCF-7 cells were obtained from the American Type Institute. AtRA was obtained
from Sigma Aldrich (St. Louis MO). Fatty Acids and other chemicals were obtained from
Fisher Scientific (Pittsburgh, PA).
3.2 Cell Experiments
MCF-7 cells were cultured at 37 °C, 5% CO2, in Dulbecco’s Modified Eagle
Media (DMEM) containing 10% fetal bovine serum (FBS) and 1% antibiotic. FBS and
the antibiotic (50:50, penicillin and streptomycin) added to the media, sterile filtered
using a bottle top vacuum filter. 75cm^2 cell culture flasks were carefully monitored for
confluence and were passed upon a 75% confluency. Cells were grown consistently in 20
ml of media until confluent. MCF-7 cells did not require a media change to ensure
confluency. The cells were considered “stock” cells which were transferred to growth
plates for growth assays.
3.3 Cell Counting
Cells collected via trypsin in a 15 ml Falcon tube. The tube spun at 1800 RPM for
5 minutes in a centrifuge to collect pellet. The cells were resuspended by light vortexing
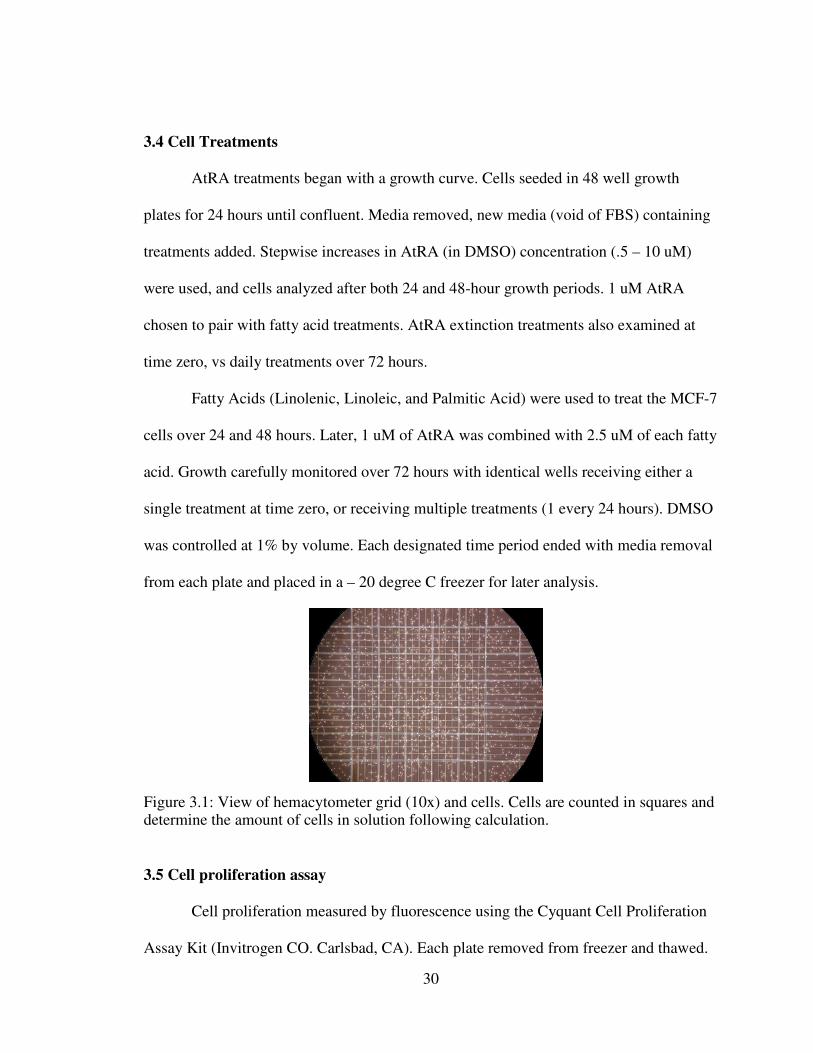
in 1 ml of fresh media. Sample (5 ul) of cells was counted on a hemacytometer (Figure
3.1) to determine amount of cells in the 1 ml. 48 well plates seeded for cell proliferation
assays, and each well contained 5000 cells as determined by a hemacytometer. Cells
adhered for 24 hours before treatment.
30
3.4 Cell Treatments
AtRA treatments began with a growth curve. Cells seeded in 48 well growth
plates for 24 hours until confluent. Media removed, new media (void of FBS) containing
treatments added. Stepwise increases in AtRA (in DMSO) concentration (.5 – 10 uM)
were used, and cells analyzed after both 24 and 48-hour growth periods. 1 uM AtRA
chosen to pair with fatty acid treatments. AtRA extinction treatments also examined at
time zero, vs daily treatments over 72 hours.
Fatty Acids (Linolenic, Linoleic, and Palmitic Acid) were used to treat the MCF-7
cells over 24 and 48 hours. Later, 1 uM of AtRA was combined with 2.5 uM of each fatty
acid. Growth carefully monitored over 72 hours with identical wells receiving either a
single treatment at time zero, or receiving multiple treatments (1 every 24 hours). DMSO
was controlled at 1% by volume. Each designated time period ended with media removal
from each plate and placed in a – 20 degree C freezer for later analysis.
Figure 3.1: View of hemacytometer grid (10x) and cells. Cells are counted in squares and determine the amount of cells in solution following calculation.
3.5 Cell proliferation assay
Cell proliferation measured by fluorescence using the Cyquant Cell Proliferation
Assay Kit (Invitrogen CO. Carlsbad, CA). Each plate removed from freezer and thawed.
31
Nano-pure water (19 ml), lysis buffer (1 ml), and a florescent dye (50 ul) combined and
added to each well in 200 uL aliquots. 30 minutes of incubation was required before the
first reading and emission was stable for up to 60 minutes.
3.6 Cell proliferation quantification
A Typhoon Variable Mode Imager (General Electric Health Care) read the
florescent stained cellular nucleic acids through a flourecein filter at 520 nm following a
green laser excitation of the dye. Following the scan, the resulting image was
manipulated and evaluated by the Imagequant TL software (Amersham Biosciences).
Each well evaluated by color absorption then measured against control wells to give cell
proliferation comparisons.
Chapter 4
RESULTS
MCF-7 cell growth was limited by media containing AtRA. A growth curve
analysis of MCF-7 cells in the presence of AtRA in varying concentrations was produced
32
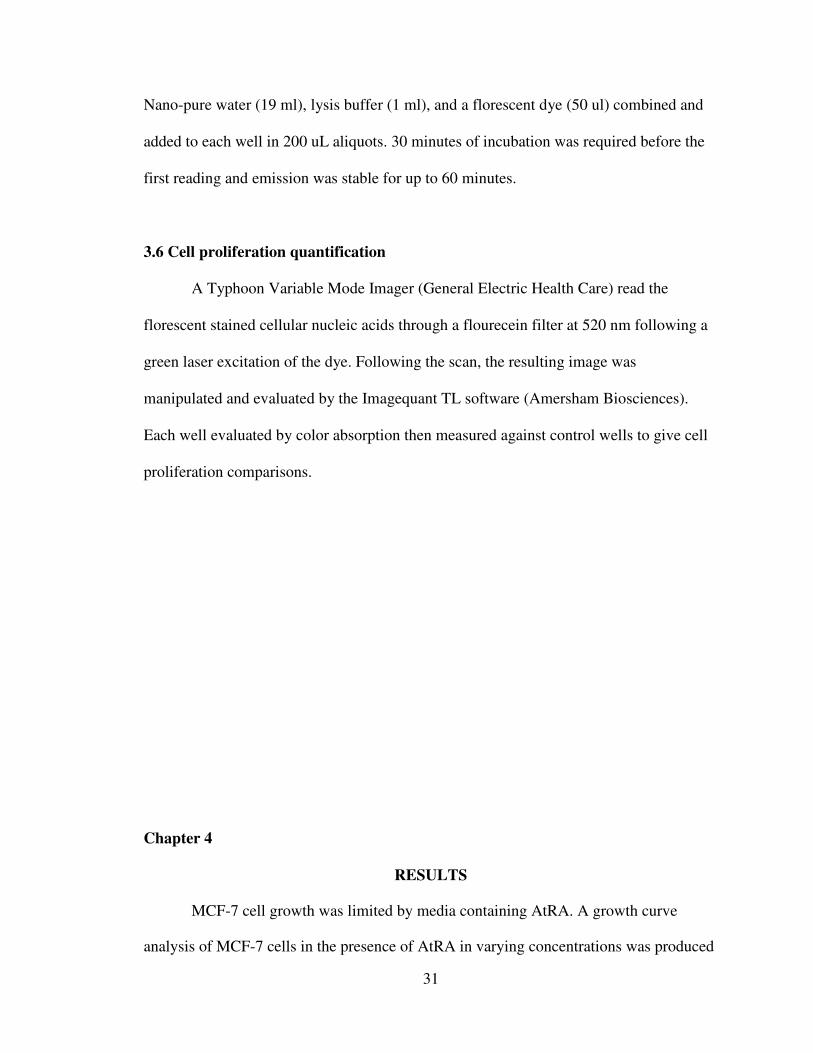
to investigate its efficacy in decreasing cell proliferation.. Figure 4.1 shows the decrease
in growth with each concentration as compared to media not supplemented with AtRA
(control). 5uM AtRA concentration showed the largest decrease, the 1 uM concentration
was chosen for further analysis. 1 uM decreased cell growth by 32.9% after 24 hours.
Figure 4.1: Molecular Probes Cyquant Kit: 5000 cells were seeded per well and allowed
to adhere overnight before treatments were given 24 hours later in serum free media.
Proliferation was significantly altered with the use of ATRA. Columns C-F are 0.5uM –
5.0uM AtRA in media respectively. (Images produced on a Typhoon Scanner, and
manipulated with Imagequant software. (Image is of actual size)
33
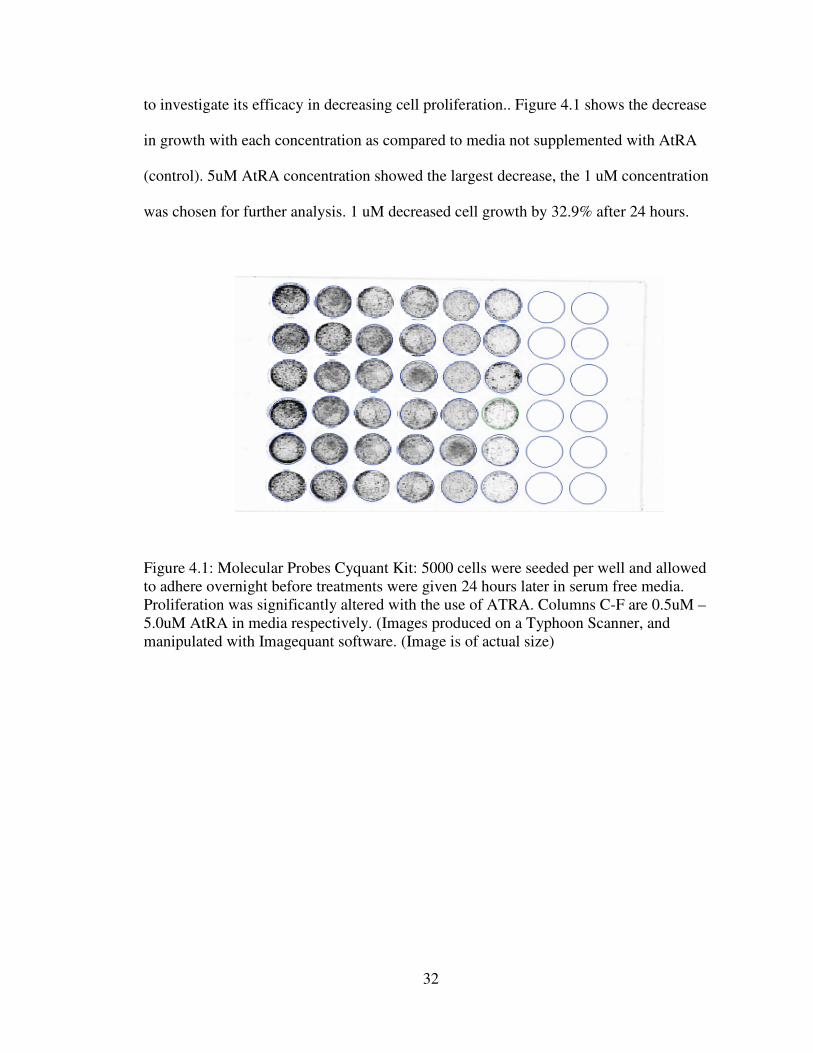
Figure 4.2: Cell Proliferation Assay. Standard curve for cell growth under varying
amounts of AtRA delivered in vitro. Ideal treatment was found to be 1 uM which was not
greater than 50% cell growth reduction. (Numbers taken from Figure 1 to produce graph)
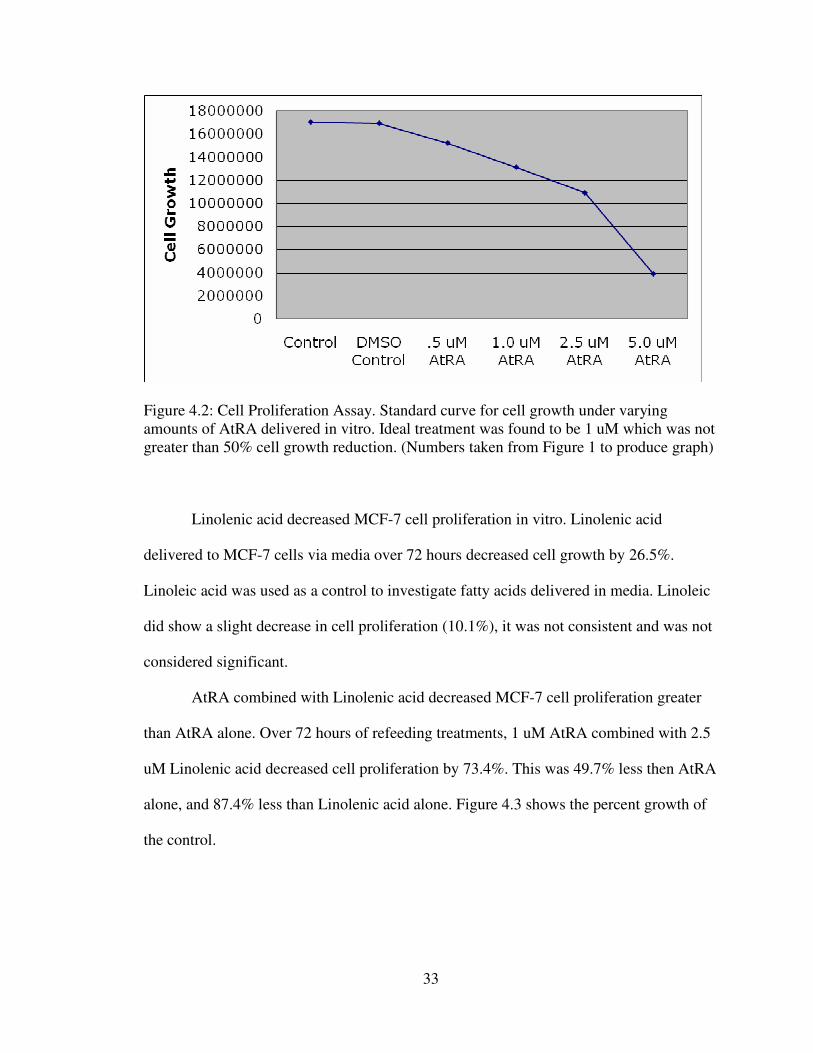
Linolenic acid decreased MCF-7 cell proliferation in vitro. Linolenic acid
delivered to MCF-7 cells via media over 72 hours decreased cell growth by 26.5%.
Linoleic acid was used as a control to investigate fatty acids delivered in media. Linoleic
did show a slight decrease in cell proliferation (10.1%), it was not consistent and was not
considered significant.
AtRA combined with Linolenic acid decreased MCF-7 cell proliferation greater
than AtRA alone. Over 72 hours of refeeding treatments, 1 uM AtRA combined with 2.5
uM Linolenic acid decreased cell proliferation by 73.4%. This was 49.7% less then AtRA
alone, and 87.4% less than Linolenic acid alone. Figure 4.3 shows the percent growth of
the control.
34
Figure 4.3: Cell Proliferation Assay: Data presented as percent of control. AtRA (1uM) along with AtRA + Linolenic acid produced significant growth differences over 72 hours. The combined affect was 49.7% greater then AtRA alone, and was significantly different.
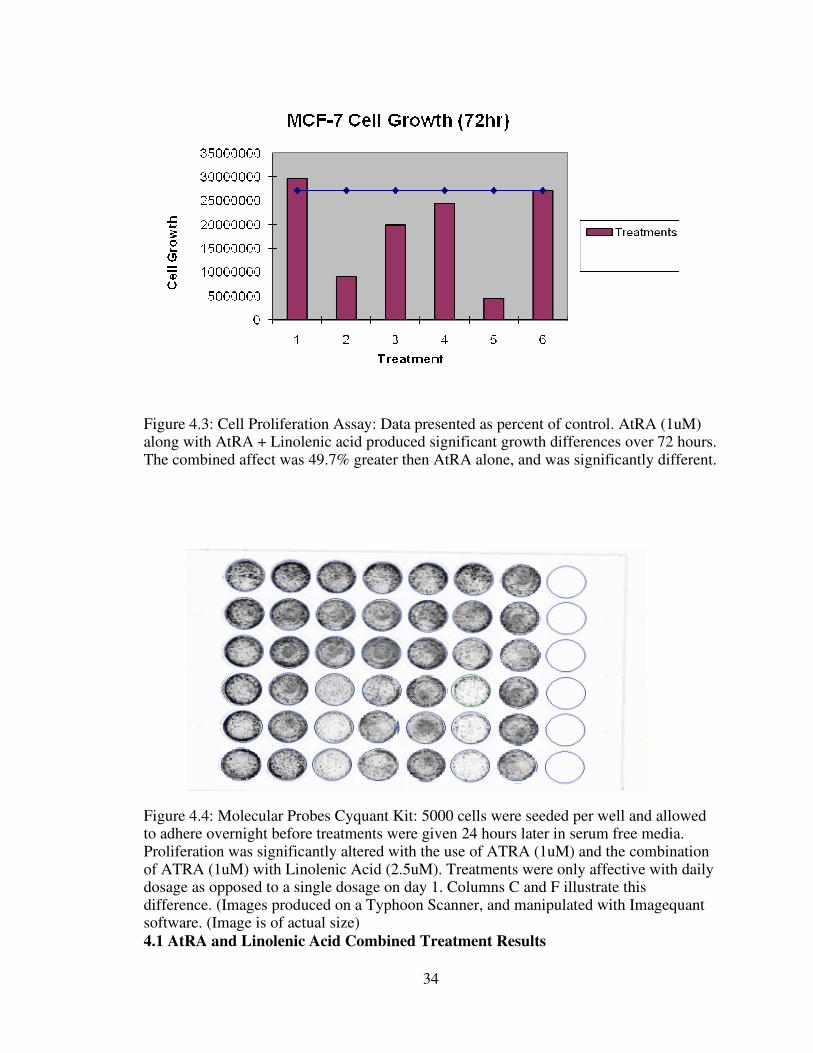
Figure 4.4: Molecular Probes Cyquant Kit: 5000 cells were seeded per well and allowed to adhere overnight before treatments were given 24 hours later in serum free media. Proliferation was significantly altered with the use of ATRA (1uM) and the combination of ATRA (1uM) with Linolenic Acid (2.5uM). Treatments were only affective with daily dosage as opposed to a single dosage on day 1. Columns C and F illustrate this difference. (Images produced on a Typhoon Scanner, and manipulated with Imagequant software. (Image is of actual size)
4.1 AtRA and Linolenic Acid Combined Treatment Results
35
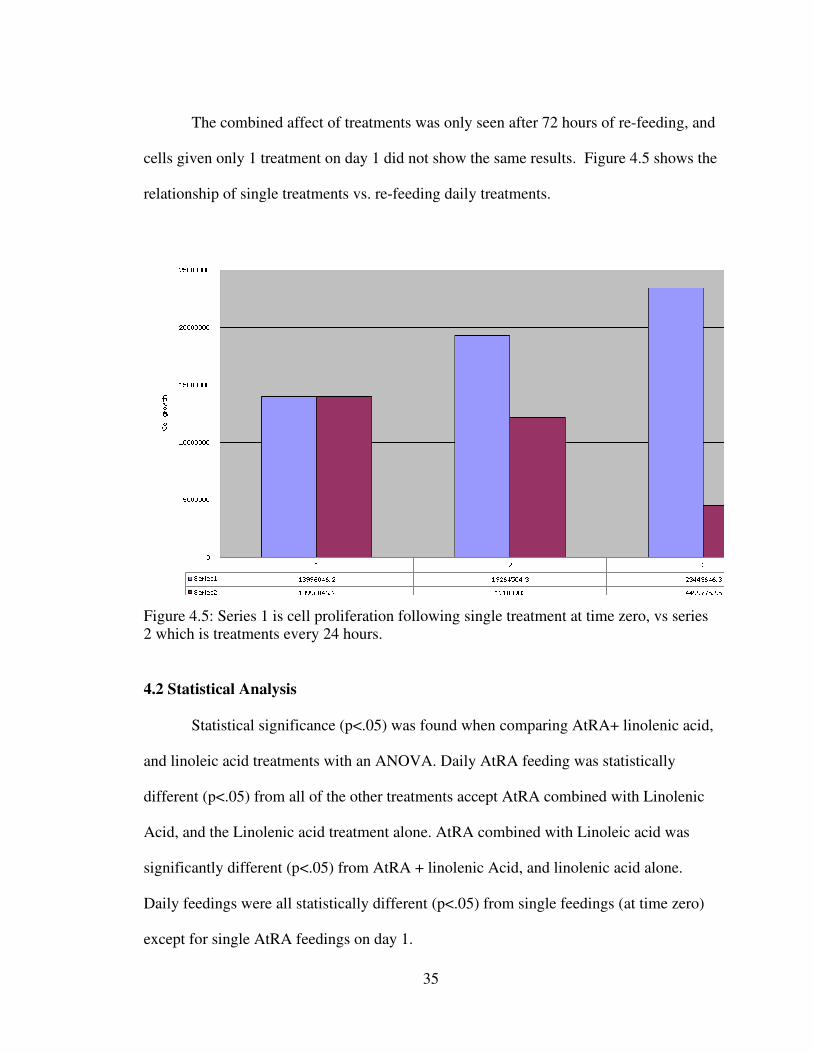
The combined affect of treatments was only seen after 72 hours of re-feeding, and
cells given only 1 treatment on day 1 did not show the same results. Figure 4.5 shows the
relationship of single treatments vs. re-feeding daily treatments.
Figure 4.5: Series 1 is cell proliferation following single treatment at time zero, vs series 2 which is treatments every 24 hours.
4.2 Statistical Analysis
Statistical significance (p<.05) was found when comparing AtRA+ linolenic acid,
and linoleic acid treatments with an ANOVA. Daily AtRA feeding was statistically
different (p<.05) from all of the other treatments accept AtRA combined with Linolenic
Acid, and the Linolenic acid treatment alone. AtRA combined with Linoleic acid was
significantly different (p<.05) from AtRA + linolenic Acid, and linolenic acid alone.
Daily feedings were all statistically different (p<.05) from single feedings (at time zero)
except for single AtRA feedings on day 1.

36
Chapter 5

37
DISCUSSION
All-trans retinoic acid has historically been evaluated and applied in
chemoprevention of epithelial cancers. Linolenic acid has also been explored for possible
application in chemoprevention. Here, we have explored the synergism of these two
compounds through an in-vitro application in a specific cell line. We have also
hypothesized the connection with these compounds to be found on the nuclear level in the
form of transcription factor specific receptors: Perxisome-proliferator activated receptor
gamma (PpARy), and Retinoic Acid receptor (RXR). MCF-7 cells are an appropriate
choice when exploring RXR and PPAR do to their previous use in these applications.
Other epithelial cell lines do not produce the same quantity of receptors and have not
shown the same promising results. Unique expression patterns of PPARγ relative to RXR
in certain cell lines led us to hypothesize that applying a known ligand for each receptor
would significantly affect the progression of MCF-7 cell growth in vitro. Our hypothesis
was supported by current research where up-regulation of the PPARE was noted with
increased ligand activity of RXR (Nicol et al. 2004).
A growing body of evidence indicates PPARγ is involved in both breast cancer
development and progression. PPARγ(+/−) mice had almost three-fold increased
incidence of mammary adenocarcinomas and decreased survival rate when compared to
PPARγ(+/+) litermates (Nicol et al. 2004). Several reports have demonstrated that
treating animals with PPARγ ligands prior to chemical induction of mammary tumors is
protective against tumor development (Nicol et al. 2004). It appears that expression and
transactivation of PPARγ is protective against breast tumor formation particularly when
38
activated by PPARγ ligands. Our data demonstrates that a particular ligand (Linolenic
Acid) seems effective at transactivating PPARγ in normal mammary epithelia.
Once a breast tumor has formed, PPARγ appears to have multiple effects. One
study observed that distinct PPARγ ligands induce apoptosis (Nicol et al. 2004).
Conversely, a recent report by Saez et al. (2004) found that when mice expressing a
constitutively active form of PPARγ in the mammary gland were crossed with mice
prone to mammary gland cancer, bigenic animals develop tumors that express higher
levels of markers of malignancy. The authors conclude that once an initiating event takes
place, increased PPARγ signaling serves as a tumor promoter in the mammary gland of
these experimental animals. Collectively, these data suggest that the physiological
consequence of PPARγ activation is dependent on many factors including the stage of
development of the specific breast cancer cell.
Our demonstration that an individual PPARγ ligand (Linolenic Acid) showed
promising results follows the trend previously demonstrated in literature. We also
demonstrated the use of a RXR ligand to slow the progression of MCF-7 cell growth in
vitro. Interestingly, further decrease in progression was observed with the co-treatment of
both ligands. The heterodimeric relationship of RXR and PPARγ has been shown to have
its own response element PPARE which was shown to be up-regulated by ligands of
either receptor independent of eachother. We have shown here that there is also promise
of increased transcription through increased availability of both ligands.
It can be concluded that individual breast cancer cell types are likely to respond to
PPARγ ligands and RXR ligands in unique physiological ways and our data suggests that,
39
in part, variant cellular responses are the result of selective PPARγ transactivation. Our
data demonstrates that individual PPARγ ligands combined with indivisual RXR ligands
can selectively activate response element activity within a single cancer cell type. These
data suggest that the effectiveness of PPARγ and RXR as a target for chemotherapeutic
treatment will greatly depend on the cell that is treated which opens the possibility of
utilizing PPARγ and RXR for targeted gene therapy.
BIBLIOGRAPHY
40
Abou-Jawde R, Choueiri T, Alemany C, Mekhail T. An Overview of Targeted Treatments in Cancer. Clinical Therapeutics 25 (8) (2003) 2121-2137. Ahmed W, Orasanu G, Nehra V, Asatryan L, Rader DJ, Ziouzenkova O, and Plutzky J (2006) High-density lipoprotein hydrolysis by endothelial lipase activates PPARalpha: a candidate mechanism for high-density lipoprotein-mediated repression of leukocyte adhesion. Circ Res 98: 490-498. Aktas H, Halperin JA. Translational Regulation of Gene Expression by n-3 Fatty Acids. Journal of Nutrition 134 (2004) 2487S-2491S. Barak Y, Liao D, He W, Ong ES, Nelson MC, Olefsky JM, Boland R, and Evans RM (2002) Effects of peroxisome proliferator-activated receptor delta on placentation, adiposity, and colorectal cancer. Proc Natl Acad Sci USA 99: 303-308. Ben-Dor A, Nahum A, Danilenko M, Giat Y, Stahl W, Martin H, Emmerich T, Noy N, Levy J, Sharoni Y. Effects of acyclo-Rdetinoic Acid and Lycopene on Activation of the Retinoic Acid Receptor and the Proliferation of Mammary Cancer Cells. Archives of Biochemistry and Biophysics 391(2) (2001) 295-302. Berger JP, Akiyama TE, and Meinke PT (2005) PPARs: therapeutic targets for metabolic disease. Trends Pharmacol Sci 26: 102-107. Bischoff ED, Gottardis MM, Moon TE, Heyman RA, Lamph WW. Beyond tamoxifen:
the retinoid X receptor selective ligand LGD1069 (TARGRETIN) causes complete
regression of mammary carcinoma. Cancer Res., 58: 479–484, 1998.
Budhu AS, Noy N. Direct Channeling of Retinoic Acid between Cellular Retinoic Acid-Binding Protein II and Retinoic Acid Receptor Sensitizes Mammary Carcinoma Cells to Retinoic Acid-Induced Growth Arrest. Molecular and Cellular Biology 22(8) (2002) 2632-2641. Burri BJ, Clifford AJ. Carotenoid and retinoid metabolism: insights from isotope studies. Archives of Biochemistry and Biophysics 430 (2004) 110-119. Chajès V, Sattler W, Stranzl A, Kostner GM. Influence of n-3 fatty acids on the growth of human breast cancer cells in vitro: relationship to peroxides and vitamin E. Breast
Cancer Res. Treat. 34 (1995), pp. 199–212. Chamras H, Ardashian A, Heber D, Glaspy JA. Fatty acid modulation of MCF-7 human breast cancer cell proliferation, apoptosis and differentiation. Journal of Nutritional Biochemistry 13 (2002) 711-716. Cho Y, Tighe AP, Talmage DA, Retinoic acid induced growth arrest of human breast carcinoma cells requires protein kinase C alpha expression and activity, J. Cell. Physiol.
172 (1997), pp. 306–313.

41
Chou CJ, Haluzik M, Gregory C, Dietz KR, Vinson C, Gavrilova O, and Reitman ML (2002) WY14,643, a peroxisome proliferator-activated receptor alpha (PPARalpha) agonist, improves hepatic and muscle steatosis and reverses insulin resistance in lipoatrophic A-ZIP/F-1 mice. J Biol Chem 277: 24484-24489. Christian P. Micronutrients and reproductive health issues: an international perspective. J Nutr. 2003 Jun;133(6):1969S-1973S. Review. Chujo H, Yamasaki M, Nou S, Koyanagi N, Tachibana H, Yamada K. Effect of conjugated linoleic acid isomers on growth factor-induced proliferation of human breast cancer cells. Cancer Letters 202 (2003) 81-87. Cohen LA, Thompson DO, Maeura Y, Choi K, Blank ME, Rose DP. Dietary fat and mammary cancer. I. Promoting effects of different dietary fats on N-nitrosomethylurea-
induced rat mammary tumorigenesis. J. Natl. Cancer Inst. 77 (1986), pp. 33–42. Danforth Jr. DN, All trans-retinoic acid acts synergistically with hydroxytamoxifen and transforming-growth factor beta to stimulate apoptosis in MCF-7 breast cancer cells, J.
Endocrinol. 183 (2004), pp. 395–404. Dawson MI, Chao W, Hobbs PD, Zhang X. Effects of trans-retinoic acid, 9-cis-retinoic acid, 1a,25-(dihydroxy)vitamin D3 and a novel apoptosis-inducing retinoid on breast cancer and endothelial cell growth. Cancer Letters 133 (1998) 1-8. Devchand PR, Ijpenberg A, Devesvergne B, Wahli W. PPARs: nuclear receptors for fatty acids, eicosanoids, and xenobiotics. Adv Exp Med Biol. 1999;469:231-6. Durgam VR, Fernandes G. The growth inhibitory effect of conjugated linoleic acid on MCF-7 cells is related to estrogen response system. Cancer Letters 116 (1997) 121-130. Freemantle SJ, Spinella MJ, Dmitrovsky E. Retinoids in cancer therapy and chemoprevention: promise meets resistance. Oncogene. 2003 Oct 20;22(47):7305-15. Review. Gerber M. Olive oil, monounsaturated fatty acids and cancer. Cancer Letters 114 (1997) 91-92. Guerre-Millo M, Gervois P, Raspe E, Madsen L, Poulain P, Derudas B, Herbert JM, Winegar DA, Willson TM, Fruchart JC, et al. (2000) Peroxisome proliferator-activated receptor alpha activators improve insulin sensitivity and reduce adiposity. J Biol Chem 275: 16638-16642. Jimenez-Lara AM, Clarke N, Altucci L, Gronemeyer H. Retinoic-acid-induced apoptosis in leukemia cells. Trends in Molecular Medicine 10 (10) (2004) 508-515. Katan MB. Omega-6 polyunsaturated fatty acids and coronary heart disease. Am J Clin Nutr. 2009 May;89(5):1283-4. Epub 2009 Mar 25.

42
Kachhap SK, Dange P, Ghosh SN. Effect of n-6 polunsaturated fatty acid (linoleic acid) on BRCA1 gene expression in MCF-7 cell line. Cancer Letters 154 (2000) 115-120. Kerner J, Hoppel C. Fatty acid import into mitochondria. Biochemica et Biophysica Acta 1486 (2000) 1-17. Kersten S, Mandard S, Escher P, Gonzalez FJ, Tafuri S, Desvergne B, and Wahli W (2001) The peroxisome proliferator-activated receptor alpha regulates amino acid metabolism. FASEB J 15: 1971-1978. Kersten S, Seydoux J, Peters JM, Gonzalez FJ, Desvergne B, and Wahli W (1999) Peroxisome proliferator-activated receptor alpha mediates the adaptive response to fasting. J Clin Investig 103: 1489-1498. Kim H, Haluzik M, Asghar Z, Yau D, Joseph JW, Fernandez AM, Reitman ML, Yakar S, Stannard B, Heron-Milhavet L, et al. (2003) Peroxisome proliferator-activated receptor-alpha agonist treatment in a transgenic model of type 2 diabetes reverses the lipotoxic state and improves glucose homeostasis. Diabetes 52: 1770-1778. Kogai T, Schultz JJ, Johnson LS, Huang M, Brent GA. Retinoic acid induces sodium/iodide symporter gene expression and radioiodide uptake in the MCF-7 breast cancer cell line. Proc Natl Acad Sci USA 97 (2000) 8519-8524.
Korde LA, Calzone KA, Zujewski J. Genetic factors are not the whole story.
Postgraduate Medicine 116 (2004).
Kuhajda FP. Fatty-Acid Synthase and Human Cancer: New Perspectives on Its Role in Tumor Biology. Nutrition 16 (2000) 202-208. Kushi L, Giovannucci E. Dietary Fat and Cancer. Am J Med 113(9b) (2002) 63s-70s. Leblanc BP, Stunnenberg HG. 9-cis retinoic acid signaling: changing partners causes
some excitement. Genes Dev., 9: 1811–1816, 1995.
Leelawat K, Ohuchida K, Mizumoto K, Mahidol C, Tanaka M. All-trans retinoic acid inhibits the cell proliferation but enhances the cell invasion through up-regulation of c-met in pancreatic cancer cells. Cancer Letters (2004) 1-8. Lefebvre P, Chinetti G, Fruchart JC, and Staels B (2006) Sorting out the roles of PPAR alpha in energy metabolism and vascular homeostasis. J Clin Investig 116: 571-580. Lehmann JM, Dawson MI, Hobbs PD, Husmann M, Pfahl M. Identification of retinoids
with nuclear receptor subtype selective activities. Cancer Res., 51: 4804–4809, 1991.
Lei M, The H. Retinoids and retinoic acid receptor in cancer. EJC Supplements 1 (2) (2003) 13-18.

43
Liu Y, Lee M, Wang H, Li Y, Hashimoto Y, Klaus M, Reed JC, Zhang X. Retinoic Acid Receptor B Mediates the Growth-Inhibitory Effect of Retinoic Acid by Promoting Apoptosis in Human Breast Cancer Cells. Molecular and Cellular Biology 16(3) (1996) 1138-1149. Maggiora M, Bologna M, Ceru MP, Possati L, Angelucci A, Cimni A, Miglietta A, Bozzo F, Margiotta C, Muzio G, Canuto RA. An overview of the effect of linoleic and conjugated linoleic acids on the growth of several human tumor cell lines, Int. J. Cancer
112 (2004), pp. 909–919. Makowski L, Hotamisligil GS. Fatty Acid Binding Proteins – The Evolutionary Crossroads of Inflammatory and Metabolic Responses. Journal of Nutrition 134 (2004) 2464S- 2468S. Mangelsdorf DJ, Evans RM. The RXR heterodimers and orphan receptors. Cell, 83: 841–
850, 1995.
Mensink RP. Effects of products made from a high-palmitic acid, trans-free semiliquid fat or a high-oleic acid, low-trans semiliquid fat on the serum lipoprotein profile and on C-reactive protein concentrations in humans. Eur J Clin Nutr. 2008 May;62(5):617-24. Epub 2007 Apr 18. McClelland GB. Fat to the fire: the regulation of lipid oxidation with exercise and environmental stress. Comparative Biochemistry and Physiology, Part B 139 (2004) 443-460. Menendez JA, Barbacid M, Montero S, Sevilla E, Escrich E, Solanas M, Cortes-Funes H, Colomer R. Effects of gamma-linolenic acid and oleic acid on paclitaxel cytotoxicity in human breast cancer cells. European Journal of Cancer 37 (2001) 402-413. Merino R, Hurle JM. The molecular basis of retinoid action in tumors. Trends in Molecular Medicine 9 (12) (2003) 509-511. Moller DE, Berger JP. Role of PPARs in the regulation of obesity-related insulin sensitivity and inflammation. Int J Obes Relat Metab Disord. 2003 Dec;27 Suppl 3:S17-21. Review. Murff HJ, Byrne D, Syngal S. Cancer Risk Assessment: Quality and Impact of the Family History Interview. American Journal of Preventive Medicine 27(3) (2004) 239-245. Nicol CJ, Yoon M, Ward JM, Yamashita M, Fukamachi K, Peters JM, Gonzalez FJ. PPARgamma influences susceptibility to DMBA-induced mammary, ovarian and skin carcinogenesis. Carcinogenesis. 2004 Sep;25(9):1747-55. Epub 2004 Apr 8. Okamoto K, Andreola F, Chiantore MV, Dedrick RL and De Luca LM, Differences in uptake and metabolism of retinoic acid between estrogen receptor-positive and -negative
human breast cancer cells, Cancer Chemother. Pharmacol. 46 (2000), pp. 128–134.
44
Paik J, Blaner WS, Swisshelm K. Cis-retinol dehydrogenase: 9-cis-retinol metabolism and its effect on proliferation of human MCF7 breast cancer cells. Experimental Cell Research 303 (2005) 183-196. Pegorier JP, Le May C, Girard J. Control of Gene Expression by Fatty Acids. Journal of Nutrition 134 (2004) 2444S-2449S. Quadro L, Hamberger L, Colantuoni V, Gottesman ME, Blaner WS. Understanding the physiological role of retinol-binding protein in vitamin A metabolism using transgenic and knockout mouse models. Reddy JK and Hashimoto T (2001) Peroxisomal beta-oxidation and peroxisome proliferator-activated receptor alpha: an adaptive metabolic system. Annu Rev Nutr 21: 193-230. Rose DP, Connolly JM. Omega-3 fatty acids as cancer chemopreventive agents. Pharmacology & Therapeutics 83 (1999) 217-244. Reyes N, Reyes I, Tiwari R, Geliebter J. Effect of linoleic acid on proliferation and gene expression in the breast cancer cell line T47D. Cancer Letters 209 (2004) 25-35. Sanderson IR. Short Chain Fatty Acid Regulaton of Signaling Genes Expressed by the Intestinal Epithelium. Journal of Nutrition 134 (2004) 2450S-2454S. Semba RD, de Pee S, Panagides D, Poly O, Bloem MW. Risk factors for xerophthalmia among mothers and their children and for mother-child pairs with xerophthalmia in Cambodia. Arch Ophthalmol. 2004 Apr;122(4):517-23. Serrano D, Perego E, Costa A, Decensi A. Progress in chemoprevention of breast cancer. Critical Reviews in Oncology/Hematology 49 (2004) 109-117. Silveira ER, Moreno FS. Natural retinoids and B-carotene: From food to their actions on gene expression. J. Nutr. Biochem. 9 (1998) 446-456. Simopoulos AP. The importance of the ratio of omega-6/omega-3 essential fatty acids. Biomed Pharmacother 56 (2002) 365-379. Sommer KM, Chen LI, Treuting PM, Smith LT, Swisshelm K. Elevated retinoic acid receptor B4 protein in human breast tumor cells with nuclear and cytoplasmic localization. Proc Natl Acad Sci USA 96 (1999) 8651-8656. Staels B, Vu-Dac N, Kosykh VA, Saladin R, Fruchart JC, Dallongeville J, and Auwerx J (1995) Fibrates downregulate apolipoprotein C-III expression independent of induction of peroxisomal acyl coenzyme A oxidase. A potential mechanism for the hypolipidemic action of fibrates. J Clin Investig 95: 705-712.
45
Stanley TB, Leesnitzer LM, Montana VG, Galardi CM, Lambert MH, Holt JA, Xu HE, Moore LB, Blanchard SG, and Stimmel JB (2003) Subtype specific effects of peroxisome proliferator-activated receptor ligands on corepressor affinity. Biochemistry 42: 9278-9287. Sun SY, Yue P, Dawson MI, Shroot B, Michel S, Lamph WW, Heyman RA, Teng M,
Chandraratna RAS, Shudo K, Hong WK, Lotan R. Differential effects of synthetic
nuclear retinoid receptor selective retinoids on the growth of human non-small cell lung
carcinoma cells. Cancer Res., 57: 4931–4939, 1997.
Takitani K, Koh M, Inoue A, Kawakami C, Kuno T, Tamai H. Pharmacokinetics of all-trans retinoic acid in adults and children with acute promyelocytic leukemia. Am J Hematol. 2006 Sep;81(9):720-1. Thoennes SR, Tate PL, Price TM, Kilgore MW. Differential transcriptional activation of peroxisome proliferators-activated receptor gamma by omega-3 and omega-6 fatty acids in MCF-7 cells. Molecular and Cellular Endocrinology 160 (2000) 67-73. Thupari JN, Pinn ML, Kuhajda FP. Fatty Acid Synthase Inhibition in Human Breast Cancer Cells Leads to Malonyl-CoA-Induced Inhibition of Fatty Acid Oxidation and Cytotoxicity. Biochemical and Biophysical Research Communications 285 (2001) 217-223. Thurnham DI, McCabe GP, Northrop-Clewes CA, Nestel P. Effects of subclinical infection on plasma retinol concentrations and assessment of prevalence of vitamin A deficiency: meta-analysis. Lancet. 2003 Dec 20;362(9401):2052-8. Tighe AP, Talmage DA. Retinoids arrest breast cancer cell proliferation: retinoic acid selectively reduces the duration of receptor tyrosine kinase signaling. Experimental Cell Research 301 (2004) 147-157. Vu-Dac N, Gervois P, Torra IP, Fruchart JC, Kosykh V, Kooistra T, Princen HM, Dallongeville J, Staels B. Retinoids increase human apo C-III expression at the transcriptional level via the retinoid X receptor. Contribution to the hypertriglyceridemic action of retinoids. J Clin Invest. 1998 Aug 1;102(3):625-32. Walker WA, Blackburn G, Symposium Introduction: Nutrition and Gene Regulation. Journal of Nutrition 134 (2004) 2434S-2436S. Wayne SJ, Lopez ST, Butler LM, Baumgartner KB, Baumgartner RN, Ballard-Barbash R. Changes in Dietary Intake after Diagnosis of Breast Cancer. J AM Diet Assoc 104 (2004) 1561-1568. Weinbrenner T, Fito M, Torre R, Saez G, Rijken P, Tormos C, Coolen S, Albaladejo MF, Abanades S, Schroder H, Marrugat J, Covas M. Olive Oils High in Phenolic Compounds Modulate Oxidative/Antioxidative Status in Men. Journal of Nutrition 134 (2004) 2314-2321.
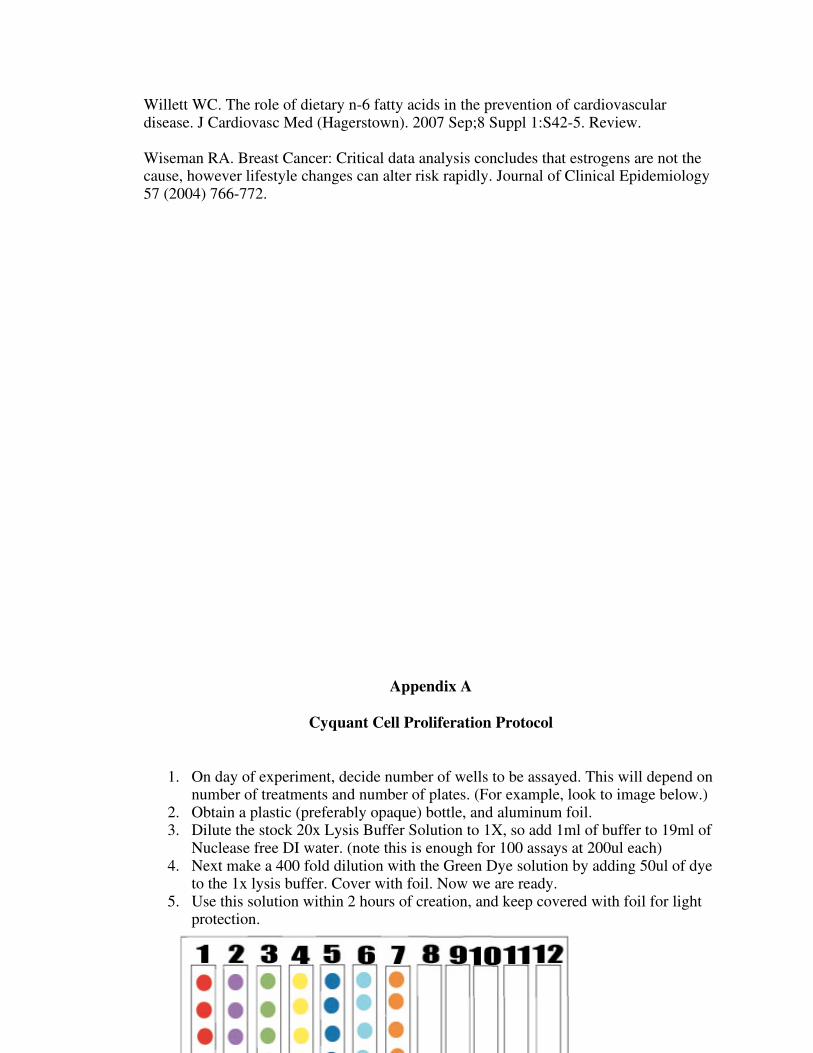
46
Willett WC. The role of dietary n-6 fatty acids in the prevention of cardiovascular disease. J Cardiovasc Med (Hagerstown). 2007 Sep;8 Suppl 1:S42-5. Review. Wiseman RA. Breast Cancer: Critical data analysis concludes that estrogens are not the cause, however lifestyle changes can alter risk rapidly. Journal of Clinical Epidemiology 57 (2004) 766-772.
Appendix A
Cyquant Cell Proliferation Protocol
1. On day of experiment, decide number of wells to be assayed. This will depend on
number of treatments and number of plates. (For example, look to image below.) 2. Obtain a plastic (preferably opaque) bottle, and aluminum foil. 3. Dilute the stock 20x Lysis Buffer Solution to 1X, so add 1ml of buffer to 19ml of
Nuclease free DI water. (note this is enough for 100 assays at 200ul each) 4. Next make a 400 fold dilution with the Green Dye solution by adding 50ul of dye
to the 1x lysis buffer. Cover with foil. Now we are ready. 5. Use this solution within 2 hours of creation, and keep covered with foil for light
protection.
47
Cell culture prior to day of assay
6. Obtain a 96 well, or 48 well plate. 7. Seed the wells with 5000 cells per well as obtained from a hemacytometer count.
(Hemacytometer protocol is available and separate) 8. Grow the cells with treatments (as described later) for specified durations. 9. Blot the media from the wells, and freeze immediately at –70C for each time
period.
Day of assay protocol
10. On day of assay, obtain plate from freezer and let thaw, then add 200ul of the working solution to each well to be assayed.
11. Let mix and incubate for 5min, and cover the plate with foil to protect from light. 12. Then use microplate reader to measure fluorescence with settings at 480nm
excitation and 520nm emission maxima.
Standard Curve Creation
1. Obtain 96 or 48 well plate. 2. Use hemacytometer to count cells from a confluent flask. 3. Seed wells with 500, 1000, 2000, 5000, and 10000 cells per well 4. Let cells adhere and incubate for 24 hours, then freeze. 5. Run assay as described above, and pray for a linear relationship. 6. Plate will be seeded as shown below.
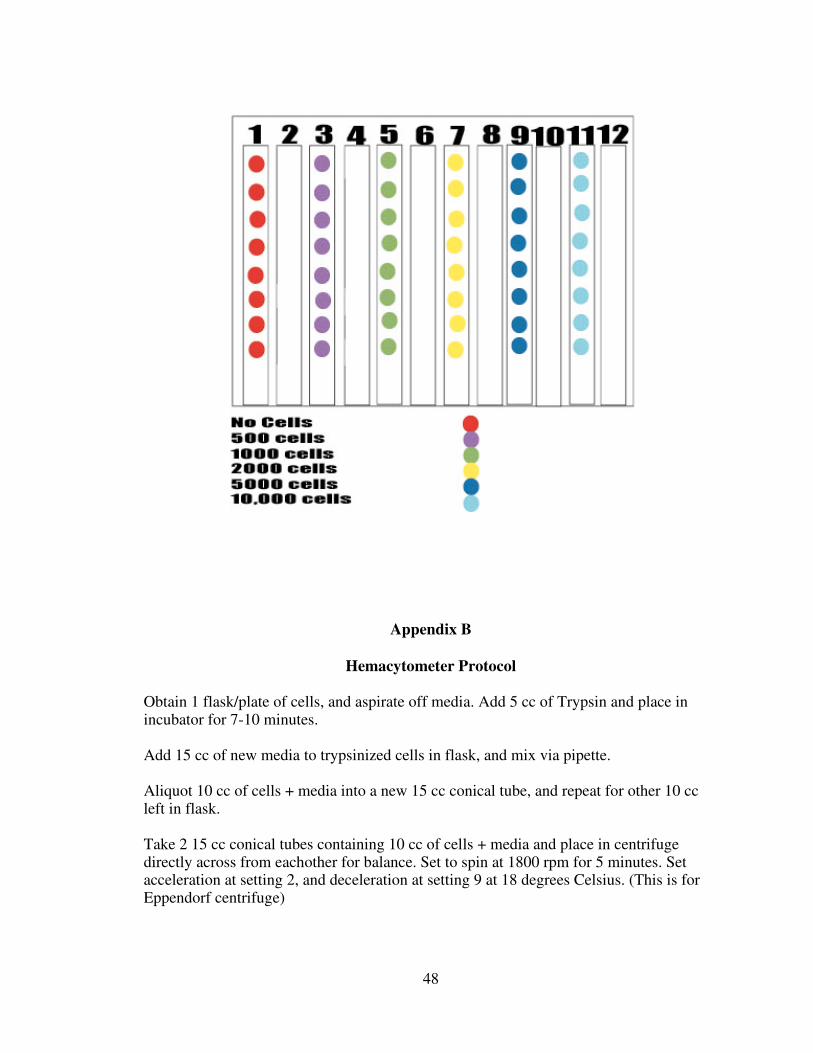
48
Appendix B
Hemacytometer Protocol Obtain 1 flask/plate of cells, and aspirate off media. Add 5 cc of Trypsin and place in incubator for 7-10 minutes. Add 15 cc of new media to trypsinized cells in flask, and mix via pipette. Aliquot 10 cc of cells + media into a new 15 cc conical tube, and repeat for other 10 cc left in flask. Take 2 15 cc conical tubes containing 10 cc of cells + media and place in centrifuge directly across from eachother for balance. Set to spin at 1800 rpm for 5 minutes. Set acceleration at setting 2, and deceleration at setting 9 at 18 degrees Celsius. (This is for Eppendorf centrifuge)

49
Take 15 cc tubes with visible cell pellets back to sterile environment to aspirate off media, and re-suspend cell pellet in 1 cc of new media. (Do this using a transfer pipette) With new transfer pipette, take small sample of cells plus media and slowly release onto hemacytometer. (The slide should have a coverslip on at this point, and is designed to disperse evenly due to small “channel” in glass) Place on upright (not inverted) microscope and view on the 5X objective lens to see cells. Optimal viewing found on 10 x objective lens. To count cells, first find center square with a 5x5 square profile. Count each corner square, and pick one more square in middle. (Note, this tactic only works if cells appear to be evenly distributed across slide… which they should!) Later the number is multiplied by 5 to account for other squares. Number will most likely be between 50-150. Then use the following equation: (cell # counted) x 5 x 10^4 x 1ml = # of cells in suspension Ex: 57 cells x 5 x 10^4 x 1ml = 2.85 x 10^6 Next, decide how much to aliquot for each well on a 96 well plate. Ex: let’s assume we want 5,000 cells per well. .05 x 10^6 / 2,85 x 10^6 = .018ml or…. 18ul per well. Max well volume should not exceed a ceiling, Of 270 ul. Therefore, the media warmed
before adding cells must be less than 252 ul in this case for each well.
Appendix C
Complete Experiment Results
The experiment concluded much more data then reported in the results section of Chapter 4. The results below are day to day results that were used for final analysis. As reported earlier, the results are described by either a single treatment on day one, or daily treatments over 72 hours. Each treatment is indicated as well.
Day 1
treatment
Daily
Treatment
Cell Growth Treatment: Blank
Day 1 18963751.5 18963751.5
Day 2 21281242.5 21281242.5
Day 3 27134548 27134548
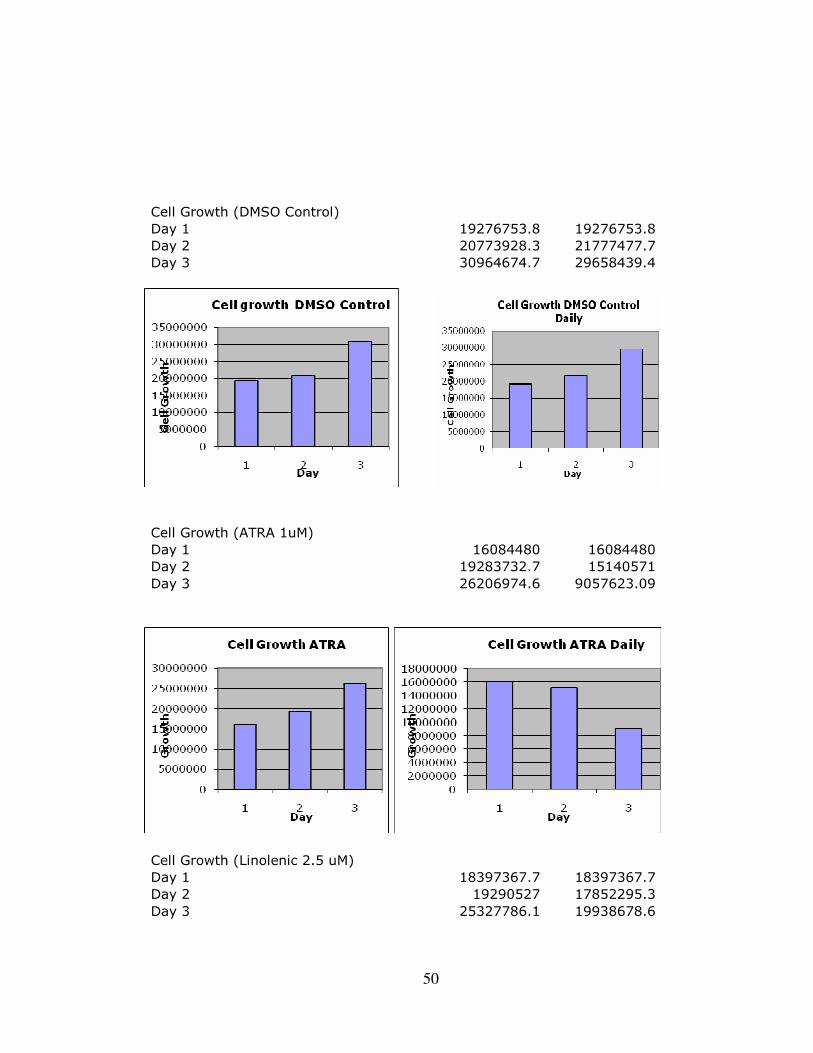
50
Cell Growth (DMSO Control)
Day 1 19276753.8 19276753.8
Day 2 20773928.3 21777477.7
Day 3 30964674.7 29658439.4
Cell Growth (ATRA 1uM)
Day 1 16084480 16084480
Day 2 19283732.7 15140571
Day 3 26206974.6 9057623.09
Cell Growth (Linolenic 2.5 uM)
Day 1 18397367.7 18397367.7
Day 2 19290527 17852295.3
Day 3 25327786.1 19938678.6
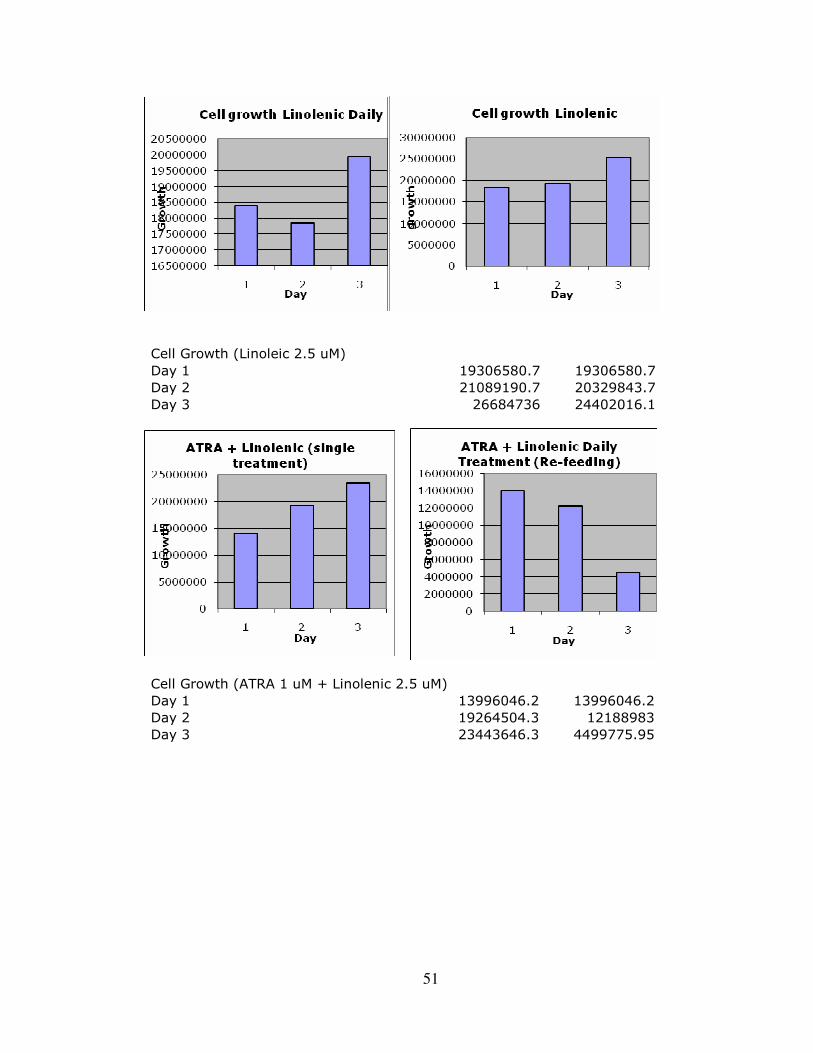
51
Cell Growth (Linoleic 2.5 uM)
Day 1 19306580.7 19306580.7
Day 2 21089190.7 20329843.7
Day 3 26684736 24402016.1
Cell Growth (ATRA 1 uM + Linolenic 2.5 uM)
Day 1 13996046.2 13996046.2
Day 2 19264504.3 12188983
Day 3 23443646.3 4499775.95
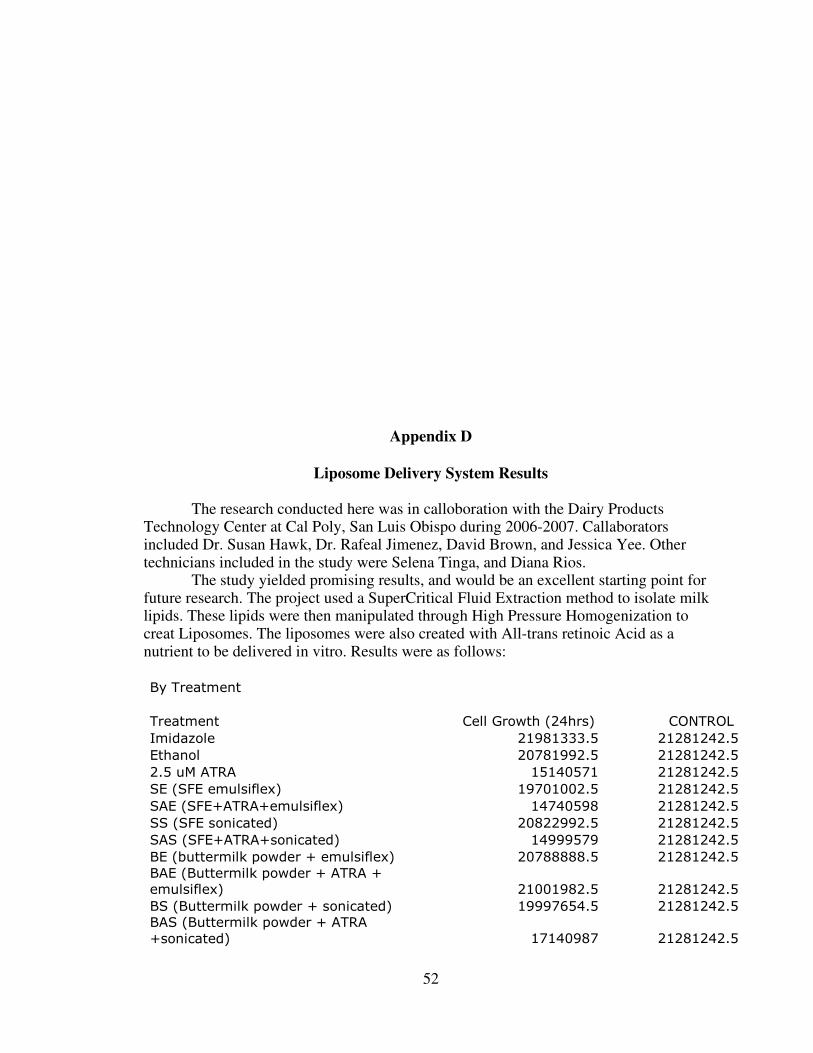
52
Appendix D
Liposome Delivery System Results The research conducted here was in calloboration with the Dairy Products Technology Center at Cal Poly, San Luis Obispo during 2006-2007. Callaborators included Dr. Susan Hawk, Dr. Rafeal Jimenez, David Brown, and Jessica Yee. Other technicians included in the study were Selena Tinga, and Diana Rios. The study yielded promising results, and would be an excellent starting point for future research. The project used a SuperCritical Fluid Extraction method to isolate milk lipids. These lipids were then manipulated through High Pressure Homogenization to creat Liposomes. The liposomes were also created with All-trans retinoic Acid as a nutrient to be delivered in vitro. Results were as follows: By Treatment
Treatment Cell Growth (24hrs) CONTROL
Imidazole 21981333.5 21281242.5
Ethanol 20781992.5 21281242.5
2.5 uM ATRA 15140571 21281242.5
SE (SFE emulsiflex) 19701002.5 21281242.5
SAE (SFE+ATRA+emulsiflex) 14740598 21281242.5
SS (SFE sonicated) 20822992.5 21281242.5
SAS (SFE+ATRA+sonicated) 14999579 21281242.5
BE (buttermilk powder + emulsiflex) 20788888.5 21281242.5
BAE (Buttermilk powder + ATRA +
emulsiflex) 21001982.5 21281242.5
BS (Buttermilk powder + sonicated) 19997654.5 21281242.5
BAS (Buttermilk powder + ATRA
+sonicated) 17140987 21281242.5
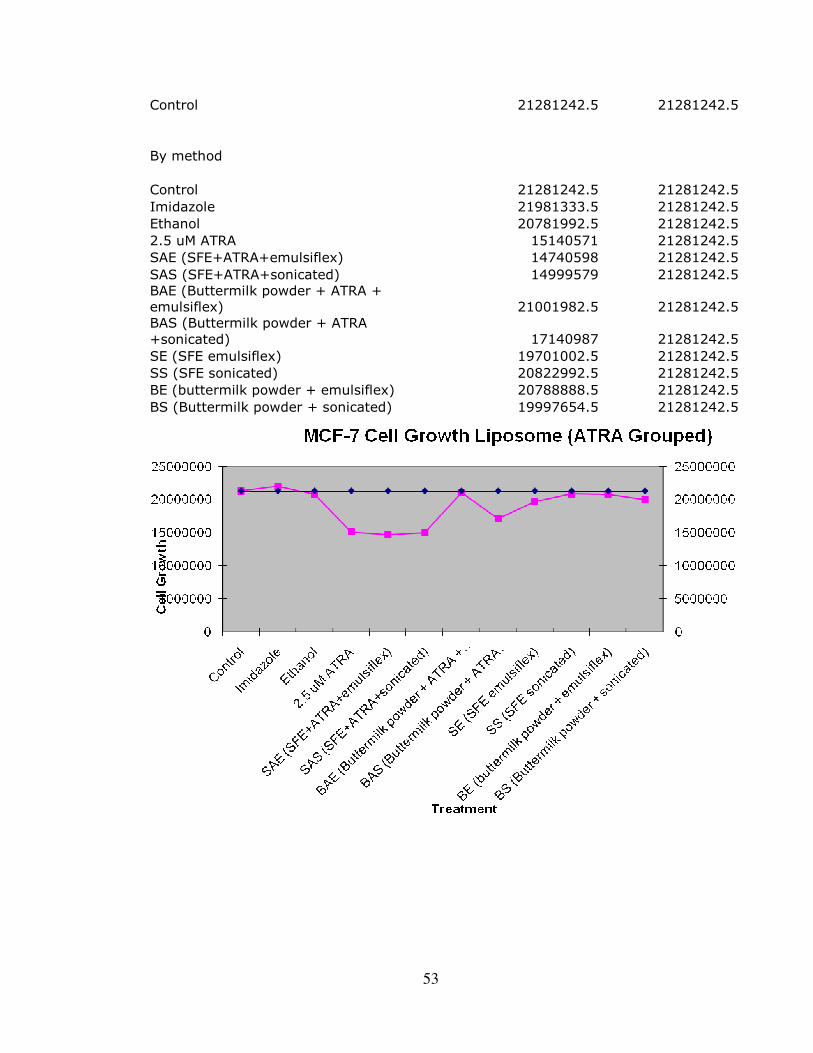
53
Control 21281242.5 21281242.5
By method
Control 21281242.5 21281242.5
Imidazole 21981333.5 21281242.5
Ethanol 20781992.5 21281242.5
2.5 uM ATRA 15140571 21281242.5
SAE (SFE+ATRA+emulsiflex) 14740598 21281242.5
SAS (SFE+ATRA+sonicated) 14999579 21281242.5
BAE (Buttermilk powder + ATRA +
emulsiflex) 21001982.5 21281242.5
BAS (Buttermilk powder + ATRA
+sonicated) 17140987 21281242.5
SE (SFE emulsiflex) 19701002.5 21281242.5
SS (SFE sonicated) 20822992.5 21281242.5
BE (buttermilk powder + emulsiflex) 20788888.5 21281242.5
BS (Buttermilk powder + sonicated) 19997654.5 21281242.5

54
Appendix E
Minitab Output
General Linear Model: Count versus Treatment, Application Factor Type Levels Values
Treatment fixed 7 Atra, Atra + Leic, ATRa +Lenic, control, dmso
control, Linoleic, Linolenic
Application fixed 2 Daily, Single
Analysis of Variance for Count, using Adjusted SS for Tests
Source DF Seq SS Adj SS Adj MS F P
Treatment 6 1.12085E+15 1.12085E+15 1.86808E+14 30.92 0.000
Application 1 8.82998E+14 8.82998E+14 8.82998E+14 146.16 0.000
Treatment*Application 6 4.85275E+14 4.85275E+14 8.08792E+13 13.39 0.000
Error 28 1.69160E+14 1.69160E+14 6.04142E+12
Total 41 2.65828E+15
S = 2457931 R-Sq = 93.64% R-Sq(adj) = 90.68%
Tukey 95.0% Simultaneous Confidence Intervals
Response Variable Count
All Pairwise Comparisons among Levels of Treatment*Application
Treatment = Atra
Application = Daily subtracted from:
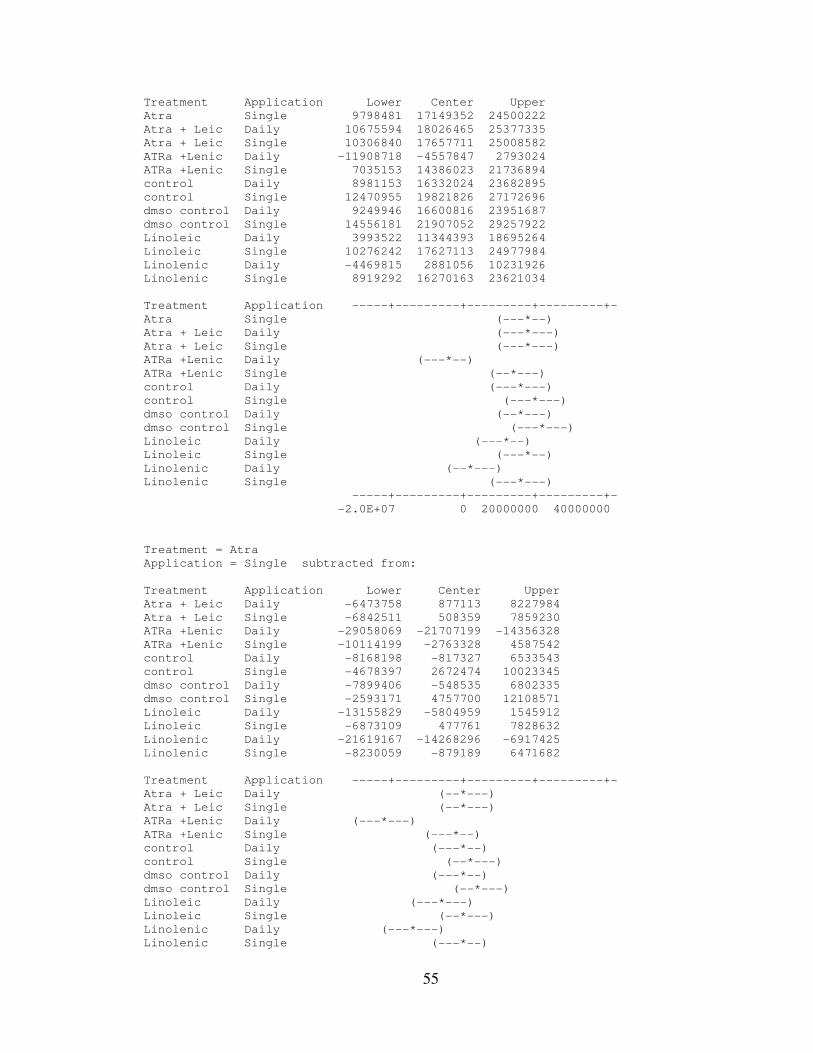
55
Treatment Application Lower Center Upper
Atra Single 9798481 17149352 24500222
Atra + Leic Daily 10675594 18026465 25377335
Atra + Leic Single 10306840 17657711 25008582
ATRa +Lenic Daily -11908718 -4557847 2793024
ATRa +Lenic Single 7035153 14386023 21736894
control Daily 8981153 16332024 23682895
control Single 12470955 19821826 27172696
dmso control Daily 9249946 16600816 23951687
dmso control Single 14556181 21907052 29257922
Linoleic Daily 3993522 11344393 18695264
Linoleic Single 10276242 17627113 24977984
Linolenic Daily -4469815 2881056 10231926
Linolenic Single 8919292 16270163 23621034
Treatment Application -----+---------+---------+---------+-
Atra Single (---*--)
Atra + Leic Daily (---*---)
Atra + Leic Single (---*---)
ATRa +Lenic Daily (---*--)
ATRa +Lenic Single (--*---)
control Daily (---*---)
control Single (---*---)
dmso control Daily (--*---)
dmso control Single (---*---)
Linoleic Daily (---*--)
Linoleic Single (---*--)
Linolenic Daily (--*---)
Linolenic Single (---*---)
-----+---------+---------+---------+-
-2.0E+07 0 20000000 40000000
Treatment = Atra
Application = Single subtracted from:
Treatment Application Lower Center Upper
Atra + Leic Daily -6473758 877113 8227984
Atra + Leic Single -6842511 508359 7859230
ATRa +Lenic Daily -29058069 -21707199 -14356328
ATRa +Lenic Single -10114199 -2763328 4587542
control Daily -8168198 -817327 6533543
control Single -4678397 2672474 10023345
dmso control Daily -7899406 -548535 6802335
dmso control Single -2593171 4757700 12108571
Linoleic Daily -13155829 -5804959 1545912
Linoleic Single -6873109 477761 7828632
Linolenic Daily -21619167 -14268296 -6917425
Linolenic Single -8230059 -879189 6471682
Treatment Application -----+---------+---------+---------+-
Atra + Leic Daily (--*---)
Atra + Leic Single (--*---)
ATRa +Lenic Daily (---*---)
ATRa +Lenic Single (---*--)
control Daily (---*--)
control Single (--*---)
dmso control Daily (---*--)
dmso control Single (--*---)
Linoleic Daily (---*---)
Linoleic Single (--*---)
Linolenic Daily (---*---)
Linolenic Single (---*--)
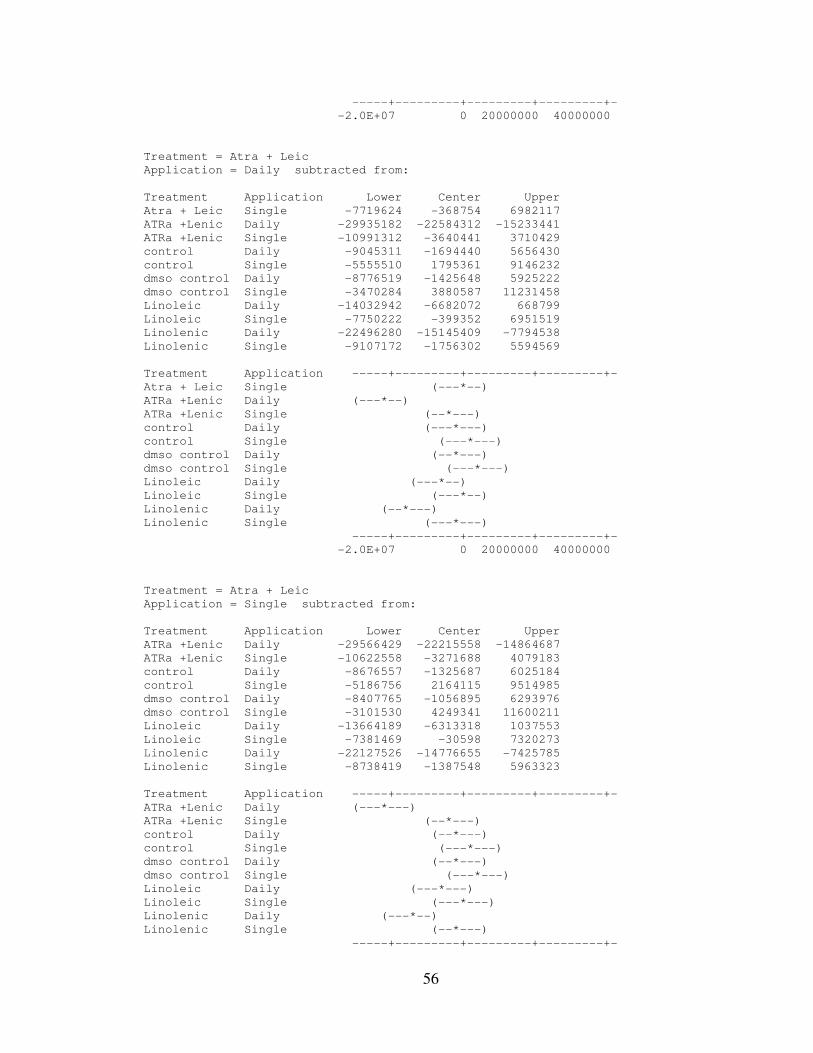
56
-----+---------+---------+---------+-
-2.0E+07 0 20000000 40000000
Treatment = Atra + Leic
Application = Daily subtracted from:
Treatment Application Lower Center Upper
Atra + Leic Single -7719624 -368754 6982117
ATRa +Lenic Daily -29935182 -22584312 -15233441
ATRa +Lenic Single -10991312 -3640441 3710429
control Daily -9045311 -1694440 5656430
control Single -5555510 1795361 9146232
dmso control Daily -8776519 -1425648 5925222
dmso control Single -3470284 3880587 11231458
Linoleic Daily -14032942 -6682072 668799
Linoleic Single -7750222 -399352 6951519
Linolenic Daily -22496280 -15145409 -7794538
Linolenic Single -9107172 -1756302 5594569
Treatment Application -----+---------+---------+---------+-
Atra + Leic Single (---*--)
ATRa +Lenic Daily (---*--)
ATRa +Lenic Single (--*---)
control Daily (---*---)
control Single (---*---)
dmso control Daily (--*---)
dmso control Single (---*---)
Linoleic Daily (---*--)
Linoleic Single (---*--)
Linolenic Daily (--*---)
Linolenic Single (---*---)
-----+---------+---------+---------+-
-2.0E+07 0 20000000 40000000
Treatment = Atra + Leic
Application = Single subtracted from:
Treatment Application Lower Center Upper
ATRa +Lenic Daily -29566429 -22215558 -14864687
ATRa +Lenic Single -10622558 -3271688 4079183
control Daily -8676557 -1325687 6025184
control Single -5186756 2164115 9514985
dmso control Daily -8407765 -1056895 6293976
dmso control Single -3101530 4249341 11600211
Linoleic Daily -13664189 -6313318 1037553
Linoleic Single -7381469 -30598 7320273
Linolenic Daily -22127526 -14776655 -7425785
Linolenic Single -8738419 -1387548 5963323
Treatment Application -----+---------+---------+---------+-
ATRa +Lenic Daily (---*---)
ATRa +Lenic Single (--*---)
control Daily (--*---)
control Single (---*---)
dmso control Daily (--*---)
dmso control Single (---*---)
Linoleic Daily (---*---)
Linoleic Single (---*---)
Linolenic Daily (---*--)
Linolenic Single (--*---)
-----+---------+---------+---------+-
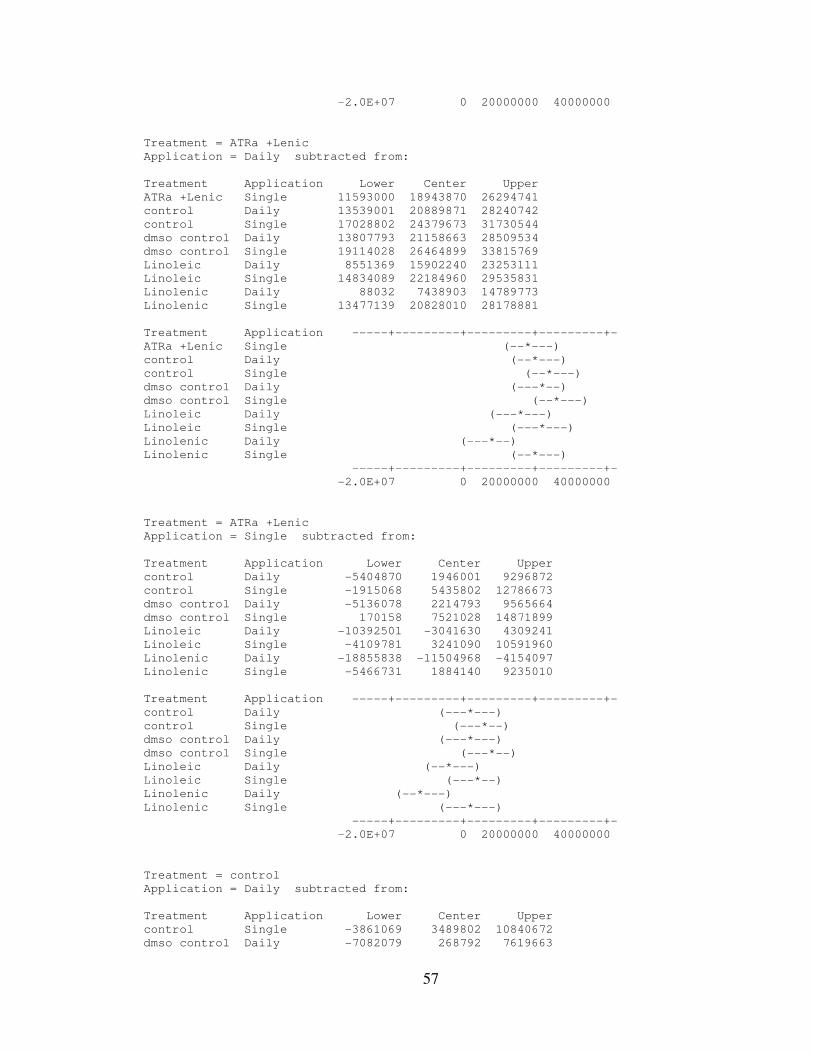
57
-2.0E+07 0 20000000 40000000
Treatment = ATRa +Lenic
Application = Daily subtracted from:
Treatment Application Lower Center Upper
ATRa +Lenic Single 11593000 18943870 26294741
control Daily 13539001 20889871 28240742
control Single 17028802 24379673 31730544
dmso control Daily 13807793 21158663 28509534
dmso control Single 19114028 26464899 33815769
Linoleic Daily 8551369 15902240 23253111
Linoleic Single 14834089 22184960 29535831
Linolenic Daily 88032 7438903 14789773
Linolenic Single 13477139 20828010 28178881
Treatment Application -----+---------+---------+---------+-
ATRa +Lenic Single (--*---)
control Daily (--*---)
control Single (--*---)
dmso control Daily (---*--)
dmso control Single (--*---)
Linoleic Daily (---*---)
Linoleic Single (---*---)
Linolenic Daily (---*--)
Linolenic Single (--*---)
-----+---------+---------+---------+-
-2.0E+07 0 20000000 40000000
Treatment = ATRa +Lenic
Application = Single subtracted from:
Treatment Application Lower Center Upper
control Daily -5404870 1946001 9296872
control Single -1915068 5435802 12786673
dmso control Daily -5136078 2214793 9565664
dmso control Single 170158 7521028 14871899
Linoleic Daily -10392501 -3041630 4309241
Linoleic Single -4109781 3241090 10591960
Linolenic Daily -18855838 -11504968 -4154097
Linolenic Single -5466731 1884140 9235010
Treatment Application -----+---------+---------+---------+-
control Daily (---*---)
control Single (---*--)
dmso control Daily (---*---)
dmso control Single (---*--)
Linoleic Daily (--*---)
Linoleic Single (---*--)
Linolenic Daily (--*---)
Linolenic Single (---*---)
-----+---------+---------+---------+-
-2.0E+07 0 20000000 40000000
Treatment = control
Application = Daily subtracted from:
Treatment Application Lower Center Upper
control Single -3861069 3489802 10840672
dmso control Daily -7082079 268792 7619663
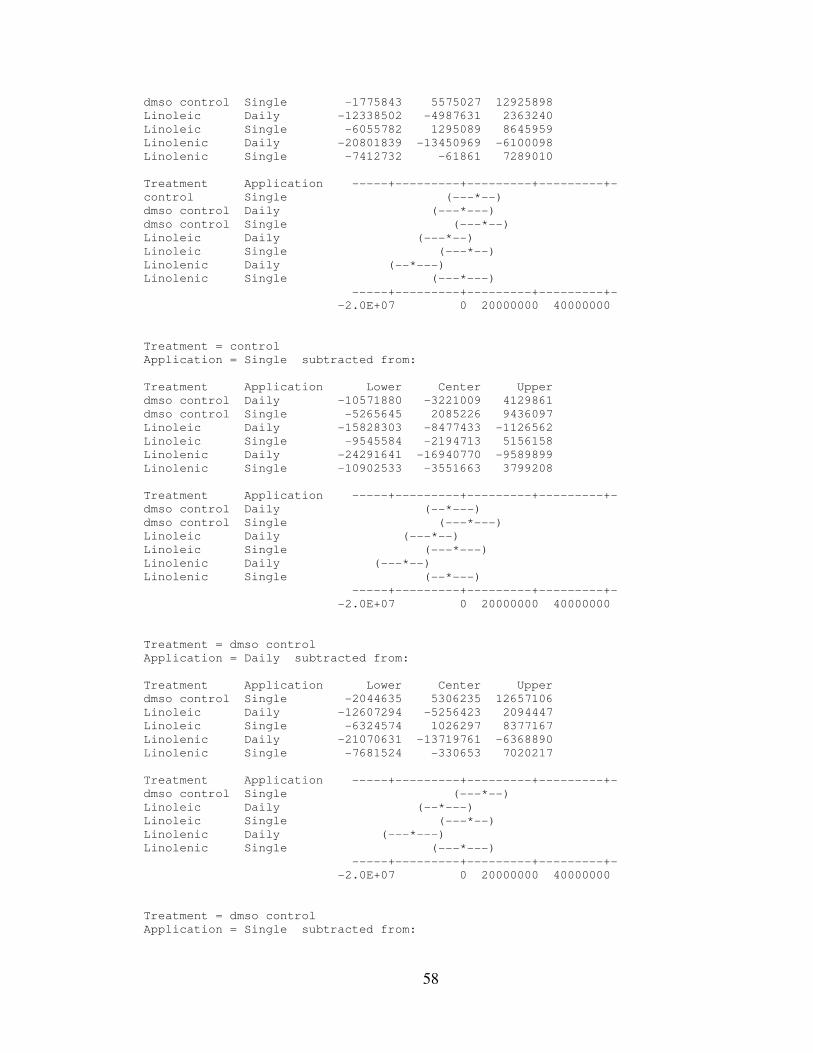
58
dmso control Single -1775843 5575027 12925898
Linoleic Daily -12338502 -4987631 2363240
Linoleic Single -6055782 1295089 8645959
Linolenic Daily -20801839 -13450969 -6100098
Linolenic Single -7412732 -61861 7289010
Treatment Application -----+---------+---------+---------+-
control Single (---*--)
dmso control Daily (---*---)
dmso control Single (---*--)
Linoleic Daily (---*--)
Linoleic Single (---*--)
Linolenic Daily (--*---)
Linolenic Single (---*---)
-----+---------+---------+---------+-
-2.0E+07 0 20000000 40000000
Treatment = control
Application = Single subtracted from:
Treatment Application Lower Center Upper
dmso control Daily -10571880 -3221009 4129861
dmso control Single -5265645 2085226 9436097
Linoleic Daily -15828303 -8477433 -1126562
Linoleic Single -9545584 -2194713 5156158
Linolenic Daily -24291641 -16940770 -9589899
Linolenic Single -10902533 -3551663 3799208
Treatment Application -----+---------+---------+---------+-
dmso control Daily (--*---)
dmso control Single (---*---)
Linoleic Daily (---*--)
Linoleic Single (---*---)
Linolenic Daily (---*--)
Linolenic Single (--*---)
-----+---------+---------+---------+-
-2.0E+07 0 20000000 40000000
Treatment = dmso control
Application = Daily subtracted from:
Treatment Application Lower Center Upper
dmso control Single -2044635 5306235 12657106
Linoleic Daily -12607294 -5256423 2094447
Linoleic Single -6324574 1026297 8377167
Linolenic Daily -21070631 -13719761 -6368890
Linolenic Single -7681524 -330653 7020217
Treatment Application -----+---------+---------+---------+-
dmso control Single (---*--)
Linoleic Daily (--*---)
Linoleic Single (---*--)
Linolenic Daily (---*---)
Linolenic Single (---*---)
-----+---------+---------+---------+-
-2.0E+07 0 20000000 40000000
Treatment = dmso control
Application = Single subtracted from:
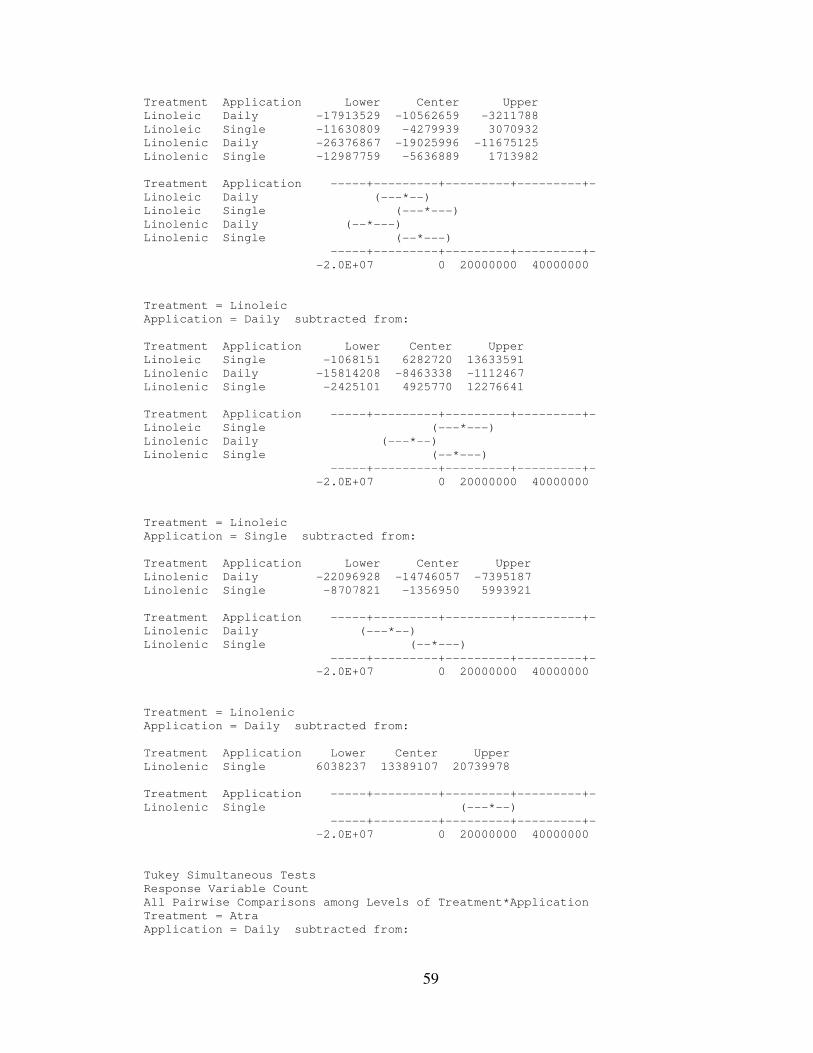
59
Treatment Application Lower Center Upper
Linoleic Daily -17913529 -10562659 -3211788
Linoleic Single -11630809 -4279939 3070932
Linolenic Daily -26376867 -19025996 -11675125
Linolenic Single -12987759 -5636889 1713982
Treatment Application -----+---------+---------+---------+-
Linoleic Daily (---*--)
Linoleic Single (---*---)
Linolenic Daily (--*---)
Linolenic Single (--*---)
-----+---------+---------+---------+-
-2.0E+07 0 20000000 40000000
Treatment = Linoleic
Application = Daily subtracted from:
Treatment Application Lower Center Upper
Linoleic Single -1068151 6282720 13633591
Linolenic Daily -15814208 -8463338 -1112467
Linolenic Single -2425101 4925770 12276641
Treatment Application -----+---------+---------+---------+-
Linoleic Single (---*---)
Linolenic Daily (---*--)
Linolenic Single (--*---)
-----+---------+---------+---------+-
-2.0E+07 0 20000000 40000000
Treatment = Linoleic
Application = Single subtracted from:
Treatment Application Lower Center Upper
Linolenic Daily -22096928 -14746057 -7395187
Linolenic Single -8707821 -1356950 5993921
Treatment Application -----+---------+---------+---------+-
Linolenic Daily (---*--)
Linolenic Single (--*---)
-----+---------+---------+---------+-
-2.0E+07 0 20000000 40000000
Treatment = Linolenic
Application = Daily subtracted from:
Treatment Application Lower Center Upper
Linolenic Single 6038237 13389107 20739978
Treatment Application -----+---------+---------+---------+-
Linolenic Single (---*--)
-----+---------+---------+---------+-
-2.0E+07 0 20000000 40000000
Tukey Simultaneous Tests
Response Variable Count
All Pairwise Comparisons among Levels of Treatment*Application
Treatment = Atra
Application = Daily subtracted from:
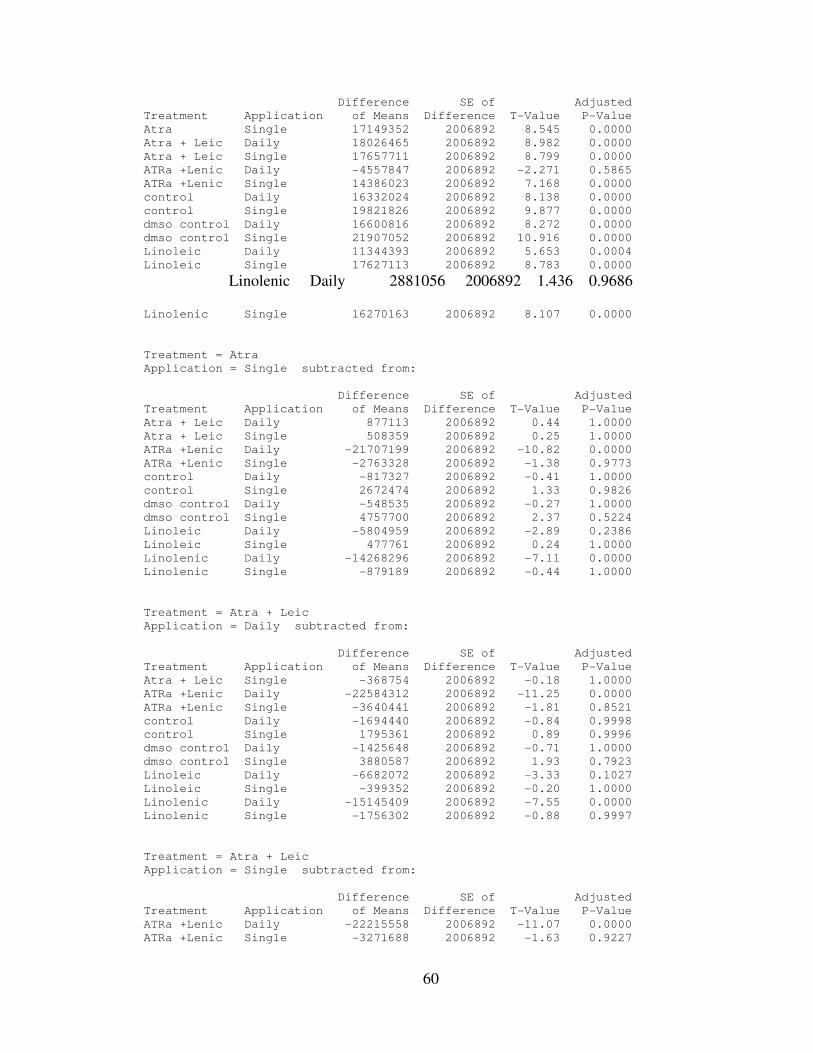
60
Difference SE of Adjusted
Treatment Application of Means Difference T-Value P-Value
Atra Single 17149352 2006892 8.545 0.0000
Atra + Leic Daily 18026465 2006892 8.982 0.0000
Atra + Leic Single 17657711 2006892 8.799 0.0000
ATRa +Lenic Daily -4557847 2006892 -2.271 0.5865
ATRa +Lenic Single 14386023 2006892 7.168 0.0000
control Daily 16332024 2006892 8.138 0.0000
control Single 19821826 2006892 9.877 0.0000
dmso control Daily 16600816 2006892 8.272 0.0000
dmso control Single 21907052 2006892 10.916 0.0000
Linoleic Daily 11344393 2006892 5.653 0.0004
Linoleic Single 17627113 2006892 8.783 0.0000
Linolenic Daily 2881056 2006892 1.436 0.9686
Linolenic Single 16270163 2006892 8.107 0.0000
Treatment = Atra
Application = Single subtracted from:
Difference SE of Adjusted
Treatment Application of Means Difference T-Value P-Value
Atra + Leic Daily 877113 2006892 0.44 1.0000
Atra + Leic Single 508359 2006892 0.25 1.0000
ATRa +Lenic Daily -21707199 2006892 -10.82 0.0000
ATRa +Lenic Single -2763328 2006892 -1.38 0.9773
control Daily -817327 2006892 -0.41 1.0000
control Single 2672474 2006892 1.33 0.9826
dmso control Daily -548535 2006892 -0.27 1.0000
dmso control Single 4757700 2006892 2.37 0.5224
Linoleic Daily -5804959 2006892 -2.89 0.2386
Linoleic Single 477761 2006892 0.24 1.0000
Linolenic Daily -14268296 2006892 -7.11 0.0000
Linolenic Single -879189 2006892 -0.44 1.0000
Treatment = Atra + Leic
Application = Daily subtracted from:
Difference SE of Adjusted
Treatment Application of Means Difference T-Value P-Value
Atra + Leic Single -368754 2006892 -0.18 1.0000
ATRa +Lenic Daily -22584312 2006892 -11.25 0.0000
ATRa +Lenic Single -3640441 2006892 -1.81 0.8521
control Daily -1694440 2006892 -0.84 0.9998
control Single 1795361 2006892 0.89 0.9996
dmso control Daily -1425648 2006892 -0.71 1.0000
dmso control Single 3880587 2006892 1.93 0.7923
Linoleic Daily -6682072 2006892 -3.33 0.1027
Linoleic Single -399352 2006892 -0.20 1.0000
Linolenic Daily -15145409 2006892 -7.55 0.0000
Linolenic Single -1756302 2006892 -0.88 0.9997
Treatment = Atra + Leic
Application = Single subtracted from:
Difference SE of Adjusted
Treatment Application of Means Difference T-Value P-Value
ATRa +Lenic Daily -22215558 2006892 -11.07 0.0000
ATRa +Lenic Single -3271688 2006892 -1.63 0.9227
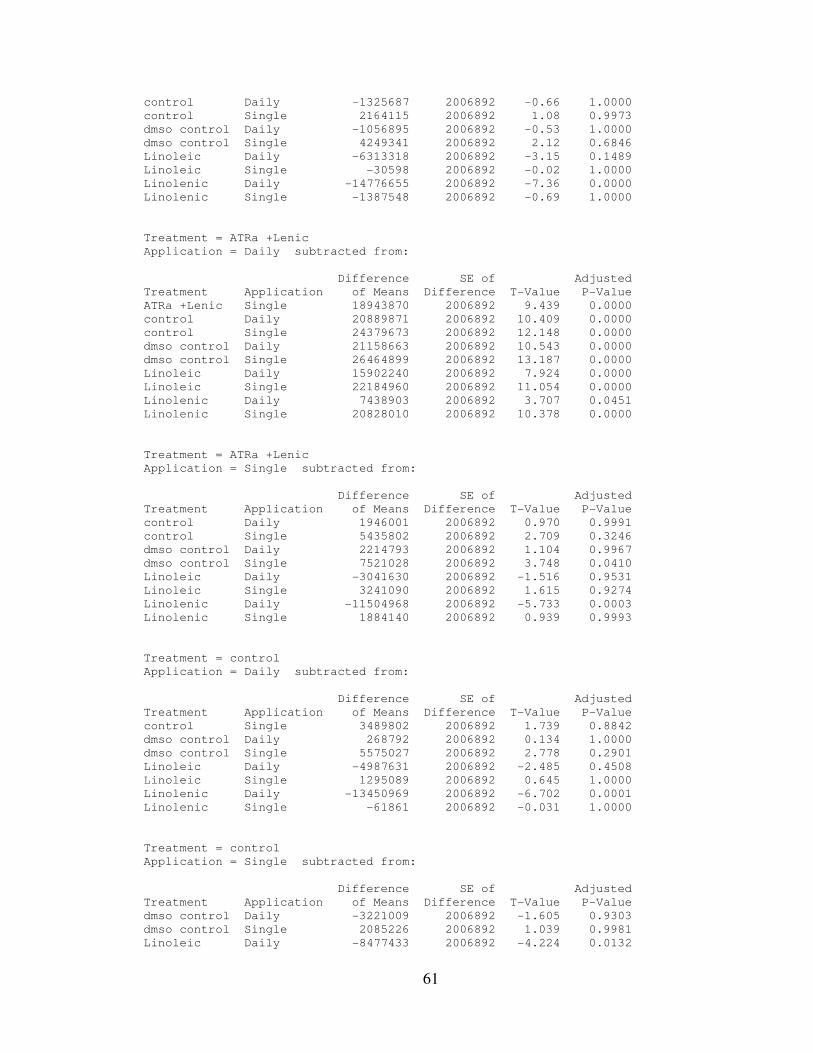
61
control Daily -1325687 2006892 -0.66 1.0000
control Single 2164115 2006892 1.08 0.9973
dmso control Daily -1056895 2006892 -0.53 1.0000
dmso control Single 4249341 2006892 2.12 0.6846
Linoleic Daily -6313318 2006892 -3.15 0.1489
Linoleic Single -30598 2006892 -0.02 1.0000
Linolenic Daily -14776655 2006892 -7.36 0.0000
Linolenic Single -1387548 2006892 -0.69 1.0000
Treatment = ATRa +Lenic
Application = Daily subtracted from:
Difference SE of Adjusted
Treatment Application of Means Difference T-Value P-Value
ATRa +Lenic Single 18943870 2006892 9.439 0.0000
control Daily 20889871 2006892 10.409 0.0000
control Single 24379673 2006892 12.148 0.0000
dmso control Daily 21158663 2006892 10.543 0.0000
dmso control Single 26464899 2006892 13.187 0.0000
Linoleic Daily 15902240 2006892 7.924 0.0000
Linoleic Single 22184960 2006892 11.054 0.0000
Linolenic Daily 7438903 2006892 3.707 0.0451
Linolenic Single 20828010 2006892 10.378 0.0000
Treatment = ATRa +Lenic
Application = Single subtracted from:
Difference SE of Adjusted
Treatment Application of Means Difference T-Value P-Value
control Daily 1946001 2006892 0.970 0.9991
control Single 5435802 2006892 2.709 0.3246
dmso control Daily 2214793 2006892 1.104 0.9967
dmso control Single 7521028 2006892 3.748 0.0410
Linoleic Daily -3041630 2006892 -1.516 0.9531
Linoleic Single 3241090 2006892 1.615 0.9274
Linolenic Daily -11504968 2006892 -5.733 0.0003
Linolenic Single 1884140 2006892 0.939 0.9993
Treatment = control
Application = Daily subtracted from:
Difference SE of Adjusted
Treatment Application of Means Difference T-Value P-Value
control Single 3489802 2006892 1.739 0.8842
dmso control Daily 268792 2006892 0.134 1.0000
dmso control Single 5575027 2006892 2.778 0.2901
Linoleic Daily -4987631 2006892 -2.485 0.4508
Linoleic Single 1295089 2006892 0.645 1.0000
Linolenic Daily -13450969 2006892 -6.702 0.0001
Linolenic Single -61861 2006892 -0.031 1.0000
Treatment = control
Application = Single subtracted from:
Difference SE of Adjusted
Treatment Application of Means Difference T-Value P-Value
dmso control Daily -3221009 2006892 -1.605 0.9303
dmso control Single 2085226 2006892 1.039 0.9981
Linoleic Daily -8477433 2006892 -4.224 0.0132
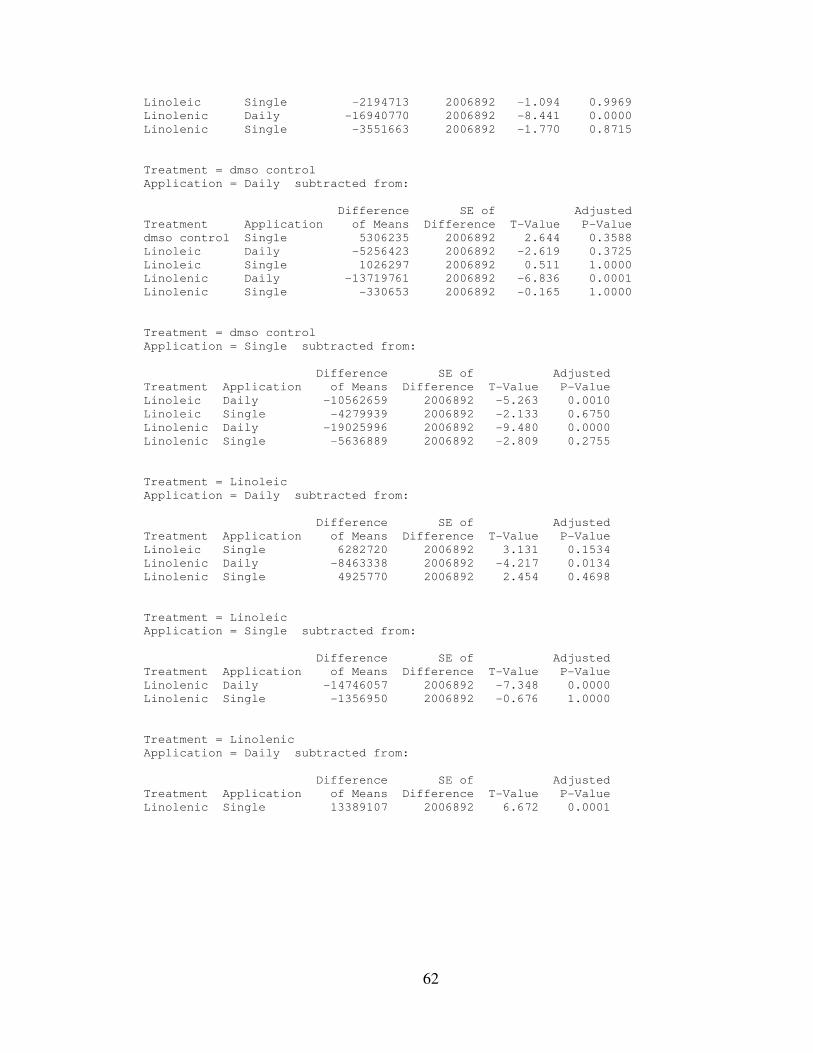
62
Linoleic Single -2194713 2006892 -1.094 0.9969
Linolenic Daily -16940770 2006892 -8.441 0.0000
Linolenic Single -3551663 2006892 -1.770 0.8715
Treatment = dmso control
Application = Daily subtracted from:
Difference SE of Adjusted
Treatment Application of Means Difference T-Value P-Value
dmso control Single 5306235 2006892 2.644 0.3588
Linoleic Daily -5256423 2006892 -2.619 0.3725
Linoleic Single 1026297 2006892 0.511 1.0000
Linolenic Daily -13719761 2006892 -6.836 0.0001
Linolenic Single -330653 2006892 -0.165 1.0000
Treatment = dmso control
Application = Single subtracted from:
Difference SE of Adjusted
Treatment Application of Means Difference T-Value P-Value
Linoleic Daily -10562659 2006892 -5.263 0.0010
Linoleic Single -4279939 2006892 -2.133 0.6750
Linolenic Daily -19025996 2006892 -9.480 0.0000
Linolenic Single -5636889 2006892 -2.809 0.2755
Treatment = Linoleic
Application = Daily subtracted from:
Difference SE of Adjusted
Treatment Application of Means Difference T-Value P-Value
Linoleic Single 6282720 2006892 3.131 0.1534
Linolenic Daily -8463338 2006892 -4.217 0.0134
Linolenic Single 4925770 2006892 2.454 0.4698
Treatment = Linoleic
Application = Single subtracted from:
Difference SE of Adjusted
Treatment Application of Means Difference T-Value P-Value
Linolenic Daily -14746057 2006892 -7.348 0.0000
Linolenic Single -1356950 2006892 -0.676 1.0000
Treatment = Linolenic
Application = Daily subtracted from:
Difference SE of Adjusted
Treatment Application of Means Difference T-Value P-Value
Linolenic Single 13389107 2006892 6.672 0.0001
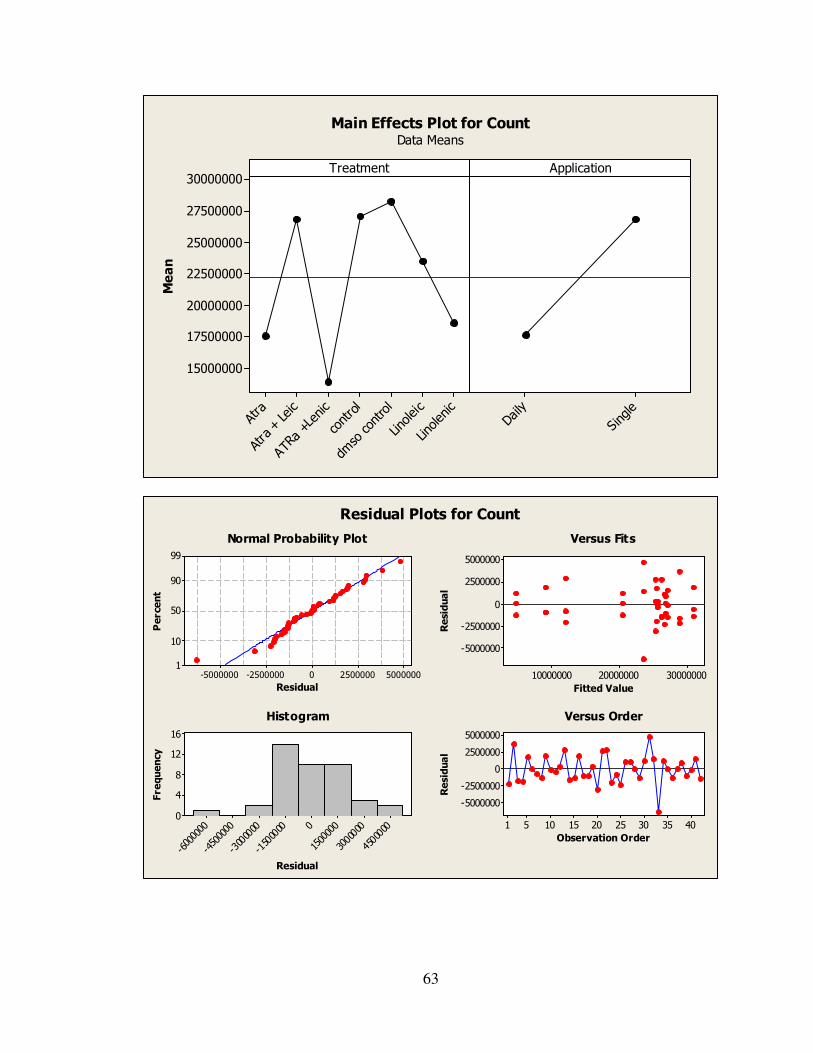
63
Linolenic
Linoleic
dmso control
control
ATRa +Lenic
Atra + Leic
Atra
30000000
27500000
25000000
22500000
20000000
17500000
15000000
Single
Daily
TreatmentMean
Application
Main Effects Plot for CountData Means
500000025000000-2500000-5000000
99
90
50
10
1
Residual
Percent
300000002000000010000000
5000000
2500000
0
-2500000
-5000000
Fitted Value
Residual
4500000
3000000
15000000
-1500000
-3000000
-4500000
-6000000
16
12
8
4
0
Residual
Frequency
4035302520151051
5000000
2500000
0
-2500000
-5000000
Observation Order
Residual
Normal Probability Plot Versus Fits
Histogram Versus Order
Residual Plots for Count