trans fatty acids in the new zealand and australian food ... · review report trans fatty acids in...
TRANSCRIPT

REVIEW REPORT
TRANS FATTY ACIDS IN THE NEW ZEALAND AND AUSTRALIAN FOOD SUPPLY

-ii-
EXECUTIVE SUMMARY Purpose of the review There is growing public awareness of trans fatty acids (TFA) in the food supply and potential health concerns arising from high levels of TFA consumption. The purpose of this review is to examine the current status of TFA in the Australia and New Zealand food supply, assess any risks to public health and come to a view about appropriate action. Under the Food Standards Australia New Zealand Act 1991, FSANZ may review a food regulatory measure on its own initiative and in a manner it considers appropriate. After the review, FSANZ may then develop a new food regulatory measure, if this is deemed appropriate. Alternatively, FSANZ may recommend non-regulatory risk management options, or recommend maintaining the status quo. FSANZ has decided to conduct this review for the following reasons: • there is new evidence concerning the potential health effects of TFA; • countries outside Australia and New Zealand have introduced new regulatory measures
governing TFA in the food supply; • current Australian and New Zealand TFA intakes are not well understood and the risks
they may pose are uncertain; • it is some time since TFA levels were evaluated in the Australian and New Zealand
food supply; • there may have been considerable changes in TFA content of foods, and food
consumption itself may have undergone some change. The Issue Chemically, unsaturated fatty acids can occur in the common cis structure, or the rarer trans configuration. These alternative structures result in different chemical and physical properties of trans and cis fatty acids, and may also explain differences in their biological activity. Sources of human intake of TFA are manufactured TFA from processed edible oils, and naturally occurring TFA from beef, mutton, lamb and dairy fat. Sources of manufactured TFA in the diet include fried foods, margarines (edible oil spreads), shortenings, biscuits and baked goods. Concerns exist about the potential health effects of TFA, particularly those that are manufactured. There has been vigorous debate in light of the evidence that intake of TFA may be connected to known risk factors for coronary heart disease.

-iii-
Estimation of dietary intake of TFA for the Australia and New Zealand populations FSANZ has estimated the dietary intake of TFA for the Australian and New Zealand populations based on recently available concentration data for TFA in foods. Major contributors to the intake of TFA for both countries were dairy products, pastry, pastry based mixed foods, fats, and oils, meat and poultry, cereal and cereal products and cereal based mixed foods. There was a higher contribution to total TFA intake from fats and oils for New Zealanders compared to Australians. The differences in part reflect that New Zealand values might pre-date moves by New Zealand manufacturers to reduce TFA levels in spreads and that New Zealand samples appeared to be primarily from products less likely to have reduced TFA levels. For Australians, the percent contributions from ruminant, manufactured and mixed sources of TFA were 60%, 24%, and 16% respectively. For the New Zealand population the percent contributions from ruminant, manufactured and mixed sources were 41%, 46% and 13%, reflecting higher TFA levels in New Zealand edible oil spreads. In Australia, between 8-24% of TFA intake is estimated to come from take away foods. In New Zealand, take away foods were estimated to be the source of 3-16% of TFA intake. For the Australian population between 46-84% of TFA intake is estimated to come from foods with a food label. In New Zealand, the figures were 63-90%. The contributions of TFA to energy intakes of Australians and New Zealanders were 0.6% and 0.7% of total energy intake respectively and therefore below the goal of no more than 1% proposed by the WHO. These estimates were comparable to, or lower than, reported TFA contribution to total energy intakes estimates from other countries. According to current recommendations1, total fats should contribute no more than 20-35% of total daily energy intake. Saturated fatty acids and TFA combined2 should comprise no more than 10% of total daily energy intake. The percentage of total energy derived from saturated fatty acids and TFA combined was estimated to be approximately 13-17% of total daily energy intake, one and a half times the recommended level. Even if all TFA were removed from the diets, intake of saturated fats would still exceed the recommended upper daily intake. Assessment of risk posed by TFA intakes A risk assessment of the dietary intake of TFA for the Australian and New Zealand populations was undertaken. The basis of the risk assessment was the dietary intakes in Australia and New Zealand estimated by FSANZ and relevant evidence published in the literature on the relationship between TFA intakes and health impacts.
1 In 2006 Nutrient Reference Values (NRV) were established for fats in the Australian and New Zealand diets, in the form of an Acceptable Macronutrient Distribution Range (AMDR). Total fats should contribute between 20-35% of total energy intake. A combined limit of 8-10% of energy from saturated and trans fatty acids together was considered prudent. 2 Whilst chemically unsaturated fatty acids, physiologically TFA are thought to be akin to saturated fats and this is reflected in dietary recommendations.

-iv-
A review of four published key studies found that there is consistent and robust evidence linking TFA intake with risk factors for coronary heart disease, including raised total cholesterol concentrations. The strength of this association was one of the principal reasons put forward to support the regulatory measures regarding TFA taken by some countries. While FSANZ concludes that there is compelling evidence that the adverse effect on blood lipid profiles caused by TFA are greater than those posed by saturated fatty acids, the contribution of TFA to energy intakes of Australians and New Zealanders is comparatively low. While FSANZ also concludes that although arguments have been put forward to suggest that ruminant3-derived TFA may have different health effects than manufactured TFA, there is a lack of definitive evidence to support this view. The best evidence for health benefits associated with reducing TFA intake is for a reduction in coronary heart disease events and death. However, TFA intakes in Australia and New Zealand are substantially lower than the TFA intakes in studies supporting potential health benefits of reducing TFA intake. Therefore, the overall magnitude of reduction in heart disease that might be achieved if manufactured TFA were reduced in Australia and New Zealand is uncertain. Consumer research FSANZ reviewed the literature on consumer information requirements and behaviour in regards to labels on products providing information on TFA contents. Studies have consistently found that most consumers use nutrition information on food labels, and that some do so more frequently than others do. In general, consumers are most interested in nutritive information concerning fat, energy (‘calories’) and sugar. International studies highlight various links between nutrition related knowledge and selection of healthy products or disease risk perceptions, but there were no reports available in the literature of the impact on information regarding TFA on the consumption behaviour of consumers. There are limited data on the level of awareness of TFA in food and the behavioural responses of consumers and purchasers in Australia and New Zealand. Research has shown that consumers will reduce their total fat intake in response to labelling, but there is no available data on reduction of TFA intake resulting from labelling of TFA. Consumer research has shown that including TFA content among nutrition information may lead to some products being considered healthier due to slightly lower levels of TFA, while containing much higher levels of saturated fatty acids. This highlights the potential negative impact that some approaches to labelling TFA might have on consumer selection of healthy products.
3 Ruminants are animals with multi-chamber stomachs; the first chamber is called the rumen. Examples are cattle, sheep, goats and camels.

-v-
Regulatory risk management in Australia and New Zealand In Australia and New Zealand, the Code permits voluntary labelling of TFA, but TFA must be declared in an expanded nutrition information panel where nutrition claims are made in relation to cholesterol or fatty acids. The FSANZ label monitoring survey has found that where mandated nutrients were listed as missing from the expanded nutrition information panel, the information on TFA was the most likely nutrient to be missing. In this context, it is important to note that some foods that contain TFA are not required to bear a label (e.g. take away foods) and therefore would not be affected by any expanded labelling requirements, and are not included in the label monitoring survey. Non-regulatory risk management approaches in Australia and New Zealand Currently, several non-regulatory risk management measures are addressing the issue of TFA in the food supply. Nutritional education provided by governments and non-government organisations, the National Heart Foundation ‘Pick the Tick’ program, and a number of initiatives by industry directed at reducing TFA content of some foods are important measures for managing the risk of TFA in the food supply. In some food categories, such as margarines/oil based spreads, there is a broad variety of low TFA choices available to consumers. Preliminary discussions with industry indicate increased demand from within the food industry for reduced levels of TFA edible oils used for food production. This trend appears to have grown recently, and has been an important driver for reducing TFA in the food supply. Based on the limited data available, industry appears to be ready to and capable of responding to market demand for lower TFA contents of food. International risk management strategies Broadly, labelling requirements in Australia and New Zealand are similar to those in the European Union and the Codex4. The USA and Canada mandate labelling of TFA content of food. Denmark is currently the only country that has set regulatory limits on the TFA content of most foods. However, labelling is not mandated. Canada is likely to introduce regulatory limits on TFA content of most foods in the near future. Stakeholders that may be affected by changes to the regulatory approach Stakeholders that would be impacted by increased regulation of TFA include the food manufacturing industry involved in the purchase and use of edible oils, manufacturers and suppliers of edible oils and the hospitality industry if compositional requirements were introduced. Enforcement agencies would need to enforce any additional requirements regarding TFA. Heightened awareness of TFA and saturated fat may lead to healthier food choices by consumers. However, consumers may be exposed to higher intakes of saturated fat, or restrict 4 The Codex Alimentarius Commission (Codex) was created in 1963 to develop food standards, guidelines and related texts such as codes of practice under the Joint Food and Agriculture Organization / World Health Organisation Food Standards Programme

-vi-
the intake of other desirable nutrients due to TFA labelling. Increased costs may be passed onto consumers. Options for risk management Options to manage the health risk from TFA in the food supply are: • voluntary labelling and claims; • mandatory labelling; • compositional restrictions; • voluntary measures that reduce TFA content of foods; or • combinations of the above.
Voluntary measures, such as industry initiatives, codes of practice, education and policy initiatives are proving to be valuable tools in managing the risks surrounding TFA intake. Conclusion and need for risk management action FSANZ concludes that immediate regulatory intervention is not required and that national non-regulatory approaches to further reducing the levels of TFA in the Australia and New Zealand food supply would be the most appropriate action for risk management. This conclusion is based on:
• the comparatively low intakes of TFA in Australia and New Zealand; • the uncertainty as to the overall magnitude of reduction in disease risk that might be
achieved by increased regulation; • uncertainty on the potential of labelling to affect consumer behaviour; • the potential to improve implementation of existing labelling requirements; • the effectiveness of current initiatives in reducing TFA in the food supply; • consistency with Codex and regulation applied in countries with similar TFA intakes
to Australia and New Zealand; • potential impact on stakeholders.

-vii-
Future Actions Following the review of this matter, FSANZ recommends the following future actions, that FSANZ: 1. Support the Australian National Collaboration on Trans Fats in its initiative directed at
expanding and strengthening existing non-regulatory risk management approaches that can further reduce the presence of manufactured trans fatty acids in the food supply and reduce dietary intakes of TFA.
2. Support related initiatives aimed at reducing the presence or intakes of trans fatty acids
in the food supply in New Zealand. 3. Monitor the effectiveness of non-regulatory measures in reducing the level of TFA in
the Australia and New Zealand food supply.
4. In early 2009, commence a review of the outcome of non-regulatory measures to reduce TFA in the food supply and assess the need to consider regulatory action commensurate with the ongoing risk posed by TFA intakes, such as additional labelling or compositional requirements. To conduct this review, FSANZ requires information from a food and nutrition monitoring system.

-1-
CONTENTS
1. INTRODUCTION ................................................................................................................ 5 2. THE ISSUE ....................................................................................................................... 6 3. METHODOLOGY............................................................................................................... 7
3.1 Estimation of dietary intake ................................................................................... 7 3.2 Risk assessment .................................................................................................... 11 3.3 Consumer research .............................................................................................. 11 3.4 Industry research .................................................................................................. 11
4. TRANS FATTY ACID: DEFINITION, CHEMISTRY AND TECHNOLOGY .................................. 12 4.1 Chemistry: a short introduction ........................................................................... 12 4.3 Purpose of hydrogenation of edible oils .............................................................. 13 4.4 Sources ................................................................................................................. 13 4.5 Regulatory definition of trans fatty acids ............................................................. 14
5. ESTIMATION OF DIETARY INTAKE OF TFA FOR THE AUSTRALIA AND NEW ZEALAND POPULATIONS ........................................................................................................................ 14
5.1 Estimated dietary intakes of TFA for the Australian population ......................... 14 5.2 Estimated dietary intakes of TFA for the New Zealand population ..................... 14 5.3 TFA intakes that from ‘naturally occurring’ versus ‘manufactured’ sources ..... 15 5.4 Contribution of Take Away foods to TFA intake .................................................. 15 5.5 Contribution of foods that display a label to TFA intake ..................................... 15 5.6 Changes in food consumption patterns since the 1995 Australian National Nutrition Survey ............................................................................................................... 19 5.7 Estimated TFA intakes compared to established reference values ...................... 20 5.8 Estimated TFA intakes compared to the World Health Organisation set nutrient goals 20
6. COMPARISON OF TFA INTAKES FOR AUSTRALIA AND NEW ZEALAND WITH INTERNATIONAL ESTIMATES .................................................................................................. 21 TABLE 1 PERCENT CONTRIBUTIONS OF NATURALLY OCCURRING TFA AND MANUFACTURED TFA FOR DIFFERENT POPULATION GROUPS. ............................................... 22 7. RISK ASSESSMENT ......................................................................................................... 26
7.1 TFA intake and health outcomes .......................................................................... 26 7.2 Scientific reasons for regulatory action in Denmark, USA and Canada ............. 26 7.3 Health effects of ruminant compared to manufactured TFA ................................ 26 7.4 Health effects of TFA compared to saturated fatty acids ..................................... 27 7.5 Potential for reducing TFA intakes in Australia and New Zealand ..................... 27 7.6 Estimates of CHD risk reduction at levels found in the New Zealand and Australian food supply ..................................................................................................... 27
8. REVIEW OF CONSUMER RESEARCH ................................................................................ 28 8.1 Review of consumer research ............................................................................... 28 8.2 Key findings .......................................................................................................... 29
9. CURRENT APPROACHES TO RISK MANAGEMENT ........................................................... 30 9.1 Risk management in Australia and New Zealand: Regulatory measures ............ 30 9.2 FSANZ label monitoring ...................................................................................... 31 9.3 Risk reduction measures ....................................................................................... 33 9.4 Current international risk management strategies .............................................. 38
10. NEW APPROACHES TO RISK MANAGEMENT IN AUSTRALIA AND NEW ZEALAND ........ 41 10.1 Approaches and options ....................................................................................... 41 10.2 Stakeholders that may be affected by changes to the regulatory approach to TFA 42

-2-
11. CONCLUSION AND FUTURE ACTIONS ......................................................................... 43 11.1 Summary of findings ............................................................................................. 43 11.2 Conclusion ............................................................................................................ 46 11.3 Future Actions ...................................................................................................... 47
12. REFERENCES ............................................................................................................. 49
APPENDICES .............................................................................................................................. Appendix 1 Chemistry and Technology ....................................................................... 52 Appendix 2 Dietary Intake Assessment ....................................................................... 63 Appendix 3 Risk Analysis .......................................................................................... 205

-3-
FIGURES FIGURE 1 IN THE CIS CONFIGURATION (RIGHT) CARBON CHAINS ON THE TWO SIDES OF THE DOUBLE BOND
BEND TOWARDS EACH OTHER. IN THE RARER TRANS CONFIGURATION (LEFT), THE CARBON CHAIN IS ALMOST STRAIGHT. .................................................................................................................................................... 12
FIGURE 2 ESTIMATED MEAN DIETARY INTAKES OF TOTAL TFA IN AUSTRALIA AND NEW ZEALAND .......... 16 FIGURE 3 ESTIMATED DIETARY INTAKES: 5% AND 95% PERCENTILE COMPARED TO MEAN. ......................... 16 FIGURE 4 MAJOR CONTRIBUTING FOOD GROUPS TO TOTAL TFA INTAKES FOR DIFFERENT POPULATION
GROUPS: AUSTRALIA. ................................................................................................................................... 17 FIGURE 5 MAJOR CONTRIBUTING FOOD GROUPS TO TOTAL TFA INTAKES FOR DIFFERENT POPULATION
GROUPS: NEW ZEALAND. ............................................................................................................................. 17 FIGURE 6 MAJOR CONTRIBUTING FOOD GROUPS TO TOTAL TFA INTAKES FOR DIFFERENT POPULATION
GROUPS: NEW ZEALAND MAORI AND PACIFIC ISLANDERS. .......................................................................... 18 FIGURE 7 CONTRIBUTION OF TFA INTAKE FROM FOODS CLASSIFIED AS TAKE AWAY FOODS. ....................... 18 FIGURE 8 CONTRIBUTION OF TFA INTAKE FROM FOODS CLASSIFIED AS DISPLAYING A FOOD LABEL. ........... 19 FIGURE 9 COMPARISON OF MEAN DIETARY INTAKES OF ENERGY FROM FATS AS A PERCENTAGE OF THE
AMDR RECOMMENDATION .......................................................................................................................... 23 FIGURE 10 PERCENTAGE TOTAL ENERGY INTAKE PER DAY FROM TFA ............................................................ 23 TABLES TABLE 2A ESTIMATED INTAKES OF TFA IN AUSTRALIA, NEW ZEALAND AND AUSTRALIA: SUMMARY OF
ESTIMATED DIETARY INTAKES OF TFA ......................................................................................................... 24 TABLE 2B ESTIMATED INTAKES OF TFA IN AUSTRALIA, NEW ZEALAND AND AUSTRALIA: DATA SOURCES
FOR ESTIMATES OF TFA INTAKES ................................................................................................................. 25 TABLE 3 RESULTS FROM ONGOING LABEL MONITORING SURVEY FOR 2002-2003 ............................................. 33 TABLE 4 APPROACHES FOR RISK MANAGEMENT ............................................................................................... 41

-4-
ABBREVIATIONS AMDR Acceptable Macronutrient Distribution Range CHD Coronary Heart Disease Codex Codex Alimentarius Commission CoPoNC Code of Practice on Nutrient Claims EU European Union FDA Food and Drug Administration FSANZ Food Standards Australia New Zealand HDL High-Density Lipoprotein LDL Low-Density Lipoprotein MUFA Monounsaturated Fatty Acids NIP Nutrition Information Panel NNS National Nutrition Survey data NRV Nutrient Reference Values PUFA Polyunsaturated Fatty Acids TFA Trans Fatty Acids US United States WHO World Health Organisation

-5-
1. Introduction FSANZ last investigated regulatory measures regarding Trans Fatty Acids (TFA) in Australia and New Zealand in the late 1990s5. FSANZ has reviewed the status of TFA in the Australia and New Zealand food supply and international regulations of TFA for the following reasons: • there is new evidence concerning the potential health effects of TFA; • countries outside Australia and New Zealand have introduced new regulatory measures
governing TFA in the food supply; • current Australian and New Zealand TFA intakes are not well understood and the risks
they may pose are uncertain; • it is some time since TFA levels were evaluated in the Australian and New Zealand
food supply; • there may have been considerable changes in TFA content of foods, and food
consumption itself may have undergone some change. FSANZ may review a food regulatory measure on its own initiative and in such a manner it considers appropriate. After the review, FSANZ may then prepare a proposal for the development of a new food regulatory measure, if this is deemed appropriate. Alternatively, FSANZ may recommend non-regulatory risk management options, or recommend maintaining the status quo. A note about terminology Throughout this report trans fatty acids are abbreviated as ‘TFA’. This term is equivalent to the term ‘trans fat’ commonly used in the popular press and other documents. TFA has been used in preference in this document, except when directly quoting or referring to documents that use the other terminology. When referring to ‘trans’ or ‘cis’ isomers the designations are commonly placed in italics. The report follows this convention, except when directly quoting or referring to documents that do not follow the convention. When referring to naturally occurring sources of TFA the report also uses the term ‘ruminant6 TFA’. Whilst TFA are chemically unsaturated fatty acids, it is thought that physiologically TFA are more akin to saturated fats. Similarly, nutrition recommendations often deal with TFA in conjunction with saturated fatty acid intakes. When the report refers to ‘saturated fatty acids and TFA combined’ this alludes to this approach, even though chemically TFA are unsaturated fatty acids
5 ANZFA 1999, Review of Nutrition Labelling, Full Assessment Report, Proposal P167, April 1999, Appendix II,II. 6 Ruminants are animals with multi-chamber stomachs; the first chamber is called the rumen. Examples are cows, sheep, goats and camels.

-6-
2. The Issue There are concerns about the potential health effects of TFA, particularly those that are derived from partially hydrogenated vegetable oils. There has been a vigorous debate regarding the link between dietary intake of TFA and adverse health outcomes, in light of the evidence that intake of TFA may be connected to known risk factors for coronary heart disease. There is a perception of growing consumer and media interest in this issue. The Australia New Zealand Food Standards Code (the Code) permits voluntary labelling of TFA content. TFA labelling is also required if claims are made in relation to cholesterol, saturated, polyunsaturated or monounsaturated fatty acids or omega fatty acids. The Code does not mandate TFA labelling. FSANZ last reviewed the risk of TFA in the late 1990s and decided not to pursue mandatory TFA labelling based on the relatively low levels of TFA occurring in Australia and the relative risk. It has been suggested that Australia and New Zealand should bring in regulatory measures similar to those recently introduced in Canada, the USA, and some European countries. TFA intakes vary widely across countries, and there are no recently published reliable estimates of total TFA intake in Australia or New Zealand. Previous estimates suggested that Australian and New Zealand intake of TFA was low compared to other countries. There have been considerable changes in TFA content of foods, and food consumption itself has almost certainly undergone some change. Consequently, the current TFA intake in Australia and New Zealand is far from clear. Any regulatory measures appropriate for Australia and New Zealand need to take account of the food composition and dietary intakes in both countries, and cannot rely on the approach taken in other countries. Nutrient compositions of Australian and New Zealand food products differ from those in North America and Europe. For example, it has been reported that Canada had amongst the highest TFA intakes in the world7 and responded to this by becoming the first country to introduce mandatory labelling of TFA8. To determine appropriate risk management measures, TFA intake must be considered carefully. In addition, the sources of TFA in the food supply must also be taken into account. As discussed below, TFA in the food supply may come from natural or manufactured sources, and the relative contribution of these sources must be taken into account when developing risk management strategies. Similarly, estimates of the contribution of take-away foods to TFA intake could inform what type of regulatory or non-regulatory measures might be most effective in managing the risk of TFA in the food supply. Finally, some foods consumed by Australian and New Zealanders are currently not labelled, and an understanding of their contribution to TFA intake could be important to assess if risk mitigation measures are warranted.
7 In 1995 Ratnayake and Chen estimated that the average TFA intake (as 18:1 trans) of Canadians as 8.4 g/day per person. The estimates ranged from 5.2 g/day for elderly women to 12.5 g/day for young men. These estimates were determined on the basis of fat and calories intakes reported in the 1990 Nova Scotia Dietary Survey along with the assumption that TFA were 10.4% of the total dietary fat. Even more extreme ranges in TFA intake were reported by Innis et al (1999), who calculated values of 1.4 to 25.4 g/person/day. 8 Health Canada TRANSforming the Food Supply, Report of the Trans Fat Task Force, Submitted to the Minister of Health June 2006. http://www.hc-sc.gc.ca/fn-an/nutrition/gras-trans-fats/tf-ge/tf-gt_rep-rap_e.html

-7-
3. Methodology 3.1 Estimation of dietary intake Dietary exposure to food chemicals from the diet is estimated as part of the risk assessment process, using data derived from records of what foods people have eaten and how much of the food chemical is in each food. The accuracy of these exposure estimates depends on the quality of the data used. Sometimes, not all of the data required are available or there is uncertainty about their accuracy so assumptions are made, either about the foods eaten or about chemical levels, based on previous knowledge and experience. The estimates are determined according to international conventions for food chemical dietary exposure estimates. 3.1.1 Dietary modelling approach for consideration of the dietary intake of TFA The dietary intake assessment was conducted using dietary modelling techniques that combine food consumption data with food chemical concentration data to estimate the intake of the food chemical from the diet. The dietary intake assessment was conducted using FSANZ’s dietary modelling computer program, DIAMOND. The intake was estimated by combining usual patterns of food consumption, as derived from national nutrition survey data, with recently determined concentrations of TFA in food. 3.1.2 Dietary survey data DIAMOND contains dietary survey data for Australia and New Zealand; the 1995 national nutrition survey data (NNS) from Australia which surveyed 13,858 people aged 2 years and above, and the 1997 New Zealand NNS that surveyed 4,636 people aged 15 years and above. Both of these surveys used a 24-hour food recall methodology. A second 24-hour recall was also conducted on a subset of respondents from each NNS for a non-consecutive day. Standard methodologies were used to estimate the intake based on consumption data from the first 24 hour recall (day one), which were then adjusted to estimate ‘usual intake’ by using consumption information from the second 24 hour recall (day two).
-8-
Adjusted nutrient intakes were calculated because they better reflect ‘usual’ daily nutrient intakes and because reference health standards such as the Nutrient Reference Values (NRVs) are based on usual or long term intakes and it is therefore more appropriate to compare adjusted or ‘usual’ nutrient intakes with NRVs. For more information on the second day adjusted nutrient intake methodology, refer to Appendix 2. It is recognised that these survey data have some limitations. For a complete list of limitations, see Appendix 2, Section 5. 3.1.2 Additional food consumption data or other relevant data The dietary intake estimates for this assessment were based on currently available data. However, it should be noted that the availability of more comprehensive analytical data on the TFA concentrations in a wider range of foods would improve the accuracy of intake estimates in the future. 3.1.3 Population groups assessed The dietary intake assessment was conducted for both the Australian and New Zealand populations. An assessment was conducted for the Australian population aged 2 years and above, as well as for the age groups 2 to 4 years, 5 to 12 years, 13 to 19 years, 20 to 44 years, and 45 years and over. An assessment was conducted for the New Zealand population aged 15 years and above, as well as for the age groups 15–19 years, 20-44 years, and 45 years and above. A dietary intake assessment was also conducted for New Zealand Maori and Pacific Islanders as a separate group, using the same age groups that were used for the NZ population as a whole. It is important to note that the New Zealand population assessments also include the Maori and Pacific Islanders that were also assessed separately. A dietary intake assessment was conducted for the population aged 2 years and above for Australia and 15 years and above for New Zealand as a proxy for lifetime intake. The population sub-group considered to be at greatest risk of cardiovascular disease from TFA was identified as those aged 45 years and over and therefore, results for this age group are presented separately to the population estimates. A dietary intake assessment was also conducted for younger age groups (2 to 4 years, 5 to 12 years, 13 to 19 years and 20 to 44 years) to obtain dietary intake estimates of TFA for comparative purposes. 3.1.4 TFA concentration levels The concentration data for Australia were derived from laboratory analyses conducted by the New South Wales Food Authority (NSWFA) in 2005 (see link below), South Australia Health in 2006 and by FSANZ between 2001 and 2006. The concentration data for New Zealand were from laboratory analyses conducted by the Institute of Environmental Science and Research Limited (ESR) in 2006 and Crop and Food Research from 2002. While the NSW Food Authority data provided information on concentrations of individual TFA, the FSANZ data did not. Therefore, estimated intakes were only calculated for total TFA. A summary of the analytical methods, the foods analysed and the range of concentrations of total TFA determined in each analytical study are shown in Appendix 2.

-9-
Both the Australian and New Zealand datasets were developed using data from foods analysed by gas chromatography. Identification and quantification of individual fatty acids relies on the availability of confirmatory standards. It may be hampered by the presence of closely related cis fatty acids9, which are generally present in much larger quantities than TFA. Therefore, not all fatty acids may be identified in the analysis, particularly fatty acids that occur at very low levels, or are obscured by very similar fatty acids that are more abundant. Concentrations used in the dietary modelling were means of analysis of up to five single samples or were a single value derived from analysis of a composite sample. The NSW study indicated there could be considerable variation in TFA concentrations between different samples of similar foods. In the case of beef and lamb, the NSW study only provided data for raw meats; the values for raw meats were used to represent cooked meats as well. The foods and concentrations of TFA used in the dietary intake assessment (which were derived from the studies described above) are shown in Appendix 2. Due to the limited number of analytical data, individual TFA levels could not be assigned to each food reported in the NNS. Concentrations of TFA found on analysis were therefore assigned to groups of related foods. Individual foods from the NNS data were matched to the most appropriate food group for dietary modelling purposes. 3.1.5 How were the estimated dietary intakes calculated? A detailed explanation of how the estimated dietary intakes are calculated can be found in Appendix 2. 3.1.6 Assumptions in the dietary modelling The aim of the dietary intake assessment was to make as realistic an estimate of dietary intake as possible. However, where significant uncertainties in the data existed, conservative assumptions were generally used to ensure that the dietary intake assessment did not underestimate intake. Assumptions made in the dietary modelling include: • Where a concentration is assigned to a food group, all foods in that group contain trans
fats at the levels specified in Appendix 2, Table A2.1; • TFA concentrations have not changed since the time of analysis; • consumption of foods as recorded in the NNS represent current food consumption
patterns; • where a food was not included in the intake assessment, it was assumed to contain a
zero concentration of TFA; • where a food has a specified TFA concentration, this concentration is carried over to
mixed foods where the food has been used as an ingredient e.g. raw beef mince as an ingredient in ’beef mince curry with rice’;
9 In the NSW study, four TFA were quantified: C16:1 ( 6t ) , C18:1 ( 9t ) (elaidic acid), C18:2 (9t,12t) and C18:3 (9t,12t,15t)

-10-
• all mixed foods with recipes in DIAMOND were assumed to be prepared in the home (and not produced commercially). Therefore, if a recipe uses an ingredient that contains TFA, the quantity of TFA from the ingredient will carry-over into the mixed food; there are no changes in TFA concentrations from food preparation or due to cooking; and
• for the purpose of this assessment, it is assumed that 1 millilitre is equal to 1 gram for all liquid and semi-liquid foods (e.g. milk, yoghurt).
3.1.7 Foods contributing to TFA intakes An assessment was conducted to estimate the relative percentage contribution of several categories of food to total TFA intakes. The purpose of the assessment was to assist in developing risk management strategies. Naturally occurring compared to manufactured sources The estimated proportion of TFA intake arising from naturally occurring sources (e.g. from butter, milk and meat) was compared to estimates of manufactured sources (e.g. table spreads, baked goods). Some foods contained a mixture of these two sources and these were classified as such. Proportion of TFA intake that comes from ‘take away’ foods Another assessment was carried out to determine the proportion of TFA intake from ‘take away’ foods, as there is a perception that these types of foods are a major source of TFA in the diet. Some foods were difficult to classify as either ‘take away’ or not. For example, hot chips are commonly purchased from a quick service restaurant. However, they can also be purchased frozen and oven baked and prepared at home. Therefore, a range of contribution was determined based on a lower bound (or best case, where foods that could be either take away or not were classified as not take away) and an upper bound (or worst case where foods that could be either take away or not were classified as take away foods). Proportion of TFA intakes that comes from foods with a label The proportion of TFA intake arising from foods carrying a label was estimated. This assisted in determining the proportion of TFA intake that can be affected by labelling. A number of foods can be purchased with or without a label. For example, bread purchased in a supermarket with a plastic wrapper is required to carry a label, compared to bread bought in a bakery, where it may not have a label or nutrition information panel. As with take-away foods, a range of contributions was determined based on a lower bound (or best case, where foods that could be either labelled or not were assumed to be not labelled) and an upper bound (or worst case where foods that could be either labelled or not were assumed to be labelled). See Appendix 2 for further details on how these assessments were conducted.

-11-
3.2 Risk assessment The risk assessment undertaken by this review followed the methodology that underpins the majority of FSANZ’s regulatory decision-making. The risk assessment component of risk analysis is a tool that facilitates FSANZ’s science-based approach to decision making, and is critical to the integrity and rigour of those decisions. FSANZ draws on the key elements of risk assessment adopted by Codex10 The risk assessment of the dietary intake of TFA for the Australian and New Zealand populations was undertaken based on FSANZ estimated dietary intakes and a review of the scientific literature. There are limitations to the methods used to determine dietary TFA intakes in Australia and New Zealand, and these are discussed above (Section 3.1). 3.3 Consumer research Consumer research is an important part of developing appropriate approaches to risk management and to fulfil the FSANZ objective regarding the provision of adequate information to enable consumers to make informed choices. FSANZ assessment of consumer information requirements or behaviour may be based on research published in the literature and, where it is considered appropriate, on original research commissioned or undertaken by FSANZ. In the case of this report, a search of existing literature was undertaken to gain a basic understanding of consumer information requirements for foods containing TFA and the likely effectiveness of labelling of TFA as a risk management measure. This review also draws on FSANZ own consumer research on labelling. 3.4 Industry research As part of this review, FSANZ carried out some initial targeted consultation with the food industry. The aim was to gain an overview of the current industry approach to TFA in the food supply including the level of awareness of the TFA issue, whether industries have initiatives in place to reduce TFA in foods, and if they have plans to reduce TFA in their products in the future. The Australian Food and Grocery Council, the New Zealand Food and Grocery Council, and a sample of 10 key stakeholders provided qualitative information to FSANZ. Industries consulted included manufacturers and suppliers of commercial fats and oils in New Zealand and Australia, producers of retail products and products for the catering or food service industry, and a fast food company. The National Heart Foundation in Australia and New Zealand also provided information regarding the food industry Pick the Tick programme.
10 Joint FAO/WHO Food Standards Programme, Codex Alimentarius Commission, Procedural Manual, 13th edition. Section 1, Working Principles for Risk Analysis for Application in the Framework of the Codex Alimentarius

-12-
4. Trans fatty acid: Definition, chemistry and technology 4.1 Chemistry: a short introduction Fatty acids can be classified according to the number of double bonds. Saturated fatty acids (SFA) have no double bonds, monounsaturated fatty acids (MUFA) have one double bond, and polyunsaturated fatty acids (PUFA) have two or more double bonds. Commonly, the unsaturated fatty acids that occur naturally in food have double bonds in a cis configuration: the carbon chains on the two sides of the double bond bend towards each other and the hydrogen atoms on the double bond are located on the same side. In the rarer trans configuration, the hydrogen atoms on the double bond are opposite each other, rather than oriented in the same direction; consequently the carbon chain is almost straight (Figure 1). This accounts for the different chemical and physical properties of trans and cis fatty acids, and consequently the properties of the fat, which may also result in a difference in the biological activity of these fatty acids. The chemical characteristics of unsaturated fatty acids are also partially determined by the position of the double bond in the molecules. Double bonds may be isolated (separated within the carbon chain), conjugated (separated by one single bond), or methylene-interrupted (separated by a CH2 unit). The location of the double bonds is important to the outcome of manufacturing processes, such as hydrogenation. Conjugated linoleic acid (CLA) is a collective term for a mixture of isomers of linoleic acid. A variety of isomers with trans configuration have been described in the literature. Chemically these isomers are TFA, and would be classified as such in the Code. However, regulatory definitions of TFA in some other countries specifically exclude CLA. It is increasingly evident that different CLA isomers have distinct properties. The chemistry of TFA is discussed in more detail in Appendix 1. Figure 1 In the cis configuration (right) carbon chains on the two sides of the double bond bend towards each other. In the rarer trans configuration (left), the carbon chain is almost straight. Source: University of Massachusetts

-13-
4.3 Purpose of hydrogenation of edible oils The supply of semi-solid or solid edible oils is determined by price, seasonal availability, animal or vegetable source requirements, and market demand for specific oils. There is great demand for such oils, and to meet this demand a process based on the hydrogenation of liquid edible oils has been in use by the food industry since the early 20th century. It is estimated that worldwide in excess of 4 million tonnes of nutritional edible oils per year are produced by hydrogenation. Hydrogenation of edible oils involves the addition of hydrogen to double bonds in the chains of fatty acids. By controlling reaction conditions, the processor can make end-products with greatly varied chemical and physical characteristics. The process is of major importance since it accomplishes two main objectives:
• It allows the conversion of liquid oils into semi solid or solid oils more suitable for specific applications, such as in shortenings and margarine. Many of the cooking oils and margarines available today contain a proportion of hardened edible oil blended with liquid oil.
• It improves the stability of the oil. The word ‘rancid’ refers to off-flavours resulting
from oil oxidation. Hydrogenated oil has a reduced tendency to develop rancidity. Many raw oils, such as fish oils and soybean oils are liable to deterioration.
The hydrogenation of edible oils is further discussed in Appendix 1. 4.4 Sources Dietary TFA come from two primary sources: • manufactured TFA – principally arise from partial hydrogenation of edible oils
containing unsaturated fatty acids and may also be formed as a consequence of oil deodorisation and exposure of oil to very high temperatures
• ruminant TFA – arise from bacterial transformation of unsaturated fatty acids in the rumen of ruminants.
Significant sources of human intake of TFA therefore are foods containing manufactured TFA, and beef, mutton, lamb and dairy fat. Sources of partially hydrogenated edible oils in the diet include fried foods, margarines, shortenings, and their products – biscuits and baked goods. TFA from both sources are formed by a process of partial hydrogenation; one achieved by microbial activity, the other by a manufacturing process. The molecules are indistinguishable from each other and current analytical techniques cannot reliably distinguish between ruminant and manufactured TFA. However, there are differences in the relative abundance of individual TFA in ruminant and manufactured TFA. Appendix 1 further discusses the sources of TFA and the differences between manufactured and ruminant TFA.

-14-
4.5 Regulatory definition of trans fatty acids The Code defines TFA as follows: trans fatty acids means the total number of unsaturated fatty acids where one or more of the double bonds are in the trans configuration and declared as trans fat The Australian and New Zealand approach closely follows the chemical definition of trans configuration in fatty acids, and includes all types of TFA, including ruminant TFA. However, the chemical definition of TFA differs from the regulatory definition used by some countries. Many regulatory definitions, while not specifically excluding ruminant TFA, exclude fatty acids with conjugated bonds11 from the definition of TFA, even though these acids have double bonds in trans configuration. These definitions stem from the view that regulatory definitions adequately identify the fatty acids targeted by the regulation (see Appendix 1). 5. Estimation of dietary intake of TFA for the Australia and New
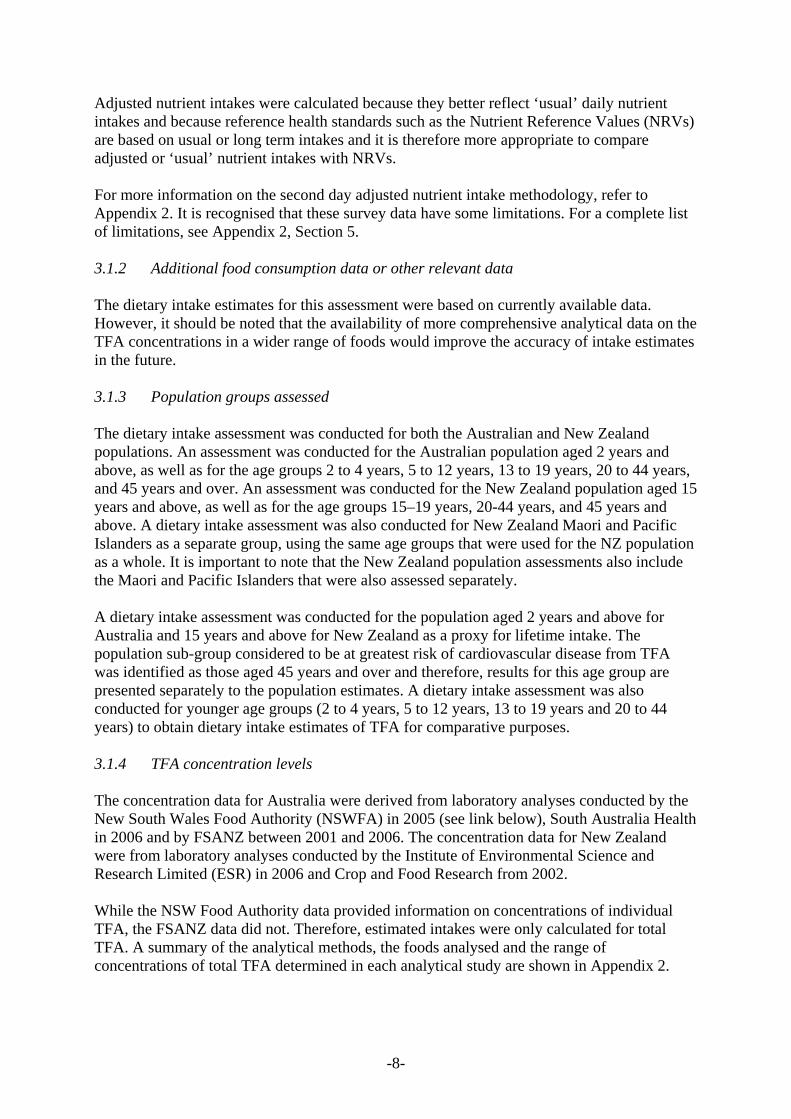
Zealand populations An estimation of the dietary intake of TFA for the Australian and New Zealand populations was derived from recently available concentration data for TFA in foods and dietary intake patterns. A detailed report on the dietary intake can be found in Appendix 2. Data sources and methodology have been discussed above. 5.1 Estimated dietary intakes of TFA for the Australian population Estimated dietary intakes of TFA for the Australian population ranged between 1.2 and 1.6 g/day at the mean level of intake (Figure 2). At the 5th percentile level intakes ranged from between 0.5 and 0.6 g/day and at the 95th percentile intakes were still relatively low between 2.0 and 3.2 g/day (Figure 3). These estimated TFA intakes were comparable or lower than those reported overseas (see below). Major contributors to the intake of TFA for Australia were dairy products (26-44%), pastry and pastry based mixed foods (8-17%), fats and oils (8-18%), meat & poultry (9-15%), cereal and cereal products (10-13%) and cereal based mixed foods (6-12%) depending on the population group assessed (Figure 4). 5.2 Estimated dietary intakes of TFA for the New Zealand population Estimated dietary intakes of TFA for New Zealanders ranged between 1.6 and 2.0 g/day at the mean level of intake (Figure 2). At the 5th percentile level intakes ranged from between 0.9 and 1.0 g/day and at the 95th percentile intakes, like the Australian intakes, were still comparatively low between 2.6 and 3.1 g/day (Figure 3). Estimated dietary intakes of TFA for New Zealand Maori and Pacific Islanders were very similar to those for the NZ population as a whole, ranging from 1.6 to 2.1 g/day at the mean level of intake and between 0.7 and 1.1 g/day at the 5th percentile level of intake and between 2.8 and 3.1 g/day at the 95th percentile level of intake (Figures 2 and 3).
11 Conjugated: separated by one single bond. See Appendix 1

-15-
Major contributors to the intake of TFA for New Zealand were fats & oils (30-44%), dairy products (19-21%), cereal & cereal based products (9-10%), pastry and pastry based mixed foods (8-11%) and meat & poultry (8-10%) (Figure 5). Major contributors to the intake of TFA for New Zealand Maori and Pacific Islanders were similar to those for the New Zealand population as a whole, fats & oils (31-44%), dairy products (18-19%), meat & poultry (8-13%), cereal & cereal based products (8-11%) and pastry and pastry based mixed foods (6-10%) depending on the population group assessed (Figure 6). These findings suggest that New Zealanders, compared to Australians, have higher intakes of TFA originating from fats and oils, in particular from oil-based spreads. Differences between the TFA content of Australian and New Zealand spreads may in part reflect the age of some of the New Zealand data. Half the New Zealand values were generated in 2002, which may pre-date moves by New Zealand spread manufacturers to reduce TFA levels. In addition, the NZ samples appeared to be primarily lower cost products, which may be less likely to have reduced TFA levels. NZ samples did not include some Australian spreads sold in NZ that were found to have low TFA levels. 5.3 TFA intakes that from ‘naturally occurring’ versus ‘manufactured’ sources The proportion of TFA intakes that came from naturally occurring versus manufactured sources was also estimated (Table 1). Some mixed foods were assumed to contain TFA from both sources. The heterogeneity of sources of the concentration data should be taken into consideration when making comparisons between Australia and New Zealand sources of TFA. For the Australian population 2 years and above the percent contributions from naturally occurring, manufactured and mixed sources were 60%, 24% and 16% respectively (Table 1a). For the New Zealand population 15 years and above the percent contribution from naturally occurring, manufactured and mixed sources were 41%, 46% and 13% respectively (Table 1b) and for New Zealand Maori and Pacific Islander population 15 years and above were 42%, 45% and 13% respectively (Table 1c). 5.4 Contribution of Take Away foods to TFA intake For the Australian population aged 2 years and above, between 8-24% of TFA intake came from Take Away foods (Figure 7). The population group 13-19 years in Australia had the highest proportion of TFA coming from Take Away foods being 13-32%. For the New Zealand population 15 years and above Take Away foods were the source of 3-16% of TFA intake and for the New Zealand Maori and Pacific Islanders between 4-18% (Figure 7). 5.5 Contribution of foods that display a label to TFA intake For the Australian population aged 2 years and above, between 46-84% of TFA intake came from foods that display a food label (Figure 8). In New Zealand (15 years and above) the intake of TFA from foods containing a food label was between 63-90%, and in the New Zealand Maori and Pacific Islanders population at between 61-86% (Figure 8).
-16-
Figure 2 Estimated Mean Dietary Intakes of Total TFA in Australia and New Zealand
1.4
1.71.8
0.0
0.5
1.0
1.5
2.0
2 years & above 15 years & above 15 years & above
Whole Population Whole Population Maori and Pacific Islanders
Australia New Zealand New Zealand
Mea
n TF
A in
take
g/d
ay
Figure 3 Estimated Dietary Intakes: 5% and 95% percentile compared to mean. Population groups are 2 years and above for Australia and 15 years and above for the whole New Zealand population and for New Zealand Maori and Pacific Islanders
0.0
0.5
1.0
1.5
2.0
2.5
3.0
TFA
inta
ke g
/day
5th Percentile 0.6 0.9 0.8Mean 1.4 1.7 1.895th Percentile 2.7 2.9 2.9
Australia New Zealand Maori and Pacific Islanders

-17-
Figure 4 Major contributing food groups to total TFA intakes for different population groups: Australia. The percent contribution of each food group is based on total TFA intakes for all consumers in the population groups assessed. Therefore, the total TFA intakes differ for each population group.
Snack foods1%
Dairy products29%
Fats and oils13%
Pastry & pastrybased mixed foods14%
Cereal and cereal products11%
Cereal based mixed foods9%
Vegetables7%
Meat and poultry13%
Other3%
AUSTRALIA
Figure 5 Major contributing food groups to total TFA intakes for different population groups: New Zealand. The percent contribution of each food group is based on total TFA intakes for all consumers in the population groups assessed. Therefore, the total TFA intakes differ for each population group. Other
3%
Meat and poultry9%
Vegetables2%
Cereal based mixed foods3%
Cereal and cereal products10%
Pastry & pastrybased mixed foods10%
Fats and oils38%
Dairy products20%
Confectionery3%
Snack foods2%
NEW ZEALAND

-18-
Figure 6 Major contributing food groups to total TFA intakes for different population groups: New Zealand Maori and Pacific Islanders. The percent contribution of each food group is based on total TFA intakes for all consumers in the population groups assessed. Therefore, the total TFA intakes differ for each population group.
Snack foods4%
Confectionery3%
Dairy products19%
Fats and oils37%
Pastry & pastrybased mixed foods9%
Cereal and cereal products9% Cereal based mixed
foods3%
Vegetables2%
Meat and poultry11%
Other3%
NEW ZEALANDMaori & Pacific Islanders
Figure 7 Contribution of TFA intake from foods classified as Take Away foods. Lower Bound (or best case) and Upper Bound (or worst case) estimates of contribution to TFA intakes was determined to account for the great variation of products and sources of these products.
828476969792
18162448 3
0
20
40
60
80
100
Australia New Zealand New Zealand Australia New Zealand New Zealand
Wholepopulation
Wholepopulation
Maori andPacific Islanders
Wholepopulation
Wholepopulation
Maori andPacific Islanders
% c
ontri
butio
n to
TFA
inta
ke
other food classified as 'take away'
Lower Bound Upper Boundclassified as 'take away'other food

-19-
Figure 8 Contribution of TFA intake from foods classified as displaying a Food Label. Lower Bound (or best case) and Upper Bound (or worst case) estimates of contribution to TFA intakes was determined to account for the great variation of products and sources of these products.
1410163937
54
86908461
46
63
0
20
40
60
80
100
Australia New Zealand New Zealand Australia New Zealand New Zealand
Wholepopulation
Wholepopulation
Maori andPacific Islanders
Wholepopulation
Wholepopulation
Maori andPacific Islanders
% c
ontri
butio
n to
TFA
inta
ke
other food classified as 'labelled'
Lower Bound Upper Boundclassified as 'labelled'other food
5.6 Changes in food consumption patterns since the 1995 Australian National
Nutrition Survey In order to determine whether food consumption patterns have changed markedly since the NNS data were collected and therefore, whether the trans fatty acid intakes based on the NNS data are reliable, the proportion of people reporting consumption of major food contributors to TFA intakes in the NNS were compared with up to date data from the Roy Morgan Single Source Survey for 2001-2006. Data were not available on all relevant foods and results are not directly comparable due to different survey methods, but for two major contributors, spreads and milk, the proportion of people consuming these products appears to have remained the same from 1995 to 2006. However, within the milk category, the Single Source Survey data indicate a trend to decreasing consumption of full fat milk and increasing consumption of low or no fat milk, which may result in decreasing TFA intake from natural sources that was not captured in the dietary intake estimate. For foods such as cheese, although proportions of all age groups who reported consuming cheese in the NNS 24-hour recall were lower than that in the more recent Single Source Survey, the proportion consuming on a weekly basis reported in the NNS food frequency surveys were very similar, again indicating little change from 1995 to 2006.
-20-
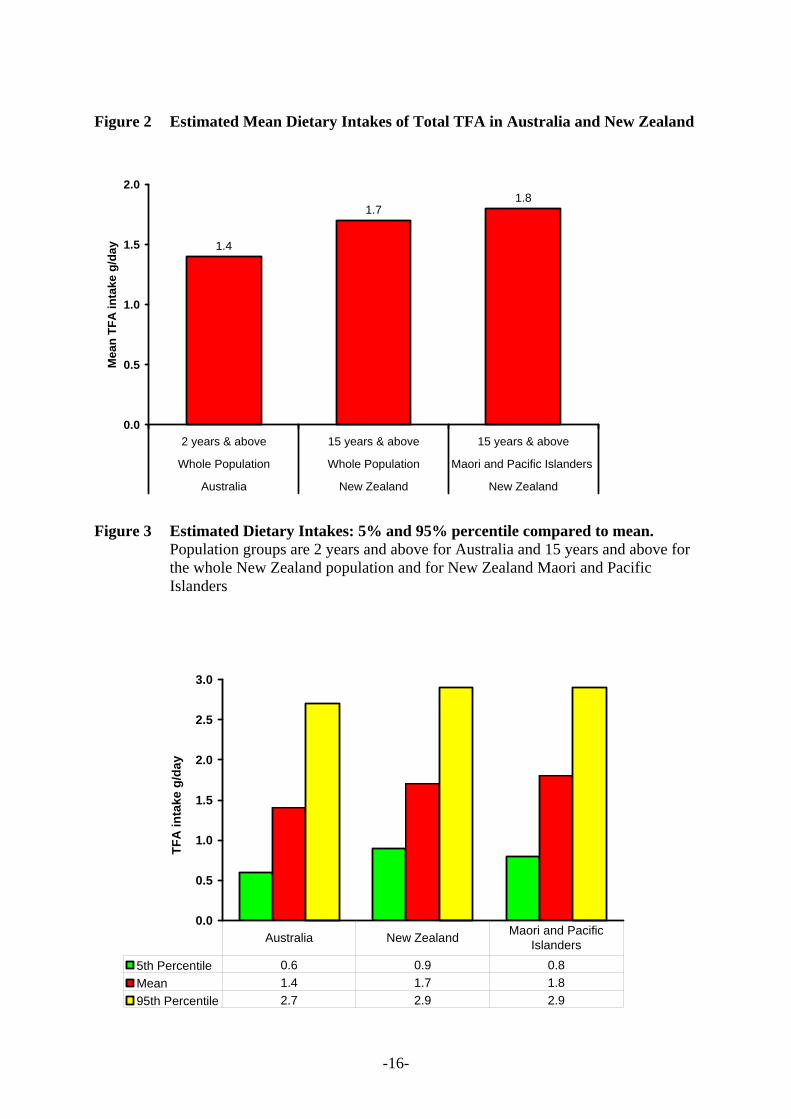
For foods such as yoghurt and potato crisps, where the proportion reporting consumption of these foods was much higher in the more recent Single Source Survey, it is not possible to determine if this is only because they are occasionally consumed and therefore not captured accurately in the 1995 NNS survey, or if food patterns have actually changed in the last ten years. However, as these foods were minor contributors to total TFA intakes, any change may not influence the results a great deal. Unfortunately, there are no comparable data for take away foods. 5.7 Estimated TFA intakes compared to established reference values Estimated TFA intakes were compared to a reference health standard in order to determine whether intakes are likely to be a concern to public health and safety. In 2006 Nutrient Reference Values (NRVs) were established for fats in the Australian and New Zealand diets12, in the form of an Acceptable Macronutrient Distribution Range (AMDR)13 such that total fats should contribute between 20-35% of total energy intake, and saturated fatty acids and TFA combined should comprise 8-10% of total daily energy intake14. The percentage of total energy intakes from saturated fatty acids and TFA combined15 was estimated to be approximately one and a half times the relevant reference health standard (130-170% AMDR, 13-17% of energy intake). Even if all TFA were removed from the diets, intake of saturated fats would still exceed the AMDR (Figure 9). 5.8 Estimated TFA intakes compared to the World Health Organisation set
nutrient goals In 2003 the World Health Organisation (WHO) set nutrient goals, including one specifically for TFA recommending that TFA contribute less than 1% total daily energy intake. The contributions of TFA intakes to total energy intakes for the Australian population 2 years and above and the New Zealand population 15 years and above were 0.6% total energy intakes and 0.7% total energy intakes respectively, and were therefore below the WHO nutrient goal. These estimates were comparable to, or lower than reported TFA contribution to total energy intakes estimates from other countries.
12 NHMRC 2005. Nutrient Reference Values for Australia and New Zealand. Including Recommended Dietary Intakes. http://www.moh.govt.nz/moh.nsf/pagesmh/4678/$File/nrv-including-rec-dietary-intakes.pdf 13 AMDR: Acceptable Macronutrient Distribution Range is an estimate of the range of intakes for each macronutrient for individuals (expressed as per cent contribution to energy), which would allow for an adequate intake of all the other nutrients whilst maximising general health outcome 14 Nutrient reference Values for Australia and New Zealand. Including Recommended Dietary Intakes., p.263 15 Whilst chemically unsaturated fatty acids, physiologically TFA are thought to be akin to saturated fats and this is reflected in dietary recommendations.
-21-
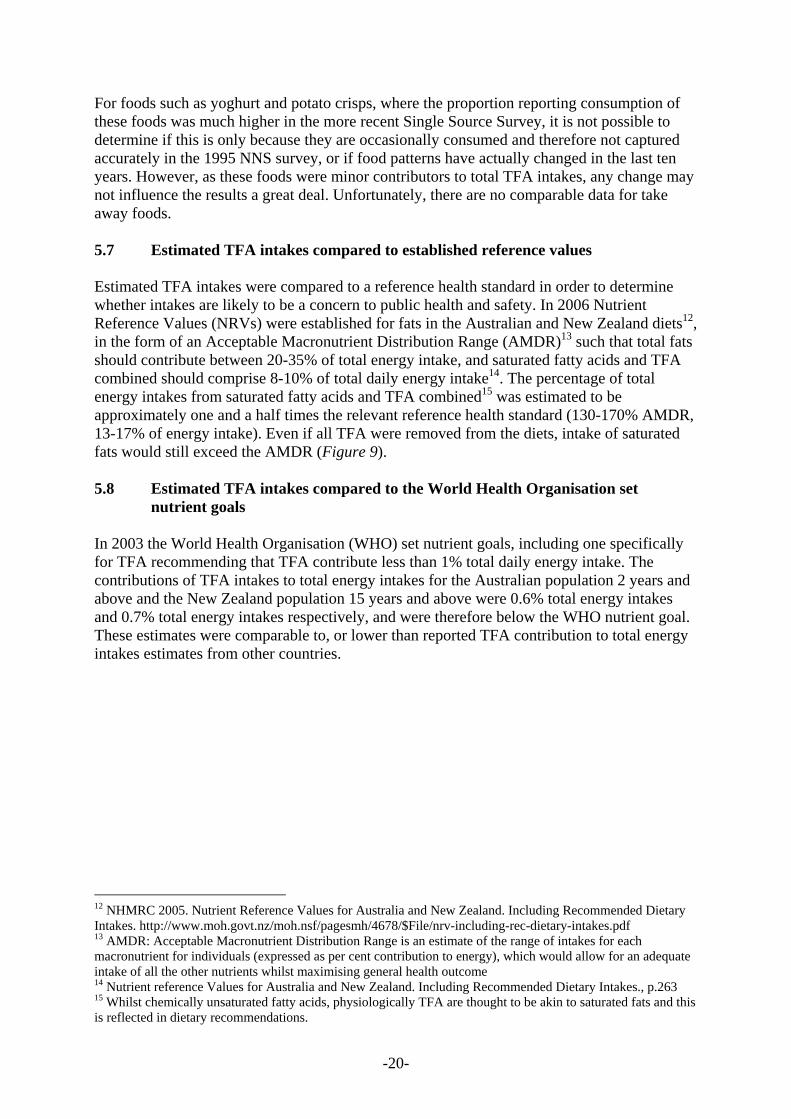
6. Comparison of TFA intakes for Australia and New Zealand with international estimates
The estimated dietary intakes of TFA were compared to those reported for other countries. The estimated dietary intakes of TFA, as compared to international estimates are shown in Table 2a and are compared to the WHO TFA nutrient goal in Figure 10. Details of the data sources are given in Table 2b. The above comparison should be interpreted with caution as different studies may have included different TFA, used different analytical methods and different approaches to estimating intakes. While these estimates may not be directly comparable, it appears that TFA intakes as estimated by FSANZ in Australia and New Zealand are similar to, or less than, intakes in other countries. Intakes estimated by FSANZ for New Zealand are lower than previous estimates. This could be attributed to the different methodologies used, different foods included and possibly different composition of foods between 1996 and 2006.

-22-
Table 1 Percent contributions of naturally occurring TFA and manufactured TFA for different population groups.
Classification of foods into the three groups was based on the major ingredients, noting that the predominant source of naturally occurring TFA is foods derived from ruminant (cattle or sheep) sources, including dairy products. a. Australia % contribution to TFA intakes 2yrs & above 45yrs & above 20-44yrs 13-19yrs 5-12yrs 2-4yrsFoods containing naturally occurring TFA only
60 63 59 55 58 67
Foods containing manufactured TFA only
24 21 24 27 29 23
Foods containing both naturally occurring TFA and manufactured TFA
16 16 18 18 13 10
b. New Zealand % contribution to TFA intakes 15 yrs & above 45 yrs & above 20-44 yrs 15-19 yrsFoods containing naturally occurring TFA only 41 40 43 41 Foods containing manufactured TFA only 46 48 44 45 Foods containing both naturally occurring TFA and manufactured TFA 13 12 14 13c. New Zealand Maori and Pacific Islanders % contribution to TFA intakes 15 yrs & above 45 yrs & above 20-44 yrs 15-19 yrs Foods containing naturally occurring TFA only 42 46 41 41 Foods containing manufactured TFA only 45 43 46 46 Foods containing both naturally occurring TFA and manufactured TFA 13 10 13 13

-23-
Figure 9 Comparison of mean dietary intakes of energy from fats as a percentage of the AMDR recommendation
15.315.3
13.4
0.70.7
0.6
6
8
10
12
14
16
18
2 years & above 15 years & above 15 years & above
Whole Population Whole Population Maori and Pacific Islanders
Australia New Zealand New Zealand
% E
nerg
y In
take
Mean SFA Mean TFA
AMDR
Total: 14%
Total: 16% Total: 16%
Figure 10 Percentage total energy intake per day from TFA
% of daily energy intake from trans fats
0.60.7
1.0
0.9
2.6
2.2
0.0
0.5
1.0
1.5
2.0
2.5
3.0
Australia(2006)
New Zealand(2006)
Europe(2000) Denmark(2003)
Canada (2005) U.S (2006)
% d
aily
ene
rgy
inta
ke
WHO recommended nutrient goal

-24-
Table 2a Estimated intakes of TFA in Australia, New Zealand and Australia: Summary of estimated dietary intakes of TFA Australia
(FSANZ) 2006
NZ (FSANZ)
2006
NZ
1996
Denmark
2003
USA
1997-2006
Europe
2000
Canada
1995-2005
Number of studies
1 1 1 1 3 2 4
Mean TFA intake range (g/day)
1 - 2
2 4 3 1 - 13 1 - 3 1 - 25
% total energy intake per day
0.6 0.7 1.5 1 2.6 1 - 2 2.2

-25-
Table 2b Estimated intakes of TFA in Australia, New Zealand and Australia: Data sources for estimates of TFA intakes Country Mean dietary intake % of energy/fat Comments Reference
Australia 1.2 to 1.6 g/day 0.6% of total energy intake*
(Food Standards Australia New Zealand, 2006b)
Canada 8.4 g/day
Estimates were determined on the basis of fat and calories intakes reported in the 1990 Nova Scotia Dietary Survey along with the assumption that trans fatty acids were 10.4% of the total dietary fat. Estimates ranged from 5.2 g/day for elderly women to 12.5 g/d for young men
(Ratnayake and Chen 1995)
1.4 to 25.4 g/day (Innis et al 1999)
3.8 to 3.4 g/day
Cross-sectional prospective study of healthy, pregnant women in Vancouver, Canada, values for trans fat intake that were somewhat less than the previous estimates for the Canadian diet. Values of 3.8 and 3.4 g/d person were reported for women in the first semester and third semester, respectively.
(Elias and Innis 2002)
4.9 g/day 2.2% energy intake/day*
From dietary intake data from nutrition surveys conducted in Ontario, Manitoba, British Columbia and Quebec. Values for various age groups and sexes are given in the Task Force Report
(Health Canada 2005)
Denmark 2.6 g/day 1.0% energy intake/day*
National food consumption data matched with laboratory analysis of major foods. Males and females, 19-64 years (approximately half from ruminant fat)
(Stender and Dyerberg, 2003a)
Europe 2.0 to2.4g/day 0.9% of total energy intake*
Cross-sectional study in eight European countries, involving 327 men and 299 women aged 50-65 years, 2.4g/day males, 1.98g/day females.
(van de Vijver et al., 2000)
New Zealand 2.5 to 41 g/day 1.4-1.5% of total
energy intake
Sources of fat in New Zealand diet were identified from published Life in New Zealand (LINZ) tables (Horwath, 1991) and from LINZ survey (Wilson et al., 1995). 4.1 g/day males, 2.5 g/day females
(Lake and Thomson, 1996)
1.6 to 2.0 g/day 0.7% of total energy intake*
(Food Standards Australia New Zealand, 2006a)
USA 5.8 g/day 2.6% energy intake/day* All population 20 yrs+ (American Heart
Association, 2006)
2.6 g/day to 12.8 g/day High intake estimates based on food disappearance statistics and therefore less robust than other estimates
(Lichtenstein, 1997)
1.8- 2.2 g/day males 5% of total fat intake
A 1996 study involving 27 females and 24 men aged 51-78 years, determined using a food frequency questionnaire
(Lemaitre et al., 1998)
*% daily energy intake from TFA used to compare to WHO TFA goal

-26-
7. Risk assessment A risk assessment of the dietary intake of TFA for the Australian and New Zealand populations was undertaken based on the estimated dietary intake outlined above. A more detailed report on the risk assessment can be found in Appendix 3. 7.1 TFA intake and health outcomes There has been much debate in the literature regarding the link between dietary intake of TFA and adverse health outcomes. The most consistent and robust evidence linking TFA intake with an adverse health outcome is its adverse effect on blood lipid profile, specifically TFA appear to raise LDL levels. A small number of cohort studies also show an association with TFA intake and risk of heart disease. A joint review was undertaken by the FAO/WHO of dietary factors associated with cardiovascular disease, a collective term for diseases of the heart and arteries that includes coronary heart disease (CHD). The evidence for an adverse effect of TFA intake on risk for cardiovascular disease led the authors of the report to recommend population nutrient intake goals of less than 1% energy from TFA (Anon, 2003). Mean TFA intakes in Australia and New Zealand are below 1% intake, but this does not preclude the possibility of health benefits from further reductions in intake, particularly in people with intakes above the mean. 7.2 Scientific reasons for regulatory action in Denmark, USA and Canada The effect of TFA on blood lipids was given as a primary scientific reason in Danish, Canadian and U.S. reviews to support reducing population TFA intakes, resulting in regulatory action in these countries. Pre-regulation TFA intakes in North America were considerably higher than current estimates in Australia and New Zealand, however, Denmark took action to reduce TFA in the Danish food supply with mean TFA intakes of 1% dietary energy (Stender and Dyerberg, 2003b), a level much closer to intakes in Australia and New Zealand (Figure 8). 7.3 Health effects of ruminant compared to manufactured TFA Arguments have been put forward to suggest that ruminant-derived TFA may have differential health effects compared with TFA formed during the manufacturing of partially hydrogenated edible oils. However, the profile of the TFA content of ruminant fat is related to the diet of the animals (see Appendix 1). Further, the TFA profile of partially hydrogenated vegetable oil is also likely to vary between countries owing to preference for different oils. Therefore, while it is reasonable to presume that studies showing differential effects of individual TFA are comparable between countries, the relevance of studies of fatty acid mixtures (e.g. butter versus margarine) between countries is less certain. In the absence of any definitive evidence for differential effects on heart disease risk factors, the recommendation to reduce saturated fat intake, and hence animal fats including ruminant-derived TFA, is still relevant. The evidence base that could be used to compare the effect on biomarkers or health outcomes of consuming ruminant or manufactured TFA is inadequate to allow firm conclusions to be made. The North American Institute of Medicine cautioned against trying to eliminate TFA from diets by avoiding meat and dairy foods because this would have undesirable effects on other dietary components (2002).

-27-
7.4 Health effects of TFA compared to saturated fatty acids Evidence for TFA having a more adverse effect on blood lipids compared with SFA on an equal energy basis is compelling. This is consistent with data from a prospective cohort study showing that replacement of 2% energy from TFA with cis-unsaturated fatty acids was equivalent, in terms of CHD risk reduction, with replacement of 5% energy from SFA with cis-unsaturated fatty acids (Hu et al., 1997). 7.5 Potential for reducing TFA intakes in Australia and New Zealand Dietary intakes of TFA including ruminant and industrial sources are approximately 0.6% and 0.7% of dietary energy intake in Australia and New Zealand, respectively (Figure 10). There is the potential for reducing TFA intakes from manufactured edible oils that account for approximately one-third and one-half of total TFA intakes in Australia and New Zealand, respectively (Table 1). Replacing high fat dairy foods with low fat alternatives would also reduce TFA intake as a consequence. 7.6 Estimates of CHD risk reduction at levels found in the New Zealand and
Australian food supply Dietary intakes of TFA from both ruminant and manufactured sources combined are approximately 0.6% and 0.7% of dietary energy intake in Australia and New Zealand, respectively. Whether intakes of this magnitude are associated with excess risk of CHD are unknown because the Australian and New Zealand intakes occur at the lower end of the TFA intake distribution found to be associated with CHD events in prospective studies (Ascherio et al., 1996; Pietinen et al., 1997; Oomen et al., 2001; Oh et al., 2005; Xu et al., 2006). The Institute of Medicine took the view that there is a positive linear trend between TFA intake and total and LDL cholesterol concentration, and therefore an increased risk of CHD (Institute of Medicine, 2002). This seemed reasonable given that the mean TFA intakes in North America are around 2 – 3% of dietary energy, a range over which changes in blood lipids have been found (Judd et al., 1994; Judd et al., 1998; Lichtenstein et al., 1999). However, there is a paucity of evidence to show that blood lipids change with reductions in TFA intakes of 0.3 – 0.4% energy, i.e. reductions in TFA intake potentially achievable in Australia and New Zealand. Nevertheless, there may be a health benefit if TFA intakes in Australia and New Zealand were reduced. Although it has been suggested that TFA are adversely associated with some forms of cancer, and type 2 diabetes, the most comprehensive evidence in support of a health benefit is a possible reduction in CHD events. The benefit would be greatest if partially hydrogenated vegetable oils were largely replaced in the food supply using carbohydrate or cis unsaturated fatty acids as alternative energy sources. Replacing carbohydrate in the diet with an isoenergetic amount of TFA adversely raises total and LDL-C concentrations. The evidence from dietary intervention trials, summarised in a systematic review, is consistent and compelling (Mensink et al., 2003). Replacement of cis fatty acids with isoenergetic amounts of TFA adversely raises the LDL:HDL cholesterol ratio. In a systematic review, a linear dose-response between percentage energy intake from TFA and change in LDL:HDL cholesterol was found with no evidence of a diminishing or threshold effect (Ascherio et al., 1999). The evidence for a dose-response effect is consistent, at least for TFA intakes in excess of 3% energy intake.

-28-
Because of the uncertainty as to whether the blood lipid dose-response effect occurs at low levels of TFA intake, and because associations with CHD incidence are unknown at low intakes, it is not possible to estimate the true extent of disease risk reduction that would occur in Australia and New Zealand if the TFA ingestion in the populations was reduced below already low intakes. 8. Review of consumer research 8.1 Review of consumer research Food purchasers and consumers are interested in the nutritive content of the food they purchase and/or consume. Empirical studies have consistently found that between 70 and 80 percent of those surveyed report the use of nutrition information on food labels occasionally or more frequently (eg. Cotunga & Vickery 1998; Neuhouser et al 1999; Derby & Levy 2001; Cowburn & Stockley 2003). Research commissioned by FSANZ confirms this general finding with 66 percent of respondents reporting use of the nutrition information panel16 (NIP) element of the label (FSANZ 2003). When referring to nutrition information about a food, purchasers and consumers do not attend all nutritive information equally, rather they focus upon the information of greatest relevance or salience to their situation (Kozup 2006). In general, consumers and purchasers report that they are most interested in nutritive information concerning fat, energy/calories and sugar (eg. Cotunga & Vickery 1998; Neuhouser et al 1999; Derby & Levy 2001; Cowburn & Stockley 2003). Research commissioned by FSANZ supports this finding (FSANZ 2003). There are limited data on the level of awareness of TFA in food and the behavioural responses of consumers and purchasers in Australia and New Zealand. A global study conducted by ACNielson in 2005 found that 21 percent of purchasers in the Asia Pacific region reported they regularly check labels for TFA content (ACNielson 2005). A number of empirical studies carried out in the USA report on various aspects of consumer response to TFA in the lead-up to mandatory labelling provisions. Hess et al. (2005) assessed TFA knowledge among a group of health-conscious adults in the US and found significant associations between TFA knowledge and formal education level and with marital status. No significant associations were found with other socio-demographic variables. TFA knowledge was also significantly related to use of label nutrition information. While the study sample was not representative of the general USA population, the findings do support the general finding in other studies that those with higher levels of formal education tend to have higher levels of use of label nutrition information (eg. Guthrie 1995; Cowburn & Stockley 2003). Kozup et al. (2006) explored the impact of information about TFA on consumers’ disease risk perceptions and on the perceived importance of TFA information. They found that TFA knowledge had a moderating influence on the perceived risk of heart disease, stroke and high blood pressure from a series of mock-up products with low and high TFA levels. TFA knowledge was simulated through the provision of a 317-word extract that discussed the potential harmful effects of consuming TFA.
16 In the Australia and New Zealand Food Standards Code, nutrition information requirements in relation to food that is required to be labelled are set out in Standard 1.2.8 – Nutrition Information Requirements

-29-
Where respondents were provided with information, disclosure of TFA level had an effect on disease risk perceptions. Where no information was provided, the level of TFA did not affect perceptions of disease risk. A similar pattern was found with perceived importance of TFA: where information was provided the level of TFA had an effect on the perceived importance of TFA. In a study for the International Food Information Council Foundation conducted by Cogent Research (2003), US consumers were surveyed about their use of TFA information in selecting healthier foods. Consumers were asked to identify the healthier choice between similar unbranded products with similar energy and total fat content, first with no information about TFA levels and then gradually being provided with additional information. The study found that as information was added about TFA consumers changed their selection. The addition of TFA content among nutrition information saw an increased number of people who based their choice on TFA content. When a footnote was added stating that the ‘Intake of Trans fats should be as low as possible‘, TFA became the primary driver in selecting healthier products. This led to some products being considered healthier due to slightly lower levels of TFA even though they contain much higher levels of saturated fatty acids. The focus on TFA in the survey may also induce some learning effect from the survey itself, which may boost decisions based on TFA. None-the-less, the study highlights the negative impact that some approaches to labelling and advice regarding TFA can have on consumer selection of healthy products. While these studies highlight various links between knowledge and selection of healthy products or disease risk perceptions, there are no reports of the impact on information regarding TFA on the consumption behaviour of consumers. However, a number of studies have explored the impact of providing information on saturated fat levels, and the level of saturated fat consumed, and these may provide a guide in the TFA context. Kim et al (2000) found that food label use decreased average daily intakes of energy from total fat by 6.9% and from saturated fat by 2.1%. Neuhouser et al (1999) found that label use was significantly associated with lower fat consumption. The US FDA estimated the reduction in TFA intake because of changed behaviour related to label reading (FDA 1999, 2003). Using changes in total fat consumption the FDA estimated that TFA intake would decrease somewhere in the range of a high of 5.5% and 0.5% of relative intake (FDA2003). However, given percentage total energy intakes from TFA of 0.6% and 0.7% for Australia and New Zealand respectively, the reduction due to consumers reading and changing behaviour in response to labels predicted from these figures would be minor if labelling was introduced. Using the FDA estimates, the Australian reduction in percentage total energy intake from TFA would range from 0.003% to 0.033%, and in New Zealand, the range is from 0.0035% and 0.0385%. 8.2 Key findings Research found in the literature suggests that consumers are very interested in the fat contents of foods, and about the type of fats found in the food. It is likely that Australians and New Zealanders are also interested in the TFA content of their food, and that this interest will increase as the awareness of the perceived health effects of TFA increases. The segments of consumers that are well-educated and avid label readers are more likely to be interested in TFA information, and are more likely to use this information.

-30-
Consumer research has shown that including TFA content among nutrition information may lead to some products being considered healthier due to slightly lower levels of TFA even though they contain much s higher levels of saturated fatty acids. This highlights the potential negative impact that some approaches to labelling TFA might have on consumer selection of healthy products. This effect may occur in the marketplace in the absence of mandatory labelling, as consumers become aware of the TFA content of foods making claims for other fatty acids that trigger the disclosure of TFA on the expanded NIP17. For example, processed fish making claims on omega-3 fatty acid contents may contain low levels of TFA that would be declared on the label. Consequently, some consumers may avoid some foods because of the perceived risk posed by TFA content. There is very little published information regarding research on consumer understanding of TFA in Australia and New Zealand. In addition to this review, qualitative and quantitative data on the information requirements, perceptions and purchasing behaviour of Australian and New Zealand consumers regarding foods containing TFA would be required to develop a useful understanding of consumer information requirements and consumer behavioural responses to TFA labelling. It has been demonstrated that the effects of mandatory labelling on consumer behaviour is uncertain. Similarly, there are little data on the information needs of Australian and New Zealand consumers regarding TFA or the consumer benefit of this information. It is concluded that the limited data, in to the context of the low levels of TFA in the food supply (see above), available does not support an urgent need for additional mandatory labelling of TFA in Australia and New Zealand. 9. Current Approaches to Risk Management 9.1 Risk management in Australia and New Zealand: Regulatory measures The Code permits voluntary labelling of TFA content. TFA labelling is mandatory only if claims are made in relation to the fatty acid or cholesterol content of a food. Standard 1.2.8 – Nutrition Information Requirements of the Code prescribes when nutritional information must be provided, and the manner in which such information is provided. It defines that ‘trans fatty acids means the total of unsaturated fatty acids where one or more of the double bonds are in the trans configuration acids and declared as trans fat’. The prescribed declaration in a nutrition information panel does not include TFA, but TFA, PUFA and MUFA must be declared in the prescribed format of an expanded nutrient information panel where nutrition claims are made in relation to cholesterol, saturated, trans, polyunsaturated or monounsaturated, omega 3, omega 6 or omega 9 fatty acids. For example, if a claim such as ‘Brand X is a monounsaturated margarine’ is made, the label must declare the quantity per gram of saturated fatty acids, monounsaturated fatty acids, polyunsaturated fatty acids and TFA in the food.
17 Under the Code, TFA labelling is mandatory if claims are made in relation to the fatty acid content of a food.

-31-
Dietary recommendations in Australia and New Zealand refer to saturated fatty acids and TFA combined. This reflects the understanding that whilst chemically TFA are unsaturated fatty acids, physiologically they are more akin to saturated fatty acids. However, the Code uses a chemical definition of trans and saturated fatty acid for the purpose of regulating declaration. Saturated fatty acid declarations in NIPs therefore do not include TFA. Standard 2.4.1 specifies that where a specific name of an oil is used (e.g. soybean oil), the food must be accompanied by a statement that describes the nature of any process that has altered the fatty acid composition of the oil. This includes hydrogenation of the oil (e.g. hydrogenated soybean oil). 9.2 FSANZ label monitoring 9.2.1 Label monitoring: the Nutrient Information Panel FSANZ undertakes an ongoing label monitoring survey; the results of Phase 1 for labels collected in 2002-2003 were reported in December 2005 (FSANZ 2005a). Food labels have been collected for 2005 and 2006 and the assessment nutrition and health claims component of the survey has been completed. The report for the nutrition and health claims 2005 survey is expected to be published in early 2007 followed by the report on other label elements in 2007. In the 2002 survey, of the 359 products assessed that were manufactured according to the new Code and which had a Nutrition Information Panel (NIP), 135 labels or 38% had an expanded NIP. In the 2003 survey, of the 1078 products assessed that had a NIP, 300 labels or 28% had an expanded NIP. Of the labels with expanded NIP sections, in the 2002 survey 48% of the 135 labels included information on fat content18, and in the 2003 survey 26% of the 300 labels included information on fat content. The information presented in the expanded NIP was assessed for consistency with requirements in the Code. The main reasons the expanded NIP sections were inconsistent when they included information on fat content were incorrect listing of nutrients, values or units. Commonly the information on TFA was the most likely nutrient to be missing when the nutrient were listed incorrectly (see Table 3). 9.2.2 Claims on food 2003 labels As part of the 2003 survey, labels were assessed against relevant provisions in the Code and the Code of Practice on Nutrient Claims (CoPoNC) for Australian purchased foods only (FSANZ 2005b). Results indicated that there were no claims about TFA content of the food, except for listing of TFA in the NIP. Forty labels had claims for poly- and mono-unsaturated fatty acids (22 claims) or omega fatty acids (18 claims) out of a total of 82 nutrition claims assessed against provisions in Standard 1.2.8 and would have been expected to also declare the TFA content in an expanded NIP.
18 Standard 1.2.8 of the Code requires that any claims relating to fatty acid composition and cholesterol must declare total fat, saturated fat, trans fatty acids, polyunsaturated fatty acid and monounsaturated fatty acids. Therefore, any label that declares a fatty acid must declare trans fatty acids.

-32-
The main categories of foods carrying these claims were emulsions and oils, breads and bakery items, and mixed foods (mono- or poly-unsaturated fat claims) and fish and fish products (omega fatty acid claims). Assessment of foods purchased in Australia against the CoPoNC indicated that out of a total of 220 CoPoNC claims on 153 labels a further 93 claims related to the fat content of the food (6 for reduced fat, 19 for low fat, 66 for x% fat free and 2 for low in saturated fat) and 32 related to the cholesterol content (3 for low cholesterol and 29 for cholesterol free). 9.2.3 Claims on food 2005 labels As for the 2003 survey, the nutrition and health claims on the food products collected in 2005 were assessed against relevant provisions. There were no claims about TFA content of the food, except for listing of TFA in the NIP. Twenty one labels had claims for poly- and mono-unsaturated fatty acids (6 claims) or omega fatty acids (15 claims) out of a total of 61 nutrition claims assessed against provisions in Standard 1.2.8 and would have been expected to also declare the TFA content in an expanded NIP. The main categories of foods carrying these claims were the same as for the 2003 survey. Assessment of foods purchased in Australia against the CoPoNC indicated that out of a total of 369 CoPoNC claims on 244 labels a further 120 claims related to the fat content of the food (10 for reduced fat, 19 for low fat, 84 for x% fat free, 5 for fat free and 2 for low in saturated fat) and 50 related to the cholesterol content (6 for low cholesterol and 44 for cholesterol free). 9.2.4 Conclusions from the label monitoring survey data The data from the labelling monitoring surveys for 2003 and 2005 show that here is very little uptake of TFA content claims on packaged foods. This can be seen as an indication that there has been no strong demand for foods carrying such claims in the market place and that TFA claims have had very little market penetration. There was also no evidence of an increase in uptake between 2003 and 2005. By requiring the declaration of all fatty acids when a claim is made, the Code takes account of the importance of disclosure of nutrition information required by the consumer to make informed decision. Where TFA has been declared on the NIP this appears to be because of other claims, such as mono- or polyunsaturated fatty acid claims, or claims on omega fatty acids or cholesterol. There is some evidence that where fatty acids claims were made on foods, consumers are not always provided with adequate information to make informed purchasing decision. There is therefore some opportunity to improve consumer access to information on TFA content of food without widening labelling requirements. Further targeted surveys of food groups that are likely to carry TFA labels (e.g. edible oils, edible oil spreads, and fish products) would be desirable to develop an understanding of the prevalence of TFA labelling in the Australian and New Zealand market place.

-33-
Table 3 Results from ongoing label monitoring survey for 2002-2003 2002 2003 Labels with NIP 359 1078 Labels with expanded NIP (fat, carbohydrate or salt)
135 (38%) 300 (28%)
(a) Proportion expanded NIPs with section on fat
64 (48%) 78 (26%)
(b) Proportion expanded NIPs with fat information inconsistent with Code (b/a)*
56 (88%)
Nutrients (46 labels or 72%) Values (21 labels or 33%) Units (11 labels or 17%)
66 (85%)
Nutrients (63 labels or 81%) Values (21 labels or 27%) Units (16 labels or 21%)
(c) Proportion expanded NIPs with fat information where nutrients were inconsistent with Code because they were missing (c/a)**
16 (25%)
22 (28%)
(e) Proportion expanded NIPs with fat information with TFA information missing (d/a)
16 (25%) 18 (23%)
* Reasons for inconsistencies were related to nutrients, values or units, note labels can be inconsistent for more than one reason ** Other reasons for inconsistencies with nutrients were related to case used, position, wording or punctuation, note labels can be inconsistent for more than one reason 9.3 Risk reduction measures Currently, there a number of ongoing risk reduction measures address the issue of TFA in the food supply. Nutritional education provided by governments and non-government organisations, the National Heart Foundation ‘Pick the Tick’ program, and a number of initiatives by industry are important measures for managing the risk of TFA in the food supply. 9.3.1 Government initiatives The Australian and New Zealand governments address public health issues, such as fat intake, through a number of education initiatives and nutritional recommendations. The Australian Guide to Healthy Eating provides information about the amounts and types of food that need to be eaten each day to consume a balanced diet19. The Guide recommends people avoid foods that contain too much fat. The Dietary Guidelines for Australian Adults20 recommend limiting saturated fat and moderate total fat intake. In New Zealand, the Food and Nutrition Guidelines for Healthy Adults21 included a set of guideline statements. The background paper to the Guidelines states that excessive dietary fat intake, and particularly saturated fat intake, is a major health concern for adults in western countries. FSANZ has released a fact sheet on TFA22.
19 http://www.healthyactive.gov.au/internet/healthyactive/publishing.nsf/Content/eating 20 NHMRC 2003, Dietary Guidelines for Australian Adults, http://www.nhmrc.gov.au/publications/_files/n33.pdf 21 Ministry of Health, http://www.moh.govt.nz/moh.nsf/ 22 FSANZ, http://www.foodstandards.gov.au/newsroom/factsheets/factsheets2006/transfattyacids24oct3388.cfm

-34-
This information provides consumers in Australia and New Zealand with information that may assist them in taking action for themselves and their families by following dietary guidelines that recommend limiting trans fat and saturated fat intakes On the 24th of October, the Parliamentary Secretary to the Minister for Health and Ageing, Christopher Pyne, announced the establishment of a National Collaboration on Trans Fats (the Collaboration). Participants in the Collaboration would include the National Heart Foundation of Australia, the Dietitians Association of Australia, the Australian Food and Grocery Council, and FSANZ. New Zealand participation is under consideration. It is expected that the aim of the Collaboration would be to reduce the intake and presence in the food supply of TFA, while not raising the level of risk arising from other nutrients and food components. The Collaboration may review current actions relating to reduction of TFA in the food supply and overall diet considering the broader food industry and public health sectors. It may promote wide implementation of related industry and public health initiatives and consumer awareness and understanding. It also could propose new initiatives and provide information and advice to other initiatives and agencies with respect to TFA. New Zealand has built up a significant amount of data on the TFA content of New Zealand foods. It is intended that these data will be used in the monitoring of TFA in the food supply and extended to consumption of TFA. There are a number of initiatives being investigated by both Government and industry in New Zealand that are looking at opportunities to reduce the fat content of foods, particularly deep fried foods. The NZFSA is undertaking work in this area and will be considering the TFA content of foods in efforts to reduce saturated fat content. 9.3.2 Industry initiatives i . The Tick Food Information Program The National Heart Foundation organisations of Australia and New Zealand consider that TFA intake need to be minimised. However, they note that because Australians and New Zealanders consume far more saturated fat than TFA, it is important that reduction of saturated fat remains a priority. The Tick program has recently introduced a TFA criterion of less than 1% of total fat into the oil based spreads and oils category. In New Zealand there are currently more than 20 Tick approved margarines / oil based spreads available on supermarket shelves. Criteria that limit TFA in 18 other Tick food categories has also been introduced, including cereal bars, crackers, savoury pies, sweet biscuits and breakfast cereals. In Australia the Tick program currently includes 25 food categories incorporating ‘no partially hydrogenated fat’ or a ‘trans fat’ criteria, with more food categories to follow. The TFA criterion is for foods that could possibly contain manufactured TFA such as meat pies, cereal bars, pasta and noodles. Food companies also still have to meet the Tick criteria for saturated fat, salt, fibre and kilojoules.

-35-
Australian Pick the Tick categories that now have a TFA criteria are cereals; cereal bars; cakes; sweet and savoury biscuits; grains (processed); pasta and noodles (plain and processed); frozen potato products; processed vegetables; fruit pies; fruit bars; processed meat and poultry; luncheon meats; processed plant alternatives; nuts and seeds; edible oil spreads; vegetable oils; salad dressings; ready meals (general and canned meat) and savoury pies. To highlight healthier choices among foods eaten out, the Heart Foundation introduced its Tick to the away from home market in August 2006. To be eligible for the Tick, food outlets are independently tested to ensure they meet stringent TFA standards as well as saturated fat, sodium, serve size and fibre/vegetable content. i i . Init iat ives to reduce TFA content of foods A range of measures to reduce TFA in the food supply is currently being actively pursued by industry. These measures have the potential to substantially reduce the level of TFA in the food supply, and are an indicator of the capacity of industry to respond to international and national regulatory measures. FSANZ has had initial discussions with a sample of companies within the food industry in Australia and NZ to gain a view of programs, currently in place or planned for the future, to reduce TFA in the food supply. Industries consulted included manufacturers and suppliers of commercial fats and oils in New Zealand and Australia, producers of retail products and products for the catering or food service industry and the fast food industry. Further quantitative data would provide an assessment of product reach and the impact of industry programs currently in place. Both the New Zealand and the Australian Food and Grocery Councils are aware there are industry activities underway to reduce TFA. The Australian Food and Grocery Council (AFGC) encourages member companies to develop action plans23, some of which include a target to reduce TFA in their food products. There appears to be a high degree of awareness amongst the companies contacted. Many companies are aware of regulatory requirements recently implemented in Denmark, Canada and the United States (see below), and some expressed the view that some form of amendment to the Code is likely to be considered. All companies contacted have a policy, strategy or research and development programme to reduce the TFA content in their food products. Most companies appear to be taking a proactive approach to the reduction of TFA. Some companies have been addressing the TFA content of food products for more than 10 years; other programs are more recent. The major commercial suppliers of edible fats and oils already have current programs to reduce TFA levels in certain products supplied to the food industry. The retail and food service producers and the fast food company contacted also have strategies underway.
23The Australian Food and Grocery Council encourages member companies to develop Nutrition and Health Action Plans that show how they intend to promote healthy choices through the content of their food, how they will market their products responsibly, what nutrition information they will provide to customers and how they will encourage healthier lifestyles. Refer to www.afgc.org.au for the Company Action Plans.

-36-
Industry appears to target products with the greatest potential impact to reduce TFA (e.g. table spreads, edible fats and oils for baking, and frying oils) with a focus on products with manufactured rather than ruminant TFA, although one company is targeting TFA from both sources. Targets for a reduced TFA content in products vary including less than 1 g per 100 g of product, less than 1 % of total fat, less than 3% of total fat and less than 1% of daily energy. Both the National Heart Foundation criterion and the WHO guidelines were referred to by industry. Some suppliers of edible fats and oils to food producers provide reduced TFA products on a supply and demand basis only as requested by customers. One supplier estimates that approximately 30% of their margarines sold for baking and frying now have reduced TFA, and notes this demand is growing. Another supplier for the food service and catering market also notes a strong interest from food producers in products with reduced TFA and supplies these products as requested. One supplier of commercial edible oils has initially targeted baking fats and has developed a new range of low TFA baking fats for use in cakes, biscuits and pastries. This is being supplied to manufacturers including key biscuit and pie manufacturers and a promotional campaign is planned to raise awareness of the product. Future aspects of the program will target frying oil used by the donut industry. Another supplier has worked with industry to develop and supply edible oils for pastries and cake margarines with a target level of TFA <0.5% of total fat. Some pastry and cake margarines with reduced TFA content are currently produced, and consideration is being given to extending this. A frying shortening containing no partially hydrogenated oils is also available, although some ruminant TFA are present. Another edible oil manufacturer now supplies reduced TFA baking shortening and is beginning to provide margarines with reduced TFA to the food industry. Future expansion of the program is being considered aiming to reduce TFA to less than 1% of total fat. Companies responsible for a significant market share of retail margarines and spreads in Australia reported that since 1996 all their branded retail spreads have contained less than 1% TFA per 100g. Table spreads have been a priority for TFA reduction due to the volumes sold and their regular daily use. House brand retail spreads and margarines manufactured for other distributors may use partially hydrogenated oil unless the customer has requested reduced levels of TFA, for example, customers may include a requirement that their product(s) meets the Heart Foundation’s Tick criteria. Testing for TFA in these products may occur but reduction appears to be undertaken on request. Major biscuit manufacturers contacted have described programs to reduce TFA in their products. One manufacturer reports their range of most popular biscuits now have a TFA content of <1% of energy. A specific brand of crisp and chip products has also been developed with the same reduced TFA content. Analysis is continuing on other products for future development. Another company reports it is at the final stage of replacing edible oils in biscuits and crackers to obtain a TFA content of below 1% total fat.

-37-
A shortening that results in 0.5 g TFA per 100 g is used for production of some biscuits; sunflower or canola oil is used for others. Biscuits produced using naturally occurring TFA (milk powder or butter) result in a finished product with less than 1g TFA per 100 g. The fast food company consulted is currently targeting frying oils. The company considers that such an initiative would have a great potential impact on reducing TFA. In late 2006 frying oils used in its restaurants and by the suppliers of par-fried foods will be upgraded to oils with a reduced TFA content of below 1%. Suppliers of par-fried foods will be required to comply. Progress on other retail products was noted by some companies including reduced TFA levels in low fat milks, yoghurt, deserts, dressings, mayonnaise and some frozen meals. One company was currently developing a proposal for further work including TFA reduction in cakes, pastries and cake mixes. Industry noted the most common barriers to TFA reduction are cost, flavour, functionality of ingredients, stability of products, and other technical reformulation issues. One noted a need to clarify the science between different effects of naturally occurring TFA versus TFA contributed by partially hydrogenated oils. One company noted the potential to increase saturated fat for technical reasons when reducing TFA. This issue is of some concern because in countries that have introduced mandatory TFA labelling or compositional requirements, there has been a trend to reduce TFA content of foods by the increased use of oils rich in saturated fatty acids in place of oils rich in PUFA. If this is the case, given the low TFA intakes in Australia and New Zealand, the choices consumers make are increasingly important for health outcomes. Further work is required by FSANZ to assess if this is a concern for the profile of fatty acid intakes in Australia and New Zealand. i i i . Drivers for change FSANZ preliminary research indicates that there is an increased demand within the food industry for reduced levels of TFA in fats and oils supplied for food production. The major edible oil manufacturers and suppliers are also driving work on reducing TFA in edible oils and smaller suppliers would need to follow the existing trends in the longer term. It appears that large retail companies can also have a strong influence over what products are manufactured. Awareness of the regulatory requirements recently implemented overseas may also be a factor driving change. The Heart Foundation Tick programme appears to be a key driver for some sections of the industry. According to the Australian Heart Foundation, this process began in the 1990s when the Tick program introduced TFA criteria for spreads. Australia now has more than 50 spreads available with the Heart Foundation Tick. In New Zealand, there are currently more than 20 Tick-approved margarines/oil based spreads on supermarket shelves that contain a maximum of one per cent of total fat as TFA, with several manufacturers updating their formulation and packaging shortly. Because of the criterion for TFA, spread manufacturers have reduced TFA by an average of 92% to keep the Tick, removing over 250 tonnes of TFA from the New Zealand food supply in one year. The TFA standard for margarines/oil based spreads to achieve the Tick is half the maximum level allowed in Denmark.

-38-
iv. Summary and conclusions In summary, industry has a variety of programs and initiatives in place to reduce TFA in the food supply. In some food categories, such as margarines/oil based spreads, a broad variety of low TFA choices have been available to consumers since the mid 1990s. Preliminary discussions with industry indicate that issues surrounding TFA content of food are already having an impact on the food industry. Some edible oil suppliers note the increased demand from within the food industry for reduced levels of TFA in fats and oils used for food production. This trend appears to have grown, and has been an important driver for reducing TFA in the food supply. In conclusion, based on the limited data available, industry appears to be ready to and capable of responding to market demand for lower TFA contents of food. There is anecdotal evidence that the TFA content of foods (e.g. margarines) can be lowered considerably without the need for regulatory measures in addition to existing labelling requirements. In addition to this preliminary information, quantitative data would be useful, such as the uptake by industry of commercial fats and oils with reduced TFA e.g. baking margarines, and the percentage of various food items produced for consumers that now have a reduced TFA content. 9.4 Current international risk management strategies 9.4.1 Codex The Codex Alimentarius Commission (Codex) was created in 1963 to develop food standards, guidelines and related texts such as codes of practice under the Joint Food and Agriculture Organization / World Health Organisation Food Standards Programme. Under the Guidelines for Nutrition Labelling of Codex, TFA must be declared where the amount and/or type of fatty acids or the amount of cholesterol is declared on a label. The WHO has recommended that governments around the world phase out partially hydrogenated oils if TFA labelling does not effect a marked reduction in the global availability of foods containing manufactured TFA. In its draft action plan for implementation of the global strategy on diet, physical activity and health WHO has requested Codex to consider setting limits on the content of manufactured trans-fatty acids in foods. The means of implementation have been referred to the Codex Committee on Nutrition and Foods for Special Dietary Uses and the Codex Committee on Food Labelling. Since these are the initial stages of consideration, it is likely to be a matter of years before the outcomes are finalised as Codex standards. 9.4.2 European Union (EU) In the EU, TFA levels are required on labels only if a TFA claim is made. Declarations of the amount of TFA in a food are subject to the rules on nutrition labelling, which are harmonized at EU level. Nutrition labelling is voluntary unless a nutrition claim is made. Separate identification of the amount of TFA, as a component of the total fat content of the food, is only required if a TFA nutrition claim is made. The Commission has announced that the Directive on nutrition labelling will soon be amended.

-39-
In the UK, the Food Labelling Regulations require hydrogenated fat to be identified as such in the ingredient list on the label when it has been used as an ingredient in food. However, if hydrogenated fat is part of a compound ingredient that makes up less than 25% of the finished product it is not required to be mentioned in the ingredient list. In the UK, it appears there are no plans at this stage to undertake regulatory action over and above current promotion of a balanced diet within which edible oils of all types should be consumed sparingly. In 2003, the Danish Nutrition Council recommended restrictions on, and phasing out of, the use of manufactured TFA in foods. By 1 June 2003, edible oils were limited to less than 2% TFA content, and from 1 June to 31 December 2003, less than 5% TFA were permitted in edible oils used in processed foods. From 1 January 2004, less than 2% TFA are permitted in edible oils used in both local and imported processed foods. If the TFA content in the finished product is less than 1 gram per 100 grams of the individual oil or fat, the food is considered free of TFA. The requirements do not apply to ruminant TFA. Whilst Denmark can mandate the composition of products sold, it cannot change the rules for nutrition labelling on its own initiative; this includes introducing compulsory declaration of TFA. Consequently, there is no mandatory declaration of TFA in Denmark. 9.4.3 Canada In Canada, the Food and Drug Regulations (FDR) specifically prescribe what information must be displayed on a food label. The TFA content of a food is considered core nutrition information and must be declared in a Nutrition Facts table. Nutrition information changes were made in January 2003, requiring compliance by 12 December 2005 for large manufacturers, and by 12 December 2007 for small manufacturers. If health claims are made immediate compliance is required. Both the TFA content and the saturated fatty acid content are expressed in grams, immediately following the words ‘saturated’ and ‘trans’. The sum of ‘saturated’ and ‘trans’ fatty acid expressed as a percentage of the Daily Value (i.e. the daily intake) must also be displayed on the label. Three nutrient content claims can be made on a label or in an advertisement for a food with respect to its trans fatty acid content: ‘free’ of TFA (less than 0.2g TFA per serve), ‘reduced in’ TFA and ‘lower in’ TFA (both at least 25% less TFA than reference food). The wording for these claims and the conditions that the food must meet in order to make them are prescribed. One diet-related health claim is permitted with respect to the trans and saturated fatty acid content of foods that comply with a set of criteria. The prescribed wording of the two variations is as follows: • A healthy diet low in saturated and trans fats may reduce the risk of heart disease.
(Naming the food) is free of saturated and trans fats. • A healthy diet low in saturated and trans fats may reduce the risk of heart disease.
(Naming the food) is low in saturated and trans fats.

-40-
For the purpose of labelling, TFA are defined as ‘unsaturated fatty acids that contain one or more isolated or non-conjugated double bonds in a trans-configuration’. Most naturally present TFA fall within the definition and must be declared on the label. CLA isomers are not included in the label declaration because they fall outside the definition. In June 2006, a report was released by the Trans Fat Task Force formed by the Canadian Minister of Health. The task force had a mandate to develop recommendations and strategies ‘to effectively eliminate or reduce processed trans fats in Canadian foods to the lowest level possible.’ It recommended the following: • Foods purchased by retailers or food service establishments from a manufacturer for
direct sale to consumers be regulated on a finished product or output basis and foods prepared on site by retailers or food service establishments be regulated on an ingredient or input basis.
• For all vegetable oils and soft, spreadable (tub-type) margarines sold to consumers or for use as an ingredient in the preparation of foods on site by retailers or food service establishments, the total trans fat content be limited by regulation to 2% of total fat content.
• For all other foods purchased by a retail or food service establishment for sale to consumers or for use as an ingredient in the preparation of foods on site, the total trans fat content be limited by regulation to 5% of total fat content. This limit does not apply to food products for which the fat originates exclusively from ruminant meat or dairy products.
• The Government of Canada and all concerned food industry associations urge companies affected to use the most healthful oils for their food applications.
• Facilitate the reformulation of food products with healthier trans fat alternatives. • Help the food industry communicate the healthier nature of its products to consumers. • Help small and medium-sized enterprises prepare for compliance. • Enhance the capacity of the Canadian agri-food industry to take a leadership role in this
area. The task force further recommended that these regulations be finalized by June 2008, with appropriate transition periods to allow industry to comply with the new requirements. 9.4.4 USA Since 1993, the labelling laws in the USA require saturated fat and cholesterol levels to be included in the Nutrition Facts panel on all labels. Following the recommendation from the FDA Advisory Committee to reduce TFA intake to less than 1% of energy intake, the FDA now requires TFA levels to be disclosed on most food labels. The FDA final rule on TFA labelling requires that the amount of ‘trans fat’ in a serving be listed on a separate line under ‘saturated fat’ on the Nutrition Facts panel. However, ‘trans fat’ does not have to be listed if the total fat in a food is less than 0.5 g per serving, and no claims are made about fat, fatty acids or cholesterol content. If it is not listed, a footnote must be added stating that the food is ‘not a significant source of trans fat’.

-41-
The US regulatory authorities decided not to exclude TFA derived from rumen hydrogenation from labelling requirements; consequently, dairy products must be appropriately labelled. However, TFA with conjugated bonds are not included because they do not meet the US regulatory definition of TFA, which is ‘all unsaturated fatty acids that contain one or more isolated double bonds in a trans configuration.’ 10. New approaches to risk management in Australia and New Zealand 10.1 Approaches and options Several approaches are currently used to manage the risk of TFA in the food supply. These are comprised of voluntary labelling and claims, mandatory labelling, compositional restrictions or combinations of the above (Table 4). Additional approaches, such as industry initiatives, codes of practice, education and recommendations and policy initiatives are also valuable tools in managing the risks surrounding TFA intake. In Australia and New Zealand, additional measures are being introduced at the company level. Table 4 Approaches for risk management Australia
and NZ EU USA Canada Denmark
Voluntary labelling and/or health claims
Mandatory labelling Mandatory compositional restrictions ( )# #currently under consideration The following risk management approaches, including consideration of priority areas for risk management (e.g. packaged food, take-away foods), could be considered by FSANZ as part of an assessment process: i. Maintain the status quo: manufacturers may voluntarily declare the TFA content
of their products. TFA content must be declared when a claim in relation to cholesterol content or fatty acid profile of a food is made.
Advantages: No additional costs to industry, no risk of consumer confusion Disadvantages: Manufactured TFA may remain in the food supply at current levels; consumers are not informed on TFA content of some foods
ii. Maintain the regulatory status quo, but develop a strategy of non-regulatory risk management measures.
Advantages: Costs to industry are carefully managed; emphasis on consumer education.
Disadvantages: Rate of change may be low, some sections of industry may not get
involved, and consumers are not informed on TFA content of some foods.

-42-
iii. Expand mandatory labelling requirements for TFA.
Advantages: Consumers have access to increased information on TFA content of food; consumers are provided with information with may result in healthier food choices; industry is encouraged to innovate and reduce TFA in food.
Disadvantages: Cost to industry; consumers may be confused by TFA labels to
concentrate on TFA levels rather than the overall nutrient profile of the food, may lead to replacement of PUFA with SFA in some foods.
iv. Place limits on the permitted TFA content of food.
Advantages: Industry must innovate and reduce TFA in food; TFA in the food supply is reduced; captures the whole food supply.
Disadvantages: Cost to industry; some foods may no longer be available to consumers, impact on quality attributed conferred by hydrogenated oils, may lead to replacement of PUFA with SFA in some foods.
v. Design regulatory measure that combines mandatory labelling requirements with compositional requirements.
Advantages: as for iii. and iv.
Disadvantages: as for iii. and iv. 10.2 Stakeholders that may be affected by changes to the regulatory approach to
TFA The parties who are likely to be affected by any changes to the regulatory approach concerning TFA have been listed below: 1. Food manufacturing industry involved in the purchase and use of edible oils. Major
impacts may come from labelling requirements, reformulation, and availability of edible oils suitable for manufacture.
2. Manufacturers and suppliers of edible oils would be heavily affected by any potential
compositional requirements. This section of industry could also be affected by any changes in demand for particular types of edible oils that may result from new labelling requirements
3. Hospitality Industry would be affected if compositional requirements were
introduced. This may lead to the need to switch to different kinds of oils used for frying or other food preparation. Labelling and raised awareness of TFA in take-away food may also affect this section of industry.

-43-
4. Consumers might benefit from a more comprehensive labelling regime because they
could have more information when purchasing food. Heightened awareness of TFA and saturated fat may lead to healthier food choices by consumers. However, consumers may be exposed to higher intakes of saturated fat as a consequence of substitution of PUFA, or restrict the intake of other desirable nutrients due to TFA labelling. Increased costs may be passed onto consumers.
5. Enforcement agencies would need to enforce any additional requirements regarding
TFA 11. Conclusion and Future Actions 11.1 Summary of findings 11.1.1 Estimation of dietary intake of TFA for the Australia and New Zealand populations FSANZ has estimated the dietary intake of TFA for the Australian and New Zealand populations based on recently available concentration data for TFA in foods. On average, estimated dietary intakes of TFA for Australians were 1.2-1.6 g/day. Average estimated dietary intakes of TFA for New Zealanders were 1.6-2.0 g/day. Major contributors to the intake of TFA for both countries were dairy products, pastry, pastry based mixed foods, fats, and oils, meat and poultry, cereal and cereal products and cereal based mixed foods. There was a higher contribution to total TFA intake from fats and oils for New Zealanders compared to Australians. The differences between Australian and New Zealand may in part reflect that some New Zealand values may pre-date moves by New Zealand manufacturers to reduce TFA levels in spreads and that New Zealand spread samples appeared to be primarily from products less likely to have reduced TFA levels. For Australians, the percentage contributions from naturally occurring, manufactured and mixed sources of TFA were 60%, 24%, and 16% respectively. For the New Zealand population the percentage contributions from naturally occurring, manufactured and mixed sources were 41%, 46% and 13%, reflecting higher TFA levels in New Zealand edible oil spreads. In Australia, between 8-24% of TFA intake is estimated to come from take away foods. In New Zealand, take away foods were estimated to be the source of 3-16% of TFA intake, between 4-18% for the New Zealand Maori and Pacific Islanders. For the Australian population between 46-84% of TFA intake is estimated to come from foods that with a food label. In New Zealand, the figures were 63-90% for the whole population and between 61-86% for the Maori and Pacific Islanders population. The contributions of TFA to energy intakes of Australians and New Zealanders were 0.6% and 0.7% of total energy intake respectively and therefore below the goal of 1% proposed by the WHO. These estimates were comparable to, or lower than, reported TFA contribution to total energy intakes estimates from other countries.

-44-
According to current recommendations, total fats should contribute no more than 20-35% of total daily energy intake. Saturated fatty acids and TFA combined should comprise no more than 10% of total daily energy intake. The percentage of total energy intakes from saturated fatty acids and TFA combined was estimated to be approximately 13-17% of total daily energy intake, one and a half times the recommended level. Even if all TFA were removed from the diets, intake of saturated fats would still exceed the recommended upper daily intake. 11.1.2 Assessment of risk posed by TFA intakes Based on FSANZ estimated dietary intakes, a risk assessment of the dietary intake of TFA for the Australian and New Zealand populations was undertaken. A review of the literature found that there is consistent and robust evidence linking TFA intake with coronary heart disease. The strength of this association was one of the principle reasons put forward to support the regulatory measures regarding TFA taken by some countries. FSANZ also concluded that there is compelling evidence that the adverse effect on blood lipid profiles caused by TFA are greater than the adverse effects posed by saturated fatty acids when compared on an equal energy basis. However, this finding has to be considered in the context of the risk posed by high saturated fat intakes in Australia and New Zealand and the actual levels of TFA intake in Australia and New Zealand. FSANZ also concluded that although arguments have been put forward to suggest that ruminant-derived TFA may have different health effects than manufactured TFA, there is a lack of definitive evidence to support this view. The best evidence for health benefits associated with reducing TFA intake is for a reduction in coronary heart disease events and death. A reduction in coronary heart disease events might occur if manufactured TFA were largely removed from the food supply. However, TFA intakes in Australia and New Zealand are substantially lower than the TFA intakes prevalent in studies that indicated potential health benefits arising from reducing TFA intake. Therefore, the overall magnitude of reduction in heart disease that might be achieved if manufactured TFA were reduced in Australia and New Zealand is uncertain. 11.1.3 Consumer research FSANZ reviewed the literature on consumer information requirements and behaviour in regards to labels on products providing information on TFA contents. Studies have consistently found that most consumers use nutrition information on food labels, and that some do so more frequently than others do. In general, consumers are most interested in nutritive information concerning fat, energy (‘calories’) and sugar. International studies highlight various links between nutrition related knowledge and selection of healthy products or disease risk perceptions, but there were no reports of the impact on information regarding TFA on the consumption behaviour of consumers available in the literature.

-45-
There are limited data on the level of awareness of TFA in food and the behavioural responses of consumers and purchasers in Australia and New Zealand. Research has shown that consumers will reduce their total fat intake in response to labelling, but there is no available data on reduction of TFA intake resulting from labelling of TFA. Consumer research has shown that including TFA content among nutrition information may lead to some products being considered healthier due to slightly lower levels of TFA, while containing much higher levels of saturated fatty acids. This highlights the potential negative impact that some approaches to labelling TFA might have on consumer selection of healthy products. 11.1.4 Regulatory risk management in Australia and New Zealand In Australia and New Zealand, the Code permits voluntary labelling of TFA, but does not mandate disclosure of TFA content. TFA must be declared in an expanded nutrition information panel where nutrition claims are made in relation to cholesterol or fatty acids. The FSANZ label monitoring survey has found that where mandated nutrients were listed as missing from the expanded nutrition information panel, commonly the information on TFA was the most likely nutrient to be missing. In this context, it is important to note that many foods that contain TFA are not required to bear a label (e.g. take away foods) and therefore would not be affected by any expanded labelling requirements, and are not included in the label monitoring survey. 11.1.5 Strategies for non-regulatory risk management in Australia and New Zealand Currently, several non-regulatory risk management measures address TFA in the food supply. Nutritional education provided by governments and non-government organisations, the National Heart Foundation ‘Pick the Tick’ program, and a number of initiatives by industry directed at reducing TFA content of some foods are important measures for managing the risk of TFA in the food supply. In some food categories, such as margarines/oil based spreads, there is a broad variety of low TFA choices available to consumers. Preliminary discussions with industry indicate increased demand from within the food industry for reduced levels of TFA edible oils used for food production. This trend appears to have grown, and has been an important driver for reducing TFA in the food supply. Based on the limited data available, industry appears to be ready to and capable of responding to market demand for lower TFA contents of food. 11.1.6 International risk management strategies Broadly, labelling requirements in Australia are similar to those in the European Union and the Codex. The USA and Canada mandate labelling of TFA content of food. Denmark is currently the only country that has set regulatory limits on the TFA content of most foods. However, labelling is not mandated. Canada is likely to introduce regulatory limits on TFA content of most foods in the near future.
-46-
11.1.7 Stakeholders that may be affected by changes to the regulatory approach Stakeholders that would be impacted by increased regulation of TFA would include the food manufacturing industry involved in the purchase and use of edible oils, manufacturers and suppliers of edible oils and the hospitality industry if compositional requirements were introduced. Enforcement agencies would need to enforce any additional requirements regarding TFA. Heightened awareness of TFA and saturated fat may lead to healthier food choices by consumers. However, consumers may be exposed to higher intakes of saturated fat, or restrict the intake of other desirable nutrients due to TFA labelling. Increased costs may be passed onto consumers. 11.1.8 Options for risk management Options to manage the risk of TFA in the food supply are: • voluntary labelling and claims; • mandatory labelling; • voluntary measures that reduce TFA content of foods; • compositional restrictions; or • combinations of the above.
Strategies, such as industry initiatives, codes of practice, education and policy initiatives are also valuable tools in managing the risks surrounding TFA intake. 11.2 Conclusion FSANZ concludes that national non-regulatory approaches to further reducing the levels of TFA in the Australia and New Zealand food supply would be the most appropriate action for risk management. At this time, changes to the regulatory status quo are not appropriate. This conclusion is based on:
• the comparatively low intakes of TFA in Australia and New Zealand; • the uncertainty as to the overall magnitude of reduction in disease risk that might be
achieved by increased regulation; • uncertainty on the potential of labelling to affect consumer behaviour; • the potential to improve implementation of existing labelling requirements; • the effectiveness of current initiatives in reducing TFA in the food supply; • consistency with Codex and regulation applied in countries with similar TFA intakes
to Australia and New Zealand; • potential impact on stakeholders.

-47-
11.3 Future Actions Following the review of this matter, FSANZ recommends the following future actions, that FSANZ: 1. Support the Australian National Collaboration on Trans Fats in its initiative directed at expanding and strengthening existing non-regulatory risk management approaches that can further reduce the presence of manufactured trans fatty acids in the food supply and reduce dietary intakes of TFA
Reasons for Action Regulatory approaches, such as compulsory declaration of TFA, were not found to be the most effective or practical risk management strategies. However, the uncertainty surrounding the risk of even very low intakes of TFA provides a rationale for reducing the presence of TFA in the food supply as much as practically possible. The most prudent, effective and fastest approach to achieve this is to encourage industry to reduce or remove manufactured TFA from the food supply. FSANZ concluded that no immediate regulatory action is required to reduce the levels of TFA in the Australia and New Zealand food supply further. This conclusion is predominantly based on the comparatively low intakes of TFA in Australia and New Zealand, the effectiveness of current non-regulatory approaches, and the uncertainty as to the overall magnitude of reduction in disease risk that might be achieved by increased regulation. 2. Support related initiatives aimed at reducing the presence or intakes of trans fatty acids in the food supply in New Zealand.
Reasons for Action To allow non-regulatory risk management to be effective, a structured and national approach is required in New Zealand. Industry, government and non-government organisations must work together to ensure that appropriate risk management strategies are developed and successfully implemented and monitored. There already are many encouraging programs initiated by individual companies and industries. These should be expanded and strengthened.

-48-
3. Monitor the effectiveness of non-regulatory measures in reducing the level of TFA in the Australia and New Zealand food supply. 4. In early 2009, commence a review of the outcome of non-regulatory measures to reduce TFA in the food supply and assess the need to consider regulatory action commensurate with the ongoing risk posed by TFA intakes, such as additional labelling or compositional requirements.
Reasons for Actions A major reduction in TFA content of food is achievable through non-regulatory risk management strategies. Evidence of the effectiveness and implementation of the initiatives introduced by the national collaborations should be available to stakeholders. On this basis, FSANZ will be able to review if the non-regulatory approach has produced the desired results or if further action by FSANZ is required.

-49-
12. References ACNielson 2005. The nutrition-conscious global shopper. Consumer attitudes towards
nutrition label on food packing in Europe. ACNielson: Australia. Cogent Research 2003. Impact of trans fat label information on consumer food choices,
summary findings. Conducted for International Food information Council Foundation. IFICF: Cambridge.
Cotunga, N. & Vickery C.E. 1998. A food-label awareness and usage pattern survey, American Journal of Health Behavior, Vol. 22 (1), pp. 3-7.
Couvreur, S., Hurtaud, C., Lopez, C., Delaby, L. and Peyraud, J.L. (2006) The linear relationship between the proportion of fresh grass in the cow diet, milk fatty acid composition, and butter properties. J.Dairy Sci. 89:1956-1969.
Cowburn, G. & Stockley, L. 2003. A systematic review of the research on consumer understanding of nutrition labelling. European Heart Network: Brussels.
Derby, B.M. & Levy, A.S. 2001. Do food labels work? Gauging the effectiveness of food labels pre- and post-NLEA, In P.N. Bloom & G.T. Gundlach (eds.) Handbook of Marketing and Society. Sage: Thousand Oaks, pp. 372-398.
Elias and Innis 2002 J. Am. Diet Assoc. 102:46-51 FAO/WHO Food Standards (1999). CODEX Alimentarius; Principles and guidelines for the
conduct of microbiological risk assessment. CAC/GL-30. Food and Drug Administration (2003) Food labeling; Trans fatty acids in nutrition labeling.
Federal Register 21 CFR 101, 41433-41506. Food and Drug Administration 1999. Food labelling: Trans fatty acids in nutrition labelling,
nutrient content claims and health claims; Proposed rule. Federal Register Vol. 64(221) (November 17), pp. 62746-62825.
Food and Drug Administration 2003. Food labelling; Trans fatty acids in nutrition labelling; Consumer research to consider nutrient content and health claims and possible footnote or disclosure statements; Final rule and proposed rule. Federal Register Vol. 68(133) (July 11), pp. 41434-41506.
Food Standards Australia New Zealand (FSANZ) 2003. Food Labelling Issues: Quantitative Research with Consumers. Evaluation Report Series No. 4. FSANZ: Canberra.
Food Standards Australia New Zealand (FSANZ) 2005a. Food label monitoring survey, July 2002- December 2003, Phase 1 report (incorporating Stages 1 and 2), Evaluation Report Series no 10, FSANZ http://www.foodstandards.gov.au/newsroom/publications/evaluationreportseries/foodlabelmonitoringsurvey/index.cfm
Food Standards Australia New Zealand (FSANZ) 2005b. On going food label monitoring survey in Australia and New Zealand: report on the re-assessment of 2003 labels for nutrition, health and related claims (Phase 2), Evaluation Report Series no 14, FSANZ http://www.foodstandards.gov.au/newsroom/publications/evaluationreportseries/ongoingfoodlabelmonitoringsurveyno14/index.cfm
Guthrie, J.F., Fox, J.J. Cleveland, L.E. & Welsh S. 1995. Who uses nutritional labelling and what effect does label use have on diet quality? Journal of Nutrition Education Vol. 27(4), pp. 163-172.
Health Canada TRANSforming the Food Supply, Report of the Trans Fat Task Force, Submitted to the Minister of Health June 2006. http://www.hc-sc.gc.ca/fn-an/nutrition/gras-trans-fats/tf-ge/tf-gt_rep-rap_e.html
Hess, S., Yanes, M., Jourdan, P. & Edelstein, S. 2005. Trans fat knowledge is related to education level and nutrition facts label use in health-conscious adults, Topics in Clinical Nutrition, Vol. 20(2), pp. 109-117.

-50-
Hulshof, K.F., van Erp-Baart, M.A., Anttolainen, M., Becker, W., Church, S.M., Couet, C., Hermann-Kunz, E., Kesteloot, H., Leth, T., Martins, I., Moreiras, O., Moschandreas, J., Pizzoferrato, L., Rimestad, A.H., Thorgeirsdottir, H., van Amelsvoort, J.M., Aro, A., Kafatos, A.G., Lanzmann-Petithory, D. and van, P.G. (1999) Intake of fatty acids in western Europe with emphasis on trans fatty acids: the TRANSFAIR Study. Eur.J.Clin.Nutr. 53(2):143-157.
Innis et al. 1999 J. Am. Coll. Nutr. 18:255-260 Kim, S., Nayga, R.M. & Capps, O. 2000. The effect of food label use on nutrient intakes: An
endogenous switching regression analysis, Journal of Agricultural and Resource Economics, Vol. 25(1), pp. 215-231.
Kozup, J. Burton, S. & Creyer, E.H. 2006, The provision of trans fat information and its interaction with consumer knowledge, Journal of Consumer Affairs, Vol. 40(1), pp. 163-176.
Neuhouser, M.L., Kristal, A.R. & Patterson, R.E. 1999. Use of food nutrition labels is associated with lower fat intake, Journal of the American Dietetic Association, Vol. 99(1), pp. 45-53.
Ratnayake W.M.N, Chen Z.Y. 1995. Trans fatty acids in Canadian breast milk and diet. In: Development and Processing of Vegetable Oils for Human Nutrition, Eds. R. Przybylski and B.E. McDonald. AOCS Press, Champaign, IL, pp. 20-35.

-51-
Appendices Appendix 1 Chemistry and Technology Appendix 2 Dietary Intake Assessment Appendix 3 Risk Analysis