the effect of a lack of knowledge and experience on …
TRANSCRIPT
1
THE EFFECT OF A LACK OF KNOWLEDGE AND
EXPERIENCE ON THE PART OF THE PROJECT MANAGER
AFFECTING THE CRITICAL SUCCESS FACTORS WITHIN
THE PROJECT LIFE CYCLE PHASES
Hercules Visser
Student No: 0609687A
A dissertation submitted to the Faculty of Engineering and the Built
Environment, University of the Witwatersrand, Johannesburg, in fulfilment
of the requirements for the degree of Master of Science in Engineering.
Johannesburg, 2019

2
DECLARATION
I hereby declare that this dissertation is my own unaided work apart from the
advice of my supervisor and that it has not been submitted before for any degree
or examination in any other university. It is submitted in fulfilment of the
requirements for the degree of Master of Science in Engineering to the
University of the Witwatersrand, Johannesburg.
_____________
Hercules Visser
..................... day of ....................................... year ..........................
3
ABSTRACT
After being a project manager for many years and overseeing projects in South
Africa and beyond the researcher began to ask questions about the reasons for so
many project failures.
The researcher was motivated to investigate the effect of project managers’ lack
of knowledge and experience on the critical success factors within the project life
cycle phases. The main objective of this study was to identify the most critical
success factors in a project and discover why the implementation of these factors
ensures the successful delivery of a project. This research was intended for the
engineers who wish to enter the office of the project manager.
A comprehensive literature review on project management principles laid the
foundation for the research methodology.
The researcher formulated a pilot questionnaire which was reviewed by a panel of
experienced engineers. The questionnaire was based on the five-point Likert scale
instrument, designed to address both quantitative and qualitative applications with
minor changes (ranking versus rating method). The software used for analysing
the quantitative questionnaires was the IBM SPSS Statistics 24 and the software
for data capturing was the MySQL. Using quantitative as well as qualitative
research and integrating the two research methods exposed the shortcomings in
project management practice.
The research presented in this study highlighted the concerns raised by the
researcher by addressing the research objective and the research questions. This
research was aimed to prove that project failures are caused by the failure to apply
sound project and construction management principles regarding the critical
success factors within the project life cycle phases and lack of site experience.
The success factors identified through this research were in many cases the root of
the problems that occurred in practice. The research delivered a successful result
with conclusions and recommendations.
4
ACKNOWLEDGEMENTS
I would like to acknowledge and thank the people who participated in this
research in order to equip the engineer/project manager in the execution of his/her
duties as project manager. I could not have achieved this without a strong support
group.
I would like to thank my Creator for the ability and guidance He gave me during
this study. Without His support, this work would not have been possible.
“What shall I render unto the Lord
For all His benefits toward me?”
Ps. 116:12
I would like to thank my wife Ria, family and friends for their encouragement and
support and most importantly Prof Robert McCutcheon for his patience and wise
guidance.
‘Coming together is the beginning,
Keeping together is progress,
Working together is success’
Henry Ford

5
PREFACE
As happens all over the world, the South African construction industry experience
problems that can be traced back to a lack of project management knowledge and
experience within the project life cycle phases which then affect the critical
success factors of project management principles strategies. Construction projects
are often in the news because of accusations of malpractice, pertaining to poor
quality work and/or high risk practices.
After more than thirty years of project management experience overseeing many
projects of billions of Rands in South Africa and beyond its borders and observing
many failed projects, this researcher began to ask questions about the reasons for
those project failures. Does the Bachelor’s degree in engineering not equip the
engineer with the knowledge necessary for his profession? Where and when is he
supposed to acquire knowledge of project management? What are the
shortcomings and latent factors that the project manager fails to identify and that
therefore lead to project failure?
The basis for this research stemmed from the researcher’s passion for post-
graduate project management knowledge and in-depth site experience and to find
solutions to avoid project failures. It was important for the researcher to
investigate the possible shortcomings and latent project factors that the project
manager experiences but fails to identify, as this can easily lead to project failure.
The researcher was motivated to investigate the reasons and critical success
factors influencing the outcome of a project, to find answers to his questions and
to possibly find solutions for some of the problems occurring in engineering and
construction projects.
This research was intended for the engineers who wish to enter the office of the
project manager and to be able to deliver a project successfully. The purpose of
this research is to address the project related concerns as defined within the
research topic affecting the critical success factors of the project life cycle phases
within the South African engineering and construction environment.
6
CONTENTS Page
DECLARATION 2
ABSTRACT 3
ACKNOWLEDGEMENTS 4
PREFACE 5
LIST OF FIGURES 12
LIST OF SPIDER-WEBS 12
LIST OF TABLES 13
LIST OF BAR AND LINE GRAPHS 13
LIST OF GRAPHS 13
LIST OF DIAGRAMS 14
LIST OF ABBREVIATIONS 15
CHAPTER 1: INTRODUCTION TO THE RESEARCH 17
1.1 Introduction 17
1.2 Background to the study 19
1.3 Research objectives 21
1.4 Research questions 22
1.5 Justification of the research problem statement 23
1.6 Research methodology 25
1.7 Limitations and restrictions of the study 26
1.8 Ethical considerations 26
1.9 Outline of the research 26
1.10 Summary 28
CHAPTER 2: LITERATURE REVIEW 29
2.1 Introduction 30
2.2 Background 31
2.3 The project environment 31
2.4 Problem statement 32

7
Layout of Section A, B and C 33
2.5 SECTION A: Project management literature review 34
2.5.1 Literature review: Project management history 34
2.5.1.1 Introduction 34
2.5.1.2 The project deliverables 35
2.5.1.3 The construction industries 35
2.5.1.4 Capital needed 36
2.5.1.5 Risk Factors 37
2.5.1.6 The need for research 39
2.5.2 Literature review: Project management philosophy 39
2.5.2.1 Introduction 39
2.5.2.2 The construction industry 40
2.5.3 Literature review: Project management methodology 41
2.5.3.1 Introduction 41
2.5.3.2 Definition of project management 42
2.5.3.3 Project and construction management
success 42
2.5.3.4 The project level 44
2.5.3.5 Components of a project environment 45
2.5.3.6 Defining project success 46
2.5.3.7 Planning techniques 46
2.5.3.8 The iron triangle theory 47
2.5.3.9 Project efficiency: Time, cost and quality 47
2.5.3.10 Meeting the customer’s needs 48
2.5.3.11 Quality management 48
2.6 SECTION B: Definition of the five main factors in the project life
cycle 49
2.6.1 The project 49
2.6.1.1 Introduction 49
2.6.1.2 Project diversity criteria 50
2.6.1.3 Success criteria 50
2.6.1.4 Project success criteria 51
8
2.6.1.5 Success criteria for project management 54
2.6.2 The client 55
2.6.2.1 Introduction 55
2.6.2.2 The client’s exposure to the project 56
2.6.2.3 Identifying the client’s needs 56
2.6.2.4 Client participation in procurement involvement 57
2.6.3 The project and construction manager 57
2.6.3.1 Introduction 57
2.6.3.2 The project manager’s skills 59
2.6.3.3 The project manager as mentor 59
2.6.3.4 Competent project managers 60
2.6.3.5 Project manager’s performance 61
2.6.3.6 The project manager’s responsibilities 61
2.6.3.7 The project manager as a generalist 62
2.6.4 The contractor 63
2.6.4.1 Introduction 63
2.6.4.2 The contractor’s duties 63
2.6.4.3 Health and safety 64
2.6.5 The contract document and other related documents 64
2.6.5.1 Introduction 64
2.6.5.2 Define a contract 64
2.6.5.3 Drafting the conditions of the contract 65
2.6.5.4 Conditions of contract (CoC) 66
2.6.5.5 Contract related documents (CRD) 66
2.6.5.6 Types of contracts 66
2.6.5.7 Project related documentation 71
2.7 SECTION C: The four project management life cycle phases 72
2.7.1 Phase 1: Project initiation / conception 73
2.7.1 (a) Contract scope of work 74
2.7.1 (b) Feasibility studies 79
2.7.1 (c) Project proposal 81
2.7.2 Phase 2: Project planning / design stage 82

9
2.7.2 (a) Project design and analysis 84
2.7.2 (b) Project specification 88
2.7.2 (c) The bill of quantities 89
2.7.2 (d) Schedule of prices 89
2.7.2 (e) Environmental studies 90
2.7.3 Phase 3: Project implementation / construction 90
2.7.3 (a) Project risk management 91
2.7.3 (b) Project work breakdown structures 93
2.7.3 (c) Project quality control 93
2.7.3 (d) Performance management 95
2.7.3 (e) Approved design drawings 98
2.7.3 (f) Contractual payments 99
2.7.3 (g) Omissions, extras and variations 100
2.7.4 Phase 4: Closeout / lessons learned 101
2.7.5 Summary 102
CHAPTER 3: RESEARCH METHODOLOGY 104
3.1 Section 1: Introduction 104
3.1.1 Purpose of the research 105
3.1.2 Research instrument 105
3.2 Research question 106
3.3 Research methodology 107
3.4 Research analysis 108
3.5 Target population and/or participants 108
3.6 Research design 109
3.7 Survey design 110
3.8 Section 2: Quantitative survey methodology 111
3.8.1 Phase 1: Research design instrument 111
3.8.2 Quantitative research method 111
3.8.3 Research question 112
3.8.4 Designing the questionnaire 112
3.8.5 The Likert scale instrument 114

10
3.8.6 Questionnaire example and explanation 114
3.8.7 Research instrument 115
3.8.8 Pilot testing 116
3.8.9 Questionnaire survey instrument 117
3.8.10 Data collection method 119
3.9 Qualitative case study methodology 119
3.9.1 Phase 2: Introduction 119
3.9.2 Case study methodology 120
3.9.3 The case studies 121
3.9.3.1 Research strategy 122
3.9.3.2 Data analysis 123
3.9.3.3 Research approach 123
3.9.3.4 Categorisation of data 124
3.9.3.5 Interpretation of data 124
3.10 Phase 3: Content analysis 125
Identification of patterns 125
3.10.1 Content analysis 125
3.10.2 Validity of instrument 126
3.11 Summary 127
CHAPTER 4: QUANTITATIVE SURVEY ANALYSIS 128
4.1 Introduction 128
4.2 Data presentation analysis and interpretation 129
4.3 Participation in the survey research 129
4.4 General information regarding the survey conducted 130
4.5 Quantitative analysis methods: Primary survey 131
4.6 Response rate 131
4.6.1 Overview of quantitative survey analysis 134
4.7 Review of ranking results 134
4.7.1 Statistical analysis of the most important success factors
• Phase 1: Concept analysis 137

11
4.7.2 Statistical analysis of the most important success factors
• Phase 2: Planning analysis 138
4.7.3 Statistical analysis of the most success factors
• Phase 3: Construction analysis 139
4.7.4 Statistical analysis of the most important success factors
• Phase 4: Closeout analysis 140
4.7.5 Statistical analysis of the most important success factors
• Phase 5 141
4.7.5.1 Phase 5: Ranking the four phases 141
4.7.5.2 Ranking phase 1 success factors 144
4.7.5.3 Ranking phase 2 success factors 145
4.7.5.4 Ranking phase 3 success factors 147
4.7.5.5 Ranking phase 4 success factors 149
4.7.5.6 Closeout phase 149
4.7.5.7 Ranking across the project: phase 5 150
4.8 Summary 156
CHAPTER 5: QUALITATIVE CASE STUDY RESEARCH
5.1 Introduction 158
5.2 Literature review of the validity of case studies 159
5.3 The case study 160
5.4 Define the secondary research questions 161
5.5 Prepare to collect the data 161
5.6 Selection of case studies 162
5.7 Qualitative data instrument 162
5.8 The qualitative data instrument design 163
5.9 Case study evaluators 164
5.10 Evaluation and analysis of data 165
5.10.1 Defining the features of the case study 166
5.11 Validating data 166
5.12 Process of case study evaluation 167

12
5.13 Prepare the report 169
5.14 Assessment of the four selected case studies 171
5.15 Summary 176
CHAPTER 6: MERGING THE QUANTITATIVE AND
QUALITATIVE RESULTS
6.1 Introduction 177
6.2 Pattern-matching 178
6.3 Summary 183
CHAPTER 7: CONCLUSION AND RECOMMENDATIONS
7.1 Conclusion 186
7.2 Recommendations 191
REFERENCES 194
ANNEXURE 1: National Survey Questionnaire 218
ANNEXURE 2: Success factor graphs 222
ANNEXURE 3: Case studies and assessments 240
ANNEXURE 4: Case study assessment form 262
LIST OF FIGURES
Figure 2.1: Economic growth versus growth in South
African construction industry 37
Figure 6.1: Iron Triangle 177
LIST OF SPIDER-WEBS
Spider-web 4.1: Success factors during the project life cycles 141
Spider-web 4.2: Phase 1 144
Spider-web 4.3: Phase 2 145

13
Spider-web 4.4: Phase 3 147
Spider-web 4.5: Phase 4 149
LIST OF TABLES
Table 3.1: National survey questionnaire (example) 115
Table 3.2: Quantitative survey results (example) 118
Table 3.3: Qualitative analysis results (example) 118
Table 4.1: Response rate 132
Table 4.2: Participation description analysis 133
Table 4.3: Selected critical success factor per phase 136
Table 4.4: Descriptive and summary of success factor rankings 236
Table 5.1: Specimen of case study analysis 165
Table 5.2: Qualitative case study analysis 170
Table 6.1: Ranking versus rating 182
LIST OF BAR AND LINE GRAPHS
Bar and line graph 4.1: Most important success factors – phase 1 152
Bar and line graph 4.2: Most important success factors – phase 2 153
Bar and line graph 4.3: Most important success factors – phase 3 154
Bar and line graph 4.4: Most important success factors – phase 4 155
LIST OF GRAPHS
SUCCESS FACTORS (SF)
Graph 4.1: SF 1: Competent project manager 222
Graph 4.2: SF 2: Client participation 222
Graph 4.3: SF 3: Project mission / objectives / scope of works 223
Graph 4.4: SF 4: Top management support 223
Graph 4.5: SF 5: Competence of project team 224
Graph 4.6: SF 6: Sufficient project resources 224
Graph 4.7: SF 7: Effective communication 225
Graph 4.8: SF 8: Reliable and experienced contractor 225

14
Graph 4.9: SF 9: Quality control 226
Graph 4.10: SF 10: Project planning, time, WBS 226
Graph 4.11: SF 11: Monitoring and controlling 227
Graph 4.12: SF 12: Regular site visit / meetings 227
Graph 4.13: SF 13: Clearly defined contract processes 228
Graph 4.14: SF 14: Project risk management 228
Graph 4.15: SF 15: Project variation orders (VOs) 229
Graph 4.16: SF 16: Applicable training 229
Graph 4.17: SF 17: Progress meetings 230
Graph 4.18: SF 18: Well defined specifications/technical
drawings, BoQ 230
Graph 4.19: SF 19: Environmental studies 231
Graph 4.20: SF 20: Feasibility studies 231
Graph 4.21: SF 21: Adequate financial resources 232
Graph 4.22: SF 22: Contractor’s performance, site management 232
Graph 4.23: SF 23: Decision procedures and latent issues 233
Graph 4.24: SF 24: Type and size of project 233
Graph 4.25: SF 25: Contract and dispute procedures 234
Graph 4.26: Mean rank per success factor 235
Graph 6.1: Pattern-matching phase 1 179
Graph 6.2: Pattern-matching phase 2 180
Graph 6.3: Pattern-matching phase 3 180
Graph 6.4: Pattern-matching phase 4 181
LIST OF DIAGRAMS
Diagram 2.1: Literature reviews layout 29
Diagram 3.1: Chapter layout 104

15
LIST OF ABBREVIATIONS
ADD Approve of design drawings
BoQ Bill of quantities
CIDB South African construction industry publication
CoC Contract of conditions
CP Contractual payments
CPD Continuing Professional Development
CRD Contract related documents
CSF Critical success factors
DoL Department of Labour
DT Design team
ECSA Engineering Council of South Africa
EO Economic overview
ES Environmental studies
FDI Foreign Direct Investment
FPP Financial progress payments
FS Feasibility studies
GDP Gross Domestic Product growth
HS High risk
IDC International Development Corporation
ISO International Organisation for Standardisation
N Number
PDLCM Project development life cycle methodology
PLC Project life cycles
PLCP Project life cycle phases
16
PM Project management / project manager
PMBOK Project management institute’s Guide
PMC Project monitoring and controlling
PMI Project Management Institute
PMM Project management methodology
PP Project proposal
PQC Project quality control
PRM Project risk management
PRTID Project related technical information documents
PS Project specifications / Procurement strategy
PTP Procurement and tender procedures
PwC Price Waterhouse Cooper
QC Quality control
QM Quality management
QS Quantity surveyor
R & D Research and Development
RMP Risk management plan
SF Success factors
SACPCMP South African Council for project and construction management
professions
SoP Schedule of prices
SoW Scope of work
VO Variation order
WBS Work breakdown structures
17
CHAPTER 1 INTRODUCTION TO THE RESEARCH
1.1 INTRODUCTION
Construction is often seen as a relay race. Designers produce drawings, which are
presented to contractors, which are then used as a design for the construction of a
project. The completed project is then submitted to the client. Project and
construction management is far more intricate than this. Apart from the designer,
contractor and owner there are also the subcontractors and project manager to
consider in order to see the full picture. It is therefore important to fully
investigate the extent of the knowledge and experience of the engineer/project
manager before employing him/her to oversee the project. Thornberry (1987)
states the lack of experience and understanding can cause the engineer/project
manager to fail in his duty as manager. One of the most difficult areas for
engineers to improve on is project management skills when he moves into a
project management position.
Each stage is managed by different role players to ensure the delivery of a
successful end-result. These are the points of contact through which different
worlds connect. In most cases in the project and construction domain, firms have
no idea what the functions of the different project partners are. To the contractor,
a design firm is a machine with mysterious and largely irrelevant persons that
produce drawings. This view of the construction industry is of course very
superficial, but it illustrates a core problem that is refined in the project life cycle
domain.
The South African construction industry experience problems that can be traced
back to a lack of project management knowledge and experience on the part of the
project manager in the project life cycle phases which then affect the critical
success factors of project management principles strategies.
Projects are often in the news when poor quality materials or work and/or other
high risk construction practices lead to accusations of malpractice.

18
The reason is that there are always various uncontrolled latent conditions and
unspecified activities within engineering project. Other possible reasons for
project and construction failure could be due to the advancement in technology
and lack of frequent site supervision.
The project manager of today wants to control the project from his/her office and
mostly relies on the word of mouth via the contractor and his/her staff. First-hand
knowledge by being on site on a permanent basis will always be the best
controlling method used by the project and construction manager.
As stated by Lientz and Rea (2003) the engineer who is also the project manager
must be aware that no project can be managed from a remote office and that he or
she should be at the project site. According to them the project manager must be
frequently or even permanently on site to discuss any problem as it arises with the
contractor and related staff. The project manager must be fully committed to the
project until the project is completed and signed off by the client.
The purpose of this research is to investigate these principles in order to improve
the quality of projects and to make recommendations to improve project and
construction management skills in South Africa. The purpose is also to reveal
the reasons as to how, why and at what stage of a project life cycle the effect of a
lack of knowledge and experience on the part of the project manager could affect
the critical success factors of the project. The researcher also wants to prove the
importance of teamwork between all role players in the successful management,
completion and delivery of a project.
Based on personal experience, the researcher believes that the engineer, after
completion of his/her degree and training, is not fully equipped to undertake a
project managerial position. He/she will require post-graduate education in project
management as well as in-depth site experience under the supervision of a well
experienced project manager for a minimum period of two years.

19
1.2 BACKGROUND TO THE STUDY
The first section of the research provides the purpose of the study. An overview of
this study is given focusing on related problems in the industry.
Research in this field has indicated that the number of development projects
constructed each year continues to grow, as do the number of project failures
because of lack of knowledge and experience within the project life cycle phases.
These failures affect the critical success factors within the project management
life cycle phases as can be shown by reviewing selected case studies. Relevant
literature and case studies also indicate that construction projects are frequently
completed with large cost overruns, extended schedules and major quality
concerns.
The researcher raises the question whether project management participants (the
project team) are adequately equipped to form partnerships with one another
during the project life cycle phases to ensure that successful project execution has
taken place. Van Wyk (2003 and 2004).
According to Kerzner (2009) project success is to meet the customer’s
expectations regardless of whether or not the customer is internal or external. A
project can also be deemed successful when constraints of time and cost are
overcome and the project is completed. Lewis (2008) argues that a project fails
when it does not meet time, cost and performance or scope objectives.
De Wit (1988) suggests in his research that project success means taking all
stakeholders’ objectives during the project life cycle into consideration as well as
during all levels of the project. De Wit (1988) further states that as a project
always has various objectives, it is difficult to measure project success
objectively. Unforeseen circumstances and latent defects can also contribute to the
failure of a project.

20
Tan and Andrew (2006) are of the opinion that, in order to achieve project
success, effort should come from “the entire project team from various disciplines
with appropriate project management processes”. Tan and Andrew (2006) further
suggest project managers should have leadership as well as people skills. People
skills on all levels are needed to ensure positive and successful project
management and are some of the most important components of critical success
factors for project success.
Munns and Bjeirmi (1996) on the other hand, state that a project must achieve a
defined objective. They claim that every project has a definite start and finish with
scheduled working dates, i.e. a series of work tasks and activities that need
resources to be utilised and must be executed within the contract specification.
Project and construction management is viewed as using companies’
organisational structures and resources and applying project management tools,
techniques and standards to control and obtain the project objectives. According
to Munns and Bjeirmi (1996) it shows that there is an overlap between the project
and project management and indicates that project management is planned to
achieve short-term and specific objectives. These objectives differ from the long-
term and broader goals of the specific project as indicated by Munns and Bjeirmi
(1996).
Industry practices and international standards have been used to develop project
management methods for design and construction of projects that have a
reasonable success rate.
Ilincuta and Jergeas (2003) argue that these kinds of methods have been
effectively used in large institutes and organisations. However, during the design
and construction stages of projects there is often a lack of trustworthy methods
used by project teams in large organisations. Rowe (2007) argues that as project
teams find themselves pressured to reach the client’s demands, it is common
practice for smaller organisations to neglect or waive formal project management
principles. Rowe claims that this practice is often due to the fact that small
21
projects are viewed as simple to manage and therefore given low prioritisation by
the organisation.
According to the Project Management Institute’s (PMBOK) Guide (a Guide to the
Project Management Body of Knowledge: 2008) current project management
standards based on best-practices can be applied to all projects, large and small.
The above statements form the basis on which the research literature will be
reviewed below. The design and construction of projects within the various phases
of its life cycle processes complement the project scope of work.
According to Pinto and Mantel (1987) and the PMBOK Guide (2013) the project
development life cycle indicated four or five phases:
(1) Conception
(2) Planning
(3) Execution
(4) Closeout
This study will focus on these four phases.
Despite the fact that project and construction management has received a lot of
research attention over the last decade, there are still latent defects that influence
the success factors in the project life cycle domain. This study will reveal these by
means of a research survey questionnaire and selected case studies.
This research will investigate the current state of project management practice in
South Africa and how the selected research methods affect the construction
environment.
1.3 RESEARCH OBJECTIVES
Project management in the construction environment involves various participants
or role players to ensure a successful project.

22
Kerzner (1992) states that project management is the process that deals with
elements of the unknown and uses the personal commitment of project team
members to ensure the project is successfully terminated when agreed upon
objectives have been met within time, cost and performance parameters.
The main objective of this study is to identify success factors related to the project
and construction management environment and grouping these success factors
with the various project life cycle phases as discussed by Pinto and Slevin (1989).
The ultimate goal is to improve the effectiveness of project management during
the execution of the project life cycle processes regarding the following critical
success factors:
1 Describing current project management practices.
2 Identifying primary and secondary success factors affecting the project life
cycle domain.
3 Bringing together theory and practical case study analyses.
4 Assessing and reviewing current project and construction management
practice which affects the project life cycle from “project conception,
planning and execution to close-out”.
1.4 RESEARCH QUESTIONS
This study requires identifying and assessing the quality of project management
practices in South Africa.
The following research questions will be addressed:
The primary research question is:
1 What are the main success factors in project management in the design and
construction industry?
The secondary research questions are as follows:
2 How do the critical success factors affect the project life cycle?

23
3 How can the effect of a lack of knowledge and experience on the part of the
project manager within the project life cycle phases influence the critical
success factors of project management?
4 Why are these critical success factors important to be implemented?
1.5 JUSTIFICATION FOR THE RESEARCH PROBLEM STATEMENT
This study will identify and assess the quality of project management practices in
the project life cycle domain affecting the critical success factors of projects in
South Africa. The researcher also intends to prove that an engineer with a
bachelor’s degree in engineering needs further education in project and
construction management as well as some hands-on experience on site in order to
successfully manage, complete and deliver a construction project. The researcher
also wants to prove the importance of teamwork between all role players in the
successful delivery of a project.
Although most of the construction projects in South Africa are completed, many
suffer from cost overruns, time delays and other high-risk factors. Sometimes new
problems develop and persist despite efforts to implement success factors.
Mbande (2010); Construction Industry Development Board (CIDB) (2004) and
Van Wyk (2004 and 2003) highlight the differences between available skills and
required skills in project and construction management. It is a concern and needs
urgent attention to ensure improved quality of workmanship that will also enhance
the safe environment of the project. Van Wyk (2004 and 2003) claims that the
high rate of project failure reflects instability, high levels of non-completion, poor
management skills and low productivity.
The SA Construction Industry Journal (2013) for instance, regards safety as a
serious problem. It is noted in the journal that the building and construction sector
are identified as one of high-risk sectors. In the building and construction sector in
the period 2007 - 2010 there were 171 fatalities and 755 injuries reported. In fact,
24
various stakeholders such as the Department of Labour (DoL) and several trade
unions signed a Construction and Health Safety Accord in (2013).
A large body of research identifies major causes of project concerns disputing and
identifying a range of success factors. This research will review the following
research statement by Pinto and Slevin (1989): “They seem to tabulate individual
factors rather than grouping them according to some criteria to help analyse the
interaction between them and the possible consequences”. This statement will be
verified as it relates to project and construction management within the South
African construction industry by means of a quantitative survey and a qualitative
case study analysis.
By applying and verifying Pinto and Slevin’s statement (1989, pages 31-35) this
research hopes to reveal the concerns of the current topic, which is “The effect of
a lack of knowledge and experience on the part of the project manager affecting
the critical success factors within the project life cycle phases”.
Furthermore, the success of a project plays a key role in achieving organisational
growth and development. Most project managers believe that exceptional
management is important if the project objectives and success are to be
accomplished.
The study of Müller and Turner (2007) was inconclusive in respect to project
success in relation to meeting project life cycle stages. This implies that research
may be necessary to determine the correlation between project successes and
project life cycles. Their research further shows that project management
methodology plays a key role in ensuring successful execution. The correct
emphasis must be placed on the project team, which will ensure proper decision
making at various stages of project life cycle, which in its turn, will result in the
project being completed within budget, time and quality.
25
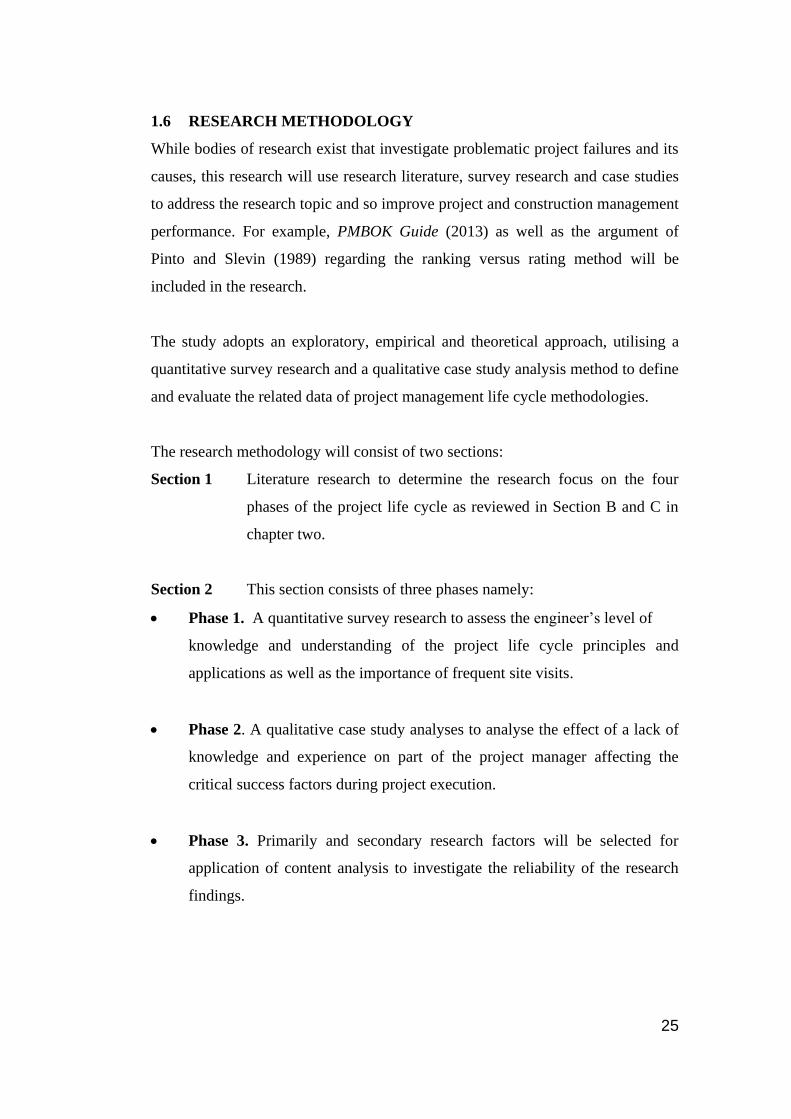
1.6 RESEARCH METHODOLOGY
While bodies of research exist that investigate problematic project failures and its
causes, this research will use research literature, survey research and case studies
to address the research topic and so improve project and construction management
performance. For example, PMBOK Guide (2013) as well as the argument of
Pinto and Slevin (1989) regarding the ranking versus rating method will be
included in the research.
The study adopts an exploratory, empirical and theoretical approach, utilising a
quantitative survey research and a qualitative case study analysis method to define
and evaluate the related data of project management life cycle methodologies.
The research methodology will consist of two sections:
Section 1 Literature research to determine the research focus on the four
phases of the project life cycle as reviewed in Section B and C in
chapter two.
Section 2 This section consists of three phases namely:
• Phase 1. A quantitative survey research to assess the engineer’s level of
knowledge and understanding of the project life cycle principles and
applications as well as the importance of frequent site visits.
• Phase 2. A qualitative case study analyses to analyse the effect of a lack of
knowledge and experience on part of the project manager affecting the
critical success factors during project execution.
• Phase 3. Primarily and secondary research factors will be selected for
application of content analysis to investigate the reliability of the research
findings.

26
1.7 LIMITATIONS AND RESTRICTIONS OF THE STUDY
In terms of geographical coverage, this study was conducted in South Africa and
therefore will only be available to members of the South African engineering
profession who participated in the survey. The research is limited to the margins
as defined in the research objective. Because of the formulation of the problem
and the scope of the research, some differentiation is called for to ensure a concise
and in-depth analysis of the research areas as proposed above. The area of project
management has attracted much attention from many different perspectives,
especially in the development, construction and engineering fields. Therefore, the
theoretical boundaries of this subject are very broad.
The research will cover the area of project and construction management
principles affecting the project life cycles phases and its critical success factors
affecting the construction industry in South Africa.
1.8 ETHICAL CONSIDERATIONS
Survey participants were given information regarding the background to and
purpose of the research and were assured that their identity and the identity of the
company would not be revealed and that the information they provided was
exclusively and solely for the use of academic purposes. They had to confirm that
they were participating in the research voluntarily.
1.9 OUTLINE OF THE RESEARCH
The research format follows the logical steps of establishing the research question,
developing the methodology, gathering and analysing data, and drawing
conclusions.
The research is structured into the following seven chapters:
Chapter 1 This chapter will cover the introduction and background of the
research by highlighting the research problems, research purpose,
research objectives and a justification of the research. It will
address the proposed research methodology, limitations of the
study, ethical considerations, and draw some conclusions.

27
Chapter 2 This chapter consists of a comprehensive review on project
management principles that are related to the project environment
as indicated by the PMBOK Guide (2013). The literature research
will cover the following three sections: (a) project literature, (b)
project participants and (c) project management principles covering
the entire project environment.
Chapter 3 The research methodology will be based on an exploratory,
empirical and theoretical research analysis. Firstly the researcher
will validate the literature in chapter 2 and secondly the researcher
will define the research topic by execution of the life cycle phases
as proposed by the PMBOK Guide (2013) and Pinto and Slevin’s
theory (1989). Pinto and Slevin (1989) state “Although several lists
of factors are generated, they seem to tabulate individual factors
rather than grouping them according to some criteria, to help
analyse the interaction between them and the possible
consequences”.
This chapter will also seek to identify the causes of defects and
lack of knowledge and experience in the project life cycle domain
by ranking the essential primary and secondary success factors
used to improve project management performance.
The research methodology will be discussed in Chapters 3 to 6.
Chapter 4 A quantitative survey using the ranking versus rating method on a
five point Likert scale will be performed to identify the primary
and secondary success factors.
Chapter 5 This chapter comprises qualitative research using four case studies.
Data collection procedures and analysis are described to assess the
critical success factors and failures thereof.
Chapter 6 The reviewed data collection, techniques and data analysis will be
validated through application of content analysis. This chapter
presents the data collected and proposes an interpretation of the
research information.
Chapter 7 Conclusions and recommendations.

28
1.10 SUMMARY
This introductory chapter provided a background to the study; a statement of the
research problem; objective and research questions of the study; justified the
necessity for the investigation; and layout of the chapters to follow.
29
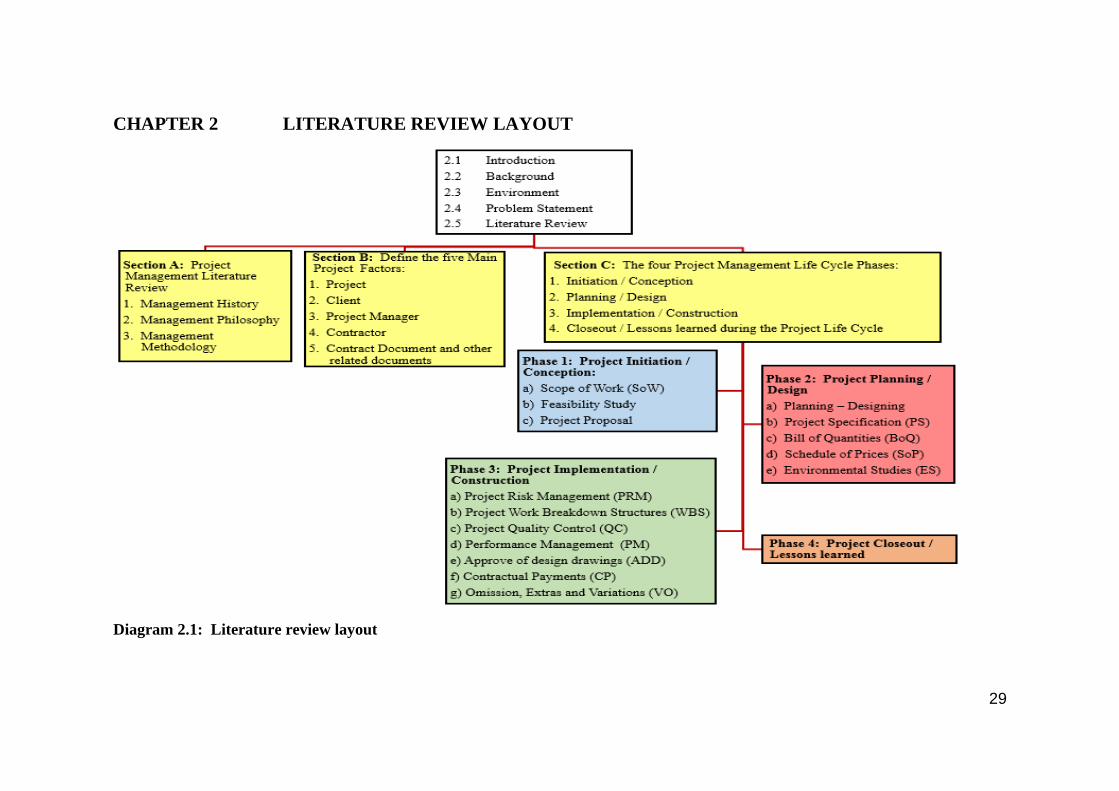
CHAPTER 2 LITERATURE REVIEW LAYOUT
Diagram 2.1: Literature review layout

30
2.1 INTRODUCTION
The first chapter introduced the research problem that poses the question whether
the project management methodology that is widely used, is adequate to ensure
successful project management implementation throughout a project life cycle.
This chapter will deal with the academic literature related to the research topic and
places it in the context of the research subject and research question. There has
been considerable debate in recent years about construction education with
reference to the delivery of a successful project. According to Haupt (2009a) there
is a disconnection between the academically qualified engineer and one with
experience in construction management.
The aim of this chapter is to provide a literature background and principles of
project and construction management and project life cycle phases. This will be
done to formulate a basis whereby the research methodology can explain and
implement the research question through the application of quantitative and
qualitative research procedures.
In addition to the above this chapter will also formulate the roadmap (chapter
layout) to guide the project manager/reader through the proposed project and
construction management processes to ensure a successful project completion and
delivery. This roadmap (Diagram 2.1, pp. 29) is a clear indication for any
engineer who intends to become a project manager of what is expected from him
regarding his experience and knowledge in order to execute his duties. Bennett
(1996) confirms that successful project managers tend to grow into their jobs over
an extended period. Project and construction management is a complex activity in
which uncertainty, intangibles and risk abound.
The literature review will cover the following sections:
Section A: History, philosophy and methodology of project management.
Section B: The project, client, project manager, contractor and contract
document.
31
Section C: The four phases of the project life cycle: initiation, planning,
implementation and closeout.
2.2 BACKGROUND
Project management methods have developed out of industry practices and
international standards to ensure an advanced and higher rate of success in the
construction and design industry.
IIincuta and Jergeas (2003) confirm that these methods are used effectively in
large organisations. However, when projects are implemented in the construction
environment, there is seldom an established method of project management or
skilled project mentors.
Ahadzie, Proverbs and Olomolaiye (2008) state during the past decades,
organisations have increasingly begun to adapt the project approach for
construction. Examples include planning and categorising a marketing drive for a
new development or product, upgrading the detailed planning of the project and
research and development (R&D) work. The rapid growth in the use of project
management techniques and principles is mainly due to the powerful management
tools available to the project manager.
2.3 THE PROJECT ENVIRONMENT
According to Ahadzie et al. (2008) the construction industry is one of the most
used examples of project-based industries. They characterise it as complex
because of cost, time and risk challenges. Because construction projects are
currently very dynamic and challenging, they draw capital, new technologies and
innovation, and also represent the largest sectors of the industry in most
developing economies of the world.
Managing a project successfully is a complex process; that may be the reason why
project management has generated significant amounts of literature. Project
success factors were first introduced by Rubin and Seeling (1967); Belassi and
32
Tukel (1996) as well as Nguyen, Ogunlana and Lan (2004). They agree that the
success factors have since been used frequently in project and construction
management literature.
Chan, Scott and Chan (2004) indicate that studies on project success factors are
valued as an important way to improve project effectiveness although there are
certainly various perceptions of project success. When defining project success,
researchers have considered different project boundaries from the perspectives of
different stakeholders. Rockart (1982) calls critical success factors a way to
prioritise project tasks as the project plan is being executed. Applying them will
ensure that all activities are completed to a high standard of quality and that
project goals are achieved.
Bryde and Robinson (2005) as well as Toor and Ogunlana (2009) claim that the
client is the main person in construction projects. This attracted a lot of attention
regarding project success, but resulted in little research being done from the
contractor’s perspective. The above-mentioned authors further state that the
relationship between the client and the contractor is the most important
requirement for successful projects.
Because of the diversity of opinions in this matter, this research will look at all the
role players’ views on success.
2.4 PROBLEM STATEMENT
This study will identify the effect of a lack of knowledge and experience in the
project life cycle domain affecting the critical success factors of project
management in the construction industry of South Africa.
According to the PMBOK Guide (2008) projects, provisional and short-term
activities are undertaken to meet exceptional goals and objectives within a defined
scope, budget and time zone. These typically occur throughout the life cycle of
various phases within a project. The project life cycle is a confined sequence of

33
activities to be executed so that the project’s goals can be reached and is managed
by various participants with different roles or responsibilities.
According to Pinto and Slevin (1989) there can be uncertainty when the success
or failure of a project is determined by the opinion of the stakeholders as each one
will have a different opinion.
The authors give two main reasons for this uncertainty:
• Firstly, “it is not clear how to measure project success because the parties
who are involved in the projects perceived project success or failure
differently as they evaluate project success differently” and according to
them will value the outcome differently.
• Secondly, Pinto and Slevin (1989) are of the opinion that although there are
several lists of factors generated, “they seem to tabulate individual factors
rather than grouping (ranking) them according to some criteria, to help
analyse the interaction between them and the possible consequences”. The
authors conclude by saying that it is usually a combination of many factors
at different stages of a project life cycle that will result in project success or
failure.
This chapter will assess Pinto and Slevin’s (1989) statement by discussing it in the
context of the literature about project and construction management. It will be
done in three Sections:
Section A: Project management literature review: Three stages.
Section B: Definition of five main factors in the project life cycle.
Section C: Review of the four project management life cycle phases.
LAYOUT OF ABOVE THREE SECTIONS:
2.5 SECTION A: Project management literature review
2.5.1: Literature review: Project management history.
2.5.2: Literature review: Project management philosophy.
34
2.5.3: Literature review: Project management methodology.
2.6 SECTION B: Definition of the five main factors in the project life
cycle
2.6.1: The project
2.6.2: The client
2.6.3: The project manager
2.6.4: The contractor
2.6.5: The contract document and other related documents
2.7 SECTION C: The four project management life cycle phases
2.7.1: Phase 1. Project initiation/conception
2.7.2: Phase 2. Project planning/design
2.7.3: Phase 3. Project implementation/construction
2.7.4: Phase 4. Project closeout/lessons learned during the project
life cycle.
2.5 SECTION A: Project management literature review
2.5.1 LITERATURE REVIEW: Project management history
2.5.1.1 INTRODUCTION
During the previous four decades a number of studies investigated project success
factors, in other words, those factors which led to the outcome of a successful
completion of the project, and in particular those that affected project success
more than others according to Baker, Murphy and Fisher (1983) and Pinto and
Slevin (1989).
Some of the first studies to present lists of critical success factors were undertaken
by Ashley, Lurie, and Jaselskis (1987). These authors identified the important
sequence of factors that can influence the success rate of complete construction
projects. Mengesha (2004) indicates that research into critical success factors has
been undertaken since 1967 and mentions that the development of information on
critical success factors was based on empirical and theoretical studies.
35
Ruben and Seeling, (1967); Cleland and King (1983); Pinto and Slevin (1987);
Tukel and Rom (1995); and Walid and Oya (1996) have the same opinion.
Several authors, Slevin and Pinto (1986); Morris and Hough (1987); Baker et al.
(1983) argue that success in a construction project can be evaluated only when the
evaluation dimensions are well-defined. Furthermore, in any project the
evaluation dimensions always correspond to the traditional constraints of time,
cost, and quality parameters.
Ashley et al. (1987) define project success as an outcome “better than expected or
normally observed in terms of quality, time, cost, safety and participant
satisfaction”.
2.5.1.2 THE PROJECT DELIVERABLES
Archibald (1976) argues that a project has a definable goal or purpose, as well as
well-defined end-times, deliverables or results, usually specified in terms of cost,
schedule and performance requirements.
Any project or development needs capital. Bennett (1995) classifies items such as
buildings, factories, offices, equipment, industrial development and infrastructural
development under the same topic.
Archibald (1976) concludes that the “producer” includes technical personnel to
produce designs and specifications to satisfy the client’s needs during the typical
pre-project negotiation phase. The total project cost and capital will remain a risk
factor, however depending on market investment and the Gross Domestic Product
(GDP) (2013) growth (IDC - SA Economic Overview report, 2013)
2.5.1.3 THE CONSTRUCTION INDUSTRIES
The construction industry can be characterised as complex, cost and time
consuming as well as uncertain and risky. However, construction projects are also
dynamic and challenging, which attracts capital, new technologies and brilliant

36
people with knowledge and experience. Housing and development projects in
particular represent one of the largest sectors of the construction industry in most
of the developing economies of the world (Ahadzie et al. (2008).
2.5.1.4 CAPITAL NEEDED
The South African economy is known as a highly attractive general business
prospect. In the IDC - SA Economic Overview report (2013) it forecasts an
economic growth of 2.7% to 3.2% year on year.
According to the Foreign Direct Investment (FDI) (2012) report documented in
the IDC - SA Economic Overview report (2013) and South African Reserve Bank
(SARB) there was a substantial economic turnaround resulting in an estimated
10.3% growth for 2012 as a whole. They reported that “South Africa thus
outperformed the rest of the African continent, for which estimates indicated a
4.8% increase in FDI”. According to Statistics South Africa (2013) published in
the Price Waterhouse Cooper (2013) report, there are more than 1.18 million
people employed in the construction industry either on a contract basis or
permanent basis.
The Industrial Development Corporation’s (IDC) report (2013) indicates that the
South African construction sector’s contribution to the Gross Domestic Product
(GDP) shows its impact on the sustainable economic growth of the country at any
given period of time, normally on a quarterly or annual basis.
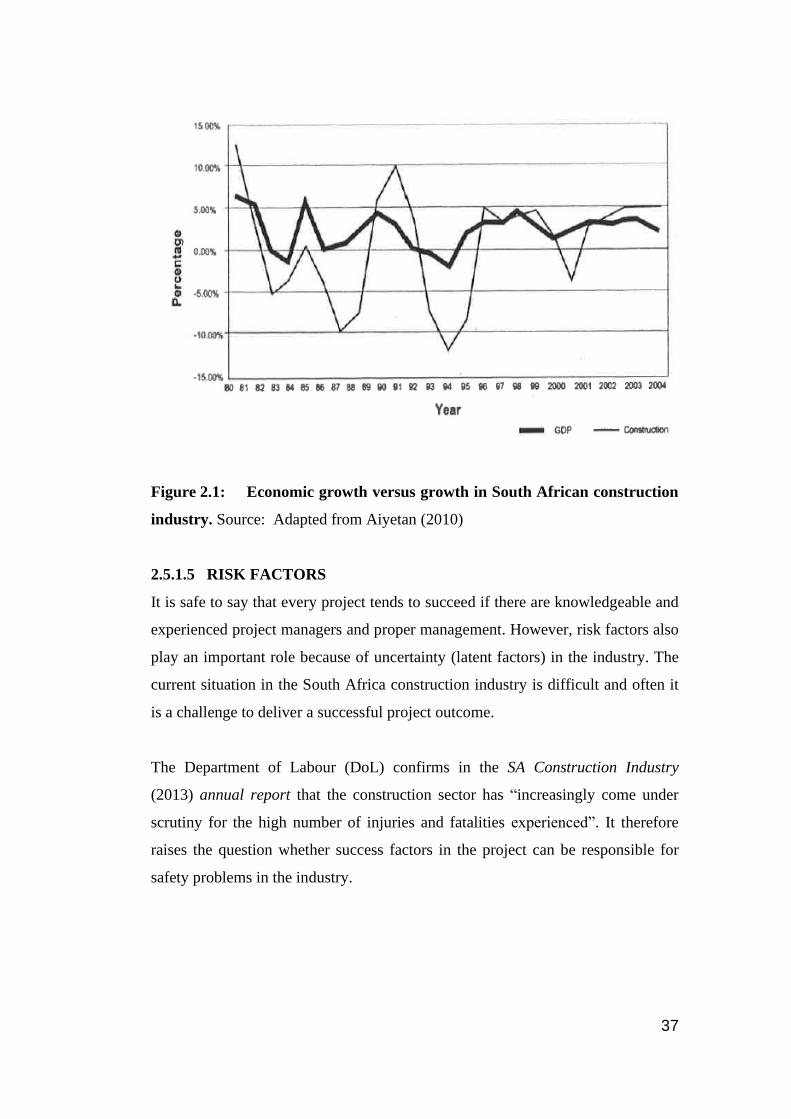
Fig.2.1 below shows the contributions of the construction industry to South
Africa’s GDP from 1980 to 2004. It is estimated to have been between 2% and
5% during that period. The growth leads one to assume that there is a strong
connection between the country’s economic growth and the contributions of the
construction industry.
37
Figure 2.1: Economic growth versus growth in South African construction
industry. Source: Adapted from Aiyetan (2010)
2.5.1.5 RISK FACTORS
It is safe to say that every project tends to succeed if there are knowledgeable and
experienced project managers and proper management. However, risk factors also
play an important role because of uncertainty (latent factors) in the industry. The
current situation in the South Africa construction industry is difficult and often it
is a challenge to deliver a successful project outcome.
The Department of Labour (DoL) confirms in the SA Construction Industry
(2013) annual report that the construction sector has “increasingly come under
scrutiny for the high number of injuries and fatalities experienced”. It therefore
raises the question whether success factors in the project can be responsible for
safety problems in the industry.

38
Relevant literature in the form of case studies performed or reviewed by
Manavazhia and Adhikarib (2002) as well as Chan and Kumaraswamy (2002)
indicates that construction projects are often completed with large cost overruns,
extended schedules and major quality concerns.
Extended time schedules are defined as the time overruns beyond the completion
date specified either in the contract or beyond the date that the parties agreed upon
for delivery of the project. Losses are the result of delays in the construction
industry and can affect many aspects of the project or even the entire project.
According to the above-mentioned authors the effects of delays include time
overruns, cost overruns, disputes, arbitration, litigation and total abandonment of
the project. Some studies have been done to investigate delays and attempt to
address these concerns, find their causes and suggest ways to avoid them.
(Baldwin and Manthel, 1971 and Assaf, Alkhalil and Al-Hazmi 1995).
Project management principles have not changed much over the years. History has
shown that since the 1950s most of the work on project and construction
management focused on project scheduling because it was assumed that better
scheduling techniques would result in better management and therefore in the
successful completion of projects. It was also assumed that a project was regarded
as a failure if the project completion time exceeded its due date, expenses overran
the budget, or outcomes did not satisfy the client’s predetermined performance
criteria. Today we know however, that determining whether a project is a success
or a failure is a more complex process.
Avots (1969); Balachandra and Raelin (1984); Bedell (1983); Hall (1980) and
Morgan and Soden (1979) argue that there are many other factors outside the
control of project management, which contribute to or even determine the success
or failure of a project. These factors are referred to as “critical success or failure
factors”. The above authors have also noticed that most of the studies on the
subject focus on the reasons for project failure rather than project success.
39
2.5.1.6 THE NEED FOR RESEARCH
Pinto and Slevin (1989) indicate that inadequate information in the scope of work
(SoW), incomplete or latent information in the specification or drawings, and
undefined and unclear goals and objectives have a major impact on the outcome
of a project and its success factors. It is the researcher’s opinion that this
statement is directly related to the research topic.
A project can be considered a success by the client but a failure by management if
the project outcomes do not meet management specifications. The reason for this
is that the various role players have different views of the success of the project
and therefore evaluate its outcome differently. Nguyen et al. (2004) argue that the
reason why the definitions of project success factors differ is that the opinion of
success is often dependent on the perspective the evaluator chooses when he or
she assess the project.
2.5.2 LITERATURE REVIEW: Project management philosophy
2.5.2.1 INTRODUCTION
Project management is the application of knowledge, skills, tools, and techniques
in order to meet the client and other role players’ needs and expectations
regarding the project. In many instances, the traditional organisational structures
or methods are not adequately accessible or even flexible enough and therefore
use of new advanced project management techniques may bridge this gap. New
management methods and tools are needed to cope with the current complexity of
project and construction management, the exponential expansion of knowledge
and the evolution of very competitive global markets. To remain competitive,
much attention must therefore be given to satisfying all participants.
The PMBOK Guide (2008) states that to be able to meet client and main role
players’ needs and expectations, project managers have to balance the following:
• Scope, time, cost, and quality;
• The vast difference in needs and expectations of participants and clients;
and

40
• Identified and unidentified requirements (expectations).
Thomas and Mullaly (2008) are of the opinion that extensive project management
research has already been accomplished in specialised developments such as
construction, engineering and technology. They further state that larger industry
sectors have already been able to increase the value of project development
practices by introducing formalised project and construction management
procedures.
Carden and Egan (2008) indicate in their study that the industry sectors are also
investigating whether these management practices can bring about improved
project success. According to them, management practices may have been
overlooked or ignored in the past because of a lack of knowledge. They base their
opinion of the fact that engineers and project managers have witnessed the results
achieved by project management, such as better utilisation of resources and the
application of work breakdown scheduling.
Thomas and Mullaly (2008) also state in their research that improved project
success can result in less professional and industrial distraction, which allow them
to concentrate on the outcome of a successful project. Thomas and Mullaly (2008)
also claim that industries such as civil, electrical and mechanical engineering
benefit from using project management methodology for developing projects and
delivering solutions for external and internal clients. The value of excellence in
project management for the control of project delivery and execution has been
acknowledged and has become a topic of research in the past few years.
2.5.2.2 THE CONSTRUCTION INDUSTRY
Projects encounter some rather unique challenges. Project roles are often assigned
to a minimum number of people in order to cut costs and frequently the project
manager is charged with the management as well as the physical execution of the
project.

41
Turner, Ledwith and Kelly (2008) argue in their research that organisations
generally adopt a non-bureaucratic method of conducting business. This is partly
due to their poor organisational structures. In light of the above, a combination of
the methods of the PMBOK Guide (2013) and Kerzner (1989) could be
advantageous in these situations. Indeed, Turner et al. (2008) see this as a
worthwhile topic for further investigation.
2.5.3 LITERATURE REVIEW: Project management methodology
(PMM)
2.5.3.1 INTRODUCTION
Construction projects are often in the news, occasionally because of problems
owing to cost overruns, safety and risk problems, quality standards and
insufficient supervision on site. A typical example is the collapse of the temporary
walkway bridge over the Grayston Road crossing on the N1 Highway between
Johannesburg and Pretoria on the 14th October 2015. An investigation into the
cause of the collapse is still in progress. There were two fatalities and nineteen
injured. Although many factors are mentioned after the collapse of bridge, many
questions may still arise such as labour, material or environmental factors, safety
risk matters, design and many more.
According to Cleland and King (1983) this method of practice can only work on
small construction projects that are less complex. It is therefore recommended
that on large projects, architects and contractors must stay in their specialised
domains of interest. Implementing a project management methodology (PMM) is
in itself a significant benefit in guiding the management of projects so that
deliverables meet the client’s needs and the required specification standards. For
the development of a deliverable, the implementation of a project life cycle model
is a complementary component of project management. Cleland and King (1983)
state that the project life cycle is a documented project application model. Project
managers/engineers should use the PMM process to ensure that they proceed in a
structured way by following certain principles and procedures on how to manage
a project.
42
2.5.3.2 DEFINITION OF PROJECT MANAGEMENT
The PMBOK Guide (2013) defines project management as “the application of
knowledge, skills, tools, and techniques to project activities to meet projects
requirements”.
Kerzner (1989) defines that project management is “the planning, organising,
directing and controlling of company resources for a relatively short-term
objective that has established complete specific goals and objectives”.
Silverman (1988) on the other hand, states that project management “is
characterised by the use of specialised control techniques”. Stuckenbruck (1981)
thinks that project and construction management must be appointed to a single
person who can take full responsibility for the success or failure of one of these
temporary undertakings.
According to Spinner (1981) the valid definition of the scope of work (SoW) is
the goal of meeting established objectives “in time, cost and technical results”.
2.5.3.3 PROJECT AND CONSTRUCTION MANAGEMENT SUCCESS
Project and construction management success is something that can be measured
during the course of the project life cycle and relates to the conventional criteria
of cost, time and quality. Cooke-Davis (2002); Han, Yusof, Ismail and Aun
(2012); Shenhar and Levy (1997) and Ika (2009) all claim that project
management success relates to internal as well as external actions and that project
success is more about the holistic view of a project. They also state that project
and construction management success requires new methods and tools.
According to de Wit (1988); Pinto and Slevin (1989) and Nguyen et al. (2004) a
specific measurement approach is needed in order to evaluate whether a project is
a success or a failure. De Wit (1988) is of the opinion that perceived success is
more important than real success.
43
These different opinions held by different authors make it clear that when a
project is evaluated, it is important to consider both objective and subjective
measurements to prevent possible confusing and misleading results. An
evaluation process is an individual process for each project due to the fact that
projects operate in different environments and cultures, that they differ in size and
procurement strategies and that each project has its own norms (Hughes, Tippett
and Thomas (2004) and Toor and Ogunlana (2009). Toor and Ogunlana (2009)
agree and state that the first reason for doing a project specific evaluation is that
each project has its own unique characteristics.
Researchers have to consider different boundary approaches and conditions for
each project evaluation study. They also state that there are different perceptions
of project success. Researchers often hesitate between two different perceptions,
namely the macro perspective described as the overall objectives of the project
and the micro perspective that concerns project success. The micro perspective
includes the different viewpoints of the individual stakeholders.
The above statement is further strengthened by the research of Chin (2012) which
states that to ensure successful completion, the components of the project
management methodology must include project and construction management
processes such as initiating, planning, executing and monitoring project progress.
Thornberry (1987) states in his research that project management is one of the
most challenging jobs in the industry for two reasons:
• Firstly, it requires management skills and abilities which are different from
those required in a traditional functional management position.
• Secondly, there is very little training support available to engineers moving
into a project and construction management position. This statement will be
reviewed in the research analysis in Chapter 3 and 4.
Kerzner (1992) states a qualified and experienced project manager is the key to
successful project execution.
44
Roberts and Biddle (1994) are of the opinion that the transition from purely
technical engineering to the role of project manager is often difficult and only
partially successful. Their research confirms the importance of postgraduate
management education for engineers to improve their managerial skills.
Inadequate postgraduate education in project management as well as a lack of
hands-on experience in project management can result in project failure.
Babcock (1978) believes in their research that the engineering manager is
distinguished from other managers by the fact that he or she has to possess both
the ability to apply engineering principles and the skills to delegate workers and
team players during the life cycle of projects.
He states that the engineer has to be qualified for two types of jobs:
• Managing of technical functions such as design and production; and
• Construction and project management.
Babcock (1978) further states that as engineers of various disciplines move higher
into management, they experience problems of managing technology and project
management.
Chatfield (2007) argues that project management has gained popularity over the
last decades as a distinct management concept used to drive not only projects
objectives, but also economic development, real estate development, event
planning and product development. This results in placing heavy emphasis on the
use of project management as a tool to optimise the rate of success.
2.5.3.4 THE PROJECT LEVEL
Projects are launched today for numerous reasons, e.g. to develop and construct
new buildings or to upgrade existing properties and developments. The question
of assessing the success of those projects has always been controversial and
dependent on the assessor’s point of view.

45
For Guterl (1994) project success is regarded as successful when it has come close
to achieving its budget and scheduling goals. Although this may seem appropriate
in the short term, it will not always be a sufficient long-term criterion of success.
In many cases a very troubled project suffering enormous delays and extensive
cost overruns can turn out to be a great success in years to come.
Shenhar, Levy and Dvir (2004) state that it is important to remember that client
satisfaction and meeting all requirements must be part of a project success
assessment. It is also important that assessors should consider the iron triangle
objectives of cost, time and quality/performance when measuring project success.
2.5.3.5 COMPONENTS OF A PROJECT ENVIRONMENT
Implementing the management processes as outlined in the proposed
methodology model is a challenge. Kerzner (1992, 2001 and 2003) states that
many project managers fail to recognise that project methodology is important to
ensure a successful project outcome. Standard procedures are often ignored in
order to meet impossible deadlines.
In this research, emphasis will therefore be placed on the fact that the process, if
followed, will accomplish the desired results.
The managerial team and client often follow their own methods without
considering standards and code of conduct procedures with disastrous results.
Baccarini (1999) states that managers must take some blame for unsuccessful
projects if proper actions were not taken and standards were not followed during
the execution of the project.
As indicated in the PMBOK Guide (2008) and the survey of Jugdev and Thomas
(2002), the project manager drives the project management process. The above
authors are of the opinion that the tools or documents are designed to monitor
personal commitments as well as to ensure that the project progresses according to

46
an accepted and approved plan. Approval of the project management plan is the
vehicle for accepting this commitment.
2.5.3.6 DEFINING PROJECT SUCCESS
Defining project success poses another challenge. In general project success can
be defined as the ability to meet the technical goals although care must be taken
not to deviate from the three constraints of scope, time and cost. The value of the
project as perceived by the stakeholders and the project team, according to
Kerzner (1992, 2001, 2003), will allow the performance of the project to be
assessed over and over. With this in mind, project success or failure can only be
effectively measured at the completion of the project.
The above statement corresponds with Baccarini’s (1999) definition of project
success. He is of the opinion that project success or failure can be measured by the
elements of the project life cycle methodology. Projects generally fail as a result
of poor planning due to constant changes in the scope, deadline and budget
funding, as well as a lack of site monitoring and control by the project manager.
Several other authors such as De Wit (1988), Pinto and Slevin (1988) and
Baccarini (1999) introduce ways of measuring project satisfaction regardless of
project scope, size or project duration:
1 Project delivery as per client’s desire or need.
2 Quality delivery as consistent with price.
3 Project completion within the timeframe stipulated by the customer.
4 Delivering the desired degree of feedback that the customer desires.
5 Having a system of conflict resolution that is fair to both the customer and
the development team.
2.5.3.7 PLANNING TECHNIQUES
Pinto and Mantel (1990) argue that the key to successful project management
entails proper planning and well-defined management disciplines.

47
According to the PMBOK Guide (2013) and Kerzner (1992) successful project
management must involve effective planning techniques as they will ensure
successful project execution.
The planning techniques consist of the following requirements:
1 The statement of work (SoW).
2 The project specification (PS).
3 The work breakdown structure (WBS).
2.5.3.8 THE IRON TRIANGLE THEORY
In order for a project to meet its objectives, it must comply with the so-called
“iron triangle” theory, according to which project success depends on “three main
pillars”, namely time, cost and quality/performance. Certain project related
procedures need to be put in place and followed through to monitor the processes
and progress of activities. These procedures will identify a series of activities
executed by selected role players and entities.
After conducting research on 650 projects, Baker, et al. (1983) decided that when
a project meets the project scope, the function to perform, the satisfaction among
all participants and the client, then the project is considered an overall success.
2.5.3.9 PROJECT EFFICIENCY: TIME, COST AND QUALITY
The time dimension measures express the efficiency with which the project has
been managed. It tells us how the project met its resources constraints, and
whether it was completed on time and within the specified budget and according
to other specifications. This immediate dimension is usually used for project
assessment during execution and right after completion.
Wheelwright and Clark (1992) argue that, although meeting time and budget
(cost) constraints can indicate a well-managed, efficient project, it may not prove
that this project was successful in the long term or that the organisation has
benefited in the longer term. On the other hand, with increased competition and
48
shorter project life cycles, time to construct (i.e. time from initial concept to
completion) becomes a critical competitive component which could affect the
project cost in the second dimension. It is therefore crucial that improved project
efficiency should be seen as adding to project competitiveness.
2.5.3.10 MEETING THE CUSTOMER’S NEEDS
The third dimension of the iron triangle which is quality refers to the customer’s
needs. Wheelwright and Clark (1992) indicate that this dimension addresses the
importance of a customer’s requirements and meeting the customer’s needs.
The following also play a major role in the third dimension or constraint of the
triangle: meeting performance standards, functional requirements, and technical
specifications (quality). These elements are part of the third dimension of the iron
triangle and not, as is commonly assumed, part of meeting the project plan. It is
important to the customer that performance objectives and quality are met because
the customer is the best person to assess whether the mission has served her or his
needs. Within this framework, meeting performance objectives is one of the
central elements of meeting the client’s needs and scope of work.
2.5.3.11 QUALITY MANAGEMENT (QM)
Quality in the context means that it implies specifications or needs have been met.
The project team can be competitive when they are aware of the needs of the
client and agree that the client’s expectations will be met on a consistent basis.
Wheeler and Chambers (1992) argue that meeting specifications is not always
sufficient however clients who are leaders in their field expect cutting-edge
planning, service delivery, meeting time, cost and quality specifications and being
on target with minimum variance. It is important to understand that specifications
alone cannot ensure that the client will be satisfied with the result or that the
contractor will receive gratitude or repeat business from the client.
49
Yourdan (1998) argues that a quality project is one that mostly satisfies the
client’s requirements. He is of the opinion that devoting too much attention to
any particular section (by, for instance, eliminating all defects) may prevent the
contractor from fulfilling other requirements that are more important. Good
project estimation is therefore important as it will ensure the successful
development of structures of satisfactory quality.
SECTION B: Definition of the five main factors in the project life cycle
2.6.1 THE PROJECT
2.6.1.1 INTRODUCTION
A project is defined as a process or development requested by a client. This
definition makes it clear that understanding the project requirements right from
the start is necessary if the needs of the client are to be satisfied.
Frame (1987) states that the main task of defining the client’s needs in a project
and its requirements is to perform a feasibility analysis, do a high-level
requirements analysis, determine start and end dates of the project and do a design
review. This exercise will reflect the needs and desires of the client, as well as
those of management, project members and stakeholders. Meredith and Mantel
(1995) define a project as a “specific, pre-determined task, usually a one-time
activity with a well-defined set of desired outcomes that must be achieved”.
Wysocki, Beck and Crane (2000) describe a project as a series of unique, multi-
faceted and connected activities having one goal in mind. It must also be
completed by a specific time, within budget, and according to specifications.
Finally, the project must reflect the needs and desires of the management,
stakeholders and the clients of the project or development.
Projects differ from a routine set of activities or daily operations. Meredith and
Mantel (2000) describe a project as a continuous process with a planned end.
50
Projects are characterised by general attributes such as purpose, life cycle,
uniqueness, interdependency and conflict.
According to Merna and Al-Thani (2008) a project is a unique and diverse
investment of resources to achieve specific objectives in order to make a profit or
to provide a service for a community. They define a project as an irreversible
change with a life cycle and defined start and completion dates.
2.6.1.2 PROJECT DIVERSITY CRITERIA
The construction industry is an accumulation of diverse segments of activities.
Project success can therefore be seen as meeting the required expectations of the
stakeholders or clients and achieving its intended purpose.
According to Archibald (1976) this can be achieved by understanding the
outcome and deliverables of the project. For a project to be successful, it is
essential to understand the required scope of work (SoW) of the project right from
the start and to have a defined project plan. The SoW provides the right
framework to facilitate successful project completion.
This topic, scope of work will be discussed in more detail in the first section of
Section C of this chapter under 2.7.1 (a) Contract scope of work (SoW).
2.6.1.3 SUCCESS CRITERIA
Other authors base success criteria on the fact that different stakeholders perceive
success differently. Stuckenbruck (1986) states that relevant success criteria must
represent different views, since construction projects involve many different
stakeholders, such as clients, managers, contractors, workers, suppliers, and end-
users.
Bryde and Robinson (2005) are of the opinion that different views of success
criteria between contractors and clients delay an effective working relationship.
They state that contractors put more effort into reducing costs and time, whereas
51
the client considers satisfying the needs of the other stakeholders as more
important. The view of the client has attracted more attention than other
stakeholders, because the client is often considered as the main person in a
construction project.
Frödell, Josephson and Lindahl (2008) explored the client’s perspective on
success criteria and state that different clients have different interests.
Consequently, they suggest that measurement of project success should be based
on different groupings of client types.
Sanvido, Grobler, Parfitt, Guvenis and Coyle (1992) reviewed literature and
grouped success criteria into the different perspectives of client, designer and
contractor. From these groupings they were able to identify certain common as
well as unique criteria for all perspectives. The designer’s desire to improve
professional development and professional satisfaction, the contractor’s concern
for safety and the client’s interest in knowing that the constructed project will
function as intended, are all examples of unique success criteria.
2.6.1.4 PROJECT SUCCESS CRITERIA
Cooke-Davis (2002) and Han et al. (2012) argue that in order to understand
project success, it is important to distinguish the difference between project
success and project management success. As mentioned by various authors,
project success can be measured only after completion of the project and refers to
the overall objective of the project.
Baccarini (1999) is of the opinion that product success is a component of project
management. Therefore, project success is defined as the “effects” of the project’s
final product.
Stuckenbruck (1986) defines project success as the effect of the project’s final
outcome. According to Stuckenbruck (1986) the most appropriate time to evaluate
a project is after completion. However, this is seldom done because contractors
52
consider a completed project as the end of construction. In addition, the project
and construction managers tend to ignore this evaluation process because they are
of the opinion that new projects are far more interesting and important than the
current completed project. Stuckenbruck further argues that this view results in a
huge loss as knowledge and experience is not gained from the projects, regardless
of whether it ended in a failure or as a success.
For Pinto and Mantel (1990) the key to project success is comprehensive
planning. While the topic of planning is wide and far ranging, this section is
intended as an introduction to some of the fundamentals in the project planning
process.
Pinto and Mantel (1990) define project success according to three different
dimensions:
a) The efficiency of the implementation process is “an internally oriented
measure of the performance of the project team, including such criteria as
staying on schedule, staying on budget, meeting the technical goals of the
project, and maintaining smooth working relationships within the team and
parent organisations”.
b) Project success is the perceived quality of the project including the project
team’s perception of the value and usefulness of the project deliverables.
c) The client’s satisfaction or an external performance measure of the project
team’s performance on the project outcome is also regarded as important for
project success.
Atkinson (1999) is of the opinion that project success criteria are something that
projects can be measured against. Sanvido et al. (1992) claim that success criteria
point to the expectations of the project and expectations dependent on
stakeholders, scope of services, project size, technological implications and other
factors.

53
Atkinson (1999) has found that most project managers only use the iron triangle
as criteria for measuring success, something he regards as an incomplete
definition of project management. He feels that this definition of success criteria
can and does result in a biased measurement of project success and can be seen as
negative or positive. He adds that in many cases a project can be perceived as
unsuccessful even though the known success criteria were met. Therefore he feels
that the iron triangle does not consider how well the project is used by the client
or perceived by the stakeholders. Atkinson (1999) further states that if the
stakeholders continue to use an incomplete set of success criteria, it would result
in repeated failures. He therefore considers the following as additional criteria for
a successful project: the technical strength of the resultant system, the benefits to
the organisation and the benefits to the wider participant community.
Lim and Mohammed (1999) classify the perspectives of project success into two
categories: the macro and micro viewpoints.
1 In the macro viewpoint, the question must be asked if the requested project
concept has been achieved. If so, the project should be considered
successful. If not, the project should be considered as less successful or even
a failure. The question can only be answered in the functioning phase after
the construction of the project and generally it is the client, users,
participants and the general public who look at project success from this
point of view.
2 The micro viewpoint is the smaller components of the project and here the
conclusion of the construction phase and concerns of the construction
parties are considered. Lim and Mohammed (1999) suggest completion and
satisfaction as criteria for the micro viewpoint, completion and satisfaction
representing two sets of criteria for determining project success. It is
important to realise that the criteria that have to do with completion will
vary, depending on the viewpoint of the evaluator. From the micro point of
view, completion typically involves the contractor’s concerns and the
manner in which he considers achieving his or her own project objectives,
54
such as time, cost, quality, performance and safety. Lim and Mohammed
(1999) further state that the criteria that involve satisfaction have to do with
the users’ perceived success of the project. Here the finished project is
typically assessed by its appearance and according to its acceptance.
2.6.1.5 SUCCESS CRITERIA FOR PROJECT MANAGEMENT
Project and construction management success can be measured over the project
life cycle as a whole but also relates to cost, time and quality (Cooke-Davies,
2002; Han et al. 2012). With this in mind, de Wit (1988) states that project
management success is not required in order to achieve project success and the
other way around.
Arguments by Shenhar and Levy (1997) and Ika (2009) contradict the previous
statement. They claim that project management success relates to internal actions
and a holistic view of the project. All of the above implies that project
management success is necessary in order to achieve project success, which
means that the latter cannot be accomplished without the former.
Pinto and Slevin (1989); Nguyen et al. (2004) and de Wit (1988) all emphasise
that perceived success is more important than the real success.
Stuckenbruck (1986) is of the opinion that top management and clients are the
most important stakeholders and that this is something that the project and
construction manager has to consider very seriously.
It is clear that there is no fixed definition for project success. Therefore, people
choose to define project success depending on various preferences and values.

55
2.6.2 THE CLIENT
2.6.2.1 INTRODUCTION
The new development process starts with the search for ideas.
Hippel (1986) argues that developers and engineering companies should state how
much effort should be devoted to developing breakthrough ideas on project
development, modifying and renovating existing developments, as well as
copying competitors’ projects. He continues that the marketing development
concept holds that client needs and wants is the logical place to start the search for
ideas. Hippel (1986) has shown that the highest percentage of ideas for new
industrial projects originate with clients. A company can define its target market
successfully but fail to correctly understand the customers’ needs.
Hamel and Prahalad (1994) state that it is not always easy to understand the
client’s needs and wants because some clients are not fully aware of what they
need due to lack of knowledge. Product success entails satisfying the client and
stakeholder’s needs relating to the project goal and purpose (Shenhar, Levy and
Dvir 2004).
PMI (2004) and International Standardisation Organisation (ISO) (2004) advise
that when different stakeholders have conflicting needs and expectations,
differences should be resolved in favour of the client. Wideman (2005) argues that
the real measure of project success should be client satisfaction.
Jenkins (1976) suggests a concept or model that addresses all the relevant needs
of the client. His model includes the following:
1 Needs identification and conceptual design.
2 Design and feasibility analysis to cover the scope of work.
3 Detailed development construction plan.
4 Commissioning closeout of the project.
The client’s satisfaction or an external performance measure for the project is
defined by Au and Hendrickson (1985) as follows:

56
1 A project must meet market demands or needs in a well-timed manner.
2 In order to select the best possible approach during the conceptual planning
stage, the technical and economic feasibility alternatives must be assessed
and compared with alternative options to ensure that the scope of work will
meet the client’s requirements.
3 A detailed feasibility study, engineering design and a detailed cost estimate
will also help to satisfy the client’s needs.
4 A work breakdown structure for the proposed project must be implemented
to involve the client from the initial stage of the project.
5 After the construction is completed, there is usually a brief period of start-up
or hand-over.
2.6.2.2 THE CLIENT’S EXPOSURE TO THE PROJECT
Hamel and Prahalad (1994) state the client usually does not have sufficient
technical knowledge to enable him or her to specify the work to be done. The
client therefore employs an engineer/project manager or consulting company to
advise him or her and to prepare the implementation process. This first meeting
between the client and the consulting company may take a high level approach
and certain criteria of agreements may be approved and noted. The client should
be involved in all decisions right from the initial stage of the project.
2.6.2.3 IDENTIFYING THE CLIENT’S NEEDS
Cooper (1998) presents a methodology to identify the client’s needs. He is of the
opinion that a little structure goes a long way in facilitating an effective project
development process.
He formulates the following four important steps to ensure that the needs of the
client will be met:
• Define the scope and purpose of the project.
• Gather and interpret raw data from the customer in order to meet the
customer’s needs.

57
• Categorise the needs into a chain of command of primary, secondary, and (if
necessary) tertiary needs.
• Create a list of relative priority of the needs.
Hamel and Prahalad (1994) argue that identifying the client’s needs for more
detail is a process of evaluating concepts with respect to the customer’s needs and
other criteria. The evaluation of needs to compare the relative strengths and
weaknesses of the various design concepts and a selection of one or more
concepts will be further investigated. Design concept selection is the activity in
which various ideas and stated needs are drawn together into one preferred design
concept.
According to Hanan (1993) development design usually requires several iterations
and refinement within design proposal phases. Thorough planning at this stage
will, however, ensure that the client and the design engineer are both on the same
level of understanding regarding the project and the scope of work.
2.6.2.4 CLIENT PARTICIPATION IN PROCUREMENT INVOLVEMENT
The successful outcome of client participation will finally form the basis of the
contract of conditions (CoC), which will include the bill of quantities (BoQ) that
will cover the full scope of works (SoW). This will result in a signed contract
agreement between the various parties. It is imperative that the client take part in
the preparation and the layout of the procurement process as it will encompass the
three above-mentioned documents.
This topic will be furthered reviewed under Section B: “The contract document”.
2.6.3 THE PROJECT AND CONSTRUCTION MANAGER
2.6.3.1 INTRODUCTION
Meredith and Mantel (1995) describe the project manager as a generalist with an
excellent background of experience and knowledge. The project manager must
oversee many functional areas, each with its own specialists and role-players. He
58
or she therefore has to have the ability to put many pieces together to form a
coherent whole. In other words, a project and construction manager must have
people skills and site experience as well as knowledge in various fields whereas
the functional manager must be skilled at analysis.
Pinkerton (2003) suggests that the competencies of the individual role players
should be grouped to achieve the objectives of the project. A functional manager
uses an analytic approach while a project and construction manager uses a
systems approach.
Belassi and Tukel (1996) state in their research that the project manager is in fact
one of the key participants in a construction project and his competence and vast
experience is a critical factor that affects project planning, scheduling and
communication.
Chua, Kog and Loh (1999) state variables under this factor consist of the project
manager’s skills, commitment, competence, experience and authority. All of these
are of immense value to ensure a successful completion of the project.
The Project Management Institute (PMI, 2008) makes the following statement:
“For a project to be successful the project manager must have the requisite
knowledge of project management, which is defined as the planning, organisation,
monitoring and control of all aspects of a project and the motivation of all
involved to achieve project objectives safely and within defined time, cost and
performance”. The project manager is responsible for managing projects,
structures and developments using a project management methodology
hypothesis.
The project and construction manager also follows a project development life
cycle methodology as specified by PMBOK Guide (2013). This model emphasises
the following project phases: initiation / concept, planning / feasibility,
implementation / construction and the closeout of the project.
59
Before any effective work on a project can commence, five main “role players”
need to be involved in the project life cycle: the project, client, project manager,
contractor and the contract conditions. It is therefore vital to select a suitable,
experienced and competent project and construction manager to lead the project
from start to finish. The project manager’s role commences at the project
initiation stage and continues until completion of the entire project.
This will be reviewed in more detail in Section C, item 2.7.1(a) “Contract scope
of work (SoW)”.
2.6.3.2 THE PROJECT MANAGER’S SKILLS
An important trait of good project and construction manager is training skills.
Babcock (1978); Badawy (1983) and Cleland and King (1983) agree that a project
manager needs a certain number of technical skills, traits and knowledge. They
further argue that these traits are based upon suitable training, diverse
management experience (technical and business), good interpersonal skills,
integrity, honesty, patience, an understanding of what is required of a project
manager and knowledge of processes with a quality orientation. These traits
should also be developed in team members in order to keep them motivated.
Raudsepp (1983) argues that the project manager should be a visionary who
focuses on delivering of a successful project. The project manager plays an
important role in the environment by showing his diversity in project
management. He or she must be enthusiastic, decisive and dedicated, have self–
confidence and be willing to lead by taking a stand. The project manager should
further have a broad range of skills and tools to deal effectively with the
complexities of project and construction management.
2.6.3.3 THE PROJECT MANAGER AS MENTOR
A project and construction manager must have the willingness to teach or mentor
team members through role modelling and providing on-the-job-training. The
project manager must also be willing to accept the status quo with an open mind.

60
Badawy (1983) states that the project manager should also be fully committed to
develop the project team players. Good project managers are people who are not
concerned about their own careers but rather about the careers of those who work
with him as a team. The industry puts great value on the ability of individuals to
work in teams.
O’Connor (1994) therefore argues that competitiveness should not be centred on
individuals but on the teams working together to complete the project. This means
that the project manager as a mentor must have maturity of judgement besides
being strong and steady and not influenced by the impulses or aggressiveness of
individual team players.
Project management is an ongoing process that spans the entire project life cycle,
and it is important to accept that the aptitudes, characteristics and abilities
outlined above are crucial.
For this reason the researcher will design a questionnaire to determine the level of
the engineer’s practical experience and his ability to measure and resolve design,
project and construction related problems on a daily basis in order to avoid delays
throughout the life cycle phases of the project. This will also enable the project
manager to identify the shortcomings of his team and to mentor accordingly.
2.6.3.4 COMPETENT PROJECT MANAGERS
A lack of experience and understanding can cause a project and construction
manager to fail in his duty as a manager. Thornberry (1987) asks the following
questions: “Who is competent to be a project manager? Are technical skills
important? How about conceptual skills? Does it mean that the project manager’s
management skills increase, the need for technical competence decreases while
the importance of taking a holistic view increases? Does it mean that he must have
the ability to see the whole rather than a part and to be able to explain or
demonstrate in simple terms to an individual?”
61
All areas are important, interrelating and necessary for a project to be completed
successfully.
2.6.3.5 PROJECT MANAGER’S PERFORMANCE
Drucker (1954) claims that project performance can be measured very easily. The
project must meet the requirements, the time schedule, and the estimated budgeted
costs in order to deliver a successful project to the members and clients. Shannon
(1980) argues that performance is a function of commitment and the completion
or non-completion of the tasks can be used to show the measure of dedication that
went into the project. To measure the project manager’s performance one needs to
know where time was invested and what was accomplished during the project life
cycle time, which includes the cost, time and quality of the performance to meet
or not to meet the final needs of the client.
Performance can be increased significantly if everyone participates in an incentive
programme. This will include excellent quality control and service objectives. A
project objective reflects the needs and desires of management, project
participants and clients of the end product.
2.6.3.6 THE PROJECT MANAGER’S RESPONSIBILITIES
The project and construction manager is responsible for defining the most cost-
effective task, bringing together and motivating his team to develop the clients’
needs.
Archibald (1976) made the following comments:
• The project must be divided into specific tasks which are called the work
breakdown structure (WBS).
• Specific tasks must be assigned to specific members of the project team.
• Communication, negotiation, interaction with other people (especially role
players), and monitoring the development during the life cycle of the
project, are important for a successful outcome of the project.

62
• The main assignment of the project manager is to deliver the project within
the scheduled time and budget, and in accordance with the technical
specifications as specified in the contract of conditions.
• It is the duty of the project manager to solve project related problems on a
daily-basis in order to avoid delays.
• He also has to deal with crises and resolve conflicts, suggest alternatives and
make recommendations when objectives cannot be achieved.
According to Archibald (1976) the project manager must stay in touch with all his
team players, clients, stakeholders, management and the main contractor in order
to avoid unaddressed or latent problems. The project manager must also be a
skilled representative, negotiator, liaison person and partner during the life cycle
of the project.
In view of these demands, development of project management skills is perhaps
one of the most important investments that the client or company can make.
2.6.3.7 THE PROJECT MANAGER AS A GENERALIST The project and construction manager oversees the work of many functional areas.
Meredith and Mantel (1995) are of the opinion that the project manager cannot be
an expert in all of the various areas. Firstly, the project manager is usually more of
a generalist than a specialist as would be the case with a functional manager.
Secondly, the role of the project manager is primarily that of a facilitator.
According to Meredith and Mantel (1995) the project manager’s role and
responsibilities can be divided into three categories:
1 The corporate company/client.
2 The project (his main responsibility).
3 The project team members.
63
2.6.4 THE CONTRACTOR
2.6.4.1 INTRODUCTION
The Collins Concise Dictionary (2001) defines that “a contractor is a person or
firm that undertakes a contract to provide materials or labour to perform a service
or do a job”.
2.6.4.2 THE CONTRACTOR’S DUTIES
The duties of the contractor consist of delivering the project according to the
client’s requirements (needs) as specified within the conditions of the contract
(CoC), scope of work (SoW), and bill of quantities (BoQ). During the initial
meeting the specification of delivering the objectives within time, cost and quality
constraints will be defined.
Biggs, Birks and Atkins (1980) argue that the SoW is the most important factor
besides cost and schedules and project performance should depend on how well
the project meets the technical design and specification requirements as the client
seeks to retain some measure of control over any contracted work. The main
contractor may subcontract various parts of the project works, and will be
responsible for their performance as well, and therefore will co-ordinate the work
of all the subcontractors and suppliers of material or equipment plant accordingly.
Bockrath (1986) and Hirsch (1986) emphasise the importance of the contractor’s
knowledge of the detailed drawings and their interpretation. Subcontractors or
material suppliers often have the task to prepare these drawings, and a good
example is reinforcing steel drawings that show fabrication and installation details
beyond those provided by the design engineer. Bockrath (1986) is of the opinion
that it must be clearly stated in the contract that the client/representative/project
manager must approve all drawings prior to manufacturing according to the
design specifications. Even in the best of all projects there will be unknown
factors hidden within the project sites and waiting to be disclosed.
This statement will be contested during the case studies analysis in chapter 4.
64
2.6.4.3 HEALTH AND SAFETY
Firstly, it is the duty and responsibility of the main contractor to implement a
health and safety plan to comply with local governmental general standards as
well as those of the Occupational Health and Safety Act and Amendments (2014)
of the Department of Labour as related to construction conditions on site and to
ensure that all persons on site comply with the regulations. Secondly, it needs to
be remembered that no two clients or contractors are the same, also regarding the
interpretation of and adherence to health and safety regulations. However, it must
be clear to all on site that safety regulations apply to all in spite of differing
viewpoints about the matter.
2.6.5 THE CONTRACT DOCUMENT
2.6.5.1 INTRODUCTION
During the initial stage of the project the client should develop the procurement
strategy (PS) of the project in consultation with the project manager (PM) and the
design team (DT). This decision requires consideration of the objectives of the
project, and can vary from project to project. There are many types of
procurement strategies; for the purpose of this research, we will review four types
below (item 2.6.5.6).
2.6.5.2 DEFINE THE CONTRACT
Lynden, Reitzel and Roberts (1985) define a contract as “a promise or set of
promises for the breach of which the law gives a remedy or the performance of
which the law in some way recognises as a duty”.
Vaughn (1983) suggests that “a contract is an agreement enforceable at law” and
must meet certain requirements such as:
1 All parties concerned must be competent to enter into the contract.
2 The agreement between the parties must consist of an offer and an
acceptance.
3 The contract must be correct and well understood by all parties involved.
4 The agreement must be in the correct form and layout.
65
5 Both the client and the contractor have an obligation towards the project.
The contractor’s obligation is to meet the contract conditions and the
client’s needs. The client obligations are to ensure performance payment
when it is due.
The study of Sweet (1989) points out two attributes of such contracts that set them
apart from ordinary commercial contracts. Firstly, it is often the case that clients
are relatively inexperienced in such contractual matters and should be instructed
by qualified people in this regard. Secondly, the initial phase of the contract
formation is often rather vague and informal, something which can cause major
problems at a later stage in the project cycle.
2.6.5.3 DRAFTING THE CONDITIONS OF THE CONTRACT
The document, to which the parties agree and sign, certifies that the contract is
sealed between the parties and becomes a legal contract agreement with terms and
conditions (called a contract under seal). A contract under hand merely recites the
names of the parties including in some cases, the sureties, and set out the terms of
the agreement by which the contractor agrees to perform all the work in
accordance with the relevant documentation, drawings and standards. It is a
“simple contract”, but also signed by all parties involved.
Drafting the conditions of the contract (CoC) is normally the work of the client’s
lawyer, the engineer merely giving such assistance on technical matters as the
lawyer may require. However, the engineer’s main concern is the preparation of
the drawings, specifications and bill of quantities (BoQ) and other relevant
documents and supervising the construction after the work has commenced. The
engineer wants to seek clauses in the conditions of the contract (CoC) that will
enable him to deal with any difficulties which may arise during the contract
execution.

66
2.6.5.4 CONDITIONS OF THE CONTRACT (CoC)
Conditions of contract (CoC) covers important items and secure a base upon
which the entire project’s scope of work (SoW) is founded. The drawings will
show the complete layout of all work activities, as well as all measurements and
the construction workmanship indicated in the specifications and SoW. The bill of
quantities (BoQ) describes all materials and related quantities with related time,
cost, labour and equipment machinery rates.
Sweet (1989) emphasises that the conditions of the contract lays down in detail
the relations between the client, the engineer/project manager and the contractor,
from the moment the agreement is accepted.
2.6.5.5 CONTRACT RELATED DOCUMENTS (CRD)
The contract document also accommodates the following documents and
conditions of importance: feasibility studies (FS), environmental studies (ES),
financial progress payments (FPP), variation orders (VOs’) procedures, work
breakdown structures (WBS), project monitoring and controlling (PMC),
statement of work (SoW), contractors’ aptitude and capability to execute the
project, health and safety management plan (HS), risk management plan (RMP),
procurement and tender procedures (PTP) and project quality control (PQC). All
these and many more are required to ensure that the appropriate project life cycle
methodology will be followed and the client’s conditions of time, cost and quality
will be met, in other words, that the project will be successfully completed.
The above conditions of contract (CoC) and project deliverables will be discussed
in more detail in Section C: Project life cycle.
2.6.5.6 TYPES OF CONTRACTS
In this research four well-known project procurement methods will be reviewed
because they are of the four main factors in the project life cycle domain. The
finer detail of the project procurement strategy, conditions of contract will be
explored in more detail in Section C: 2.7.2 Project planning and design.
67
In the early stages of the project, the client should develop the procurement
strategy for the project in consultation with the project manager and the design
team. This has to be done with an eye to the objectives of the project and will vary
from project to project.
According to Hirsch (1986) the client must retain some measure of control over
any contracted work. The contract should clearly specify the areas of the project
over which the project and construction manager has ultimate authority (on behalf
of the client) for supervision and decision-making, and also for tracking project
progress.
There are many types of procurement strategies of which four will be discussed
briefly as this is not the focus of this research.
A Traditional methods
When this strategy is followed, according to Gordon (1994), the design is
finalised before the tender process commences. This type of contract gives the
client a great deal of control over quality, specifications and cost. However, the
timescale may have to be changed to be able to complete the project. The client
carries the risk in terms of the consultant’s design and any unforeseen items, such
as ground conditions, and also cannot benefit from the contractor’s input on
building ability, as he or she is only brought in once the design has been
completed.
As the contractor has no responsibility for the design, the client or project
manager is responsible for any mistakes or omissions in the design. Although
some risk is shared with the contractor the majority of the risk is taken by the
client/project manager.
Cook and Williams (1998) argue that the traditional procurement approach is a
good method provided that:

68
• The design is completed before the tender stage, as this will ensure that the
client knows the cost of the project.
• The design does not change substantially during construction as this will
cause delays and disruption.
• The designer understands how the construction will be carried out, as this
will ensure the practical execution of the project.
Advantages: The client/project manager maintains control of the quality and
specifications of the project.
Disadvantages: The client/project manager is responsible for any risk as there are
usually little or no interaction between the design team and the contractor.
B Design and build
This strategy transfers the risk to the contractor at a much earlier stage in the
project. There are various sub-types of design and build; however, the basic
parameters remain the same. The contractor becomes responsible for completing
the design and construction of the project at a certain point of time for a fixed
amount. Cost is achieved at an early stage and therefore offers the client a high
level of certainty. The client’s design team designs the project to the first design
proposal stage. At this point, the project is tendered in either a single or a two-
stage process, and risk is transferred to the contractor who becomes responsible
for the design and construction from that point onward. The design team is for all
purposes unrelated to the contractor and the client no longer has any control over
them. Most project managers choose to retain the services of a quantity surveyor
(QS) so that some control can be maintained over project costs expenses.
Ndekugri and Turner (1994) state that the contractor must provide a fixed price
based on the client’s requirements document which can range from a simple
accommodation schedule (for a basic project) to a fully worked out design.
Adequate time must be allowed for the client’s proposals to be prepared,
including completed layout data sheets. After signing the contract, the contractor
assumes responsibility for developing the design in accordance with the client’s

69
requirements. If the client requires any changes during the work, they are
controlled by the contractor. Additional costs are the responsibility of the client.
It is the responsibility of the client to ensure that the tender adequately describes
the extent of the development and scope of the work (SoW). It must be
remembered that no changes will be accommodated during the construction stage
unless there is a validated reason. It is also suggested that the client’s concept of
design and SoW be clearly defined within the contract agreement. The bill of
quantities (BoQ) price schedules must include all related design and building
costs including the execution of all construction in compliance with related design
and building, construction and professional code of conduct standards. The
contract price must include all related services, material, labour, equipment, tools,
health and safety supervision and accidental insurance cover.
Ndekugri and Turner’s (1994) survey confirm that time and cost savings appear to
be the main reason why clients select this procurement strategy. The authors are
of the opinion that this strategy provides better value for money, particularly
where the time of completion is of the essence.
Advantages: The contractor takes the risk.
Disadvantages: The client is usually not much involved with the project and the
end product may not meet his or her expectations according to Barrie and Paulson
(1992). These authors also think that this strategy provides better value for money,
particularly where the time of completion is of the essence.
C Management contracting
Here the contracting organisation manages the project.
The construction management and the design team are direct in contact with the
client (Naoum and Langford (1987). The contractor selects and appoints his team
on a competitive basis (usually on a fixed price) as the design develops.

70
Where speed and control of quality are of paramount importance, a management
contract may be an acceptable choice. In this instance, the design team has the
responsibility for the design of the whole project but the contractor is responsible
for defining the packages of work and then arranging for these to be carried out
through separated trades or works contracts. The advantage of this strategy is
time, as the detailed design can be developed in parallel with the construction
works and an early start can be made on site. Design changes can be done during
the course of the works but only where these will not affect the work packages
that have already been assigned.
Barrie and Paulson (1992) claim the disadvantage of this approach is that the
client does not have cost certainty until the final package has been assigned. This
strategy is therefore often considered risky for the client. The client retains control
and responsibility for the design and therefore, if the design is not fully co-
ordinated and the design team fails to produce information on time, virtually all
risks remain with the client throughout the entire project. There is no risk transfer
to the contractor. Whilst this option is suited to projects where it is not viable to
complete the design prior to commencing work on site, this high level of risk is an
unpopular option.
Barrie and Paulson (1992) also argue that the construction manager does not
usually guarantee either the overall price or the quality of the work.
Advantage: The client/project manager has full control of the design aspects of
the project. This strategy is a viable possibility in the case of shorter programmes.
Disadvantage: There is no transfer of risk to the contractor and the client carries a
high risk if the design is not fully co-ordinated. There is no cost certainty until late
in the project.
D Construction management
There is generally an overlap between the preparation of the design and work on
site (as is also the case in management contracting). All the contracts for the work
71
packages are between the client and the trade contractors; therefore, the client has
a considerable duty in managing the separate contracts. The final cost of the
project is not known until the last work package is assigned.
Barrie and Paulson (1992) suggest that full-time interaction between the project
manager’s design team and the construction team functions not only ensures
effective overlapping of design and construction, but also provides for value
engineering and ensures constructability of the design.
Advantages: The client retains full control of the design, something which is
possible especially in the case of shorter programmes.
Disadvantages: The client negotiates the package with the contractor directly.
The construction manager has no contractual role and the client carries the largest
risk if the design is not fully co-ordinated. There is no cost certainty until late in
the project and also no transfer of risk to the contractor.
2.6.5.7 PROJECT RELATED DOCUMENTATION
The conditions of the contract (CoC) actually include the preliminary clauses of a
specification and other related documentation.
Goldbloom (1992) states that the output from the construction documents phase is
a set of documents that will form the basis of a contract with the construction
contractor. This includes the final drawings and technical specifications as well as
general and special conditions. The method allows the project and construction
manager to invite tenders who will affect the contents of the specification and the
successful execution of the project. Goldbloom (1992) therefore suggests that the
best method is to issue to each contractor tendering a complete set of documents
comprising the conditions of the contract, the specification and the bill of
quantities with all other related documentation so that they can submit a justified
bid. The contractor will then be left in no doubt as to what his obligations will be
should his estimate or bid price be approved.

72
2.7 SECTION C: The four project management life cycle phases
• Phase 1: Project initiation/conception
• Phase 2: Project planning/design
• Phase 3: Project implementation/construction acknowledgement
• Phase 4: Closeout/lessons learned
The researcher is aware that the South African Council for Project and
Construction Management Professions (SACPCMP) work with the concept of six
life cycle phases in projects. For the purpose of this research, however, the
researcher chose to work with four phases and to cross-relate activities with one
another. The phases concept, feasibility studies and project initiation were merged
into one phase (see Fig 2.1). In this study the researcher therefore worked with
four phases, namely concept and initiation; planning (including design);
construction; and close-out in order to ensure a positive reply in the survey
questionnaire.
There is no fixed number of life cycles in any project; the complexity of a specific
project will determine the number of life cycle phases for that project. Moore and
Tushman (1982) identified only three stages in a project life cycle, namely
introductory, growth and maturity. Adams and Brandt (1983); Cleland and King
(1983); and Burke (2001) based their life cycle phases on PMBOK (2013)
principles and accordingly also identified five life cycle phases.
Moore (1991), on the other hand composed a five stage project life cycle
programme by including a phase he called “crossing the chasm”. This phase refers
to latent problems that emerge during the course of the project, for example an
unexpected underground water fountain found during the construction phase.
This researcher accommodated the above phase (crossing the chasm) into phases
1 and 2 of his research. He also listed it as SF19 and SF20 (environmental and
feasibility studies) in his questionnaire.
73
The researcher also decided to use a four phase life cycle for this study and his
questionnaires by merging some of the six life cycle phases identified by
SACPCMP and ultimately working with four life cycle phases.
2.7.1 PHASE 1: PROJECT INITIATION / CONCEPTION
The project life cycle begins with the identification of a need or the suggestion of
a project opportunity; it might come from researchers, salespeople or customers.
PMBOK Guide (2013) defines a project as the entire sequence of activities from
the initial idea invention through the research and development phase to the
development process. PMBOK Guide (2013) states that a project is a dynamic
activity with a distinguished life cycle of its own. The activities can originate from
the client or the research and development functions and are rooted in the dynamic
life of civil and construction engineering. The life cycle of a project has its own
structure because the managerial considerations of the project change significantly
as the project progresses.
PMBOK Guide (2001) describes the project life cycle as the project phase, the
relationship to each other and to the project. This includes an overview of the
organisational structure that can influence the project and the way the project is
managed. PMBOK Guide (2001) suggests the following four phases, adding that
constant monitoring and evaluation across all four phases of the project life cycle
is important: (1) the initiation phase, project planning, (2) feasibility and design
phase, (3) the implementation and construction phase and (4) the project closeout
and lessons learned phase.
The above four phases also require different management and support services
from the corporate management. Each phase in the project life cycle requires
different levels of effort in terms of planning, monitoring and evaluation.
Kyriakopoulos (2011) emphasises the importance of regular project monitoring
and planning during the initiation phase and involving all stakeholders and team

74
players. This will keep the project vibrant and on track and make sure that it
fulfils and meets its objectives.
PMBOK Guide (2001) also refers to a project as a temporary undertaking to
provide a unique product or service. It consists of a series of sequential phases
from its initiation to its closure, and these can be broken down into functional or
practical objectives. A project has transitional results or deliverables and specific
milestones within the overall scope of work or financial availability.
The Project Management Institute (PMI) (2013) states that every project has a
definite start and end as well as with specific deliverables and activities. The
proposed life cycle provides the basic framework for managing the project.
Careful attention to detail, the ongoing involvement of key participants and proper
documentation at each stage are all important to ensure an excellent outcome of
the project.
2.7.1 (a) CONTRACT SCOPE OF WORK (SoW)
Scope of work (SoW) defines the major task that will need to be performed to
accomplish the work to be done and produce all the project deliverables. The SoW
defines what the project team or the contractor will do.
Manzi (1984) and Schoumacher (1986) argue that the scope of the design work
during the construction phase is often the most difficult to define. The engineer or
architect has some responsibility for assisting the project manager with contractor
selection, including advertising the project, receiving and evaluating proposals,
and awarding the contract. The above authors claim that the design engineer or
architect has a responsibility to represent the client and the project and
construction manager on site during the actual construction site meetings.
PMBOK Guide (2013) argues that the project scope defines what needs to be
done, in other words everything that must be done to produce all the project
deliverables and satisfy the client or stakeholders that all the work and

75
deliverables met the requirements and acceptance criteria, and accomplished the
project objectives. The scope of works identifies all the major tasks that will need
to be performed to complete the project deliverables. The SoW also defines the
duties of the project team and/or the contractor. If something is not specified or
defined in the SoW, it will not be done. Having the contractor or project team
review the SoW with the client provides an opportunity to make sure everything
that the client expects is included.
Scope of work involves specifying the full breadth of the project and the full span
of its outputs, end-results, or deliverables. The defined end-items to be delivered
or constructed by the project are termed inclusions, meaning they are included in
the project.
Frame (1988) states in his research that scope definition should focus primarily on
determining outputs and deliverables, not on time and cost alone. Time and cost
restrict or dictate the potential deliverables and must therefore be accounted for as
constraints in the scope definition.
Archibald (1976) argues that sometimes uncertainty stems from lack of effort. He
states that management should in general strive for the clearest, most definitive
scope of work and project objectives. During the project however, changes in
project design or schedules occur due to project concept changes or
developmental barriers. These are outside the control of the project participants,
but the original cost estimate should then be updated and become the new baseline
for tracking and controlling project costs.
Many consider this initial phase in the project life cycle to be the most important
one, because if the correct requirements and problems are not identified, the
project will be in trouble from the start.
Walker (1995) claims that project scope is a useful forecaster to estimate
construction time. Other authors, such as Akinsola, Potts, Ndekugri and Harris

76
(1997); Songer and Molenaar (1997); Belout (1998); Chua et al. (1999);
Dissanayaka and Kumaraswamy (1999) and Kumaraswamy and Chan (1999)
concur. The attributes used to measure this factor are types of project, nature of
project, number of floors, project environment and the complexity of the project
and the size of the project.
• Project scope of works clarity
Bahill and Chapman (1993) argue that the needs of the client are not always
clearly or well defined in the concept development phase. They are of the opinion
that alternative perceptions are created to formulate a meaningful presentation on
which various other success factors will depend. The most important phase in the
project life cycle is therefore the concept development phase, as this is the phase
where all the client requirements and related success factors can be clarified and
described. The concept proposal should be reviewed by various role players as
many times as necessary before the project is moved to the next phase (the design
phase).
Akao and Ed (1990) and Bahill and Chapman (1993) all state that a design
concept is a description of the form, function and features of a project. They also
state that a set of specifications, an analysis of competitive alternatives, a
feasibility study and a breakdown of cost, material and labour should be included
in the concept documents to justify the project cost and reason for development.
This activity is known as a bill of quantities (BoQ). Documents for this phase
usually include descriptions of several methodologies and success factors to
ensure that all aspects of the scope of works (SoW) are addressed and agreed upon
before full and final approval of the project is given.
Frame (1987) states that the concept development phase demands more
coordination than the other phases as many of the development methodologies are
concentrated in this phase. The purpose of the activities of this phase is to gain an
understanding of the client’s needs and to communicate them effectively to the
77
planning and design team. It is important to have a set of carefully constructed
client needs statements, structured in a classified list.
Kaplan and Norton (1996) highlight the important role of a qualified and
experienced project manager in satisfying the expectations of the client,
stakeholders and the participants.
Argus and Gunderson (1997) emphasise that concept development time should be
used to explore analytically the space of the project concept in order to satisfy
client needs. Concept development includes a description of external factors,
creative problem solving within the team and a systematic exploration of the
various solutions. The exercise usually results in a set of two to five concepts,
each typically represented by a sketch and brief descriptive text.
Cooper (1986) and Kaplan and Norton (1996) all state that the general function of
design is often overlooked in efforts to ensure client satisfaction. Raw data should
be obtained from the client at the earliest possible stage to ensure that the project
concept is appropriate for its intended users. Harrison (1981) mentions typical
changes that can influence the clarity and outcome of the project, such as the
following: changes in the project scope and specifications during the early stages
of development, changes in the project design caused by errors or omissions and
unidentified ecological factors embedded in latent conditions.
Hanan (1993) argues that it is important for an executive committee representing
all project related participants to review each idea against a set of criteria.
The following should be asked:
- Does the proposed design entity meet the stated needs?
- Would it offer superior value and quality?
- Can it meet the client’s needs?
- Does the company have the necessary capital?
- Will the new project deliver the expected growth and profit for the client?

78
The result of this action is usually a set of one to five concepts, and again each
must be represented by a sketch and brief descriptive text. Hanan concludes with
the opinion that the project mission and design usually requires several iterations
and may even initiate additional concept refinement in order to define the goals,
objectives and the scope of works (SoW).
• Initial needs of competence and commitment
Baccarini (1999) indicates that project management success in each project life
cycle phase requires the competence and commitment of all parties involved.
Only then can the scope of the work related to the specific criteria of the project
be carried out successfully.
McKillip (1987) indicates that a need is a value judgment that points to an
existing problem. However, different parties in an identical situation will perceive
the situation differently and therefore a need must always be identified with
respect to a particular party or client. That is why the first and second phases are
vital for the project development process and why they should be executed in
depth.
• Project initiation protocol
The conception phase according to Biggs, Birks and Atkins (1980) has two stages:
1 During the first stage it is established that a need or problem exists and that
the matter is worthy of investigation.
2 During the second stage the feasibility of a detailed investigation of the need
or problem is proposed, possible solutions are sought and the best solutions
to the need or problem are selected. It is important that this phase ends with
agreement on the specific solution to be presented to the client.
According to McKillip (1987) the above two stages should be underpinned by the
fundamental principle. This will ensure that the project will be based on a
thorough functional and feasibility analysis, that all participants will benefit and
that the client’s needs will be met.
79
• Identification of needs
Cusumano and Selby (1995) declare that identification of the need for the project
commences with a document from a client which management has approved. It
concludes with a preliminary analysis of the scope of work required.
Frame (1987) suggests that the proposed project be analysed and a feasibility
study with a project proposal be reviewed and approved by the client. Frame
(1987) is of the opinion that in identifying the customer’s needs is a process and
he presents a five-step methodology. He believes that a little structure goes a long
way in facilitating effective project development practices, and that this structure
should be viewed as a starting point for continuous improvement and refinement.
Frame’s five steps are:
1 Collect raw data from the client to define the scope of work involved.
2 Interpret the raw data in terms of the client’s needs by conducting a research
analysis to show the feasibility of the proposed solutions and project.
3 Determine the relative importance of the client’s needs.
4 Restate and document the client’s needs according to the information gained
during steps 2 and 3.
5 Review the reformulated needs with the client for his approval.
Concept selection is the process of evaluating concepts with respect to the client’s
needs and other criteria. It is important to compare the relative strengths and
weakness of the concepts, and select one or more concepts for further
investigation or development.
2.7.1 (b) FEASIBILITY STUDIES (FS)
Biggs et al. (1980) state that the feasibility process is a study of the need,
investigation of the problem, and search for solutions in a detailed analysis to
determine if the idea is economically viable and worth developing. The current
situation regarding a feasibility analysis, the preferred solutions and reasons for
their selection will be highlighted in such a study. This phase includes critical

80
success factors such as an environmental study, risk assessment, time and cost
estimates and a conceptual design layout. The above authors argue that the
feasibility study, combined with the project plan and prices forms the project
proposal.
During this initiation phase the purpose, objectives and scope of the proposed
project are presented and the functional requirements determined.
Frame (1988) writes that the size of the development is assessed and the scope of
the potential project determined during the investigation. He agrees with Biggs et
al. (1980) that this will serve as a framework for a feasibility study. Frame further
states that determining functional requirements at this stage can cause problems
for many individuals. He regards it as a simple concept task, however: what
should be determined is what is required, not how it should be done. He further
recommends obtaining a copy of an existing functional requirements document
and using it as a model to measure various alternatives and solutions. He
concludes that it is important to have an approved project initiation document
available as a platform for approving the assignment of resources.
It is understandable that sufficient information may not be available in the design
proposal to do a detailed cost estimate. This will only be possible after the
completion of the feasibility and the client has approved the initial presentation.
As the project progresses more information will become available and estimates
will be more reliable.
The results of the feasibility study are a statement of the problem, a list of needs
and reasons for its selection. The feasibility study, when combined with the
project plan, bid price and contractor qualification form part of the project
proposal.
Roman (1986) is of the opinion that the outcome of the feasibility and proposal
study can put the focus on the problem and reveal the list of needs and reasons for
selection. The feasibility study forms part of the proposal if it is combined with
81
the project plan, bid price and contractor qualifications. The development process
is costly and therefore project investigation frequently requires that a preliminary
study, known as a feasibility study be included.
Daft (2005) states the term “feasibility studies” include all the objective and
subjective analyses. It also includes economic projections, the legality of the
proposed project and its environmental impact. He emphasises the fact that the
purpose of the feasibility study is to evaluate different options and to analyse the
costs involved. The benefits of each option must be explored so that the most
feasible option for development can be proposed. He concludes by saying that a
feasibility study is the process of measuring the proposed project against suitable
criteria that can influence the go/no-go decision about the project.
The feasibility study is time-consuming and very costly and may take weeks or
months to complete, especially in the case of technical projects where a full scale
demonstration of the proposed solution has to be included.
2.7.1 (c) PROJECT PROPOSAL (PP)
Hajek (1984) emphasises that developing a proposal can be the equivalent of a
good-sized project. Nothing should be overlooked in the proposal preparation and
the project manager should use checklists to make sure he includes all the
necessary and important items in the proposal. Before the proposal can be
submitted to the client, the contractor and top management must be briefed about
the project’s scope, required resources, price, etc., and approve it. Hajek (1984)
also states that the proposal provides the client with necessary information about
the duties of the contractor, his/her basis for selecting the most cost, time and
performance effective contractor.
According to Roman (1986) a proposal includes a feasibility study, scope of work
and a work breakdown structure (WBS). The project proposal also describes the
various procurement options accessible to the client for the specific project and
may recommend some of them. After approval of the initial proposal, the project

82
manager will select the project team to prepare the inclusive proposal which will
be presented to the client for his review, comments and approval.
2.7.2. PHASE 2: PROJECT PLANNING / DESIGN STAGE
Once the initial project scope and requirements have been established, the high-
level design develops through a series of phases such as the conceptual,
preliminary, development and, detailed design phases.
Akao and Ed (1990) and Bahill and Chapman (1993) state that the evaluative
function must be completed at the end of each major phase of the design process,
before proceeding to the next phase to ensure that the design is correct. The
evaluation function includes both the informal day-to-day project coordination
from data review and the formal design review.
The planning and designing drawings are prepared by professional people and
they illustrate the project details graphically. According to Firmage (1980) the
design drawings, prepared by the engineer and architect, are referred to as contract
drawings after the contract has been signed.
Bockrath (1986) states that a typical set of drawings for the construction of a
building consists of the following: (1) general layout and civil works such as
roads and parking areas, drainage and landscaping; (2) architectural drawings
illustrating all dimensions and locations of all features of the building; (3)
mechanical drawings including plumbing, heating, ventilation, air conditioning,
special equipment and electrical installations; (4) drawings illustrating the
building excavations, foundation types, concrete beams, floor slabs, roof
structures, concrete reinforcing designs, steel and other detail structures. Bockrath
(1986) concludes by stating that the ecological as well as the feasibility and
economical studies must meet the conditions of the various standard codes of
conduct and that this should be taken into account during the above stages.
Hamel and Prahalad (1994) argue that another important process is evaluating
concepts with respect to the customer’s needs. Design concept selection is the
83
activity where various project analyses and needs are included into one design
concept.
According to Hanan (1993) the development design usually requires several
modifications during the design proposal phases. This ensures that the client and
the design engineer will be in agreement regarding the project scope of works.
Lehmann, Gupta and Steckel (1997) think that the engineer should not define the
client’s problem too broadly or too narrowly and propose the following evaluation
process plan:
1 Identify the problem and research the objectives.
2 Develop the research plan.
3 Collect the information.
4 Analyse the information.
5 Present the findings to the client and the team members.
They further recommend that the needs be evaluated against the strengths and
weaknesses of the various design concepts, and that a selection of one or more
concepts should be further investigated, if necessary. The above authors mention
that project related technical information documents underpin and reinforce the
project during the planning and design phase.
Dellacave (1996) advises that the engineer or project manager assists the client in
determining general project feasibility. He suggests that the following questions
be answered:
- Is the project viable at all?
- What sites are available that should be considered?
- What is the cost of the various alternatives?
- How much time is needed to execute the project?
Even though the client receives preliminary information at this stage, he needs it
in order to:

84
- Decide whether to proceed; and
- Seek the funding, if it is decided to proceed.
During the design phase, the project manager will often engage the services of
outside designers/consultants who will be responsible for specialised aspects of
the design, such as electrical installation, the reinforcement designs for
foundation, concrete columns, beams, floors slabs and structural steel and roof
designs. The contract should state who would have responsibility for the design
and whether there would be site supervision.
2.7.2 (a) PROJECT DESIGN AND ANALYSIS
After the client’s needs have been determined, the proposed design goes through
successive stages as the design cycle is repeated by one engineer after the other.
According to Akao and Ed (1990) and Bahill and Chapman (1993) the analysis
provides specifications based on a detailed investigation of the feasibility studies.
Project design is a design for an efficient and effective project structure that
complies with the specifications obtained during the analysis stage. The feasibility
research will balance the specifications, bill of quantities, and time, cost and
fairness requirements of the project.
• Design requirements
Akao and Ed (1990) and Bahill and Chapman (1993) emphasise that this function
is part of phase 1 and 2. It involves feasibility, environmental and design reviews
and is one of the most important aspects to be addressed. In the traditional
approach to verification checklists of attributes are used, such as:
1 Each requirement should be noted as being mandatory, secondary or
tertiary.
2 The client should approve the requirements.
3 Each requirement should be confirmed in the developed project plan.
The above requirements are to ensure that the client is involved in all activities of
the project (SoW). One example is the matter of soil analysis. These conditions

85
are very difficult to predict, especially when environmental and feasibility studies
have not been executed during the second phase of the project. At the first site
inspection the soil may seem to be suitable but soil analysis density test may show
different results. The type of soil will determine the foundation design required
for the development loadings.
The results of a soil density test can therefore have cost implications or result in a
later completion date. They can also lead to the conclusion that the project is not
economically viable at all. It is vital that a full layout of all items and activities be
stipulated from an early stage on all design documents. This needs to be
monitored by way of a check list and relevant dates and signed and approved by
the relevant role players. In this way there will be a traceable path of evidence on
record.
• Design of the concept
Reswick (1962) states design process starts with the recognition of a need and the
conception of an idea to meet that need. These steps are followed by the definition
of the problem and a programme of research and development. These lead to the
construction and evaluation of a project. Reswick (1962) also states that the
design is the process of creating a model that will meet an identified need. The
engineer carries out some logical sequence of activities, decisions, and analyses to
develop a solution to the problem within the development design process.
However, this solution is of little use unless the engineer communicates the
solution via drawings, specifications, financial estimates, written reports, and oral
presentations to the client and the other project participants.
• Elements of design
Akao and Ed (1990) and Bahill and Chapman (1993) state that design elements
can be evaluated by checklists similar to those used in stage 1 where requirements
are clarified to meet the specifications of the client. An important aspect of design
elements is the analysis of risk factors. There are several analytic methods and
standard codes of practice available with which to analyse design proposals.
86
These methods are used to ensure that elements of verification loads and the
reliability of the proposed design will meet standard codes of conduct.
Cooper (1986) is of the opinion that only one out of every four fully-developed
new projects becomes a success.
• Design and quality requirements
As indicated by Biggs et al. (1980) the first phase of project development is
defining the design problem or scope.
During this phase, the project manager should ask questions such as:
1 What is the function and intension of the desired project?
2 What performance characteristics must be met?
3 What restrictions, including legal restrictions, limit the solution?
4 What methods will be used to evaluate the quality of the design solution?
Wilson and Wilson (1970) identify four categories of objectives and goals for the
solution:
- Musts: requirements that must be met.
- Must not: constraints defining what the project must not be or do.
- Wants: features what significantly enhance the value of the solution.
- Do not want: characteristics that reduce the value of the solution.
Wilson and Wilson (1970) think that these measures may lead to a set of
functional requirements that the design solution should be made to achieve. It is
crucial at this stage to have a preliminary identification of the potential barriers to
the development and presentation of the project.
• Project cost estimation
During either the initiation stage or a later stage a need will arise for an estimate
of the length and, by extension, the cost of the project.
87
Harrison (1981) and Kerzner (1992) refer in their research to this form of estimate
as an ongoing exercise during projects. They usually involve cost increases. An
“estimate” is a package of information that describes the anticipated potential
resource requirements for a particular project and its specific characteristics and
attributes.
Archibald (1976) in his research argues that a project design schedule is necessary
because of concept changes, development barriers, strikes and legal cost
estimates. He thinks that the project design schedule should be regularly updated
so that it remains a valid baseline for tracking and controlling project costs. For
him an “estimate” is one possible scenario among many that make up a set of
possible solutions. An estimate is bound by project risks and/or uncertainties. A
specific amount called a contingency fund or budget reserve is usually added to
the original estimate to be used in the case of unavoidable cost overruns (i.e.
VOs).
• Project planning process
Meredith and Mantel (1995) state that planning provides a process for the
organisation to identify significant development aspects that should be addressed
by the project management process (PMP).
Project planning does not require justification, of course. It can be defined as the
planning of a project by breaking the main objective down into manageable events
and tasks; scheduling these events and tasks in a certain order; and assigning
funds with which to complete the events (deliverables). It is important that the
components of the project be managed and the results evaluated.
• Planning objectives
According to Manzi (1984) and Schoumacher (1986) development planning has
both strategic and calculated aspects. Strategic planning defines the objective;
evaluate macro issues and shows where you want to be in any given period.
Tactical planning uses the strategic plan to develop a detailed road map of how
88
the results will be achieved. This plan should describe who is to do what; how
long it will take; in what sequence the activities are to be undertaken; and at what
cost. These aspects will give all participants a common direction and a frame of
reference within which they are empowered to make decisions.
A detailed plan provides a formal medium for the project and construction
manager to accept responsibility for the project or to decline to do so. The detailed
plan will indicate to the project manager that all the participants are in agreement
regarding the scope and objectives of the project. Signing the plan will establish
the relationship between role players and their commitment to deliverables and
the anticipated activities that will lead to a common goal, the end project. The
purpose of the detailed plan is to determine the best way to complete a project on
time and within budget.
2.7.2 (b) PROJECT SPECIFICATION (PS)
The goal of construction or engineering documents is to communicate the needs
of the client as represented by a design in a way that is easily understood by those
responsible for the construction project.
Goldbloom (1992) reminds us of a fundamental legal principle: when there is
disagreement over specification language, the courts will most likely interpret the
language against the party who authored it, who is usually the project manager or
engineer. He emphasises the importance of clarity, briefness, and simplicity in
construction specifications.
Specifications outline the quality levels and the standards which will make the
construction of a development possible. A specification is a detailed description of
all workmanship and materials necessary to execute a specific project in
accordance with detailed drawings.
The following should be included in the specifications:
1 A description of the work to be performed, including material and
equipment requirements and conditions for that performance.
89
2 The manner in which the quality and acceptability of the work will be
determined.
3 Allowable tolerances and how deviations from these tolerances will be
handled within the standard design parameters.
4 The manner in which payment for the work will be made.
5 The manner in which changing conditions are to be managed.
Bockrath (1986) and Vaughn (1983) argue that it is essential that contractors have
this information as they base their tender bids and their plans for managing and
executing the work if their bid is accepted on the specifications. After the contract
has been agreed upon and signed, no additional duties or restrictions can be
imposed on the contractor without modifying the contract.
2.7.2 (c) THE BILL OF QUANTITIES (BoQ)
The bill of quantities (BoQ) does not always form an essential part of the contract
as do the drawings and specifications. Sometimes the bill is excluded from the
contract on purpose, except in so far as it is supplied as a list of prices by which
variations and extras can be valued. By basing the contract on the drawings,
specifications and conditions of the contract and inviting contractors to include
everything necessary for the completion of the work as shown in the
specifications, the client will have the full scope of what the project will cost him
when the project is delivered, including omissions in the bill of quantities.
2.7.2 (d) SCHEDULE OF PRICES (SoP)
An alternative document, similar to the bill of quantities and also as part of the
contract is a schedule of prices (SoP), which is a list of all materials and labour
necessary, or likely to be necessary for the completion of the work as stated by
Kerzner (1989) and Eisner (1988).
In some cases it can include approximate quantities of each item for the guidance
of the contractor in his pricing. The contractor puts his unit price to each
activity/item in the SoP and the total then determines the contract price, which is
finally calculated upon completion of all said activities.

90
2.7.2 (e) ENVIRONMENTAL STUDIES (ES)
It is essential to consider the impact of the design on the environment.
Environment, in this context, refers to the numerous external factors that must be
considered in the development process. In addition to the technological and
economic factors, one must deal with ecological, political and social
considerations as well according to Harrison (1981). The system being developed
must be compatible with its environment and must ultimately exist within that
environment.
A full environment study must be done to consider the following: temperature,
shock, vibration, humidity, pressure, wind, salt spray, sand, dust, rain, fungus,
radiation, and traffic and noise levels. The results must form part of the overall
design. In addition a soil analysis, access to the site and delivery of materials to
the site must form part of the investigation. The full range of conditions, including
extremes, must be specified and properly addressed.
2.7.3 PHASE 3: PROJECT IMPLEMENTATION / CONSTRUCTION
The life cycle of projects can usually be broken into sequential phases which are
differentiated by the technical work required for each phase. The Project
Management Institute (2004) states that key role players produce the deliverables
and determine the ways in which these are controlled and approved.
As indicated in the research review above, the conditions required to ensure
project management success in each life-cycle phase involve the skills and
commitment of the concerned parties in carrying out the scope of work of the
various phases, as well as other external environmental conditions of these
activities.
The PMBOK Guide (2001) states that planning, monitoring and controlling the
project work is “the process of tracking, reviewing, and regulating the progress to
meet the performance objectives defined in the project management plan”.
PMBOK (2001) also writes that planning and monitoring include regular status
reporting, progress measurement and forecasting. Regular performance reports
91
provide information on the project’s performance with regard to scope, schedule,
cost, resources, quality and risk, all of which can be used as inputs in other
processes.
Baccarini (1999), Liu and Walker (1998) and Pinto and Mantel (1990) attempt to
define project success by means of three different measurements:
1 The efficiency of the implementation process that is “an internally oriented
measure of performance of the project team”. This includes criteria such as
staying on schedule, on budget, meeting the technical goals of the project,
and maintaining smooth working relationships within the team and parent
organisation;
2 The supposed quality of the project and the project team’s perception of the
value and usefulness of the project deliverables;
3 External measurement of project performance and the project team as well
as the client’s satisfaction.
Martin (1974), Locke (1984), and Pinto and Slevin (1987) are of the opinion that
careful recruitment of the right project manager and personnel is crucial to project
success. Cleland and King (1983) highlight the value of effective training to build
the capacities required for the project. White and Fortune (2002) add that relevant
project experience and competencies play a vital role in project success.
Project execution is the phase where visions become reality. This is the logical
conclusion after all the documents have been drawn up and approved by the
client.
2.7.3 (a) PROJECT RISK MANAGEMENT (PRM)
Argus and Gunderson (1997) describe risk as a type of work or technical function,
such as engineering risk associated with construction or product manufacturing.
Risk identification starts in the conception phase and focuses on those high risk
factors that would make the project difficult or destined to fail. They further state
that sources or causes of high risk must be studied and well understood before the
project can be approved and funds committed. Risk identified in the conception
92
phase are often broadly defined and subjectively assessed, though they can also be
analysed using the assessment and reliability as well as feasibility methods.
Project risk management requires project and construction managers to be
proactive and prepare for possible events in advance, rather than reacting to them
after they have occurred.
• Risk management involves three elements:
1 Risk identification:
Risk identification must be sub-divided into two distinct forms of risk:
business risk and insurable risk. Business risk involves the likelihood of
profit from any business endeavour (PMBOK Guide (1987) and VanScoy
(1992). Insurable risk is only negative in nature; there is no change, only
loss. In assessing probability of both types of risk, it is important to analyse
the environmental issues seeking to determine the relevant risk factors as
early as possible which may derail the project.
2 Impact analysis:
Impact analysis is another element of risk management. It is important to
determine the potential sources of risk in the environment but equally
important to assess the impact that each intervening event can have on
project success. Impact analysis, in its simplest form, typically consists of
breaking down each project activity or external intervening event into
categories of high risk, moderate risk, and low risk. VanScoy (1992) further
argues that the likelihood of each source of risk occurring should be
examined to develop a clearer picture of the status or degree of risk of the
project.
3 Response planning:
According to PMBOK Guide (1987) the final component of risk
management is response planning. Project risk should be associated with
complementary contingency plans so that problems can be addressed if and
93
when they are discovered. Pinto and Mantel (1990) claim that the biggest
single cause of project failure is the absence of adequate contingency plans
to bring a project back on track in the event of an accidental failure.
2.7.3 (b) PROJECT WORK BREAKDOWN STRUCTURES (WBS)
It is the opinion of Cleland and King (1983) that the work task defined in the SoW
section along with the detailed list of deliverables is the basis for outlining the
WBS. The WBS is the main breakdown of the project into manageable
components that produce the project deliverables. It is a technique for organising
and subdividing all the work and deliverables into more manageable components
and forms the framework for further planning by creating a baseline plan to
execute the project work. A high-level WBS may include a graphic chart format.
Archibald (1976) explains the importance of milestones, the key dates for major
project phases or activities. He regards them as vital for detailed planning. They
make possible the coordination of the workforce during the entire project.
Examples from a typical project are: “go-ahead” (start), design reviews ending
each design phase, 90% drawing release, start of each major test phase and
delivery of first prototype of concrete precast beams. Milestones also include the
customer’s required delivery dates.
2.7.3 (c) PROJECT QUALITY CONTROL (QC)
Crosby (1979) claims that a major concern in any construction project is quality;
the non-achievement of quality often leads to client dissatisfaction.
According to Dainty, A.R.J., Cheng, M. and Moore, D.R. (2003) skills shortages,
which is a problem in the construction industry, leads to poor quality results?
Bach (1995) questions the validity of the term “good quality”. He feels that
striving for the best possible quality often results in a very expensive project and
those clients often do not notice the difference between the best possible quality
and pretty good quality.
94
Crosby (1979) argues that the clients do not really know what the actual meaning
of good quality is especially when the client purchases a particular product or
service instead of competing alternatives because of its higher quality. Crosby
(1979) concludes that in this context, quality will refer to a higher level of
reliability at a given level of performance to the specified specifications. This
occurs when contractors employ unskilled labour to perform project construction
related tasks.
A well-structured quality control plan must include the following: specifications,
industry or government standards (for design, testing, safety, construction, and so
forth), and codes that must be used to meet performance standards of the project
design and construction execution.
Kransdroff (1996) makes the statement that quality control can be contrasted to
scope verification whereas scope verification refers to the acceptability of project
deliverables by the client. Quality control refers to validating the trustworthiness
of specifications and standards already set out in the specifications. Scope
confirmation includes verifying the acceptability of those specifications and
standards. It is the opinion of Kransdroff that the quality control inspections
should make sure that deliverables will meet the specifications and design code
standards before handover to the client.
Industrial standard codes of practice and local building codes are fundamental
when choosing materials and building the design structure’s foundations,
columns, beams, roof structures and supporting walls and these codes must be
stated and noted in the appropriate project documents such as technical
specifications and acceptance criteria. It is vital that these standards be
communicated to the members of the project team at the outset of the project and
before construction begins. The quality plan may also require suppliers to provide
documentation certifying that the materials they supply meet certain required
specification standards.
95
• Expectations in service delivery
Parasuraman, Zeithaml and Berry (1985) argue in their research that there are five
main requirements for delivering quality service:
1 There is often a difference between the expectations of the client and other
participants.
2 There can often be a misunderstanding between management (company)
perception and quality specification in order to specify a performance
standard code.
3 There may be a discrepancy between service-quality, specifications and
service delivery. Problems in this regard occur when personnel have an
inadequate level of expertise or are poorly trained and are therefore
incapable of meeting the required performance standard.
4 A communication breakdown may lead to misconceptions. It is very
important that the project team must realise that statements made during
presentations as well as during the phase of service delivery can affect the
client’s expectations.
5 There is often a discrepancy between perceived service and expected
service. This can lead to a client having misconceptions regarding service
quality.
Kaminetzky (1991) expresses the importance of the client being able to convey
the purpose and requirements of the structure to the designer. He claims that a
major problem is that the client’s real requirements may not be made fully clear
during the initial planning stage. He is of the opinion that it is the duty of the
project manager and team to make sure, through in-depth discussions, that they
understand the client’s needs, as well as the design and the scope of work.
2.7.3 (d) PERFORMANCE MANAGEMENT
Performance in this context is meeting the conditions as specified in the SoW.
Bockrath (1986) defines substantial performance as the accomplishment of all
things essential to the fulfilment of the purpose of the contract, although there
may be insignificant deviations from certain contractual terms or specifications.
96
Shannon (1980) states performance management steps are simple but important:
- The first step establishing the standard of performance is essential and
should always be part of effective planning. It is important that standards
should be measurable, verifiable and tangible. In this step, the standard rate
of production by work measurement of time and motion studies should be
identified and put in place.
- Secondly, the actual level of performance achieved by measurement of time
and motion studies must be calculated.
- The third step is to compare two measurements of the variance (deviations
between them).
- The final step is taking corrective action if required.
According to Pillai, Joshi and Rao (2002) a performance measurement system
should be implemented to reflect the needs and expectations of all the
stakeholders during all the phases of the project. This system, according to the
above authors, can be in terms of technical design, construction or commercially
related subjects. Measurement should be at the planning and design,
manufacturing and construction levels and includes the overall performance of the
company.
• Effective communication
Kerzner (1992) confirms that a project manager should create a working climate
conductive to teamwork. He should nurture a spirit of open communication
between all project related team members as well as between the client, contractor
and his top management.
Blake and Mouton (1969) are of the opinion that planning and communication are
as barriers. They argue that the character of supervision is often the underlying
cause of communication difficulties and that the style of supervision is influenced
by the supervisor’s knowledge of theories of human behaviour (or lack thereof). A
project manager may be technically competent, but if he does not have a good
understanding of human motivation and group dynamics he will not be able to

97
generate the best results. Such a manager will not be able to establish a climate
that provides clear objectives, full commitment, and the closeness of cooperation
within the project team.
• Kick-off meeting
Before the contractor starts working on the site, the project and construction
manager must hold a kick-off meeting which all relevant parties will attend. The
purpose of this meeting is to introduce all parties to one another and to review the
requirements of the project.
Archibald (1976) writes that the contractor commences the mobilisation stage
immediately after his appointment. He appoints subcontractors for the first stage
of the project and also begins to set up the site. The project manager has to check
that the contractor’s insurance and health and safety plans are in place.
Archibald (1976) also states that the project manager has to clarify the following
with the main contractor:
• Contract documents are prepared, agreed and signed off.
• The work breakdown study (WBS) is completed.
• Handover of the site to the contractor.
• Contractor’s construction schedule and method statements.
• Regular site meetings to monitor the progress of the project.
• Monitoring of construction activities and performance.
• The timeous provision of relevant design information is given to the
contractor.
• Regular site inspections and quality control.
• Progress report to the client.
• Statutory approvals are obtained.
• Environmental issues are addressed.
98
All the above actions need to be taken if the contractor is to deliver the
development in accordance with the contract and standard codes of conduct.
• Regular site meetings
The project manager will chair regular meetings, the primary method of
controlling and reviewing progress. According to Archibald (1976) the main
points to be covered are:
• Progress versus programme, procurement and resources management.
• Relevant information required should reflect in the programme.
• Change control; or technical queries and instructions.
• Method statements in particular for plant change-over and disruptive works
which must be planned in advance.
• Commercial issues such as warranties, claims, valuations and the agreement
on variations (VOs).
2.7.3 (e) APPROVED DESIGN DRAWINGS
The output from the construction documents phase is a set of documents that will
form the basis of the contract between the contractor and the client. It includes
final drawings and technical specifications, as well as general and special
conditions and other written literature that will be part of the construction
contract.
During the design phase projects such as a new development, alterations on
existing buildings, renovations, road-crossing bridges or other construction related
work requiring the service of an engineer and project manager, may require one or
more design review meetings. This is to ensure that the client agrees and approves
the design and development approach development by the project team or
contractor.
99
In many projects, more than one meeting is needed for the following reasons:
1 A preliminary design review meeting occurs when the project team or the
contractor/engineer has completed the initial design, concept drawings,
specifications or flowchart. The purpose of this meeting is to get the client’s
agreement that the design approach meets the requirements and purpose as
well as to gain approval from the client before ordering certain materials.
There is often a long delivery time and this meeting eliminate unnecessary
delays in the project schedule.
2 A final design review meeting occurs when the project team or contractor
has completed the detailed drawings and has to make sure that they meet the
client’s expectations.
Firmage (1980) argues that design drawings should include the standard code of
practice specifications and feasibility assessment reports as well as other related
documents. The design drawings should be prepared by the engineer or architect.
At this stage they are called design drawings but after the contract has been signed
and the drawings incorporated in the contract, they are referred to as contract
drawings.
The purpose of the final design review meeting is to gain approval from the client
before starting the construction and project deliverables.
2.7.3 (f) CONTRACTUAL PAYMENTS (CP)
West Ridge Natural Science Facility (1992) prescribed 65 general conditions on
which contractual payments to the contractor will be paid by instalments during
the progress of the work. It is necessary to precisely lay down the conditions
under which the client or project manager will make these payments. Firstly, the
contractual payments are made on the authority of the project manager who is not
a party to the contract. Secondly, unless agreed otherwise, payment for work
completed and the entire lump sum become due only when the work is completed.

100
The project manager’s authority for payment is given in the form of certificates in
writing and issued from time to time to the contractor, usually when the value of
the work executed and materials delivered has reached the amount specified in the
conditions of the contract (CoC). Payment is then due on fixed proportional
intervals of the rated value, up to 90 per cent of that value. The balance of 10 per
cent is paid in two instalments, one when the work is completed and handed over
to the client, the other at the end of the maintenance period which is usually six
months after hand-over and when the project manager has given his final
certificate that the entire work has been carried out and maintained to his
satisfaction.
The client is liable for payment to the contractor and the only grounds to resist
payment would be fraud by the project manager, project team of contractor.
2.7.3 (g) OMISSIONS, EXTRAS AND VARIATIONS (VOS’)
Bockrath (1986) emphasises that the project manager should be responsible to
oversee the project on behalf of the client. The construction document is a set of
documents that form the basis for entering into a contract with the contractor. It
includes final drawings and technical documentation, BoQ, WBS, SoW and a
specification of works. The general and special conditions as well as all other
written literature will be part of the construction contract. Bockrath (1986) further
states that in the absence of special provisions added to the contract, a contract
cannot be altered in terms and there can be no omissions, additions or variation
orders (VO) without the consent of the parties concerned. Care should be taken in
the preparation of the drawings and specifications to avoid those extras but
construction works can often not be carried out without some variation from the
original design. It is therefore necessary to include a clause in the conditions of
the contract permitting the client or project manager to make alterations if
necessary.
Silverman (1988) proposes that the project manager should have complete control
of such alterations and it must be made clear that no omissions, alterations or
101
variations may be made without the written authority of the engineer via the
project manager and the client. This is particularly important in the case of
alterations, as they may give rise to a claim for extra payment if there is no
guarantee that the work can be carried out in the manner shown on the drawings
or described in the specifications. For this reason most contracts have a provision
that the contractor must include everything necessary for the due performance of
the work in his contract and specifications.
The amount to be paid for extra work known as the variation order (VO) is
determined by the engineer or project manager who uses the prices in the bill of
quantities that are applicable for work of a similar character. If no price in the bill
is applicable, the contract should provide for the settlement of the amount to be
paid before the commencement of the work.
SECTION 3: PHASE 4
2.7.4 CLOSE-OUT AND LESSONS LEARNED PHASE
The fourth and final phase of the project life cycle is closing the project.
The close-out meeting is held after the project work has been completed and the
client has accepted the project and its final deliverables. Such deliverables may
include training or procedure manuals, drawings and spare equipment parts. An
important activity during the closing phase is ensuring that all payments have
been collected from the customer. Many contracts include a progress payment
clause which specifies that the client is to make the final payment at the
completion of the project. After all payments have been received and made, the
accounting records can be finalised and a financial analysis of the project in which
final actual costs are compared to the project baseline budget can be made.
The project manager can make sure that the following activities were successfully
addressed:
• How successful was the project?
• How did the final scope of work compare to the scope of work at the start of
the project?
102
• Was the client expectations addressed and was he satisfied with the capital
investment in the project?
2.7.5 SUMMARY
This chapter has reviewed comprehensive literature on project management
principles and laid the foundation on which the following chapters will be
formulated to review and assess the proposed quantitative survey and qualitative
case study research. This was important to investigate and validate the research
objective and the research questions. The comprehensive literature covered in this
chapter provides a framework for the project manager and shows that it is his or
her responsibility to identify and determine the risk factors inherent in the project
and to formulate a plan of action which will ensure the successful delivery of the
project (as illustrated in Diagram 2:1 Chapter layout, pp. 29) The layout
demonstrates the most important activities during the project; if they are executed
all the needs and requirements of the project should be addressed successfully and
the project manager should be able to take the project successfully through all its
life cycles.
Any project whether it’s a construction development, manufacturing of an aircraft
or a mining development requires a plan of action. Some projects are more
complicated than others due to latent elements. These hidden aspects which can
result in problems and delays can have many causes, such as people, environment,
project scope, risk, time, quality, cost, project and construction knowledge and
experience. The project and construction manager must have sufficient experience
and knowledge to pinpoint the possibility of the existence of these elements
within the life cycle phases of the project, keep possible solutions in mind and
reconcile them with the demands of the project and needs of the client before the
commencement of the project. The importance of knowledge of project
management principles, leadership skills, and therefore, postgraduate education is
of the utmost significance.

103
Although the engineer with a bachelor’s degree does have academic knowledge
regarding project management, the researcher argues that all projects have latent
issues within the above-mentioned elements that need to be exposed well ahead of
the start of the project if the project is to be safeguarded from failing. This
argument will be fully investigated and contested by means of a qualitative case
study analysis (Chapters 5 and 6) by means of which the extent of the knowledge
and experience of the engineer as project manager will be revealed.
The researcher agrees with Hoffman (1989) when he argues that it takes years of
experience and knowledge to recognise and identify latent issues during the initial
project phases and to rectify them before it is too late.
The researcher further argues that failure regarding a single element may well
impact the effect of a lack of knowledge and experience in the project life cycle
phases which can affect the critical success factors of project management during
any stage or phase of a project. Project management is a specialised field of
engineering demanding a high level of postgraduate academic knowledge and
practical experience and engineers who wish to attain that level of expertise
should be encouraged and given every opportunity to do so (Roberts and Biddle,
1994).
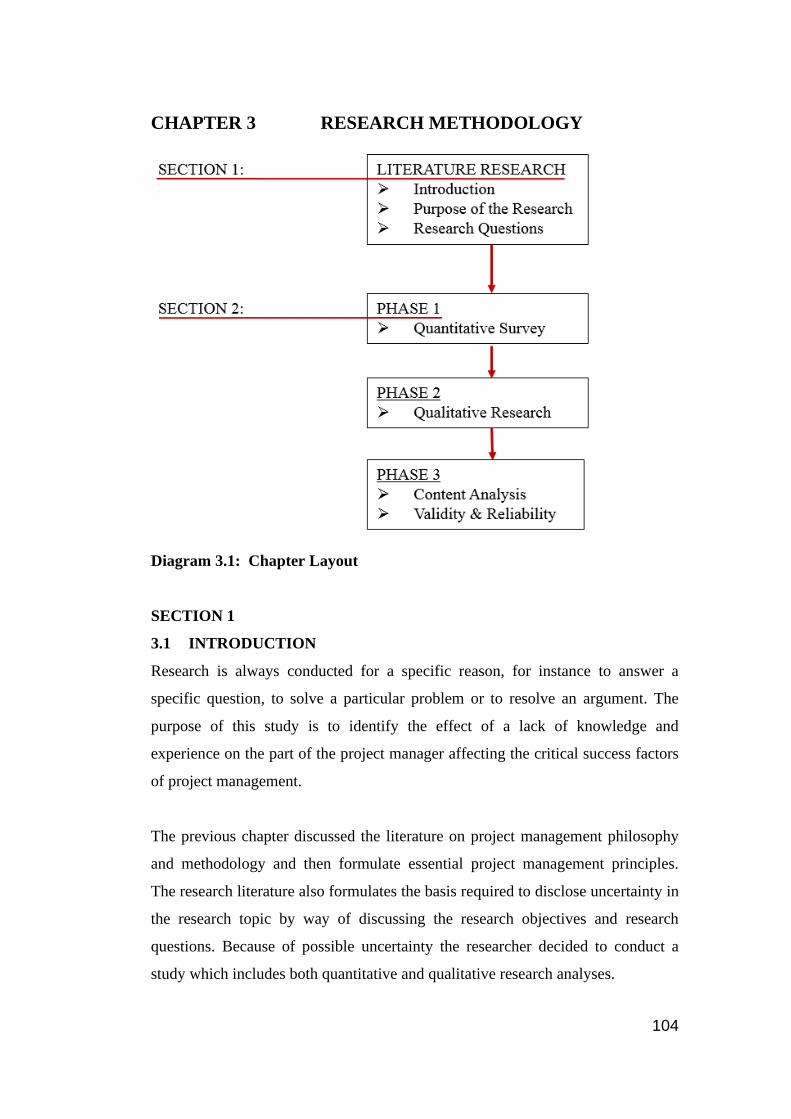
104
CHAPTER 3 RESEARCH METHODOLOGY
Diagram 3.1: Chapter Layout
SECTION 1
3.1 INTRODUCTION
Research is always conducted for a specific reason, for instance to answer a
specific question, to solve a particular problem or to resolve an argument. The
purpose of this study is to identify the effect of a lack of knowledge and
experience on the part of the project manager affecting the critical success factors
of project management.
The previous chapter discussed the literature on project management philosophy
and methodology and then formulate essential project management principles.
The research literature also formulates the basis required to disclose uncertainty in
the research topic by way of discussing the research objectives and research
questions. Because of possible uncertainty the researcher decided to conduct a
study which includes both quantitative and qualitative research analyses.

105
3.1.1 PURPOSE OF THE RESEARCH
In order to address the research topic, the literature on project management
methodology and project success factors was reviewed in chapter 2.
The literature review also form the basis of the research topic and research
questions as presented by Creswell (1994 and 2008).
The discussion on the research method will include the following:
1 The research topic.
2 The research problem.
3 Evidence gathered from the literature that justifies the research.
4 Deficiencies in evidence.
5 Identify the primary and secondary success factors.
6 Importance of the programme for the client, stating the following:
• The case study evaluation will be conducted by means of coding and
content analysis.
• The research problem: why and how the effect of a lack of knowledge
and experience in the project life cycle can influence the critical success
factors.
• Twenty-five critical success factors are mentioned in the questionnaire.
Quantitative as well as qualitative surveys will determine fifteen most
critical success factors.
• Factual evidence will be provided from the literature and then
amalgamated with practical evidence from the project management and
construction environment.
3.1.2 RESEARCH INSTRUMENT
A quantitative survey instrument (five point Likert scale) was used to rank the
critical success factors. The instrument was used to implement a ranking analysis
instead of a rating analysis. Kohn (1977) and Rokeach (1973) argue that ranking
(qualitative) is often viewed as conceptually more appropriate for value
measurement but also difficult for the participants. According to them ratings
106
(quantitative) are thought to be easier to administrate and less difficult for
participants.
The five point Likert scale will also be suitable to accommodate Pinto & Slevin’s
(1989) hypothesis of ”to tabulate individual factors rather than grouping them
according to some criteria to help analyse the interaction between them and the
possible consequences”.
The survey instrument will also determine the fifteen most critical success factors
of the twenty-five listed in the questionnaire. Why and how a lack of knowledge
and experience on the part of the project manager within the project life cycle
phases affecting the critical success factors will also be determined. The
qualitative research analysis will prove the statement of Pinto & Slevin (1989)
given above, while both the quantitative and qualitative analyses answer the
research questions.
This research will identify what the reasons are to reveal the research objectives
listed above. This process will be further reviewed in more detail in chapter four.
3.2 RESEARCH QUESTION
Spradley (1980) states that a researcher normally reduces her or his research study
by formulating a single, overarching central question and following that up with
several secondary questions.
Following Spradley, the main and secondary questions of this research were
formulated as follows:
The primary research question is:
What are the main success factors in project management in the design and
construction industry?
107
The secondary research questions are as follows:
2 How do the critical success factors affect the project life cycle?
3 How can the effect of a lack of knowledge and experience on the part of the
project manager within the project life cycle phases influence the critical
success factors of project management?
4 Why are these critical success factors important to be implemented?
3.3 RESEARCH METHODOLOGY
When the relevant literature has been studied and the research questions
formulated, the next step in the research process is to decide on the most suitable
methodology approach.
Cooper and Schindler (2003) argue that the research approach limits itself to the
chosen data collection methodology or case studies. The literature reviewed in the
previous chapter pointed to the fact that the complexity of the field of study would
require more than a simple research methodology. A combination of a quantitative
survey and a qualitative case study analysis was therefore chosen. The
quantitative survey should be completed first, as the case study will allow
questions or problems that arose from the results of the quantitative survey to be
addressed.
Hence the sequence will be:
Phase 1 Quantitative survey study and sample size (Pinto and Slevin 1987)
Phase 2 Qualitative case study analyses
Phase 3 Content analysis
Ranking versus rating on a Likert scale was performed. Harzing et al. (2009) and
Creswell (1994) argue that qualitative research questions should be open-ended,
evolving and without limitations.
108
Quantitative survey research was carried out by sending the survey questionnaires
to various participants to identify the critical success factors and grouping these
factors by a ranking versus rating theory.
Qualitative case study analysis: Evaluation and verification of four case studies
will be reviewed and assessed in correlation to the questionnaire for a reliable
outcome.
3.4 RESEARCH ANALYSIS
The research procedures and analyses will be discussed and assessed in chapters 4
and 5.
To find solutions for the research questions, Pinto and Slevin’s (1989) theory of
ranking versus rating will be applied. The research will be conducted by means of
the five point Likert scale application as defined by Krosnick and Alwin (1988)
and Alwin and Krosnick (1985) for both the quantitative analysis and qualitative
studies.
3.5 TARGET POPULATION AND/OR PARTICIPANTS
Asmussen and Creswell (1995) suggest that a variation of case studies be selected
to cover maximum differences as a sampling strategy which will, in turn, make a
diverse case analysis possible.
Carey (1975) states that there are no definitive guidelines regarding sample size,
both in a quantitative or qualitative study. The final decision will be a compromise
between the practical and theoretical requirements of the study. Other
considerations such as time, cost and resources available to the researcher also
have to be taken into account.
The sample size will be obtained by inviting a large number of engineers in
Gauteng, S.A. via email or handouts to participate voluntarily in the research.
Those who indicate that they are willing to participate and, in fact, complete the
109
questionnaire, will form the size of the sample. The participants will be assured
that their answers and identity or company will be treated with confidentiality and
that the survey will not request any identification from the respondent. See
response rate in Chapter 4; Table 4.1 and 4.2.
For this research selected participants in the construction and development
environment were targeted. These participants represent the engineering
profession as engineers, project managers, consultants and contractors in South
Africa.
A concern about quality expressed by the South African Construction Industry
publication (CIDB) (2011) justifies the decision to target this specific industry.
The researcher shares the above concerns and with this in mind drew up a
questionnaire based on available information. The proposed questionnaire
(questionnaire specimen) will indicate the extent to which the five main factors
(Chapter 2: Section B) in the project life cycle have contributed to the research
topic after the participants have replied and when the selected case studies have
been analysed.
3.6 RESEARCH DESIGN
The design and methodology of this research was chosen to assess project teams’
knowledge and practice and to discover the most important ways in which it
affects the current project life cycle phases. Both qualitative and quantitative
procedures are used to find out whether there is a correlation between critical
success factors for project management in construction industry and to assess the
critical factors affecting the project life cycle domain.
In the construction and development industry there are several ways to discover
which success factors are critical. The researcher also needs to find out why and
how these success factors influence typical industry problems and at what stage in
the project life cycle they emerge.

110
Bryman and Bell (2003) are of the opinion that both quantitative and qualitative
techniques are useful for conducting a research while other authors believe that
qualitative techniques are more appropriate for researching development issues.
Ghauri and Gronhaug (2002) and Reichardt and Cook (1979) on the other hand,
strongly support the qualitative approach. They find it to be more factual. When
the scope of this research is taken into account, it must be said that quantitative
methods will probably provide more valid data. However qualitative methods are
more flexible and can be used to include different aspects of the research question
and therefore develop a more in-depth study.
Jankowicz (1991) argues that these two research approaches can complement each
other and lead to a sound analysis of the research.
Bryman and Bell (2003) support the above author’s statement. One advantage of
using the two approaches together is that it enforces the triangulation or content
analysis model. When data from different sources are considered, there should
also be an increase in the validity of the findings.
Semi–structured interviews were chosen as a data collection technique to explore
the research question in depth and add value to our knowledge of success factors
in the construction industry.
3.7 SURVEY DESIGN
According to Kothari (2004) a descriptive design involves planning and
organising as well as the analysis of the data to provide the information that is
being sought. This design provides a great depth of responses, and therefore
results in a better understanding of the phenomenon under study.
The survey design involves the gathering of data that will describe certain events,
as well as the tabulation and interpretation of those data.
111
Descriptive studies represent the variables by answering who, what and how
questions (Babbie 1998). According to Mugenda and Mugenda (2003) descriptive
design is a process of collecting data in order to test hypothesis or answer the
questions of the current status of the research. This method is used extensively to
describe behaviour, attitude, characteristic and values. The survey design
evaluates the research topic at hand.
SECTION 2
3.8 QUANTITATIVE SURVEY METHODOLOGY
3.8.1 PHASE 1: RESEARCH DESIGN INSTRUMENT
According to Beardsworth (1980) there are several stages involved in developing
a sampling strategy. Firstly, the range of the content to be studied (the participants
of your research) has to be defined. Secondly, a decision is to be made about what
the sampling unit is to represent. Beardsworth (1980) is of the opinion that the
sample consists of people or institutions, the sampling unit is self-evident, but that
the unit of analysis is not readily identified when texts are involved. Some
quantitative content analysis studies have a very precise focus.
Gill and Johnson (2010) argue that questionnaires tend to be used for descriptive
or explanatory research. They add that although questionnaires may be used as the
only data collection method, it may be better to link them with other methods in a
research design.
3.8.2 QUANTITATIVE RESEARCH METHOD
A quantitative research method is a systematic approach whereby data of various
relationships and phenomena are gathered. This method will ask specific
questions to collect and analyse numerical data using a statistical instrument. The
quantitative research questionnaire is designed to collect data from experiments
and other surveys and by means of correlation (Creswell, 2008). Statistics from
the data derived from quantitative research allow the researcher to check the
relationship between variables.

112
Pekrun and Stephens (2010) explain that the data collection method relies on
various samples, and that the structured data collected are made to fit into
predetermined response categories.
Saunders, Lewis and Thornhill (2007 and 2009) claims that the results from
quantitative methods are straightforward and easy to categorise, compare and
summarise. The core of quantitative research is testing the hypothesis or research
question that was formulated after a preliminary study of a phenomenon and/or
various theories.
In this research the participants were selected to evaluate the research
questionnaire and to give their personal evaluations. The participants were
selected from the design and construction environment industry. The outcomes of
the questionnaires were statistically categorised.
3.8.3 RESEARCH QUESTION
The main research question is: What are the main success factors in project
management in the design and construction industry?
3.8.4 DESIGNING THE QUESTIONNAIRE
Pinto and Slevin (1989) considered the success factors identified by themselves
and eleven other international researchers (Martin (1976); Locke (1984); Sayles
and Chandler (1971); Baker, et.al (1983); Morris and Hough (1987); and Cleland
and King (1983) and found a total of 71 of these success factors in the literature.
The above researchers then reviewed these success factors, deleted duplications
and narrowed the number down to 40 success factors. Pinto and Slevin (1989)
concluded: “Although several lists of factors are generated, they seem to tabulate
individual factors rather than grouping them according to some criteria, to help
analyse the interaction between them and the possible consequences”. By using
various criteria Pinto and Slevin (1989) then reduced the number of success
factors to 25.
113
For the purpose of this study the researcher also selected 25 critical success
factors out of 71 identified by the thirteen authors. The survey questionnaire
requested the participants to select, out of the 25 success factors listed and across
all four phases, the 15 or more critical success factors that they deemed the most
important.
This research questionnaire was designed by using a template used by various
researchers such as mentioned above (Annexure 1: National Survey Questionnaire
as compiled by the researcher, pp. 218).
Foddy (1994) discusses validity and reliability in terms of the questions and
answers. In particular, he emphasises that the questions must be understood by the
participant in the way intended by the researcher. The answer given by the
participant must be understood by the researcher in the way intended by the
participant. This means that there are various stages that must occur if the
question is to be valid and reliable. It also means that the design stage is likely to
involve substantial rewriting in order to ensure that the participant decodes the
question in the way the researcher intended.
A descriptive survey design was adopted for this study. According to Kothari
(2004) a descriptive design involves the planning, organising, collecting and
analysing of data so as to provide the information being sought. This design
provides a great depth of responses resulting in a better and more detailed
understanding of the study.
This research design involved gathering data that described events and then
organise, tabulate, represent and described the data. Descriptive studies must
portray the variables by answering who, what and how questions as noted by
Babbie (1998).
114
3.8.5 THE LIKERT SCALE INSTRUMENT
In this research a five point Likert scale instrument will be used as survey
instrument in both the quantitative and the qualitative research studies.
The questionnaire example and explanation is attached below (Table 3.1:
National survey questionnaire example, pp. 115).
3.8.6 QUESTIONNAIRE EXAMPLE AND EXPLANATION
The participant has to comply with the instructions as indicated on the survey
form (Annexure 1: National Survey Questionnaire as compiled by the researcher,
pp. 218).
The aim of the research and questionnaire is to identify the most important factors
which influence project success in the construction industry. The research has an
“A and B” section. Section A consists of twelve (12) personal questions. Section
B consists of a questionnaire which covers the four phases of the project life cycle
(concept, planning, implementation / construction and closing out) and the fifth
phase stating the success factor ratings of choice.
Questions are based on overall experience in project management of design and
construction projects. The participant must select not less than the 15 most
important success factors (SF) of his/her choice for each of the phases 1, 2, 3 and
4 by marking them with an X. (The request that participants identify their selected
preferences in the questionnaire by marking them with an X, allowed the
researcher and the participant to be unbiased).
Phases 1, 2, 3 and 4 represent the project life cycles.
In phase 5 (the ranking phase), the participant must rate the 25 success factors
from 1 to 25 starting with the most important or favoured success factor (1) and
continuing to the least important success factor as (25).

115
EXAMPLE: NATIONAL SURVEY QUESTIONNAIRE
SUCCESS FACTORS
Phase 1
Concept
Phase 2
Planning
Phase 3
Implementa-
tion
Construction
Phase 4
Closeout
Success
Factor
Rating
1 to 25
1. Competent project
manager.
X X X X 1
2. Client participation and
approval on project,
design – construction
X X X 2
3. Project mission – clearly
defined goals, objectives,
scope of works.
X X 10
4. Top management
support.
X X 4
5. Competence of project
team.
X X 5
6. Sufficient project
resources.
X 9
7. Effective communication
between participants.
X 7
8. Reliable and experienced
contractor services.
X X X 3
Table 3.1: National questionnaire example. (Participant to complete)
3.8.7 RESEARCH INSTRUMENT
The primary data for this study was collected by using a survey questionnaire. The
questionnaires that were used consisted of a mixture of open-ended and closed-
ended questions and were designed to address Pinto and Slevin’s (1989) theory
and Dillman, Smith and Christian (2014) tailored design method.
This allows for intensity and richness of individual perceptions in responses. The
study uses questionnaires because they are flexible and facilitates the capture of
116
participants’ in-depth knowledge, promote participant cooperation and allow for
further probing in order to clarify certain issues. Andersen, Barton and Wrieden
(2004) state that questionnaires for data collection are appropriate because they
are easy to analyse and are cost-effective.
A complete survey questionnaire and letter requesting information were delivered
to all the participants (see Annexure 1: National survey questionnaire, pp. 218).
3.8.8 PILOT TESTING
After many years of project and construction management experience and also
reviewing many research papers related to the research subject, this researcher
formulated a pilot questionnaire. Initially there would have been a list of not more
than fifteen questions but the literature review convinced the researcher to deviate
from standard practice and use another method of research and evaluation.
This research questionnaire was designed to complement Pinto and Slevin’s
(1989) statement and therefore twenty-five (25) relevant success factors were
selected and the participant was asked to select not less than fifteen success
factors (of his/her choice) for each phase from that list. Phases 1 to 4 comprise the
project life cycle phases and here the participant needs to mark his fifteen or more
selected success factors (out of a total of 25) with an “X”. In phase 5 the
participant has to rate all 25 factors from his/her most preferred factor (nr 1) to his
least important factor (nr 25).
Bell and Waters (2014) and Dillman et al. (2014) advice, “however pressed for
time you are, do your best to give the questionnaire a trial run, as without a trial
run, you have no way of knowing whether your questionnaire will succeed”.
The questionnaire was sent to eight senior engineering managers that are well
acquainted with the project management and construction industry for their
review, input and feedback. They suggested a few changes after which a second
and final review was done. The final questionnaire was then e-mailed, run online
117
and hand delivered to selected professional participants of companies in the
design and construction industry. These participants included participants with
many years’ experience, project directors, senior project managers, senior design
engineers and construction managers. All of them were graduated engineers.
3.8.9 QUESTIONNAIRE SURVEY INSTRUMENT
For this research a quantitative questionnaire survey was used for collecting the
primary data. The motivation was to remove the bias from the researcher and the
participant. The researcher predicts that Pinto and Slevin’s (1989) statement can
possibly address the concerns and questions associated with the research topic.
Bruner (2013) confirms that ranking surveys normally involve the use of a five
point Likert scale instrument on which the participants rate their level of
agreement or the level of importance of a series of statements on a predefined
number of scale points. In order to use Pinto and Slevin’s (1989) theory and
address the outcomes of the research topic, the five point Likert scale was
converted to rating and ranking both the quantitative and qualitative research
assessments.
The same questionnaire instrument will be used to assess and validate the case
studies qualitatively by utilising the coding numbering method. (See both
examples below).
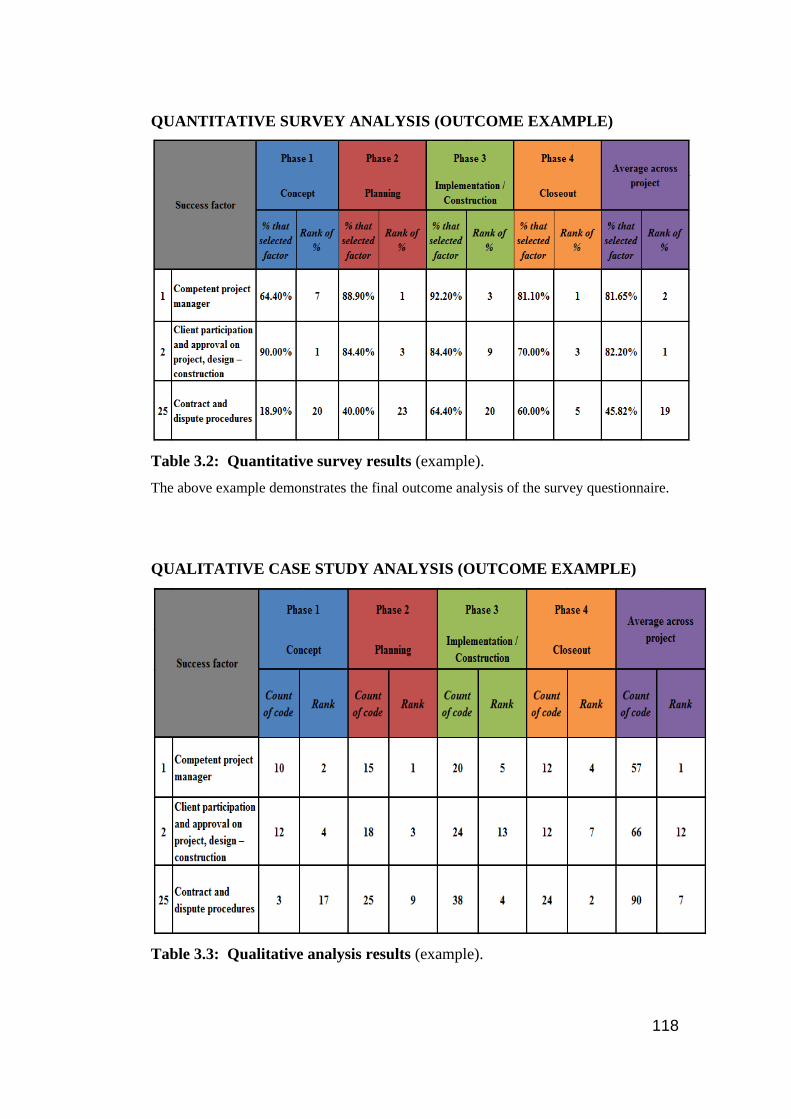
118
QUANTITATIVE SURVEY ANALYSIS (OUTCOME EXAMPLE)
Table 3.2: Quantitative survey results (example).
The above example demonstrates the final outcome analysis of the survey questionnaire.
QUALITATIVE CASE STUDY ANALYSIS (OUTCOME EXAMPLE)
Table 3.3: Qualitative analysis results (example).

119
The above example demonstrates the final outcome analysis of the case study
ranking and coding of success factors.
3.8.10 DATA COLLECTION METHOD
Questionnaires were used to collect the quantitative survey data information. The
primary data was collected by using semi-structured questionnaires, which
included a five point Likert scale questionnaire. The structured questions give the
participant limited and pre-determined response options. The answers given to
these structured questions were easy to analyse but they left no room for other
possible responses. The questionnaires were self-administrated by an e-mail
coding programme (online) with a send and response programme with a single
receipt and reply option, email as well as hand-delivered. These methods were
used to ensure confidentiality and avoid receiving more than one response from a
single participant.
The process of gathering essential data and preparing them for analysis is called
data collection. As mentioned by Saunders et al. (2007 and 2009) there are many
approaches to collect the data required for research purposes.
One research method was used for both the qualitative and quantitative data
collection process but gave different results.
3.9 QUALITATIVE CASE STUDY METHODOLOGY
3.9.1 PHASE 2: INTRODUCTION
Case studies are a method of research that is difficult to characterise with a simple
definition. A case study gives the history and observation during construction of a
project and is of much value in case of any dispute or failure (collapse) during the
construction period.
Yin (1989) defines a case study as an experimental investigation for the following
reasons:
1 To investigate a current phenomenon within its real-life context.
2 To use it as a methodology when boundaries between phenomenon and
context are not clearly evident, and

120
3 To use multiple sources of evidence already collected.
According to Yin (1989) the use of case studies is a form of approach that is
different from other non-experimental methods.
3.9.2 CASE STUDY METHODOLOGY
In this section the proposed research methodology will be made clear. The theory
of knowledge, especially with regards to different methods and the distinction
between what is justified and what is someone’s opinion will also be established.
Eisner (1988) argues that there are no specific formats for conducting a qualitative
study. He further states that a case study is expected to capture the complexity of
a single incident. Case study methodology is often used in the fields of sociology,
economics, environmental studies and education.
Yin (1994), Merriam (1988 and 1998), Stake (1995, 1998), Gillham (2001) and
Miles and Huberman (1994) all agree that there are different viewpoints about the
definition and purpose of case studies.
In general it is agreed that a case study should have a “case” which is the object of
the study and that it can be described as follows:
• It is contemporary of nature.
• A case can be investigated in its natural context with a multitude of
methods.
The case study researchers mentioned above emphasise different features but
Stake (1998) argues that it is crucial to keep in mind that the object of study is a
case and that a case study research is not the method of investigation. A case
study must be seen as the interest in an individual case and not by the methods of
inquiry used.
In contrast Yin (1994) places more emphasis on the method and techniques that
are used in a case study.
121
3.9.3 THE CASE STUDIES
In the qualitative research a number of selected case studies were reviewed and
assessed. Thirty four case studies were reviewed after which four case studies
were randomly selected by the researcher as the sampling to review. All thirty
four case studies were related to the construction industry and contained various
instances of failure and defects. Chapter 2 discussed the relevant terminology as
well as the selected success factors.
According to Flyvberg (2011) and Denzin and Lincoln (1994) choosing a case
study and determining its boundaries are key factors in defining a case study. He
further argues that once a case study is defined, the research sets out to understand
the dynamics of the topic being studied within its settings or its context.
Eisenhardt (1989) and Eisenhardt and Graebner (2007) are of the opinion that
understanding the dynamics of the topic refers to the interactions between the
subject of the case and its context.
The selected case studies will ultimately answer the research question, as it will be
discovered how and why they were reported to be accidental failures during their
project life cycle phases. The Likert scale instrument that was used for the
quantitative research survey was also used for coding the case study analyses with
minor changes to fit its purpose. The application and the methodology of the
Likert scale instrument were adapted so that it could be used in both research
interventions under the following topics:
Phase 2:
1 Research strategy
2 Data analysis
3 Research approach
4 Categorisation of data
5 Interpretation of data
122
Phase 3:
1 Identification of patterns
2 Synthesis and generalisation
3 Validity and reliability
3.9.3.1 RESEARCH STRATEGY
The research literature is applicable for both the quantitative and the qualitative
research information described under items 3.1.2 to 3.7.
The research information below will analyse the qualitative case studies according
to the methods used by Creswell (1994) and Stake (1995). According to McCuen
(1996) the term research refers to the development of new information for the
body of knowledge. Scientific research refers to the systematic, controlled,
experimental and critical investigation of a hypothetical proposition in order to
find the solution to a problem or discover and interpret new knowledge.
According to Stone (1978) a scientific investigation and verification of the
research knowledge involve empirical research based on the belief that all
knowledge originates in experience.
The research presented in this study deals with facts that have objective reality
and are based on empirical research. In this research informed and critical
questioning of an existing phenomenon led to a problem statement and
formulation of the research question.
Multiple case studies were analysed and scrutinised.
Yin (1993) states when case studies are analysed for qualitative research,
replication methods and not sampling logic should be used. This means that two
or more cases should be included within the same study precisely because the
researcher predicts that similar results (replication) will be found. If such
replications are indeed found in several cases, the researcher can have confidence
in the overall results. The development of consistent findings over multiple cases
can underpin the reason for the research and be considered a very forceful finding.
123
He further states that examining a number of cases enhances the accuracy, validity
and reliability of the results.
3.9.3.2 DATA ANALYSIS
Stake (1995) argues that case study analysis consists of making a detailed
description of cases and their settings. If the case reveals an order of events it is
important to analyse multiple sources of data to determine events for each step or
phase in the development. Direct interpretation as well as naturalistic
generalisation should be used here.
3.9.3.3 RESEARCH APPROACH
The following approach is useful when research is conducted:
1 Hypothesis: The formal expression of a preconceived factual relationship
and provides an uncertain explanation or solution to the problem in
question.
2 Experimentation: Using a specific design of the study to lead to a systematic
and controlled testing of the hypothesis or research question.
3 Induction: An overview of the experimental results which will lead to the
formal statement of the theory.
4 Empirical research has a number of different approaches to research
strategies.
Yin (2003) points out that a research strategy is not distinguished by the following
directives:
1 Case studies are appropriate for the explanatory/descriptive phase of an
investigation.
2 Surveys are appropriate for the descriptive phase.
3 Experiments are the only way of developing explanations for casual
inquiries.
It is, however, distinguished by conditions such as:
• The type of research question created;

124
• The extent of control that the researcher has over actual behavioural events,
and
• The degree of focus on contemporary as opposed to historical events.
The research questions for this study are:
• How are the success factors related to the research topic?
• What are the real causes that influence the research topic?
The particular research question and the variables involved in the research will
determine a research strategy among the various strategies available to the
researcher.
3.9.3.4 CATEGORISATION OF DATA
Historical research is concerned with historical events or a specific approach to
contemporary events or problems. Historical research can also be used to help
solve problems through an examination of what occurred in the past (Bennet
1991).
The researcher therefore used case studies to examine contemporary events,
especially as the relevant behaviour of the phenomenon being studied could not be
manipulated, as is possible in experiments.
Case studies have two sources of evidence namely: direct observation and
systematic interviewing.
In this section the proposed research methodology will be explained. The
different viewpoints of the research will be established, as well as the methods
that were used in this particular venture.
3.9.3.5 INTERPRETATION OF DATA
Yin (2014) refers to a case study as an event, an entity, an individual or even a
unit of analysis. A case study is empirical research that investigates a
contemporary phenomenon within its real life context using multiple sources of

125
events. According to Yin (2014) there are three types of case study research
namely exploratory, descriptive, and explanatory research. For example, the
exploratory case study can be used as a basis for formulating questions or testing
theories. In the descriptive case study a phenomenon is described and the facts of
how and what happened are given. Explanatory research can be useful to study
processes in companies.
In this research four case studies will be contrasted and reviewed and how and
why questions will be answered.
Anderson (1993) states that case studies are concerned with how and why things
happen, and are used to investigate background realities and the differences
between what was planned and what actually occurred. He agrees that a case
study is not intended as a study of the entire organisation but is intended to focus
on a particular issue, feature or unit of analysis. Patton (1987) states that case
studies are used to probe an area of interest. Case studies become particularly
useful where one needs to understand a particular problem or situation in great-
depth.
PHASE 3: CONTENT ANALYSIS
3.10 IDENTIFICATION OF PATTERNS
Yin (2014) emphasises that pattern-matching involves predicting a pattern of
outcomes based on theoretical propositions to explain what you expect to find
when you analyse your data.
3.10.1 CONTENT ANALYSIS
Multiple case studies are used to improve the outcomes of the research and to
explain the importance of knowledge and experience in the design and
construction environment. The choice for multiple cases is appropriate given that
Yin (1993) argues that multiple-case studies should follow a replication and not a
sampling logic. This means that two or more cases should be included within the
same study precisely because the researcher expects similar results (replication).
126
According to the researcher the outcomes of the case studies analysed together
with the questionnaire interpretation will reveal the reliability and validity of the
study. The development of consistent findings, over multiple cases, can then be
considered a very robust finding.
Yin (1993) states that examining a number of cases enhances the accuracy,
validity and reliability of the results and reveals the essence of the subject studied.
3.10.2 VALIDITY OF INSTRUMENT
According to Bell and Waters (2014) the researcher has to explain to the
participant the purpose of pilot testing and its validity, namely that a pilot test
involves a preliminary testing of data collection tools and procedures to identify
and eliminate problems and then to make corrective revisions to the instruments
and data collection procedures. This is done to ensure that the data eventually
collected will be reliable and valid. Bell and Waters (2014) further emphasise that
the reliability and validity of research instruments determine the quality of data
collection and hence that of the whole research. Information given by participants
in the pilot test was used to improve the reliability and validity of the final
questionnaire. After the feedback had been analysed, questions found to generate
unreliable or invalid information were adapted or changed in order to ensure more
reliable and valid information.
Bloomberg, Cooper and Schindler (2014) emphasise that the validity of a
questionnaire refers to the ability of that questionnaire to measure what you intend
it to measure.
Literature on the subject was extensively reviewed in order to establish a reliable
and viable instrument.
127
3.11 SUMMARY
The purpose of this chapter was to describe the research framework and explain
how it will be implemented into the research. This chapter also laid the foundation
for the subsequent discussion of the research data and the conclusions drawn from
them.
Case study research (qualitative) and survey analysis (quantitative) were used in
this study and the process of these particular methods will be discussed in detail in
the chapters to follow. It will be further explained why case study research and
survey analysis were both chosen as methods.
This chapter highlighted the sequential order of the steps taken in the research; the
type of research design; data collection methods; and the validity; and reliability
of both qualitative and quantitative research methods. The research objective and
research questions will be addressed in the following chapters.

128
CHAPTER 4: QUANTITATIVE SURVEY ANALYSIS
4.1 INTRODUCTION
PMBOK Guide (2013) describes the project management process as a five life
cycle scale process, while Adams and Barndt (1983) and Cleland and King (1983)
refer to a four phase life cycle process. These two frameworks are widely
accepted and are, in fact, recognised by most top management institutions. The
five phase life cycle process is similar to the four phase life cycle process except
for an additional phase, namely monitoring and controlling of process groups.
The fifth phase is covered in the research of Pinto and Slevin (1989) as well as in
this research. Pinto and Slevin (1989) agree with other researchers on the
previously selected 71 success factors distributed across the four phases of the
project life cycle.
From those 71 factors this researcher selected 40 factors that he regards as the
most relevant. He then narrowed the field to 25 success factors, and listed them in
a questionnaire. These 25 success factors (SF) were used for both the quantitative
and the qualitative studies and questionnaires.
Participants were requested to select the 15 success factors in each of the four
phases of the questionnaire that they deemed most relevant. Regarding the rating
of success factors in column 5, the number “1” is to be selected for the most
important factor whereas “25” is for the least important factor (PMBOK Guide
(2013). The results of the participants’ rating of success factors are presented in
Table 4.3 and also displayed in the Spider-webs 4.1 to 4.5 and Bar and Line
graphs 4.1 – 4.4 illustrating the most important factors in each of the life cycle
phases.
This research will assess the research topic by reviewing the closeout lessons
learned from executing and reviewing the survey research results of the
questionnaire and doing the case study analysis. The research methods used were
field interviews with project stakeholders, analysing relevant case studies as well

129
as analysing the results of a questionnaire. All of these highlight the primary and
secondary critical success factors of project management.
The main objective and the primary research question will be addressed in this
chapter.
4.2 DATA PRESENTATION ANALYSIS AND INTERPRETATION
PURPOSE OF THE RESEARCH
This chapter focuses on the presentation of the primary data analysis and includes
discussions of the research study and conclusions drawn from it. The objectives of
this study are to select the 15 most important success factors (in each of the four
phases) from the 25 nominated success factors in the survey questionnaire and to
determine their effect during the execution of the project life cycle phases (PLCP).
This study also aims to determine when, how and why these success factors affect
the project life cycle phases (PLCP). Lastly the study hopes to measure the four
projects described in the case studies against the 15 selected success factors in
each of the four phases to discover the reasons for their failure (see Chapter 5).
The selection of success factors were discussed in chapter 2, hence they will only
be referred to in this chapter when relevant. They are listed from 1 to 25 in the
questionnaire.
4.3 PARTICIPATION IN THE SURVEY RESEARCH
Participation was entirely voluntarily and the researcher guaranteed the anonymity
of all the responses received. A copy of the invitation to participate in the
questionnaire is attached as Annexure 1: National survey questionnaire, pp. 218.
The questionnaire has two sections and follows the model of Pinto and Slevin
(1989) that is described in Chapter 3. The survey will be evaluated by using a five
point Likert scale instrument and a ranking versus rating analysis will be
conducted.
130
4.4 GENERAL INFORMATION REGARDING THE SURVEY
CONDUCT
The following information was used when the survey was conducted and also
when a Likert scale instrument was used to test for the validity and reliability of
the results.
The following authors discussed the use of ranking versus rating on a Likert scale:
• Harzing et al. (2009): ranking generally requires a higher level of attention
than rating, as all the alternatives in the answer have to be considered before
a choice can be made. As a result, ranking may lead to higher data quality
(Alwin & Krosnick (1985) and Krosnick & Alwin (1988).
• Ranking scales are useful to avoid traditional response bias. Each choice on
the scale may be used only once: most important to least important, most
satisfactory to least satisfactory, most likely to least likely.
• “Although not stated explicitly in most literature, there is a consensus that
the ranking approach is better than the rating approach because the ranking
approach is more in accordance with the fundamental idea of the structure
of individual values” (Moors (2010) and Vriens et al. (2015).
• Other (proponents of the ranking method) include:
DeChiusole and Stefanutti (2011). Rating, ranking, or both? A joint
application of two probabilistic models for the measurement of values.
Testing, Psychometrics, Methodology in Applied Psychology. Vol. 18(1),
pp. 49–60.
- Harzing, A. W., Baldueza J., Barner-Rasmussen W., Barzantny C.,
Canabal A., Davila, A. & Zander L. (2009). Rating versus ranking: what
is the best way to reduce response and language bias in cross-national
research? International Business Review, 18(4), pp. 417– 432.
- Krosnick J. A. & Alwin D. F. (1988). A test of the form resistant
correlation hypothesis: ratings, rankings, and the measurement of values.
Public Opinion Quarterly, 52(4); pp. 526–538.
- Miethe, T. D. (1985). The validity and reliability of value measurements.
The Journal of Psychology, 119(5); pp. 441–453.
131
- Van Herk, H. & Van de Velden M. (2007). Insight into the relative merits
of rating and ranking in a cross national context using three-way
correspondence analysis. Food Quality and Preference, 18(8); pp. 1096–
1105.
The software used for analysing the 90 quantitative questionnaires was IBM SPSS
Statistics 24 and the software used for data capturing was MySQL.
4.5 QUANTITATIVE ANALYSIS METHODS: PRIMARY SURVEY
Data collected from the questionnaire were cleaned and the sample scaled down to
include only participants that met the following two criteria:
• The participant identified not fewer than 15 important success factors (SF)
in each of phases 1 to 4 by selecting the box in the phase column marked
with an “X”.
• They rated the 25 success factors in phase 5 from 1 to 25, 1 being the
highest rating and 25 the lowest.
Ultimately a total of 90 participants were used for the analysis.
• Frequencies (distributions)
• Descriptive (mean and standard deviation)
4.6 RESPONSE RATE
From the research questionnaire the following response information was received
and statistically verified to ensure its reliability and viability.

132
This table below shows the results on the response as verified.
Response rate
Population Frequency Percentage
__________________________________________________________________
Responded 90 70.3
No of defective responses 38 29.7
Total 128 100
Table 4.1: Response rate (participants)
From the study sample of 128 participants, 90 were found reliable and 38 were
found to be defective. This constituted a 70.3% response rate. The questionnaires
were self-administered to the participants and the purpose of the research
explained to them by means of email and a give and take method. According to
Oswald, Mossholder and Harris (1997) a response rate of 50 % and above are
adequate for data analysis. The researcher made use of the five point Likert scale
to perform a ranking and rating analysis. Iacobucci (2010) states that if a survey
model is not overly complex and the data collected from a reliable source, a
sample size of 50 can be adequate for meeting the research objective.

133
Quantitative: Participant description analysis (N=90)
Table: 4.2 Participant description analysis (N=90)
Descriptor N = 90 Valid percentage
Province Gauteng 83 93.26%
North West 5 5.62%
Limpopo 1 1.12%
Highest qualification ND 1 1.12%
NC 1 1.12%
HND 6 6.74%
BSc 40 44.94%
BEng 22 24.72%
B.Tech 1 1.12%
MSc 11 12.36%
M.Eng 7 7.87%
Design work experience Less than 2 years 3 3.37%
2-5 years 32 35.96%
6-10 years 37 41.57%
More than 10 years 17 19.10%
Construction work
experience
Less than 2 years 4 4.71%
2-5 years 19 22.35%
6-10 years 50 58.82%
More than 10 years 12 14.12%
Area of specialisation Construction management 25 27.78%
Civil engineering 28 31.11%
Structural engineering 2 2.22%
Electrical engineering 26 28.89%
Other 9 10.00%
Role in project Client / owner 2 2.30%
Consultant 80 91.95%
Contractor 3 3.45%
Other 2 2.30%
Position in organisation Project director 4 4.65%
Project manager 48 55.81%
Contract manager 5 5.81%
Project engineer 20 23.26%
Consultant 4 4.65%
Designer 4 4.65%
Other 1 1.16%
Project type Building and construction works 33 38.37%
Civil and structural works 24 27.91%
Mechanical works 6 6.98%
Electrical works 21 24.42%
Other 2 2.33%
Budgeted project cost Less than R10 million 4 4.49%
R10 million - R20 million 9 10.11%
R20 million - R50 million 6 6.74%
R50 million - R100 million 31 34.83%
More than R100 million 39 43.82%
Planned project duration Less than 1 year 1 1.18%
1-3 years 16 18.82%
More than 3 years 68 80.00%

134
4.6.1 OVERVIEW OF QUANTITATIVE SURVEY ANALYSIS
The study sought to establish the profile of the participants in terms of the
following:
Sample size description (N=90)
• The majority of the participants were located in Gauteng (93.3%) (N=83).
• The majority of the participants had a BSc degree (44.9%) (N=49).
• The work experience of the participants were typically 6-10 years’
experience in design and construction work (N=37).
• The main areas of specialisation were civil engineering (31.1%) (N=28),
electrical engineering (28.9%) (N=26) and construction management
(27.8%) (N=25).
• The roles of project manager (55.8%) (N=48) and project engineer (23.3%)
(N=20) were mainly filled by consultants (92%) (N=80).
• The majority of the projects were building and construction work projects
(38.4%) (N=33) with large budgets (over R100 million) (43.8%) (N=39)
and spanning more than 3 years (80%) (N=68).
The findings in Table 4.2 above point to the fact that participants in the
questionnaire were literate and competent personnel who had experience of the
performance principles used in project management.
4.7 REVIEW OF RANKING RESULTS
The quantitative five point Likert scale questionnaire listed 25 success factors
(SF). The results as received from the participants were analysed using a ranking
method as discussed by DeChiusole and Stefanutti (2011) and Harzing et al.
(2009).
The software used for analysing the 90 quantitative questionnaires was IBM SPSS
Statistics 24 and the software used for data capturing was MySQL.
• Success factor analysis
Success factor 1: a competent project manager was ranked (7, 1, 3 and 1) in the
four phases 1 to 4. This means that random rating as discussed by DeChiusole and
135
Stefanutti (2011) was imposed. The result also complied with Pinto and Slevin’s
theory (1989). The other five success factors (numbers 2, 3, 4, 5 and 7) are
indicated in the table below (Table 4.3 pp. 136). When the four phases were
grouped together as one unit the 25 success factors were ranked from the highest
to the lowest in one list (column 5: Average across project). The single most
important success factor was therefore revealed, as well as the rankings of the
other success factors.
Only the success factors rated above 60% were taken into consideration (Table
4.3).
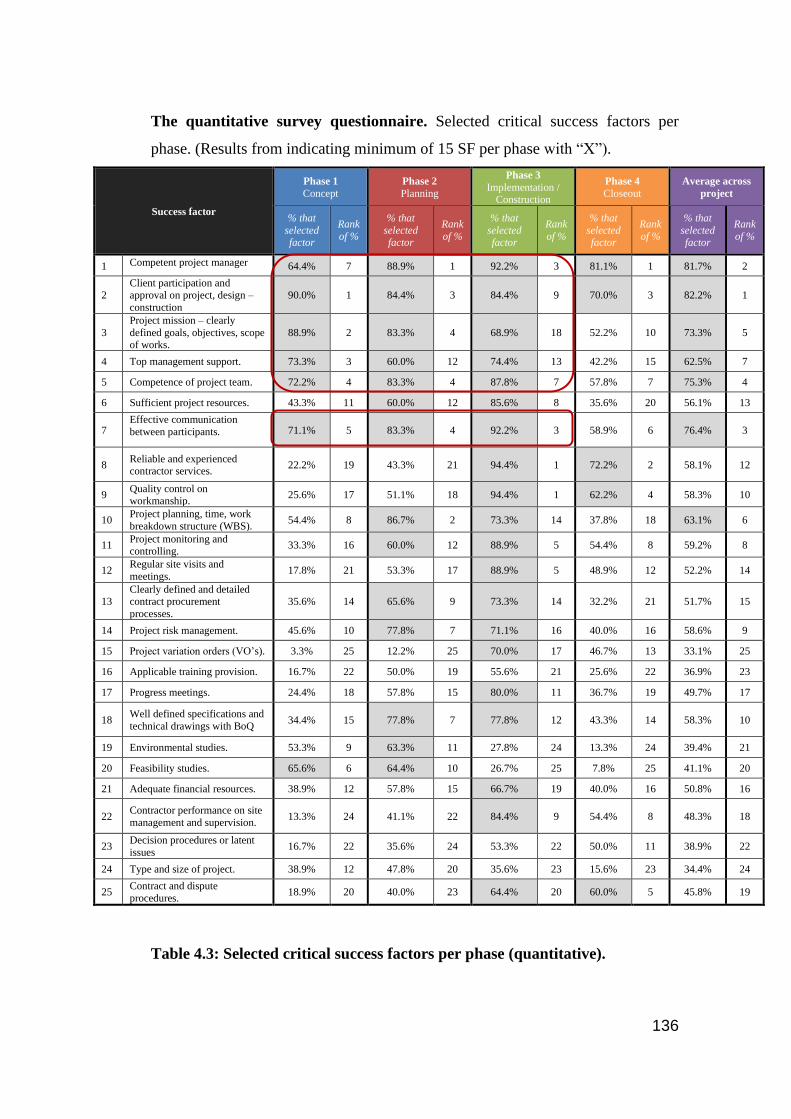
136
The quantitative survey questionnaire. Selected critical success factors per
phase. (Results from indicating minimum of 15 SF per phase with “X”).
Success factor
Phase 1
Concept
Phase 2
Planning
Phase 3
Implementation / Construction
Phase 4
Closeout
Average across
project
% that
selected factor
Rank
of %
% that
selected factor
Rank
of %
% that
selected factor
Rank
of %
% that
selected factor
Rank
of %
% that
selected factor
Rank
of %
1 Competent project manager 64.4% 7 88.9% 1 92.2% 3 81.1% 1 81.7% 2
2 Client participation and approval on project, design –
construction
90.0% 1 84.4% 3 84.4% 9 70.0% 3 82.2% 1
3
Project mission – clearly
defined goals, objectives, scope of works.
88.9% 2 83.3% 4 68.9% 18 52.2% 10 73.3% 5
4 Top management support. 73.3% 3 60.0% 12 74.4% 13 42.2% 15 62.5% 7
5 Competence of project team. 72.2% 4 83.3% 4 87.8% 7 57.8% 7 75.3% 4
6 Sufficient project resources. 43.3% 11 60.0% 12 85.6% 8 35.6% 20 56.1% 13
7 Effective communication
between participants. 71.1% 5 83.3% 4 92.2% 3 58.9% 6 76.4% 3
8 Reliable and experienced contractor services.
22.2% 19 43.3% 21 94.4% 1 72.2% 2 58.1% 12
9 Quality control on workmanship.
25.6% 17 51.1% 18 94.4% 1 62.2% 4 58.3% 10
10 Project planning, time, work
breakdown structure (WBS). 54.4% 8 86.7% 2 73.3% 14 37.8% 18 63.1% 6
11 Project monitoring and controlling.
33.3% 16 60.0% 12 88.9% 5 54.4% 8 59.2% 8
12 Regular site visits and
meetings. 17.8% 21 53.3% 17 88.9% 5 48.9% 12 52.2% 14
13 Clearly defined and detailed contract procurement
processes.
35.6% 14 65.6% 9 73.3% 14 32.2% 21 51.7% 15
14 Project risk management. 45.6% 10 77.8% 7 71.1% 16 40.0% 16 58.6% 9
15 Project variation orders (VO’s). 3.3% 25 12.2% 25 70.0% 17 46.7% 13 33.1% 25
16 Applicable training provision. 16.7% 22 50.0% 19 55.6% 21 25.6% 22 36.9% 23
17 Progress meetings. 24.4% 18 57.8% 15 80.0% 11 36.7% 19 49.7% 17
18 Well defined specifications and
technical drawings with BoQ 34.4% 15 77.8% 7 77.8% 12 43.3% 14 58.3% 10
19 Environmental studies. 53.3% 9 63.3% 11 27.8% 24 13.3% 24 39.4% 21
20 Feasibility studies. 65.6% 6 64.4% 10 26.7% 25 7.8% 25 41.1% 20
21 Adequate financial resources. 38.9% 12 57.8% 15 66.7% 19 40.0% 16 50.8% 16
22 Contractor performance on site
management and supervision. 13.3% 24 41.1% 22 84.4% 9 54.4% 8 48.3% 18
23 Decision procedures or latent
issues 16.7% 22 35.6% 24 53.3% 22 50.0% 11 38.9% 22
24 Type and size of project. 38.9% 12 47.8% 20 35.6% 23 15.6% 23 34.4% 24
25 Contract and dispute
procedures. 18.9% 20 40.0% 23 64.4% 20 60.0% 5 45.8% 19
Table 4.3: Selected critical success factors per phase (quantitative).
137
• Highlighting in the table above indicates where more than 60% of the
participants marked the factor as important for that phase.
4.7.1 STATISTICAL ANALYSIS OF THE MOST IMPORTANT
SUCCESS FACTOR IN PHASE 1
PHASE 1: CONCEPT ANALYSIS
Participants had to select the fifteen most important critical success factors from
the list of 25 in the questionnaire. The seven success factors in phase 1 that they
rated highest, and therefore regarded as the most important, are numbers 1, 2, 3, 4,
5, 7 and 20. These seven (7) success factors are also listed in the research of
Martin (1976), Locke (1984), Cleland and King (1983) and Sayles and Chandler
(1971). The most important success factors in each phase are rated above 60% and
are the highest percentage over phases 1, 2 and 3 as indicated in Table 4.3, (pp.
136) and Spider-web 4.1, project life cycles (pp. 139), which in fact address the
main research objective. Hence the fifteen (15) primary success factors are
selected and indicated by the participants in phase 3, as they have nominated 20
success factors rated above 64%.
Table 4.3 indicates that success factors 1, 2, 3, 4, 5 and 7 within the ranking of
phases 1 to 3 were rated as the highest among the 25 listed success factors and
ranked (by grouping as the most important success factors ) over these 3 phases.
By omitting anyone of these SFs in phase 1, there cannot be a project. The
importance of the outcome of the above selection of success factors revealed the
vital academic knowledge of the participants to meet project management
requirements.
The list below indicates in the ranking order of these 6 success factors to prove
the theory of Pinto & Slevin (1989):
Success factor 1: competent project manager was ranked as a 2.
Success factor 2: client participation/design/construction was ranked as a 1.
138
Success factor 3: project mission/objectives and scope of work was ranked as a 5.
Success factor 4: top management support was ranked as a 7.
Success factor 5: competence of project team was ranked as a 4.
Success factor 7: effective communication between participants was ranked as a 3.
Participants selected the above mentioned success factors in the quantitative
survey questionnaire, indicating that they indeed have the knowledge to deliver a
project successfully.
The quantitative survey questionnaire led to the results shown above in Table 4.3,
pp. 136.
In essence the survey analysis showed that the client’s needs should be put first
and that the project manager has to make sure that that happens by means of:
• Implementing a solid and effective communication environment.
• Selecting a competent team.
• Formulating a strategy to fulfil the project mission, set clearly defined
goals, and meet the project objectives.
• Formulating a clear scope of works that will meet the project target and its
intervention challenges.
4.7.2 STATISTICAL ANALYSIS OF THE MOST IMPORTANT
SUCCESS FACTORS IN PHASE 2
PHASE 2: PLANNING ANALYSIS
It is evident from the survey analysis that fourteen (14) success factors were rated
above 60% in phase 2 by the participants. Seven of those success factors had also
been selected as important in phase 1. Additionally it has to be noted that SF
number 20 (feasibility studies) was also selected in both phases 1 and 2 as
important success factors, albeit not ranked most important SF due to the low rate
of 26.6% in phase 3 as reflected in Table 4.3, pp. 136.
139
4.7.3 STATISTICAL ANALYSIS OF THE MOST IMPORTANT
SUCCESS FACTORS IN PHASE 3
PHASE 3: CONSTRUCTION ANALYSIS
Although phases 1, 2 and 3 have a high rate of correlation proven during the
selection of the questionnaire, success factors are of critical importance on the site
where pick and shovel strike the ground and real-life construction has to deliver
proof that the months of planning and preparation can lead to the successful
execution of the project.
Participants selected twenty (20) success factors in phase 3 to be of critical
importance (rated above 64%). This is remarkable in the sense that the
participants here showed insight into the fact that the main challenge during this
phase is delivering evidence that the project concept can become a viable project.
The questionnaire indicates a very robust selection of the success factors
necessary to manage and deliver a project to the satisfaction of all project
activities on time, within the budged and of good quality.
The main objective of this study is to identify success factors related to the project
management environment and grouping these factors with the various project life
cycle phases. Success factors (SFs) 1, 2, 3, 4, 5 and 7 were ranked above 60% in
phases 1 to 3 as indicated in Table 4.3.
It is important to note that SF 19 and 20 were rated at 27.8% and 26.7%
respectively in phase 3 but were rated above 60% in phases 1 and 2. This indicates
that the participants regarded investigation and research prior to the
implementation of phase 3 as necessary and therefore important to ensure a
positive outcome of the project.
These results show that the participants ranked 20 SFs above 60% and sixteen of
those above 70%. This led the researcher to the conclusion that the primary
research question was addressed when 20 SFs were rated in phase 3 and a
minimum 14 SFs were selected in phase 2 (see Table 4.3, pp. 136).
140
4.7.4 STATISTICAL ANALYSIS OF THE MOST IMPORTANT
SUCCESS FACTORS IN PHASE 4
PHASE 4: CLOSEOUT ANALYSIS
In the final phase only five (5) success factors gained a rate above 60%. However,
eleven SFs achieved a rating of more than 50% which are still acceptable taking
into account the high score of success factors in phase 3. This can be justified
because all five main project factors (as indicated in Chapter 2: Literature layout:
Section B, pp. 29) were selected as important success factors.
Selecting success factors such as numbers 1, 2, 8, 9 and 25 indicates thoughtful
and considered choices by the participants. As this is a survey analysis it can be
assumed that 50% or more of the participants had never met or worked with one
another on a project. Therefore the vigorous results of this phase indicate that the
engineers were well-educated and had good engineering knowledge on which to
rely when they worked in the construction industry.
The success factors 3, 5, 7, 11, 22, and 23 were rated between 50% and 60%.
This means that 50% to 60% of the participants considered these success factors
the important for project success. The result also indicates that the participants
acknowledged the value of these success factors during the execution of phase
four of the project.
The above-mentioned factors needed to be evaluated in the context of their
definition (phases 1 to 3) in order to discover their important role in the last and
completion phase of the project, where the goal is to meet the objectives of all the
role players.
SF 3 Project mission – clearly defined goals, objectives, scope of works;
SF 5 Competence of project team;
SF 7 Effective communication between participants;
SF 11 Project monitoring and controlling;
SF 22 Contractor performance on site management and supervision;

141
SF 23 Decision procedures or latent issues.
It is to be remembered however, that it is understood in all professions (not only
in the engineering profession) that one will execute one’s duty according to the
code of conduct and standards of the profession, with knowledge and insight, and
with respect for the client. Project success depends on who the project manager is
and whether he/she is competent to deliver a specific task.
4.7.5 STATISTICAL ANALYSIS OF THE MOST IMPORTANT
SUCCESS FACTORS IN PHASE 5
4.7.5.1 PHASE 5: RANKING THE FOUR PHASES
The spider-web displays the results of the participants’ choices for the four project
life cycle phases.
Spider-web 4.1: Success factors during the four project life cycles
SF1SF2
SF3
SF4
SF5
SF6
SF7
SF8
SF9
SF10
SF11
SF12SF13SF14
SF15
SF16
SF17
SF18
SF19
SF20
SF21
SF22
SF23
SF24SF25
Success factors regarded as most important per phase
(illustrate all 4 phases)
Phase 1
Phase 2
Phase 3
Phase 4

142
HOW DO WE READ THE ABOVE SPIDER-WEB?
Note that the numbers of the success factors given above correlate to the numbers
on the survey questionnaire.
To analyse the spider-web above within the various phase ratings as indicated in
Table 4.3, the centre of the spider-web will be point zero while the outer circle
will be rated at 100%. For the convenience of the reader, the success factors are
listed below Spider-web 4.1. All four phases are indicated in different colours to
make interpretation easier. The spider-web display the 25 success factors involved
over all four project life cycle phases.
Phase 1 is analysed in part as an example.
Phase 1 (illustrated in blue): SF 1 refers to a competent project manager.
Starting from the spider-web centre (zero) the score moves up to a level of 64.4%,
indicating the success factor rating of the project manager by the participants. SF
2 (client participation) points to the outer circle and is 90%, indicating the
importance of this success factor during phase 1 of the project. SF 3 (project
mission) shows a rating of 88.8%, also indicating its importance during this phase
for participants. Each success factor, up to SF 25 can be read in this way.
The spider-web charts below identify the critical success factors for each of the
four phases of the project with explanations where necessary.
The reviewed spider-web 4.2 should be seen in conjunction with above Table 4.3
which highlights the following important information:
1 In the next category only SFs 1, 2, 3, 4, 5 and 7 were selected in phases 1, 2
and 3 and rated above 60%.
2 The only other SF selected in phase 1 was SF 20 (feasibility studies) and it
was rated at 65.6%. It was also selected in phase 2 where it was rated at
64.4%.
143
These results confirm the research objective which is related to the theory of Pinto
and Slevin (1989).
Note that the numbers in above spider-web correlate to the numbers of the success
factors in the questionnaire.
SF 1 Competent project manager;
SF 2 Client participation and approval on project, design – construction;
SF 3 Project mission – clearly defined goals, objectives, scope of works;
SF 4 Top management support;
SF 5 Competence of project team;
SF 6 Sufficient project resources;
SF 7 Effective communication between participants;
SF 8 Reliable and experienced contractor services;
SF 9 Quality control on workmanship;
SF 10 Project planning, time and WBS;
SF 11 Project monitoring and controlling;
SF 12 Regular site visits / meetings;
SF 13 Clearly defined and detailed contract procurement processes;
SF 14 Project risk management;
SF 15 Project variation orders (VOs’);
SF 16 Applicable training provision;
SF 17 Progress meetings;
SF 18 Well defined specifications and technical drawings with BoQ;
SF 19 Environmental studies;
SF 20 Feasibility studies;
SF 21 Adequate financial resources;
SF 22 Contractor performance on site management and supervision;
SF 23 Decision procedures or latent issues;
SF 24 Type and size of project;
SF 25 Contract and dispute procedures.
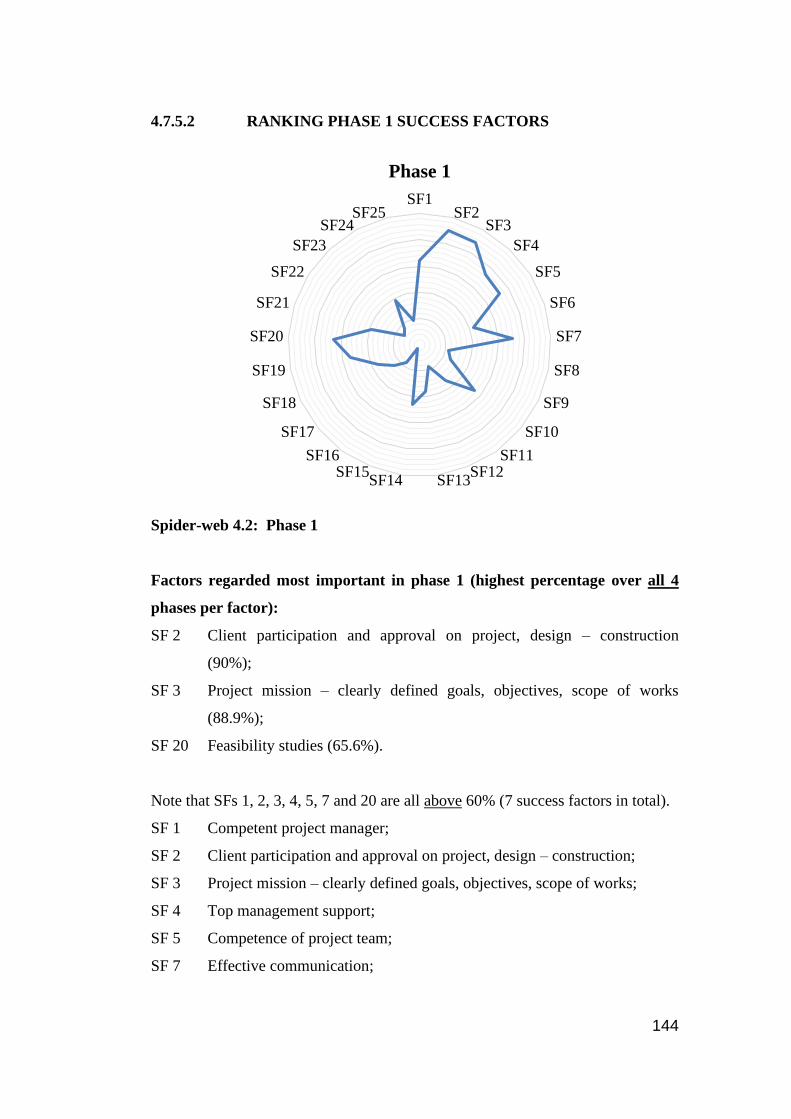
144
4.7.5.2 RANKING PHASE 1 SUCCESS FACTORS
Spider-web 4.2: Phase 1
Factors regarded most important in phase 1 (highest percentage over all 4
phases per factor):
SF 2 Client participation and approval on project, design – construction
(90%);
SF 3 Project mission – clearly defined goals, objectives, scope of works
(88.9%);
SF 20 Feasibility studies (65.6%).
Note that SFs 1, 2, 3, 4, 5, 7 and 20 are all above 60% (7 success factors in total).
SF 1 Competent project manager;
SF 2 Client participation and approval on project, design – construction;
SF 3 Project mission – clearly defined goals, objectives, scope of works;
SF 4 Top management support;
SF 5 Competence of project team;
SF 7 Effective communication;
SF1SF2
SF3
SF4
SF5
SF6
SF7
SF8
SF9
SF10
SF11SF12
SF13SF14SF15
SF16
SF17
SF18
SF19
SF20
SF21
SF22
SF23
SF24SF25
Phase 1
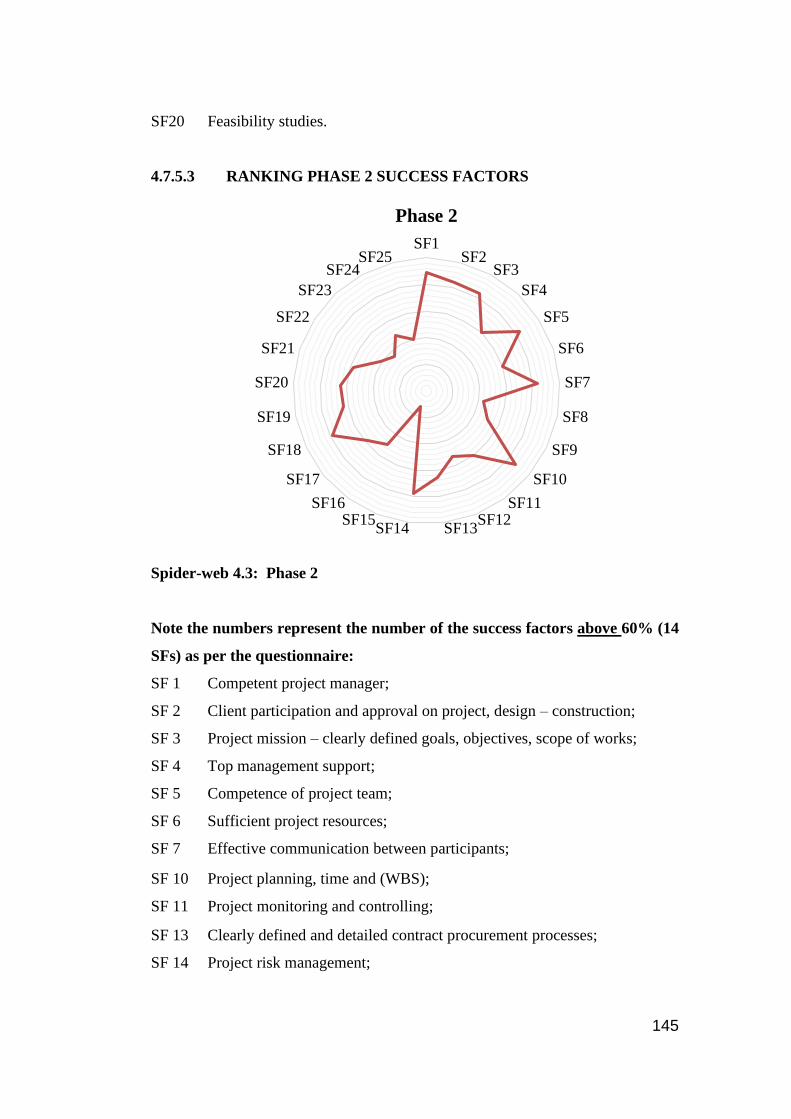
145
SF20 Feasibility studies.
4.7.5.3 RANKING PHASE 2 SUCCESS FACTORS
Spider-web 4.3: Phase 2
Note the numbers represent the number of the success factors above 60% (14
SFs) as per the questionnaire:
SF 1 Competent project manager;
SF 2 Client participation and approval on project, design – construction;
SF 3 Project mission – clearly defined goals, objectives, scope of works;
SF 4 Top management support;
SF 5 Competence of project team;
SF 6 Sufficient project resources;
SF 7 Effective communication between participants; SF 10 Project planning, time and (WBS);
SF 11 Project monitoring and controlling; SF 13 Clearly defined and detailed contract procurement processes;
SF 14 Project risk management;
SF1SF2
SF3
SF4
SF5
SF6
SF7
SF8
SF9
SF10
SF11SF12
SF13SF14SF15
SF16
SF17
SF18
SF19
SF20
SF21
SF22
SF23
SF24SF25
Phase 2

146
SF 18 Well defined specifications and technical drawings with BoQ;
SF 19 Environmental studies;
SF 20 Feasibility studies.
The above spider-web for phase 2 displays the survey environment in which the
design engineer and project manager have to perform their duties if they wish to
address all the unknown factors. As indicated in phases 1 to 3 in Table 4.3, SFs 1,
2, 3, 4, 5 and 7, the ranking selection indicates clearly that the participants had
been well equipped both during their engineering studies and their post-graduate
training in their field.
Factors regarded most important in phase 2 (highest percentage over all 4
phases per success factor):
SF 10 Project planning, time (WBS);
SF 14 Project risk management;
SF 18 Well defined specifications and technical drawings with BoQ;
SF 19 Environmental studies;
PROJECT PLANNING: PHASE 2
This is probably the most important phase of any project. All the pros and cons
need to be investigated and considered. This stage also requires a full feasibility
and environmental evaluation to assess whether the project will be economically
viable and profitable to the client.
Construction projects are often in the news because poor quality work and/or
high-risk construction practices resulted in malpractice of some kind. We have to
keep in mind that each project is unique even when the same floor layout
drawings are used for more than one project or different projects are executed on
the same construction site. This is because there are always various uncontrollable
latent conditions. These conditions are difficult to predict, especially when
environmental and feasibility studies were not executed during the second phase
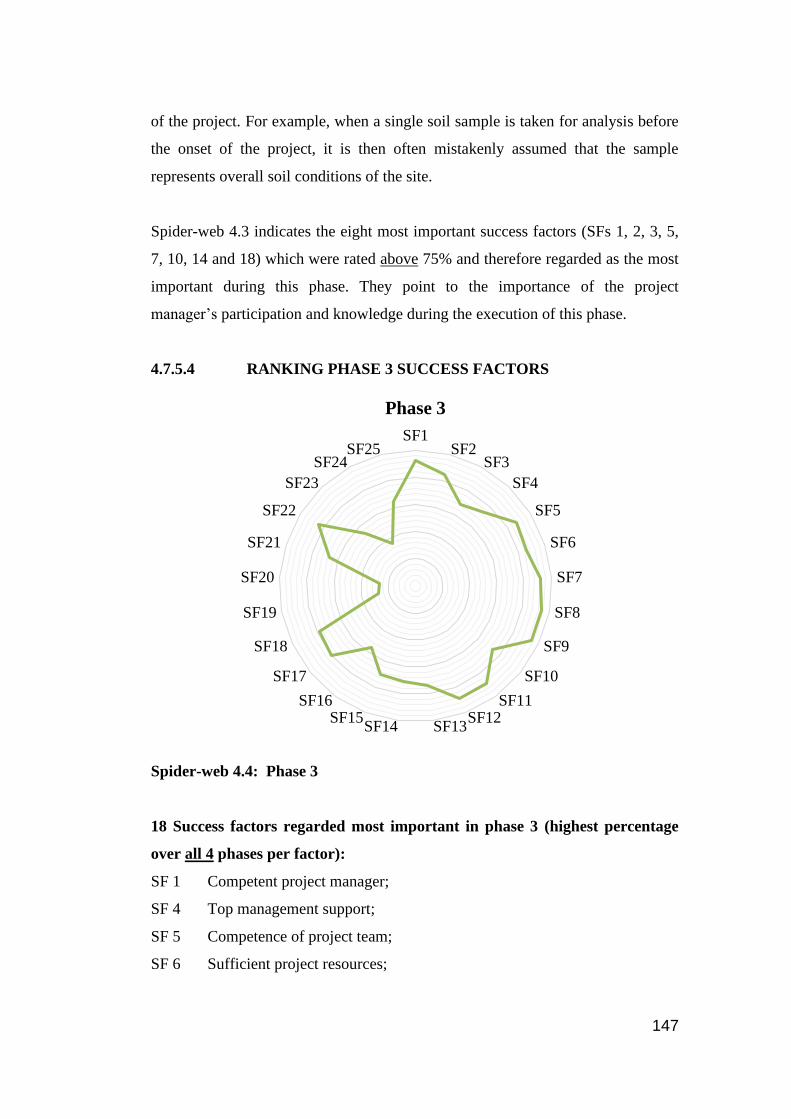
147
of the project. For example, when a single soil sample is taken for analysis before
the onset of the project, it is then often mistakenly assumed that the sample
represents overall soil conditions of the site.
Spider-web 4.3 indicates the eight most important success factors (SFs 1, 2, 3, 5,
7, 10, 14 and 18) which were rated above 75% and therefore regarded as the most
important during this phase. They point to the importance of the project
manager’s participation and knowledge during the execution of this phase.
4.7.5.4 RANKING PHASE 3 SUCCESS FACTORS
Spider-web 4.4: Phase 3
18 Success factors regarded most important in phase 3 (highest percentage
over all 4 phases per factor):
SF 1 Competent project manager;
SF 4 Top management support;
SF 5 Competence of project team;
SF 6 Sufficient project resources;
SF1SF2
SF3
SF4
SF5
SF6
SF7
SF8
SF9
SF10
SF11SF12
SF13SF14SF15
SF16
SF17
SF18
SF19
SF20
SF21
SF22
SF23
SF24SF25
Phase 3
148
SF 7 Effective communication between participants;
SF 8 Reliable and experienced contractor services;
SF 9 Quality control on workmanship;
SF 11 Project monitoring and controlling;
SF 12 Regular site visits / meetings;
SF 13 Clearly defined and detailed contract procurement processes;
SF 15 Project variation orders (VOs’);
SF 16 Applicable training provision;
SF 17 Progress meetings;
SF 18 Well defined specifications and technical drawings with BoQ;
SF 21 Adequate financial resources;
SF 22 Contractor performance on site management and supervision;
SF 23 Decision procedures or latent issues;
SF 25 Contract and dispute procedures.
Notice is to be taken that phase 3 has indicated 20 success factors above 60%.
The least important SF selected in phase 3 under 60%:
SF 19 Environmental studies;
SF 20 Feasibility studies.
IMPLEMENTATION OF THE CONSTRUCTION: PHASE 3
During this phase the project team needs to prove their knowledge and expertise
and complete the project. All construction implementation plans require the
project manager or engineer to be involved in as many site activities as possible.
This requirement becomes especially important when changes in the site activities
become imperative. This is the best way to keep communication channels open
and every project team player involved regarding the project process. The
participants selected 20 important success factors above 60% in this phase and
showed that during this phase activities are deemed very important, as the site can
instantly turn into a high risk environment involving safety matters, quality
inspections on latent issues, and misinterpretation of site instructions. All of these
can lead to disputes and ultimately influence the project as a whole.
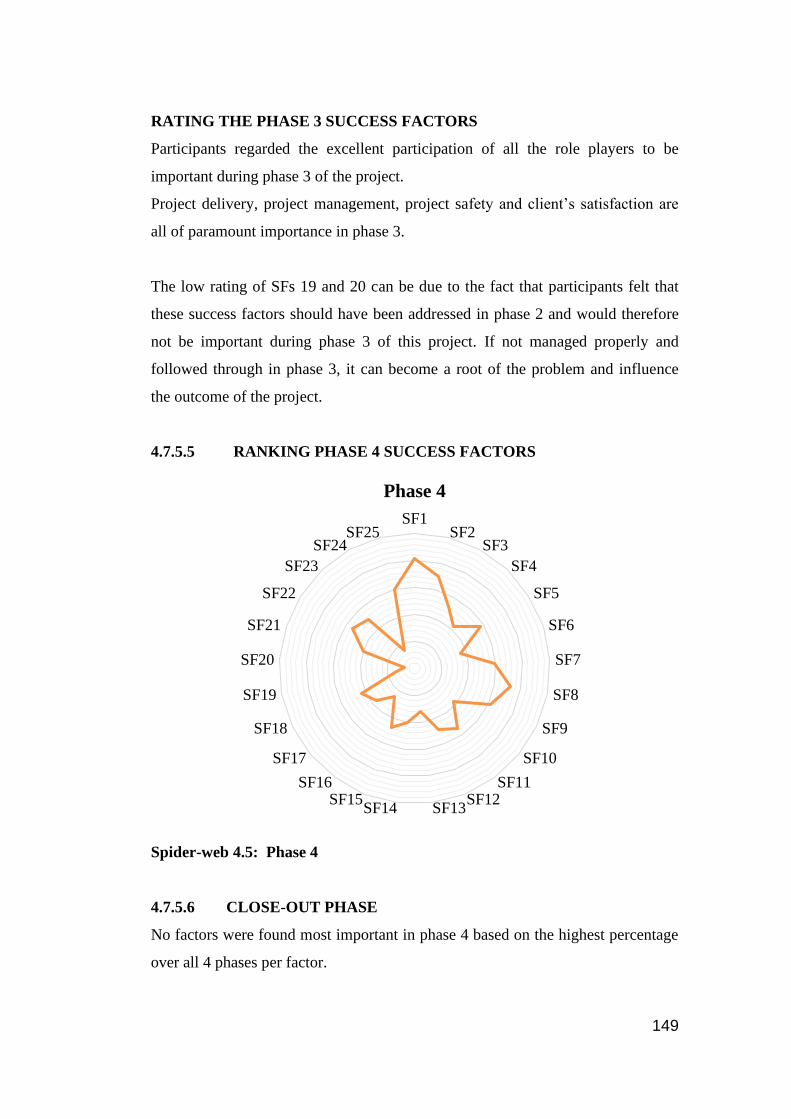
149
RATING THE PHASE 3 SUCCESS FACTORS
Participants regarded the excellent participation of all the role players to be
important during phase 3 of the project.
Project delivery, project management, project safety and client’s satisfaction are
all of paramount importance in phase 3.
The low rating of SFs 19 and 20 can be due to the fact that participants felt that
these success factors should have been addressed in phase 2 and would therefore
not be important during phase 3 of this project. If not managed properly and
followed through in phase 3, it can become a root of the problem and influence
the outcome of the project.
4.7.5.5 RANKING PHASE 4 SUCCESS FACTORS
Spider-web 4.5: Phase 4
4.7.5.6 CLOSE-OUT PHASE
No factors were found most important in phase 4 based on the highest percentage
over all 4 phases per factor.
SF1SF2
SF3
SF4
SF5
SF6
SF7
SF8
SF9
SF10
SF11SF12
SF13SF14SF15
SF16
SF17
SF18
SF19
SF20
SF21
SF22
SF23
SF24SF25
Phase 4
150
The most important SF in phase 4 and above 60%:
SF 1 Competent project manager;
SF 2 Client participation and approval on project, design – construction;
SF 8 Reliable and experienced contractor services;
SF 9 Quality control and workmanship;
SF 25 Contract and dispute procedures;
All projects are different even if the floor layout design is identical and
completion costs are equal. A single success factor in one unit can change the
conditions of the closeout phase, thereby also changing the outcome of the
project. In this last phase various success factors can be the reason why a project
fails to meet the design criteria and/or the client’s needs.
There is and will never be a project that will completely meet all the conditions
for project success. The reason for that is simple; no two people are the same.
There will always be differences regarding values and definitions of success.
However, the correct selection of success factors will usually ensure a reasonably
successful outcome in terms of time, cost and quality.
If a project turns out to be completed within its scheduled completion time and
cost estimates and is of the required quality, the project manager, his design team
and his contractor has delivered a service to the client that he has a right to expect
and should be willing to pay for in full.
4.7.5.7 PHASE 5: RANKING ACROSS THE PROJECT
DISTRIBUTIONS OF SUCCESS FACTORS
The participants were asked to rank the 25 factors in order of importance, where
the most important factor was ranked as 1 and, the least important factor as 25.
The graphs (Annexure 2: Success factor ranking graphs 4.1 – 4.25, pp. 222 - 234)
indicate the distribution (as a percentage of 90 participants) that provided each
151
ranking, i.e. what percentage of the 90 participants ranked the specific factor for
example second (the 2 on the axis).
For ease of reference the rankings of the phase 5 graphs (average across project)
are all listed with the necessary critical success factors (CSF) in chapter 2 and all
listed 25 success factor graphs have an item notification referring to the
importance of specific success factors.
The results discussed in Chapter 2 will therefore not be repeated here.
The four Bar and Line graphs below illustrate the most important factors per
phase.
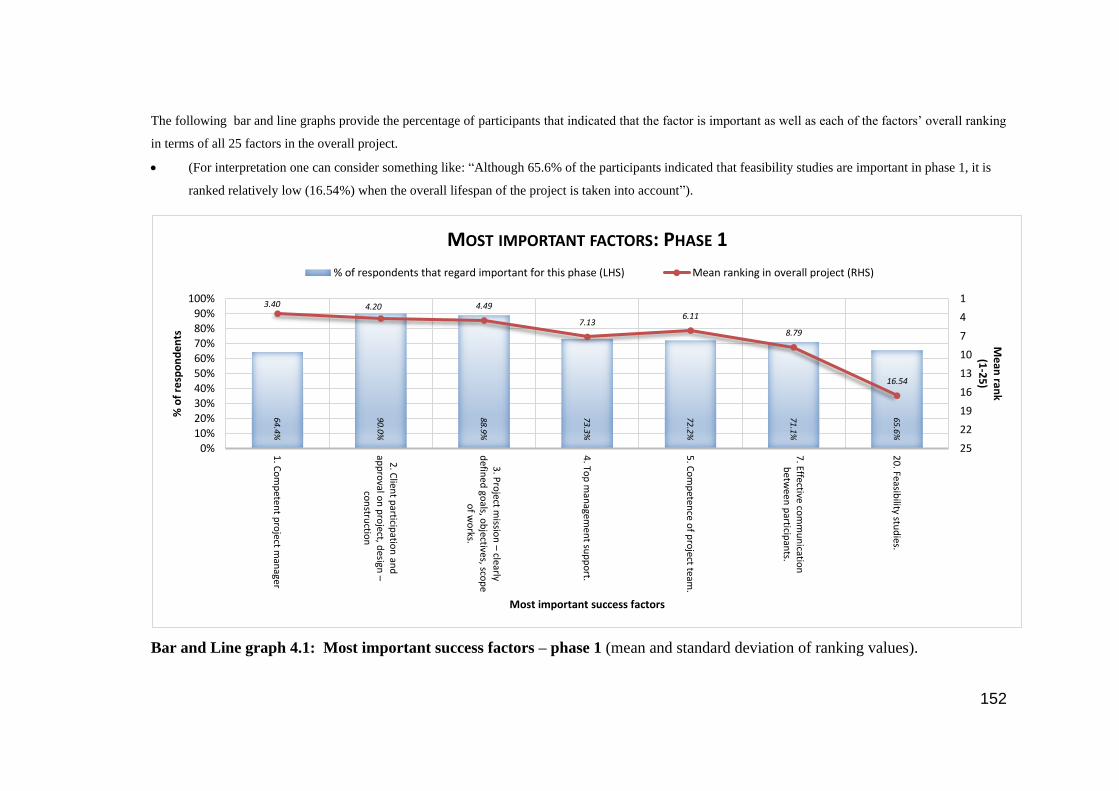
152
The following bar and line graphs provide the percentage of participants that indicated that the factor is important as well as each of the factors’ overall ranking
in terms of all 25 factors in the overall project.
• (For interpretation one can consider something like: “Although 65.6% of the participants indicated that feasibility studies are important in phase 1, it is
ranked relatively low (16.54%) when the overall lifespan of the project is taken into account”).
Bar and Line graph 4.1: Most important success factors – phase 1 (mean and standard deviation of ranking values).
64.4%
90.0%
88.9%
73.3%
72.2%
71.1%
65.6%
3.40 4.20 4.49
7.136.11
8.79
16.54
1
4
7
10
13
16
19
22
250%
10%
20%30%
40%
50%
60%70%
80%90%
100%
1. C
om
peten
t pro
ject man
ager
2. C
lient p
articipatio
n an
d
app
roval o
n p
roject, d
esign –
con
structio
n
3. P
roject m
ission
–clearly
defin
ed go
als, ob
jectives, scop
e o
f wo
rks.
4. To
p m
anagem
en
t sup
po
rt.
5. C
om
peten
ce of p
roject team
.
7. Effective co
mm
un
ication
betw
een
particip
ants.
20
. Feasibility stu
dies.
Me
an ran
k (1
-25
)
% o
f re
spo
nd
en
ts
Most important success factors
MOST IMPORTANT FACTORS: PHASE 1
% of respondents that regard important for this phase (LHS) Mean ranking in overall project (RHS)
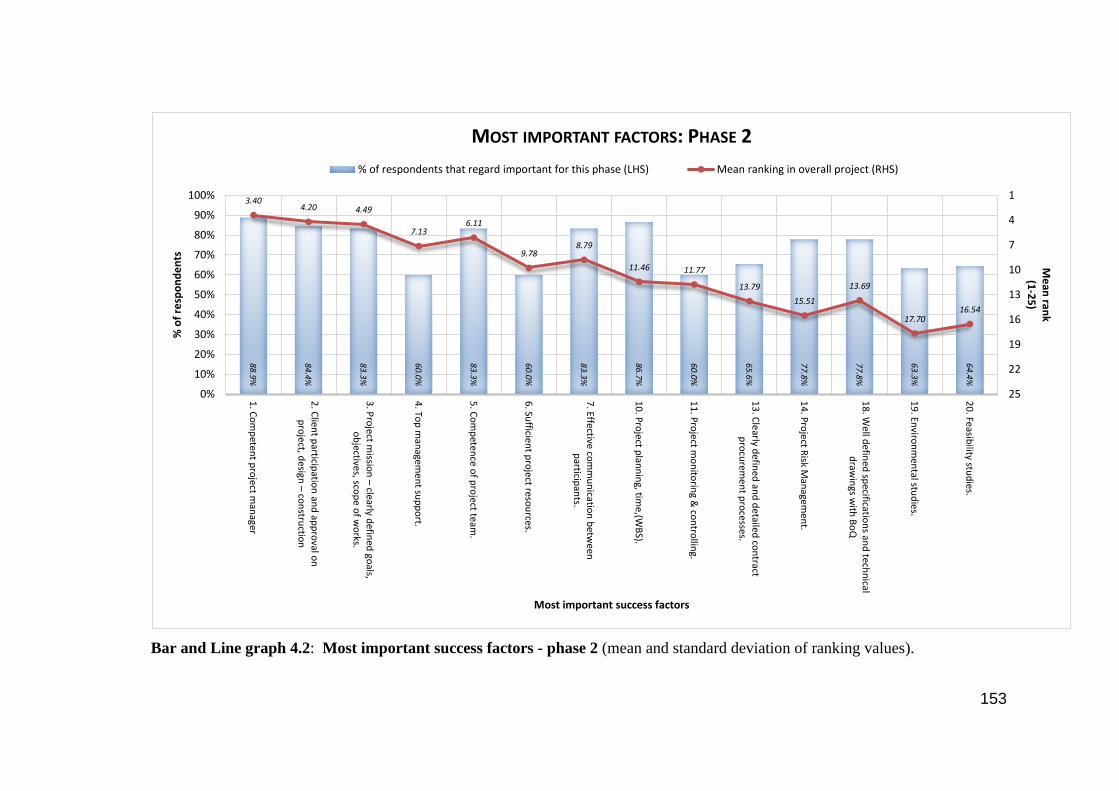
153
Bar and Line graph 4.2: Most important success factors - phase 2 (mean and standard deviation of ranking values).
88.9%
84.4%
83.3%
60.0%
83.3%
60.0%
83.3%
86.7%
60.0%
65.6%
77.8%
77.8%
63.3%
64.4%
3.404.20 4.49
7.136.11
9.788.79
11.46 11.77
13.79
15.51
13.69
17.7016.54
1
4
7
10
13
16
19
22
250%
10%
20%
30%
40%
50%
60%
70%
80%
90%
100%
1. C
om
peten
t pro
ject man
ager
2. C
lient p
articipatio
n an
d ap
pro
val on
p
roject, d
esign –
con
structio
n
3. P
roject m
ission
–clearly d
efined
goals,
ob
jectives, scop
e of w
orks.
4. To
p m
anagem
en
t sup
po
rt.
5. C
om
peten
ce of p
roject team
.
6. Su
fficient p
roject reso
urces.
7. Effective co
mm
un
ication
betw
eenp
articipan
ts.
10
. Pro
ject p
lann
ing, tim
e,(WB
S).
11
. Pro
ject m
on
itorin
g & co
ntro
lling.
13
. Cle
arly defin
ed an
d d
etailed co
ntract
pro
curem
en
t pro
cesses.
14
. Pro
ject R
isk Man
agem
ent.
18
. Well d
efined
specificatio
ns an
d tech
nical
draw
ings w
ith B
oQ
19
. Enviro
nm
ental stu
dies.
20
. Feasibility stu
dies.
Me
an ran
k (1
-25
)
% o
f re
spo
nd
en
ts
Most important success factors
MOST IMPORTANT FACTORS: PHASE 2
% of respondents that regard important for this phase (LHS) Mean ranking in overall project (RHS)

154
Bar and Line graph 4.3: Most important success factors – phase 3 (mean and standard deviation of ranking values).
92.2%
84.4%
68.9%
74.4%
87.8%
85.6%
92.2%
94.4%
94.4%
73.3%
88.9%
88.9%
73.3%
71.1%
70.0%
80.0%
77.8%
66.7%
84.4%
64.4%
3.404.20 4.49
7.136.11
9.788.79
7.92
11.68 11.46 11.77
13.68 13.79
15.51
20.31
16.37
13.6914.43
15.20
18.62
1
4
7
10
13
16
19
22
250%
10%
20%
30%
40%
50%
60%
70%
80%
90%
100%
1. C
om
peten
t pro
ject man
ager
2. C
lient p
articipatio
n an
d ap
pro
val on
p
roject, d
esign –
con
structio
n
3. P
roject m
ission
–clearly d
efined
goals,
ob
jectives, scop
e of w
orks.
4. To
p m
anagem
en
t sup
po
rt.
5. C
om
peten
ce of p
roject team
.
6. Su
fficient p
roject reso
urces.
7. Effective co
mm
un
ication
betw
eenp
articipan
ts.
8. R
eliable an
d exp
erien
ced
con
tractor
services.
9. Q
uality co
ntro
l on
wo
rkman
ship
.
10
. Pro
ject p
lann
ing, tim
e,(WB
S).
11
. Pro
ject m
on
itorin
g & co
ntro
lling.
12
. Regu
lar site visits / mee
tings.
13
. Cle
arly defin
ed an
d d
etailed co
ntract
pro
curem
en
t pro
cesses.
14
. Pro
ject R
isk Man
agem
ent.
15
. Pro
ject variation
ord
ers (VO
’).
17
. Pro
gress meetin
gs.
18
. Well d
efined
specificatio
ns an
d tech
nical
draw
ings w
ith B
oQ
21
. Ad
equ
ate finan
cial resou
rces.
22
. Co
ntracto
r perfo
rman
ce o
n site
man
agemen
t and
sup
ervision
.
25
. Co
ntract an
d d
ispu
te pro
cedu
res.
Me
an ran
k (1
-25
)
% o
f re
spo
nd
en
ts
Most important success factors
MOST IMPORTANT FACTORS: PHASE 3
% of respondents that regard important for this phase (LHS) Mean ranking in overall project (RHS)

155
Bar and Line graph 4.4: Most important success factors – phase 4 (mean and standard deviation of ranking values).
81.1%
70.0%
72.2%
62.2%
60.0%
3.404.20
7.92
11.68
18.62
1
4
7
10
13
16
19
22
250%
10%
20%
30%
40%
50%
60%
70%
80%
90%
1. C
om
peten
t pro
ject man
ager
2. C
lient p
articipatio
n an
d ap
pro
val o
n p
roject, d
esign –
con
structio
n
8. R
eliable an
d exp
erien
ced
con
tractor services.
9. Q
uality co
ntro
l on
wo
rkman
ship
.
25
. Co
ntract an
d d
ispu
te pro
cedu
res.
Me
an ran
k (1
-25
)
% o
f re
spo
nd
en
ts
Most important success factors
MOST IMPORTANT FACTORS: PHASE 4
% of respondents that regard important for this phase (LHS) Mean ranking in overall project (RHS)
156
4.8 SUMMARY
Chapter 4 described the implementation of the national survey questionnaire (see
Annexure 1: National survey questionnaire, pp. 218) as the research instrument
that is required to address the research objective and primary research question.
Although 90 participants completed the research questionnaire it would have been
of greater value if the research could had the support of all the engineering
institutions and companies in Gauteng.
SUMMARY OF THE QUANTITATIVE PARTICIPANT DESCRIPTION
ANALYSIS:
As indicated in the survey Table: 4.2, pp. 133 the following statistics are of
importance: N=90.
• 50 of the 90 participants have between six and 10 years’ experience in
construction work (58.82% of the participants).
• 25 out of 90 participants have experience in construction
management (27.78% of the participants).
• 28 out of 90 participants have experience in civil engineering 79
(31.11% of the participants).
• 26 out of 90 participants have experience in electrical
engineering (28.89% of the participants).
The 79 engineers with experience in construction management, civil engineering
and electrical engineering (87.77% of all participants) are at the top rate of the 90
participants in this research survey (see Table 4.2: Area of specialisation pp. 133).
• 80 out of 90 participants have had experience as consultants for a project
(91.95% of the participants).
• 48 out of 90 participants hold the position of project manager in the
organisation in which they are employed (55.81% of the participants).
157
REVIEWING THE SURVEY RESULTS
This research was justified by the results of the quantitative survey. An analysis of
the results (see Table 4.3, pp. 136) indicated the following ranking:
1. The research objective was reached by ranking the phases 1 to 3. The
resulting success factors 1, 2, 3, 4, 5, and 7 agreed with the Pinto and
Slevin’s research statement (1989) “by grouping them (the selected
success factors) according to some criteria (SF description i.e. competent
project manager), to help analyse the interaction between them (the
selected success factors and phases) and the possible consequences (the
outcome of the project)”.
2. The primary research question was addressed in chapter 4, item 4.7.3 and
illustrated in Table 4.3: phase 3, indicating twenty main success factors in
project management of which the lowest (SF 25) was rated at 64.4%.
3. Spider-web 4.1, pp. 141 displays the survey results indicating a very well
structured project management methodology, especially when it is taken
into account that few, if any, of the participants have ever worked with one
another in a project environment before. This spider-web displays all 4
phases as indicated in Table 4.3, pp. 136 presenting the 25 success factors.
4. This chapter also presented ranking graphs on all four phases illustrating
the 25 success factors selected in the questionnaire (Spider-webs 4.2, 4.3,
4.4, and 4.5, pp. 144 - 149). These graphs indicate and explain how the
participants rated the various success factors through the various project
life cycle phases.
This chapter described the quantitative survey analysis, thereby addressing the
research objective and the primary research question. Chapter 5 will describe and
discuss this second part of the research, namely qualitative assessment, by means
of a modified five point Likert scale instrument of four case studies. The
secondary research questions will be addressed in chapter 5.
158
CHAPTER 5 QUALITATIVE CASE STUDY RESEARCH
5.1 INTRODUCTION
The quantitative research survey was accompanied by a letter of introduction
which gave the background and purpose of the research. The letter assured the
participants to participate voluntarily and that the researcher would not reveal the
identity of the participants or their companies because of security concerns. The
participants were assured that the information they provided would be used
exclusively and solely for academic purposes and would be treated with the
confidentiality it deserved. (See Annexure 1: National survey questionnaire, page
218). The assurances regarding the ethic aspects of the research hold true for both
the quantitative and qualitative research.
The quantitative instrument was adjusted to accommodate the qualitative case
study analysis and was based on the statement made by Pinto and Slevin (1989)
that “they seem to tabulate individual factors rather than grouping them according
to some criteria to help analyse the interaction between them and the possible
consequences” as seen in Table 5.1: Specimen of case study, pp. 165.
The research methodology (chapter 3) laid the basis for both the quantitative and
qualitative research. The quantitative survey constituted the primary research but
it was complemented by the qualitative part of the research, the case study
analysis. This analysis validated the assessment and application of the instrument.
Four case studies were selected and assessed. When these assessments were
documented and analysed, the neglected critical success factors in each case study
were revealed. It was the neglect of these critical success factors that was the
reason for the failed projects. (Annexure 2, pp. 222 - 239 and Annexure 3, pp. 240
- 261).
The total scores of the four selected and assessed case studies were ranked and are
reflected as one score in the last column of Table 5.2: Total of complete project,
pp. 170. For example: SF 1 (competent project manager) scored a total of 117
159
which reflects the number of activities that the project manager failed to execute
properly or correctly during those phases.
Jackson (2008) states quantitative research is mainly concerned with the testing of
hypotheses and statistical generalisations. Gerring (2004) argues that case study
research involves the intensive study of a single unit for the purpose of
understanding a larger class of similar units. The unit is observed at a single point
in time or over some bordered period of time. Baxter and Jack (2008) and Tellis
(1997a and 1997b) argue that case studies provide an opportunity for the
researcher to gain a holistic view of the research problem and therefore can
facilitate describing, understanding and explaining the research problem or
situation.
The case study methodology, the questionnaire application and its validity on the
case study analysis will be described below.
5.2 LITERATURE REVIEW OF THE VALIDITY OF CASE STUDIES
The secondary research questions were addressed by means of the case study
analyses.
Yin (1994) states that there are generally four types of cases studies: teaching
cases, case histories, case work and research case studies. The research type is
mostly used by professionals and students. Professional skills are necessary to
select this kind of case study and then to conduct the research. He further states
that a methodological framework for the preparation and usage of research cases
is of vital importance.
The following criteria are important for preparing a good research case study:
• Construct validity (requires using multiple data resources and establishing
fundamental chains between processes and/or phenomena.
• Internal validity (includes well-documented pattern-matching and
explanation of the process).

160
• External validity (includes multiple receivers) and reliability which means
that a full dataset is applied in the study.
• The literature must be treated as valuable and reliable research case study
methodology.
Xiao and Smith (2006) argue that the case study approach was criticised for years
and treated as the research method of last resort. Stoecker (1991) is of the opinion
that the case study approach as research method was unnecessarily disapprove of
a theoretical area – specific and not following strictly defined procedures (Yin
1981). Campbell (1975) and Yin (1981) state that notes on case studies can be
used as a valuable research method.
Cutler (2004) argues that methodological inflexibility in the methodology of case
study building is of crucial importance. According to him, there is a need to define
priorities for general aims and scopes in this methodology. Developed case studies
are regarded as of high quality, because they do have a few important advantages
such as innovation, testability and empirical validity.
5.3 THE CASE STUDY
The above four criteria are often treated as four principles for preparing valuable
and reliable research case study literature.
Yin (1984) also states that there are three types of case study research
methodologies, namely exploratory, descriptive, and explanatory methodology.
Multiple case studies were used in this research study. The choice for multiple
case studies is appropriate because multiple case studies should follow replication
logic and not the sampling logic.
In this research an explanatory approach was followed to address the research
questions as to why, how and what could resolve or reveal the research topic.

161
Other case study researchers such as Stake (1995), Simons (1980 and 1996) and
Yin (1984) suggest techniques for organising and conducting the research
successfully. They recommend the following steps:
• Determine and identify the applicable research questions.
• Select the case studies.
• Determine data gathering and analysis techniques.
• Organise to collect the data.
• Collect data in the field.
• Evaluate and analyse the data.
• Prepare the report to represent a complicated problem in a way that
expresses experience and knowledge to the reader.
Yin (2002) defines a case study as a contemporary experience within its real life
context, especially when the boundaries between a phenomenon and context are
not clear and the researcher has little control over the phenomenon and context.
5.4 DEFINE THE SECONDARY RESEARCH QUESTIONS
The following case study questions (secondary research questions) were chosen
for this research:
1 How do the critical success factors affect the project life cycle?
2 How can the effect of a lack of knowledge and experience on the part of the
project manager within the project life cycle phases influence the critical
success factors of project management?
3 Why are these critical success factors important to be implemented?
5.5 PREPARE TO COLLECT THE DATA
A suitable research topic will be found when an urgent need within the specified
domain (in this case the construction and project management industry) is
discovered.
The authors of the South African Construction Industry Board (CIDB (2013) and
numerous stakeholders have raised their concerns on quality delivery due to the
increased complexity of large-scale construction projects (see Chapter 3,
162
paragraph 3.5: Target population). They are of the opinion that this kind of
construction project requires outstanding project management and discipline at all
levels.
These concerns initiated this research and preliminary answers were found by
means of a quantitative survey instrument which highlighted the fifteen most
relevant success factors. Further investigation was needed to reveal the reasons
why these factors are so vital to the success of large projects. The investigation
into success factors affecting the research topic was then undertaken by means of
a qualitative research analysis on related case studies.
5.6 SELECTION OF CASE STUDIES
Four case studies were randomly selected out of thirty four case studies. The
organisation that allowed access to the case studies wished to support the research
investigation but also wished to remain anonymous.
As Ravitch and Riggan (2011) state, clearly defining the research problem is
probably the most important step in the complete research project as a whole.
Therefore a case study should begin with a comprehensive literature review and
careful consideration of the research questions and study objective.
Chapter 2 laid the basis for both the quantitative and qualitative research studies.
The thirty four selected case studies are all classified as not performing within the
standard code of building practice. The four randomly selected case studies all
pointed out the clients’ requirements regarding delivery of the final project within
the standards of the critical success factors.
5.7 QUALITATIVE DATA INSTRUMENT
The same five point Likert scale instrument that was used for the quantitative
survey was used for the qualitative analysis. The quantitative application was
slightly changed to accommodate the desired results for the qualitative analysis.
163
The original thirty four case studies had already been judged by the engineering
council. The purpose of this research is not to judge the projects described in the
case studies but to:
• Reach the research objective; and
• Answer the research questions and find out what led to the failure of these
projects.
5.8 THE QUALITATIVE DATA INSTUMENT DESIGN
After considering the many different case study categories and identifying a
theoretical perspective, the researcher can begin to formulate the study research
design. This design links the collected data and draw conclusions which
ultimately address the research question. Case studies are normally conducted on
topics that are diverse.
Van Vugt (1994) argues that it is virtually impossible to outline any strict or
universal method or design for conducting a case study. However, Yin (1993)
suggests the following basic research design components:
1 A study question.
2 A study intention (if any).
3 A study unit of analysis.
4 The logical linking of data to the proposal.
5 The criteria for interpreting the findings.
The same data instrument that was used for the quantitative survey was used to
analyse the four case studies, but with the following minor changes:
1 The instrument must display the following coding analysis information:
• Success factors number (1 to 25).
• Success factor description (competent project manager) 1 to 25.
• Count of code and over all four phases.
• Rank value over all four phases.
164
2 The instrument will display phases 1, 2, 3, 4 and 5. Phase 5 is the total for
the project as a whole. The four phases will represent a success factor from
1 to 25, each with a coding description.
The total count of code has been analysed by ranking and displayed as in Table
5.2, pp. 170. The instrument will also display phases 1 to 4 and phase 5 with its
ranking totals.
5.9 CASE STUDY EVALUATORS
A total of four case studies were reviewed by four evaluators. The researcher took
the process further by overseeing the coding and auditing process to the final
assessment.
1 The evaluators record their individual counts of coding of the case study
from success factor 1 to 25 (see Table 5.1: Specimen of case study analysis
for clarification, pp. 165).
2 When the evaluators assess the case studies and for example find that (SF)
success factor 2 (design/construction) contravened by failing to engage in
the required practice, the evaluators must mark the success factor (SF) as ‘1’
at all the various SF items related to this specific issue. In other words, the
design problem can impact more than one success factor, for example items
2, 5, 8, 12, 11 and 18, over one or more phases (see specimen Table 5.1).
If SF 2 is only related to phase 2, the total will be ‘3’ because one contravened SF
can influence 3 activities, but if SF 2 affects phases 1, 2, 3 and 4 it will be
illustrated in the column “Ranking SF totals” as a total of 10 (see Table 5.1,
pp. 165). The total of ‘10’ reflects the number of activities that the project
manager contravened over those phases regarding SF 2. It is possible that
the “design” SF can cover all four phases or a number of success factors
(any number between 1 and 25 of the SF list).
3 Once the evaluators completed the assessment forms (see Annexure 3: Case
studies assessments, pp. 240), each item in every phase must be counted and
the total stipulated in phase 5 under “Ranking SF totals”.

165
4 After the evaluators completed their assessments, they count the SF
numbers in each phase and write the total in the “Phase 5: SF rating”
column
(Annexure 3: Case study – Evaluator’s form, pp. 265).
5 Ranking on a five point Likert scale was then performed according to the
recommendations by Harzing et al. (2009), DeChiusole and Stefanutti
(2011) and Krosnick and Alwin (1988).
SF
NO
SUCCESS FACTORS (SF)
Case – Study No:
Coding Analysis
SF
CODING
Phase 1
Concept
Ranking
SF
NO
Phase 2
Planning
Ranking
SF
NO
Phase 3
Implementa-
tion
Construction
Ranking
SF
NO
Phase 4
Closeout
Ranking
SF
NO
Phase 5
Success
Factor
Rating
SF
TOTALS
1. Competent project manager. 111(3) ____ 111111(6) 11(2) 11
2. Client participation and approval on
project, design – construction 1 (1) 111(3) 1111 (4) 11(2) 10
3. Project mission – clearly defined
goals, objectives, scope of works. 11(2) 1(1) 11(2) 1(1) 6
TABLE 5.1: Specimen of case study analysis
5.10 EVALUATION AND ANALYSIS OF DATA
Yin’s (2002) declares that quantitative and qualitative research should be
combined if a valid answer to the research question is to be found. He says that
the investigation of data “consists of examining, categorising, tabulating, testing,
or otherwise to combine both the quantitative and qualitative evidence to address
the initial proposition of a study, which is compatible with his opposition to the
bifurcation between quantitative and qualitative research”.
In this research results from the quantitative and qualitative research were
analysed separately and then combined in tables and graphs. The results were then
seen to complement one another.

166
A number of success factors were deemed critical to the success of a project, and
the absence of those success factors were revealed to be among the causes of the
failures of the projects examined in the case studies.
5.10.1 DEFINING THE FEATURES OF THE CASE STUDY
Stake (1995) describes two ways to analyse data: categorical aggregation and
direct interpretation. He regards them as two general strategies to handle case
study data.
Merriam (1998) feels that her model of analysing qualitative data in a case study
is mostly complementary to both Stake’s and Yin’s interpretations of case study
analysis. She describes data analysis as the process of making sense out of data by
consolidating, reducing and interpreting what people said and what the researcher
saw and read. She also explains why and how data should be collected and
analysed simultaneously. Merriam (1998) agrees on the importance of strategies
to manage data; this viewpoint complements both Yin’s and Stake’s theories.
This research methodology will assess and clarify the various case studies within
the context of the well-known tri-angle paradigm which Kerzner (1992), Pinto &
Slevin (1989) and Meredith and Mantel (1995) define.
5.11 VALIDATING DATA
The three methodologists have different views on data validation which are
associated with their notions of validity and reliability in investigations. The
differences between Merriam (1998) and Stake’s (1995) on the one hand and
Yin’s (2002) on the other hand relate to the differences in their philosophical
viewpoints.
Yin (2002) thinks that data is validated through the triangulation of multiple
sources of evidence, pattern-matching and generalisation. Stake (1995) thinks that
validation occurs through the triangulation of data, theory and methodology.
167
Merriam (1998) is of the opinion that the researcher’s work should consist of
strategies, and explanation of the investigator’s position with regards to the study,
triangulation and the use of an audit trail. She suggests three external validity
methods: the use of a comprehensive description, typicality or model categories,
and multi-site designs.
Flower and Hayes (1981) argue that using multiple sources of evidence will
increase the reliability and validity of the data for pattern-matching. Their
suggestions were followed with those of Yin (2002) as indicated in item 5.3
above.
5.12 PROCESS OF CASE STUDY EVALUATION
The case studies evaluated were related to the research topic and also to the
construction industry. The documented case study failures were directly observed
and participants were interviewed; original evidence that existed at the time of the
improper execution of the project was therefore available. The project failure was
judged in terms of the rules of conduct for registered engineers. The four case
studies were randomly selected from thirty four similar cases by the researcher.
The researcher also selected four engineers (qualified and experienced in project
management) to be part of the case study evaluation. The researcher gave these
engineers instructions on how to approach and assess the case study at hand to
ensure a reliable and valid assessment.
The assessment protocol was as follows:
The engineers remained anonymous and the case studies under review were not
identified.
Each of the four engineers selected a case study (from the four already selected by
the researcher) and was then shown how to apply the assessment questionnaire.
• Every SF and coding incident as identified in the case study counts one
point.
168
Example: in coding case study 1: an investigation revealed that the quality
of materials and workmanship produced by the contractor was substandard
(SFs 1, 2, 5, 7, 8 and 11).
This implied the following: The project manager did not approve the bill of
quantities (1). The designer failed to provide the specification for materials
(2). Lack of client participation (5). No effective communication (7). Lack
of reliable contractor service (8). Project monitoring and controlling was not
carried out (11), and so forth. One statement in the case study addressed
6 SF activities.
• Read the case study through and prepare for unknown questions to be
clarified before filling in the questionnaire which will then be discussed
before dealing with the assessment review.
• Every item (failure or not according to the standard code of practice) on the
case study should be identified and coded individually within its specific
phase and the numbers added in the SF rating column (Assessment form).
• One incident of case activity may have numerous of the same SF applicable
within the same criteria and context. The design engineer can be involved
four or five times in the same paragraph depending on the area under
question. For example: In question SF criteria 2, the design can have an
impact on SFs 2, 6, 8, 16 and 20, and therefore your reply will be coded as
‘1’ at each of those identified SF numbers i.e. 2(1 point), 6(1), 8(1), 16 (1),
and 20 (1). A total of 5 points is then written in the Rating SF totals column.
• The assessment must be coded and include numbers 1 to 25 in the case
study assessment table.
The four case study assessments took four evaluators an average of 2.5 hours each
to complete. The assessment was then finalised and recorded in a data base so that
the contents of the four case studies could be analysed and ranked.
169
5.13 PREPARE THE REPORT
The purpose of the qualitative study was to code the selective case study
information and find out whether it validated the quantitative survey research
results.
By analysing the contents of four anonymous case studies the critical success
factors that were neglected were identified and therefore resulted in the failure of
the project. Table 5.2 (pp.170) provides a summary of the number of occurrences
of each code (i.e. failure or absence of the success factor) which forms part of the
report.
Ranking of the success factors indicating the failures regarding a case study are
articulated in the last column “Total of complete project” seen in the ranking
column. For example: SF 1 indicated a count of 117 = ranking as 1, indicating the
highest SF failure. See Table 5.2: Qualitative case study analysis, pp 170.
The reviewed case study assessments are indicated in the pattern-matching graphs
6.1, 6.2, 6.3 and 6.4, pp. 179 - 181.
To validate the results in the Table, a summary of each case study will be included
in the report.

170
Success factor
Phase 1
Concept
Phase 2
Planning
Phase 3
Implementation / Construction
Phase 4
Closeout
Total of complete
project
Count of
code Rank
Count of
code Rank
Count of
code Rank
Count of
code Rank
Count of
code Rank
1 Competent project manager 20 3 49 1 36 6 12 5 117 1
2 Client participation and approval on project, design –
construction
20 3 33 4 34 8 20 2 107 3
3
Project mission – clearly
defined goals, objectives, scope of works.
22 2 36 3 31 12 12 5 101 4
4 Top management support. 8 8 9 18 7 20 7 16 31 19
5 Competence of project team. 23 1 39 2 40 2 12 5 114 2
6 Sufficient project resources. 2 20 1 22 1 23 2 22 6 23
7 Effective communication
between participants. 14 5 30 5 33 10 13 4 90 5
8 Reliable and experienced contractor services.
11 6 26 8 34 8 11 10 82 10
9 Quality control on
workmanship. 11 6 27 7 35 7 14 3 87 7
10 Project planning,
time,(WBS). 2 20 8 20 9 19 5 18 24 20
11 Project monitoring & controlling.
5 13 15 14 37 5 9 14 66 12
12 Regular site visits / meetings. 3 17 9 18 21 14 9 14 42 17
13
Clearly defined and detailed
contract procurement
processes.
6 11 20 11 24 13 3 20 53 13
14 Project Risk Management. 8 8 28 6 33 10 12 5 81 11
15 Project variation orders (VO’).
0 23 1 22 4 22 2 22 7 22
16 Applicable training
provision. 0 23 0 25 0 25 0 25 0 25
17 Progress meetings. 6 11 10 17 13 18 10 11 39 18
18
Well defined specifications
and technical drawings with BoQ
8 8 25 9 39 3 12 5 84 9
19 Environmental studies. 5 13 19 12 19 15 4 19 47 15
20 Feasibility studies. 5 13 18 13 18 17 7 16 48 14
21 Adequate financial resources. 0 23 1 22 1 23 1 24 3 24
22 Contractor performance on site management and
supervision.
4 16 15 14 58 1 10 11 87 7
23 Decision procedures or latent issues
3 17 15 14 19 15 10 11 47 15
24 Type and size of project. 1 22 3 21 7 20 3 20 14 21
25 Contract and dispute
procedures. 3 17 25 9 38 4 24 1 90 5
Table 5.2: Qualitative case study analysis (Shading indicates the five factors that had
the most problematic occurrences for all four case studies).

171
5.14 ASSESSMENTS OF THE FOUR SELECTED CASE STUDIES
The four case studies and assessments can be seen in Annexure 3: Case study
assessment, pp. 240 – 261
Evaluator’s assessment: Case study 1
It is clear from the above case study analysis that the engineer/project manager did
not utilise support, knowledge and expertise available to him/her when
supervising the project. The engineer’s misrepresentation to the owner to cover up
for the contractor is a violation of the engineering code of conduct.
Neither the engineer nor the contractor should have allowed the use of
substandard materials.
When the five highest scores for CSFs in the case study evaluation are selected, it
is evident that the engineer/project manager and the contractor neglected or failed
to execute success factors 1, 2, 3, 5, 7, 9, 22 and 25. These results indicate the
most important instances of poor project management practice.
The analysis of this case study revealed that the engineer/project manager and
contractor rendered a substandard service (SF 5: competence of project team).
This conclusion is shown in merging (patter-matching) graphs 6.1, 6.2, 6.3 and
6.4 (pp. 179 – 181) and Table 5.2 which indicate high ratings in critical success
factor (CSF) 5:
Phase 1 rated 23, phase 2 rated 39 and phase 3 rated 40.
The project ranking factor indicates that this was the second highest risk
factor with a count code of 114.
These CSFs were rated as very important in Chapter 4, Table 4.3, pp. 136
when the engineer rated the CSF 5 at 72.2% in phase 1, 83.3% in phase
two and 87.8% in phase 3.
172
There is no doubt that both the engineer and the contractor should take full
responsibility for the financial loss (and its impact on the client’s investment)
caused by the reduction in the floor-to-floor height.
The project’s final rating was a 4 which indicated the fourth lowest project
service delivery out of 25 CSFs. Project SFs ratings are determined by meeting SF
3 (mission, goals and SoW). This assessment count of code was 101 (Table 5.2,
pp. 170).
The researcher’s point of view is that the engineer was not equipped with
sufficient project experience or knowledge to oversee this project through its
various phases.
Evaluator’s assessment: Case study no 2
This was a large project which required a high level of specialised professional
engineering services. For this reason the client appointed a firm of consulting
engineers to provide the required services and to execute the requirements in
terms of the project scope of work. This type of project often contains latent
defects, necessitating the knowledge and supervision of an experienced
engineer/project manager. An additional problem was the fact that the owner
limited the engineer’s site visits, something which later proved to has been crucial
oversight.
The most important success factors defined in the case study evaluation were SFs
1, 2, 3, 5, 7, 9, 21, 18, 22 and 25.
As noted in Chapter 2 the project manager/engineer is supposed to take full
responsibility of the project team. He should have taken the lead in advising the
client, design team, contractors and other role players about the full scope of
work, communication, overall quality control and the complexity of the project.
According to the evaluator’s assessment the project manager failed to do the
following:
173
- He did not formulate a full scope of work, something which would have
identified the client’s needs. There was no written project mission, no risk
and project implementation, no testing of the reliability of work force, a
lack of the experience and knowledge required for the specific design
components of the project and no environmental and feasibility studies to
assess latent factors.
- Other success factors indicated in Table 5.2 were also neglected.
- The project manager failed to take control and lead in managing, advising
and overseeing the client’s needs. This was probably because of his lack of
managerial and leadership experience.
- The client limited the engineer’s site inspections probably to cut costs. The
project manager/engineer did not advise the owner of the risks inherent in
his decision, and this decision led to his violating the building code of
conduct.
From the above evaluator’s analysis it is clear that the most important critical
success factors are 1, 2, 3, 5, 7, 9, 14, 18, 22 and 25. This was illustrated in phases
1, 2 and 3 and as indicated in the success factor ratings.
The above mentioned factors are shown in merging (pattern-matching) graphs 6.1,
6.2 and 6.3 (pp. 179 – 180) where the three project phases were displayed.
Evaluator’s assessment: Case study no 3
The assessment of this case study led to the conclusion that the engineer was not
competent to design the structure. His method of executing the design and
drawings showed that he did not take the complexity of the design into
consideration, and this affected the entire project. The most important critical
success factors 1, 2, 3, 5, 7, 18, 22 and 25 were shown to be relevant for this
project.
The engineer/project manager maintained inter alia that the collapse was not
caused solely by him, that he was not responsible for producing the structural
174
design, that he did not err when reacting to the punching failure, that the design
was altered without his knowledge and that his scope of work included only
limited visits to the site. The engineer claimed that the design changes altered the
loading on the structure, culminating in overloading during construction.
However, the engineer/project manager signed the local authority’s form ‘A19
form’, confirming his appointment as the responsible person for the design and
overseeing the project.
• He failed to discharge his duties to his client and the public with skill,
efficiency, professionalism, knowledge, competence, due care and
diligence.
• He undertook work of a nature for which his education, training and
experience had not rendered him competent.
• He failed to engage in or adhere to acceptable practices (SFs 1, 2, 3, 5, 7, 8,
9, 11, 12, 13, 14, 18, 19, 24 and 25).
• He did not have due regard for public health, safety and interest (SF 14).
• He did not provide work or services of quality and scope or on a level
corresponding to accepted standards and practices in the profession
(SF 9).
The engineer did not conform to the design and construction codes of conduct,
and did not pay attention to the critical success factors. He also did not do soil
analysis to ascertain the soil conditions of the site, something which is necessary
when the foundation design loadings are calculated. The most important success
factors as defined in the survey research (Table 4.3, pp. 136) namely SFs 1, 2, 3, 5
and 7 as well as the success factors listed in phases 2 and 3 (which are above
60%) were ignored.
CSFs 1, 2, 3, 5, 7, 9, 11, 14, 19, 22, 23, and 25 were shown by the quantitative
research to be regarded as very important. In this project they were all
disregarded, leading to a negative outcome for the project. Regarding phases 1, 2
and 3 scope of work (SF 3) the engineer and the contractor’s competence to
execute their duties (SF 19) environmental studies, (SF 14) risk control and well
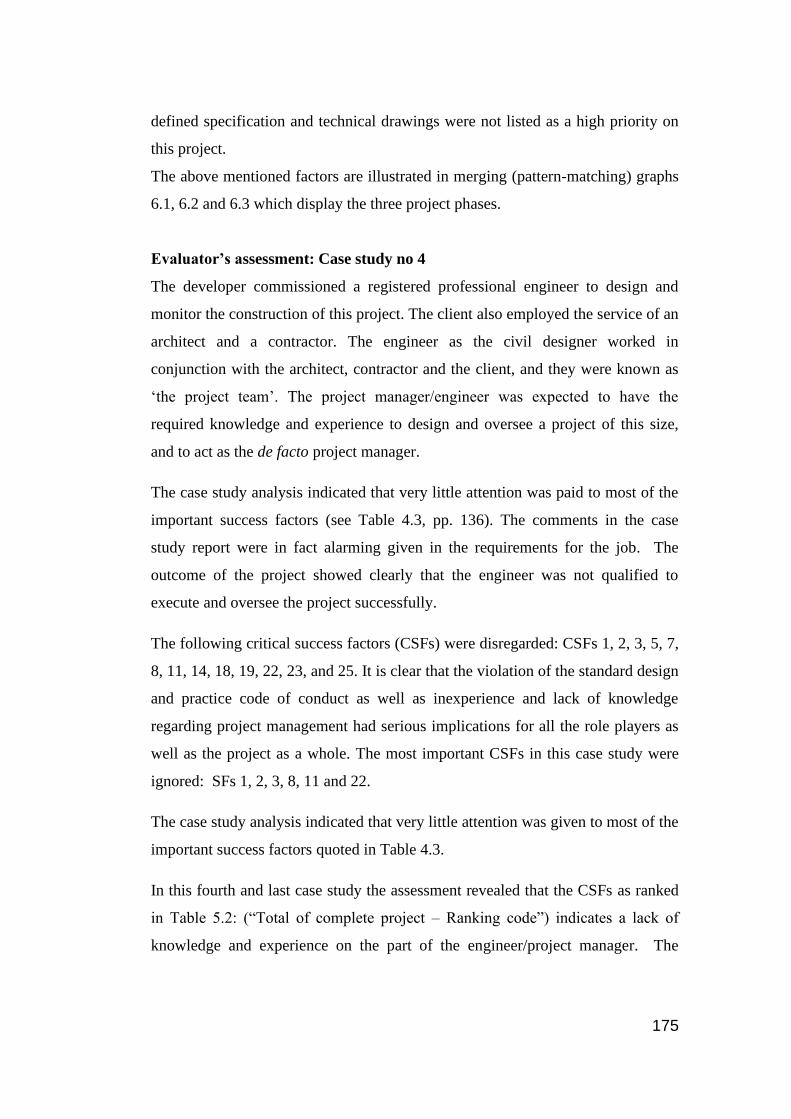
175
defined specification and technical drawings were not listed as a high priority on
this project.
The above mentioned factors are illustrated in merging (pattern-matching) graphs
6.1, 6.2 and 6.3 which display the three project phases.
Evaluator’s assessment: Case study no 4
The developer commissioned a registered professional engineer to design and
monitor the construction of this project. The client also employed the service of an
architect and a contractor. The engineer as the civil designer worked in
conjunction with the architect, contractor and the client, and they were known as
‘the project team’. The project manager/engineer was expected to have the
required knowledge and experience to design and oversee a project of this size,
and to act as the de facto project manager.
The case study analysis indicated that very little attention was paid to most of the
important success factors (see Table 4.3, pp. 136). The comments in the case
study report were in fact alarming given in the requirements for the job. The
outcome of the project showed clearly that the engineer was not qualified to
execute and oversee the project successfully.
The following critical success factors (CSFs) were disregarded: CSFs 1, 2, 3, 5, 7,
8, 11, 14, 18, 19, 22, 23, and 25. It is clear that the violation of the standard design
and practice code of conduct as well as inexperience and lack of knowledge
regarding project management had serious implications for all the role players as
well as the project as a whole. The most important CSFs in this case study were
ignored: SFs 1, 2, 3, 8, 11 and 22.
The case study analysis indicated that very little attention was given to most of the
important success factors quoted in Table 4.3.
In this fourth and last case study the assessment revealed that the CSFs as ranked
in Table 5.2: (“Total of complete project – Ranking code”) indicates a lack of
knowledge and experience on the part of the engineer/project manager. The

176
ranking codes 1, 3, 4, 2, 5, 7, 9, 7, and 5 are all applicable here and affect all four
phases of the project.
5.15 SUMMARY
The fundamental structure for the second part of the research, a case study
analysis, was formulated in the chapter which discussed the literature on
quantitative and qualitative research. This was followed by the survey research to
address the research objective and the research questions.
The literature overview made it clear that the research topic could only be
addressed through the application of a quantitative survey as well as a qualitative
case study analysis. After assessing the views of various researchers on case study
analysis, it was decided that the views of Yin (2002) and Flower and Hayes
(1981) were the most appropriate for this research.
The results of all four case study analyses are shown in Table 5.2, pp. 170. The
appalling results revealed in the case studies will be merged in chapter 6 when
pattern-matching analysis will be applied to validate the concerns of the
researcher.
The results of the qualitative case study described in this chapter were integrated
into the quantitative survey results to form a basis from which the secondary
research questions could be addressed.
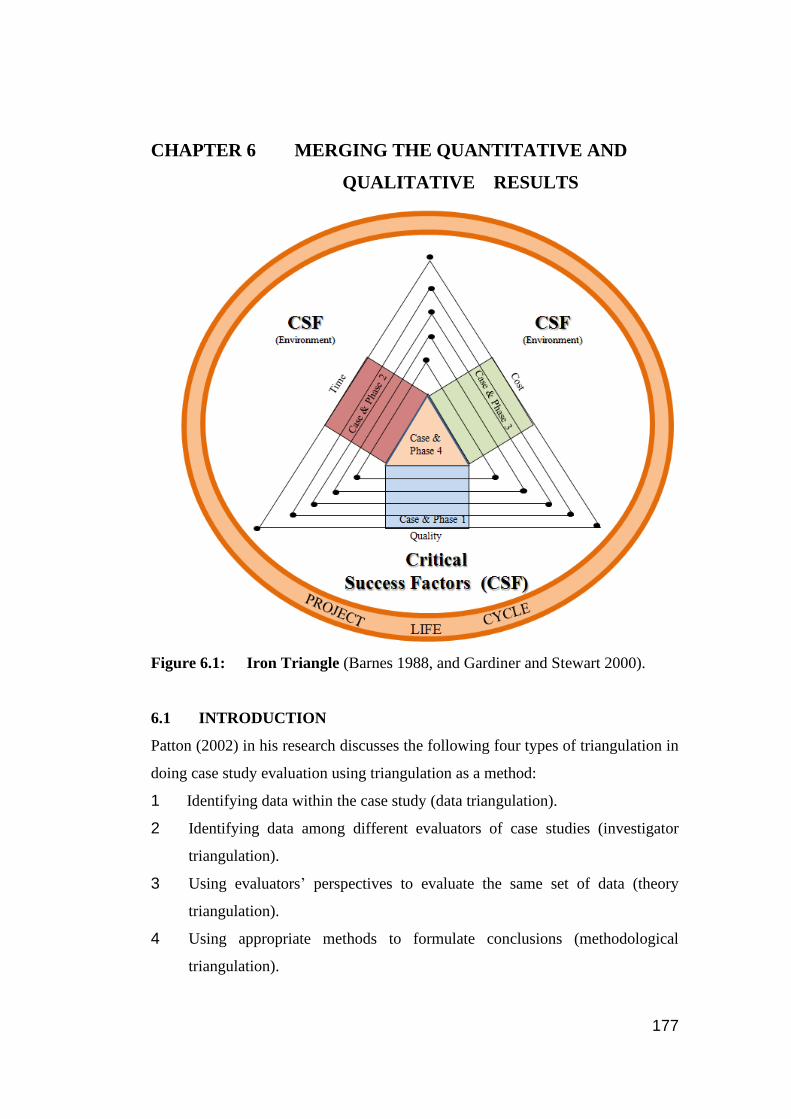
177
CHAPTER 6 MERGING THE QUANTITATIVE AND
QUALITATIVE RESULTS
Figure 6.1: Iron Triangle (Barnes 1988, and Gardiner and Stewart 2000).
6.1 INTRODUCTION
Patton (2002) in his research discusses the following four types of triangulation in
doing case study evaluation using triangulation as a method:
1 Identifying data within the case study (data triangulation).
2 Identifying data among different evaluators of case studies (investigator
triangulation).
3 Using evaluators’ perspectives to evaluate the same set of data (theory
triangulation).
4 Using appropriate methods to formulate conclusions (methodological
triangulation).
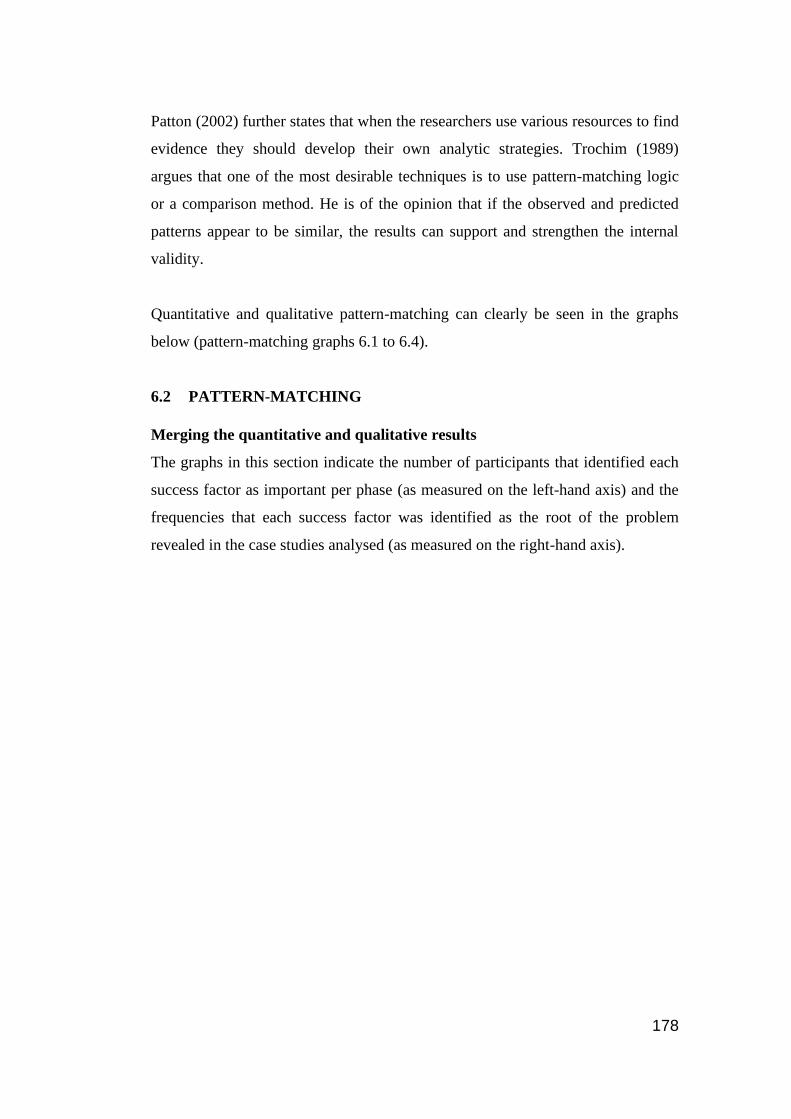
178
Patton (2002) further states that when the researchers use various resources to find
evidence they should develop their own analytic strategies. Trochim (1989)
argues that one of the most desirable techniques is to use pattern-matching logic
or a comparison method. He is of the opinion that if the observed and predicted
patterns appear to be similar, the results can support and strengthen the internal
validity.
Quantitative and qualitative pattern-matching can clearly be seen in the graphs
below (pattern-matching graphs 6.1 to 6.4).
6.2 PATTERN-MATCHING
Merging the quantitative and qualitative results
The graphs in this section indicate the number of participants that identified each
success factor as important per phase (as measured on the left-hand axis) and the
frequencies that each success factor was identified as the root of the problem
revealed in the case studies analysed (as measured on the right-hand axis).

179
Phase 1
Graph 6.1: Pattern-matching phase 1
• Similar trends, in other words the factors identified as important by the
participants (that corresponds to theory) are in many cases the root of
problems in practise such as SF 5 coded at 23 in Table 5.2 (phase 1).
Similar trends can be noticed in graphs 2 to 4 regarding SF 5.
• The exceptions in phase 1 are with SF 19 (environmental studies) and SF 20
(feasibility studies), where the participants indicated them as important and
these were not the root of problems during this phase. This could imply that
these studies are conducted and therefore do not create risks for the project’s
success.
0
5
10
15
20
25
0
10
20
30
40
50
60
70
80
90
SF
1S
F2
SF
3S
F4
SF
5S
F6
SF
7S
F8
SF
9S
F1
0S
F1
1S
F1
2S
F1
3S
F1
4S
F1
5S
F1
6S
F1
7S
F1
8S
F1
9S
F2
0S
F2
1S
F2
2S
F2
3S
F2
4S
F25
Cod
e frequ
encies
Co
un
t o
f su
rvey
res
po
nd
ents
Identified as important in Phase 1 Case study problem in Phase 1
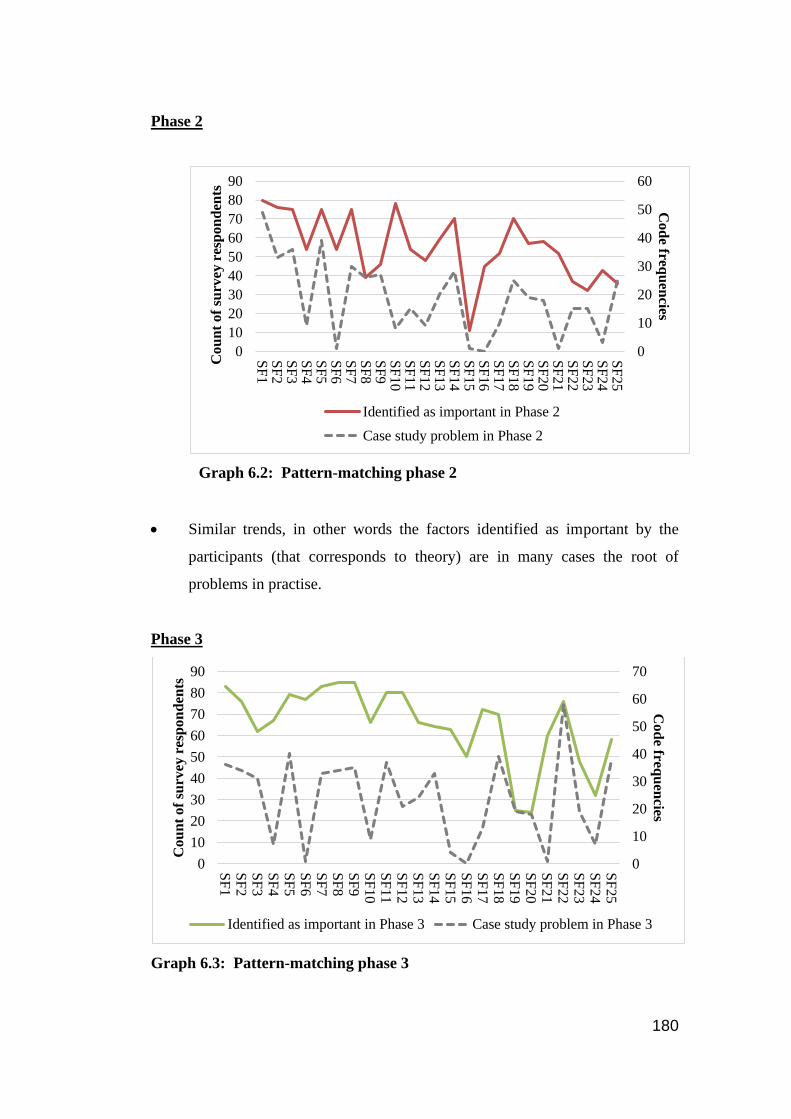
180
Phase 2
Graph 6.2: Pattern-matching phase 2
• Similar trends, in other words the factors identified as important by the
participants (that corresponds to theory) are in many cases the root of
problems in practise.
Phase 3
Graph 6.3: Pattern-matching phase 3
0
10
20
30
40
50
60
0
10
20
30
40
50
60
70
80
90
SF
1S
F2
SF
3S
F4
SF
5S
F6
SF
7S
F8
SF
9S
F1
0S
F1
1S
F1
2S
F1
3S
F1
4S
F1
5S
F1
6S
F1
7S
F1
8S
F1
9S
F2
0S
F2
1S
F2
2S
F2
3S
F2
4S
F2
5
Co
de freq
uen
cies
Co
un
t o
f su
rvey
res
po
nd
ents
Identified as important in Phase 2
Case study problem in Phase 2
0
10
20
30
40
50
60
70
0
10
20
30
40
50
60
70
80
90
SF
1S
F2
SF
3S
F4
SF
5S
F6
SF
7S
F8
SF
9S
F1
0S
F1
1S
F1
2S
F1
3S
F1
4S
F1
5S
F1
6S
F1
7S
F1
8S
F1
9S
F2
0S
F2
1S
F2
2S
F2
3S
F2
4S
F2
5
Co
de freq
uen
cies
Co
un
t o
f su
rvey r
esp
on
den
ts
Identified as important in Phase 3 Case study problem in Phase 3
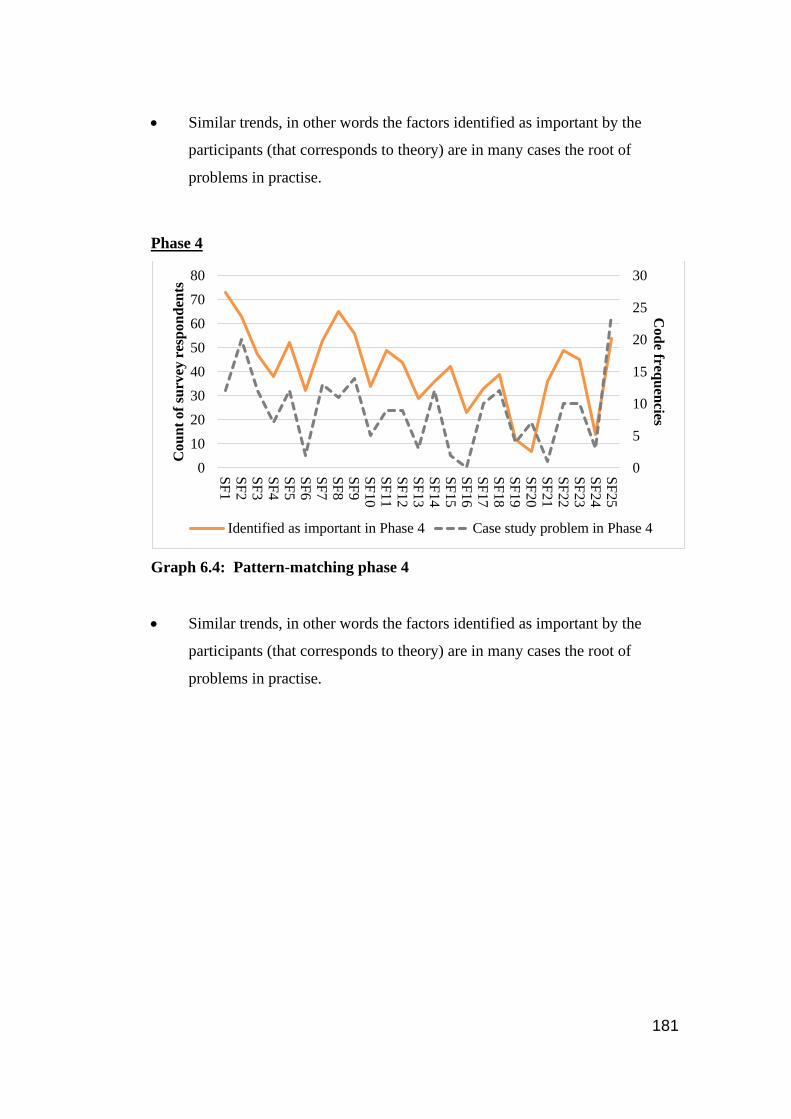
181
• Similar trends, in other words the factors identified as important by the
participants (that corresponds to theory) are in many cases the root of
problems in practise.
Phase 4
Graph 6.4: Pattern-matching phase 4
• Similar trends, in other words the factors identified as important by the
participants (that corresponds to theory) are in many cases the root of
problems in practise.
0
5
10
15
20
25
30
0
10
20
30
40
50
60
70
80
SF
1S
F2
SF
3S
F4
SF
5S
F6
SF
7S
F8
SF
9S
F10
SF
11
SF
12
SF
13
SF
14
SF
15
SF
16
SF
17
SF
18
SF
19
SF
20
SF
21
SF
22
SF
23
SF
24
SF
25
Co
de freq
uen
cies
Cou
nt
of
surv
ey
res
po
nd
ents
Identified as important in Phase 4 Case study problem in Phase 4
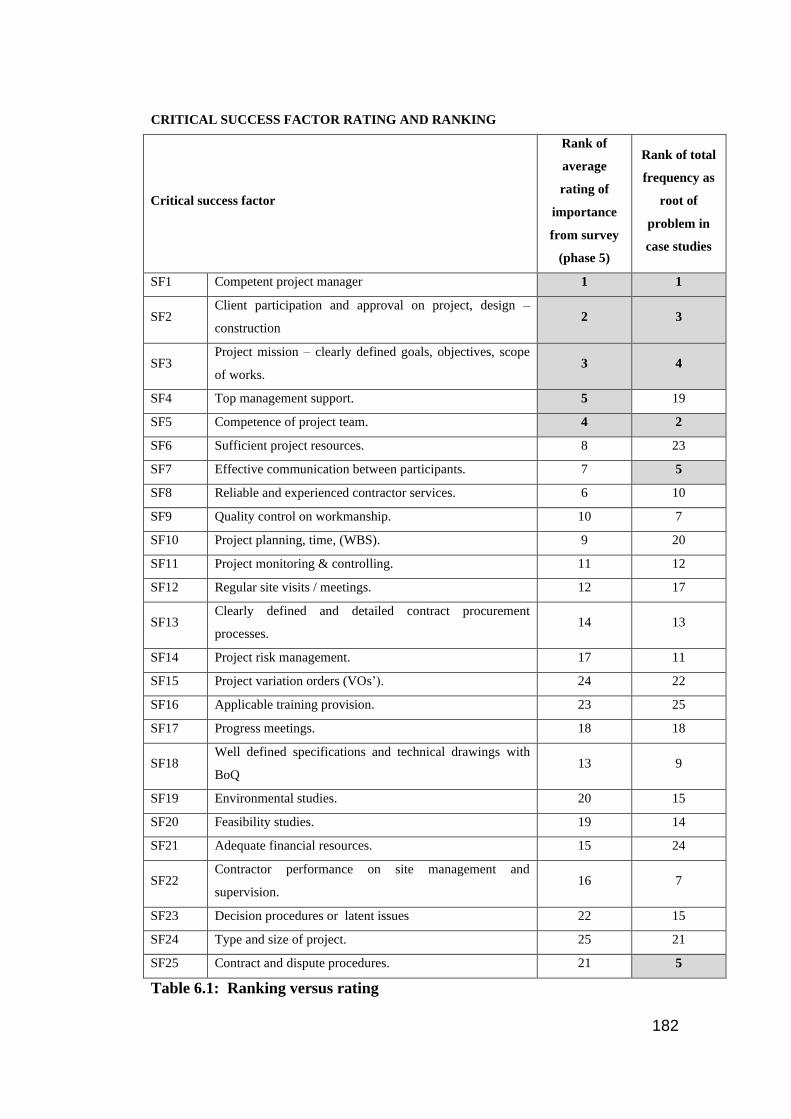
182
CRITICAL SUCCESS FACTOR RATING AND RANKING
Critical success factor
Rank of
average
rating of
importance
from survey
(phase 5)
Rank of total
frequency as
root of
problem in
case studies
SF1 Competent project manager 1 1
SF2 Client participation and approval on project, design –
construction 2 3
SF3 Project mission – clearly defined goals, objectives, scope
of works. 3 4
SF4 Top management support. 5 19
SF5 Competence of project team. 4 2
SF6 Sufficient project resources. 8 23
SF7 Effective communication between participants. 7 5
SF8 Reliable and experienced contractor services. 6 10
SF9 Quality control on workmanship. 10 7
SF10 Project planning, time, (WBS). 9 20
SF11 Project monitoring & controlling. 11 12
SF12 Regular site visits / meetings. 12 17
SF13 Clearly defined and detailed contract procurement
processes. 14 13
SF14 Project risk management. 17 11
SF15 Project variation orders (VOs’). 24 22
SF16 Applicable training provision. 23 25
SF17 Progress meetings. 18 18
SF18 Well defined specifications and technical drawings with
BoQ 13 9
SF19 Environmental studies. 20 15
SF20 Feasibility studies. 19 14
SF21 Adequate financial resources. 15 24
SF22 Contractor performance on site management and
supervision. 16 7
SF23 Decision procedures or latent issues 22 15
SF24 Type and size of project. 25 21
SF25 Contract and dispute procedures. 21 5
Table 6.1: Ranking versus rating
183
The above Table 6.1 provides a summary of ranking of the analysed critical
success factors based on the results from the research analysis and total
frequencies of root of problem in all the case studies.
This serves as evidence that the factors identified as the most important factors
that are critical to the success of a project were mainly the root of project failures
in practice as based on the four case studies (selected out of 34 case studies) that
were analysed.
6.3 SUMMARY
Analysis of the case studies, questionnaires and graphs revealed a lack of
theoretical (academic) and scientific knowledge about project management on the
part of the project manager, which impacted negatively on their projects and in
some cases led to project failure. This finding is in agreement with the research by
Thornberry (1987) and Thamhain (1983). The case study evaluators who
reviewed and assessed the various case studies and took into account the practical
experience and the theoretical and scientific knowledge came to similar
conclusions as did Yin (1994) in his research. The lack of scientific knowledge
(includes scientific equipment and analysis done in a laboratory or on site) was
clearly demonstrated in the results seen in Chapter 6, graphs 6.1, 6.2, 6.3 and 6.4.
Over all four phases the following success factors were identified: SF 1, 2, 3, 5
and 7 as critical success factors.
As indicated by Patton (2002) and Yardley (2009) (see Chapters 5 and 6) the
above graphs indicate the results that answer the secondary research questions and
address said authors’ theory in terms of meeting the evidence of reliability and
triangulation of the case study results.
The secondary research questions below as indicated in Chapter 1.4:
- Secondary research question 2: “How do the critical success factors affect
the project life cycle?” is answered in merging graphs 6.1, 6.2, 6.3 and 6.4.
184
The most important factors that are critical to the success of a project were
mainly the root of project failures in practise as based on the case studies
that were analysed.
- Secondary research question 3: “How can the effect of a lack of
knowledge and experience on the part of the project manager within the
project life cycle phases influence the critical success factors of project
management?” Inexperienced engineers who are employed as project and
construction managers and lack experience and knowledge in project
management practice will not be able to deliver a project successfully.
These engineers cannot identify latent defects within the critical success
factors which can affect all the phases of the life cycle as indicated in the
above pattern-matching graphs and case study analyses.
- Secondary research question 4: “Why are these critical success factors
important to be implemented?” Possible answers to the question are given in
Table 4.3: Selected critical success factors per phase (pp.136). This table
indicates phases 1, 2 and 3, highlighting SFs 1, 2, 3, 4, 5 and 7 as the most
important success factors to ensure the successful outcome of a project.
Phases 2 and 3 (shown the Table 4.3, pp. 136) indicate various success
factors above 60% which are ranked as a unit (SFs 2, 1, 5, 7, 4 and 3) as
indicated in the column marked as “average across project” and are equally
important. Pattern-matching of all four phases clearly illustrate that lack of
knowledge and experience on the part of the project manager can be
catastrophic to the outcome of any project because it will affect all the life
cycle phases.
As stated by Trochim (1989) a case study consists of the evaluators’ findings and
conclusion. If these conclusions agree with the conclusions of the quantitative
survey, they increase the internal validity of the research as a whole.
This chapter has proved the value of doing quantitative as well as qualitative
research to solve a problem. A combination of the two kinds of research made an
in-depth interpretation of the results of the study possible. The two research
instruments delivered different values but useful information was revealed when
185
the two methods were combined, and that information made answering the
research questions possible.
The information obtained from the case studies and shown in the merging graphs
clarified a number of concerns which had been left unresolved after the
investigations of the failed projects.
The final and total score of success factor 1 (competent project manager) showed
a total rating of 117 (highest rating) and indicates the incompetency of the project
manager, ranked as 1 in the total of complete project column (Table 5.2). The
relevance of this finding for this research is shown in the merging (pattern-
matching) graphs 6.1 to 6.4 above, as the pattern-matching of all four phases
illustrate the lack of knowledge and experience of the engineer when operating in
the office of a project manager.
186
CHAPTER 7 CONCLUSION AND RECOMMENDATIONS
7.1 CONCLUSION
The purpose of this research was to examine the Project Management Principles
that are applied in the South African Design and Construction Industry by
assessing and evaluate the engineer’s or project manager’s practical knowledge
and experience in the application of project methodology principles. The aim was
to address the project related concerns as defined within the research topic
affecting the critical success factors of project management and project delivery.
The purpose of this research was also to identify critical success factors related to
the project management environment and group them with the various project life
cycle phases. This survey questionnaire was utilised to gather information, as well
as to rank and group the most critical success factors as indicated in the survey
results.
The partnership of expertise and knowledge is a complex one and includes the
operational (practical) knowledge of being able to execute a project in its entirety
and work through all its life cycles to reach a successful end, in this case the
successful delivery of a project. Full responsibility to meet the objectives of the
project rests fully on the shoulders of the project manager. He/she has to be able
to apply the theoretical and scientific knowledge (obtained at a university) to the
construction project action. Theoretical and scientific knowledge forms the
underpinning of his work as it explains why a project should be performed in a
particular way, and it gives the project manager the ability to integrate the
individual tasks that have to be performed from initiation to completion if the
project as a whole is to be delivered successfully.
The research done by Thornberry (1987) and Thamhain (1983) point to a possible
cause for project failures: a lack of both theoretical (lack of practical application
dealing in theory) and scientific knowledge (scientific equipment, sample tests on
site and/or laboratories confirming with methods used in science, e.g. soil analysis
187
as revealed in the case studies) and practical experience on site on the part of the
project manager during the execution of his duties.
Case study 3 serves as a good example of the need to combine theoretical and
scientific knowledge and practical know-how. In this project the project manager
followed the example of what had been done at surrounding properties and did not
carry out a geotechnical investigation of the specific property before foundations
were designed. It was only discovered at a later stage that the design of the
structure did not take latent soil conditions into account. Soil conditions will have
an effect on the type of selected foundations and its safety / risk factors to
accommodate the required foundation design to sustain the full building load. This
example shows that the project failed because the project manager did not do
environmental studies before he started on the project. His lack of theoretical and
scientific knowledge of the correct procedures during the early stages of the
project as well as his lack of practical experience in the field had an adverse effect
on the project as a whole (Tomlinson 1980).
In this research the analysis of the four case studies as well as the questionnaire
results and the graphs confirm the researcher’s conclusions. Analysis of the
research questionnaire and the quantitative research revealed that the engineers
had sufficient knowledge to operate in their environment. However, the
qualitative case study analyses revealed that the engineers had a lack of
knowledge where project management was concerned.
The academic engineering courses offered by the universities equip young
engineers with sufficient knowledge to start their careers in the field of their
choice.
However, beginner engineers lack practical on-site experience. It therefore seems
logical that they need to start their careers by working under the supervision of an
experienced and knowledgeable engineer, especially regarding the responsibility
of managing a large project.
188
Due to the complexity and the scope of the research topic which involves survey
research and case study analyses, the researcher developed a research
methodology applying both quantitative and qualitative research technique
assessments to address the research objective and research questions.
The quantitative survey and qualitative case study analyses revealed the
following results:
1 The quantitative survey: The engineer with a Bachelor’s degree was found
to be competent when the survey was done regarding his/her academic
knowledge concerning project management practices (rating his/her
academic knowledge).
2 The qualitative case study analysis showed that the engineers lacked post-
graduate project management knowledge and on-site experience (pattern-
matching graphs 6.1 to 6.4).
3 Through the case study analyses the researcher proved the importance of on-
going collaboration between the project management team and other role
players as well as post-graduate project management knowledge and in-
depth site supervision if a project is to be delivered successfully. The lack of
collaboration was a major concern as revealed in the merging (pattern-
matching) graphs 6.1, 6.2, 6.3 and 6.4 (Pattern-matching phases 1, 2, 3, and
4). These graphs bring the quantitative and qualitative results together and
revealed the root of problems in practise.
The researcher found no reason to regard the quality of a Bachelor’s degree in
engineering to be inadequate or a possible cause for the failure of a project for
which the engineer was responsible. Registered professional engineers are
equipped with scientific knowledge about engineering in general as well as the
specific field of his/her choice. Thereafter the engineer has to follow a lengthy
process before he/she can be registered with the Engineering Council of South
Africa (ECSA). Engineers have to gain practical experience at a company or in
their field of interest, usually for a period of 2 to 3 years, after which they have to
submit a report of their experience. This is followed by a review and oral
189
examination by ECSA and only then can the engineer apply for full registration
with ECSA.
The research presented in this study highlighted the concerns raised by the
research topic by addressing the research objective and the research questions.
The main objective of the research was to identify success factors related to the
project and construction management environment and to group these success
factors with the various project life cycle phases as discussed by Pinto and Slevin
(1989). Critical success factors 1, 2, 3, 4, 5 and 7 were successfully identified and
grouped in phases 1, 2 and 3 according to some criteria. In order to resolve the
concerns of the research topic a five point Likert scale instrument was used to
measure the ranking versus rating results and revealed the above neglected critical
success factors. The ranking order for phases 1 to 3 (success factors 1, 2, 3, 4, 5
and 7) correlate with the ranking order presented in phase 5.
The primary research question was illustrated in phases 2 and 3 indicating
between 14 and 20 success factors rated above 60% (see Table 4.3). Most of these
critical success factors were neglected and were found in the reviewed case
studies to be the root of problems in practise (pattern-matching graphs 6.1 to 6.4,
pp. 179 – 181).
The secondary research questions revealed the following:
The most important success factors that are critical to the success of a project
were mainly the root of project failures in practise as based on the case studies
that were analysed. Inexperienced engineers who are employed as project and
construction managers and lack experience and knowledge in project management
practice will not be able to deliver a project successfully. Pattern-matching of all
four phases clearly illustrate that lack of knowledge and experience on the part of
the project manager can be catastrophic to the outcome of any project because it
will affect all the life cycle phases.

190
Four case studies were analysed and when the results of the quantitative survey
research and the qualitative analysis were merged, the following came to light:
1 During various stages in the qualitative case study analysis there was an
indication that a combination of activities were not performed during the
execution of the project live cycle process and that those led to project
failure and an inability by the main role players to fulfil the client’s needs.
2 The assessment of the four case studies showed that the knowledge, skills,
experience, practical abilities, as well as the communication between the
various role players were below the required standard and code of conduct.
3 The results also showed that the project mission was lacking, that goals and
objectives were undefined and that there was insufficient monitoring and
controlling during site meetings and activities. Physical inspections of the
real progress of the project and regular site meetings were often replaced by
weekly reports by the contractor.
4 Examination of the case studies indicated that the engineers regularly
overlooked or neglected to study the planning techniques and scope of work
in its fullness, and that this affected the critical success factors of the project
throughout the project life cycle. Examples of aspects that were neglected
are feasibility and environmental studies and risk management assessments.
5 The case studies indicated that the project manager did not visit the project
regularly and allowed the contractor to take control and make important
decisions on his own.
6 It was shown that communication and participation between all relevant role
players were not up to standard.
7 The case study analysis of all four phases indicated that the effect of a lack
of knowledge and experience in the project life cycle domain had a negative
impact on the critical success factors of project management. (Table 5.2:
Qualitative case study analysis, pp. 170).
8 The information obtained from the case studies and shown in the merging
(pattern-matching) graphs 6.1 to 6.4 clarified a number of concerns which
had been left unresolved after the investigation and judgement of the failed
projects.
191
The dual application of quantitative and qualitative research exposed
shortcomings in the knowledge (and therefore probably the training) of the
engineer when he needs to act as manager of a project. Integrating the two
research instruments brought to light the effect of a lack of project management
knowledge and site experience affecting the critical success factors within the
project life cycle phases.
The researcher concludes that there is a statistically significant correlation
between the quantitative survey and the qualitative analysis. These case studies
showed that project failure occurred when project management principles were
not followed. This is therefore an area of major concern. The results of the
research (using a quantitative survey, qualitative case study analyses, and five
point Likert scale instruments), stated that the engineer as project manager needs
further project management education and site experience in order to deliver a
successful project.
The purpose of this research was fulfilled in the results of the surveys and showed
that latent factors as well as the inexperience of engineers as project managers led
to project failures.
Fayol (1949) is of the opinion the future of the project manager will rest much on
his technical knowledge and ability but more on his managerial skills.
7.2 RECOMMENDATIONS
The researcher proposes that ECSA examine (and possibly adjust) its registration
conditions in order to better prepare engineers to become effective project
managers in their field of choice.
Adjustments and changes to the procedure can ensure that the candidate’s
registration is only valid within the boundaries of his or her experience. Should an
engineer wish to add a field of expertise to his/her resume, ECSA should be
informed and a new application process may be necessary.

192
The researcher further proposes the following requirements for some of the fields
of project management and registering with ECSA:
The graphs 6.1, 6.2, 6.3 and 6.4 and Table 5.2 reveal the most critical success
factors that need to be attended to. Over all four phases the following success
factors were identified: SF 1, 2, 3, 4, 5 and 7.
In order to address the identified lack of practical knowledge in engineers
regarding project management and therefore to ensure a more reliable
performance outcome (i.e. successful projects), the researcher recommends the
following:
The Continuing Professional Development (CPD) and other relevant,
registered courses should be expanded to include the areas where there is a
marked lack of knowledge especially in the field of project management.
These areas are identified in Table 5.2 as success factors 1, 2, 3, 5 and 7,
across all phases of the project. Relevant diplomas or certificates
approved by these institutions should be obtained.
A post graduate degree in project management should equip an engineer
with the necessary knowledge and skills to become a successful project
manager. This should be the choice of the engineer who seeks the office of
project manager.
In addition to the above two options, an engineer should gain at least two years’
(full time) site experience on project management under the supervision of a
senior engineer before being allowed to manage a project on his own.
Engineers with a bachelor’s degree should not be able to become project
managers in the construction and engineering environment without further post-
graduate knowledge, training and experience.
Badawy (1995) indicates that 63% of the engineers in the USA are employed as
managers at the age of 65 because of their relevant experience in this field.

193
The researcher agrees with Roberts and Biddle (1994) when they state that
postgraduate management education is important for engineers if they are to
improve their managerial skills.
The research presented in this study highlighted the concerns raised by the
research topic and addressed the research questions. The research also confirmed
the importance of postgraduate knowledge in project management principles and
full-time site experience for a minimum period of two years.
194
REFERENCES
Adams, J.R. & Barndt, S.E. (1983). Behavioural implications of the project life cycle. In
D.I. Cleland & W.R. King (Eds.). Project Management Handbook. New York: Van
Nostrand Reinhold Co. Pp. 183–204.
Ahadzie, D., Proverbs, D. & Olomolaiye, P. (2008). Critical success criteria for mass
housing building projects in developing countries. International Journal of Project
Management. Vol. 26 (6), pp. 675-687.
Aiyetan, A.O. (2010). Influences on the construction project delivery time. Unpublished
PhD. 2 – 4 August 2015, S.A. ASOCSA.
Akao, Y. & Ed., (1990). Quality function deployment: Integrating customer requirements
into product design. Productivity Press, Cambridge, MA.
Akinsola, A. O., Potts, K.F., Ndekugri, I. & Harris, F. C. (1997). Identification and
evaluation of factors influencing variations on building projects. International Journal
Project Management. Vol.15 (4), pp. 263-267.
Alwin, D.F. & Krosnick, J.A. (1985). The measurement of values in surveys: A
comparison of ratings and rankings. Public Opinion Quarterly. Vol. 49, pp. 535 – 552.
Anderson, G. (1993). Fundamentals of educational research. Falmer Press, London,
pp. 152-160.
Andersen, A.S., Barton, K.L. & Wrieden, W.L. (2004). Validity and reliability of a short
questionnaire for assessing the impact of cooking skills intervention. Journal of human
nutrition and dietetics. Centre for Public Health Nutrition Research. University of
Dundee, Dundee, UK.
Archibald, R.D. (1976). Managing High-Technology programs and projects. New York,
Wiley; pp. 167-168.
Argus, R. & Gunderson, N. (1997). Planning, performing and controlling projects. Upper
Saddle River, NJ: Prentice Hall; pp. 22-23.
195
Ashley, D. B., Lurie, C.S. & Jaselskis, E.J. (1987). Determinants of construction project
success. Project Management Journal. Vol. 18, (2), pp. 69-79.
Asmussen, K.J. & Creswell, J.W. (1995). Campus response to a student gunman. Journal
of Higher Education. Vol. 66, pp. 575–591.
Assaf, S.A., Alkhalil, M. & Al-Hazmi, M. (1995). Causes of delay in large building
construction projects. Journal of Management in Engineering, ASCE Vol. 11 (2), pp.
45-50.
Atkinson, R. (1999). Project management: cost, time and quality, two best guesses and a
phenomenon, it’s time to accept other success criteria. International Journal of Project
Management. Vol. 17, pp. 337–342.
Au, T. & Hendrickson, C. (1985). Education in engineering planning and management.
Proceedings of the ASCE Conference on Civil Engineering Education. Columbus, Ohio.
Avots, I. (1969). Why does project management fail? California Management Review.
Vol. 12 (10) pp. 77-82.
Babbie, E. (1998). The practice of social research. 8th Edn. Belmont, CA: Wadsworth
Publishing.
Babcock, D.L. (1978). Is the engineering manager different? Machine Design, March,
Vol. 50 (5), pp. 82-85.
Baccarini, D. (1999). The logical framework method for defining project success. Project
Management Journal. Vol. 30 (4), pp. 25–32.
Bach, J. (1995). The challenge of good enough soft ware. American Programmer. Vol. 8
(10), pp. 2-11.
Badawy, M.K. (1983). Why managers fail. Research management, May-June, pp. 26-31.

196
Badawy, M.K. (1995). Developing managerial skills in engineers and scientists,
pp. 49–199.
Bahill, A.T. & Chapman, W.L. (1993). A tutorial on quality function deployment.
Engineering Management Journal. Vol. 5 (3), pp. 24-35.
Baker, B.N., Murphy, D.C. & Fisher, D. (1983). Factors affecting project success. Project
Management Handbook. Van Nostrand Reinhold. New York.
Barnes, M. (1988). Construction project management. Project management.
Vol. 6 (2), pp. 69–79.
Baxter, P. & Jack, S. (2008). Qualitative case study methodology: Study design and
implementation for novice researchers. The Qualitative Report. Vol. 13 (4),
pp. 544–559.
Balachandra, R. & Raelin, J.A. (1984). When to kill that R&D project. Research
management (July-August 1984) pp. 30-33.
Baldwin, J.R. & Manthel, J.M. (1971). Causes of delay in the construction industry.
Journal of Construction Division, ASCE, Vol. 97, pp. 177-187.
Barrie, D.S. & Paulson, B.C. (1992). Professional construction management; ISBN 0-07-
003889-9, 3rd edn. McGraw-Hill Inc.
Beardsworth, A. (1980). Analysing press content: some technical and methodological
issues in Christian, H. (ed.). Sociology of Journalism and the Press. Keele: Kele
University Press.
Bedell, R.I. (1983). Terminating R&D projects prematurely. Research Management
(July - August 1983) pp. 32-35.
Belassi, W. & Tukel, O.I. (1996). A new framework for determining critical success
failure factors in projects. International Journal of project Management. Vol. 14 (3),
pp. 141-151.

197
Bell, J. & Waters, S. (2014). Doing your research project. 6th edn. Maidenhead:
Open University Press.
Belout, A. (1998). Effects of human resource management on project effectiveness and
success: towards a new conceptual framework. International Journal Project.
Bennet, R. (1991). How is management research carried out? The Management Research
Handbook: Smoth, N.C. & Danity, P. (eds). Rouledge, London, pp. 83–103.
Bennett, F.L. (1996). The management of engineering. John Wiley & Sons, inc. NY.
Bennett, P.D. (1995). Classifying products strategically. Journal of marketing. Chicago,
American Marketing Associations. Paper, pp. 24-42.
Biggs, C., Birks E. & Atkins, W. (1980). Managing the systems development process.
Upper Saddle River, NY: Prentice Hall.
Blake, R. & Mouton, J. (1969). The managerial grid. pp. 178-179. A more complete
description is given in Blake and Mouton: Organisational change by design. Austin,
Texas: Scientific Methods, (1976), pp. 1-16.
Bockrath, J.T. (1986). Dunham and Young’s Contracts, specifications for engineers. New
York: McGraw-Hill.
Bloomberg, B., Cooper, D.R. & Schindler, P.S. (2014). Business research methods.
4th edn. Boston, MA and Burr Ridge, IL: McGraw-Hill.
Bryde, D.J. & Robinson, L. (2005). Client versus contractor perspectives on project
success criteria. International Journal of Project Management. Vol. 23, pp. 622-629.
Bruner, G.C. (2013). Marketing Scales Handbook: The top 20 multi item measure used in
consumer research. Fort Worth, TX: GBll Productions.
Bryman, A. & Bell, E. (2003). Business research methods. Oxford: University Press.
198
Burke, R. (2001). Project management. Planning and control techniques. 3rd edn.
Promatec International. Technical Books, Cape Town, South Africa.
Campbell, D.T. (1975). Degrees of freedom and the case study. Comparative political
studies. Vol. 8 (2), pp. 178–193.
Carden, L. & Egan, T. (2008). Does our literature support sectors newer to project
management? The research for quality publications relevant to non-traditional industries.
Project Management Journal. Vol. 39, (3), pp. 6-27.
Carey, J. (1975). Communication and culture. Communication research. Vol. 2,
pp. 173-191.
Chan, A.P.C., Scott, D. & Chan, A.P.L. (2004). Factors affecting the success of a
construction project. Journal of Construction Engineering & Management. Vol. 130 (1),
pp. 153-155.
Chan, D.W.M. & Kumaraswamy, M.M. (2002). A comparative construction duration:
lessons learned from Hong-Kong building projects. International Project Management.
Vol. 20, pp. 23-35.
Chatfield, C. (2007). A short course in project management, Microsoft Office project
(2007). Step by step. Retrieved from http://www.office.Microsoft.com.
Chin, C. M. M. (2012). Development of project management methodology for use in a
university-industry collaborative research environment. (Doctoral dissertation).
University of Nottingham, Semenyih Selangor Darul Ehsan, Malaysia.
Chua, D.K.H., Kog, T.C. & Loh, P.K. (1999). Critical success factors for different project
objectives. Journal of Construction Engineering and Management. Vol.125 (3),
pp.142-150.
Cleland, D.I. & King, W.R. (1983). Systems analysis and project management. McGraw
Hill, New York.

199
Construction Industry Development Board (CIDB) (2004). Status Report. Synthesis
Review on the South African construction industry and its development, Pretoria, South
Africa.
Code of practice of Project Management for construction and development (2002).
3rd edn. The Chartered Institute of Building.
Collins Concise Dictionary (2001). 5th edn. Haper Collins Publisher. Great Britain. Omnia
Books Limited, Glasgow. ISBN:0 007 11634 9.
Construction and Health Safety Accord (2013).
Cook, B., & Williams, P. (1998). Construction planning, programming and control;
ISBN 0-333-67758-7, MacMillan Press Ltd.
Cooke-Davies, T. (2002). The real success factors on projects. International Journal of
Project Management. Vol. 20, pp.185-190.
Cooper, D. & Schindler, P. (2003). Business research methods. 8th edn. Boston: McGraw-
Hill.
Cooper, R.G. (1986). Winning at new products. Addison-Wesley, New York. pp.12.
Cooper, R. (1998). Product Leadership: Creating and launching superior new products.
New York: Perseus Books, (1998).
Cordero, R. (1990). The measurement of innovation performance in the firm: an
overview. Research Policy. Vol. 19, pp. 185-192.
Creswell, J.W. (1994). Research design: Qualitative and quantitative approaches.
Thousand Oaks. CA: Sage.
Creswell, J.W. (2008). Educational research: Design qualitative and quantitative
approaches. 3rd edn. Upper Saddle River: Pearson. Stage Publications, UK.

200
Crosby, B.P. (1979). Quality is free: The art of making quality certain. New York:
McGraw-Hill.
Cusumano, M. & Selby, R. (1995). Microsoft Secrets. New York, NY: Free Press.
Cutler, A. (2004). Methodological failure: the use of case study method by public
relations researchers. Public Relations Review. Vol. 30, pp. 365–375.
Daft, R. L. (2005). Management. 7th edn. Australia: Thomson, pp. 62.
Dainty, A.R.J., Cheng, M. & Moore, D.R. (2003). Redefining performance measures for
construction project managers: An empirical evaluation. Journal of construction
management and economics. Vol. 21, pp. 209-218.
DeChuisole, D. and Stefanutti, L. (2011). Rating, ranking, or both? A joint application of
two probabilistic models for the measurement of values. Testing, Psychometrics,
Methodology in Applied Psychology. Vol. 18 (1), pp. 49–60.
De Wit, A. (1988). Measurement of project success. International Journal of project
management. Vol. 6 (3), pp.164-170.
Dellacave, T. (1996). Curing Market Research Headaches, Sales & Marketing
Management, July 1996, pp. 84-85.
Denzin, N. & Lincoln, Y. (1994). The handbook of qualitative research. Sage
publications. California, pp. 3-5.
Department of Safety and Health (DOSH) (2010).
Department of Labour confirmed in the SA Construction (2013) Annual Report.
Dillman, D.A., Smyth, J.D. & Christian, J.M. (2014). Internet, Phone, Mail and Mixed
Mode Surveys: The Tailored Design Method. 4th edn. Hoboken, NJ: Wiley.
201
Dissanayaka, S.M. & Kumaraswamy, M.M. (1999). Evaluation of factors affecting time
and cost performance in Hong Kong building projects. Engineering. Construction,
Architect and Management. Vol. 6 (3), pp. 287-298.
Drucker, P.F. (1954). The practice of management. Renewed by Drucker, P.F., reprinted
by permission of Harper Collins Publishers, Inc.
Eisner, H. (1988). Computer-aided systems engineering. Upper Saddle River, NJ:
Prentice Hall, pp. 297-326.
Eisenhart, K.M. (1989). Building theories from case study research. The academy of
management review. Vol. 14. (4), pp. 532–550.
Eisenhart, K.M. & Graebner, M.E. (2007). Theory building from cases: Opportunities and
challenges. Academy of Management Journal. Vol. 50 (1), pp. 25–32.
Foddy, W. (1994). Constructing for interviews and questionnaires. Cambridge:
Cambridge University Press.
Flyvberg, B. (2011). Case study, in N.K. Denzin and Y.S. Lincoln (eds). The Sage
Handbook of qualitative research. 4th edn. London. Sage, pp. 301–316.
Flower, L.S. & Hayes, J.R. (1981). A cognitive process theory of writing. College
composition and communication. Vol. 32 (4), pp. 365–387.
Fayol, H. (1949). General and industrial management. London: Sir Isaac Pitman &
Sons Ltd.
Firmage, D.A, (1980). Modern engineering practice. New York: Garland STPM Press.
Frame, J.D. (1987). Managing projects in organisations. San Francisco, CA: Jossey–Bass.
Frame, J.D. (1988). Managing projects in organisations. San Francisco, CA: Jossey–Bass;
pp. 146-151.
202
Frödell, M., Josephson, P.E., & Lindahl, G. (2008). Swedish construction clients’ views
on project success and measuring performance. Journal of Engineering, Design and
Technology. Vol. 6, pp. 21-32.
Gardiner, P.D. & Stewart, K. (2000). Revisiting the golden triangle of cost, time and
quality: the role of NPV in project control, success and failure. International Journal of
project management. Vol. 18, pp. 251–256.
Gerring, J. (2004). What is a case study and what is it good for? American political
science review. Vol. 98 (2), pp. 341–354.
Gill, J. & Johnson, P. (2010). Research methods for managers. 4th edn. London: Sage.
Gillham, B. (2001). Case study research methods. London, New York: Continuum.
Gilgun, J.F. (1994). A case for case studies in social work research. Social work,
Vol. 39 (4), pp. 371-380.
Goldbloom, J. (1992). Improving specifications. Civil Engineering. Vol. 62 (9),
September, pp. 68-70.
Gordon, C.M. (1994). Choosing appropriate construction contracting method; Journal of
Construction Engineering and Management. Vol.120 (1), March 1994.
Ghauri. P. & Gronhaug, K. (2002). 2nd edn. Research methods in business studies:
A practical guide. Harlow, England: Prentice Hall.
Gross Domestic Product growth (GDP) (2013). (IDC – SA economic overview report).
Guterl, F. (1994). Design case history: Apple’s Macintosh, IEEE Spectrum, pp. 34-43.
Hajek, V. (1984). Management of engineering projects. 3rd edn. New York, NY:
McGraw-Hill, pp. 35-37.
Hall, P. (1980). Great planning disasters. Weidenfied and Nicolson, London.
203
Hamel, G.C. & Prahalad, K. (1994). Competing for the future. Boston Harvard Business
School Press.
Han, W.S., Yusof, A. M., Ismail, S. & Aun, N. C. (2012). Reviewing the notions of
construction project success. International Journal of Business and Management. Vol. 7,
pp. 90-101.
Hanan, M. (1993). Corporate growth through venture management. Harvard Business
Review, January-February 1969, pp. 36-44.
Harrison, F. (1981). Advanced project management. Aldershot: Gower. pp. 242-244.
Harzing, A.L., Baldueza, J., Barner-Rasmussen W., Barzantny, C., Canabal, A., Davila,
A. & Zander, L. (2009). Rating versus ranking: what is the best way to reduce response
and language bias in cross-national research? International Business Review. Vol. 18 (4),
pp. 417 – 432.
Haupt, T.C. (2009a). Preliminary findings of South African Construction Industry-
Academia Survey: Part 1, Journal of Construction. Vol. 2 (2), pp. 26-31, ISSN 1994-
7402.
Hippel, von E. (1986). Lead Users: A source of novel product concepts. Management
Science, July 1986, pp. 791-805.
Hirsch, W. (1986). The contracts management desk-book, revised edition. New York,
American Association Management.
Hoaglin, D.C., Mosteller, F. & Tukey, J.W. (1983). Understanding robust and exploratory
data analysis. New York: John Wiley and Sons.
Hoffman, G.C. (1989). Prescription for transitioning engineers into managers.
Engineering Management Journal. Vol. 1 (3). September, pp. 3-7.
Hughes, S. W., Tippett, D.D. & Thomas, W.K. (2004). Measuring project success in the
construction industry. Engineering Management Journal. Vol. 16, pp. 31-37.

204
Iacobucci, D. (2010). Structural equations modelling: Fit indices, sample size, and
advanced topics. Journal of consumer psychology. Vol. 20, pp. 90–98.
Industrial Development Corporation (IDC). February (2013). Foreign Direct Investment
(FDI).
IIincuta, A. & Jergeas, G.F. (2003). A practical approach to managing multiple small
projects, AACE International Transactions, pp. PM.13.1-PM.6.
Ika, L.A. (2009). Project success as a topic in project management journal. Project
Management Journal. Vol. 40, pp. 6-19.
International Development Corporation (IDC) (2013). SA Economic Overview. Recent
developments in the global and South African economies. Department of Research and
Information. February 2013.
International Organisation for Standardisation (ISO) (2004). ISO 10006: Quality
management-guidelines to quality in project management. Geneva: ISO. pp. 13.
Jackson, L.S. (2008). Research methods and statistics: A critical thinking approach.
Belmont, CA: Wadsworth Cengage Learning.
Jankowicz, A.D. (1991). Business research projects for students, London: Chapman and
Hall.
Jenkins, G. (1976). The systems approach. In Beishon, J. and Peters, G. (eds.), Systems
Behavior, 2nd edn. London, UK: Harper & Row; pp. 82.
Jugdev, K. & Thomas J. (2002). Project management maturity models: the silver bullets
of competitive advantage? Project Management Journal. Vol. 33 (4), pp. 4-14.
Kaminetzky. D. (1991). Design and construction failures: Lessons from forensic
investigations; ISBN 0-07-03355065-6, McGraw-Hill Inc.
205
Kaplan. R. S. & Norton. D. P. (1996). The balanced scorecard: Translating strategy into
action. (Boston: Harvard Business School Press, 1996) as a tool for monitoring
stakeholders satisfaction.
Kerzner, H. (1989). Project Management: A systems approach to planning, scheduling
and controlling. 3rd edn. New York: Van Nostrand Reinhold. NY.
Kerzner, H. (1992). Project management: A systems approach to planning, scheduling,
and controlling. Van Nostrand Reinhold. NY.
Kerzner, H. (2001). Project management: A systems approach to planning, scheduling,
and controlling. 7th edn. New York: John Wiley & Sons, Inc.
Kerzner, H. (2003). Project management: A systems approach to planning, scheduling,
and controlling. New Jersey: John Wiley & Sons, Inc.
Kerzner, H. (2009). Project management: A systems approach to planning, scheduling,
and controlling. 10th edn. John Wiley & Sons, Inc.
Kohn, M.L. (1977). “Reassessment 1977”. In class and conformity: A study in values.
Chicago: University of Chicago Press.
Kothari, C. (2004). Research methodology: Methods and techniques: New Delhi, New
age International Publishers.
Kransdroff, A. (1996). The role of the post-project analysis. The learning organisation.
Vol. 3 (1), pp.11-15.
Krosnick, J.A. & Alwin, D.F. (1988). A test of the form resistant correlation hypothesis:
ratings, rankings, and the measurement of values. Public Opinion Quarterly. Vol. 52 (4),
pp. 526–538.
Kumaraswamy, M.M. & Chan, D.W.M. (1999). Factors facilitating faster construction.
Journal Construction and Procurement.

206
Kyriakopoulos, G.L. (2011). Project management (PM) prosperity: A second half of the
20th century literature review. Journal of Management and Sustainability. Vol. 1 (91),
pp. 64-81.
Lehmann, D.R., Gupta, S. & Steckel, J. (1997). Market research, reading, MA:
Addison-Wesley.
Lewis, J.P. (2008). Mastering project management. 2nd edn. Applying advanced concepts
to system thinking, control and evaluation and resource allocation. MC Graw Hill.
Lientz, B. and Rea, K. (2003). International project management. Amsterdam. Academic
Press. pp. 161.
Lim, C.S. & Mohammed, M.Z. (1999). Criteria of project success: an exploratory re-
examination. International Journal of Project Management. Vol. 17, pp. 243-248.
Liu, A.N.N. & Walker, A. (1998). Evaluation of project outcomes. Construction
management and economics. Vol. 16, pp. 109-219.
Locke, D. (1984). Project management. St Martins Press, New York (1984).
Lynden, D.P., Reitzel, J.D. & Roberts, N.J. (1985). Business and the law. New York:
McGraw-Hill.
Manavazhia, M.R. and Adhikarib, D.K. (2002). Material and equipment procurement
delays in highway projects in Napal, International Journal project management. Vol. 20,
pp. 627-632.
Manzi, J.E. (1984). The A/E’s Liability in Design/Construction Progress. Construction
Claims Monthly, Vol. 6 (4), April, pp. 1-7.
Martin, C.C. (1974). Project management. New York: St Martins.
Martin, C.C. (1976). Project management. Amaco, New York. Delphi Revisited: Expert
opinion in Urban analysis, Urban studies. Vol. 24, pp. 217–225.
207
Mbande, C. (2010). Overcoming construction constraints through infrastructure deliver.
Proceedings: The Association of Schools of Construction of Southern Africa. Fifth Built
Environment Conference. Durban, South Africa.
McCuen, R.H. (1996).The elements of academic research. ASCE press, New York.
McKillip, J. (1987). Need analysis: Tools for the human services education. Newbury
Park, CA: Sage Publications.
Mengesha, W.J. (2004). Performance for Public Construction Projects in developing
countries: Federal Road & Educational Building Projects in Ethiopia Norwegian
University of Science and Technology: Doctoral Thesis 2004: pp. 45.
Merriam, S.B. (1988). Case study research in education. San Fransico: Jossey-Bass Inc.
Publishers.
Merriam, S.B. (1998). Qualitative research and case study applications in education. San
Francisco: Jossey-Bass Publishers.
Meredith, J.R. & Mantel, S.J. (1995). Project management: A Managerial Approach.
3rd edn. New York: Wiley.
Meredith, J.R. & Mantel, S.J. Jr. (2000). Project management: A managerial approach.
4th edn. New York: John Wiley & Sons.
Merna, T. & Al-Thani (2008). Corporate risk management. 2nd edn. England: John Wiley
& Sons, Ltd.
Miethe, T.D. (1985). The validity and reliability of value measurements. The Journal of
Psychology. Vol. 119 (5), pp. 441–453.
Miles, M. B. & Huberman, A. M. (1994). Qualitative data analysis. Thousand Oaks:
Sage.

208
Moore, W.L. and Tushman, M.L. (1982). Managing innovation over the product life
cycle, In Readings in the Management of Innovation, eds., pp. 131-150, Ballinger,
Cambridge, MA.
Moors, G. (2010). Ranking the ratings: a latent-class regression model to control for
overall agreement in opinion research. International Journal of Public Opinion Research.
Vol. 22, (1), pp. 93–119.
Morgan, H. & Soden, J. (1979). Understanding MIS failures. Database 5, pp. 157-171.
Morris, P.W. & Hough. G. H. (1987). The anatomy of major projects. John Wiley and
Sons, New York.
Mugenda, O.M. & Mugenda, A.G. (2003). Research method quantitative and qualitative
approaches: Nairobi Kenya: Acts Press.
Müller, R. & Turner, R. (2007). The influence of project managers on project success
criteria and project success by type of project. European Management Journal. Vol. 25
(4), pp. 298-309.
Munns, A.K. & Bjeirmi, B.F. (1996). The role of project management in achieving
success. International Journal of Project Management. Vol. 14 (2), pp. 81-88.
Naoum, S.G. & Langford, D. (1987). Management contracting: The client’s view;
Journal of Construction Engineering and Management. Vol. 113, (3), September 1987.
Ndekugri, I. & Turner, A. (1994). Building procurement by design and build approach;
Journal of construction engineering and management. Vol. 120, (2), June 1994.
Nguyen, D.L., Ogunlana, S.O. & Lan, D.T. X. (2004). A study on project success factors
in large construction projects in Vietnam. Engineering construction and architectural
management. Vol. 11 (6), pp. 404-413.
O’Connor, D.T. (1994). The practice of engineering management – A new approach.
John Willet & Sons, New York.

209
Occupational Health and Safety Act and Amendments (2014), the Department of Labour.
Oswald, S.L., Mossholder, K.W. & Harris, S.G. (1997). Relations between strategic
involvement and managers: Perceptions of environment and competitive strengths. Group
and organisation management. Vol. 22 (3).
Parasuraman, A., Zeithaml, V, A. & Berry, L. (1985). A conceptual model of service
quality and its implications for the future research. Journal of Marketing Research. Fall
1985, pp. 41-50.
Patton, M. (1987). How to use qualitative methods in evaluation. Sage Publication,
California, pp. 18-20.
Patton, M.Q. (2002). Qualitative research and evaluation methods. 3rd edn. Thousand
Oaks, CA: Sage.
Pekrun, R. & Stephens, E.J. (2010). Achievement emotions: A control-value approach.
Social and personality psychology compass. Vol. 4, pp. 238–255.
Pillai, A.S., Joshi, A. & Rao, K.S. (2002). Performance measurement of R&D projects in
multi-project, concurrent engineering environment. International Journal of Project
Management. Vol. 20, pp 165-177.
Pinkerton, W.J. (2003). Project management: achieving project bottom-line success. New
York. McGraw-Hill.
Pinto, J.K. & Mantel, S.J. Jr. (1987). The causes of project failure, IEEE Transactions on
engineering management. EM – 37: pp. 269-276, (1990). PMBOK (Project Management
Body of Knowledge), PMI, Upper Darby, PA.
Pinto, J.K. & Mantel, S.J. (1990). The causes of project failure, IEEE Transactions on
engineering management. EM – 37: pp. 269–276.
Pinto, J.K. & Slevin, D.P. (1987). Critical factors in successful project implementation,
IEEE Transactions on engineering management. Vol. 34, pp. 22-27.
210
Pinto, J.K. & Slevin, D.P. (1988). Critical success factors across project life cycle.
Project Management Journal. Vol. 19 (3), pp. 67–75.
Pinto, J.K. & Slevin, D.P. (1989). Critical success factors in R&D projects. Research
Technical Management (Jan-Feb 1989). Vol. 31, pp. 31-35.
PMBOK Guide (1987). Project Management Body of Knowledge. Upper Darby, PA.
PMBOK Guide (2001). Project Management Body of Knowledge. In Project
Management Institute.
PMBOK Guide (2008). A Guide to the Project Management Body of Knowledge. 4th edn.
New-town Square, PA: Project Management Institute; November 2008.
PMBOK Guide (2013). Project Management Body of Knowledge. USA. Project
management Institute (PMI). 5th edn.
Price Waterhouse Cooper Report (2013). SA’s Construction Industry poised for future
growth.
Project Management institute, Inc. (PMI) (2004). A guide to project management body of
knowledge. 3rd edn. Pennsylvania.
Project Management Institute (PMI) (2008). A guide to the project management body of
knowledge. USA.
Ravitch, S,M. and Riggan, M. (2011). Reason and rigor: How conceptual frameworks
guide research. Thousand Oaks, CA: Sage.
Raudsepp, E. (1983). How much freedom for engineers? Machine design, 12 May,
pp. 67-68.
Reichardt, C.S. and Cook, T.D. (1979). Quantitative methods in evaluation research,
Beverly Hills, California: Sage.
211
Reswick, J.B. (1962). Introduction to design (Englewoord Cliffs, NJ: Prentice-Hall,
Inc., 1962).
Roberts, K. & Biddle, J. (1994). The transition into management by scientists and
engineers. Human resource management. Vol. 33.
Rokeach, M. (1973). The nature of human values. New York: Free Press.
Rockart, J.F. (1982). The changing role of information systems executive: A critical
success factor perspective.
Roman, D. (1986). Managing projects: A system approach. New York, NY: Elsevier;
1986. pp.67-72.
Rowe, S.F. (2007). Project management for small projects, management concepts,
Vienna, Virginia.
Ruben, I.M. & Seeling, W. (1967). Experience as a factor in the selection and
performance of project managers. IEEE Trans Eng. Management. Vol.14 (3),
pp. 131-134.
South African Construction Industry Journal (2013). Highlighting trends in the South
African construction industry. 1st edn. (Price Waterhouse Cooper).
Sanvido, V., Grobler, F., Parfitt, K., Guvenis, M. & Coyle, M. (1992). Critical success
factors for construction projects. Journal of Construction Engineering and Management.
Vol. 118, pp. 94-111.
Saunders, M., Lewis, P. & Thornhill, A. (2007). 4th edn. Research methods for business
students Harlow, England: Prentice Hall.
Saunders, M., Lewis, P. & Thornhill, A. (2009). 5th edn. Research methods for business
students. London: Prentice Hall.
212
Sayles. L.R., & Chandler, M. K. (1971). Managing large systems. Harper and Row,
New York.
Schoumacher, B. (1986). Engineers and the Law: An overview. New York: Van Nostrand
Reinhold.
Shannon, R.E. (1980). Engineering management. New York: John Wiley & Sons.
Shenhar, A.J. & Levy, O. (1997). Mapping the dimensions of project success. Project
Management Journal. Vol. 28, pp. 5-13.
Shenhar, A.J., Levy, O., & Dvir, D. (2004). Mapping the dimensions of project success.
Project Management Journal. Vol.28 (2), pp. 5-13.
Silverman, M. (1988). Project Management: A short-course for professionals. 2nd edn.
New York: Wiley.
Simons, H. (1980). Towards a science of the singular: Essays about case study in
educational research and evaluation. Norwick, UK: University of East Anglia, Centre for
Applied Research in Education.
Simons, H. (1996). The paradox of case study: Cambridge Journal of Education. Vol. 26
(2), pp. 225–240.
Slevin, D.P. & Pinto, J.K. (1986). The Project implementation profile. Project
Management Journal. Vol. 18 (4), pp. 57-71.
Songer, A.D. & Molenaar, K.R. (1997). Project characteristics for successful public-
sector design-build. Journal: Construction and Engineering Management. Vol. 123 (1),
pp. 34-40.
S. A. Construction Industry Journal (2013). 1st edn. Published by Price Waterhouse
Cooper (PwC).
213
Spinner, M. (1981). Elements of project management: Plan schedule and control.
Englewood Cliffs, NJ: Prentice-Hall.
Spradley, J.P. (1980). Participant observation. New York. Holt, Reinhart & Winston.
Stake, R. (1995). The art of case study research. Thousand Oaks, London, New Delhi.
CA: Sage.
Stake, R. (1998). Case Studies in: Norman Denzin & Yvonna Lincoln. (eds.): Strategies
of qualitative inquiry. Thousand Oaks, London, New Delhi: Sage.
Stone, E.F. (1978). Research methods in organisation behaviour. Goodyear publishing
company, Santa Monica, CA.
Stoecker, R. (1991). Evaluating and rethinking the case study. The sociological review.
Vol. 39 (1), pp. 88–112.
Stuckenbruck, L.C. (1981). The implementation of project management: The
professional’s Handbook. Reading, MA: Addison-Wesley.
Stuckenbruck, L.C. (1986). Who determines project success? Project Management
Institute, pp. 85-93.
Sweet, J. (1989). Legal aspects of architecture. Engineering and construction process. 4th
edn. St. Paul, MN: West Publications.
Tan, A.L. & Andrew, (2006). People skills in project management. Venton Publishing
(M) Sdn. Bhd.
The Construction Industry Development Board (CIDB) (2004).
The Construction Industry Development Board (CIDB) (2013).
Tellis, W. (1997a). Application of a case study methodology. The Qualitative Report.
Vol. 3 (3), pp. 1–17.

214
Tellis, W. (1997b). Introduction to case study. The Qualitative Report. Vol. 3. (2).
Thamhain, H.J. (1983). Managing engineers effectively. IEEE. Transactions on
engineering management. November, EM-30, 4, pp. 231-237.
Thomas, J. & Mullaly, M. (2008). Researching the value of project management. Project
Management Institute, Newtown, Pennsylvania, pp. 464.
Thornberry, N.E. (1987).Training the engineer as Project Manager. Training and
Development Journal, October, Vol. 4 (10), pp. 67-69.
Toor, S.U.R. & Ogunlana, S.O. (2009). Construction professionals’ perception of critical
success factors for large-scale construction projects. Construction Innovation:
Information, Process, management. Vol. 9, pp. 149-167.
Tomlinson, M.J. (1980). Foundation design and construction. 4th edn. Pitman Books
Limited, Parker Street, London.
Trochim, W. (1989). Outcome pattern-matching and program theory. Evaluation and
program planning. Vol. 12, pp. 355-366.
Tukel, O.I. & Rom, W.O. (1995). Analysis of the characteristics of projects in diverse
industries working paper, Cleveland State University, Cleveland Ohio.
Turner, J.R., Ledwith, A., & Kelly, J. (2008). Project management in small to medium –
sized enterprises: simplified processes for innovation and growth, 22nd IPMA World
Congress in Project Management, Rome, 9–11 November.
Van Herk, H. & Van de Velden, M. (2007). Insight into the relative merits of rating and
ranking in a cross national context using three-way correspondence analysis. Food
Quality and Preference. Vol. 18 (8), pp. 1096–1105.
VanScoy, R. (1992). Software development risk. Problem or opportunity. Technical
report. CMU/SEI-92-TR-30. Pittsburgh, PA: Software Engineering Institute, Carnegie
Mellon University.
215
Van Vugt, J.P., ed. (1994). Aids prevention and services: Community based research.
Westport: Bergin and Garvey.
Van Wyk, L. (2003). A Review of the South African Construction Industry. Part 1:
Economic, regulatory and public sector capacity influences on the construction industry.
Pretoria, South Africa: CSIR Boutek.
Van Wyk, L, (2004). A Review of the South African Construction Industry, Part 2:
Sustainable Construction Activities. Pretoria, South Africa: CISR Boutek.
Vaughn, R.C. (1983). Legal aspects of engineering. 4th edn. Dubuque, IA: Kendall /Hunt
Publishing.
Vriens, I., Moors, G., Gelissen, J.P.T.M. & Vermunt, J.K. (2015). Two of a kind.
Similarities between ranking and rating data in measuring work values. Hertogenbosch:
Box-Press BV.
Walid, B. & Oya, I. T. (1996). A framework for determining critical success and failure
factors in projects, Vol. 14 (3), pp. 141–151.
Walker, D.H.T. (1995). An investigation into construction time performance.
Construction, Management, Economy. Vol. 13, (3), pp. 263-274.
West Ridge Natural Science Facility (1992). University of Alaska Fairbanks, Project
Manual. March 16.
Wheeler, D.J. and Chambers, D.S. (1992). Understanding statistical process control. 2nd
edn. SPC Press, Knoxwille, KY.
Wheelwright, S.C. & Clark, K.B. (1992). Revolutionising product development. Free
press. New York.
White, D., & Fortune, J. (2002). Current practice in project management: An empirical
study. International Journal of Project Management. Vol. 20, (1), pp. 1-11.
216
Wideman, R.M. (2005). How to motivate stakeholders to work together. In D.I. Cleland
(Ed.), Field guide to project management, pp. 212-226. New York: Van Nostrand
Reinhold.
Wilson, I. G. and Wilson, M. E. (1970). From idea to working model. New York: John
Wiley & Sons, Inc.
Wysocki, R.K., Beck, Jnr. R., & Crane, D.B. (2000). Effective Project Management
(2nd edn). New York: John Wiley & Sons, Inc.
Xiao, H. & Smith, S.L.J. (2006). Case studies in tourism research: a state-of-the-art
analysis. Tourism Management. Vol. 27, pp. 738–749.
Yardley, L. (2009). Demonstrating validity in qualitative psychology. In J.A. Smith (Ed),
Qualitative psychology: A practical guide to research method. pp. 235-251. Los Angeles:
Sage.
Yin, R. K. (1981). The case study crisis: Some answers. Administrative Science
Quarterly. Vol. 26 (1), pp. 58–65.
Yin, R.K. (1984). Case study research: design and methods. Sage publications,
California, pp. 11-15.
Yin, R.K. (1989). Case study research design and methods. Sage, Newbury Park.
Yin, R.K. (1993). Application of case study research. Sage Publications, California,
pp. 33-55.
Yin, R.K. (1994). Case Study Research: Design and methods. Thousand Oaks, London,
New Delhi: Sage Publications.
Yin, R.K. (2002). Case study research: design and methods. Thousand Oaks, CA: Sage
Publications.

217
Yin, R.K. (2003). Case study research: design and methods, 3rd edn. Thousand Oaks,
California, Sage Publications.
Yin, R.K. (2014). Case Study Research: Design and Methods. 5th edn. London:
Sage.
Yourdan, E. (1998). Rise and resurrection of the American Programmer. Upper Saddle
River, NJ: Yourdan Press/Prentice Hall; pp. 157-181.

218
ANNEXURE 1: NATIONAL SURVEY QUESTIONNAIRE
CRITICAL SUCCES SFACTORS FOR PROJECT MANAGEMENT IN SOUTH AFRICA
DESIGN AND CONSTRUCTION PROJECTS
Dear Sir / Madam and Respondent,
This is a national survey.
We request your participation and support in our research on Success Factors in the
Project Management and the Construction Industry in South Africa.
The aim of this survey is to identify the most important factors, which determine the
success of the construction project. Dr Harry Visser is conducting this survey as part of
the requirements for completion of a post-graduate research study at the University of the
Witwatersrand.
This survey comprises of an “A” and “B” section. Section A covers twelve (12) personal
questions. Section B comprises of a matrix questionnaire pertaining to the selection and
rating of success factors necessary for the delivery of an engineering project across its
entire life cycle. Regarding Section B, you need to select no less than 15 success
factors in respect of project phases 1 to 4 (i.e. columns 1 to 4 respectively) in
addition, to rating the 25 success factors relevant to the management of a project in
general (i.e. column 5).
The outcome of this survey will be available to respondents upon written request thereof.
Please be assured that your answers will be treated with confidentiality and that the
survey DOES NOT request any identification from the respondent. Your frank and honest
opinion(s) is sought and the information obtained will be strictly used for academic
purposes and statistical analysis only. The identity of respondents will not be revealed.
Participation in this survey is entirely voluntarily and there is no penalty if you do not
participate. There is no risk associated with filling in the survey since the researcher
guarantees anonymity of the responses. E-mail information will be used to track the
number of responses only and will not be shared with anybody outside the group. Kindly
take a few minutes of your time to complete this survey and return it to the researcher
within 2 weeks from receipt thereof.
Your cooperation is appreciated.
Please email the completed survey to:[email protected]
Study Leader, Prof Robert McCutcheon: [email protected]
011 717 7129
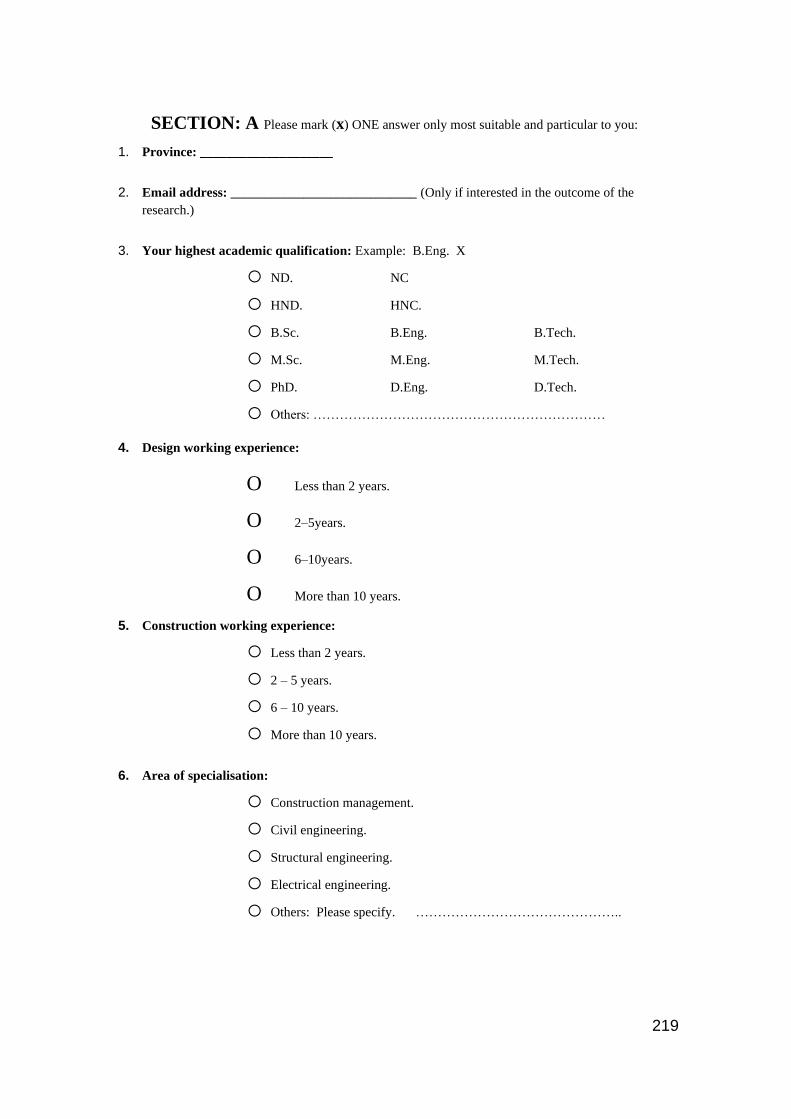
219
SECTION: A Please mark (x) ONE answer only most suitable and particular to you:
1. Province: ____________________
2. Email address: ____________________________ (Only if interested in the outcome of the
research.)
3. Your highest academic qualification: Example: B.Eng. X
o ND. NC
o HND. HNC.
o B.Sc. B.Eng. B.Tech.
o M.Sc. M.Eng. M.Tech.
o PhD. D.Eng. D.Tech.
o Others: …………………………………………………………
4. Design working experience:
O Less than 2 years.
O 2–5years.
O 6–10years.
O More than 10 years.
5. Construction working experience:
o Less than 2 years.
o 2 – 5 years.
o 6 – 10 years.
o More than 10 years.
6. Area of specialisation:
o Construction management.
o Civil engineering.
o Structural engineering.
o Electrical engineering.
o Others: Please specify. ………………………………………..
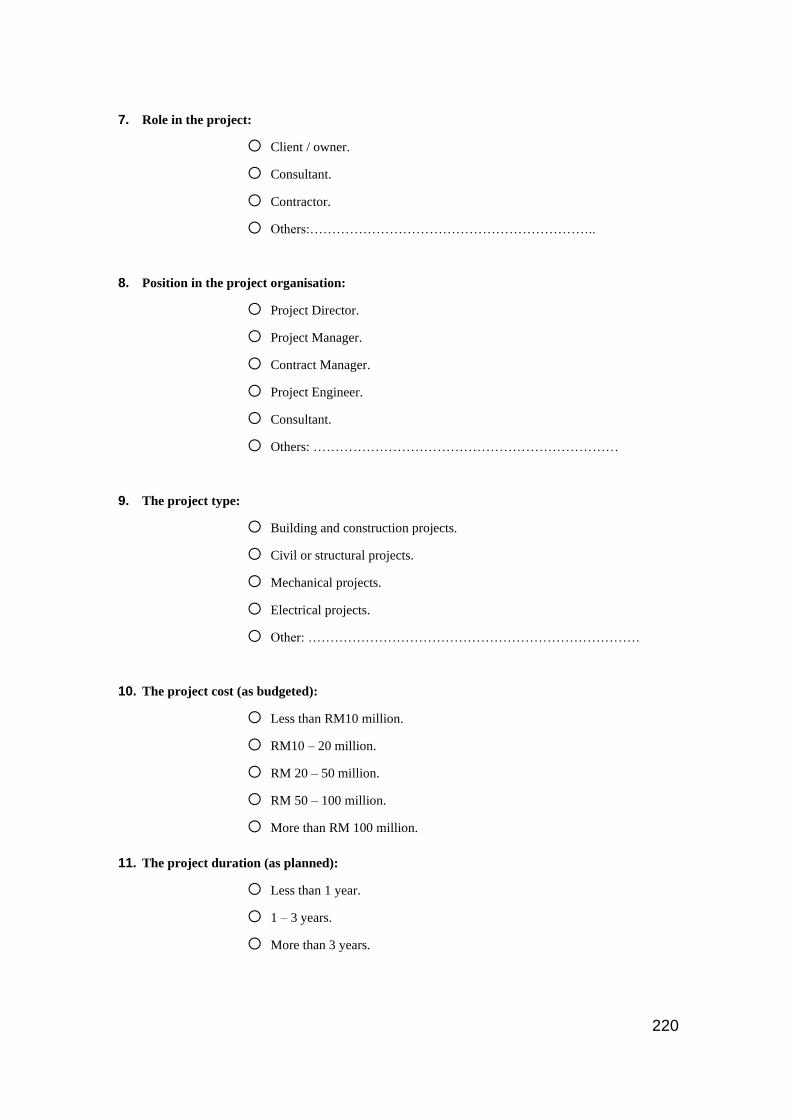
220
7. Role in the project:
o Client / owner.
o Consultant.
o Contractor.
o Others:………………………………………………………..
8. Position in the project organisation:
o Project Director.
o Project Manager.
o Contract Manager.
o Project Engineer.
o Consultant.
o Others: ……………………………………………………………
9. The project type:
o Building and construction projects.
o Civil or structural projects.
o Mechanical projects.
o Electrical projects.
o Other: …………………………………………………………………
10. The project cost (as budgeted):
o Less than RM10 million.
o RM10 – 20 million.
o RM 20 – 50 million.
o RM 50 – 100 million.
o More than RM 100 million.
11. The project duration (as planned):
o Less than 1 year.
o 1 – 3 years.
o More than 3 years.
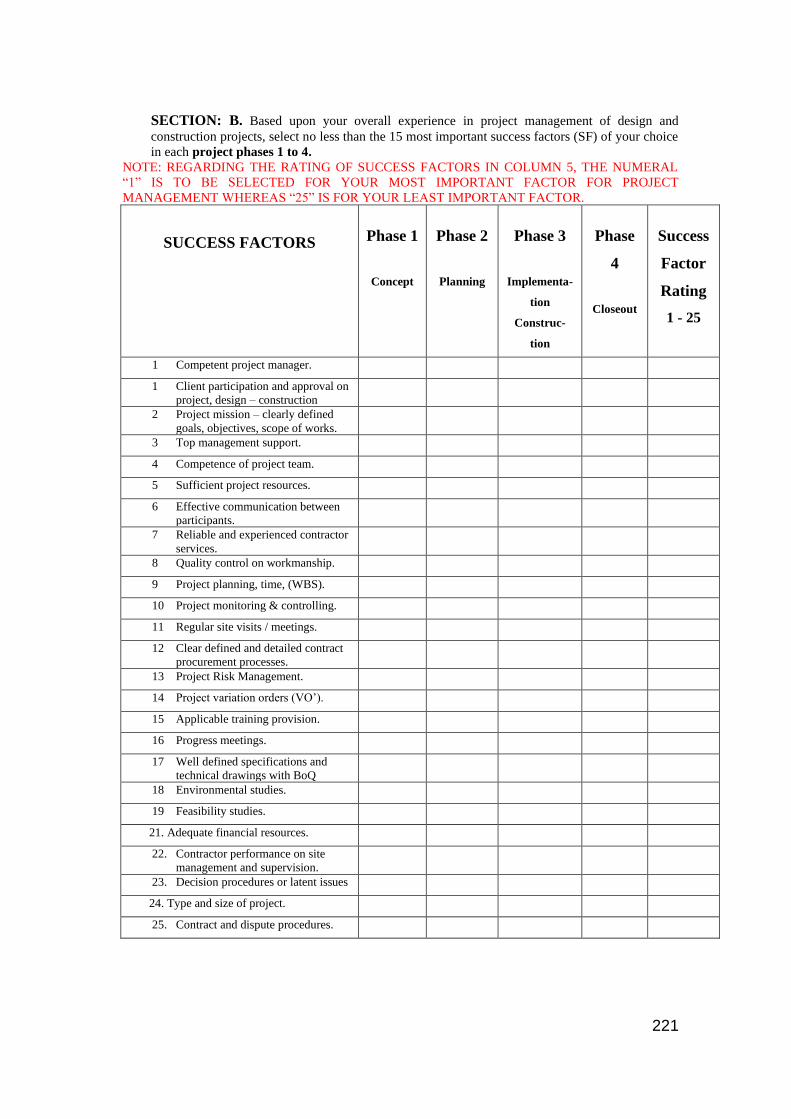
221
SECTION: B. Based upon your overall experience in project management of design and
construction projects, select no less than the 15 most important success factors (SF) of your choice
in each project phases 1 to 4.
NOTE: REGARDING THE RATING OF SUCCESS FACTORS IN COLUMN 5, THE NUMERAL
“1” IS TO BE SELECTED FOR YOUR MOST IMPORTANT FACTOR FOR PROJECT
MANAGEMENT WHEREAS “25” IS FOR YOUR LEAST IMPORTANT FACTOR.
SUCCESS FACTORS
Phase 1
Concept
Phase 2
Planning
Phase 3
Implementa-
tion
Construc-
tion
Phase
4
Closeout
Success
Factor
Rating
1 - 25
1 Competent project manager.
1 Client participation and approval on
project, design – construction
2 Project mission – clearly defined
goals, objectives, scope of works.
3 Top management support.
4 Competence of project team.
5 Sufficient project resources.
6 Effective communication between
participants.
7 Reliable and experienced contractor
services.
8 Quality control on workmanship.
9 Project planning, time, (WBS).
10 Project monitoring & controlling.
11 Regular site visits / meetings.
12 Clear defined and detailed contract
procurement processes.
13 Project Risk Management.
14 Project variation orders (VO’).
15 Applicable training provision.
16 Progress meetings.
17 Well defined specifications and
technical drawings with BoQ
18 Environmental studies.
19 Feasibility studies.
21. Adequate financial resources.
22. Contractor performance on site
management and supervision.
23. Decision procedures or latent issues
24. Type and size of project.
25. Contract and dispute procedures.
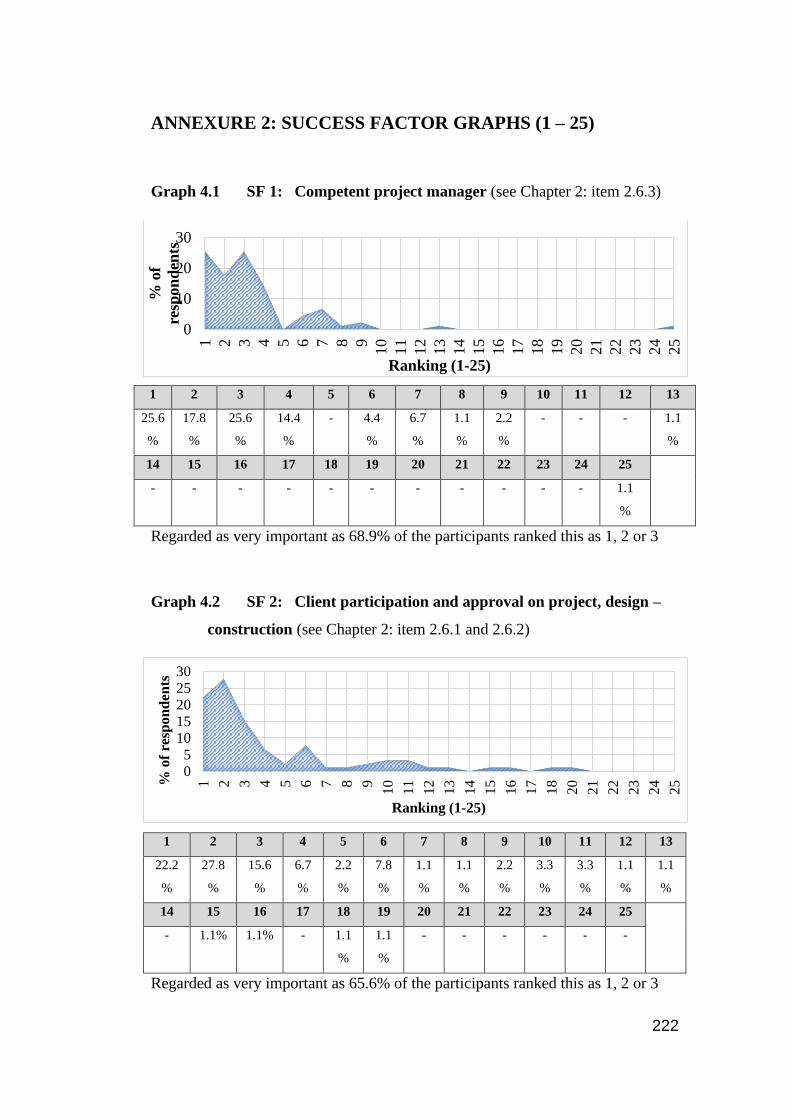
222
ANNEXURE 2: SUCCESS FACTOR GRAPHS (1 – 25)
Graph 4.1 SF 1: Competent project manager (see Chapter 2: item 2.6.3)
1 2 3 4 5 6 7 8 9 10 11 12 13
25.6
%
17.8
%
25.6
%
14.4
%
- 4.4
%
6.7
%
1.1
%
2.2
%
- - - 1.1
%
14 15 16 17 18 19 20 21 22 23 24 25
- - - - - - - - - - - 1.1
%
Regarded as very important as 68.9% of the participants ranked this as 1, 2 or 3
Graph 4.2 SF 2: Client participation and approval on project, design –
construction (see Chapter 2: item 2.6.1 and 2.6.2)
1 2 3 4 5 6 7 8 9 10 11 12 13
22.2
%
27.8
%
15.6
%
6.7
%
2.2
%
7.8
%
1.1
%
1.1
%
2.2
%
3.3
%
3.3
%
1.1
%
1.1
%
14 15 16 17 18 19 20 21 22 23 24 25
- 1.1% 1.1% - 1.1
%
1.1
%
- - - - - -
Regarded as very important as 65.6% of the participants ranked this as 1, 2 or 3
0
10
20
30
1 2 3 4 5 6 7 8 9
10
11
12
13
14
15
16
17
18
19
20
21
22
23
24
25
% o
f
resp
on
den
ts
Ranking (1-25)
05
1015202530
1 2 3 4 5 6 7 8 9
10
11
12
13
14
15
16
17
18
20
21
22
23
24
25%
of
resp
on
den
ts
Ranking (1-25)

223
Graph 4.3 SF 3: Project mission – clearly defined goals, objectives, scope
of works (See Chapter 2: item 2.6.2.3).
1 2 3 4 5 6 7 8 9 10 11 12 13
11.1
%
24.4
%
22.2
%
18.9
%
5.6
%
3.3
%
3.3
%
1.1
%
- - - 1.1
%
2.2%
14 15 16 17 18 19 20 21 22 23 24 25
1.1% 1.1% 1.1% - 1.1
%
- - - - - 1.1
%
1.1
%
Regarded as important as 65.6% of the participants ranked this as 2, 3 or 4
Graph 4.4 SF 4: Top management support (see Chapter 2: item 2.5.4.2)
1 2 3 4 5 6 7 8 9 10 11 12 13
15.6
%
6.7
%
5.6
%
22.2
%
10.0
%
2.2
%
4.
4%
2.2
%
4.4
%
1.1
%
3.3
%
2.2
%
3.3
%
14 15 16 17 18 19 20 21 22 23 24 25
2.2
%
1.1
%
1.1
%
1.1
%
- 6.7
%
- 2.2
%
- 2.2
%
- -
Regarded as important as 15.6% of the participants ranked this as 1, while 32.2%
ranked this as 4 or 5.
0
5
10
15
20
25
301 2 3 4 5 6 7 8 9
10
11
12
13
14
15
16
17
18
19
20
21
22
23
24
25%
of
resp
on
den
ts
Ranking (1-25)
0
5
10
15
20
25
1 2 3 4 5 6 7 8 9
10
11
12
13
14
15
16
17
18
19
20
21
22
23
24
25%
of
resp
on
den
ts
Ranking (1-25)
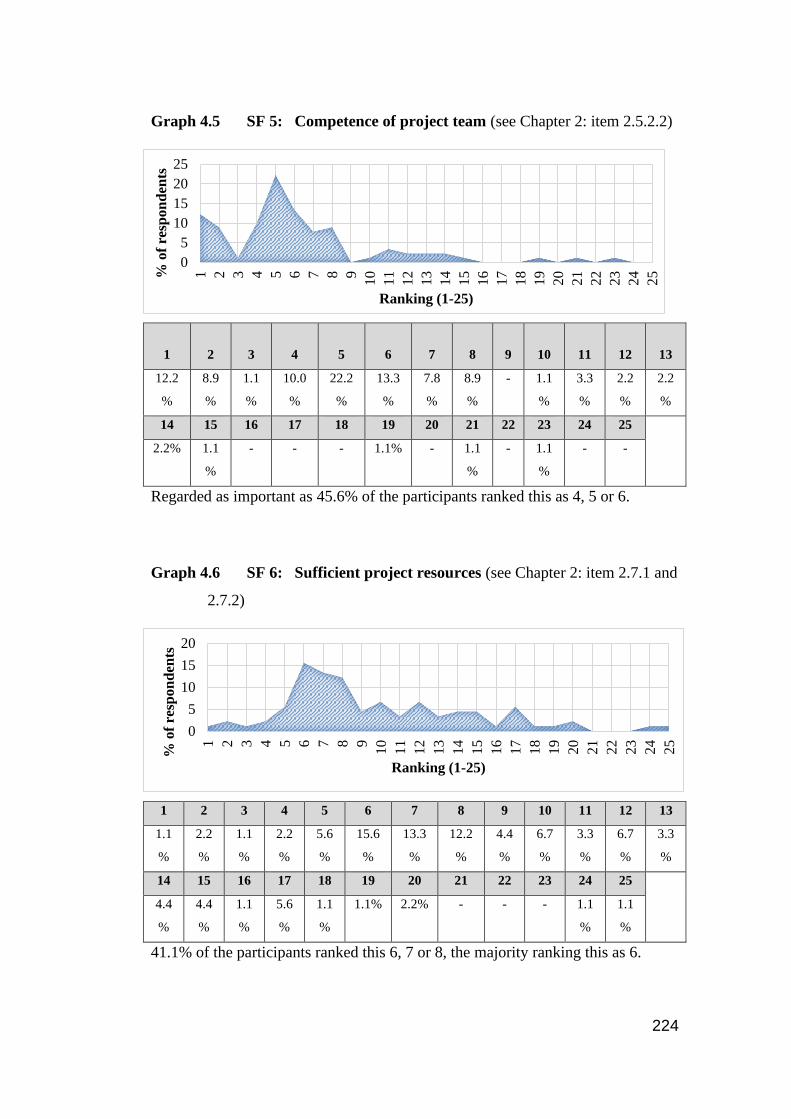
224
Graph 4.5 SF 5: Competence of project team (see Chapter 2: item 2.5.2.2)
1 2 3 4 5 6 7 8 9 10 11 12 13
12.2
%
8.9
%
1.1
%
10.0
%
22.2
%
13.3
%
7.8
%
8.9
%
- 1.1
%
3.3
%
2.2
%
2.2
%
14 15 16 17 18 19 20 21 22 23 24 25
2.2% 1.1
%
- - - 1.1% - 1.1
%
- 1.1
%
- -
Regarded as important as 45.6% of the participants ranked this as 4, 5 or 6.
Graph 4.6 SF 6: Sufficient project resources (see Chapter 2: item 2.7.1 and
2.7.2)
1 2 3 4 5 6 7 8 9 10 11 12 13
1.1
%
2.2
%
1.1
%
2.2
%
5.6
%
15.6
%
13.3
%
12.2
%
4.4
%
6.7
%
3.3
%
6.7
%
3.3
%
14 15 16 17 18 19 20 21 22 23 24 25
4.4
%
4.4
%
1.1
%
5.6
%
1.1
%
1.1% 2.2% - - - 1.1
%
1.1
%
41.1% of the participants ranked this 6, 7 or 8, the majority ranking this as 6.
0
5
10
15
20
25
1 2 3 4 5 6 7 8 9
10
11
12
13
14
15
16
17
18
19
20
21
22
23
24
25%
of
resp
on
den
ts
Ranking (1-25)
0
5
10
15
20
1 2 3 4 5 6 7 8 9
10
11
12
13
14
15
16
17
18
19
20
21
22
23
24
25
% o
f re
spon
den
ts
Ranking (1-25)

225
Graph 4.7 SF 7: Effective communication between participants (see
chapter 2: item 2.6.3.4)
1 2 3 4 5 6 7 8 9 10 11 12 13
1.1
%
1.1
%
6.7
%
2.2
%
10.0
%
11.1
%
11.1
%
18.9
%
7.8
%
4.4
%
8.9
%
1.1
%
2.2
%
14 15 16 17 18 19 20 21 22 23 24 25
- - 4.4
%
1.1
%
3.3% 1.1% - 1.1% 1.1
%
- - 1.1
%
51.1% of the participants ranked this as 5, 6, 7 or 8, the majority ranking it as 8.
Graph 4.8 SF 8: Reliable and experienced contractor services (see
Chapter 2: item 2.6.4.2)
1 2 3 4 5 6 7 8 9 10 11 12 13
2.2
%
1.1
%
7.8
%
3.3
%
21.1
%
14.4
%
10.0
%
2.2
%
6.7
%
5.6
%
4.4
%
6.7
%
2.2
%
14 15 16 17 18 19 20 21 22 23 24 25
4.4
%
2.2
%
2.2
%
- - 1.1% 1.1% 1.1
%
- - - -
45.6% of the participants ranked this as 5, 6, or 7, the majority ranking it as 5.
0
5
10
15
20
1 2 3 4 5 6 7 8 9
10
11
12
13
14
15
16
17
18
19
20
21
22
23
24
25
% o
f re
spo
nd
ents
Ranking (1-25)
0
5
10
15
20
25
1 2 3 4 5 6 7 8 9
10
11
12
13
14
15
16
17
18
19
20
21
22
23
24
25%
of
resp
on
den
ts
Ranking (1-25)
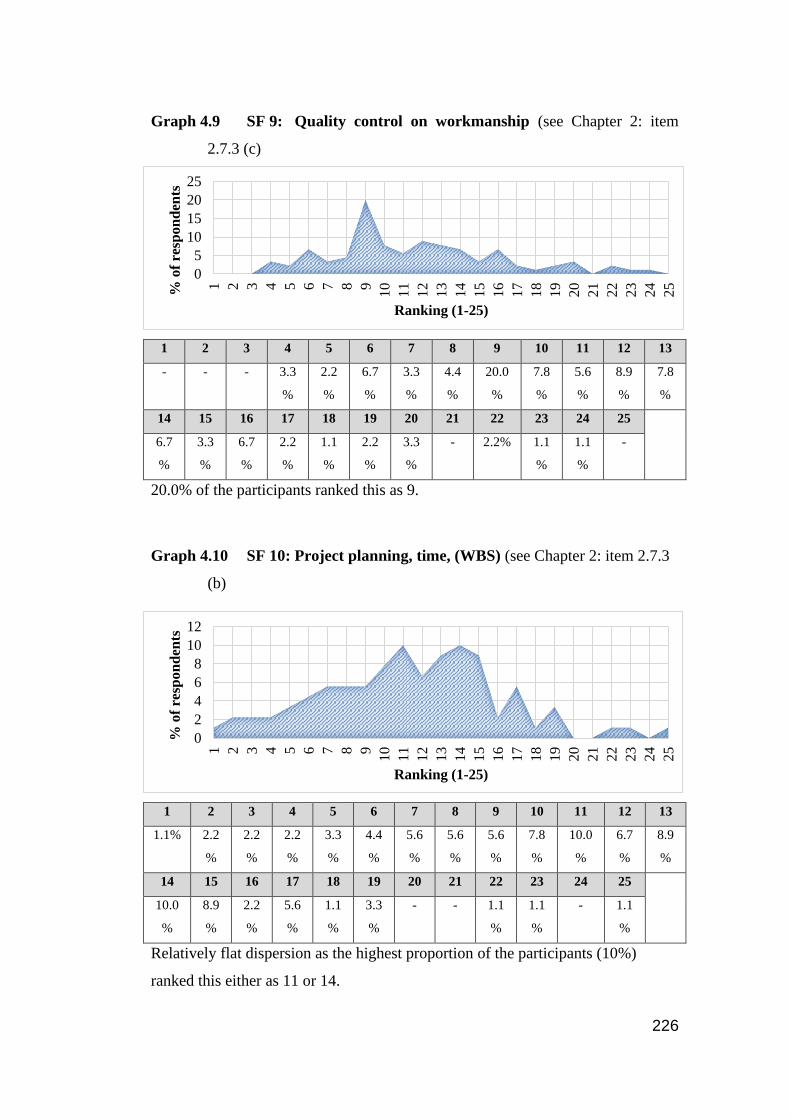
226
Graph 4.9 SF 9: Quality control on workmanship (see Chapter 2: item
2.7.3 (c)
1 2 3 4 5 6 7 8 9 10 11 12 13
- - - 3.3
%
2.2
%
6.7
%
3.3
%
4.4
%
20.0
%
7.8
%
5.6
%
8.9
%
7.8
%
14 15 16 17 18 19 20 21 22 23 24 25
6.7
%
3.3
%
6.7
%
2.2
%
1.1
%
2.2
%
3.3
%
- 2.2% 1.1
%
1.1
%
-
20.0% of the participants ranked this as 9.
Graph 4.10 SF 10: Project planning, time, (WBS) (see Chapter 2: item 2.7.3
(b)
1 2 3 4 5 6 7 8 9 10 11 12 13
1.1% 2.2
%
2.2
%
2.2
%
3.3
%
4.4
%
5.6
%
5.6
%
5.6
%
7.8
%
10.0
%
6.7
%
8.9
%
14 15 16 17 18 19 20 21 22 23 24 25
10.0
%
8.9
%
2.2
%
5.6
%
1.1
%
3.3
%
- - 1.1
%
1.1
%
- 1.1
%
Relatively flat dispersion as the highest proportion of the participants (10%)
ranked this either as 11 or 14.
0
5
10
15
20
25
1 2 3 4 5 6 7 8 9
10
11
12
13
14
15
16
17
18
19
20
21
22
23
24
25%
of
resp
on
den
ts
Ranking (1-25)
0
2
4
6
8
10
12
1 2 3 4 5 6 7 8 9
10
11
12
13
14
15
16
17
18
19
20
21
22
23
24
25
% o
f re
spon
den
ts
Ranking (1-25)
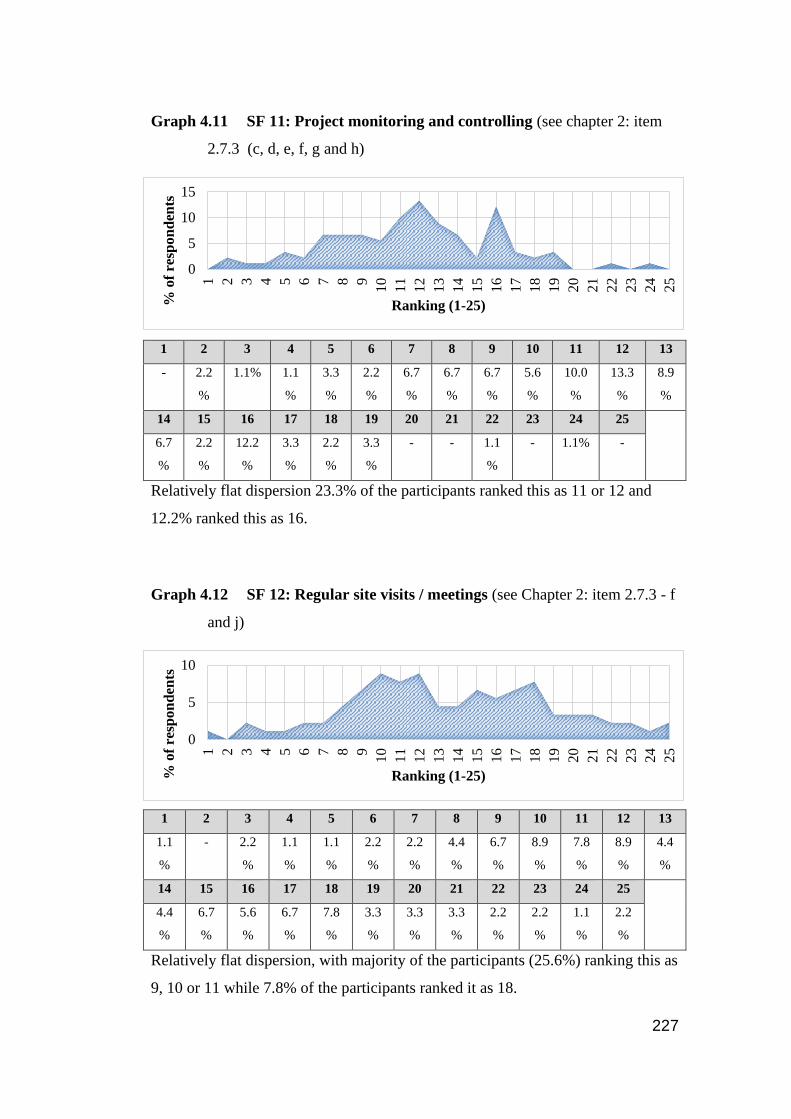
227
Graph 4.11 SF 11: Project monitoring and controlling (see chapter 2: item
2.7.3 (c, d, e, f, g and h)
1 2 3 4 5 6 7 8 9 10 11 12 13
- 2.2
%
1.1% 1.1
%
3.3
%
2.2
%
6.7
%
6.7
%
6.7
%
5.6
%
10.0
%
13.3
%
8.9
%
14 15 16 17 18 19 20 21 22 23 24 25
6.7
%
2.2
%
12.2
%
3.3
%
2.2
%
3.3
%
- - 1.1
%
- 1.1% -
Relatively flat dispersion 23.3% of the participants ranked this as 11 or 12 and
12.2% ranked this as 16.
Graph 4.12 SF 12: Regular site visits / meetings (see Chapter 2: item 2.7.3 - f
and j)
1 2 3 4 5 6 7 8 9 10 11 12 13
1.1
%
- 2.2
%
1.1
%
1.1
%
2.2
%
2.2
%
4.4
%
6.7
%
8.9
%
7.8
%
8.9
%
4.4
%
14 15 16 17 18 19 20 21 22 23 24 25
4.4
%
6.7
%
5.6
%
6.7
%
7.8
%
3.3
%
3.3
%
3.3
%
2.2
%
2.2
%
1.1
%
2.2
%
Relatively flat dispersion, with majority of the participants (25.6%) ranking this as
9, 10 or 11 while 7.8% of the participants ranked it as 18.
0
5
10
151 2 3 4 5 6 7 8 9
10
11
12
13
14
15
16
17
18
19
20
21
22
23
24
25
% o
f re
spo
nd
ents
Ranking (1-25)
0
5
10
1 2 3 4 5 6 7 8 9
10
11
12
13
14
15
16
17
18
19
20
21
22
23
24
25
% o
f re
spon
den
ts
Ranking (1-25)
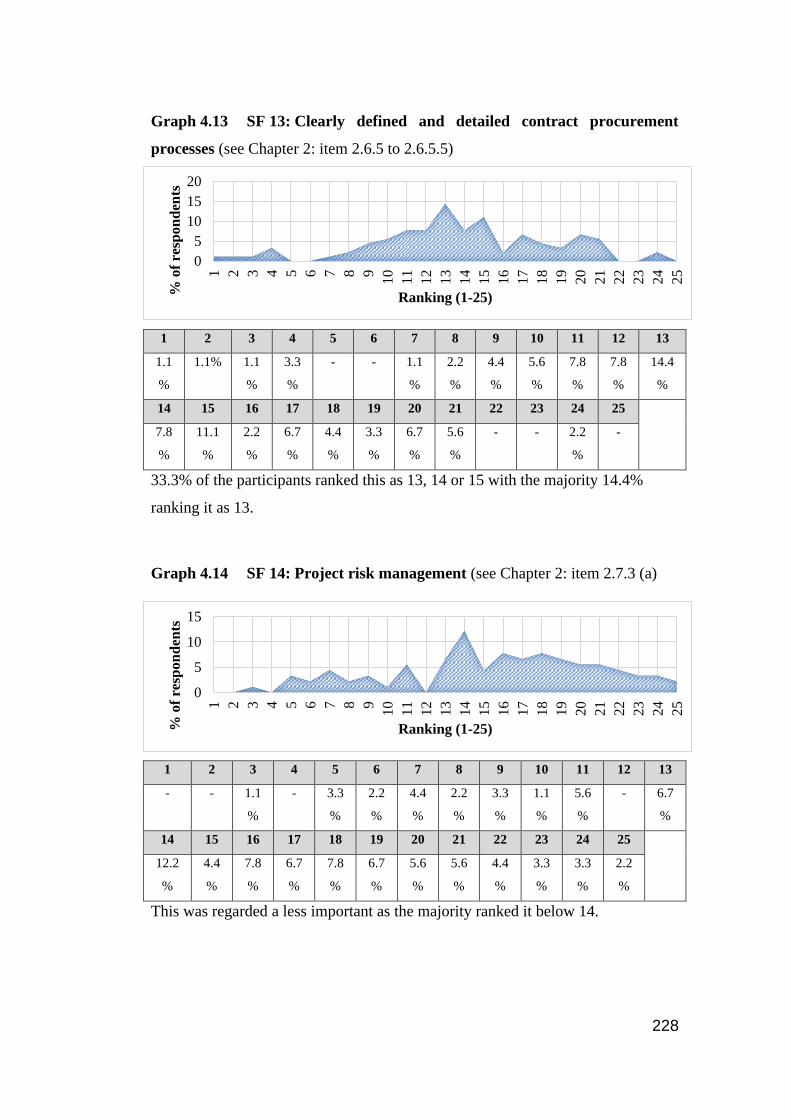
228
Graph 4.13 SF 13: Clearly defined and detailed contract procurement
processes (see Chapter 2: item 2.6.5 to 2.6.5.5)
1 2 3 4 5 6 7 8 9 10 11 12 13
1.1
%
1.1% 1.1
%
3.3
%
- - 1.1
%
2.2
%
4.4
%
5.6
%
7.8
%
7.8
%
14.4
%
14 15 16 17 18 19 20 21 22 23 24 25
7.8
%
11.1
%
2.2
%
6.7
%
4.4
%
3.3
%
6.7
%
5.6
%
- - 2.2
%
-
33.3% of the participants ranked this as 13, 14 or 15 with the majority 14.4%
ranking it as 13.
Graph 4.14 SF 14: Project risk management (see Chapter 2: item 2.7.3 (a)
1 2 3 4 5 6 7 8 9 10 11 12 13
- - 1.1
%
- 3.3
%
2.2
%
4.4
%
2.2
%
3.3
%
1.1
%
5.6
%
- 6.7
%
14 15 16 17 18 19 20 21 22 23 24 25
12.2
%
4.4
%
7.8
%
6.7
%
7.8
%
6.7
%
5.6
%
5.6
%
4.4
%
3.3
%
3.3
%
2.2
%
This was regarded a less important as the majority ranked it below 14.
0
5
10
15
20
1 2 3 4 5 6 7 8 9
10
11
12
13
14
15
16
17
18
19
20
21
22
23
24
25
% o
f re
spo
nd
ents
Ranking (1-25)
0
5
10
15
1 2 3 4 5 6 7 8 9
10
11
12
13
14
15
16
17
18
19
20
21
22
23
24
25
% o
f re
spon
den
ts
Ranking (1-25)

229
Graph 4.15 SF 15: Project variation orders (VOs’) (see Chapter 2: item 2.6.5
to 2.6.5.6)
1 2 3 4 5 6 7 8 9 10 11 12 13
- - - - - 1.1
%
1.1
%
1.1
%
- - 1.1
%
1.1% 1.1
%
14 15 16 17 18 19 20 21 22 23 24 25
1.1
%
8.9
%
4.4
%
8.9
%
3.3
%
3.3
%
7.8
%
6.7
%
5.6
%
10.0
%
7.8
%
25.6
%
Regarded as unimportant as the majority of the participants (25.6%) ranked this as
25.
Graph 4.16 SF 16: Applicable training provision (see Chapter 2: item
2.6.3.2)
1 2 3 4 5 6 7 8 9 10 11 12 13
1.1
%
- 1.1
%
- - 1.1
%
- - 2.2
%
- - 2.2
%
4.4
%
14 15 16 17 18 19 20 21 22 23 24 25
2.2
%
4.4
%
5.6
%
4.4
%
5.6
%
5.6
%
4.4
%
8.9
%
7.8
%
8.9
%
22.2
%
7.8
%
Regarded as unimportant as the majority of the participants (22.2%) ranked this as
24.
0
10
20
30
1 2 3 4 5 6 7 8 9
10
11
12
13
14
15
16
17
18
19
20
21
22
23
24
25
% o
f re
spo
nd
ents
Ranking (1-25)
0
5
10
15
20
25
1 2 3 4 5 6 7 8 9
10
11
12
13
14
15
16
17
18
19
20
21
22
23
24
25%
of
resp
on
den
ts
Ranking (1-25)
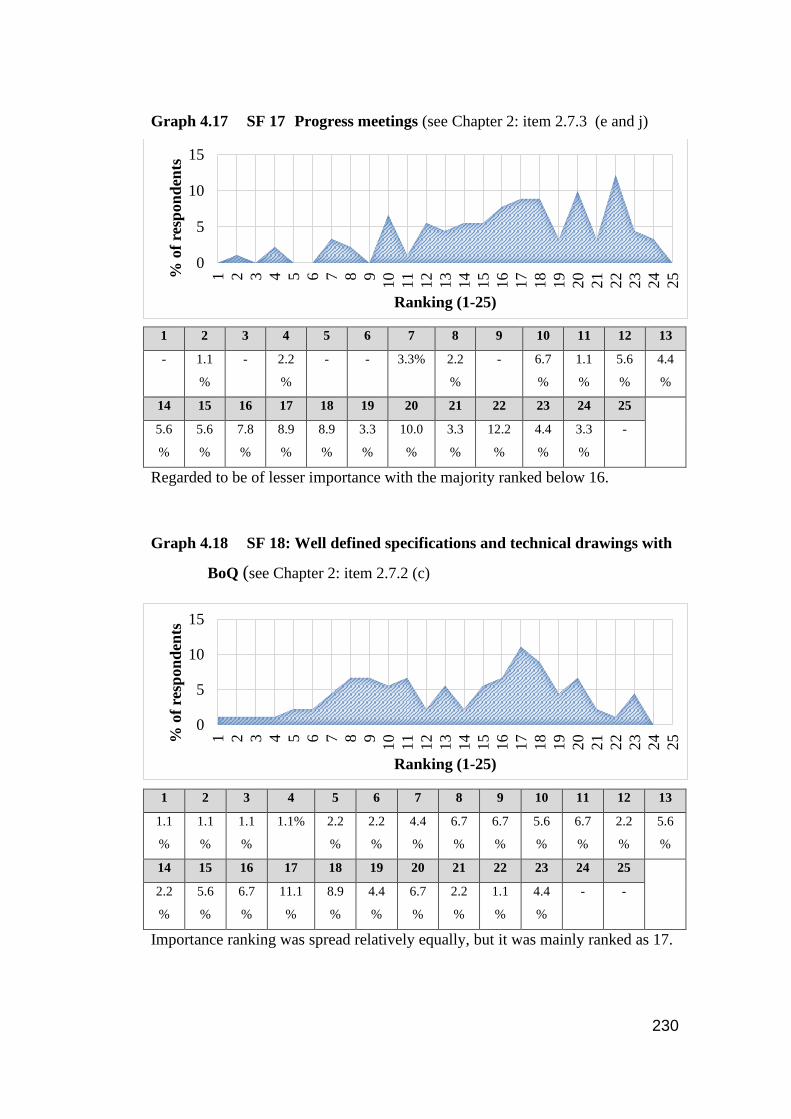
230
Graph 4.17 SF 17 Progress meetings (see Chapter 2: item 2.7.3 (e and j)
1 2 3 4 5 6 7 8 9 10 11 12 13
- 1.1
%
- 2.2
%
- - 3.3% 2.2
%
- 6.7
%
1.1
%
5.6
%
4.4
%
14 15 16 17 18 19 20 21 22 23 24 25
5.6
%
5.6
%
7.8
%
8.9
%
8.9
%
3.3
%
10.0
%
3.3
%
12.2
%
4.4
%
3.3
%
-
Regarded to be of lesser importance with the majority ranked below 16.
Graph 4.18 SF 18: Well defined specifications and technical drawings with
BoQ (see Chapter 2: item 2.7.2 (c)
1 2 3 4 5 6 7 8 9 10 11 12 13
1.1
%
1.1
%
1.1
%
1.1% 2.2
%
2.2
%
4.4
%
6.7
%
6.7
%
5.6
%
6.7
%
2.2
%
5.6
%
14 15 16 17 18 19 20 21 22 23 24 25
2.2
%
5.6
%
6.7
%
11.1
%
8.9
%
4.4
%
6.7
%
2.2
%
1.1
%
4.4
%
- -
Importance ranking was spread relatively equally, but it was mainly ranked as 17.
0
5
10
15
1 2 3 4 5 6 7 8 9
10
11
12
13
14
15
16
17
18
19
20
21
22
23
24
25%
of
resp
on
den
ts
Ranking (1-25)
0
5
10
15
1 2 3 4 5 6 7 8 9
10
11
12
13
14
15
16
17
18
19
20
21
22
23
24
25%
of
resp
on
den
ts
Ranking (1-25)

231
Graph 4.19 SF 19: Environmental studies (see Chapter 2: item 2.7.2 (d) and
2.7.2.2)
1 2 3 4 5 6 7 8 9 10 11 12 13
- 2.2
%
1.1
%
1.1
%
1.1
%
- - - 3.3
%
4.4
%
2.2
%
1.1
%
2.2
%
14 15 16 17 18 19 20 21 22 23 24 25
3.3
%
4.4
%
4.4
%
6.7
%
2.2
%
14.4
%
8.9
%
13.3
%
7.8
%
6.7
%
5.6
%
3.3
%
Regarded to be of lesser importance with the majority (60%) ranking this 19 and
lower.
Graph 4.20 SF 20: Feasibility studies (see Chapter 2: item 2.7.1 and 2.7.2.1
and 2.7.2.2)
1 2 3 4 5 6 7 8 9 10 11 12 13
1.1
%
1.1
%
1.1
%
1.1
%
1.1
%
- 2.2
%
3.3
%
1.1
%
5.6
%
3.3
%
6.7
%
2.2
%
14 15 16 17 18 19 20 21 22 23 24 25
4.4
%
3.3
%
2.2
%
7.8
%
6.7
%
6.7
%
10.0
%
6.7
%
7.8
%
3.3
%
7.8
%
3.3
%
Regarded to be of lesser importance with the majority (60%) ranking this 17 and
lower.
0
5
10
15
20
1 2 3 4 5 6 7 8 9
10
11
12
13
14
15
16
17
18
19
20
21
22
23
24
25
% o
f
resp
on
den
ts
Ranking (1-25)
0
5
10
15
1 2 3 4 5 6 7 8 9
10
11
12
13
14
15
16
17
18
19
20
21
22
23
24
25
% o
f re
spon
den
ts
Ranking (1-25)
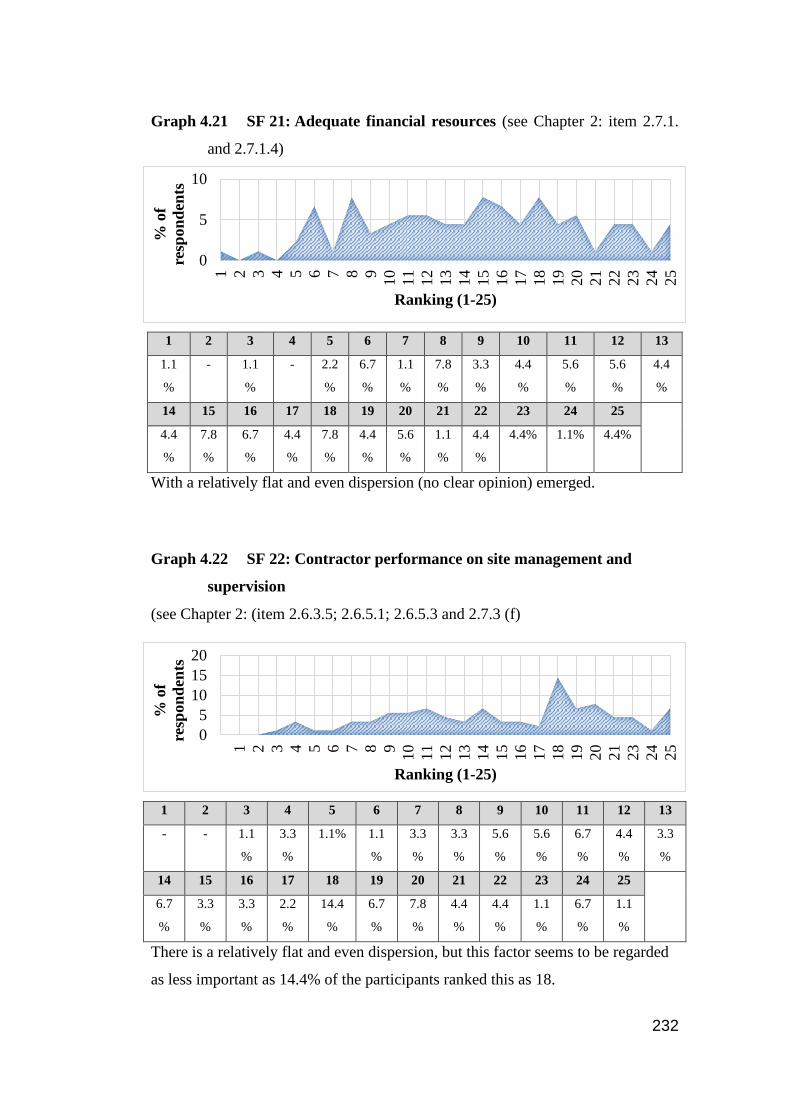
232
Graph 4.21 SF 21: Adequate financial resources (see Chapter 2: item 2.7.1.
and 2.7.1.4)
1 2 3 4 5 6 7 8 9 10 11 12 13
1.1
%
- 1.1
%
- 2.2
%
6.7
%
1.1
%
7.8
%
3.3
%
4.4
%
5.6
%
5.6
%
4.4
%
14 15 16 17 18 19 20 21 22 23 24 25
4.4
%
7.8
%
6.7
%
4.4
%
7.8
%
4.4
%
5.6
%
1.1
%
4.4
%
4.4% 1.1% 4.4%
With a relatively flat and even dispersion (no clear opinion) emerged.
Graph 4.22 SF 22: Contractor performance on site management and
supervision
(see Chapter 2: (item 2.6.3.5; 2.6.5.1; 2.6.5.3 and 2.7.3 (f)
1 2 3 4 5 6 7 8 9 10 11 12 13
- - 1.1
%
3.3
%
1.1% 1.1
%
3.3
%
3.3
%
5.6
%
5.6
%
6.7
%
4.4
%
3.3
%
14 15 16 17 18 19 20 21 22 23 24 25
6.7
%
3.3
%
3.3
%
2.2
%
14.4
%
6.7
%
7.8
%
4.4
%
4.4
%
1.1
%
6.7
%
1.1
%
There is a relatively flat and even dispersion, but this factor seems to be regarded
as less important as 14.4% of the participants ranked this as 18.
0
5
10
1 2 3 4 5 6 7 8 9
10
11
12
13
14
15
16
17
18
19
20
21
22
23
24
25
% o
f
resp
on
den
ts
Ranking (1-25)
0
5
10
15
20
1 2 3 4 5 6 7 8 9
10
11
12
13
14
15
16
17
18
19
20
21
23
24
25
% o
f
resp
on
den
ts
Ranking (1-25)
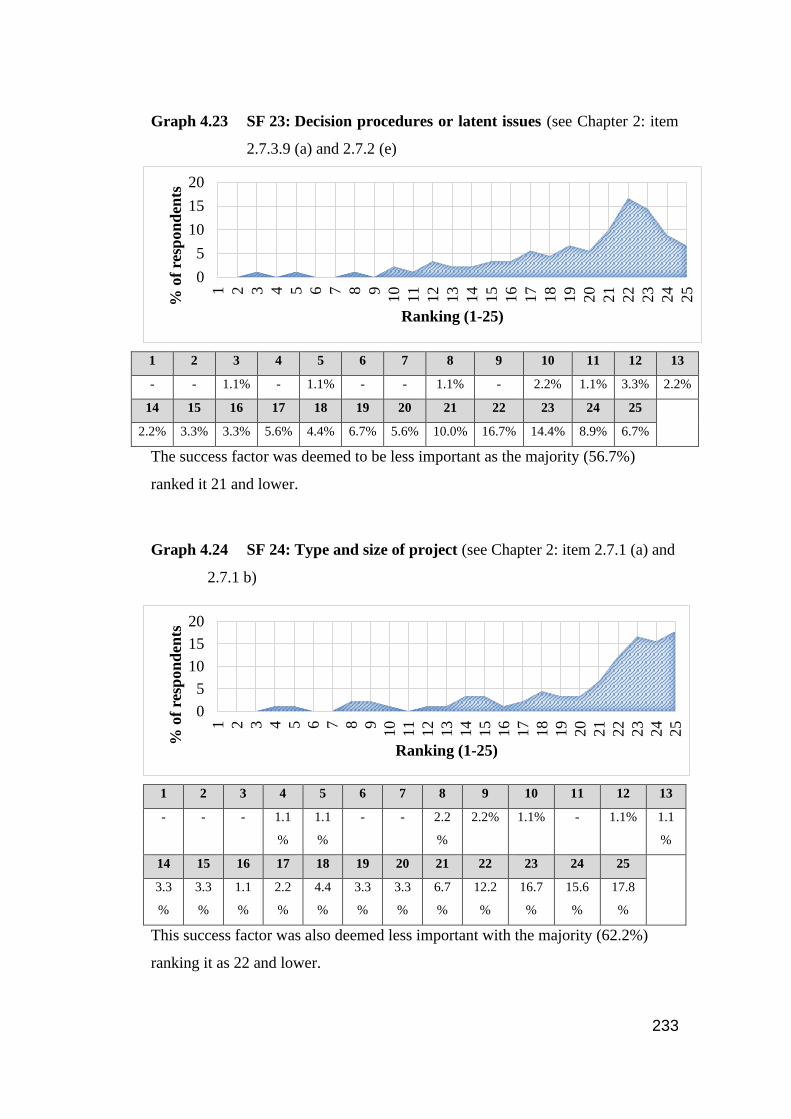
233
Graph 4.23 SF 23: Decision procedures or latent issues (see Chapter 2: item
2.7.3.9 (a) and 2.7.2 (e)
1 2 3 4 5 6 7 8 9 10 11 12 13
- - 1.1% - 1.1% - - 1.1% - 2.2% 1.1% 3.3% 2.2%
14 15 16 17 18 19 20 21 22 23 24 25
2.2% 3.3% 3.3% 5.6% 4.4% 6.7% 5.6% 10.0% 16.7% 14.4% 8.9% 6.7%
The success factor was deemed to be less important as the majority (56.7%)
ranked it 21 and lower.
Graph 4.24 SF 24: Type and size of project (see Chapter 2: item 2.7.1 (a) and
2.7.1 b)
1 2 3 4 5 6 7 8 9 10 11 12 13
- - - 1.1
%
1.1
%
- - 2.2
%
2.2% 1.1% - 1.1% 1.1
%
14 15 16 17 18 19 20 21 22 23 24 25
3.3
%
3.3
%
1.1
%
2.2
%
4.4
%
3.3
%
3.3
%
6.7
%
12.2
%
16.7
%
15.6
%
17.8
%
This success factor was also deemed less important with the majority (62.2%)
ranking it as 22 and lower.
0
5
10
15
20
1 2 3 4 5 6 7 8 9
10
11
12
13
14
15
16
17
18
19
20
21
22
23
24
25
% o
f re
spon
den
ts
Ranking (1-25)
0
5
10
15
20
1 2 3 4 5 6 7 8 9
10
11
12
13
14
15
16
17
18
19
20
21
22
23
24
25
% o
f re
spon
den
ts
Ranking (1-25)

234
Graph 4.25 SF 25: Contract and dispute procedures (see Chapter 2: item
2.6.5 to 2.6.5.5)
1 2 3 4 5 6 7 8 9 10 11 12 13
1.1
%
- - 1.1
%
1.1
%
- 3.3
%
- 3.3% 6.7
%
2.2% - 1.1
%
14 15 16 17 18 19 20 21 22 23 24 25
5.6
%
3.3
%
3.3
%
- 2.2
%
5.6
%
5.6
%
12.2
%
10.0
%
7.8
%
12.2
%
12.2
%
Deemed of lesser importance with the majority (54.4%) ranking it as 21 and
lower.
0
5
10
15
1 2 3 4 5 6 7 8 9
10
11
12
13
14
15
16
17
18
19
20
21
22
23
24
25
% o
f re
spon
den
ts
Ranking (1-25)
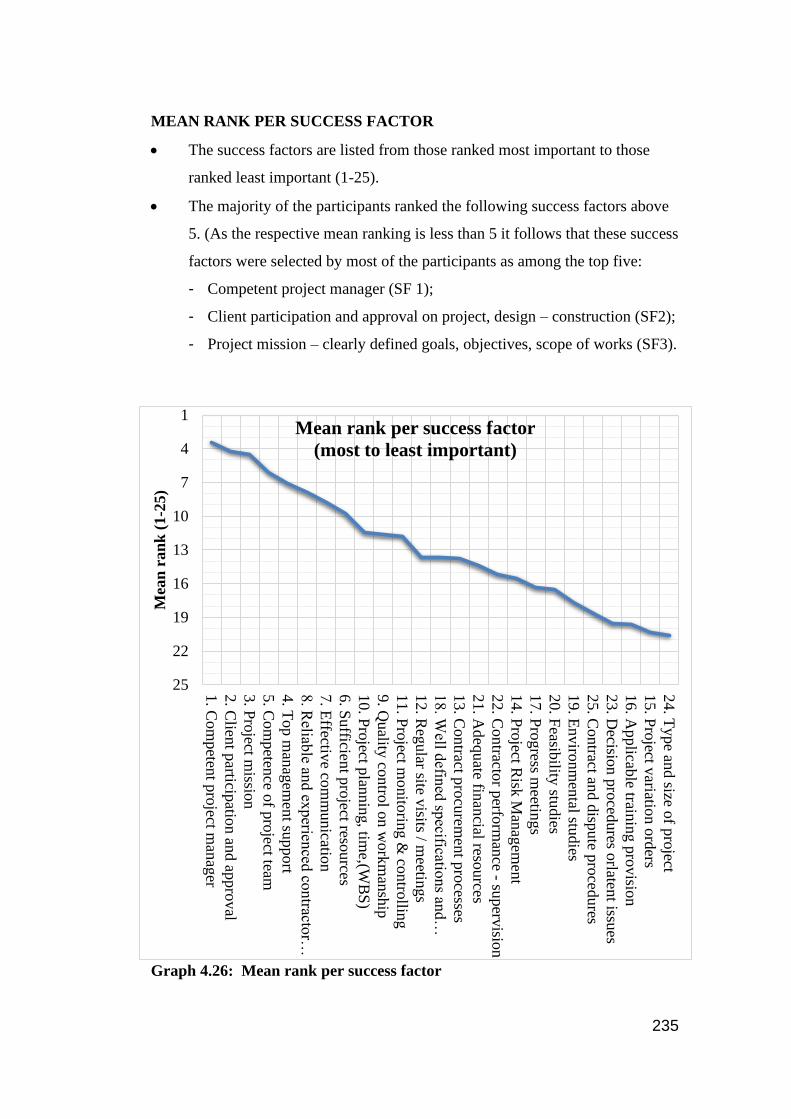
235
MEAN RANK PER SUCCESS FACTOR
• The success factors are listed from those ranked most important to those
ranked least important (1-25).
• The majority of the participants ranked the following success factors above
5. (As the respective mean ranking is less than 5 it follows that these success
factors were selected by most of the participants as among the top five:
- Competent project manager (SF 1);
- Client participation and approval on project, design – construction (SF2);
- Project mission – clearly defined goals, objectives, scope of works (SF3).
Graph 4.26: Mean rank per success factor
1
4
7
10
13
16
19
22
25 1. C
om
peten
t pro
ject man
ager
2. C
lient p
articipatio
n an
d ap
pro
val
3. P
roject m
ission
5. C
om
peten
ce of p
roject team
4. T
op m
anag
emen
t support
8. R
eliable an
d ex
perien
ced co
ntracto
r…
7. E
ffective co
mm
unicatio
n
6. S
ufficien
t pro
ject resources
10. P
roject p
lannin
g, tim
e,(WB
S)
9. Q
uality
con
trol o
n w
ork
man
ship
11. P
roject m
onito
ring &
contro
lling
12. R
egular site v
isits / meetin
gs
18. W
ell defin
ed sp
ecifications an
d…
13. C
ontract p
rocu
remen
t pro
cesses
21. A
deq
uate fin
ancial reso
urces
22. C
ontracto
r perfo
rman
ce - superv
ision
14. P
roject R
isk M
anag
emen
t
17. P
rogress m
eetings
20. F
easibility
studies
19. E
nviro
nm
ental stu
dies
25. C
ontract an
d d
ispute p
roced
ures
23. D
ecision p
roced
ures o
rlatent issu
es
16. A
pplicab
le trainin
g p
rovisio
n
15. P
roject v
ariation o
rders
24. T
ype an
d size o
f pro
ject
Mea
n r
an
k (
1-2
5)
Mean rank per success factor
(most to least important)
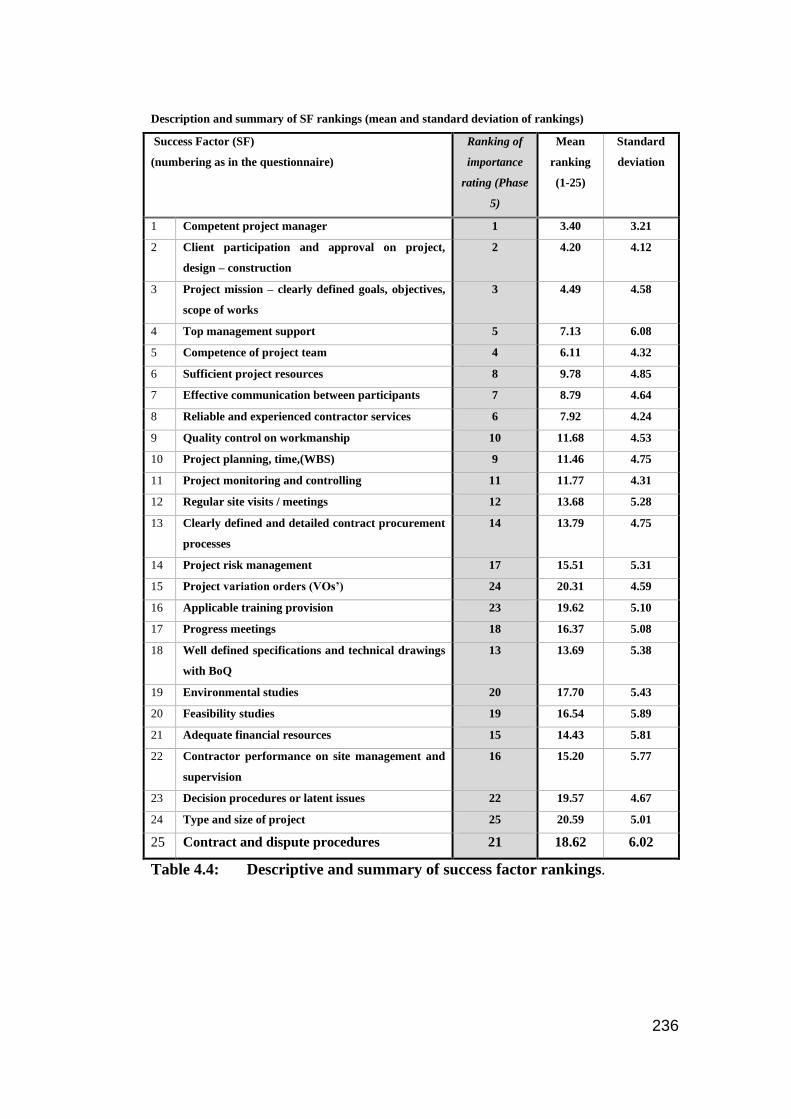
236
Description and summary of SF rankings (mean and standard deviation of rankings)
Success Factor (SF)
(numbering as in the questionnaire)
Ranking of
importance
rating (Phase
5)
Mean
ranking
(1-25)
Standard
deviation
1 Competent project manager 1 3.40 3.21
2 Client participation and approval on project,
design – construction
2 4.20 4.12
3 Project mission – clearly defined goals, objectives,
scope of works
3 4.49 4.58
4 Top management support 5 7.13 6.08
5 Competence of project team 4 6.11 4.32
6 Sufficient project resources 8 9.78 4.85
7 Effective communication between participants 7 8.79 4.64
8 Reliable and experienced contractor services 6 7.92 4.24
9 Quality control on workmanship 10 11.68 4.53
10 Project planning, time,(WBS) 9 11.46 4.75
11 Project monitoring and controlling 11 11.77 4.31
12 Regular site visits / meetings 12 13.68 5.28
13 Clearly defined and detailed contract procurement
processes
14 13.79 4.75
14 Project risk management 17 15.51 5.31
15 Project variation orders (VOs’) 24 20.31 4.59
16 Applicable training provision 23 19.62 5.10
17 Progress meetings 18 16.37 5.08
18 Well defined specifications and technical drawings
with BoQ
13 13.69 5.38
19 Environmental studies 20 17.70 5.43
20 Feasibility studies 19 16.54 5.89
21 Adequate financial resources 15 14.43 5.81
22 Contractor performance on site management and
supervision
16 15.20 5.77
23 Decision procedures or latent issues 22 19.57 4.67
24 Type and size of project 25 20.59 5.01
25 Contract and dispute procedures 21 18.62 6.02
Table 4.4: Descriptive and summary of success factor rankings.
237
The above table defines the following:
1 Success factors in order of most importantly ranked to least importantly
ranked (1 – 25).
2 Majority of participants ranked the following success factors above 5 as the
respective mean ranking is less than 5 (therefore formed part of the top 5
success factors in most participants’ views):
• Competent project manager;
• Client participation and approval on project, design – construction;
• Project mission – clearly defined goals, objectives, scope of works.
Most important factors per phase combined with respective overall rankings
of success factor (phases 1 to 4 and phase 5 of study) from Table 4.3.
By considering the factors indicated as the most important per phase by 60% or
more of the participants the factors were limited to:
Phase 1 (7 success factors)
• SF 1 Competent project manager;
• SF 2 Client participation and approval on project, design – construction;
• SF 3 Project mission – clearly defined goals, objectives, scope of works;
• SF 4 Top management support;
• SF 5 Competence of project team;
• SF 7 Effective communication between participants;
• SF 20 Feasibility studies.
Phase 2 (14 success factors)
• SF 1 Competent project manager;
• SF 2 Client participation and approval on project, design – construction;
• SF 3 Project mission – clearly defined goals, objectives, scope of works;
• SF 4 Top management support;
• SF 5 Competence of project team;
238
• SF 6 Sufficient project resources;
• SF 7 Effective communication between participants;
• SF 10 Project planning, time (WBS);
• SF 11 Project monitoring and controlling;
• SF 13 Clearly defined and detailed contract procurement processes;
• SF 14 Project risk management;
• SF 18 Well defined specifications and technical drawings with BoQ;
• SF 19 Environmental studies;
• SF 20 Feasibility studies.
Phase 3 (20 success factors)
• SF 1 Competent project manager;
• SF 2 Client participation and approval on project, design – construction;
• SF 3 Project mission – clearly defined goals, objectives, scope of works;
• SF 4 Top management support;
• SF 5 Competence of project team;
• SF 6 Sufficient project resources;
• SF 7 Effective communication between participants;
• SF 8 Reliable and experienced contractor services;
• SF 9 Quality control on workmanship;
• SF 10 Project planning, time (WBS);
• SF 11 Project monitoring and controlling;.
• SF 12 Regular site visits / meetings;
• SF 13 Clearly defined and detailed contract procurement processes;
• SF 14 Project risk management;
• SF 15 Project variation orders (VOs’);
• SF 17 Progress meetings;
• SF 18 Well defined specifications and technical drawings with BoQ;
• SF 21 Adequate financial resources;
• SF 22 Contractor performance on site management and supervision;
• SF 25 Contract and dispute procedures.
239
Phase 4 (5 success factors)
• SF 1 Competent project manager;
• SF 2 Client participation and approval on project, design – construction;
• SF 8 Reliable and experienced contractor services;
• SF 9 Quality control on workmanship;
• SF 25 Contract and dispute procedures.
Average across project: Phase 5 (7 success factors)
• SF 1 Competent project manager;
• SF 2 Client participation and approval on project, design – construction;
• SF 3 Project mission – clearly defined goals, objectives, scope of works;
• SF 4 Top management support;
• SF 5 Competence of project team;
• SF 7 Effective communication between participants;
• SF 10 Project planning, time (WBS);
240
ANNEXURE 3: CASE STUDIES AND ASSESSMENTS
CASE STUDY NO 1
Background: The property was one of a number of similar units in a cluster
development.
1 This property consisted of a number of similar units in a cluster
development in a suburban area.
2 A contractor was appointed to oversee the development.
3 The purchaser of one of the units (the employer) entered into a contract with
the contractor of the development.
4 The contractor retained the services of the engineer to provide the necessary
professional engineering services.
5 An investigation revealed that the quality of materials and workmanship
produced by the contractor was substandard.
6 The substandard level of the workmanship in numerous activities which
justified the purchaser’s complaint to the architectural council.
7 Numerous additional faults and defects seemed to be of an engineering
nature.
8 After the investigation it was noted that the dominant fault concerned the
reduction in the floor to floor height between the ground and first floors.
This fault involved the engineer.
9 When the owner/employer consulted with the engineer, the engineer made a
written misrepresentation to the owner to cover up for the contractor.
10 It was found that the engineer violated the rules of conduct in that he had
failed to base any decision, recommendation or opinion upon prevailing
facts.
Details of the problem:
1 The units were designed not suitable for South African climate conditions.
2 Considerable modifications were therefore necessary, but these resulted in
finishes which were Spartan and “cheap” and not according to the standards
to which buyers were accustomed.
241
3 Another factor included inferior materials and poor workmanship from
employing unskilled artisans.
4 Various disputes between the employer and contractor were caused by
defects not being put right and also a failure to complete the project.
5 There were various unprofessional and unacceptable situations such as
client and team participation, design, scope of work, quality control, risk
management and contractor performance.
6 The main problem was that the contractor decided to reduce the height of
the walls between the ground floor and first floor of the unit by at least
300mm. In this way he saved the labour and material not constructed of
360mm.
7 Because of this decision the contractor also used less plaster, Rhino-Lite
plaster and paint on the walls of the ground floor of the unit. The owner
queried this.
8 The door to a walk-in pantry below the stairs, which was supposed to have
had a door frame of standard height (2.10m), had a frame of 1.91m, an
unacceptable height.
9 The engineer and the designer discussed the reducing of the floor height
with the client but the reasons were not valid.
10 The roof reduction was not necessary from a design perspective but was a
blatant cost-cutting exercise.
11 Furthermore, the decision to reduce the height of the walls was made
without informing the owner, which would have been the correct procedure.
12 The reduction could not be rectified as the matter was only investigated
when the unit was nearly complete.
13 The following had lasting and negative effects on the value of the unit :
• The door to the pantry was too low and therefore hazardous.
• The loss of volume in the utility.
• The negative aesthetic effect of the loss in volume.
• Consequent market value loss of the unit.
242
Assessment: Case study 1
It is clear from the above case study analysis that the engineer/project manager did
not utilise support, knowledge and expertise available to him/her when
supervising the project. The engineer’s misrepresentation to the owner to cover up
for the contractor is a violation of the engineering code of conduct.
Neither the engineer nor the contractor should have allowed the use of
substandard materials.
From the case study analysis it is evident that the engineer and the contractor
abused the most critical success factors 1, 2, 3, 5, 7, 9, 14, 18, 22 and (25) as these
neglected CSFs were the reason for failure to meet the client’s expectations (see
evaluator’s assessment form pp. 244). They also failed to perform good project
management and to deliver a quality project management service.
The analysis of this case study revealed that the engineer and contractor rendered
a substandard service.
This conclusion is shown in merging graphs 6.1, 6.2, 6.3 and 6.4 (pp. 179 - 181)
and Table 5.2 (pp. 170) which indicates high ratings in critical success factor
(CSF) 5, Table 5.2: SF 5, competence of project team.
Phase 1 rated 23, phase 2 rated 39 and phase 3 rated 40, phase 4 rated 12 and
Total Rating 114. The project ranking factor indicates that this was the second
highest risk factor to deliver a successful project.
These CSFs were rated as very important in Chapter 4 when the engineer rated the
CSF 5 at 72.2% in phase 1, 83.3% in phase two and 87.8% in phase 3.
There is no doubt that both the engineer and the contractor should take full
responsibility for the financial loss (and its impact on the client’s investment)
caused by the reduction in the floor-to-floor height.
243
The project’s final rating was CSF 1 which indicated the lowest project service
delivery out of 25 CSFs due to the incompetence and lack of experience on the
part of the project manager (rating of 23).
The researcher’s point of view is that the engineer was not equipped with
sufficient project experience or knowledge to oversee this project through its
various phases.

244
Evaluator’s assessment:
245
CASE STUDY NO 2
Background: Major structural engineering additions were carried out on an
existing shopping mall.
1 Large scale additions involving major structural engineering elements were
made to an existing shopping centre.
2 The owners of the shopping centre appointed a firm of consulting engineers
to provide the structural engineering services required for these major
structural additions.
3 A senior professional engineer of this firm was appointed to be in charge of
the assignment.
4 The new structure included a steel lattice girder beam spanning an open area
of 40m and supporting the ceiling and roof of this part of the building.
5 After the beam had been erected, a welded connection in the lattice beam
failed.
6 This caused the beam to collapse and resulted in injuries to the people below
as well as in some fatalities.
7 The designer contravened certain building rules of conduct.
Details of the problem:
1 The agreement between the client and consulting engineers provided inter
alia for the “design and commissioning” of structural engineering services
which involved reinforced concrete foundations and structures and a steel
roof structure.
2 It was agreed that the engineering firm would not be responsible for the
design elements of equipment supplied and installed by others. It was
required that the consultants approve the structural designs.
3 The failure of the lattice beam was the failure of a welded joint between a
diagonal member and the top chord of the lattice beam at the spot where it
was supported on a concrete column.
4 The welded joint was unable to withstand the forces applied to it and the
welds failed. It was found that the preparation of the steelwork for the
246
welding (chamfering) had not been done correctly and the welding itself
was therefore suspect.
5 It was further revealed that the joint had not been welded with the beam on
the ground. The steelwork subcontractor should have used a 25 ton crane to
lift the completed lattice into position.
6 The investigation showed that the lattice was supported by scaffolding and
was not welded on the ground. It was lifted to its position where the welding
of the joint was done “up in the air”.
7 During the investigation considerable emphasis was put on the culpability of
the beam designer and steelwork subcontractor as they had not met their
contractual obligations.
8 The competence and experience needed for the inspection and approval of
the welding was beyond the competence of the average structural engineer.
9 The Department of Labour put considerable emphasis on the culpability of
the beam designer and steelwork subcontractor in terms of the Occupational
Health and Safety Act.
10 The responsibility of the design engineer included supervision of the
construction as well as inspections by the engineer to verify the contractor’s
workmanship and materials complied with the contract specification.
11 The owner limited the engineer to approximately 4 hours per fortnight for
site visits, inspections and site meetings.
12 The engineer therefore had to rely on the contractor and subcontractors to
carry out inspections themselves and to fulfil their obligation to produce
work which complied in all respects with the contract specifications and
requirements.
13 This applied particularly to the welding of the lattice beam members and
joints, and the contractor and subcontractors were supposed to have the
necessary competence and expertise.
14 The design engineer had to ensure that the contractor and subcontractors
were furnished with information and details necessary for the manufacturing
and erection of all the elements of the work they were responsible for.

247
15 The design engineer was also responsible for checking and approving the
shop drawings to ensure the design intent and requirements were clearly
stated and fully comprehended by the contractor and subcontractor. It was
particularly important that all necessary information and details required for
the manufacture, erection or fabrication of all elements needed for the work
were supplied to the contractor and subcontractors.
16 In the case of structural steelwork comprehensive “general arrangement”
drawings had to be made by the engineer. They had to be sufficient for the
steelwork subcontractor to be able to prepare the shop drawings, including
all the necessary details for fabrication or manufacture, both in the shop and
on the site.
17 It was also the design engineer’s responsibility to check and approve the
shop drawings to ensure that the design intent and requirements were clearly
stated and could be fully complied with by the subcontractor.
18 The design required that the welds should be full penetration welds.
19 It was revealed in the investigation that the welding method was not clearly
described to the subcontractor.
20 Examination of numerous welds in the joints of the collapsed beam revealed
that the proper weld preparation was not done. It also revealed that the weld
gaps were too wide and were filled by first welding in the round bars.
21 The welding of the joint which failed was complicated by the joint being too
close to the support column.
22 The subcontractor’s engineer inspected the welding after completion for
visual defects, but he was unable to verify the number of weld runs because
these were now covered and he could only rely on the word of the welding
foreman.
23 Although the subcontractor had concerns about the lattice beam welding and
suggested the addition of gusset plates at the joints, his suggestions were not
acted upon.
24 A major reason for the collapse can be contributed to the fact that the
engineer was limited by the owner regarding the number of his inspections.
248
He could not inspect the works or verify compliance to the instructions in
the drawings sufficiently to be sure that there were no defects.
25 The engineer did have concerns when the welded lattice beams were erected
in sections and joints were welded high off the ground.
26 The engineer requested a load test on this part of the structure but the owner
refused his request. The engineer felt that the scope of the on-site welding
added an unknown element to the design process and that that should have
been checked for consistency.
The following conclusions were reached by the evaluator of this case study:
• The way in which the lattice beam members were fabricated resulted in
significant unconventional behaviour. There were differences between
member centrelines and central axes, causing secondary bending moments
which had not been taken into account.
• Important and heavy connections, including weld specifications and test
requirements, are normally specified by the engineer in the engineering
drawings. These were omitted.
• The specific lattice beam was assembled in sections and then welded
together. No design details were provided by the engineer for construction
joints and this detail was left to the contractor to work out.
• The engineer was obligated to provide sufficient supervision to ensure that
the structure that was built was safe for public use. The engineer had to sign
the structural certificate of the local authority, thereby giving his assurance
of the safety of the structure.
• The engineer contravened the building code of conduct because he did not
discharge his duties with the necessary skill, efficiency, professionalism,
knowledge, competence, due care and diligence. The engineer failed to
adhere to acceptable practices.
• The engineer did not have regard for public health, safety and interest at all
times. He did not provide work or services according to the accepted
standards and practices of his profession.

249
Assessment: Case study no 2
This was a large project which required a high level of specialised professional
engineering services. For this reason the client appointed a firm of consulting
engineers to provide the required services and to execute the requirements in
terms of the project scope of work. This type of project often contains latent
defects, necessitating the knowledge and supervision of an experienced
engineer/project manager.
An additional problem was the fact that the owner limited the engineer/project
manager’s site visits, something which later proved to has been crucial oversight.
The most important success factors defined in the survey research were SFs 1, 2,
3, 5, 7, 8, 9, 14, 18, 22, and 25 (see Table 4.3, pp. 136). These included the
success factors listed in phases 2 and 3 (which are above 60%), but in this project
they were ignored. As noted in Chapter 2 the project manager/engineer is
supposed to take full responsibility of the project team. He should have taken the
lead in advising the client, design team, contractors and other role players about
the full scope of work and the complexity of the project.
The project manager failed to do the following:
- He did not formulate a full scope of work, something which would have
identified the client’s needs. There was no written project mission, no risk
and project implementation, no testing of the reliability of work force, a lack
of the experience and knowledge required for the specific design
components of the project and no environmental and feasibility studies to
assess latent factors.
Other success factors were also neglected.
- The project manager failed to take control and lead in managing, advising
and overseeing the client’s needs. This was probably because of his lack of
managerial and leadership experience.
- The client limited the engineer’s site inspections probably to cut costs. The
project manager/engineer did not advise the owner of the risks inherent in
250
his decision, and this decision led to his violating the building code of
conduct.
Evaluator’s case study analysis:
From the above analysis it is clear that the most important critical success factors
were contravened indicating the following CSFs: 1, 2, 3, 5, 7, 8, 9, 14, 18, 22 and
25. This was illustrated in the evaluator’s case study assessment form below.
The above mentioned factors are shown in Graphs 6.1, 6.2, 6.3 and 6.4 where the
four project phases were displayed.
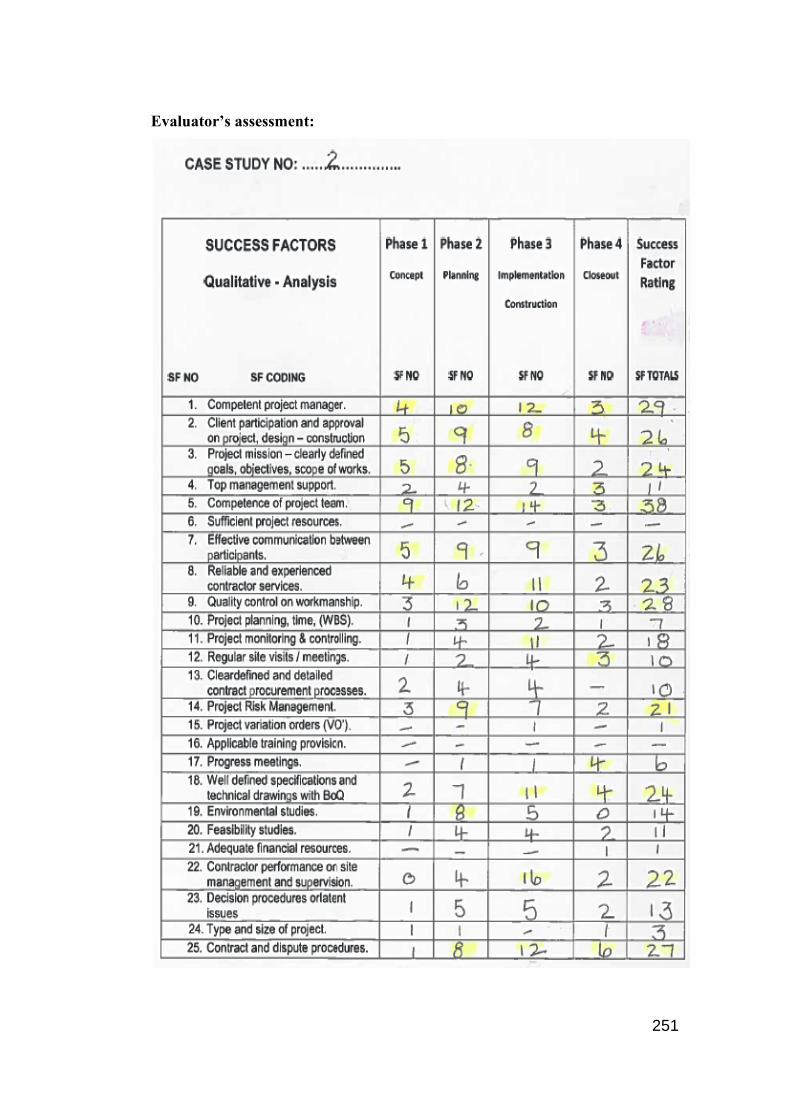
251
Evaluator’s assessment:
252
CASE STUDY NO. 3
Background: A four-story community centre constructed with a reinforced
concrete structure, comprising of spread foundations, columns, floor slabs and a
basement with retaining walls.
1 The building has a length and breadth of approximately 100m x 50m. It
consists of a parking basement with two office floors above and a tiled roof
supported by timber trusses and resting on external walls.
2 While the internal brick walls were being built and the roof tiles put in
place, the concrete structure, more than half of the area of the building,
collapsed.
3 Thirteen workers were injured, there was one fatality and one person could
not be found in the rubble.
4 An investigation revealed that the probable cause of the collapse of the
structure was the fact that the columns had been punched through the floor
slab.
5 The design was carried out by the engineer concerned with the project.
7 The engineer designed the floor slab reinforcing but instead of issuing
drawings or bending schedules, he only provided A4 sketches.
8 Calculations for the design of the structure could not be retrieved.
9 Openings in the floor slab were not taken into account in the design.
10 No geotechnical investigation was done for foundation design; a safe
bearing pressure under the footings had been assumed and could have been
insufficient.
11 The engineer relied on verbal instructions given on site, including increasing
concrete strengths which indicated the reinforcement bar bending details.
12 Saw cuts in the ground floor suspended slab had been introduced,
apparently to allow for the thermal movement.
13 The engineer took it upon himself to check his own calculations and details.
253
14 The floors were built without beams but the reinforcement for this was
insufficient, particularly in the area of the columns.
Evaluator’s case study analysis:
Assessment: Case study no 3
The assessment of this case study led to the conclusion that the engineer was not
competent to design the structure. His method of executing the design and
drawings showed that he did not take the complexity of the design into
consideration and this affected the entire project.
Critical success factors 1, 2, 3, 5, 7, 8, 14, 18, 22 and 25 were shown to be
relevant for this project’s failure (as indicated in SF rating totals). This was
illustrated in the evaluator’s case study assessment form below.
The engineer/project manager maintained inter alia that the collapse was not
caused solely by him, that he was not responsible for producing the structural
design, that he did not err when reacting to the punching failure, that the design
was altered without his knowledge and that his scope of work included only
limited visits to the site. The engineer claimed that the design changes altered the
loading on the structure, culminating in overloading during construction.
However, the engineer/project manager signed the local authority’s form A19
form, confirming his appointment as the responsible person for the design and
overseeing the project.
• He failed to discharge his duties to his client and the public with skill,
efficiency, professionalism, knowledge, competence, due care and
diligence.
• He undertook work of a nature for which his education, training and
experience had not rendered him competent.
• He failed to engage in or adhere to acceptable practices (SFs 2, 3, 5, 7, 8, 9,
11, 12, 13, and 19).

254
• He did not have due regard for public health, safety and interest (SF 14).
• He did not provide work or services of quality and scope or on a level
corresponding to accepted standards and practices in the profession
(SF 9).
The engineer did not conform to the design and construction codes of conduct,
and did not pay attention to the critical success factors. He also did not do soil
analysis to ascertain the soil conditions of the site, something which is necessary
when the foundation design loadings are calculated. The most important success
factors as defined in the survey research (Table 4.3, pp 136) namely CSFs 1, 2, 3,
5, 7, 8, 14, 18, 22 and 25 as well as the success factors listed in phases 2 and 3
(which are above 60%) were ignored.
In the average across ranking (Table 4.3) CSFs 1, 2, 3, 4, 5, 7 and 10 were shown
by the quantitative research to be regarded as very important. In this project they
were all disregarded, leading to a negative outcome for the project.
Regarding phases 1, 2 and 3 scope of work (SF 3) the engineer and the
contractor’s competence to execute their duties, (SF 19) environmental studies,
(SF 14) risk control and well defined specification and technical drawings were
not listed as a high priority on this project.
The above mentioned success factors are illustrated in the merging graphs 6.1,
6.2, 6.3 and 6.4 (pp. 179 – 181) which display the four project phases.

255
Evaluator’s assessment:

256
CASE STUDY NO 4
Background: A double story block of flats above ground floor parking was
constructed with reinforced concrete footings, columns and flat slabs and with
load bearing brick walls.
1 The building in question was an apartment block with double storey flats
above ground floor parking. It was constructed with reinforced concrete
footings, columns and flat slabs and with load bearing brick walls.
2 A registered professional engineer was appointed to provide design and
construction monitoring services for the proposed building.
3 An architect was also appointed.
4 The first floor flat slab was supported on columns on pad footings and in
reinforced concrete.
5 The load bearing brick walls on this slab supported a second floor
reinforced concrete slab also with load bearing walls to support a
lightweight roof.
6 After the casting of the concrete, severe cracks at an early stage were noted
in the first floor slab.
Details of the problem:
The findings during the investigation revealed the following:
1 The load bearing walls on the first and second floors did not correspond
with the position of the columns below the first floor, i.e. the first floor slab
functioned as a transfer slab.
2 The report revealed that the slab was a flat slab without beams.
3 The load on this slab was extremely heavy as it carried the load of the roof,
the second floor slab and the two floors of brickwork.
4 It was noted that there were longitudinal top cracks over column lines, radial
cracks around columns, longitudinal cracks on the soffit, and top cracks at
the root of the cantilever slabs. This was all seen on the first floor slab.
5 It was further revealed that the slab was not designed as a flat slab capable
of transferring this load to the columns and that this caused the slab to fail in

257
various ways. The failure of the slab was attributed to the following design
faults:
• The slab was too thin and therefore needed compression
reinforcement in places.
• The bottom slab reinforcement was insufficient.
• There was too little top slab reinforcement.
• There was inadequate reinforcement round the columns to withstand
punching shear forces.
• There were also insufficient anchorage lengths of cantilever slab
reinforcement.
6 The investigation also revealed other failing structural elements such as the
column stirrup spacing and starter bar lengths as well as excessive bearing
pressure below footings.
7 The lateral stability of the structure in withstanding wind loads had not been
considered and would require shear walls.
8 The strength of the ready-mixed concrete had been questioned by the
engineer after the casting of the slab.
9 Subsequent tests showed the strength to be marginal but not the cause of the
slab failure.
10 The omission of a geotechnical investigation and reliance on information
from a nearby site for foundation design was a risk that should not have
been taken.
11 The investigation revealed that the slab could not be strengthened in situ and
would have to be demolished.
12 The project manager/engineer had undertaken work of a nature which his
education, training and experience had not rendered him competent to
perform.
13 The project manager/engineer failed to engage in or adhere to acceptable
practices. He accepted conditions and terms that compromised his ability to
carry out his responsibilities in accordance with acceptable professional
standards.

258
14 The engineer did not at all times have due regard for public health, safety
and interest.
15 The project manager/engineer did not provide work or services
corresponding to the standards and practices in his profession.
Evaluator’s case study analysis:
Assessment: Case study no 4
The developer commissioned a registered professional engineer to design and
monitor the construction of this project. The client also employed the service of an
architect and a contractor. The engineer as the civil designer worked in
conjunction with the architect, contractor and the client, and they were known as
‘the project team’. The project manager/engineer was expected to have the
required knowledge and experience to design and oversee a project of this size,
and to act as the de facto project manager.
The case study analysis indicated that very little attention was paid to most of the
important success factors (see Table 4.3, pp. 136). The comments in the case
study report were in fact alarming given in the requirements for the job. The
outcome of the project showed clearly that the engineer was not qualified to
execute and oversee the project successfully.
The following critical success factors (CSFs) were disregarded: CSFs 1, 2, 3, 5, 7,
8, 9, 11, 13, 14, 17, 18, 22 and 25. It is clear that the violation of the standard
design and practice code of conduct (Code of practice (2002) as well as
inexperience and lack of knowledge regarding project management had serious
implications for all the role players as well as the project as a whole. This was
illustrated in the evaluator’s case study assessment form below.
The case study analysis indicated that very little attention was given to most of the
important success factors quoted in Table: 5.2 (pp. 170).

259
In this fourth and last case study the assessment revealed that the CSFs as ranked
in Table 5.2: (“Total of complete project – Ranking code”) indicates a lack of
knowledge and experience on the part of the engineer/project manager. The
ranking codes 1, 3, 4, 2 and 5 are all applicable here and affect all four phases of
the project.
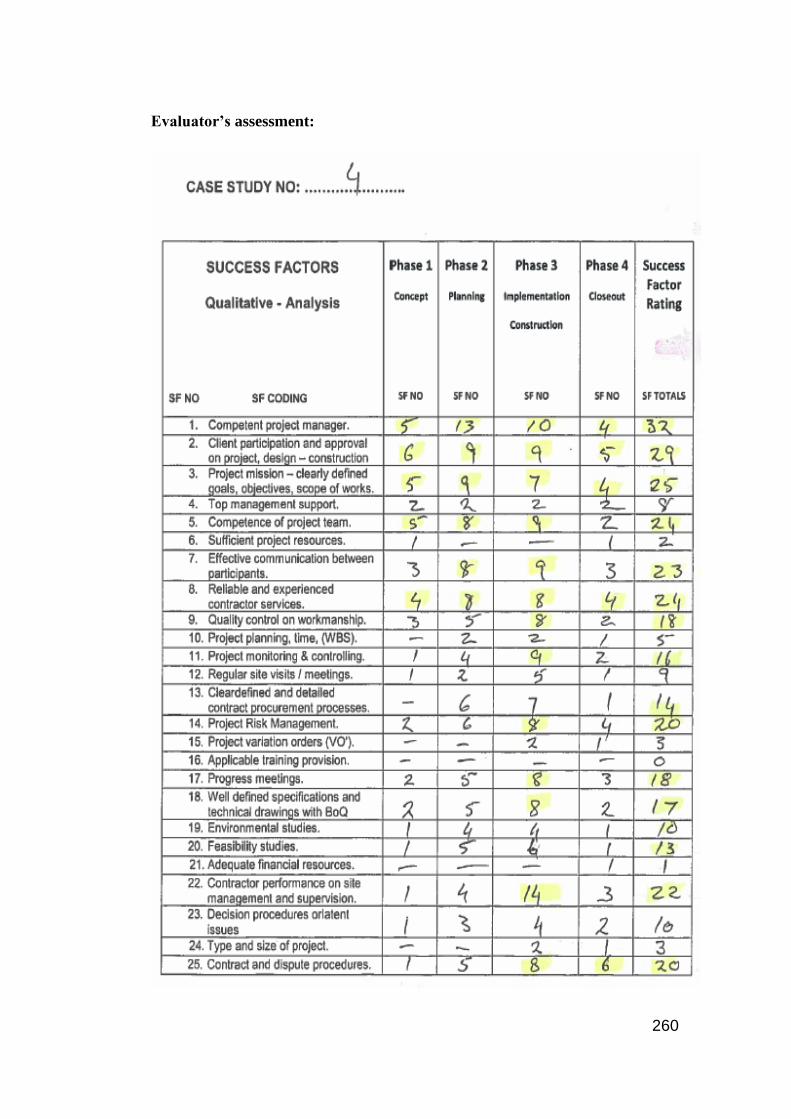
260
Evaluator’s assessment:

261
In conclusion over all four case studies:
The final and total score of success factor 1 (competent project manager) showed
a total rating of 117 (highest rating) and indicates the incompetency of the project
manager, ranked as 1 in the total of complete project column (Table 5.2, pp. 170).
The relevance of this finding for this research is shown in the merging graphs 6.1
to 6.4 in Chapter 6, as the pattern-matching of all four phases illustrate the lack of
knowledge and experience of the engineer when operating in the office of a
project manager.
262
ANNEXURE 4: CASE STUDY ASSESSMENT FORM
SECTION C: CASE STUDY ANALYSIS
Based upon your overall experience in project management of design and
construction projects, kindly review and evaluate the case study according to the
explanation and guidance. See assessment protocol below. You are requested to
code the literature of the case study and rate the success factors (SF) over the
various phases. See example below.
The aim of this survey is to identify the most important success factors, which
determine the success of the construction project. Dr Harry Visser is conducting
this survey as part of the requirements for completion of a post-graduate research
study at the University of the Witwatersrand.
Please be assured that your answers will be treated with confidentiality and that
the case study assessment DOES NOT requests any identification from the
evaluator. Your frank and honest opinion is sought and the information obtained
will be strictly used for academic purposes and statistical analysis only. The
identity of evaluator will not be revealed. Participation in this assessment is
entirely voluntarily and there is no penalty if you do not participate. There is no
risk associated with filling in the assessment form since the researcher guarantees
anonymity of the responses.
Your cooperation is appreciated.
Harry Visser (PhD): [email protected]. Cell: 083 2600 170
Study Leader, Prof Robert McCutcheon: [email protected]
011 717 7129

263
SF
NO
SUCCESS FACTORS (SF)
Case – Study No:
Coding Analysis
SF
CODING
Phase 1
Concept
Ranking
SF
NO
Phase 2
Planning
Ranking
SF
NO
Phase 3
Implemen-
tation
Construc-
tion
Ranking
SF
NO
Phase 4
Closeout
Ranking
SF
NO
Phase 5
Success
Factor
Rating
SF
TOTALS
1. Competent project manager. 111(3) ____ 111111
(6)
11(2) 11
2. Client participation and approval on
project, design – construction
1 (1) 111(3) 1111 (4) 11(2) 10
3. Project mission – clearly defined
goals, objectives, scope of works.
11 (2) 1 11 (2) 1 6
TABLE 5.1: Example of case study analysis
The assessment protocol was as follows:
The engineers remained anonymous and the case studies under review were not
identified.
Each of the four engineers selected a case study (from the four already selected by
the researcher) and was then shown how to apply the assessment questionnaire.
Remember that your rating on the Assessment form will identify to what degree
the project manager has not applied to the standard code of practise.
• Every SF and coding incident as identified in the case study counts one
point.
Example: in coding case study 1: an investigation revealed that the quality
of materials and workmanship produced by the contractor was substandard.
(1, 2, 5, 7, 8 and 11).
Explanation: this implied the following: The project manager did not
approve the bill of quantities (1). The designer failed to provide the
specification for materials (2). Lack of client participation (5). No effective

264
communication (7). Lack of reliable contractor service (8). Project
monitoring and controlling was not carried out (11), and so forth. One
statement in the case study addressed 6 SF items.
• Read the case study through and prepare for unknown questions to be
clarified before filling in your questionnaire which will then be discussed
before dealing with the assessment review.
• Every item (failure or not according to the standard code of practice) on the
case study should be identified and coded individually within its specific
phase and the numbers added in the SF rating column.
• One incident of case activity may have numerous of the same SF applicable
within the same criteria and context. The design engineer can be involved
four or five times in the same paragraph depending on the area under
question. For example: In question SF criteria 2, the design can have an
impact on SF items 2, 6, 8, 16 and 20, and therefore your reply will be
coded as ‘1’ at each of those identified SF numbers i.e. 2(1 point), 6(1),
8(1), 16 (1), and 20 (1). A total of 5 points is then written in the Rating SF
totals column.
• The assessment must be coded and include numbers 1 to 25 in the case
study “Assessment Form” pp. 265.
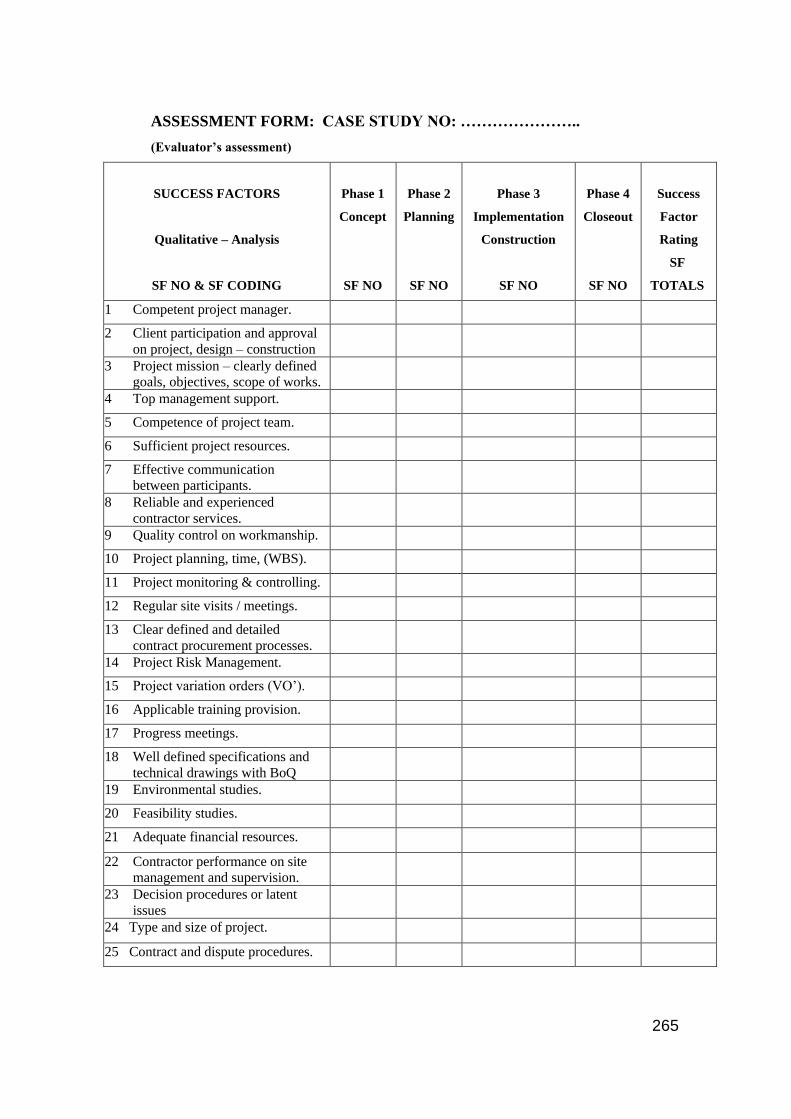
265
ASSESSMENT FORM: CASE STUDY NO: …………………..
(Evaluator’s assessment)
SUCCESS FACTORS
Qualitative – Analysis
SF NO & SF CODING
Phase 1
Concept
SF NO
Phase 2
Planning
SF NO
Phase 3
Implementation
Construction
SF NO
Phase 4
Closeout
SF NO
Success
Factor
Rating
SF
TOTALS
1 Competent project manager.
2 Client participation and approval
on project, design – construction
3 Project mission – clearly defined
goals, objectives, scope of works.
4 Top management support.
5 Competence of project team.
6 Sufficient project resources.
7 Effective communication
between participants.
8 Reliable and experienced
contractor services.
9 Quality control on workmanship.
10 Project planning, time, (WBS).
11 Project monitoring & controlling.
12 Regular site visits / meetings.
13 Clear defined and detailed
contract procurement processes.
14 Project Risk Management.
15 Project variation orders (VO’).
16 Applicable training provision.
17 Progress meetings.
18 Well defined specifications and
technical drawings with BoQ
19 Environmental studies.
20 Feasibility studies.
21 Adequate financial resources.
22 Contractor performance on site
management and supervision.
23 Decision procedures or latent
issues
24 Type and size of project.
25 Contract and dispute procedures.