risk and knowledge management - infoscience … and knowledge management • risk – product...
TRANSCRIPT

Risk and Knowledge Management
IFPAC January 2015Kevin Nepveux – Pfizer Global Supply

Pfizer OperationsAn aggregation of 25+ companies!
(1985)
(2000)AgouronGene/NetworksHickson Int’lPlc
Institute FarmacoBiologico Pagni
Plaistow
+ + + +
American Home
Products
A.H Robbins
+
(1989)
American Cyanamid
+
(1987–88)
+
(1992)
+(1994)
Animal divisions of:
Kabi Pharmacia
Pharmacia AB
Upjohn Company
Sugen (1999)
(1990)(1995)
Kelco Chemicals (1994)
+
(1993)+ +
+
+Kabi Vitrum
(1990) (1997) (1998) (1999)+
(2009)
(2003)
– SmithKline Beecham Animal Health (1995)– Restivo Italiana (1994 – through Roerig) – Koshin Medical KK (1992)– CSL Ltd Animal Health Unit (2004)
– Vicuron Pharmaceuticals Ltd (2005)– Idun Pharma (2005) — Apoptech
(1994)– Synbiotics (2010)– King Pharmaceuticals (2011)2

Risk and Knowledge Management
• Risk– Throughout product lifecycle but differs by phase– Unique risks by technology – common to all products
• Knowledge Management– Product-specific (across lifecycle)– Technology (across products)– General (across network)

Risk and Knowledge Management
• Risk – Product Lifecycle– Development – lack of experience, don’t know enough
(traditionally knowledge = experience)– KM approaches
• Risk Assessment based on institutional experience by unit operation
• Design experimental plan based on RA – iterative process• Modeling based on first principal equations
– Dynamic unit operations– Predictive stability models (ASAP)
• Capture knowledge in on-line, query-driven data system

Design Space
ConceptsQbD Concepts Right First Time Workflow
Commercial Manufacturing Process
(API or DP)
Risk AssessmentPrioritized Plans - Experimental PAT Risk Mitigation
Experimentation Method Dev
Documentation
Process Capability Monitoring
Continuous Improvement
(Process Changes)
e.g. Cpk
Launch
Process Understanding
Process Control Continuous Improvement
Control Strategy
Change Control Strategy
Regulatory Filing/Approval

Benefits“Platform Risk Assessment”
• How: Built by numerous SMEs• What: Pre-scored risk assessment that
captures institutional knowledge for specific technology platform
• When: Initial risk assessment on new project• Why: Save hours of pre-work, quicker
consensus, leverages prior knowledge
Example:

Platform Risk Assessment for a Low Dose, Dry Granulated, IR, Coated Tablet
Platform Risk Assessments –“Cause & Effect”• Blending• Lubrication• Granulation• Extragran Lub• Compress• Coating

Platform Risk Assessment for a Low Dose, Dry Granulated, IR, Coated Tablet
Blending
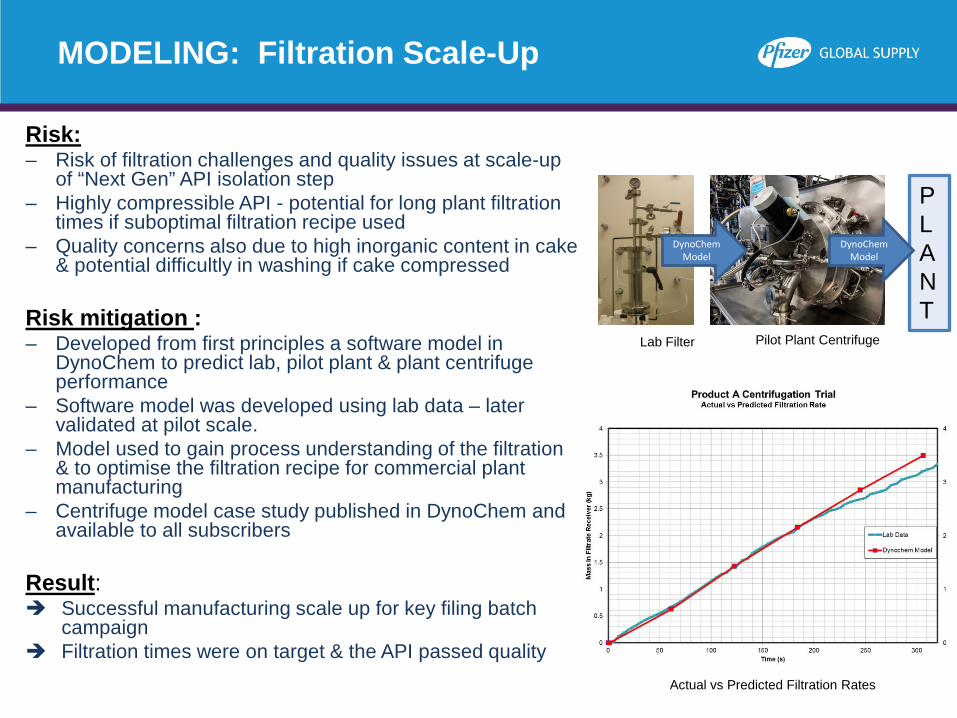
MODELING: Filtration Scale-Up
Risk: – Risk of filtration challenges and quality issues at scale-up
of “Next Gen” API isolation step – Highly compressible API - potential for long plant filtration
times if suboptimal filtration recipe used– Quality concerns also due to high inorganic content in cake
& potential difficultly in washing if cake compressed
Risk mitigation : – Developed from first principles a software model in
DynoChem to predict lab, pilot plant & plant centrifuge performance
– Software model was developed using lab data – later validated at pilot scale.
– Model used to gain process understanding of the filtration & to optimise the filtration recipe for commercial plant manufacturing
– Centrifuge model case study published in DynoChem and available to all subscribers
Result: Successful manufacturing scale up for key filing batch
campaign Filtration times were on target & the API passed quality
Lab Filter
Actual vs Predicted Filtration Rates
Pilot Plant Centrifuge
DynoChem Model
PLANT
DynoChem Model

MODELING: Capsule filling process
Early Design Recommended Full Scale Design
Velo
city
Novel predictive modelling used to develop robust commercial process and equipment
•Reduced over mixing•Improve dissolution performance•Now made 5 batches at full commercial scale•Traditional development paradigm
•More development batches•Slower•Expensive – API/PGS facility costs
0102030405060708090
100110
0 5 10 15 20 25 30 35 40 45 50 55 60 65
% D
issol
ved
Throughput (kg)
0102030405060708090
100110
0 10 20 30 40 50 60 70 80 90 100 110
% D
issol
ved
Throughput (kg)
Dissolution performance at different stage of the productions run
Pfizer Confidential │ 10

Small-scale process models are applied to solve critical processing issues at large-scale
0.085 1620
24
0.125
2.0 °C
8.0 °C
5.0 °C
[oxidising agent]
Time (h)
T(C)
Influence of Time and Temp under fixed Mol. Eq.
Model <1 g active10s mL scale
Large-scale >100 g activeMultiple L scale
Fix process variability using input from modelling studies
Oxidation of a polysaccharide for conjugate vaccine production
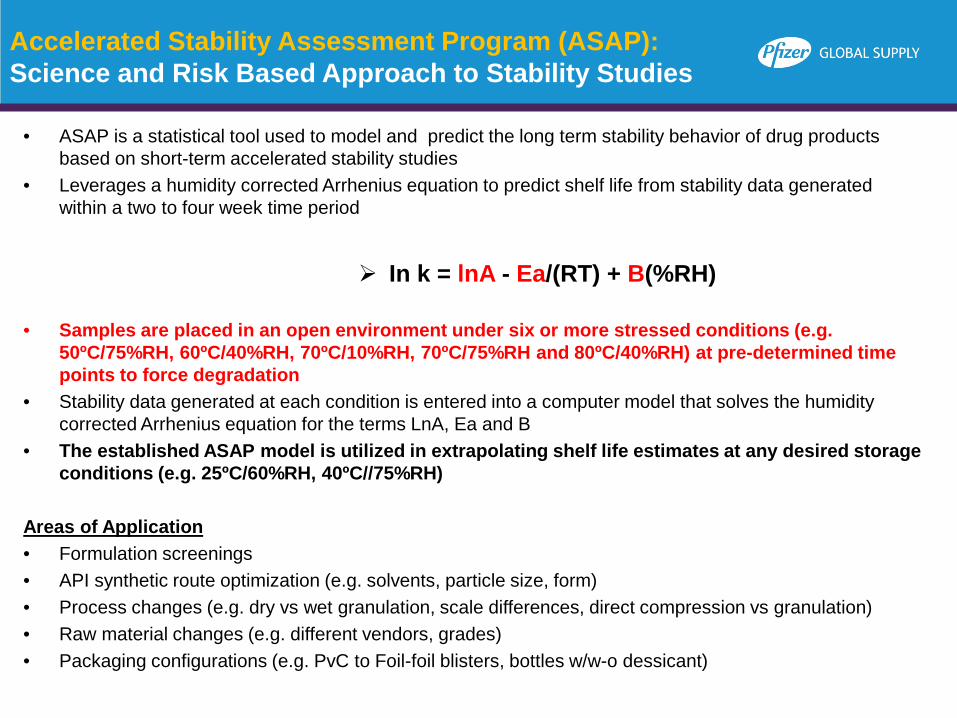
Accelerated Stability Assessment Program (ASAP): Science and Risk Based Approach to Stability Studies
• ASAP is a statistical tool used to model and predict the long term stability behavior of drug products based on short-term accelerated stability studies
• Leverages a humidity corrected Arrhenius equation to predict shelf life from stability data generated within a two to four week time period
In k = lnA - Ea/(RT) + B(%RH)
• Samples are placed in an open environment under six or more stressed conditions (e.g. 50ºC/75%RH, 60ºC/40%RH, 70ºC/10%RH, 70ºC/75%RH and 80ºC/40%RH) at pre-determined time points to force degradation
• Stability data generated at each condition is entered into a computer model that solves the humidity corrected Arrhenius equation for the terms LnA, Ea and B
• The established ASAP model is utilized in extrapolating shelf life estimates at any desired storage conditions (e.g. 25ºC/60%RH, 40ºC//75%RH)
Areas of Application• Formulation screenings• API synthetic route optimization (e.g. solvents, particle size, form)• Process changes (e.g. dry vs wet granulation, scale differences, direct compression vs granulation)• Raw material changes (e.g. different vendors, grades)• Packaging configurations (e.g. PvC to Foil-foil blisters, bottles w/w-o dessicant)

Knowledge Management ToolPharma InvestigatorTM Home Screen
PFDs, Risk Assessment Studies
©Copyright 2014 Light Pharma Inc. All rights reserved.
Organize Process & Parameters
QRM
Investigations Control Strategy Summaries
KM
KM13

Risk and Knowledge Management
• Risk – Product Lifecycle– Growth phase – scale-up & transfer, optimization; new
sites, new/different equipment, new raw material suppliers, experts move on to other products
– KM approaches• Continue RA approach for all significant changes• On-Line/At-Line PAT applications to look for “differences” as well as key
parameters• Use metrics (process capability) to identify highest variability• Ensure all product knowledge is accessed (Process Understanding Plan)• Ensure all data from similar products/unit operations available• Populate models with data – tune parameters (APC)

PAT - API Example
Risk: New API process being scaled up at launch facility. Development lab runs showed potential to form two polymorphs for step 2 product. One polymorph does not filter well. Risk discussed during co-development risk assessment process and associated cross functional PAT discussions. Risk of isolation challenges and quality issues at scale up.
Risk mitigation : Supersaturation control enabled by process analytics was used to develop an optimised crystallisation cooling profile to reduce the risk of forming the wrong polymorph. Innovative approach to control particle size distribution based on process understanding and knowledge.
Result:Modified cooling profile implemented at plant scale during successful validation campaign.
The plot above shows the solubility curve calculated using MIR and FBRM data.
Staying between the two curves delivers product with the correct particle size
distribution and polymorph composition

PAT Bio DS Example
Risk: Variability in molecular weight observed at lab scale during development of new vaccine. Risk to clinical supply.
Risk mitigation : Process and Analytical experts from development and manufacturing connected via internal cross functional ‘knowledge sharing’ forum (IPA). Focus on rapidly building process understanding using process analytics and identifying control strategy to address the risk.
Result:Innovative process analytical technology solutions used to understand how process parameters impacted molecular weight variability. Real time Mid IR integrated to control dissolved CO2 levels. Clinical material manufactured with consistent molecular weight. Target Product Quality Profile achieved.
• Connecting people and knowledge
• Process driven innovation
• Risk Reduction

PAT Aseptic DP Example
Risk: pH conversion by NaOH addition from an insoluble API to a soluble salt has to be stopped when the solution is clear. Process risk - Excess NaOH precipitates a non-recoverable white paste.
Risk mitigation : Process knowledge and process monitoring key. Use of both turbidity meter and stoichiometric chemical addition tracking provide clear target to the zero end point, thus mitigating risk.
Result:Process Understanding + real time process knowledge allows risk mitigation
Turbidity monitoring
Conversion Control

Metrics To Identify RiskProcess Capability
10%
90%
19%
81%
~150 studies with ~1800 QAs31%
69%
Acquired/In-licensed Non-QbD: 9/8/11
Legacy Products
New Products
In-Licensed
Pie charts represent total attributes evaluatedGreen = Cpk>1, Red = Cpk<1

Judging Capability – Using Process Robustness Contours!
Attribute Content Uniformity
(AV)
Dissolution (4 hour)
Impurity x Potency Total Impurities
Yield
Specs <15% 35 – 55% <0.2% 95 – 105% <1% >90%3.24 52.56 0.09 100.95 0.12 93.397.64 53.96 0.07 96.89 0.16 93.84
DATA 9.57 51.63 0.12 99.71 0.21 94.912.73 47.86 0.11 99.85 0.18 94.498.79 54.60 0.06 98.88 0.19 93.103.98 49.89 0.05 97.85 0.23 94.28
• Example: Dissolution: All values are within specification acceptance criteria• Don’t just look at the tabulated data; plot it [mean (x-axis) and SD (y-axis)]• Plot summarizes the data set; where does the “X” lie and should it be repositioned
19
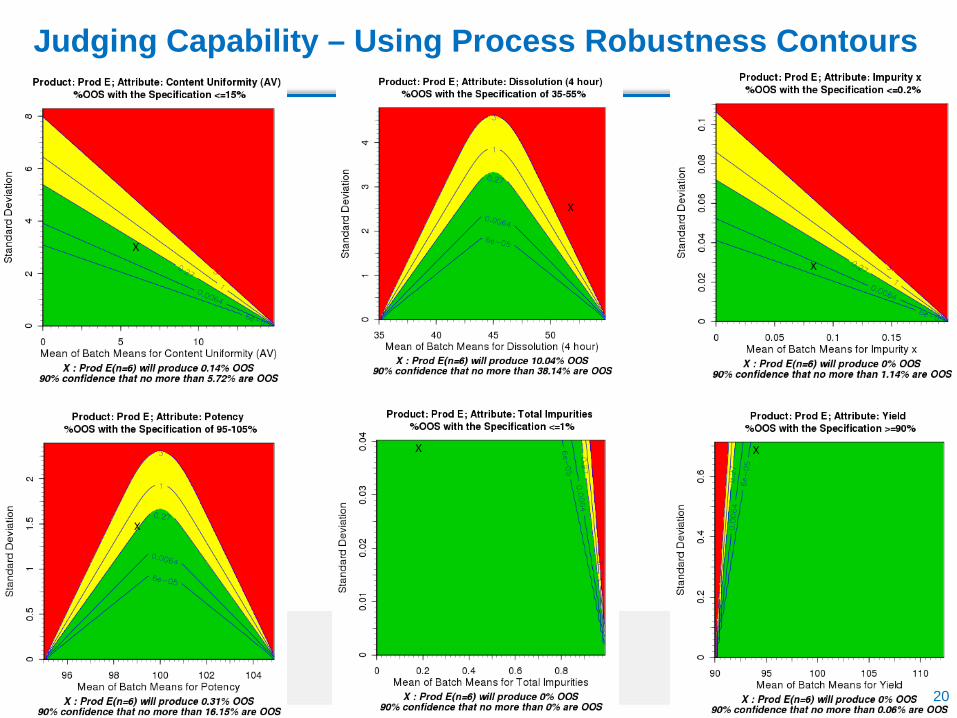
Judging Capability – Using Process Robustness Contours
20
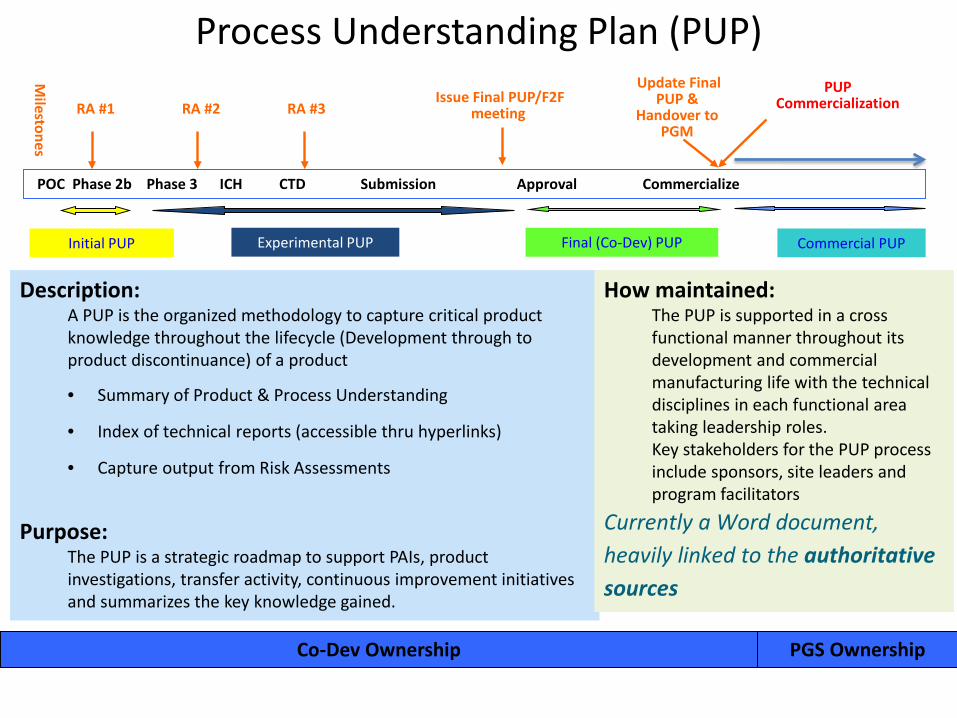
Co-Dev Ownership PGS Ownership
POC Phase 2b Phase 3 ICH CTD Submission Approval Commercialize
Initial PUP Experimental PUP Final (Co-Dev) PUP Commercial PUP
RA #1 RA #2 RA #3Issue Final PUP/F2F
meeting
Update Final PUP &
Handover to PGM
Milestones
PUP Commercialization
Description:A PUP is the organized methodology to capture critical product knowledge throughout the lifecycle (Development through to product discontinuance) of a product
• Summary of Product & Process Understanding
• Index of technical reports (accessible thru hyperlinks)
• Capture output from Risk Assessments
Purpose:The PUP is a strategic roadmap to support PAIs, product investigations, transfer activity, continuous improvement initiatives and summarizes the key knowledge gained.
How maintained:The PUP is supported in a cross functional manner throughout its development and commercial manufacturing life with the technical disciplines in each functional area taking leadership roles.Key stakeholders for the PUP process include sponsors, site leaders and program facilitators
Currently a Word document, heavily linked to the authoritative sources
Process Understanding Plan (PUP)

Product Transfer Risk Assessment Methodology
Build Process in Pharma Investigator
Cause & EffectRisk assessment
Failure mode and effect analysis
API-DP risk assessment
Feedback Loop / Lessons Learned
Building the model to explain the process and the chemistry to another colleague
Capture historical & current process challenges (process, equipment, quality, analytical etc.,Capture subject matter expert tacit knowledge about the processIdentifies gaps in process understanding and challenges assumptions
How will the process fit into the receiving sites equipment & are there sufficient controls in place
What is the DP sites experience with changes to the physical / chemical properties of the API –what is the potential impact on the drug product formulation
Identifies where there is a need; to establish a baseline for transfer – where additional experimentation is needed such as process or analysis, mxing modelling etc.,
Did the process behave as predicted or did the transfer team identify the most obvious sources of risk to control

Multivariate Soft Sensor Model tablet bed temperature during coating
Model Calibration: 3-component PLS model & Predictive Performance
Variable Importance Plot
Y Tablet Bed Temperature
X
Inlet TemperatureExhaust TemperatureSolution Flow Inlet Air FlowInlet Fan VSD Speed (Hz)Exhaust Fan VSD Speed (Hz)to Room PressureDrum Load PressureBypass Valve Open FeedbackPlenum Seal PressureDrum Motor VSD Speed (Hz)Atomising Air FlowPattern Air FlowInlet Dew Point (Humidity)Exhaust Dew Point
Process Inputs & Output
4 inputs were used to create a robust Dynamic ARX-PLS Softsensor – used as back up to IR sensor (blinds sometimes)
22
24
26
28
30
32
34
36
38
40
42
44
46
48
7/21/2
011 8:0
5:00 P
M
7/21/2
011 9:1
9:00 P
M
7/21/2
011 10
:34:00
PM
7/21/2
011 11
:49:00
PM
7/22/2
011 1:0
4:00 A
M
7/22/2
011 2:1
9:00 A
M
7/22/2
011 3:3
4:00 A
M
7/22/2
011 4:4
9:00 A
M
7/22/2
011 6:0
4:00 A
M
7/22/2
011 7:1
9:00 A
M
7/22/2
011 8:3
4:00 A
M
7/22/2
011 9:4
9:00 A
M
7/22/2
011 11
:04:00
AM
7/22/2
011 12
:19:00
PM
7/22/2
011 1:3
4:00 P
M
7/22/2
011 2:4
9:00 P
M
7/22/2
011 4:0
4:00 P
M
7/22/2
011 5:1
9:00 P
M
7/22/2
011 6:3
4:00 P
M
7/22/2
011 7:4
9:00 P
M
7/22/2
011 9:0
4:00 P
M
7/22/2
011 10
:19:00
PM
7/22/2
011 11
:34:00
PM
7/23/2
011 12
:49:00
AM
7/23/2
011 2:0
4:00 A
M
7/23/2
011 3:1
9:00 A
M
7/23/2
011 4:3
4:00 A
M
7/23/2
011 5:4
9:00 A
M
7/23/2
011 7:0
4:00 A
M
7/23/2
011 8:1
9:00 A
M
7/23/2
011 9:3
4:00 A
M
7/23/2
011 10
:49:00
AM
7/23/2
011 12
:04:00
PM
7/23/2
011 1:1
9:00 P
M
7/23/2
011 2:3
4:00 P
M
7/23/2
011 3:4
9:00 P
M
7/23/2
011 5:0
4:00 P
M
7/23/2
011 6:1
9:00 P
M
7/23/2
011 7:3
4:00 P
M
7/23/2
011 8:4
9:00 P
M
7/23/2
011 10
:04:00
PM
7/23/2
011 11
:19:00
PM
7/24/2
011 12
:34:00
AM
7/24/2
011 1:4
9:00 A
M
7/24/2
011 3:0
4:00 A
M
Obs ID (Primary)
YPredPS[3](Tablet Bed Temperature PV)YVarPS(Tablet Bed Temperature PV)
SIMCA-P+ 12.0.1 - 2012-03-13 14:52:39 (UTC-5)
Model Prediction (Black) vs Existing IR Sensor
Coater Opened
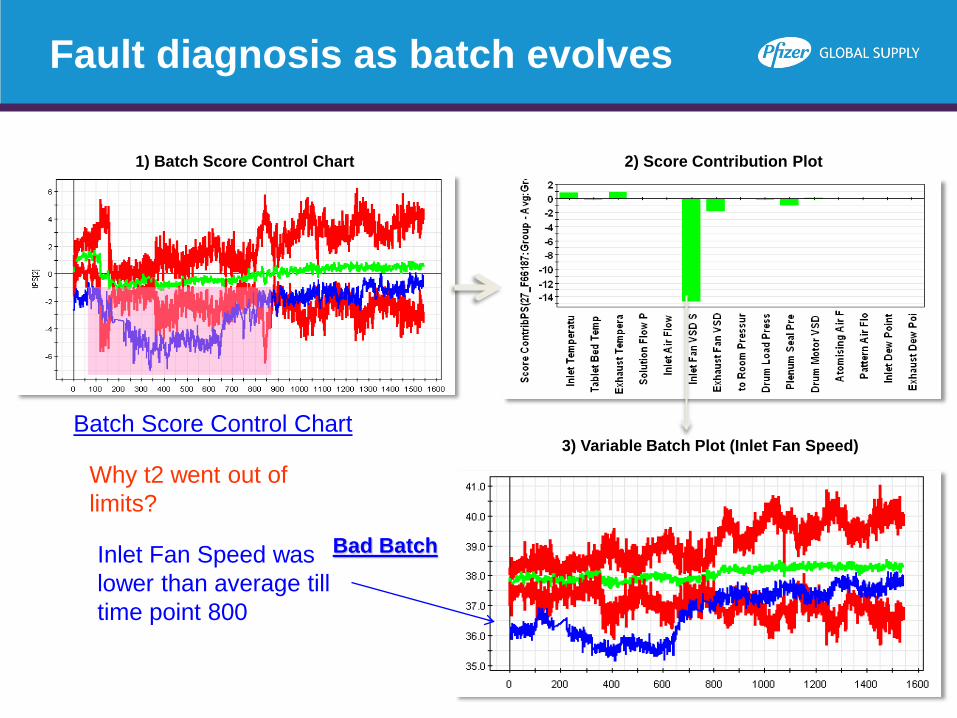
Fault diagnosis as batch evolves
1) Batch Score Control Chart 2) Score Contribution Plot
3) Variable Batch Plot (Inlet Fan Speed)Batch Score Control Chart
Bad BatchInlet Fan Speed was lower than average till time point 800
Why t2 went out of limits?

Soft Sensor PSD (D50)
• Captures major process dynamics impacting PSD
• Based on Population balance models
• Takes into account wet granulation step parameters as well as drying
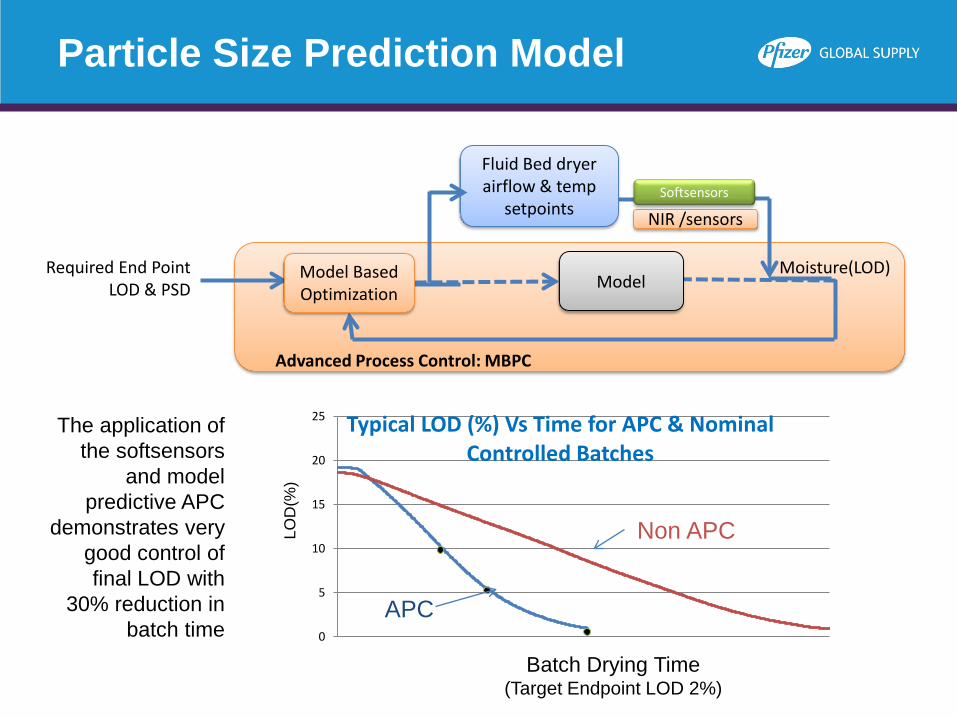
Particle Size Prediction Model
0
100
200
D-v
alu
es (
mic
rons)
The softsensor is used to predict and control particle attrition in fluid bed dryer
Particle Size Prediction Model
0
5
10
15
20
25 Typical LOD (%) Vs Time for APC & Nominal Controlled Batches
ModelRequired End Point
LOD & PSD
Advanced Process Control: MBPC
Fluid Bed dryer airflow & temp
setpoints
Moisture(LOD)Model Based Optimization
NIR /sensorsSoftsensors
APC
Non APC
Batch Drying Time (Target Endpoint LOD 2%)
LOD
(%)
The application of the softsensors
and model predictive APC
demonstrates very good control of final LOD with
30% reduction in batch time

Risk and Knowledge Management
• Risk – Product Lifecycle– Mature Phase – transfer (partners/CMOs), reduction in
tech support & response time, changes in specs/standards/methods
– KM approaches• Continue RA approach for all significant changes• Focus on major events (transfers) – deep dive RA (understand control
strategy vs accept)• Maintain PUP – requires discipline & easy on-line system• Ensure all data from similar product

Risk and Knowledge Management
• Risk – Technology– SM API – physical properties– Solid Oral – physical & chemical stability, content
uniformity, dissolution– Biologicals DS – lot-lot comparability (degree of
conjugation, glycosilation), transfer/scale-up, analytical characterization (chemical & biological assays), contamination
– Aseptic – sterility, particulates, temperature (cold chain)

Traditional Small Molecule Pharmaceutical Biologic
Small Molecules vs. BiologicsBiologic Production Process Is More Complex
Bioreactor Centrifugation
Affinity Chromatograph
y
Tangential Flow
Filtration
Ion Exchange(Cation)
Ion Exchange
(Anion)
Viral Retention
Filter
Tangential Flow
Filtration
Lyophilize Formulation
Distribution Supply Chain
Conventional Small Molecule Pharmaceuticals• Less complex chemical process• Multiple ways to manufacture a product • Straightforward controls and monitoring• Less risk of biologic growth or contamination
Biologic Products• Complex, multistep manufacturing process involving
biologic organisms• Product depends upon proprietary process• Elaborate controls and monitoring• Favorable environment for growth of biologic
contaminants (bioburden)
Ingredients Excipient addition
Mixing/blending
CompressionFormulation
29

Traditional Small Molecule Pharmaceutical Biologic
Small Molecules vs Bios- Complexity and Structure
1. Kresse GB. Biosimilars—Science, status, and strategic perspective. Eur J Pharm Biopharm. 2009;72(3):479-486. 2. In: Cooper GM, Hausman RE. The Cell: A Molecular Approach.3rd Ed. 2004:366-369.
• Well-defined stable structure held together by strong chemical bonds
Spatial structures (secondary & tertiary) based on relatively weak bonds and post-translational modifications to form the 3D conformation
30
Small Molecule Drugs
Biologic Drugs
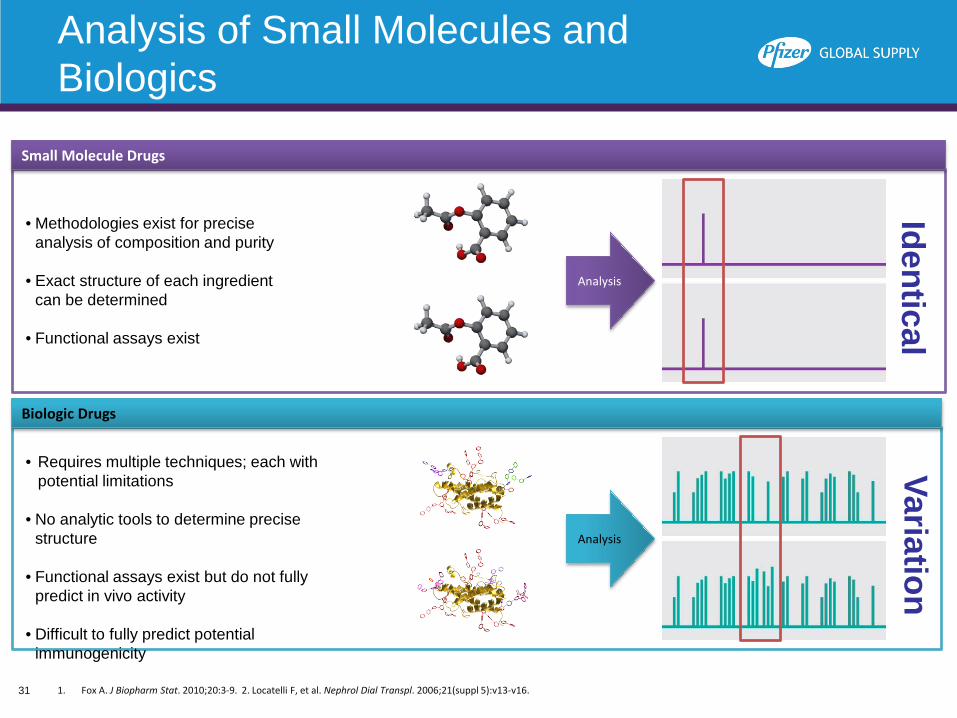
Analysis of Small Molecules and Biologics
1. Fox A. J Biopharm Stat. 2010;20:3-9. 2. Locatelli F, et al. Nephrol Dial Transpl. 2006;21(suppl 5):v13-v16.
• Methodologies exist for precise analysis of composition and purity
• Exact structure of each ingredient can be determined
• Functional assays exist
• Requires multiple techniques; each with potential limitations
• No analytic tools to determine precise structure
• Functional assays exist but do not fully predict in vivo activity
• Difficult to fully predict potential immunogenicity
Analysis
Analysis
IdenticalVariation
31
Risk and Knowledge Management
• Knowledge Management Approaches– Gather information/expertise by product AND by technology– Platform technology models can be applied across products– Standardize on equipment, nomenclature, KM recording
approaches– Many tools, approaches used – no single parameter or
approach can completely characterize Risk• NONE OF THIS WORKS without engagement of
colleagues.– Visible Commitment from Leadership– Examples Demonstrating Value– Tools (user-friendly)– Training, Support, Patience ….

33
PGS Leveraging People, Process, & Technology for a holistic approach to KM and business results
Critical process and business knowledge, capturing tacit
knowledge of subject matter experts
Leveraging subject matter experts, global colleagues
help solve problems, surface replication opportunities
Information findability, increase information & knowledge reuse,
culture of information/ knowledge curation
Connecting systems to extract and transform data to enable new knowledge and insights,
KM Strategy Element Focus Driving
-Regulatory Compliance (efficiency & performance)- Decision making/problem solving
-Cost efficiencies -Product Supply Reliability-Colleague engagement-Colleague capabilities
-Cost efficiencies -Product Supply Reliability-Colleague engagement
-Regulatory Compliance-Decision making/problem solving- Agility


Acknowledgments
• Vince McCurdy• Paige Kane• Brian Fitzpatrick• Mojgan Moshgbar• Llurellyn Malcolm• Kim Vukovinsky• Steve Hammond
• Joe Brennan• Mark Hand• Seamus O’Neill• Enda Moran• Tom Lantz• Edel Hughes• GK Raju (LightPharma)
Contact Details:Kevin NepveuxVP Global Technology Services, Pfizer Global Manufacturing [email protected]
For the PGS KM Program: [email protected]