africa’s skill tragedy: does teachers’ lack of knowledge ... · pdf filedoes...
TRANSCRIPT

Africa’s Skill Tragedy: Does Teachers’ Lack of Knowledge Lead to Low Student Performance? Jan Bietenbeck, Marc Piopiunik, and Simon Wiederhold

Africa’s Skill Tragedy:
Does Teachers’ Lack of Knowledge Lead
to Low Student Performance?∗
Jan Bietenbeck
Lund University and IZA
Marc Piopiunik
Ifo Institute and CESifo
Simon Wiederhold
Ifo Institute and CESifo†
Student performance in Sub-Saharan Africa is tragically low. We study the importance of
teacher subject knowledge for student performance in this region using unique international
assessment data for sixth-grade students and their teachers. To circumvent bias due to unob-
served student heterogeneity, we exploit variation withinstudents across math and reading. We
find that teacher subject knowledge has a modest impact on student performance on average.
However, this effect is substantially larger for students with access to textbooks, which indicates
important complementarities between teacher knowledge and school resources. Results are
robust to adding teacher fixed effects and not driven by sorting.
JEL Code: I21, J24, O15
Keywords: teacher knowledge, student performance, Sub-Saharan Africa
∗We thank Martin Abel, Manuel Arellano, Manuel Bagues, DavidDorn, Joshua S.Goodman, Eric A. Hanushek, Ricardo Hausmann, Asim Khwaja, Frank Neffke, RandallReback, Ludger Woessmann, and seminar participants at the Ifo Institute for helpful comments.We are grateful to SACMEQ for providing the data used in the empirical analysis in thispaper. Bietenbeck acknowledges funding from the Spanish Ministry of Science and Innovation(BES-2011-050947). Wiederhold is thankful for the hospitality provided by the Centerfor International Development at Harvard University, and is especially grateful to RicardoHausmann, Ljubica Nedelkoska, and Frank Neffke. Wiederhold also greatly appreciates thefinancial support provided by the Fritz Thyssen Foundation for financing the research stay atHarvard University.
†Piopiunik (corresponding author): Ifo Institute, Poschingerstraße 5, 81679 Munich,Germany; Email: [email protected]; Phone: +49 89 9224 1312.Bietenbeck: Lund University,P.O. Box 7082, 220 07 Lund, Sweden; Email: [email protected]. Wiederhold: IfoInstitute, Poschingerstraße 5, 81679 Munich, Germany; Email: [email protected].

1 Introduction
Developing countries have made considerable progress in increasing school enrollment over
the past few decades (Glewwe et al., 2013). However, children in these countries are learning
remarkably little in school. For instance, in a large-scaleassessment across Sub-Saharan
African countries, sixth-grade students were asked to choose the correct formula for calculating
the number of remaining pages in a 130-page book when the first78 pages have already been
read. Only 30% of the students were able to answer this question correctly. In comparison,
two-thirds of fourth-grade students from OECD countries answered this question correctly.
Even in the worst-performing OECD country, the United Kingdom, fourth-grade students did
substantially better than the averagesixth-grade student in Sub-Saharan Africa.1 Moreover, the
average performance of students in Sub-Saharan Africa is dismal compared to students in other
countries at the same stage of economic development (see, e.g., Hanushek and Woessmann,
2012, for a comparison with students in India). These are alarming findings for Sub-Saharan
Africa since previous studies have shown that it is the skills of the population, and not the num-
ber of years spent in school, that drive economic growth (Hanushek and Woessmann, 2012).
While average student performance is dramatically low in Sub-Saharan Africa, there are
also substantial differences between countries. For example, correct-answer rates for the math
question described above range from 14% in Malawi to almost 50% in Kenya and Tanzania.
This variation is unlikely to be explained by differences inschool resources, given that the most
convincing evidence from randomized interventions shows at best small effects of resources on
student performance (see Murnane and Ganimian, 2014, for a survey). In contrast, a growing
literature documents the importance of teachers for student learning (see Jackson et al., 2014,
1These figures are based on data from the Southern and Eastern Africa Consortium forMonitoring Educational Quality (SACMEQ) and from the ThirdInternational Mathematicsand Science Study (TIMSS), respectively. The question reads: “Tanya has read the first 78pages of a book that is 130 pages long. Which number sentence could Tanya use to findthe number of pages she must read to finish the book?” Studentshad to choose between thecorrect answer, 130−78= X , and three incorrect answers: 130+78= X , X −78= 130, and130/78= X . Other questions that are comparable across these two assessments reveal similarlylarge differences in the performance of Sub-Saharan African students and their younger peersin developed countries.
1

for a recent overview), suggesting a role for teacher quality in explaining the observed cross-
country differences in student performance.
In this paper, we use unique data from 13 Sub-Saharan Africancountries that provide
consistent measures of teacher subject knowledge as one main dimension of teacher quality.2
We estimate the causal effect on student performance of having a teacher with higher subject
knowledge, exploiting the fact that both students and theirteachers were tested in two subjects,
math and reading. This allows us to identify the effect of teacher subject knowledge only from
differences within students between math and reading, thuseliminating any unobserved student
heterogeneity that is constant across subjects. The specifications additionally control for several
subject-specific teacher characteristics and school resources.
We find that teacher subject knowledge has a positive and significant impact on student per-
formance. Our student fixed-effects results indicate that increasing teacher subject knowledge
by one standard deviation (SD) raises student performance by about 0.03 SD. Assuming that the
variation in teacher effectiveness in Sub-Saharan Africa is similar to that in the United States,
this implies that teacher subject knowledge explains about20% of the variation in teachers’
overall effectiveness.3
By far the most popular policy in developing countries for increasing student performance
is to provide additional resources, in particular, more textbooks. Contrary to popular belief,4
however, rigorous evaluation studies from Sub-Saharan Africa which randomized textbook
provision have shown that textbooks have little impact on student achievement on average.
For example, Glewwe et al. (2009) find that providing free textbooks to primary schools in
Kenya does not improve the performance of the average student, but benefits those students
who performed well before the intervention. Rationalizingthis finding, the authors argue
that the English-language textbooks were too difficult to read for most students. Similarly,
2We draw on the 2000 and 2007 assessments of SACMEQ, a collaboration between AfricanMinistries of Education and the UNESCO International Institute for Educational Planning.
3This estimate is based on the midpoint (= 0.15 SD) of the range of estimates on how muchstudent performance increases when teacher value-added increases by one SD in the UnitedStates (Jackson et al., 2014). This figure is in line with recent evidence on teacher value-addedfrom India (Azam and Kingdon, 2015).
4For instance, the World Bank regularly publishes reports which emphasize that providingtextbooks to all students is essential to improving the quality of learning in Sub-Saharan Africa(most recently, Fredriksen et al., 2015).
2

Sabarwal et al. (2014) find no impact on student performance from the provision of textbooks
to schools in Sierra Leone. The authors attribute this zero effect to implementation problems
since only few textbooks were actually distributed to students (but instead kept in storage).5
We suspect that providing textbooks might fail to improve students’ performance because
many teachers lack the (subject) knowledge necessary to make productive use of them. We
investigate this hypothesis by interacting teacher subject knowledge with the availability of
subject-specific textbooks during class. To identify a causal interaction effect, we exploit
within-student across-subject variation in both teacher knowledge and textbook availability.
We find that textbook availability increases student performance only when students are taught
by teachers with high subject knowledge, indicating that teacher knowledge and textbook
availability are complements in educational production.6 In contrast, and consistent with the
existing literature, textbook availability is ineffective in raising student performance for the
average teacher.7
Several robustness checks support a causal interpretationof both the main effect of teacher
subject knowledge and its interaction with textbook availability. For instance, results are robust
to restricting the sample to students taught by the same teacher in both subjects, thus also
holding constant any teacher characteristics that do not differ across subjects. We can also
restrict our analysis to schools with only one sixth-grade classroom, excluding the possibility
that students are assigned to teachers based on teachers’ specific knowledge in one subject.
Results are furthermore qualitatively similar if we focus on rural schools, suggesting that they
are not driven by across-school sorting of students or teachers.
Finally, we gauge the extent to which differences in teachersubject knowledge are respon-
sible for the large cross-country differences in student performance in Sub-Saharan Africa.
5A zero impact of textbooks on student performance is also found in non-experimentalwork exploiting within-student variation (Kuecken and Valfort, 2013) and not limited to Sub-Saharan Africa (Das et al., 2013). In particular, the latterstudy finds no overall effect on studentperformance of a randomly-assigned school grant (which wasmostly spent on books and othermaterials) in India, arguing that households have offset the intervention by reducing their ownspending on these inputs.
6This finding is in line with Abeberese et al. (2014), who find significantly positive effectsof a reading program in the Philippines that provided age-appropriate reading material tofourth-gradersand trained teachers to use the textbooks in their class (and also supported thesemeasures with a 31-day reading marathon).
7Note that this result cannot be explained by a failure of distributing textbooks to studentsbecause we use the actual availability of textbooks during class, as reported by students.
3

To this end, we simulate how much student performance in a given country would increase
if the country’s average teacher subject knowledge was raised to the level in the country
with the most knowledgeable teachers, holding everything else constant. Our back-of-the-
envelope calculation suggests that these effects would be modest in all countries (at most 0.05
SD). However, given that teacher knowledge and textbooks are complements in educational
production, simultaneously increasing teacher knowledgeand textbook availability (to the level
of the country with the best textbook endowment) leads to substantially larger improvements in
student performance (up to 0.20 SD). Both the increase in teacher knowledge and in textbook
availability assumed in our simulation analysis seem feasible. First, the average level of teacher
performance appears to be very low in all Sub-Saharan African countries compared to devel-
oped economies. Second, recent estimates by the UNESCO suggest that the current number of
textbooks available in Sub-Saharan Africa could be tripledwithout an increase in government
funds if efficiency in textbook procurement was improved (UNESCO, 2016).
Our work is related to the literature on the determinants of student achievement, which
mostly deals with developed countries, particularly with the United States. This literature
shows that teachers differ greatly in their ability to enhance student learning (see Jackson et al.,
2014, for a review). However, easily-observed teacher characteristics, such as education,
gender, and teaching experience (except for the first few years) are not consistently related
to teacher effectiveness (Hanushek and Rivkin, 2006). The only teacher trait consistently as-
sociated with gains in student performance is teacher cognitive skills as measured by achieve-
ment tests (e.g., Eide et al., 2004; Hanushek, 1986; Hanushek and Rivkin, 2006; Rockoff et al.,
2011).8 Hanushek et al. (2016) also find positive effects of teacher cognitive skills on student
achievement across OECD economies. However, in contrast tothis paper, the authors do not
observe the skills of individual teachers, but instead relyon country-level measures of teacher
skills. Moreover, our measures of teacher subject knowledge reflect the knowledge that is
essential for teaching the material included in the curriculum, and therefore differ considerably
from more general teacher ability measures that most of the previous literature has used.
8The evidence for teachers’ scores on licensure tests affecting student performance is mixed(Clotfelter et al., 2006; Harris and Sass, 2006; Goldhaber,2007).
4

In the context of developing countries, several studies have found positive correlations
between teacher test scores and student achievement.9 However, these studies likely suffer
from bias due to omitted student and teacher characteristics and non-random sorting of students
and teachers. Metzler and Woessmann (2012) circumvent these problems by exploiting within-
teacher within-student variation across two subjects for sixth-grade students and their teachers
in Peru, finding a significant impact of teacher skills on student achievement. In contrast to our
study, the authors focus only on a single country and do not investigate the interplay between
teacher quality and school resources.10
This study contributes to the literature by providing the first rigorous evidence on the
importance of teacher subject knowledge for student learning in a large group of developing
countries with the lowest-performing students worldwide.Furthermore, we are the first to
identify a complementarity between teacher knowledge and textbooks, a frequently emphasized
input in the educational process in developing countries. This finding yields new insights for
both researchers and policymakers. On the one hand, it helpsto understand why existing
evaluation studies have found zero average effects of textbooks on student performance. On the
other hand, given that the subject knowledge of many teachers in Sub-Saharan Africa is very
poor, it suggests that increasing the availability of textbooks without simultaneously improving
teacher quality may not be effective as a strategy for promoting student learning in Sub-Saharan
Africa.
The remainder of the paper is structured as follows. Section2 describes the data and reports
descriptive statistics. Section 3 lays out the estimation strategy. Section 4 presents the results
regarding the effect on student learning of teacher subjectknowledge and its complementarity
with textbook availability and other school resources. Section 5 reports results from robustness
checks, addressing potential biases from omitted teacher traits and non-random sorting across
9See, for example, Santibanez (2006) for Mexico, Marshall (2009) for Guatemala, andBehrman et al. (2008) for Pakistan. In the context of Kenya, Duflo et al. (2015) study theimpact of teacher incentives on student performance. See Behrman (2010), Glewwe et al.(2013), and Murnane and Ganimian (2014) for recent overviews of the literature on theeducation production function in developing countries.
10Three other studies aim at identifying the impact of teachersubject knowledge on studentperformance using the SACMEQ data, but they substantially differ from our paper. Shepherd(2015) restricts her attention to a single country (South Africa) and Altinok (2013) uses asimple OLS model without student fixed effects. Hein and Allen (2013) focus primarily onother teacher characteristics such as experience.
5

and within schools. Section 6 presents simulations of the effect on student performance of
increasing teacher subject knowledge to the level of the best-performing country. Section 7
concludes.
2 Data and Descriptive Statistics
In this section, we first introduce the data. We then describeour sample selection and provide
descriptive statistics, including cross-sectional and longitudinal correlations between student
performance and teacher subject knowledge at the country level.
2.1 The SACMEQ Assessments
The empirical analysis draws on data from the Southern and Eastern Africa Consortium for
Monitoring Educational Quality (SACMEQ), a collaborativenetwork of 15 Sub-Saharan African
Ministries of Education and the UNESCO International Institute for Educational Planning
(IIEP). The network periodically conducts international assessments of the math and reading
knowledge of sixth-grade primary-school students and their teachers. By means of student,
teacher, and principal questionnaires, it also collects detailed background information on stu-
dent and teacher characteristics as well as on classroom andschool resources. The first of the
three waves of the assessment conducted to date took place inseven countries in 1995, the
second wave in 14 countries in 2000, and the third wave in 15 countries in 2007. In this paper,
we use data from the last two waves because teachers were not tested in the first wave.
SACMEQ employs a two-stage clustered sampling design to draw nationally representative
samples of sixth-grade students for each participating country. Schools are sampled within pre-
defined geographical strata in the first stage, and a simple random sample of students is drawn
from each selected school in the second stage. In the second wave, 20 students per school were
sampled randomly, and the teachers who taught math and reading to these students were tested.
In the third wave, 25 students per school were sampled randomly, and the math and reading
6

teachers of the three largest classes in each school were tested.11 While all students are tested
in both math and reading, teachers are tested only in the subject they teach. However, both
math and reading scores are available for a subsample of teachers who teach sampled students
in both subjects. Throughout our analysis, we use student sampling weights to account for this
complex sampling design.
Importantly, the student assessments are designed to reflect the elements common to the
math and language curricula in the participating countries. The multiple-choice tests contain
items developed by SACMEQ as well as items from other international student assessments
such as the Trends in International Mathematics and ScienceStudy (TIMSS). Students in all
participating countries are administered the same tests atthe end of sixth grade. Tests are
translated into the local language of instruction if it is different from English. The teacher
tests include items from the student assessment and additional, more difficult questions. Both
student and teacher tests are graded centrally in each country under the auspices of the IIEP.
Using Item Response Theory, all test scores are placed on a common scale with mean 500 and
standard deviation 100 across students participating in the second SACMEQ wave. Because of
the overlapping items, test scores are directly comparablebetween students and teachers as well
as between the two assessment waves. The similarity betweenstudent and teacher tests also
means that teacher test scores in SACMEQ reflect knowledge that is likely highly relevant for
teaching math and reading. Therefore, these curriculum-based measures of teacher knowledge
differ noticeably from other teacher test scores, for instance, SAT and ACT scores in the United
States, which reflect teachers’ general cognitive ability.
2.2 Sample Selection and Descriptive Statistics
We pool the data from the second and third wave of the SACMEQ assessment. From initially
15 countries, we exclude Mauritius because it did not test teachers. Furthermore, teachers in
South Africa were not tested at all in the second wave and could opt out of the assessment in the
third wave, which 18% of the sampled teachers did. As this might lead to an unrepresentative
11The sampling design of the third wave implies that teacher test scores are missing forstudents who did not attend any of the three largest classes.As described in Section 2.2, allstudents with missing teacher test scores are excluded fromthe sample.
7

sample, we also exclude South Africa from the analysis.12 We further exclude from the sample
5,428 students who could not be linked to a teacher in any subject, 4,018 students who had
at least one teacher with missing test scores, and 225 students with missing test scores.13
The final estimation sample consists of 74,708 students with8,742 teachers in 3,939 schools
in the following 13 countries: Botswana, Kenya, Lesotho, Malawi, Mozambique, Namibia,
Seychelles, Swaziland, Tanzania (mainland), Uganda, Zambia, Zanzibar (semi-autonomous
region of Tanzania), and Zimbabwe.14
Table A-1 reports descriptive statistics of student performance and teacher subject knowl-
edge for the pooled sample and separately for each country. There are striking differences in
student performance between countries. For example, in math, students in Kenya score on
average more than 1.4 international SD higher than studentsin Zambia. Similarly, in reading,
students in the Seychelles score more than 1.5 international SD higher than their peers in
Malawi. Interestingly, the cross-country differences in teacher subject knowledge are even
larger. Teachers in Kenya, for example, outperform teachers in Zanzibar by 2.2 international
SD in math; the variation in teacher reading knowledge is of asimilar magnitude.15 Figures
A-1 and A-2 further illustrate these large cross-country differences by plotting each country’s
distribution of teacher test scores and, as a benchmark, theaverage test score of teachers in the
best-performing country (separately for math and reading).
To put the observed variation in teacher subject knowledge into perspective, we compare
it to the subject-knowledge variation between teachers with different levels of education. For
instance, in the pooled sample, the average math test score is 734 points for teachers with
12Opting out (by either students or teachers) was not possiblein any other country. Resultsare robust to retaining South Africa in the sample.
13As usual, some background variables have missing values. Since we consider a large setof explanatory variables and since a portion of these variables is missing for a relatively largefraction of students, dropping all student observations with any missing value would result insubstantial sample reduction. We therefore imputed missing values for control variables byusing the country-by-wave means. To ensure that imputed data are not driving our results,all our regressions include an indicator for each variable with missing data that equals 1 forimputed values and 0 otherwise.
14All these countries participated in the second and third SACMEQ wave, except Zimbabwe,which participated only in the third wave.
15As expected, in each country, the average teacher significantly outperforms the averagestudent in both math and reading. However, in all countries,the best students outperform theworst teachers.
8

only primary education and 822 points for teachers with tertiary education. This difference
is equivalent to 0.8 international SD in teacher subject knowledge in math. In other words,
the difference in teacher math knowledge between the country with the best-performing teach-
ers and the country with the worst-performing teachers is almost three times as large as the
difference between teachers with tertiary education and teachers with primary education (in
reading, this ratio is about two). Another way to illustratethe substantial differences in teacher
subject knowledge across countries is to consider individual test items. For instance, teachers
participating in SACMEQ were asked to answer the following math question: “x/2 < 7 is
equivalent to (a)x > 14, (b) x < 14, (c) x > 5, or (d) x < 7/2?” 83% of teachers in Kenya
answered this question correctly, but only 43% of teachers in Lesotho did so.16
These large cross-country differences notwithstanding, teachers in Sub-Saharan Africa ap-
pear to possess dramatically less knowledge than teachers in developed countries. While there
is no dataset that would allow a direct comparison between African teachers and teachers in
developed countries, we can compare the math knowledge of teachers in Sub-Saharan Africa
to that of eighth-grade students in developed countries. Inthe TIMSS 1995 assessment, eighth-
grade students were asked to solve the same math question described above (“x/2 < 7 is
equivalent to”). In 19 out of 39 mostly developed countries,eighth-grade students did as well or
even better than teachers in the worst-performing Sub-Saharan country (Lesotho), and in four
countries they did even better than the average teacher in Sub-Saharan Africa. Moreover, 47%
of eighth-grade students in the United States could solve this math question, and—judging by
this item alone—are therefore at the level of teachers in Botswana and Namibia.17
16Even bigger cross-country differences arise for the following item: “If the height of a fenceis raised from 60cm to 75cm, what is the percentage increase in height: (a) 15%, (b) 20%, (c)25%, or (d) 30%?” Here, the spectrum of correct answer rates ranges from 18% in Zanzibar to88% in Kenya.
17These comparisons even overestimate the relative performance of teachers in Sub-SaharanAfrica because they faced only four different answer options in the SACMEQ assessment,whereas the eighth-grade students in TIMSS had to choose among five possible answers.
9

2.3 Relationship Between Student Performance and Teacher Subject Knowl-
edge at the Country Level
To get a first sense of the importance of teacher subject knowledge for student performance,
we plot average student test scores against average teachertest scores at the country level. The
upper panel of Figure 1 reveals a positive association between teacher subject knowledge and
student performance in both math and reading. Students in countries with highly knowledge-
able teachers tend to perform better than their peers in countries with teachers who have less of
a command of the material they are teaching.
The availability of both student and teacher performance measures is a unique feature of
the SACMEQ assessments. Other international student assessments contain at best coarse
measures of teacher quality such as teachers’ educational attainment. To provide suggestive
evidence that teacher subject knowledge is a better predictor of student performance than
teachers’ educational credentials, the bottom panel of Figure 1 plots a country’s average student
performance against the share of teachers with a college degree. Unlike subject knowledge,
educational credentials appear to explain little if any of the cross-country variation in student
performance in math or reading.18
The cross-sectional correlation between teacher subject knowledge and student perfor-
mance might of course be driven by numerous unobserved factors that are correlated with
teacher subject knowledge at the country level, such as the overall quality of the education
system. As a first step to mitigate the influence of such correlated unobservables, we exploit
the availability of two waves of the SACMEQ assessment and plot changes in teacher subject
knowledge between 2000 and 2007 against the analogous changes in student performance.
Figure 2 shows for both math and reading that student performance tends to improve in those
countries where the subject knowledge of teachers increases. The figure also reveals that
student performance improved in most countries during thisseven-year period, which is also
true for teachers’ knowledge in reading (but less so in math).
18A qualitatively similar picture emerges if we instead use the share of teachers whocompleted at least secondary school.
10

Overall, Figures 1 and 2 suggest that teacher subject knowledge is an important determinant
of student performance. We assess this hypothesis more rigorously in Section 4 using student-
level regressions.
3 Estimation Strategy
In the baseline OLS model, we estimate the following education production function:
yikcs = α +βTkcs + γ1Xics+ γ2Xcs+ γ3Xs+µtextbookikcs +δZkcs +ξcountry + εikcs, (1)
whereyikcs is the test score of studenti in subjectk (math or reading) in classroomc in school
s; Tkcs is the test score of studenti’s teacher in subjectk; Xics is a vector of student-level
subject-invariant controls measuring student and family background;Xcs is a vector of subject-
invariant classroom and teacher characteristics; andXs is a vector of subject-invariant school
characteristics.textbookikcs equals 1 if a student uses a textbook in subjectk by herself during
class or shares a textbook in subjectk with only one other student; zero otherwise.Zkcs contains
classroom and teacher characteristics that vary across subjects (e.g., the availability of teacher
guides in math or reading).19 ξcountry denotes country fixed effects which absorb any country-
specific differences in student performance.20 εikcs is an error term with mean zero.21
Interpreting the OLS estimate ofβ as the causal effect of teacher subject knowledge on
student performance is problematic because of omitted variables that might be correlated with
both student and teacher test scores. For instance,β would be biased upward if high-educated
parents select schools or classrooms with better teachers and also foster their children’s learn-
ing in other ways. Similarly, student sorting across or within schools would lead to biased
estimates if students with high (unobserved) academic ability are more likely to attend schools
or classrooms with highly knowledgeable teachers.
19See Table A-2 for a complete list of control variables.20The country fixed effects also control for potential cross-country differences in school
curricula or in the timing of national examinations.21Additionally, we include a wave dummy in all specifications.To simplify notation, we
drop the wave dummy and the wave subscripts in all equations.
11

To overcome these sources of bias, we exploit the fact that students were tested in two
subjects and ask whetherdifferences in teacher knowledge between math and reading are
systematically related todifferences in student performance between the same two subjects.
This implies that we identify the effect of teacher subject knowledge only from variation
between teacher math and reading knowledge within the same student.22 We thus estimate
the following first-differenced model, which we implement by pooling the two subjects math
and reading and adding student fixed effects to Equation (1):
yics,math − yics,read = β (Tcs,math −Tcs,read) (2)
+µ(textbookics,math − textbookics,read)
+δ (Zcs,math −Zcs,read)+(εics,math − εics,read).
This model controls for the influence of any student-level performance determinants that are
not subject-specific, such as family background, overall academic ability, or general motivation.
It also eliminates the impact of school resources that do notdiffer across subjects, such as
availability of black boards, chairs, and computers. Therefore, estimates from the student fixed-
effects model are not biased by student sorting across or within schools, as long as such sorting
is not subject-specific. In robustness checks, we provide evidence that our estimates are also
unlikely to be biased by subject-specific sorting.23
While the within-student model in Equation (2) ensures thatthe estimates are not con-
founded by any subject-invariant student characteristics, unobserved teacher traits could still
bias the coefficient on teacher subject knowledge. For example, if teachers with high subject
knowledge are also more motivated (not observed in the data), a positive estimate ofβ might
partly reflect the impact of high motivation. The fact that about one-third of the students in our
sample were taught by the same teacher in math and in reading allows us to rigorously address
this issue in a robustness check. Specifically, by restricting the sample to students taught in both
22Within-student across-subject variation has been exploited in previous studies (e.g., Dee,2005, 2007; Clotfelter et al., 2010; Lavy, 2015).
23In contrast to the OLS model, the impact of teacher subject knowledge in the fixed-effectsmodel is “net” of teacher knowledge spillovers across subjects.
12

subjects by the same teacher (same-teacher sample), we can control for any teacher traits that
affect students’ math and reading performance in the same way.24 The corresponding results
suggest that our student fixed-effects estimates are not biased by correlated teacher traits.25
To investigate whether teacher subject knowledge is more effective when students have
access to a textbook in that subject during class, we estimate the following interaction model
(again pooling the two subjects and including student fixed effects):
yics,math − yics,read = β (Tcs,math −Tcs,read) (3)
+γ(Tcs,math × textbookics,math−Tcs,read × textbookics,read)
+µ(textbookics,math − textbookics,read)
+δ (Zcs,math −Zcs,read)+(εics,math− εics,read).
The parameter of interest in this model,γ, tells us whether the impact of teachers’ math
(reading) knowledge on student performance is stronger when students have access to a math
(language) textbook during class. This within-student analysis is feasible since students report
textbook usage during class separately for math and reading.
4 Results
We first document a positive association between student performance and teacher subject
knowledge at the individual level. We then present the estimates from the student fixed-
effects model, which identifies the effect of teacher subject knowledge only from variation
within students across subjects. Finally, we provide evidence that the impact of teacher subject
24Using the same-teacher sample is equivalent to adding teacher fixed effects in Equation (2),thus exploiting only variation within students and within teachers.
25While we control for any differences between teachers that are similar across subjects—most importantly, motivation and pedagogical skills—our results might still be affected bysubject-specific teacher traits (e.g., particularly high motivation in one subject) if correlatedwith subject knowledge. However, it seems likely that non-subject-specific teacher traitsdiffer much more between teachers than do subject-specific traits within teachers. Still, asin Metzler and Woessmann (2012), our results should be interpreted as the impact of teachersubject knowledge and any subject-specific trait correlated with it.
13

knowledge systematically differs with school resources, particularly with the availability of
subject-specific textbooks.
4.1 Ordinary Least Squares Results
Table 1 reports estimates of the association between student performance and teacher subject
knowledge in math (Panel A) and in reading (Panel B) based on the model in Equation (1). In
addition to an increasing set of control variables at the student, classroom, school, and teacher
level, all specifications include country fixed effects.26 To facilitate interpretation of effect
sizes, both student and teacher test scores are standardized with mean 0 and standard deviation
1 across countries and waves. Throughout our analysis, we cluster standard errors at the school
level to account for potential correlation of the error termwithin schools.
The results in Table 1 show a strong positive association between teacher subject knowledge
and student performance in both math and reading, which is inline with the positive country-
level correlation illustrated in Figure 1. In the most parsimonious specification which includes
only country fixed effects, a one SD increase in teacher subject knowledge is associated with a
0.11 SD increase in student performance in both subjects (Column 1). This association becomes
weaker when student, classroom, and school characteristics are added as controls, but remains
highly statistically significant (Columns 2–4). Interestingly, the coefficient on teacher subject
knowledge changes only slightly when teacher characteristics, such as educational attainment
and experience, are also controlled for (Column 5). In this most restrictive specification, a
one SD increase in teacher subject knowledge is associated with a 0.07 (0.05) SD increase in
student performance in math (reading).
Table A-2 reports the estimated coefficients on the remaining control variables from the
regressions in Column 5 of Table 1. Covariates generally enter the regressions with the expected
signs. For instance, female students perform worse than male students in math but not in read-
ing, and students with highly-educated parents perform better in both subjects. Furthermore,
student performance is negatively related to class size andpositively related to the availability of
26Note that because the regressions in Table 1 use only within-country variation, thecoefficients do not correspond to the cross-country correlations in the upper panel of Figure1.
14

subject-specific textbooks during class. In line with existing evidence on the detrimental effects
of teacher absenteeism, teacher absence is negatively associated with student performance.27
Finally, several teacher characteristics are significantly associated with student performance.
For example, female teachers and teachers with higher education levels tend to have better-
performing students. We also observe a positive association between student performance and
teachers having at least some subject-specific training, whereas teacher experience is unrelated
to student performance.28
4.2 Student Fixed-Effects Results
As discussed in Section 3, the OLS estimates in Table 1 are likely biased due to omitted
variables and non-random sorting across or within schools.Therefore, we now turn to the
student fixed-effects models that identify the impact of teacher subject knowledge only from
within-student variation between math and reading. The results, shown in Table 2, indicate
that teacher subject knowledge has a positive and statistically highly significant impact on
student performance. As expected, the coefficients in the fixed-effects models are substantially
smaller than the corresponding OLS estimates: when controlling for subject-specific classroom
and teacher characteristics, a one SD increase in teacher subject knowledge raises student
performance by 0.026 SD (Column 3).29
The smaller estimate in the fixed-effects model compared to the OLS model suggests that
there are unobserved student characteristics correlated with both student and teacher test scores
which bias the OLS estimates upward. Another possible explanation is that attenuation bias due
to measurement error in teacher subject knowledge is aggravated in the fixed-effects model (see
Angrist and Krueger, 1999, Chapter 4). In the Appendix, we show how the reliability ratios of
27See Banerjee and Duflo (2006) and Chaudhury et al. (2006) for overviews on absenteeismin the education and health sector, and Spaull (2011) for a discussion of teacher absenteeismin Sub-Saharan Africa. Duflo et al. (2012) provide evidence that paying teachers bonuses forattending school significantly reduces teacher absenteeism, which in turn increases studentperformance.
28Due to the large number of control variables, and for ease of exposition, we do not reportcoefficients on ten family resources in Table A-2 (all coefficients have the expected signs).Results are available on request.
29Besides teacher subject knowledge, the only statisticallysignificant explanatory variablesare a dummy for female teachers and a dummy for teachers having access to a teaching guidefor their subject; the coefficients on both variables are positive.
15

the teacher math and reading tests can be used to correct for measurement error. We find that
the measurement-error-corrected coefficient on teacher subject knowledge is almost 50% larger
than the baseline estimate (0.039 SD instead of 0.026 SD). However, a caveat of this correction
procedure is that it hinges on several (strong) assumptions, for example, that measurement
errors in math and reading are uncorrelated. While the measurement error correction suggests
that our baseline coefficient on teacher subject knowledge is likely downward biased, due to
these (strong) assumptions it is hard to pin down the exact magnitude of this bias. Therefore,
we prefer reporting only the uncorrected, more conservative, estimates throughout the paper.
Figure 3 displays a non-parametric version of the regression in Column 3 of Table 2. To
create this binned scatterplot, we first regress student andteacher test scores on the student fixed
effects and the other control variables. We then divide the residualized teacher test scores into
20 equal-sized groups and plot the mean value of the residualized teacher test scores in each bin
against the mean value of the residualized student test scores. The binned scatterplot indicates
that the conditional expectation of student performance appears to be linear throughout the
distribution of teacher subject knowledge.30
One important question concerning the interpretation of these results is whether our esti-
mate captures the impact of teacher subject knowledge of only a single school year or rather the
cumulative effect over several school years. Unfortunately, as is the case for other international
assessments like PISA or TIMSS, the SACMEQ data do not contain information about how
long each teacher has been teaching a particular class. However, there is ample evidence that
teacher turnover in Sub-Saharan Africa is high, with annualattrition rates ranging between 5
and 30 percent (Mulkeen et al., 2007). Moreover, a study fromtwo Malawian school districts
finds that almost 50 percent of 188 teachers who began the school year were not teaching the
same class nine months later (IEQ, 2000).31 Given this high turnover in the teacher workforce,
30In Table A-3, we explore whether the effect of teacher subject knowledge on studentperformance depends on the gender of the student or teacher.The results suggest thatparticularly students who are taught by a teacher of the samegender benefit from higherteacher subject knowledge, which is in line with Metzler andWoessmann (2012). We alsofind that, conditional on subject knowledge, both male and female teachers are more effectiveat teaching students of their own gender; this is consistentwith evidence from India reported inMuralidharan and Sheth (Forthcoming).
31One reason for these high attrition rates is that primary-school teachers often enroll inupgrading programs, which allow them to advance to secondary-school teaching or to move to
16

our estimate likely captures a short-run effect of teacher subject knowledge on student per-
formance. Importantly, if our estimate indeed reflects a short-run effect, the improvements in
student performance from raising the subject knowledge of teachers acrossall grade levels will
likely be substantially larger than our modest point estimate indicates.
4.3 Complementarity between Teacher Subject
Knowledge and School Resources
The most popular education policies in developing countries involve the provision of addi-
tional resources such as textbooks. However, rigorous evaluation studies have shown that such
policies often fail to improve student learning (for an overview, see Murnane and Ganimian,
2014). One candidate explanation for this finding is the prevalence of low-quality teachers in
developing countries, who lack the necessary knowledge andskills to make productive use of
these resources. Containing information on a variety of school inputs, the SACMEQ data allow
to rigorously examine the potential complementarity between teacher subject knowledge and
school resources in Sub-Saharan Africa. To do so, we add the respective school resource both
as main term and interacted with teacher subject knowledge to the model in Equation (2). The
results are presented in Table 3.
The most important school resource is textbook availability during class, a crucial education
input that is often lacking in Sub-Saharan Africa.32 Since each student reports the availability of
textbooks separately for math and reading, we exploit within-student across-subject variation in
both teacher knowledge and textbook availability to identify a causal interaction effect between
both education inputs.33 Column 1 of Table 3 shows that the student performance increase
other careers. Moreover, the prevalence of HIV/AIDS in a region may increase teacher attrition(Lewin, 2002).
32In our sample, for example, about 40% of students report thatthey either have no textbookat all or have to share a textbook with two or more classmates.
33In the SACMEQ background questionnaire, students were asked “How are themathtextbooks used in your classroom during the lessons?”, withfive answer categories: (1) Thereare no math textbooks; (2) Only the teacher has a math textbook; (3) I share a math textbookwith two or more pupils; (4) I share a math textbook with one pupil; (5) I use a math textbook bymyself. The analogous question was asked aboutreading textbooks. In line with Glewwe et al.(2009), we group students who use a textbook by themselves and students who share a textbookwith only one other student because all these students can effectively use a textbook duringclass (in this case, our binary textbook variable equals 1; 0otherwise). This categorization isalso consistent with experimental evidence from the Philippines that providing one textbook
17

resulting from a 1 SD increase in teacher subject knowledge is more than twice as large
when textbooks are available during class compared to when textbooks are not available. This
indicates that teacher knowledge and textbooks are important complements in the education
production function. In line with existing evaluation studies, textbooks have no impact on
student performance for the average teacher (i.e., teachers with average subject knowledge).
This finding suggests that low teacher quality might explainwhy providing physical inputs by
themselves have often proven to be so little effective in raising student performance.
In Columns 3 to 5 of Table 3, we consider the complementarity between teacher subject
knowledge and other school resources. The results on these interactions are, however, only
suggestive because these resource variables are not subject specific and are furthermore mea-
sured at the school level only. Since identification relies on variation across schools, these
interaction effects may be driven by differences in school management or in school quality
more generally. Against this background, it is worth notingthat the interaction between teacher
subject knowledge and aschool-level measure of textbook availability—averaged across math
and reading—is also positive and statistically significantas is the well-identified interaction
that exploits within-student between-subject variation (Column 2).34
The SACMEQ data contain information on the availability of alarge variety of school
resources (reported by principals), ranging from classroom endowments with boards, chairs,
and tables to access to drinking water. We combine all 31 school resources surveyed in
SACMEQ into a single index by counting the number of available resources. In line with
the complementarity between teacher knowledge and textbook availability, Column 3 suggests
that the effectiveness of teacher knowledge is enhanced by such resources.
In addition to physical resources, we also investigate the interaction between teacher knowl-
edge and other school inputs. We find no significant interaction between teacher subject
for every two students and providing one textbook for each student has very similar effects ontest scores (Heyneman et al., 1984). The sample mean of our binary textbook variable is 0.56for math and 0.58 for reading.
34To facilitate interpretation of results, we normalize all school-level variables to have mean0 and standard deviation 1, such that the main effect of teacher subject knowledge reflects theimpact at the sample mean of the respective resource variable. Therefore, the magnitudes ofthe interaction terms in Columns 1 and 2 are not directly comparable. Because the school-level variables do not vary across subjects, their main effects on student performance cannot beestimated.
18

knowledge and class size, suggesting that teachers with thesame level of subject knowledge
are as effective in large classrooms as in small ones (Column4). The negative interaction
between teacher knowledge and a school-level index of teacher absenteeism suggests that the
impact of teacher subject knowledge is weaker among teachers who are regularly absent from
the classroom (Column 5).35 This makes intuitive sense: higher teacher subject knowledge can
translate into more student learning only if teachers are actually teaching their students.36
Overall, the results in Table 3 yield a consistent picture: the transmission of knowledge from
teachers to students is facilitated by the presence of educational resources such as textbooks.
Therefore, improving both teacher knowledge and simultaneously adding resources might lead
to substantial improvements in student performance.
5 Robustness Checks
The student fixed-effects model identifies the impact of teacher subject knowledge from varia-
tion between math and reading within students. Therefore, the model accounts for any sorting
of students across and within schools that is based on non-subject-specific factors such as
overall ability. However, the estimates in Section 4 might still be biased if students (or teachers)
sort on the basis of subject-specific factors. For example, if students who are particularly
interested in math manage to attend schools with particularly good math teachers, the estimated
impact of teacher subject knowledge would be biased upward.Similarly, the teacher knowledge
impact would be biased upward if school principals tend to assign proficient math students
to teachers with high math knowledge. To examine whether ourestimates are biased due to
subject-specific sorting, we perform several robustness checks, reported in Table 4.
35To construct this index, we combine information from schoolprincipals on how oftenteachers in their school (i) arrive late, (ii) skip classes,and (iii) are not present at all. Wetake the simple average across the three indicators, with answers ‘never’, ‘sometimes’, and‘often’ coded as 0, 1, and 2, respectively. Descriptive statistics of this index show that teacherabsenteeism is a pervasive phenomenon in Sub-Saharan Africa: almost 95% of schools in oursample suffer from at least some teacher absence, and in 8% ofschools, all three dimensionsof teacher absence occur ‘often’.
36SACMEQ also contains information on the number of days students were absent fromschool during the month before the survey. As expected, we find that students who are moreoften absent benefit less from highly knowledgeable teachers. Results are available on request.
19

We first address the potential bias due to sortingacross schools by restricting the sample
to students living in rural areas, where students likely have little choice between different
schools. Column 1 shows that the coefficient on teacher subject knowledge decreases somewhat
compared to our baseline estimate in Table 2, but remains statistically significant. This indicates
that non-random sorting of students across schools is unlikely to affect our results.
Even in the absence of sorting across schools, matching of students to teacherswithin
schools based on subject-specific factors might bias our results. One way to address this con-
cern is to restrict the analysis to schools with only one sixth-grade classroom, which implies that
students cannot choose their teachers, and principals cannot assign students to teachers based
on relative subject performance. This yields a coefficient of similar magnitude as the baseline
estimate (Column 2). An alternative way of accounting for potential within-school sorting is
to aggregate teachers’ subject knowledge to the school level;37 this school-level measure of
teacher knowledge also shows an effect very similar to our baseline estimate (Column 3). In
sum, these results strongly suggest that our estimates do not suffer from any meaningful bias
due to sorting across or within schools.
Another concern is that our baseline estimate reflects not only the impact of teacher subject
knowledge, but also other, unobserved teacher characteristics correlated with subject knowl-
edge. For example, teachers with high subject knowledge might also have better pedagogical
skills than their peers with low subject knowledge, thus biasing the coefficient of interest
upward. We address this concern by restricting the sample tostudents taught both math and
reading by the same teacher. This analysis is equivalent to including teacher fixed effects in
the full sample. Identification in the same-teacher sample is therefore based only on variation
in subject knowledge between math and reading within the same teacher. Hence, all subject-
invariant teacher traits, such as pedagogical skills or absenteeism, that might affect student
performance are controlled for.
Table 5 reports results from regressions based on the same-teacher sample. In the simple
OLS models, the coefficients on teacher subject knowledge are only slightly smaller than those
in the full sample (Columns 1 and 2). Similarly, using the same-teacher sample leaves our
37For this analysis, all other teacher characteristics have been aggregated to the school levelas well.
20

baseline student fixed-effects results almost unchanged: when controlling for subject-specific
classroom characteristics, a one SD increase in teacher subject knowledge is estimated to raise
student performance by 0.024 SD (Column 4). These results indicate that unobserved subject-
invariant teacher characteristics are unlikely to bias ourbaseline estimates.38
The interaction effect between teacher subject knowledge and subject-specific textbook
access might suffer from the same potential biases as the main teacher knowledge effect.
Therefore, we conduct the same checks as in Tables 4 and 5 to assess the robustness of this
complementarity. Results are presented in Table 6. In Column 1, we replicate the baseline
estimate from Column 1 of Table 3 as a reference. Restrictingthe sample to students taught
both math and reading by the same teacher leads to an even stronger complementarity between
teacher knowledge and textbook availability (Column 2). Focusing on students in rural areas,
where students have little school choice, yields an interaction coefficient of very similar mag-
nitude as the baseline estimate (Column 3). This also holds when we focus on schools with
only one sixth-grade classroom (Column 4). Finally, aggregating teacher subject knowledge
(and all other teacher characteristics) to the school levelleads to a somewhat smaller, but
statistically significant interaction effect (Column 5). These results suggest that the estimated
complementarity between teacher subject knowledge and textbook availability does not suffer
from any meaningful bias due to omitted teacher characteristics or subject-specific sorting
across or within schools.
One potential remaining concern regarding this interaction effect arises when parents are
responsible for providing textbooks. If parents have limited resources and can afford to buy
only one textbook, they may purchase the textbook for the subject they deem more important.
But at the same time these parents may support their children’s learning—specifically in the
preferred subject—also in other ways (e.g., through helping with homework). If this was the
case, the coefficient on the interaction term would be biasedupward. However, this concern
seems to have little empirical support, given that we find a precisely estimated zero effect of
38We prefer estimating the effect of teacher subject knowledge in the full sample becausethe extent to which sixth-grade students are taught by the same teacher in both subjects varieswidely across countries. For example, all students in Zimbabwe are taught by the same teacherin both subjects, but only less than 1% of students in Mozambique are. Across all countries inour sample, 35% of students are taught by the same teacher in both subjects.
21

textbook availability on student performance (see Column 1of Table 6). Moreover, the main
source of textbook funding in Sub-Saharan Africa in primaryschool is the government (i.e.,
purchases by schools with government funding or free government supply to schools), while
parental provision becomes more prevalent in secondary school (Fredriksen et al., 2015).
Another issue is that the availability of subject-specific textbooks during class might reflect
the school’s emphasis on a particular subject (either math or reading). Because we exploit
variation across subjects, this might bias our results. Since we are mainly interested in the
interaction between teacher subject knowledge and textbook availability (and less in the effect
of textbook availability itself), our primary concern is that textbook availability is correlated
with teacher knowledge in the same subject in a school, whichwould suggest a focus on a par-
ticular subject. This, however, is not the case. Across all students and schools, the correlation
between teacher subject knowledge and textbook availability is close to zero (r =0.0067). At
the same time, teacher subject knowledge and textbook availability are completely uncorrelated
at the student level within schools (math:r =-0.0002; reading:r =-0.0079) and are only very
weakly correlated at the school level across schools (math:r =-0.0823; reading:r =0.1011).
Moreover, the school-level shares of students with access to math textbooks and of students
with access to reading textbooks are highly correlated (r =0.83), indicating that schools tend
not to focus on either subject.
A related concern is that students of teachers with high subject knowledge perform well
because their teachers spend more time teaching that subject. Although we cannot observe
subject-specific instruction time in the data, there are several reasons to suspect that our results
are not driven by between-subject differences in instruction time. First, the above correlations
show that teacher subject knowledge is uncorrelated with the availability of textbooks (i.e.,
another important education input), which suggests that schools tend not to focus on a particular
subject. Second, Metzler and Woessmann (2012) show for Peruthat including subject-specific
instruction time does not affect the estimate of the effect of teacher subject knowledge on
student performance.
Finally, differences in the extent to which English is spoken at home or at school might
bias our results. In the countries covered by SACMEQ, English is typically both the official
22

language of instruction and the test language. In practice,however, the dominant language of
instruction and the language which students use in their daily lives may not be English. In
particular, in “English-only” schools, all instruction and all conversation is in English. These
schools likely hire teachers with higher English-languageproficiency and also attract students
who regularly speak English outside the classroom. While English-only schools cannot be
identified in the data,39 we know to which extent (never, sometimes, or always) students speak
English at home. To assess whether our results are sensitiveto varying degrees of daily
English usage, we estimate models in which we interact teacher subject knowledge with the
school-specific share of students who always speak English at home. These estimates are
reported in Table 7. We find that both the effect of teacher subject knowledge on student
performance (Column 2) and the complementarity between teacher subject knowledge and
textbook availability (Column 4) are the same independent of whether there are few or many
English-always speakers at school (Columns 1 and 3 report the respective baseline estimates).40
Moreover, in line with Glewwe et al. (2009), we find that textbook availability is associated
with higher student performance only in schools with high shares of English-always speakers,
that is, students who are likely able to read the English-written textbooks (Column 4). Overall,
the results in Table 7 suggest that differences in English-language use between schools are
unlikely to bias our estimates.
6 Simulation Analysis
Our results indicate that better teacher subject knowledge—by itself and also in combination
with a higher textbook availability in class—significantlyimproves student performance in
Sub-Saharan Africa. In this section, we first provide back-of-the-envelope calculations of the
impact of raising each country’s average teacher subject knowledge to the level of knowledge
in the country with the most knowledgeable teachers, that is, Kenya in math and the Sey-
chelles in reading. These calculations will help in assessing the extent to which differences
39Unfortunately, information on language of instruction andtest language are not includedin the SACMEQ data.
40The school-level share of students speaking always Englishat home varies between 0%and 100%, with a mean of 23% at the individual level and of 25% at the school level.
23

in teacher subject knowledge are responsible for the large cross-country differences in student
performance observed in the data. Second, we simulate the impact on student performance of
simultaneously raising each country’s teacher subject knowledge (as before)and its textbook
availability (to the level of the country with the best textbook endowment, that is, Swaziland in
both subjects).41
Column 1 of Table 7 reports the difference in average teachersubject knowledge in math
between the indicated country and the country with the best-performing teachers (Column 5
reports the analogous difference for reading). Column 2 (Column 6) shows the corresponding
increase in student math (reading) performance if the country enhanced its teachers’ knowledge
to the level held by the best-performing teachers, evaluated at the current level of textbook
availability in that country. For countries with already highly knowledgeable teachers, such
as Zimbabwe, this would have only a weak impact (student-performance improvements of
0.01 SD in math and 0.02 SD in reading). For other countries, however, improvements would
be more substantial, albeit not large. For instance, our simulations indicate that the largest
improvements (for students in Lesotho and Zanzibar) would amount to about 0.05 SD in both
math and reading.
Column 3 reports the difference in math textbook availability between the indicated country
and the country with the highest availability of math textbooks (Column 7 reports the analogous
difference for reading textbooks). There is huge variationin textbook availability across coun-
tries. While almost all students in Swaziland have access toa subject-specific textbook, not
even every third student in Tanzania, Uganda, and Zimbabwe does. In light of these substantial
differences in textbook availability across Sub-Saharan African countries, increasing textbook
41The impact on student performance of the simulated increases in teacher knowledge andtextbooks is calculated as follows. Ignoring other controlvariables and omitting subscripts forsimplicity, we estimate the simple interaction modely = β0+β1T SK +β2books+β3(TSK ×books)+ u, wherey denotes student performance,T SK denotes teacher subject knowledge,andbooks denotes textbook availability. The total impact on studentperformance of increasingboth teacher knowledge and textbook availability then is:∆y = (β1+β3books)∆T SK+(β2+β3T SK)∆books+β3∆T SK ×∆books. For calculating the impact on student performance ofan increase in teacher knowledge alone,∆books = 0 andbooks equals the average textbookavailability in the respective subject and country (see Columns 2 and 6). For calculating theimpact of simultaneously increasing teacher knowledge andtextbooks, we setβ2 = 0 becauseof the precisely estimated zero effect of textbook availability on student performance (seeColumns 4 and 8). The calculations in Table 7 are based on the coefficients in Column 1of Table 3.
24

availability—together with teacher knowledge—is likely to have considerable leverage in im-
proving student performance.
The results of the counterfactual exercise of simultaneously increasing teacher knowledge
and textbooks are shown in Columns 4 (math) and 8 (reading). The simulation suggests
sizable improvements in student performance in many countries. For example, the estimated
math performance increase in Zimbabwe would now be 0.13 SD (as compared to 0.01 SD
for an increase in teacher math knowledge alone), reflectingthe poor textbook endowment of
Zimbabwean schools. Although its teacher knowledge is at the international average, Tanzania
would experience the largest student performance increasebecause textbook availability is by
far the lowest among all countries. Generally, the estimated impact on student performance is
much larger than before because two additional effects add to the effect from improving teacher
knowledge alone. First, teachers at their current knowledge level get more effective because
more textbooks are available; and, second, the increase in teacher knowledge also becomes
more effective because the availability of textbooks in thecountry improves.
To get an idea of how difficult it would be for teachers to catchup to the best-performing
country, consider again the math question “x/2< 7 is equivalent to” from Section 2. Only 58%
of the teachers in Sub-Saharan Africa were able to answer this simple math question correctly.
Moreover, only half the teachers could correctly answer thequestion “If the height of a fence
is raised from 60cm to 75cm, what is the percentage increase in height?”, with correct-answer
rates below 20% in some countries. Given the abysmal level ofteacher subject knowledge
suggested by these two items, there is likely substantial room for policy to improve teacher
skills in Sub-Saharan Africa. A similar argument can be maderegarding the availability of
textbooks in this region. For example, a recent report by theUNESCO estimates that by simply
re-organizing the procurement process for textbooks, the total number of textbooks available in
Sub-Saharan Africa can be tripled, from currently 72 million to 258 million (UNESCO, 2016).
In our sample across all countries, this would imply thatall students could share a textbook
with at most one other student, which indicates that our simulated improvement in textbook
availability is realistic.
25
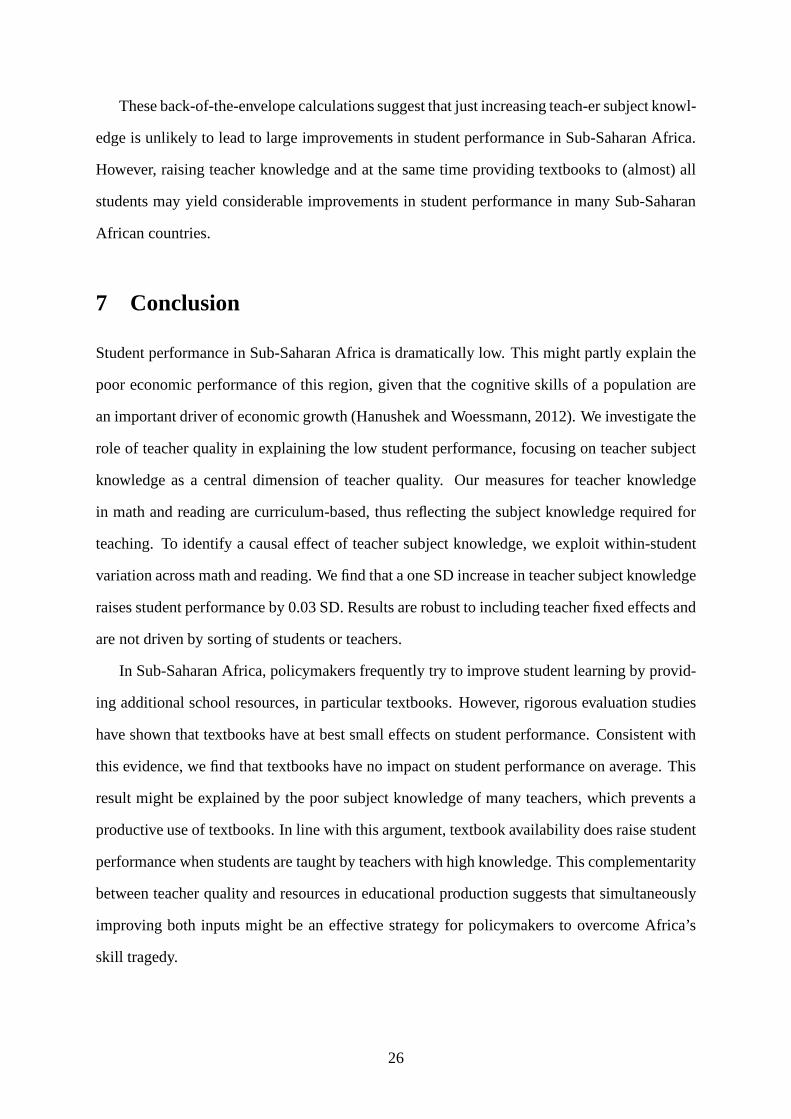
These back-of-the-envelope calculations suggest that just increasing teach-er subject knowl-
edge is unlikely to lead to large improvements in student performance in Sub-Saharan Africa.
However, raising teacher knowledge and at the same time providing textbooks to (almost) all
students may yield considerable improvements in student performance in many Sub-Saharan
African countries.
7 Conclusion
Student performance in Sub-Saharan Africa is dramaticallylow. This might partly explain the
poor economic performance of this region, given that the cognitive skills of a population are
an important driver of economic growth (Hanushek and Woessmann, 2012). We investigate the
role of teacher quality in explaining the low student performance, focusing on teacher subject
knowledge as a central dimension of teacher quality. Our measures for teacher knowledge
in math and reading are curriculum-based, thus reflecting the subject knowledge required for
teaching. To identify a causal effect of teacher subject knowledge, we exploit within-student
variation across math and reading. We find that a one SD increase in teacher subject knowledge
raises student performance by 0.03 SD. Results are robust toincluding teacher fixed effects and
are not driven by sorting of students or teachers.
In Sub-Saharan Africa, policymakers frequently try to improve student learning by provid-
ing additional school resources, in particular textbooks.However, rigorous evaluation studies
have shown that textbooks have at best small effects on student performance. Consistent with
this evidence, we find that textbooks have no impact on student performance on average. This
result might be explained by the poor subject knowledge of many teachers, which prevents a
productive use of textbooks. In line with this argument, textbook availability does raise student
performance when students are taught by teachers with high knowledge. This complementarity
between teacher quality and resources in educational production suggests that simultaneously
improving both inputs might be an effective strategy for policymakers to overcome Africa’s
skill tragedy.
26

References
Abeberese, Ama Baafra, Todd J. Kumler, and Leigh L. Linden.2014. “Improving Reading
Skills by Encouraging Children to Read in School: A Randomized Evaluation of the Sa Aklat
Sisikat Reading Program in the Philippines.”Journal of Human Resources, 49, 611–633.
Altinok, Nadir. 2013. “The Impact of Teacher Knowledge on Student Achievement in 14 Sub-
Saharan African Countries.” Mimeo.
Angrist, Joshua D. and Alan B. Krueger.1999. “Empirical Strategies in Labor Economics.”
in David Card and Orley Ashenfelter, eds.,Handbook of Labor Economics, Vol. 3 Part A,
Elsevier, pp. 1277–1366.
Azam, Mehtabul and Geeta Kingdon.2015. “Assessing Teacher Quality in India.”Journal
of Development Economics, 117, 74–83.
Banerjee, Abhijit and Esther Duflo. 2006. “Addressing Absence.”Journal of Economic
Perspectives, 20, 117–132.
Behrman, Jere R.2010. “Investment in Education: Inputs and Incentives.” inDani Rodrik and
Mark Rosenzweig, eds.,Handbook of Development Economics, Vol. 5, Elsevier, pp. 4883–
4975.
Behrman, Jere R., David Ross, and Richard Sabot.2008. “Improving Quality Versus
Increasing the Quantity of Schooling: Estimates of Rates ofReturn from Rural Pakistan.”
Journal of Development Economics, 85, 94–104.
Chaudhury, Nazmul, Jeffrey Hammer, Michael Kremer, Karthi k Muralidharan, and
F. Halsey Rogers.2006. “Missing in Action: Teacher and Health Worker Absencein
Developing Countries.”Journal of Economic Perspectives, 20, 91–116.
Clotfelter, Charles T., Helen F. Ladd, and Jacob L. Vigdor. 2006. “Teacher-Student
Matching and the Assessment of Teacher Effectiveness.”Journal of Human Resources, 41,
778–820.
27

Clotfelter, Charles T., Helen F. Ladd, and Jacob L. Vigdor.2010. “Teacher Credentials and
Student Achievement in High School: A Cross-Subject Analysis with Student Fixed Effects.”
Journal of Human Resources, 45, 655–681.
Das, Jishnu, Stefan Dercon, James Habyarimana, Pramila Krishnan, Karthik
Muralidharan, and Venkatesh Sundararaman. 2013. “School Inputs, Household
Substitution, and Test Scores.”American Economic Journal: Applied Economics, 5 (2): 29–
57.
Dee, Thomas S.2005. “A Teacher like Me: Does Race, Ethnicity, or Gender Matter?”
American Economic Review, Papers and Proceedings, 95, 158–165.
Dee, Thomas S.2007. “Teachers and the Gender Gaps in Student Achievement.” Journal of
Human Resources, 42, 528–554.
Duflo, Esther, Pascaline Dupas, and Michael Kremer.2015. “School Governance, Teacher
Incentives, and Pupil-Teacher Ratios: Experimental Evidence from Kenyan Primary
Schools.”Journal of Public Economics, 123, 92–110.
Duflo, Esther, Rema Hanna, and Stephen P. Ryan.2012. “Incentives Work: Getting Teachers
to Come to School.”American Economic Review, 102, 1241–1278.
Eide, Eric, Dan Goldhaber, and Dominic Brewer.2004. “The Teacher Labour Market and
Teacher Quality.”Oxford Review of Economic Policy, 20, 230–244.
Fredriksen, Birger, Sukhdeep Brar, and Michael Trucano.2015.Getting Textbooks to Every
Child in Sub-Saharan Africa: Strategies for Addressing the High Cost and Low Availability
Problem, Washington DC: World Bank.
Glewwe, Paul, Eric A. Hanushek, Sarah Humpage, and Renato Ravina. 2013. “School
Resources and Educational Outcomes in Developing Countries: A Review of the Literature
from 1990 to 2010.” in Paul Glewwe, ed.,Education Policy in Developing Countries,
University of Chicago Press, pp. 13–64.
28

Glewwe, Paul, Michael Kremer, and Sylvie Moulin.2009. “Many Children Left Behind?
Textbooks and Test Scores in Kenya.”American Economic Journal: Applied Economics, 1,
112–135.
Goldhaber, Dan.2007. “Everyone’s Doing It, But What Does Teacher Testing Tell Us About
Teacher Effectiveness?”Journal of Human Resources, 42, 765–794.
Hanushek, Eric A. 1986. “The Economics of Schooling: Production and Efficiency in Public
Schools.”Journal of Economic Literature, 24, 1141–1177.
Hanushek, Eric A. and Ludger Woessmann.2012. “Do Better Schools Lead to More
Growth? Cognitive Skills, Economic Outcomes, and Causation.” Journal of Economic
Growth, 17, 267–321.
Hanushek, Eric A. and Steven G. Rivkin.2006. “Teacher Quality.” in Eric A. Hanushek and
Finis Welch, eds.,Handbook of the Economics of Education, Vol. 2, Elsevier, pp. 1051–1078.
Hanushek, Eric A., Marc Piopiunik, and Simon Wiederhold. 2016. “The Value of Smarter
Teachers: International Evidence on Teacher Cognitive Skills and Student Performance.”
NBER Working Paper 20727.
Harris, Douglas and Tim R. Sass.2006. “Value-Added Models and the Measurement of
Teacher Quality.” Mimeo.
Hein, Christopher F. and Rebecca Allen.2013. “Teacher Quality in Sub-Saharan Africa:
Pupil-fixed Effects Estimates for Twelve Countries.” DoQSSWorking Papers 13-08.
Department of Quantitative Social Science, University College London.
Heyneman, Stephen P., Dean T. Jamison, and Xenia Montenegro. 1984. “Textbooks in the
Philippines: Evaluation of the Pedagogical Impact of Nationwide Investment.”Educational
Evaluation and Policy Analysis, 6, 139–150.
IEQ. 2000. “What Happened to the Teachers? Follow-Up on Teacher Mobility in Two Malawi
Districts.” Technical Report, Improving Educational Quality undertaken by: American
Institutes for Research in collaboration with Academy for Educational Development,
29

Education Development Center, Inc., Juarez and Associates, Inc., and University of
Pittsburgh. Washington, D.C.
Jackson, C. Kirabo, Jonah E. Rockoff, and Douglas O. Staiger. 2014. “Teacher Effects and
Teacher-Related Policies.”Annual Review of Economics, 6, 801–825.
Kuecken, Maria and Marie-Anne Valfort. 2013. “When Do Textbooks Matter for
Achievement? Evidence from African Primary Schools.”Economics Letters, 119, 311–315.
Lavy, Victor. 2015. “Do Differences in Schools’ Instruction Time ExplainInternational
Achievement Gaps? Evidence from Developed and Developing Countries.” Economic
Journal, 125, F397–F424.
Lewin, Keith M. 2002. “The costs of supply and demand for teacher education:dilemmas for
development.”International Journal of Educational Development, 22, 221–242.
Marshall, Jeffery H. 2009. “School Quality and Learning Gains in Rural Guatemala.”
Economics of Education Review, 28, 207–216.
Metzler, Johannes and Ludger Woessmann.2010. “The Impact of Teacher Subject
Knowledge on Student Achievement: Evidence from Within-Teacher Within-Student
Variation.” IZA Discussion Paper 4999.
Metzler, Johannes and Ludger Woessmann.2012. “The Impact of Teacher Subject
Knowledge on Student Achievement: Evidence from Within-Teacher Within-Student
Variation.” Journal of Development Economics, 99, 486–496.
Mulkeen, Aidan, David W. Chapman, Joan G. DeJaeghere, and Elizabeth Leu. 2007.
Recruiting, Retaining, and Retraining Secondary School Teachers and Principals in Sub-
Saharan Africa, Washington DC: World Bank.
Muralidharan, Karthik and Ketki Sheth. Forthcoming. “Bridging Education Gender Gaps
in Developing Countries: The Role of Female Teachers.”Journal of Human Resources.
30

Murnane, Richard J. and Alejandro J. Ganimian. 2014. “Improving Educational Outcomes
in Developing Countries: Lessons from Rigorous Evaluations.” NBER Working Paper
20284.
Rockoff, Jonah E., Brian A. Jacob, Thomas J. Kane, and Douglas O. Staiger.2011. “Can
You Recognize an Effective Teacher When You Recruit One?”Education Finance and
Policy, 6, 43–74.
Sabarwal, Shwetlena, David Evans, and Anastasia Marshak.2014. “The Permanent Input
Hypothesis: The Case of Textbooks and (No) Student Learningin Sierra Leone.” Policy
Research Working Paper 7021, Washington, DC: World Bank Group.
Santibanez, Lucrecia.2006. “Why We Should Care if Teachers Get A’s: Teacher Test Scores
and Student Achievement in Mexico.”Economics of Education Review, 25, 510–520.
Shepherd, Deborah L.2015. “Learn to Teach, Teach to Learn: A Within-Pupil Across-Subject
Approach to Estimating the Impact of Teacher Subject Knowledge on South African Grade
6 Performance.” Stellenbosch Economic Working Papers 01/15.
Spaull, Nicholas.2011. “Primary School Performance in Botswana, Mozambique, Namibia,
and South Africa.” SACMEQ Working Paper 8.
UNESCO. 2016. “Every Child Should Have a Textbook.” Global Education Monitoring
Report, Policy Paper 23.
31

Figures and Tables
Figure 1: Potential Determinants of Cross-Country Differencesin Student Performance
BOT
KEN
LES
MAL
MOZ
NAM
SEY
SWATAN
UGA
ZAM
ZAN
ZIM
400
450
500
550
600
Stu
dent
mat
h pe
rfor
man
ce
700 750 800 850 900 950
Teacher math knowledge
Math
BOTKEN
LES
MAL
MOZ
NAM
SEY
SWA
TAN
UGA
ZAM
ZAN ZIM
400
450
500
550
600
Stu
dent
rea
ding
per
form
ance
650 700 750 800 850
Teacher reading knowledge
Reading
Teacher subject knowledge
BOT
KEN
LES
MAL
MOZ
NAM
SEY
SWATAN
UGA
ZAM
ZAN
ZIM
400
450
500
550
600
Stu
dent
mat
h pe
rfor
man
ce
0 5 10 15 20 25
Share college−educated math teachers
Math
BOTKEN
LES
MAL
MOZ
NAM
SEY
SWA
TAN
UGA
ZAM
ZAN ZIM
400
450
500
550
600
Stu
dent
rea
ding
per
form
ance
0 5 10 15 20 25
Share college−educated reading teachers
Reading
Share of college−educated teachers
Notes: Solid lines fit a linear relationship between student performance and teacher subject knowledgein the top panel and between student performance and the share of college-educated teachers in thebottom panel. Share of college-educated teachers is the share of sixth-grade teachers with a collegedegree (based on SACMEQ data). Country abbreviations: BOT=Botswana, KEN=Kenya, LES=Lesotho,MAL=Malawi, MOZ=Mozambique, NAM=Namibia, SEY=Seychelles, SWA=Swaziland, TAN=Tanzania,UGA=Uganda, ZAM=Zambia, ZAN=Zanzibar, ZIM=Zimbabwe.

Figure 2: Changes in Student Performance and Teacher Subject Knowledgebetween 2000 and 2007
BOT
KEN
LES
MAL
MOZ
NAM
SEY
SWA
TAN
UGA
ZAMZAN
−40
−20
020
4060
Cha
nge
stud
ent m
ath
perf
orm
ance
−60 −40 −20 0 20 40 60
Change teacher math knowledge
Math
BOT
KEN
LES
MAL
MOZ
NAM
SEY
SWA
TAN
UGAZAM
ZAN
−40
−20
020
4060
Cha
nge
stud
ent r
eadi
ng p
erfo
rman
ce
−10 0 10 20 30
Change teacher reading knowledge
Reading
Notes: Solid lines fit a linear relationship between changes in student performance and changes in teachersubject knowledge between 2000 and 2007. Country abbreviations: BOT=Botswana, KEN=Kenya,LES=Lesotho, MAL=Malawi, MOZ=Mozambique, NAM=Namibia, SEY=Seychelles, SWA=Swaziland,TAN=Tanzania, UGA=Uganda, ZAM=Zambia, ZAN=Zanzibar. Zimbabwe did not participate in thesecond SACMEQ wave and is therefore excluded in this figure.

Figure 3: Effect of Teacher Subject Knowledge on Student Performance
−.0
4−
.02
0.0
2.0
4S
tude
nt p
erfo
rman
ce
−1 −.5 0 .5 1Teacher subject knowledge
Coef. = 0.026 (0.005)
Notes: The figure displays a binned scatterplot corresponding to the student fixed-effects model in Column3 of Table 2; see notes to Table 2 for list of control variables. To construct the figure, we first regressmath and reading test scores of students and teachers separately on all control variables, including studentfixed effects. We then divide the teacher test score residuals into 20 ranked equal-sized groups and plotthe mean of the student test score residuals against the mean of the teacher test score residuals in eachbin. The best-fit line, the coefficient, and the standard error (clustered at the school level) are calculatedfrom regressions on the micro data.

Table 1: Ordinary Least Squares Results
Panel A: student math performance(1) (2) (3) (4) (5)
Teacher math knowledge 0.112∗∗∗ 0.091∗∗∗ 0.091∗∗∗ 0.074∗∗∗ 0.073∗∗∗
(0.013) (0.011) (0.011) (0.010) (0.010)Adj. R2 0.22 0.30 0.30 0.32 0.32Observations (students) 74,708 74,708 74,708 74,708 74,708Clusters (schools) 3,939 3,939 3,939 3,939 3,939
Panel B: student reading performance(1) (2) (3) (4) (5)
Teacher reading knowledge 0.106∗∗∗ 0.078∗∗∗ 0.077∗∗∗ 0.057∗∗∗ 0.052∗∗∗
(0.013) (0.010) (0.010) (0.009) (0.009)Adj. R-squared 0.22 0.35 0.35 0.38 0.38Observations (students) 74,708 74,708 74,708 74,708 74,708Clusters (schools) 3,939 3,939 3,939 3,939 3,939
Control variables in Panels A + BCountry fixed effects X X X X XSocio-economic characteristics (18) X X X XClassroom characteristics (4) X X XSchool characteristics (5) X XTeacher characteristics (6) X
Notes: Least squares regressions weighted by students’ inverse sampling probability. Dependent variable:student performance in math (Panel A) and in reading (Panel B). Student and teacher test scores arez-standardized at the individual level across countries and waves. Socio-economic controls include three studentcharacteristics and 15 family background measures. Classroom controls contain four classroom resources, andschool resource controls include five measures of school resources and location. Teacher controls include sixteacher characteristics. Table A-2 reports coefficients on these control variables. All regressions includeimputation dummies and a dummy indicating the SACMEQ wave. Robust standard errors, adjusted forclustering at the school level, are reported in parentheses. Significance levels: ∗ p<0.10, ∗∗ p<0.05, ∗∗∗ p<0.01.

Table 2: Student Fixed-Effects Results
Dependent variable: student performance(1) (2) (3)
Teacher subject knowledge 0.027∗∗∗ 0.026∗∗∗ 0.026∗∗∗
(0.005) (0.005) (0.005)Student fixed effects X X XClassroom characteristics (3) X XTeacher characteristics (6) XObservations 149,416 149,416 149,416
Notes: Fixed-effects estimations weighted by students’ inverse sampling probability. Dependent variable:student performance in math and reading. Student and teacher test scores are z-standardized at the individuallevel across countries and waves. Compared to Table 1, among classroom characteristics, class size is excludedbecause it does not vary across subjects for the same student. All regressions include subject fixed effectsand imputation dummies. Robust standard errors, adjusted for clustering at the school level, are reported inparentheses. Significance levels: ∗ p<0.10, ∗∗ p<0.05, ∗∗∗ p<0.01.

Table 3: Complementarity Between Teacher Subject Knowledgeand School Resources (Student Fixed-Effects Model)
Dependent variable: student performanceStudent-level
resources Resources measured at school level(1) (2) (3) (4) (5)
Teacher subject knowledge 0.015∗∗ 0.027∗∗∗ 0.026∗∗∗ 0.027∗∗∗ 0.027∗∗∗
(0.007) (0.005) (0.006) (0.006) (0.005)× textbook availability 0.020∗∗ 0.017∗∗∗
(0.008) (0.005)× school facilities (index) 0.016∗∗∗
(0.005)× average class size –0.002
(0.006)× teachers absent from classroom –0.010∗
(0.006)Textbook availability 0.005
(0.011)Student fixed effects X X X X XClassroom characteristics (3) X X X X XTeacher characteristics (6) X X X X XObservations 149,416 149,416 149,416 146,310 149,416
Notes: Fixed-effects estimations weighted by students’ inverse sampling probability. Dependent variable:student performance in math and reading. In Column 1, teacher subject knowledge is interacted with astudent-level indicator of whether subject-specific textbooks are available during math and reading class,respectively. In the remaining columns, teacher subject knowledge is interacted with school-level measuresof share of students with subject-specific textbooks (Column 2), school facilities (Column 3), class size (Column4), and teacher absenteeism (Column 5). To facilitate interpretation of coefficient magnitudes, the resourcevariables in Columns 2–5 are z-standardized across countries and waves. Textbook availability : binary variablethat equals 1 if a student shares his or her subject-specific textbook with exactly one other student or hasown textbook; 0 otherwise. In Column 2, textbook availability is aggregated to the school level and measuresthe share of students at school who share subject-specific textbook with at most one other student (averagedacross math and reading). School facilities (index): counts the availability of all 31 school resources reported inSACMEQ: board, cafeteria, chairs, chalk, charts, classroom library, community hall, computer, drinking water,duplicator, electricity, fax, fence, first aid kit, garden, locker, overhead projector, photocopier, playground,radio, school library, separate office for school head, shelves, storeroom, tables, tape recorder, teacher room,telephone, TV, typewriter, and VCR. Average class size: average number of students per classroom in sixthgrade. 3,106 student observations are missing because some school principals did not report the number ofsixth-grade students at school. Teachers absent from classroom: overall indicator of teacher absence combiningthe following three questions answered by the school principal: (1) How often do teachers arrive late at school?(2) How often do teachers skip classes? (3) How often are teachers unjustifiably absent? Each answer is codedas follows: 0: never; 1: sometimes; 2: often. The index is the simple average across the three answers. The maineffects of the school-level resources in Columns 2–5 cannot be estimated because these variables do not varyacross subjects. Classroom and teacher characteristics are the same as in Column 3 of Table 2. All regressionsinclude subject fixed effects and imputation dummies. Robust standard errors, adjusted for clustering at theschool level, are reported in parentheses. Significance levels: ∗ p<0.10, ∗∗ p<0.05, ∗∗∗ p<0.01.

Table 4: Sorting (Student Fixed-Effects Model)
Dependent variable: student performanceRural schools One-classroom schools School level
(1) (2) (3)Teacher subject knowledge (indiv. level) 0.017∗∗ 0.017∗
(0.007) (0.009)Teacher subject knowledge (school level) 0.030∗∗∗
(0.006)Student fixed effects X X XClassroom characteristics (3) X X XTeacher characteristics (6) X X XObservations 92,968 63,204 149,416
Notes: Fixed-effects estimations weighted by students’ inverse sampling probability. Dependent variable:student performance in math and reading. Student and teacher test scores are z-standardized at the individuallevel across countries and waves. In Column 1, the sample includes only schools in rural areas. In Column 2, allschools with more than one sixth-grade classroom are excluded. In Column 3, teacher test scores and all teachercharacteristics are collapsed at the school level. Classroom and teacher characteristics are the same as in Table2. All regressions include subject fixed effects and imputation dummies. Robust standard errors, adjusted forclustering at the school level, are reported in parentheses. Significance levels: ∗ p<0.10, ∗∗ p<0.05, ∗∗∗ p<0.01.
Table 5: Same-Teacher Sample (OLS and Student Fixed-Effects Models)
Dependent variable: student performanceOLS Student fixed effects
Math Reading Math & Reading(1) (2) (3) (4)
Teacher subject knowledge 0.064∗∗∗ 0.039∗∗∗ 0.025∗∗ 0.024∗∗
(0.016) (0.014) (0.012) (0.012)Socio-economic characteristics (18) X X n.a. n.a.Classroom characteristics (4) X X XSchool characteristics (5) X X n.a. n.a.Teacher characteristics (6) X X n.a. n.a.Student fixed effects X XObservations 23,444 23,444 46,888 46,888
Notes: Estimations weighted by students’ inverse sampling probability. Same-teacher sample includes onlystudents who are taught in both math and reading by the same teacher. Dependent variable: studentperformance in math (Column 1), in reading (Column 2), and in math and reading (Columns 3 and 4). Studentand teacher test scores are z-standardized at the individual level across countries and waves. The specificationsin Columns 1 and 2 are analogous to those in Column 5 of Table 1. In the student fixed-effects estimationsin Columns 3 and 4, socio-economic characteristics, school characteristics, class size, and the wave indicatorare excluded because variables do not vary across subjects for the same student; teacher characteristics arealso excluded as they do not vary within the same teacher. All regressions include subject fixed effects andimputation dummies. Robust standard errors, adjusted for clustering at the school level, are reported inparentheses. Significance levels: ∗ p<0.10, ∗∗ p<0.05, ∗∗∗ p<0.01.

Table 6: Complementarity Between Teacher Subject Knowledge and Subject-Specific Textbooks (Robustness Checks)
Dependent variable: student performanceSame-teacher One-classroom School-level
Baseline sample Rural schools schools variables(1) (2) (3) (4) (5)
Teacher subject knowledge 0.015∗∗ 0.005 0.008 0.009 0.030∗∗∗
(0.007) (0.015) (0.009) (0.012) (0.006)× textbook availability 0.020∗∗ 0.035∗∗∗ 0.017∗ 0.016 0.013∗∗
(0.008) (0.013) (0.009) (0.012) (0.005)Textbook availability 0.005 0.019 0.003 –0.012 –0.003
(0.011) (0.016) (0.013) (0.017) (0.012)Effect of teacher knowledge for students with textbooks 0.035∗∗∗ 0.040∗∗∗ 0.025∗∗∗ 0.025∗∗ 0.044∗∗∗(a)
(linear combination of main effect and interaction) (0.006) (0.012) (0.008) (0.011) (0.008)Student fixed effects X X X X XClassroom characteristics (2) X n.a. X X XTeacher characteristics (6) X n.a. X X XObservations 149,416 46,888 92,968 63,204 149,416
Notes: Fixed-effects estimations weighted by students’ inverse sampling probability. Dependent variable: student performance in math and reading. Column 1 replicatesColumn 1 of Table 3. In Column 2, sample includes only students who are taught in both math and reading by the same teacher; this is equivalent to adding teacherfixed effects in the full sample. In Column 3, the sample includes only schools in rural areas. In Column 4, all schools with more than one sixth-grade classroom areexcluded. In Column 5, teacher test scores, subject-specific textbooks, access to teaching guide, and all teacher characteristics are collapsed at the school level. Thus, thetextbook availability variable in Column 5 measures the share of students at school who share a textbook with one other student or have own textbook (separately formath and reading); this variable is z-standardized across countries and waves. Classroom and teacher characteristics are the same as in Table 2 (without the textbooksvariable); these variables are excluded in Column 2 because they do not vary within the same teacher. All regressions include subject fixed effects and imputationdummies. Robust standard errors, adjusted for clustering at the school level, are reported in parentheses. Significance levels: ∗ p<0.10, ∗∗ p<0.05, ∗∗∗ p<0.01.(a) Effect size is not directly comparable to magnitudes in Columns 1–4 because of a different standardization of the textbook variable.
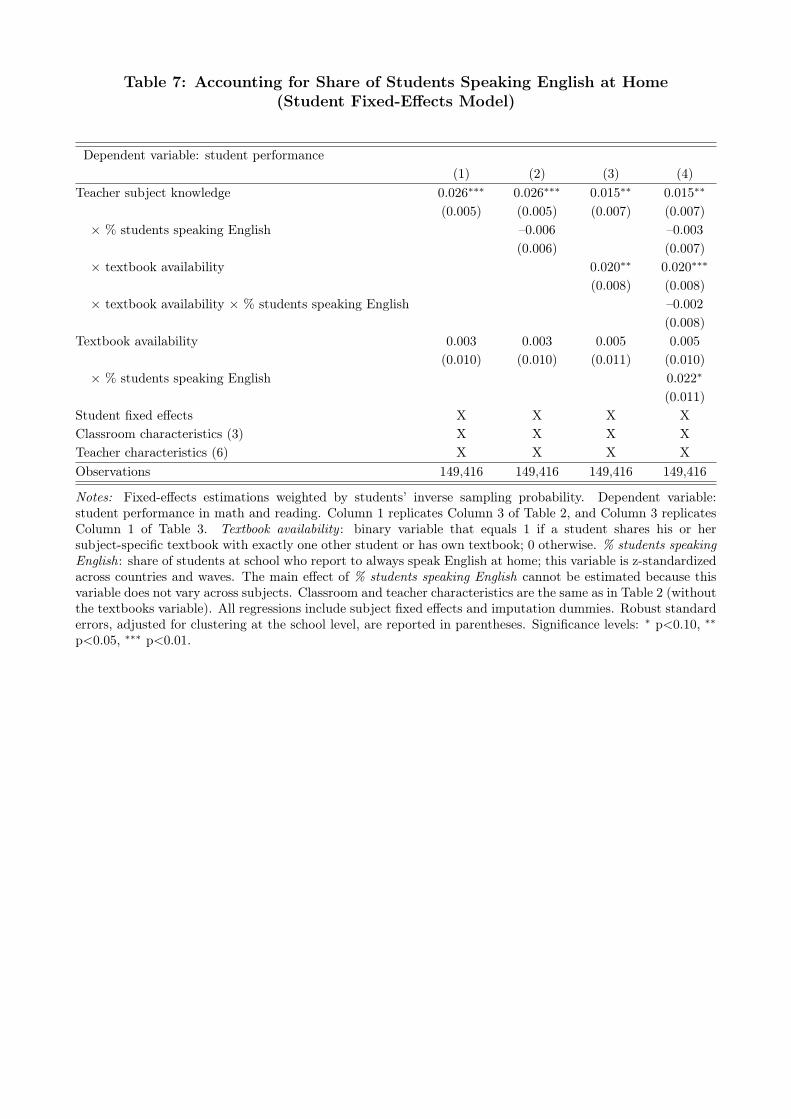
Table 7: Accounting for Share of Students Speaking English at Home(Student Fixed-Effects Model)
Dependent variable: student performance(1) (2) (3) (4)
Teacher subject knowledge 0.026∗∗∗ 0.026∗∗∗ 0.015∗∗ 0.015∗∗
(0.005) (0.005) (0.007) (0.007)× % students speaking English –0.006 –0.003
(0.006) (0.007)× textbook availability 0.020∗∗ 0.020∗∗∗
(0.008) (0.008)× textbook availability × % students speaking English –0.002
(0.008)Textbook availability 0.003 0.003 0.005 0.005
(0.010) (0.010) (0.011) (0.010)× % students speaking English 0.022∗
(0.011)Student fixed effects X X X XClassroom characteristics (3) X X X XTeacher characteristics (6) X X X XObservations 149,416 149,416 149,416 149,416
Notes: Fixed-effects estimations weighted by students’ inverse sampling probability. Dependent variable:student performance in math and reading. Column 1 replicates Column 3 of Table 2, and Column 3 replicatesColumn 1 of Table 3. Textbook availability : binary variable that equals 1 if a student shares his or hersubject-specific textbook with exactly one other student or has own textbook; 0 otherwise. % students speakingEnglish: share of students at school who report to always speak English at home; this variable is z-standardizedacross countries and waves. The main effect of % students speaking English cannot be estimated because thisvariable does not vary across subjects. Classroom and teacher characteristics are the same as in Table 2 (withoutthe textbooks variable). All regressions include subject fixed effects and imputation dummies. Robust standarderrors, adjusted for clustering at the school level, are reported in parentheses. Significance levels: ∗ p<0.10, ∗∗
p<0.05, ∗∗∗ p<0.01.
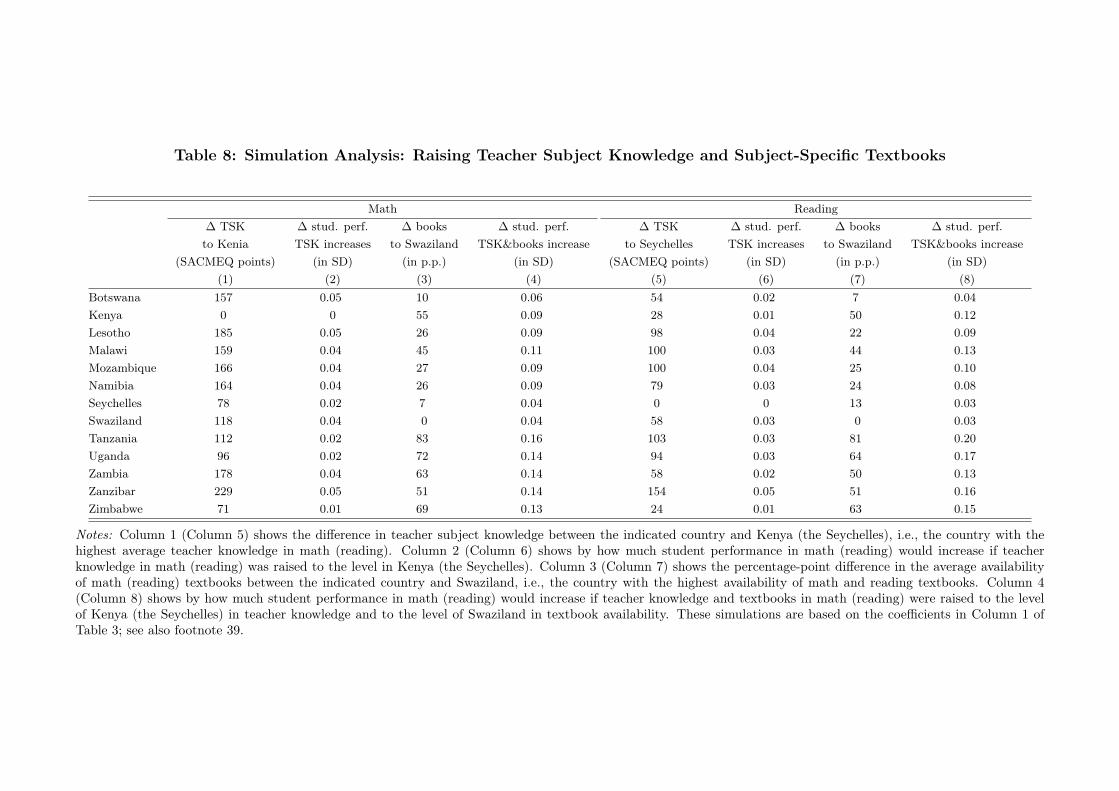
Table 8: Simulation Analysis: Raising Teacher Subject Knowledge and Subject-Specific Textbooks
Math Reading∆ TSK ∆ stud. perf. ∆ books ∆ stud. perf. ∆ TSK ∆ stud. perf. ∆ books ∆ stud. perf.to Kenia TSK increases to Swaziland TSK&books increase to Seychelles TSK increases to Swaziland TSK&books increase
(SACMEQ points) (in SD) (in p.p.) (in SD) (SACMEQ points) (in SD) (in p.p.) (in SD)(1) (2) (3) (4) (5) (6) (7) (8)
Botswana 157 0.05 10 0.06 54 0.02 7 0.04Kenya 0 0 55 0.09 28 0.01 50 0.12Lesotho 185 0.05 26 0.09 98 0.04 22 0.09Malawi 159 0.04 45 0.11 100 0.03 44 0.13Mozambique 166 0.04 27 0.09 100 0.04 25 0.10Namibia 164 0.04 26 0.09 79 0.03 24 0.08Seychelles 78 0.02 7 0.04 0 0 13 0.03Swaziland 118 0.04 0 0.04 58 0.03 0 0.03Tanzania 112 0.02 83 0.16 103 0.03 81 0.20Uganda 96 0.02 72 0.14 94 0.03 64 0.17Zambia 178 0.04 63 0.14 58 0.02 50 0.13Zanzibar 229 0.05 51 0.14 154 0.05 51 0.16Zimbabwe 71 0.01 69 0.13 24 0.01 63 0.15
Notes: Column 1 (Column 5) shows the difference in teacher subject knowledge between the indicated country and Kenya (the Seychelles), i.e., the country with thehighest average teacher knowledge in math (reading). Column 2 (Column 6) shows by how much student performance in math (reading) would increase if teacherknowledge in math (reading) was raised to the level in Kenya (the Seychelles). Column 3 (Column 7) shows the percentage-point difference in the average availabilityof math (reading) textbooks between the indicated country and Swaziland, i.e., the country with the highest availability of math and reading textbooks. Column 4(Column 8) shows by how much student performance in math (reading) would increase if teacher knowledge and textbooks in math (reading) were raised to the levelof Kenya (the Seychelles) in teacher knowledge and to the level of Swaziland in textbook availability. These simulations are based on the coefficients in Column 1 ofTable 3; see also footnote 39.

Appendix
Figure A-1: Distribution of Teacher Math Knowledge by Country
KEN KEN KEN KEN
KEN KEN KEN KEN
KEN KEN KEN KEN KEN
0
.002
.004
.006
0
.002
.004
.006
0
.002
.004
.006
400 800 1200 400 800 1200 400 800 1200 400 800 1200 400 800 1200
BOT KEN LES MAL
MOZ NAM SEY SWA
TAN UGA ZAM ZAN ZIM
Den
sity
Teacher math knowledge
Notes: Kernel density plots of teacher math knowledge separately for each country. Vertical red lines indicatethe average math knowledge of teachers in Kenya, the country with the highest average teacher math knowl-edge in our sample. Country abbreviations: BOT=Botswana, KEN=Kenya, LES=Lesotho, MAL=Malawi,MOZ=Mozambique, NAM=Namibia, SEY=Seychelles, SWA=Swaziland, TAN=Tanzania, UGA=Uganda,ZAM=Zambia, ZAN=Zanzibar, ZIM=Zimbabwe.

Figure A-2: Distribution of Teacher Reading Knowledge by Country
SEY SEY SEY SEY
SEY SEY SEY SEY
SEY SEY SEY SEY SEY
0
.005
.01
0
.005
.01
0
.005
.01
400 700 1000 400 700 1000 400 700 1000 400 700 1000 400 700 1000
BOT KEN LES MAL
MOZ NAM SEY SWA
TAN UGA ZAM ZAN ZIM
Den
sity
Teacher reading knowledge
Notes: Kernel density plots of teacher reading knowledge separately for each country. Vertical red lines indicatethe average reading knowledge of teachers in the Seychelles, the country with the highest average teacherreading knowledge in our sample. Country abbreviations: BOT=Botswana, KEN=Kenya, LES=Lesotho,MAL=Malawi, MOZ=Mozambique, NAM=Namibia, SEY=Seychelles, SWA=Swaziland, TAN=Tanzania,UGA=Uganda, ZAM=Zambia, ZAN=Zanzibar, ZIM=Zimbabwe.

Table A-1: Summary Statistics of Student Performance and Teacher Subject Knowledge
Pooled Botswana Kenya Lesotho Malawi Mozambique NamibiaStudents
Math performance 496 516 558 463 441 505 453(88) (81) (86) (66) (60) (69) (82)
Reading performance 501 527 543 459 431 494 475(94) (94) (92) (65) (51) (73) (90)
# Students 74,708 6,375 6,778 6,895 4,733 5,308 10,365Teachers
Math knowledge 792 768 934 739 768 762 754(110) (83) (106) (70) (89) (95) (105)
Reading knowledge 742 763 793 721 720 717 735(73) (63) (55) (58) (61) (68) (78)
# Math teachers 5,421 730 474 422 278 586 587# Reading teachers 5,466 725 480 421 288 603 561
Seychelles Swaziland Tanzania Uganda Zambia Zanzibar ZimbabweStudents
Math performance 549 530 542 490 434 482 515(100) (65) (87) (88) (70) (64) (95)
Reading performance 575 540 566 477 435 509 503(122) (67) (90) (79) (78) (86) (99)
# Students 2,820 6,700 6,455 6,498 4,745 4,317 2,719Teachers
Math knowledge 848 810 812 829 749 691 854(75) (91) (81) (103) (89) (78) (96)
Reading knowledge 818 761 715 723 761 665 793(65) (62) (49) (73) (64) (64) (67)
# Math teachers 91 336 397 355 534 362 269# Reading teachers 105 336 398 359 534 387 269
Notes: Means and standard deviations (in parentheses) reported. The pooled sample includes 8,742 teachers in total, some of them teaching both math and reading.Statistics are based on individual-level observations weighted with inverse sampling probabilities.

Table A-2: OLS Estimations: Results on Other Covariates
Dependent variable: student performance Math ReadingSocio-economic characteristicsAge –0.032∗∗∗ –0.041∗∗∗
(0.003) (0.003)Female –0.128∗∗∗ 0.004
(0.009) (0.008)Mother’s education
Unknown –0.022 0.009(0.017) (0.016)
Some primary –0.001 0.033∗∗
(0.017) (0.015)Primary –0.001 0.033∗∗
(0.017) (0.015)At least some secondary 0.022 0.077∗∗∗
(0.018) (0.016)More than secondary 0.134∗∗∗ 0.199∗∗∗
(0.021) (0.020)Father’s education
Unknown 0.042∗∗ 0.104∗∗∗
(0.018) (0.016)Some primary 0.044∗∗ 0.098∗∗∗
(0.018) (0.017)Primary 0.070∗∗∗ 0.103∗∗∗
(0.018) (0.017)At least some secondary 0.083∗∗∗ 0.146∗∗∗
(0.019) (0.016)More than secondary 0.203∗∗∗ 0.275∗∗∗
(0.020) (0.018)Repeated grade –0.191∗∗∗ –0.231∗∗∗
(0.010) (0.009)Books at home
11-50 books 0.093∗∗∗ 0.102∗∗∗
(0.015) (0.013)More than 50 books 0.177∗∗∗ 0.233∗∗∗
(0.024) (0.024)
Textbook availability 0.047∗∗∗ 0.077∗∗∗
(0.013) (0.013)(continued on next page)

Table A-2 (continued)
Dependent variable: student performance Math ReadingClassroom characteristicsAccess to teaching guide –0.057∗∗∗ 0.002
(0.019) (0.020)Number of books in class (/10) –0.001 –0.001∗
(0.001) (0.001)Class size –0.002∗∗∗ –0.001∗∗∗
(0.001) (0.001)School characteristicsSchool facilities (index) 0.153∗∗∗ 0.184∗∗∗
(0.012) (0.012)Private school 0.139∗∗∗ 0.116∗∗∗
(0.029) (0.027)Rural school –0.143∗∗∗ –0.191∗∗∗
(0.019) (0.018)Teachers absent from classroom –0.032∗∗∗ –0.016∗
(0.009) (0.008)Number of students in school (/100) –0.003∗ –0.003
(0.002) (0.002)Teacher characteristicsTeacher female 0.034∗∗ 0.037∗∗
(0.017) (0.015)Education
Junior secondary 0.015 0.021(0.030) (0.030)
Senior secondary 0.049∗ 0.070∗∗∗
(0.026) (0.025)A-level 0.034 0.061∗∗
(0.028) (0.029)Tertiary 0.143∗∗∗ 0.125∗∗∗
(0.039) (0.036)Work experience –0.000 0.001
(0.001) (0.001)(continued on next page)

Table A-2 (continued)
Dependent variable: student performance Math ReadingYears of subject-specific training
<1 year 0.120∗∗ 0.078(0.048) (0.050)
1 year 0.153∗∗∗ 0.025(0.054) (0.051)
2 years 0.069∗ 0.061∗
(0.036) (0.036)3 years 0.042 0.094∗∗
(0.036) (0.039)>3 years 0.097∗∗ 0.103∗∗
(0.040) (0.042)Weekly teaching time –0.002∗∗ –0.002∗∗
(0.001) (0.001)How often teacher meets parents 0.004 0.002
(0.009) (0.008)Family resources (10) X XAdj. R-squared 0.32 0.38Observations (students) 74,708 74,708Clusters (schools) 3,939 3,939
Notes: The table reports results on other covariates of the ordinary least squares estimations with the full set ofcontrol variables, corresponding to Column 5 of Table 1 (Panel A: math, Panel B: reading). Omitted categoriesof student characteristics: mother no education; father no education; and 0-10 books. Omitted categories ofteacher characteristics: primary education; and no training. Textbook availability : binary variable which equals1 if a student shares his or her subject-specific textbook with one other student or has own textbook; 0 otherwise.School facilities (index): counts the availability of all 31 school resources reported in SACMEQ: board, cafeteria,chairs, chalk, charts, classroom library, community hall, computer, duplicator, electricity, fax, fence, first aidkit, garden, locker, overhead projector, photocopier, playground, radio, school library, separate office for schoolhead, shelves, storeroom, tables, tape recorder, teacher room, telephone, TV, typewriter, VCR, and drinkingwater. Teachers absent from classroom: overall indicator of teacher absence combining the following threequestions answered by the school principal: (1) How often do teachers arrive late at school? (2) How oftendo teachers skip classes? (3) How often are teachers unjustifiably absent? Each answer is coded as follows: 0:never; 1: sometimes; 2: often. The index is the simple average across all three answers. School facilities (index)and teachers absent from classroom are z-standardized across countries and waves. Results for family resourcesare available on request. All regressions include subject fixed effects and imputation dummies. Robust standarderrors, adjusted for clustering at the school level, are reported in parentheses. Significance levels: ∗ p<0.10, ∗∗
p<0.05, ∗∗∗ p<0.01.

Table A-3: Heterogeneity by Student and Teacher Gender
Dependent variable: student performanceGender: Student Teacher Student-teacher
(1) (2) (3)Teacher subject knowledge 0.028∗∗∗ 0.031∗∗∗ 0.014∗∗
(0.006) (0.007) (0.006)× female student –0.004
(0.006)× female teacher –0.009
(0.009)× same-gender teacher 0.022∗∗∗
(0.005)Female teacher 0.039∗∗∗
(0.013)Same-gender teacher 0.046∗∗∗
(0.008)Student fixed effects X X XClassroom characteristics (3) X X XTeacher characteristics (6) X X XObservations 148,174 148,174 148,174
Notes: Fixed-effects estimations weighted by students’ inverse sampling probability. Four students with missinggender information and 617 students with missing information on their teacher’s gender are excluded from thesample. All regressions include subject fixed effects and imputation dummies. Robust standard errors, adjustedfor clustering at the school level, are reported in parentheses. Significance levels: ∗ p<0.10, ∗∗ p<0.05, ∗∗∗
p<0.01.

A Measurement Error
Like in any performance assessment, teacher subject knowledge in SACMEQ is likely mea-
sured with error. As is well known, measurement error in the explanatory variable may lead
to a downward bias in the estimated coefficient, and this biasmay be aggravated in the student
fixed-effects models (Angrist and Krueger, 1999, Chapter 4). In this appendix, we assess
the importance of measurement error for our estimates and propose a way of correcting the
corresponding attenuation bias.
We begin our analysis by assuming that teacher subject knowledge is measured with random
noise. LetT ∗ik denote the true knowledge of studenti’s teacher in subjectk and let the observed
teacher test score be denoted byTik = T ∗ik + eik.1 Assuming classical measurement error,
E(eik) = 0 andCov(T ∗ik,eik) = 0. In a bivariate model, the true effect of teacher subject
knowledge on student performance,yik, will then be asymptotically biased towards zero:
yik = βλkTik + εik, whereλk =Var(T ∗
ik)
Var(T ∗ik)+Var(eik)
. (A.1)
The factorλk indicates how much the true effectβ is attenuated and is often referred to as the
reliability ratio or signal-to-noise ratio.
In a first-differenced, i.e., a student fixed-effects model,the attenuation bias due to mea-
surement error is likely aggravated. Intuitively, teachers’ math and reading knowledge are more
strongly correlated than the measurement errors in these variables, such that differencing the
observed test scores decreases the signal-to-noise ratio.More formally, consider the case where
the measurement errors are uncorrelated across subjects, that is,Cov(eim,eir) =Cov(T ∗im,eir) =
Cov(eim,T ∗ir ) = 0. In this case, the reliability ratio for the first-differenced model can be derived
as (see Metzler and Woessmann, 2010):
λ∆ =Var(∆T ∗
i )
Var(∆T ∗i )+Var(∆ei)
(A.2)
=λmVar(Tim)+λrVar(Tir)−2Cov(Tim,Tir)
Var(Tim)+Var(Tir)−2Cov(Tim,Tir).
1For conciseness, we ignore the classroom and school subscripts in this discussion.

Note that the only unknown quantities in Equation (A.2) areλm andλr, while the variances and
covariances of teacher subject knowledge can easily be computed from the data. Therefore,
if the reliability ratios of the teachers’ math and reading assessments were known, we could
correct our baseline estimate for measurement error by multiplying the estimated coefficient
with 1/λ∆.
Referring to psychometric test theory, Metzler and Woessmann (2012) argue that Cron-
bach’sα is a natural estimate forλk in the context of teacher subject knowledge. We compute
Cronbach’sα for the math and reading tests (which are not reported by SACMEQ) by using
teachers’ answers to all individual test items.2 The estimated reliability ratios areλm = 0.83
for math andλr = 0.75 for reading. Together withVar(Tim) = Var(Tir) = 1 (due to our
normalization of test scores) and the estimated covarianceCov(Tim,Tir) = 0.34, we obtainλ∆ =
0.68 as an estimate for the reliability ratio for the differenced teacher test scores. Therefore,
under the assumptions set out in the previous paragraphs, multiplying our baseline coefficient
by the factor 1/0.68= 1.46 will provide the measurement-error-corrected estimateof the effect
of teacher subject knowledge on student performance. For our baseline coefficient of 0.026 SD,
this implies a corrected effect of 0.039 SD.
2Cronbach’sα is a function of the number of test items and the covariances between allpossible item pairs; see Metzler and Woessmann (2010, 2012)as well as references therein.We use Stata’salpha command to compute Cronbach’sα for the teacher math and readingtests in SACMEQ.