the economic role of kentucky’s nonprofit private colleges ... · nonprofit private colleges in...
TRANSCRIPT
The economic role of Kentucky’s nonprofit private colleges in the Commonwealth Annual Economic Impact Estimate, 2014-15
aikcu.org


The Association of Independent Kentucky Colleges and Universities (AIKCU) is composed of eighteen (18) diverse nonprofit, private colleges and universities. AIKCU member institutions directly employ more than 6,750 employees. These jobs are widely spread across the Commonwealth and can be characterized as being economically, socially, and environmentally friendly. Additionally, AIKCU’s member colleges and universities serve 38,000 students and play a critical role in Kentucky’s postsecondary education system. AIKCU students are composed of both undergraduates (77%) and graduate students (23%).
AIKCU’s member colleges and universities account for approximately 22% of Kentucky’s bachelor degrees.
This economic estimate measures the operational annual economic impact value of AIKCU’s member institutions. This economic impact estimate does not measure the eco-nomic and social value of the students and alumni to the Commonwealth of Kentucky. The economic benefits that Kentucky receives from AIK-CU’s member institutions operating in Kentucky are signifi-cant, adding $700 million to Kentucky’s state gross domestic product (GDP) annually. These annual operational values recur each year.
Based on the one-year (academic year 2014-2015) opera-tional impact estimate, the AIKCU’s member institutions could easily add $7 billion (cumulative) to Kentucky’s state GDP during a ten (10) year period. If the value of the AIK-CU’s member institutions’ alumni were to be added to this impact, then the impact would be noticeably higher.
Kentucky’s 18 nonprofit private colleges & universities:
Add $700 million to the Kentucky
economy annually
• $404 million in direct effects
• $121 million in indirect efffects
• $175 million in induced effects
Are responsible for the creation of
10,588 jobs
• 6,755 direct employees
Average salary (with benefits):
$53,674
• 1,400 indirect jobs
Average salary (with benefits):
$38, 915
• 2,443 induced jobs
Average salary (with benefits):
$40, 613
Overview of the Economic Impact of AIKCU Members
AIKCU’s member institutions vary from Kentucky’s public universities to Kentucky’s Community and Technical College System (KCTCS) in how they cost and benefit the Common-wealth. Kentucky’s public institutions of higher education receive funding from state revenues. AIKCU’s member insti-tutions do not receive direct state operational funds.
Additionally, Kentucky historically has utilized state revenue to assist in the creation of jobs in the Commonwealth. Each year in Kentucky, several hundred new and existing busi-nesses are approved to receive state financial incentives for creating and retaining jobs in the state.
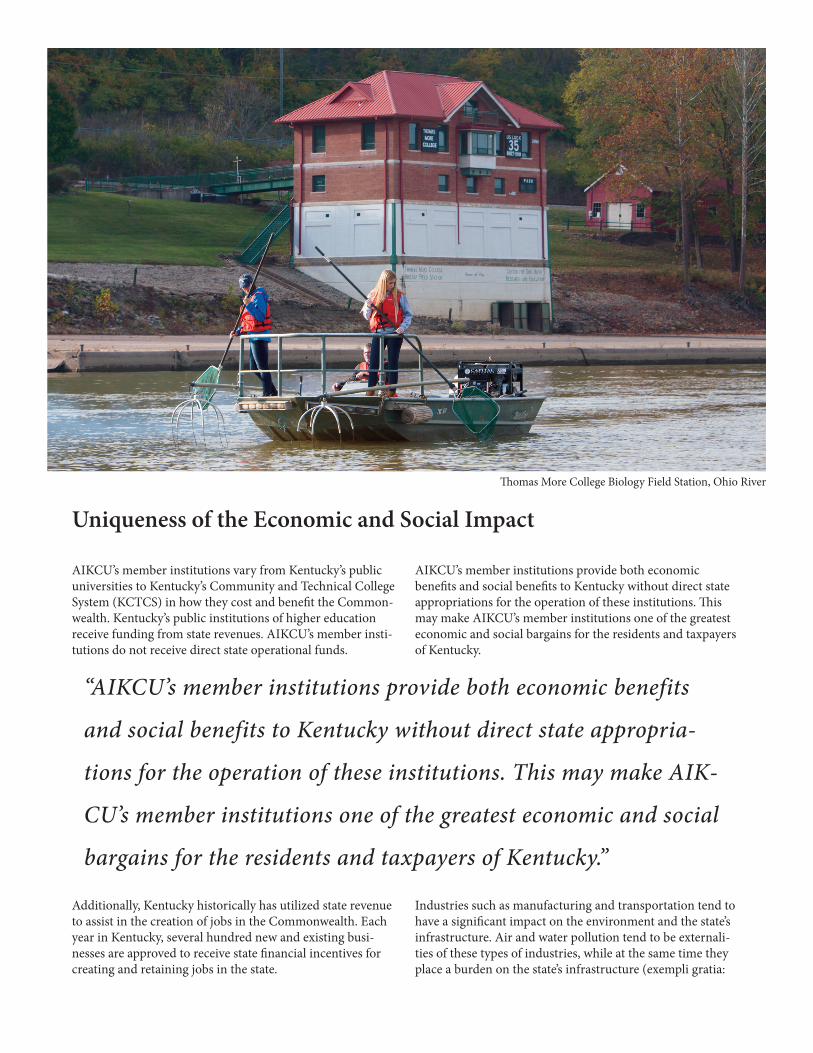
AIKCU’s member institutions provide both economic benefits and social benefits to Kentucky without direct state appropriations for the operation of these institutions. This may make AIKCU’s member institutions one of the greatest economic and social bargains for the residents and taxpayers of Kentucky.
Industries such as manufacturing and transportation tend to have a significant impact on the environment and the state’s infrastructure. Air and water pollution tend to be externali-ties of these types of industries, while at the same time they place a burden on the state’s infrastructure (exempli gratia:
“AIKCU’s member institutions provide both economic benefits
and social benefits to Kentucky without direct state appropria-
tions for the operation of these institutions. This may make AIK-
CU’s member institutions one of the greatest economic and social
bargains for the residents and taxpayers of Kentucky.”
Uniqueness of the Economic and Social Impact
Thomas More College Biology Field Station, Ohio River
heavy trucks put wear and tear on the highway system and commercial freight hauling jets create both sound and air pollution). Operationally, AIKCU’s member institutions are friendly to the environment and to the state’s cost of maintaining its infrastructure.
“Thomas More College is a longtime partner and valued contributor to the Northern Ken-tucky economy. Thomas More is focused on meeting the needs of today’s employers—witness their new values-based leadership ma-jors—and works collaboratively with employers and other edu-cation providers in the region. They have a good track record, as many local leaders are TMC graduates. And Thomas More’s students, faculty, and employees help make our region a better place through their community engagement and service in area churches, nonprofits, the Cham-ber, and other organizations.”
Trey Grayson President & CEO Northern Kentucky Chamber of Commerce
COMMUNITY PARTNERS SAY:
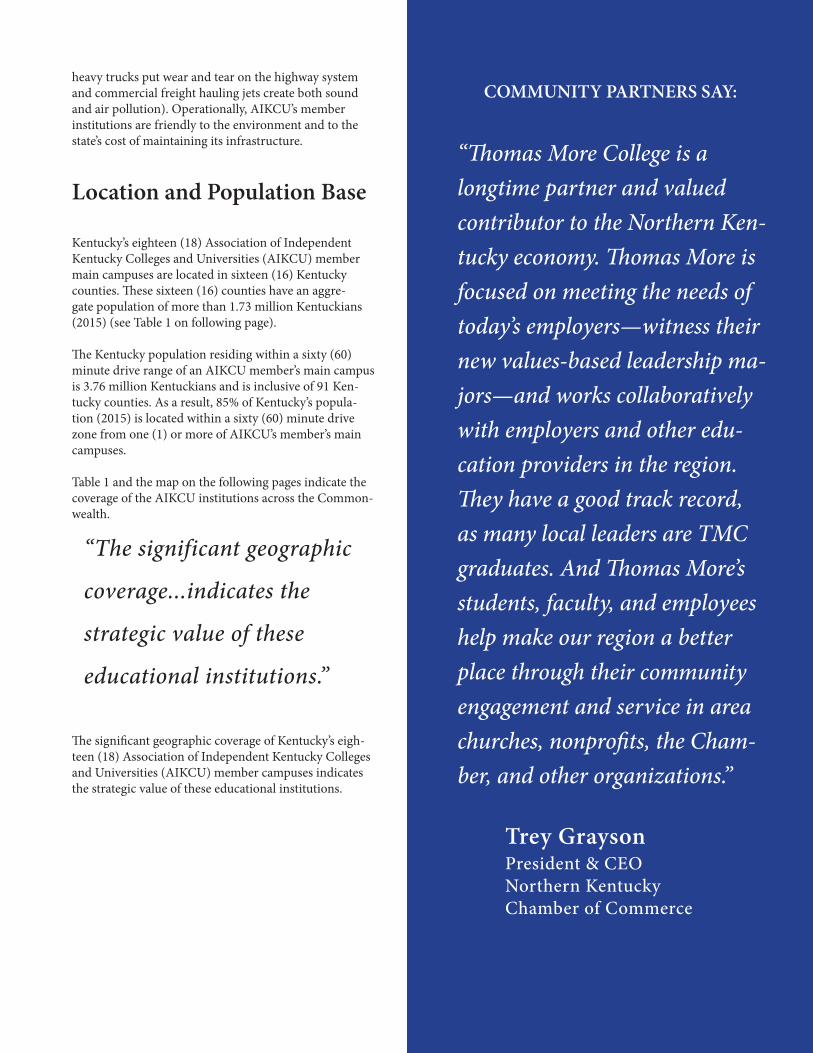
Location and Population Base
“The significant geographic
coverage...indicates the
strategic value of these
educational institutions.”
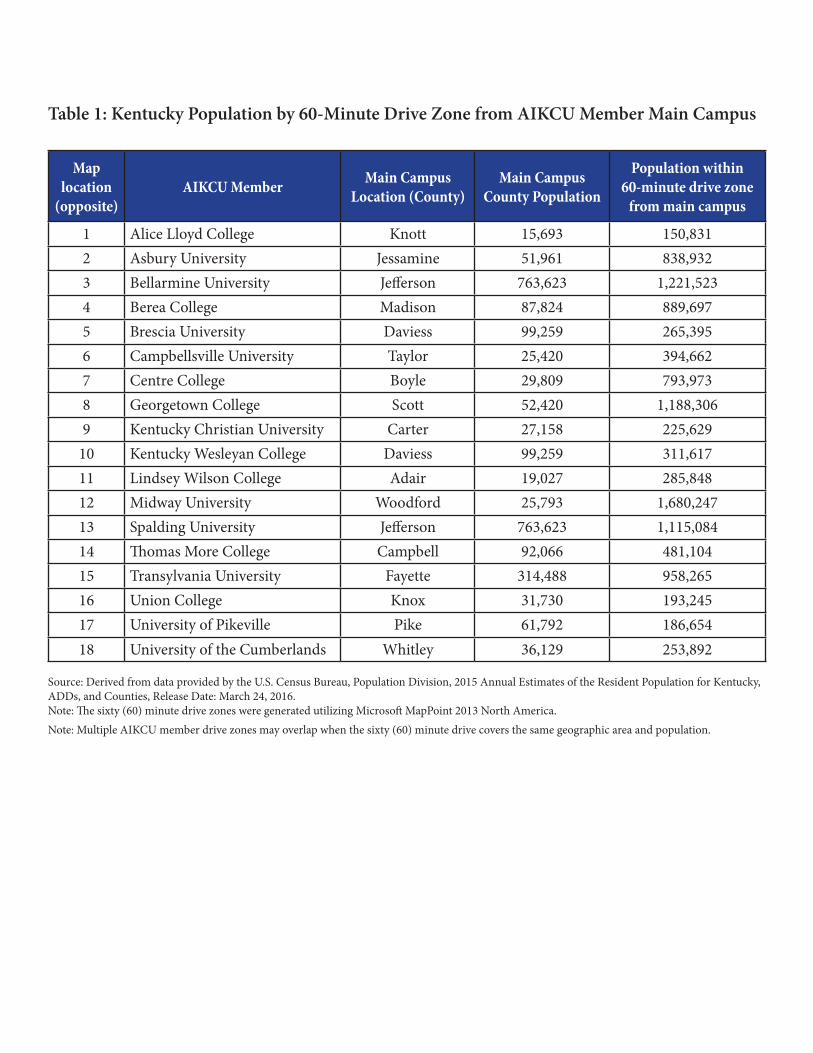
Kentucky’s eighteen (18) Association of Independent Kentucky Colleges and Universities (AIKCU) member main campuses are located in sixteen (16) Kentucky counties. These sixteen (16) counties have an aggre-gate population of more than 1.73 million Kentuckians (2015) (see Table 1 on following page).
The Kentucky population residing within a sixty (60) minute drive range of an AIKCU member’s main campus is 3.76 million Kentuckians and is inclusive of 91 Ken-tucky counties. As a result, 85% of Kentucky’s popula-tion (2015) is located within a sixty (60) minute drive zone from one (1) or more of AIKCU’s member’s main campuses. Table 1 and the map on the following pages indicate the coverage of the AIKCU institutions across the Common-wealth.
The significant geographic coverage of Kentucky’s eigh-teen (18) Association of Independent Kentucky Colleges and Universities (AIKCU) member campuses indicates the strategic value of these educational institutions.
Map location
(opposite) AIKCU Member Main Campus
Location (County)Main Campus
County Population
Population within 60-minute drive zone
from main campus
1 Alice Lloyd College Knott 15,693 150,8312 Asbury University Jessamine 51,961 838,9323 Bellarmine University Jefferson 763,623 1,221,5234 Berea College Madison 87,824 889,6975 Brescia University Daviess 99,259 265,3956 Campbellsville University Taylor 25,420 394,6627 Centre College Boyle 29,809 793,9738 Georgetown College Scott 52,420 1,188,3069 Kentucky Christian University Carter 27,158 225,629
10 Kentucky Wesleyan College Daviess 99,259 311,61711 Lindsey Wilson College Adair 19,027 285,84812 Midway University Woodford 25,793 1,680,24713 Spalding University Jefferson 763,623 1,115,08414 Thomas More College Campbell 92,066 481,10415 Transylvania University Fayette 314,488 958,26516 Union College Knox 31,730 193,24517 University of Pikeville Pike 61,792 186,65418 University of the Cumberlands Whitley 36,129 253,892
Table 1: Kentucky Population by 60-Minute Drive Zone from AIKCU Member Main Campus
Source: Derived from data provided by the U.S. Census Bureau, Population Division, 2015 Annual Estimates of the Resident Population for Kentucky, ADDs, and Counties, Release Date: March 24, 2016.Note: The sixty (60) minute drive zones were generated utilizing Microsoft MapPoint 2013 North America.Note: Multiple AIKCU member drive zones may overlap when the sixty (60) minute drive covers the same geographic area and population.
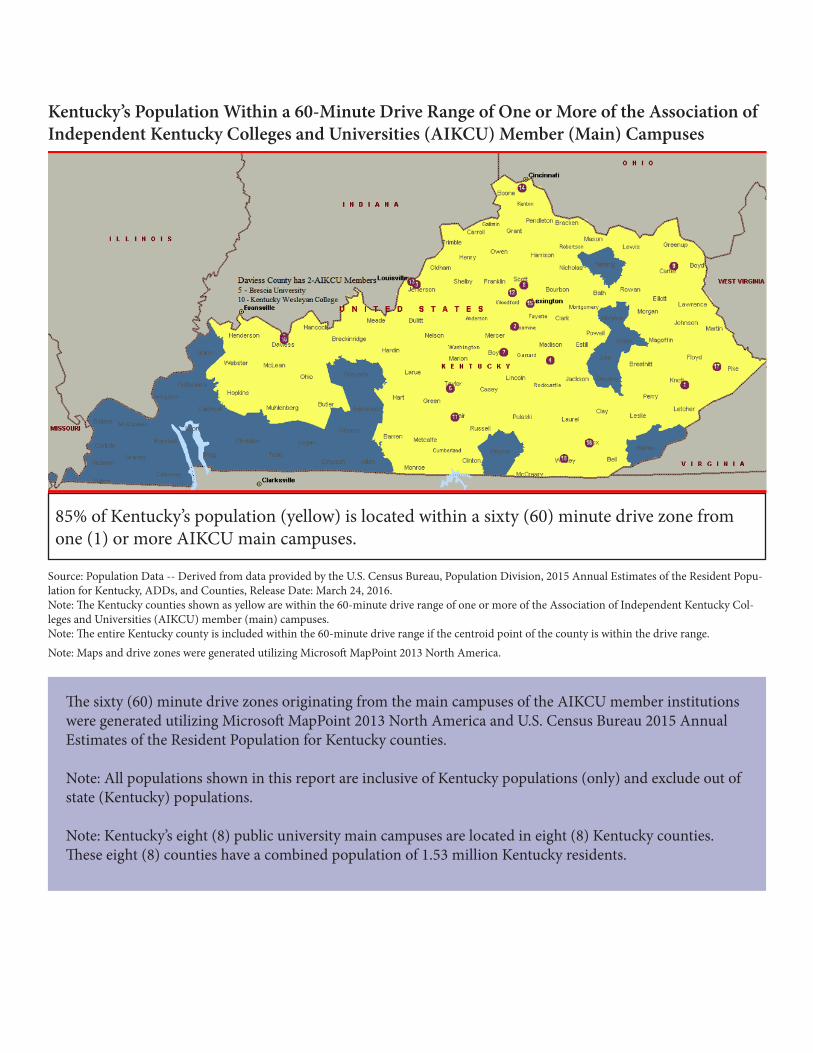
The sixty (60) minute drive zones originating from the main campuses of the AIKCU member institutions were generated utilizing Microsoft MapPoint 2013 North America and U.S. Census Bureau 2015 Annual Estimates of the Resident Population for Kentucky counties.
Note: All populations shown in this report are inclusive of Kentucky populations (only) and exclude out of state (Kentucky) populations.
Note: Kentucky’s eight (8) public university main campuses are located in eight (8) Kentucky counties. These eight (8) counties have a combined population of 1.53 million Kentucky residents.
85% of Kentucky’s population (yellow) is located within a sixty (60) minute drive zone from one (1) or more AIKCU main campuses.
Kentucky’s Population Within a 60-Minute Drive Range of One or More of the Association of Independent Kentucky Colleges and Universities (AIKCU) Member (Main) Campuses
Source: Population Data -- Derived from data provided by the U.S. Census Bureau, Population Division, 2015 Annual Estimates of the Resident Popu-lation for Kentucky, ADDs, and Counties, Release Date: March 24, 2016.Note: The Kentucky counties shown as yellow are within the 60-minute drive range of one or more of the Association of Independent Kentucky Col-leges and Universities (AIKCU) member (main) campuses.Note: The entire Kentucky county is included within the 60-minute drive range if the centroid point of the county is within the drive range.Note: Maps and drive zones were generated utilizing Microsoft MapPoint 2013 North America.
1. Perhaps the greatest benefit AIKCU’s member institutions provide for the state of Kentucky is an economic impact not measured in this report. The impact of AIKCU’s member institutions’ alumni has a tremendous effect across the spec-trum of industries doing business within the Commonwealth. Human capital is the most essential input for any state’s economy, and Kentucky receives this benefit at little or no cost from the alumni of these eighteen (18) AIKCU member institutions. It can easily be expected that wages, productivity, employment levels, business and industry recruitment, and state and local taxes paid are each enhanced by the presence of the eighteen (18) AIKCU’s member institutions’ alumn. Note: One (1) year after graduation – 83% of the AIKCU member in-state graduates were employed in Kentucky and 29% of the out-of-state AIKCU member graduates were employed in Kentucky (AIKCU class of 2012). 7.6% continued their education. Source: Kentucky Center for Education and Workforce Statistics (KCEWS) 2014 postsecondary education (special) feedback report roll up.
2. Construction projects that take place on the campuses of AIKCU’s member institutions generate non-recurring econom-ic impacts, which generate jobs and pay taxes.
3. Student spending beyond payments to AIKCU’s member institutions are not accounted for in this report.
4. Research, federal and corporate grants, and community services provided by the AIKCU’s member institutions have a true value to the state’s economy. However, the results of research projects and the community service provided have not been calculated in this study.
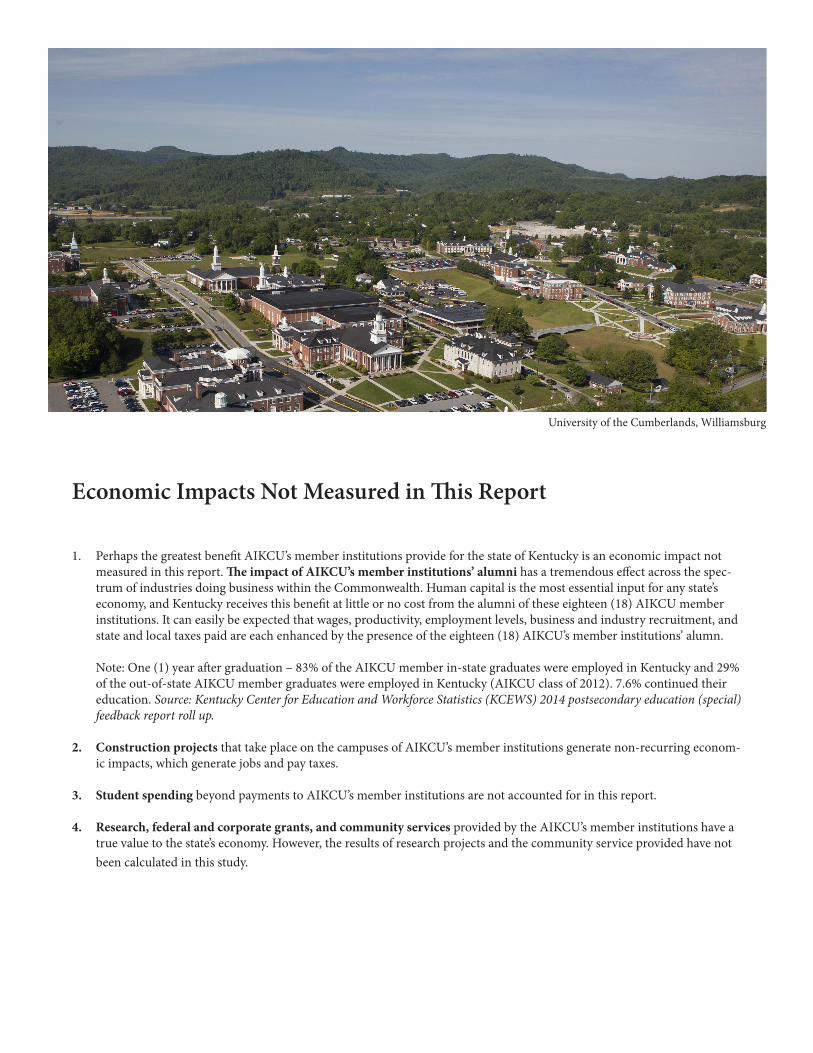
Economic Impacts Not Measured in This Report
University of the Cumberlands, Williamsburg

COMMUNITY PARTNERS SAY:
“We’re fortunate to have two pri-vate colleges in our region. Uni-versity of the Cumberlands and Union College are major employ-ers and contributors to the local and regional economies. Perhaps most importantly, they are key partners in developing our work-force and improving the quality of life in Southeastern Kentucky, which are vital to our prosperity and economic growth.”
Bruce Carpenter Executive Director Southeast Kentucky Regional Industrial Authority
The direct inputs for the economic impact estimates for the operational impact of Kentucky’s AIKCU’s member institutions are listed in Table 1 (below). The member in-stitutions are shown in Table 2 (below), which is inclusive of total wages and employment.
Wage and salary benefits have been estimated at 30.9% of total wages. The benefit value for this industry sector is derived from the United States Bureau of Economic Analysis, Kentucky state average annual wage benefit for educational services. The components of personal in-come benefits are inclusive of employer contributions for employee pension and insurance funds (these consist of employer payments to private and government employee retirement plans, private group health and life insurance plans, privately administered workers’ compensation plans, and supplemental unemployment benefit plans) and of employer contributions for government social insur-ance.
The industry sectors utilized for the economic impact model are NAICS 611310 (Colleges, Universities, and Professional Schools).
Input Data

Full & Part-time Employment
Total Annual Payroll
Without Benefits
Estimated Benefits
Total Annual Payroll with
Benefits
Annual Average Wage
without Benefits
Annual Average Wage with Benefits
6,755 $276,981,000 30.9% $362,568,000 $41,004 $53,674
• The AIKCU Frankfort, Kentucky, has provided the employment and wage values, utilizing National Center for Education Statistics
(NCES) Integrated Postsecondary Education Data System (IPEDS) datasets.• The employment and wage values are for the academic year 2014 to 2015.• The employment and wage values are for AIKCU member institutions.
Table 2: Direct Input Assumptions for the Economic Impact Estimate
Table 3: Wages and Employment - Member Colleges and Universities
Institution Name Total Expenses - Salaries and Wages
Full-Time Employees
Part-Time Employees Total Employees
AIKCU TOTAL $276,980,607 4864 1,891 6,755Alice Lloyd College $4,279,559 104 13 117Asbury University $16,860,281 317 169 486Bellarmine University $35,663,155 461 298 759Berea College $38,051,640 615 123 738Brescia University $6,207,734 137 70 207Campbellsville University $17,528,843 360 171 531Centre College $22,782,925 400 42 442Georgetown College $14,002,821 255 116 371Kentucky Christian University $5,090,364 98 51 149Kentucky Wesleyan College $5,588,101 117 64 181Lindsey Wilson College $17,377,909 382 164 546Midway University $6,443,082 99 80 179Spalding University $15,380,214 233 103 336Thomas More College $10,177,023 164 81 245Transylvania University $16,233,882 277 37 314Union College $7,418,072 160 41 201University of Pikeville $16,941,756 290 51 341University of the Cumberlands $20,953,246 395 217 612
Source: National Center for Education Statistics (NCES) Integrated Postsecondary Education Data System (IPEDS) HR Survey datasets - IPEDS FINANCE SURVEY (Spring 2015). Employee salary and wage data is for Spring 2015.
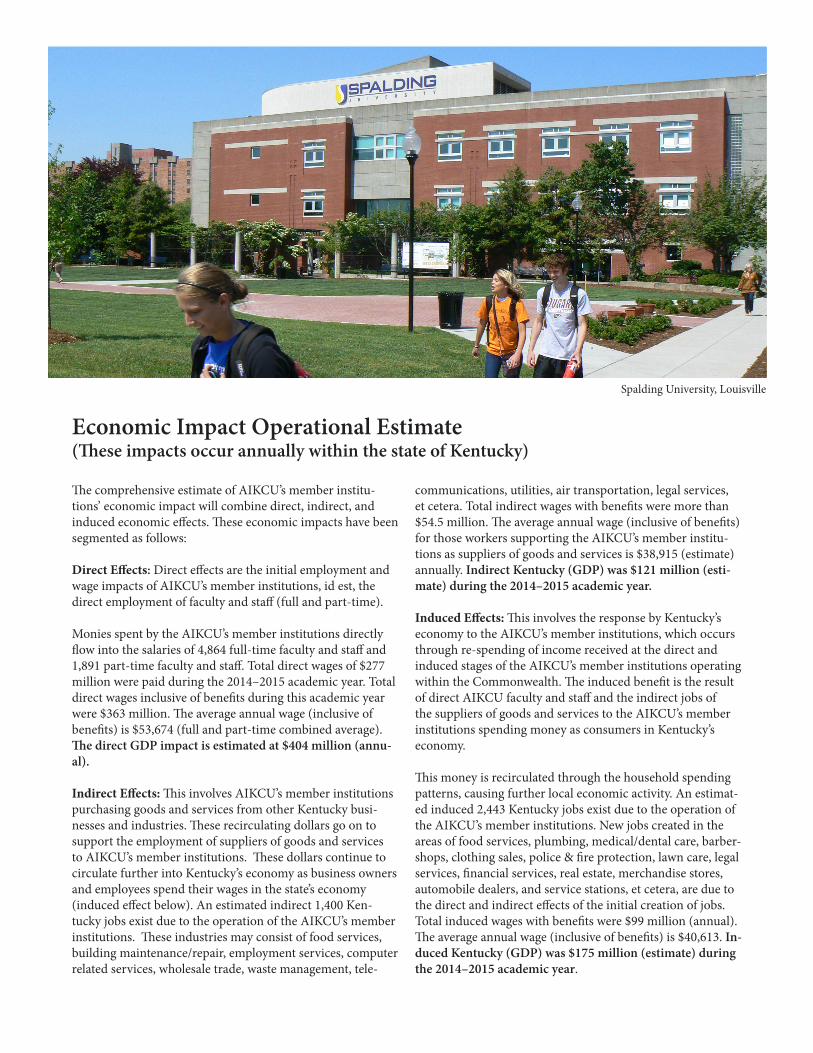
Economic Impact Operational Estimate (These impacts occur annually within the state of Kentucky)
The comprehensive estimate of AIKCU’s member institu-tions’ economic impact will combine direct, indirect, and induced economic effects. These economic impacts have been segmented as follows:
Direct Effects: Direct effects are the initial employment and wage impacts of AIKCU’s member institutions, id est, the direct employment of faculty and staff (full and part-time).
Monies spent by the AIKCU’s member institutions directly flow into the salaries of 4,864 full-time faculty and staff and 1,891 part-time faculty and staff. Total direct wages of $277 million were paid during the 2014–2015 academic year. Total direct wages inclusive of benefits during this academic year were $363 million. The average annual wage (inclusive of benefits) is $53,674 (full and part-time combined average). The direct GDP impact is estimated at $404 million (annu-al).
Indirect Effects: This involves AIKCU’s member institutions purchasing goods and services from other Kentucky busi-nesses and industries. These recirculating dollars go on to support the employment of suppliers of goods and services to AIKCU’s member institutions. These dollars continue to circulate further into Kentucky’s economy as business owners and employees spend their wages in the state’s economy (induced effect below). An estimated indirect 1,400 Ken-tucky jobs exist due to the operation of the AIKCU’s member institutions. These industries may consist of food services, building maintenance/repair, employment services, computer related services, wholesale trade, waste management, tele-
communications, utilities, air transportation, legal services, et cetera. Total indirect wages with benefits were more than $54.5 million. The average annual wage (inclusive of benefits) for those workers supporting the AIKCU’s member institu-tions as suppliers of goods and services is $38,915 (estimate) annually. Indirect Kentucky (GDP) was $121 million (esti-mate) during the 2014–2015 academic year.
Induced Effects: This involves the response by Kentucky’s economy to the AIKCU’s member institutions, which occurs through re-spending of income received at the direct and induced stages of the AIKCU’s member institutions operating within the Commonwealth. The induced benefit is the result of direct AIKCU faculty and staff and the indirect jobs of the suppliers of goods and services to the AIKCU’s member institutions spending money as consumers in Kentucky’s economy.
This money is recirculated through the household spending patterns, causing further local economic activity. An estimat-ed induced 2,443 Kentucky jobs exist due to the operation of the AIKCU’s member institutions. New jobs created in the areas of food services, plumbing, medical/dental care, barber-shops, clothing sales, police & fire protection, lawn care, legal services, financial services, real estate, merchandise stores, automobile dealers, and service stations, et cetera, are due to the direct and indirect effects of the initial creation of jobs. Total induced wages with benefits were $99 million (annual). The average annual wage (inclusive of benefits) is $40,613. In-duced Kentucky (GDP) was $175 million (estimate) during the 2014–2015 academic year.
Spalding University, Louisville

Total Economic Impact:
The value added to Kentucky’s economy on an annu-al operational basis by AIKCU’s member institutions indicates this to be one of Kentucky’s primary economic engines.
AIKCU’s member institutions’ direct employment of 6,755 (full and part-time) has the total estimated opera-tional (recurring) economic impact of
• Creating a total of 10,599 Kentucky jobs which pay an average of $48,713 per year (inclusive of bene-fits); and
• Generating $700 million in Kentucky GDP annually; - Approximately 0.4% of Kentucky’s total (GDP).
“The value added to
Kentucky’s economy on
an annual operational
basis by AIKCU’s
member institutions
indicates this to be one
of Kentucky’s primary
economic engines.”
Midway University, Midway
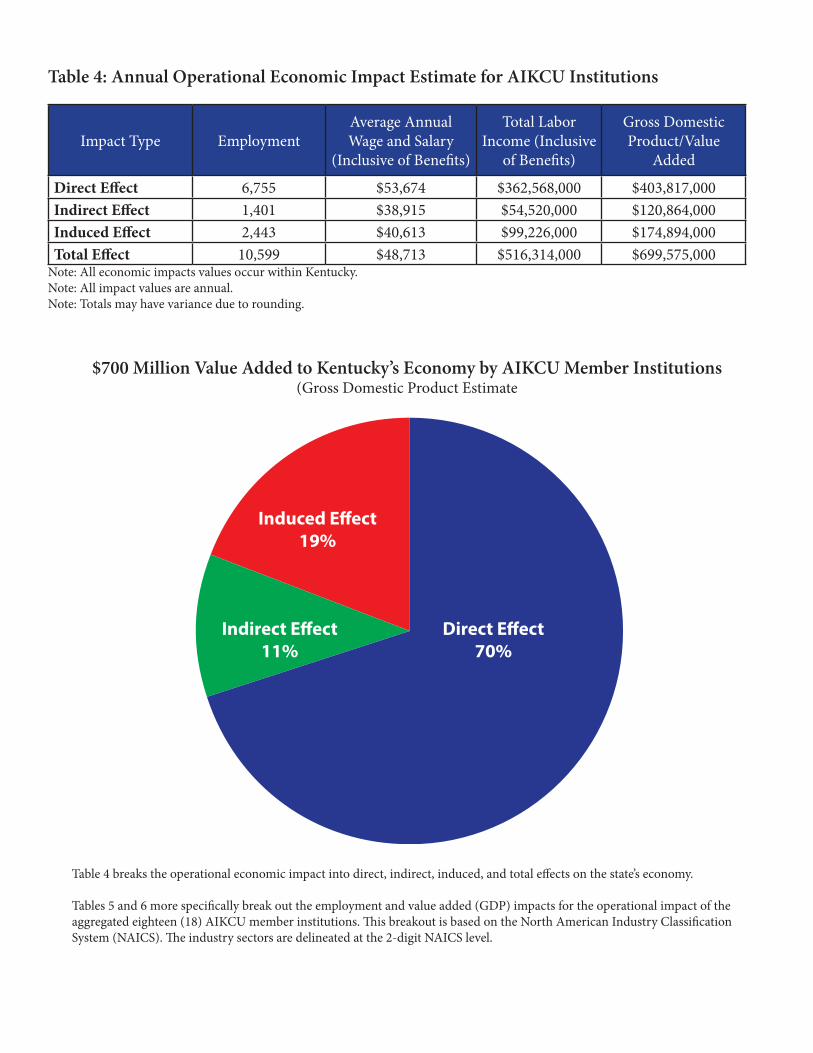
Table 4: Annual Operational Economic Impact Estimate for AIKCU Institutions
Impact Type EmploymentAverage Annual Wage and Salary
(Inclusive of Benefits)
Total Labor Income (Inclusive
of Benefits)
Gross Domestic Product/Value
Added
Direct Effect 6,755 $53,674 $362,568,000 $403,817,000Indirect Effect 1,401 $38,915 $54,520,000 $120,864,000Induced Effect 2,443 $40,613 $99,226,000 $174,894,000Total Effect 10,599 $48,713 $516,314,000 $699,575,000
Note: All economic impacts values occur within Kentucky.Note: All impact values are annual.Note: Totals may have variance due to rounding.
Table 4 breaks the operational economic impact into direct, indirect, induced, and total effects on the state’s economy.
Tables 5 and 6 more specifically break out the employment and value added (GDP) impacts for the operational impact of the aggregated eighteen (18) AIKCU member institutions. This breakout is based on the North American Industry Classification System (NAICS). The industry sectors are delineated at the 2-digit NAICS level.
Direct E�ect70%
Induced E�ect19%
Indirect E�ect11%
$700 Million Value Added to Kentucky’s Economy by AIKCU Member Institutions (Gross Domestic Product Estimate

NAICS and Industry Sector Direct Indirect Induced Total
Total 6,755 1,401 2,443 10,59911 Agriculture, Forestry, Fish & Hunting - 19 12 3121 Mining - 8 3 1222 Utilities - 26 6 3323 Construction - 46 30 7631-33 Manufacturing - 28 20 5042 Wholesale trade businesses - 31 52 8344-45 Retail trade - 12 447 45948-49 Transportation & Warehousing - 43 59 10151 Information - 39 33 7252 Finance & insurance - 44 154 19853 Real estate & rental - 348 102 45054 Professional- scientific & tech services - 101 95 19655 Management of companies - 229 161 39056 Administrative & waste services - 12 5 1761 Educational services 6,755 67 67 6,88862 Health & social services - - 528 52871 Arts- entertainment & recreation - 33 66 10072 Accommodation & food services - 129 337 46681 Other services - 106 239 34592 Government & non NAICs - 78 26 104
Note: All economic impacts values occur within Kentucky. Note: All impact values are annual. Note: Totals may have variance due to rounding.
Table 5: Annual Employment Operational Economic Impact Estimate for AIKCU Member Institutions (2-digit NAICS)
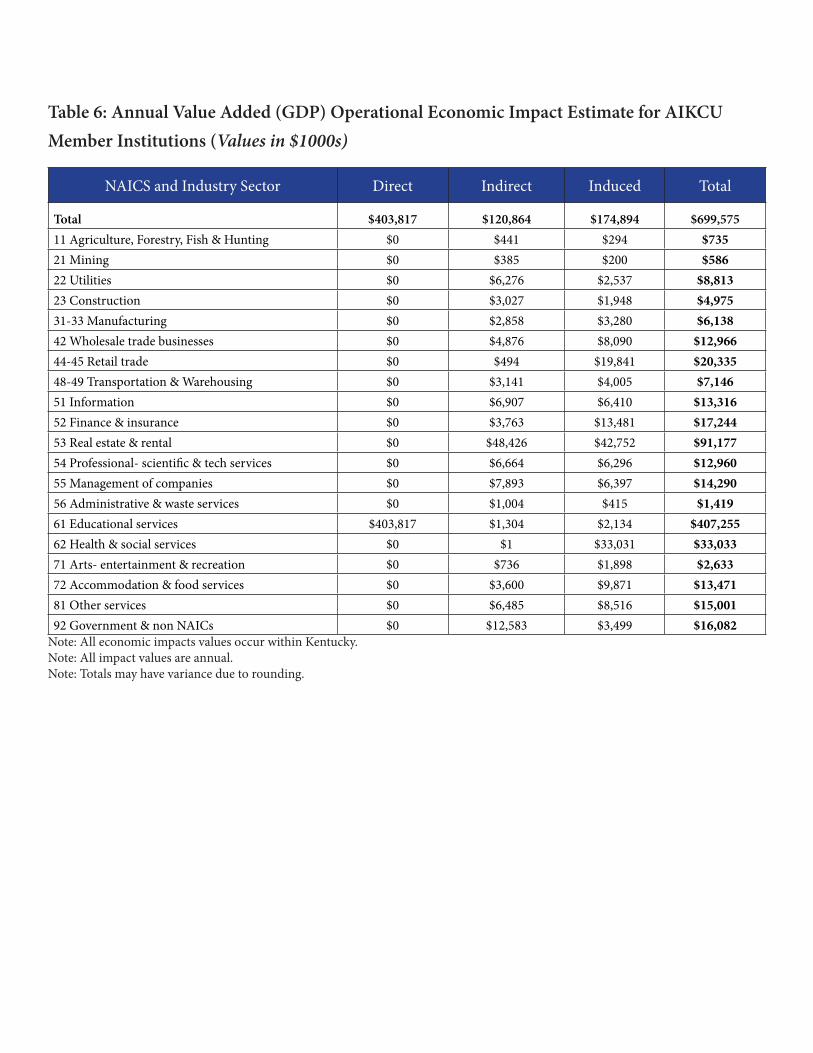
Table 6: Annual Value Added (GDP) Operational Economic Impact Estimate for AIKCU Member Institutions (Values in $1000s)
NAICS and Industry Sector Direct Indirect Induced Total
Total $403,817 $120,864 $174,894 $699,57511 Agriculture, Forestry, Fish & Hunting $0 $441 $294 $73521 Mining $0 $385 $200 $58622 Utilities $0 $6,276 $2,537 $8,81323 Construction $0 $3,027 $1,948 $4,97531-33 Manufacturing $0 $2,858 $3,280 $6,13842 Wholesale trade businesses $0 $4,876 $8,090 $12,96644-45 Retail trade $0 $494 $19,841 $20,33548-49 Transportation & Warehousing $0 $3,141 $4,005 $7,14651 Information $0 $6,907 $6,410 $13,31652 Finance & insurance $0 $3,763 $13,481 $17,24453 Real estate & rental $0 $48,426 $42,752 $91,17754 Professional- scientific & tech services $0 $6,664 $6,296 $12,96055 Management of companies $0 $7,893 $6,397 $14,29056 Administrative & waste services $0 $1,004 $415 $1,41961 Educational services $403,817 $1,304 $2,134 $407,25562 Health & social services $0 $1 $33,031 $33,03371 Arts- entertainment & recreation $0 $736 $1,898 $2,63372 Accommodation & food services $0 $3,600 $9,871 $13,47181 Other services $0 $6,485 $8,516 $15,00192 Government & non NAICs $0 $12,583 $3,499 $16,082
Note: All economic impacts values occur within Kentucky. Note: All impact values are annual. Note: Totals may have variance due to rounding.

Comparable to the economic effects produced by AIKCU’s member institutions
Professional industry sectors such as medical offices, law firms, insurance agencies, accounting firms, veterinary services, and private higher education institutions are industries that have similar employment impacts for Kentucky economy. The graph below provides prospective concerning how AIKCU’s member institutions fit into Kentucky’s economy. The employment mul-tiplier for AIKCU’s member institutions is comparable to these Kentucky professional (white-collar) industries.
0
40
80
120
160
HotelsVeterinaryServices
NewspaperPublishing
DentistO�ce
AccountingAIKCUMembers
Induced Employment 36.2 39.8 36.8 29.8 30.4 22.8
Indirect Employment 20.7 15.2 17.5 22.3 21.4 23.2
Direct Employment 100.0 100.0 100.0 100.0 100.0 100.0
TOTAL Employment per
100 Direct
156.9 155 154.3 152.1 151.8 146
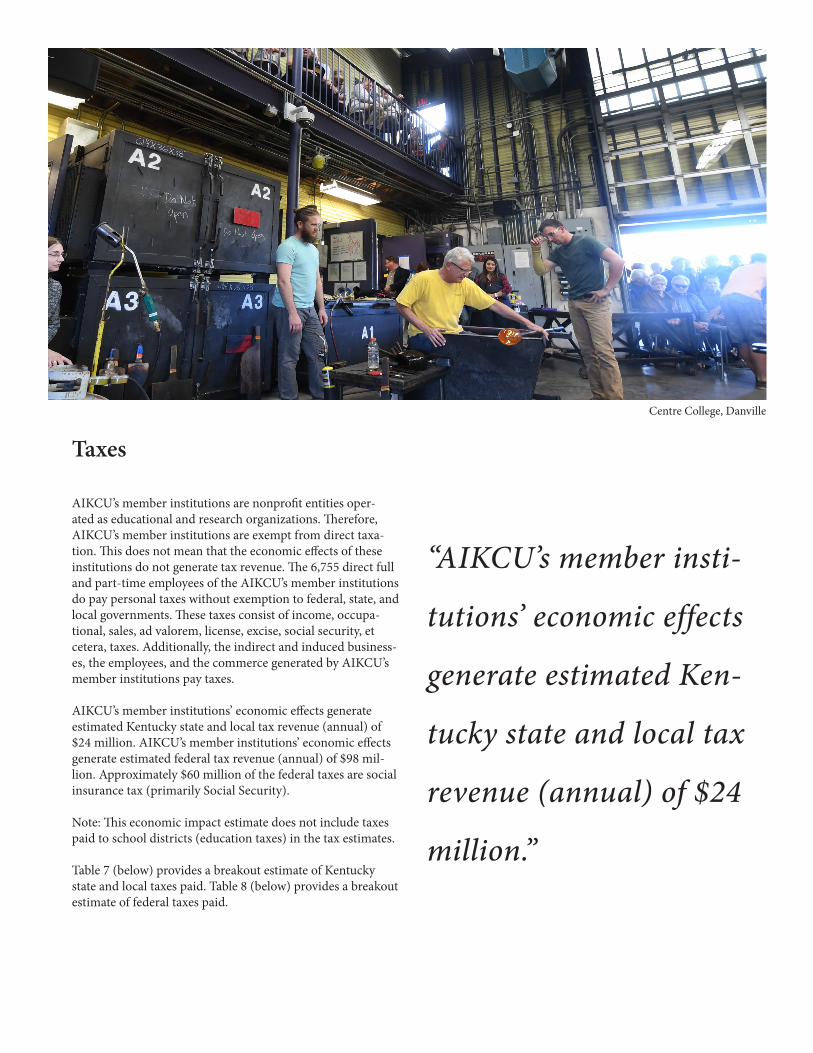
Taxes
AIKCU’s member institutions are nonprofit entities oper-ated as educational and research organizations. Therefore, AIKCU’s member institutions are exempt from direct taxa-tion. This does not mean that the economic effects of these institutions do not generate tax revenue. The 6,755 direct full and part-time employees of the AIKCU’s member institutions do pay personal taxes without exemption to federal, state, and local governments. These taxes consist of income, occupa-tional, sales, ad valorem, license, excise, social security, et cetera, taxes. Additionally, the indirect and induced business-es, the employees, and the commerce generated by AIKCU’s member institutions pay taxes.
AIKCU’s member institutions’ economic effects generate estimated Kentucky state and local tax revenue (annual) of $24 million. AIKCU’s member institutions’ economic effects generate estimated federal tax revenue (annual) of $98 mil-lion. Approximately $60 million of the federal taxes are social insurance tax (primarily Social Security).
Note: This economic impact estimate does not include taxes paid to school districts (education taxes) in the tax estimates.
Table 7 (below) provides a breakout estimate of Kentucky state and local taxes paid. Table 8 (below) provides a breakout estimate of federal taxes paid.
“AIKCU’s member insti-
tutions’ economic effects
generate estimated Ken-
tucky state and local tax
revenue (annual) of $24
million.”
Centre College, Danville

State and Local Taxes (Estimates Exclude Education Taxes) Total Tax
Social Ins Tax- Employee Contribution (1) $ 363,000Social Ins Tax- Employer Contribution (2) $ 733,000Tax on Production and Imports: Sales Tax (3) $ 4,884,000Tax on Production and Imports: Property Tax (4) $ 2,588,000Tax on Production and Imports: Motor Vehicle License (5) $ 74,000Tax on Production and Imports: Severance Tax (6) $ 194,000Tax on Production and Imports: Other Taxes (7) $ 290,000Tax on Production and Imports: S/L NonTaxes (8) $ 16,000Corporate Profits Tax (9) $ 653,000Personal Tax: Income Tax (10) $ 12,728,000Personal Tax: NonTaxes (Fines- Fees) (11) $ 734,000Personal Tax: Motor Vehicle License (12) $ 376,000Personal Tax: Property Taxes (13) $ 130,000Personal Tax: Other Tax (Fish/Hunt) (14) $ 232,000Total State and Local Tax $ 23,995,000
Table 7: Annual Kentucky State and Local Taxes based on economic activities which occur in Kentucky
1. Tax estimates are model based.2. Estimates are based on 6,755= direct, 1,401= indirect, 2,443 = induced Kentucky AIKCU jobs.3. Local education taxes are excluded.
Federal Taxes Total Tax
Social Ins Tax- Employee Contribution (15) $31,037,000Social Ins Tax- Employer Contribution (16) $29,373,000Tax on Production and Imports: Excise Taxes (17) $3,399,000Tax on Production and Imports: Custom Duty (18) $1,280,000Tax on Production and Imports: Fed NonTaxes (19) $208,000Corporate Profits Tax (20) $3,552,000Personal Tax: Income Tax (21) $29,015,000Total Federal Tax $97,863,000
1. Tax estimates are model based.2. Estimates are based on 6,755= direct, 1,401= indirect, 2,443 = induced Kentucky AIKCU jobs.
Table 8: AIKCU Member Institutions Estimated Annual Kentucky Federal Taxes based on economic activities which occur in Kentucky
The Association of Independent Kentucky Colleges & Universities (AIKCU)
484 Chenault RoadFrankfort, Kentucky 40601
502.695.5007
http://aikcu.org
Technical notes:
The online version of this document includes elements that do not appear in this print version, including: a glossary of economic impact terms; tax data sources; notes on multipliers, methodologies and sources; and a detailed appendix. To download the full version, visit http://aikcu.org.
Methodology/Sources (partial)The economic impacts estimates and conclusions resulting from this study have been derived from Minnesota IMPLAN Group, Inc. databases. This aggregate database is primarily composed of government data sources including information from• US Bureau of Economic Analysis Benchmark I/O Accounts of the US;• US Bureau of Economic Analysis Output Estimates;• US Bureau of Economic Analysis REIS Program;• US Bureau of Labor Statistics ES 202 Program;• US Bureau of Labor Statistics Consumer Expenditure Survey;• US Bureau of County Business Patterns;• US Census Bureau Decennial Census and Population Surveys;• US Census Bureau Economic Census and Surveys;• US Department of Agriculture; and• US Geological Survey.
Model Source: The estimates are derived from and based on IMPLAN 2015 databases and IMPLAN Version 3.1 software system matrices.
Prepared by Phil FlynnEconomistVersailles, Kentucky
The information provided herein is believed to be accurate and has been prepared for the Association of Independent Kentucky Colleges and Universities (AIKCU). Users of the information other than AIKCU and/or those authorized by AIKCU should perform their own due diligence in drawing conclusions from the information provided.
This economic impact report is not a product of any government agency.

aikcu.org